

Quality of Groundwater Used for Domestic Supply in the Gilroy-Hollister Basin and Surrounding Areas, California, 2022
Links
- Document: Report (6.2 MB pdf) , HTML , XML
- NGMDB Index Page: National Geologic Map Database Index Page
- Download citation as: RIS | Dublin Core
Acknowledgments
We thank the site owners and water purveyors for granting site access and allowing the U.S. Geological Survey staff to collect samples from their wells. Most of the funding for this work was provided by the California State Water Resources Control Board Groundwater Ambient Monitoring and Assessment Program. Additional funding was provided with U.S. Geological Survey Cooperative Matching Funds. This report is a product of the California State Water Resources Control Board Groundwater Ambient Monitoring and Assessment Program Priority Basin Project.
Abstract
More than 2 million Californians rely on groundwater from domestic wells for drinking-water supply. This report summarizes a 2022 California Groundwater Ambient Monitoring and Assessment Priority Basin Project (GAMA-PBP) water-quality survey of 33 domestic and small-system drinking-water supply wells in the Gilroy-Hollister Valley groundwater basin and the surrounding areas, where more than 20,000 residents are estimated to utilize privately owned domestic wells. The study area includes the Llagas subbasin in the north, the North San Benito subbasin in the south, and the surrounding uplands. The study was focused on groundwater resources used for domestic drinking-water supply, which are mostly drawn from shallower parts of aquifer systems rather than those of groundwater resources used for public drinking-water supply in the same area. This assessment characterized the quality of ambient groundwater in the aquifer before filtration or treatment, rather than the quality of drinking water delivered to the tap.
To provide context, the measured concentrations of constituents in groundwater were compared to Federal and California State regulatory and non-regulatory benchmarks for drinking-water quality. A grid-based method was used to estimate the areal proportions of groundwater resources used for domestic drinking wells that have water-quality constituents present at high concentrations (above the benchmark), moderate concentrations (between one-half of the benchmark and the benchmark for inorganic constituents, or between one-tenth of the benchmark and the benchmark for organic constituents), and low concentrations (less than one-half or one-tenth the benchmark for inorganic and organic constituents, respectively). This method provides statistically representative results at the study-area scale and permits comparisons to other GAMA-PBP study areas. In the study area, inorganic constituents in groundwater were greater than regulatory benchmarks (U.S. Environmental Protection Agency [EPA] or State of California maximum contaminant levels [MCLs]) for public drinking-water quality in 24 percent of domestic groundwater resources. The inorganic constituents present at concentrations greater than MCLs for drinking water were nitrate (as nitrogen), barium, chromium, and selenium. Total dissolved solids (TDS) or manganese were present at concentrations greater than the secondary maximum contaminant levels (SMCLs) that the State of California uses as aesthetic-based benchmarks in 48 percent of domestic groundwater resources. No volatile organic compounds or pesticide constituents were present at concentrations greater than regulatory benchmarks. Total coliform bacteria and enterococci were detected in 4 percent of domestic groundwater resources. Per- and polyfluoroalkyl substances (PFAS) were detected in 19 percent of domestic groundwater resources, and 10 percent had concentrations greater than recently enacted (April 2024) EPA MCLs.
Physical and chemical factors from natural and anthropogenic sources that could affect the groundwater quality were evaluated using results from statistical testing of associations between constituent concentrations and potential explanatory variables. In this study, relevant physical factors include well construction characteristics, groundwater age, site proximity to groundwater recharge or discharge zones, and potential sources of contamination. Relevant chemical factors include the initial chemistry of the recharge water, the mineralogy of the aquifer sediments, and the subsequent shifts in chemistry as biologic and geologic reactions alter groundwater in the subsurface.
Nitrate concentrations were correlated to agricultural land use, distance from the boundary of the Gilroy-Hollister Valley groundwater basin, and the proportion of modern (post-1950s) water captured by the well. Denitrification under anoxic redox conditions can mitigate some nitrate derived from fertilizer application. Total dissolved solids primarily were derived from water-rock interactions with soils and aquifer materials in the study area, but there were high concentrations where agricultural practices contributed additional TDS. Mineralogy of aquifer sediments and rocks also affect barium, selenium, boron, and chromium concentrations in the Gilroy-Hollister Valley groundwater basin. PFAS were positively correlated with urban land use and the proportion of modern water captured by the well.
Plain Language Summary
The U.S. Geological Survey works with the California State Water Resources Control Boards’ Groundwater Ambient Monitoring and Assessment Program to study the quality of groundwater used for drinking-water supplies across California. This report examines the quality of groundwater collected from 33 private domestic wells in the Gilroy-Hollister Valley groundwater basin and surrounding area in California’s Central Coast region. Groundwater samples were analyzed for human-made and naturally occurring substances that can be found dissolved in groundwater. They were also analyzed for geochemical tracers that can be used to help determine the age of the groundwater and processes affecting the concentrations of dissolved constituents. The water-quality data were compared to Federal and State benchmarks that are applied to public drinking water, such as regulatory maximum contaminant levels (MCLs). Nitrate was detected at concentrations greater than its Federal MCL benchmark in 17 percent of the groundwater samples. Nitrate concentrations above natural background levels were associated with greater agricultural land use near the well, wells tapping a higher proportion of younger groundwater, and absence of anoxic conditions that promote degradation of nitrate. No volatile organic compounds or pesticide constituents were detected at concentrations greater than MCLs, however per- and polyfluoroalkyl substances (PFAS) were detected at concentrations greater than the Federal MCLs enacted in April 2024 in about 10 percent of the groundwater samples. PFAS are used in many consumer products and industrial processes. Occurrences of these elevated concentrations of PFAS were not associated with known potential sources of PFAS contamination to groundwater but were positively correlated with urban land use and the proportion of younger groundwater tapped by the well. Total dissolved solids (TDS, a measure of salinity) were detected at concentrations about the State nonregulatory upper secondary MCL in 24 percent of the groundwater samples. TDS is primarily derived from natural interactions between water and aquifer materials, although agricultural practices may contribute additional TDS in some areas. About 20,000 residents in the Gilroy-Hollister area, and more than 2 million people in California, use private domestic wells for drinking water. Therefore, assessing the quality of groundwater used by domestic wells and understanding the factors affecting that quality is important for protecting public health.
Introduction
Approximately 82 percent of the population of California depends in some part on groundwater for drinking-water supply (California State Water Resources Control Board, 2024a). To protect this vital resource, the California State Water Resources Control Board (SWRCB) created the Groundwater Ambient Monitoring and Assessment (GAMA) program in 2000. The purpose of GAMA is to comprehensively assess groundwater quality throughout California and enhance public access to groundwater quality information and analysis. The U.S. Geological Survey (USGS) implements the Priority Basin Project (PBP) of the GAMA program, which provides spatially unbiased assessments of groundwater resources used for drinking-water supply on a basin scale.
The first phase of the GAMA-PBP (2004–12) focused on groundwater wells used for public drinking-water supply (Belitz and others, 2015). This second phase of the GAMA-PBP, which began in 2012, is assessing the status of groundwater resources used for domestic drinking-water supply, including in the Gilroy-Hollister Valley groundwater basin and surrounding areas (Shelton and Tejeda, 2024). Approximately 2 million California residents use domestic or small-system (fewer than 15 service connections) wells for their drinking-water supply (California State Water Resources Control Board, 2024a). Unlike public supply wells that are routinely monitored for water-quality by law, private domestic wells are not systematically monitored for water quality, and much less is known about the quality of domestic drinking-water resources. Domestic wells tend to be drilled to shallower depths than public supply wells and can provide important information on groundwater quality in shallower parts of aquifer systems that respond more rapidly to changes at the land surface compared to deeper production wells (Burow and others, 2008; Degnan and others, 2021).
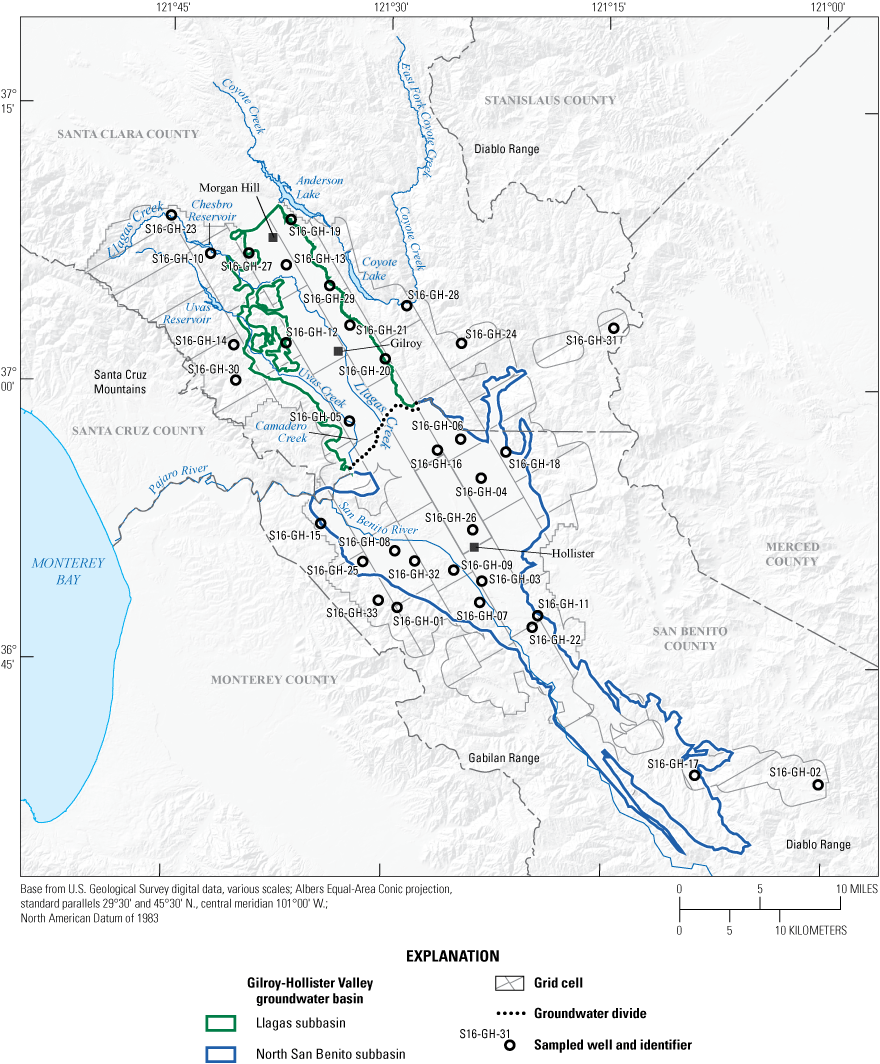
Between August and October of 2022, the GAMA-PBP assessed the quality of groundwater resources used for domestic drinking-water supply in the Llagas and North San Benito subbasins of the Gilroy-Hollister Valley groundwater basin and the surrounding areas (Faulkner and Dupuy, 2024), where it was estimated that more than 20,000 residents used domestic wells for household drinking-water supplies in 2010 (Johnson and Belitz, 2019). To assess groundwater quality within the aquifer used for domestic drinking-water supply (herein, “study area”), the study area was divided into 40 equal-area grid cells, with the objective to sample at least 1 well used for domestic or small-system supply per cell. The GAMA-PBP sampled a total of 33 domestic or small-system wells for water quality distributed across 27 of the cells in the study area (fig. 1; Faulkner and Dupuy, 2024).
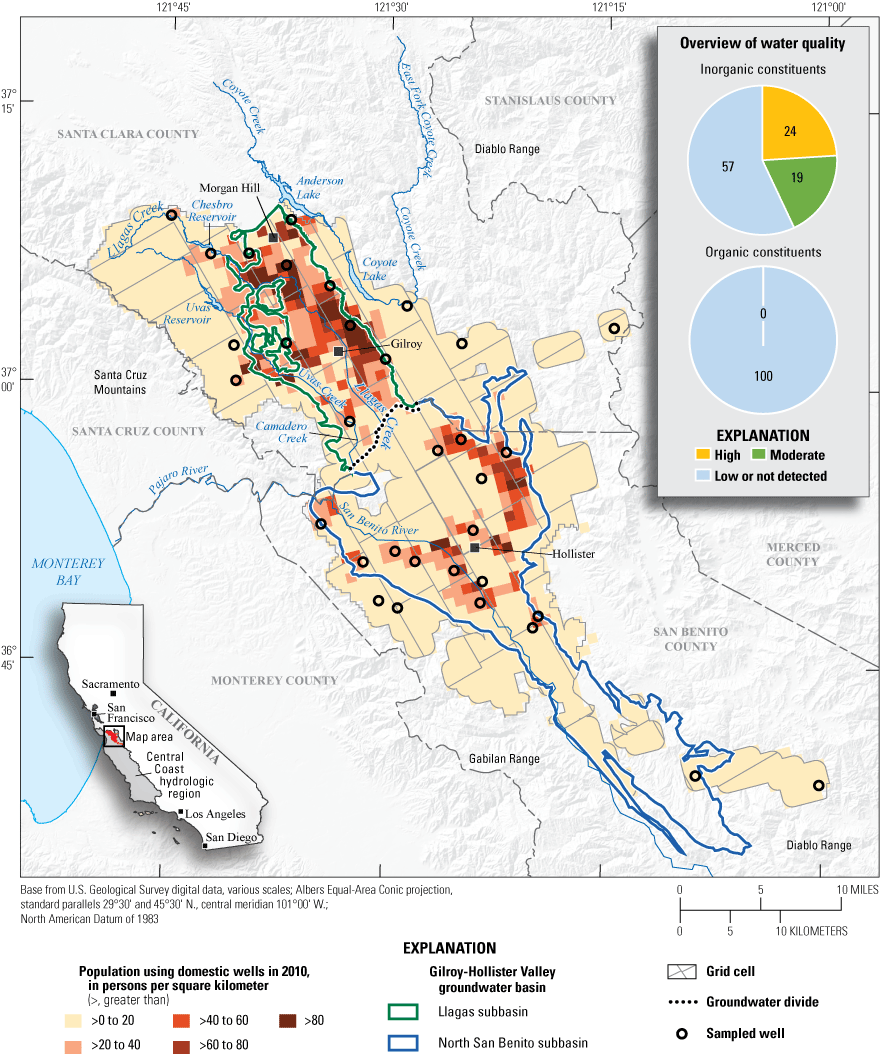
Gilroy-Hollister Valley groundwater basin and the surrounding areas, California and the estimated population using domestic wells, sampling grid cells for the study area, locations of wells sampled to characterize groundwater resources used for domestic drinking-water supply, extent of the Llagas and North San Benito subbasins, and the groundwater divide between the subbasins (Johnson and Belitz, 2019; California Department of Water Resources, 2021; Faulkner and Dupuy, 2024). Overview of water-quality charts inset show proportions of domestic groundwater resources in the study area that had low, moderate, or high concentrations of inorganic and organic constituents with regulatory maximum contaminant level benchmarks.
Hydrologic Setting
The 1,300-square kilometer (km2) study area includes the Gilroy-Hollister Valley groundwater basin and the surrounding areas in the Central Coast hydrologic region of California (fig. 1; California Department of Water Resources, 2021). The Gilroy-Hollister Valley is an inland valley in the southern Coast Ranges bounded by the Diablo Range to the north, east, and south and by the San Andreas Rift Zone, Gabilan Range, and Santa Cruz Mountains to the west. The study area includes the Llagas subbasin in the north, the North San Benito subbasin in the south, and the surrounding uplands (fig. 1).
Average annual precipitation in the study area ranges from 993 millimeters (mm) in the northwest to 361 mm in the southeast (PRISM Climate Group, 2022). Within the study area, land use varies, with agricultural areas (21 percent) intermingled with developed areas (15 percent), including some urban centers (Gilroy, Hollister, and Morgan Hill) on the valley floor surrounded by predominantly natural lands (64 percent; Falcone, 2015). The primary crop types are vegetables and other annual crops with some vineyard and grain crops (California Department of Water Resources, 2018).
The aquifer of the Gilroy-Hollister Valley groundwater basin consists of less-permeable Tertiary to Holocene formations (the Santa Clara Formation in the Llagas subbasin and the Purisima Formation in the North San Benito subbasin) overlain by generally more permeable alluvial deposits (California Department of Water Resources, 2003a, 2003b, 2003c, 2003d). The aquifer system is predominately unconfined (California Department of Water Resources, 2003a, 2003b, 2003c, 2003d); an unnamed confining layer extends from the southern Llagas subbasin to the northern North San Benito subbasin, which restricts vertical groundwater flow and historically resulted in artesian conditions near surface streams (Kilburn, 1973; California Department of Water Resources, 2003a, 2003b). The Calaveras and Sargent fault zones restrict lateral groundwater flow within the Gilroy-Hollister Valley groundwater basin. A groundwater flow divide is located between the Llagas subbasin and the North San Benito subbasin and generally follows the Santa Clara and San Benito County line and the Pajaro River (fig. 1). Groundwater flows generally north to south in the Llagas subbasin from the foothills to the Pajaro River and from south to north in the North San Benito subbasin from the foothills to the San Benito River.
The primary sources of groundwater recharge are infiltration of precipitation that falls on the landscape, irrigation infiltration, and losses from the upper reaches of the Pajaro and San Benito Rivers and their tributaries; additional recharge sources are subsurface flow and engineered recharge (California Department of Water Resources, 2003a, 2003b, 2003c, 2003d). Water used for irrigation and engineered recharge is a mixture of local water and water imported from the Central Valley Project and the State Water Project (Moran and others, 2005; Todd Groundwater, 2024; Tick and Gurdak, 2024). Groundwater primarily is discharged through extraction of groundwater by wells for irrigation or municipal use (Kilburn, 1973; California Department of Water Resources, 2003d). Groundwater discharges from the Llagas subbasin and the North San Benito subbasin into the Pajaro River and the San Benito River, respectively (Kilburn, 1973). These rivers converge into the Pajaro River, which flows west out of the Gilroy-Hollister Valley (fig. 1).
Methods for Evaluating Groundwater Quality
The GAMA-PBP uses benchmarks established for public drinking-water systems to contextualize groundwater quality from domestic wells, which are not systematically monitored for water quality in California. This report focuses on water-quality constituents with U.S. Environmental Protection Agency (EPA) or the State of California regulatory maximum contaminant level (MCL) benchmarks. Constituents with aesthetic-based, secondary maximum contaminant level (SMCL) benchmarks that affect groundwater color, taste, or odor are discussed but not included in the overview of water-quality charts for inorganic and organic constituents (inset on fig. 1). Other constituents of interest with non-regulatory, health-based benchmarks (such as California State response and notification levels or EPA lifetime health advisory levels) are discussed on a more limited basis and are not included in the overview of water-quality charts (inset on fig. 1). Water-quality benchmarks used in this report are compiled by Faulkner and Dupuy (2024), except for hexavalent chromium and per- and polyfluoroalkyl substances (PFAS), which had regulatory benchmarks established after the publication of Faulkner and Dupuy (2024). In April 2024, the California State Water Resources Control Board (2024b) adopted an MCL for hexavalent chromium, and U.S. Environmental Protection Agency (2024a) adopted MCLs for perfluorooctanoate (PFOA), perfluorooctanesulfonate (PFOS), perfluorohexanesulfonate (PFHxS), and perfluorononanoate (PFNA); an MCL also was established for mixtures containing two or more of PFHxS, PFNA, perfluorobutanesulfonate (PFBS), and hexafluoropropylene oxide dimer acid (HFPO-DA; also known as perfluoro-2-propoxypropanoate and commonly known as GenX Chemicals; U.S. Environmental Protection Agency, 2024b).
Concentrations of a given water-quality constituent that exceeded its respective benchmark were considered “high.” Concentrations between the benchmark and one-half the benchmark (for inorganic constituents) or one-tenth the benchmark (for organic constituents) were considered “moderate.” The moderate classification indicates elevated concentrations less than the benchmark and can help identify constituents of emerging concern in aquifer systems. A lower moderate threshold was set for organic constituents because, unlike inorganic constituents, they typically are not naturally in groundwater systems, and a lower threshold effectively highlights parts of the aquifer area vulnerable to anthropogenic contamination. Concentrations less than the moderate threshold and greater than the detection or reporting levels listed by Faulkner and Dupuy (2024) were considered “low.” Concentrations less than the detection or reporting levels were considered “not detected.”
The gridded sampling design used in GAMA-PBP studies allows results to be considered in terms of proportion of aquifer area with water quality in a defined range (for example, the proportion of the study area exceeding the MCL or “high”). Groundwater from 33 domestic or small-system wells selected for study across 27 grid cells was sampled and analyzed for a comprehensive suite of water-quality constituents and geochemical indicators as described by Faulkner and Dupuy (2024). Wells sampled from individual grid cells represent a random sampling within a defined unit of the total aquifer area used for domestic drinking-water supply (herein, “domestic groundwater resources”). A spatial-weighting method was used to calculate the proportion of domestic groundwater resources with water quality within defined ranges (Belitz and others, 2010, 2015). The proportion of wells in each sampled grid cell with low, moderate, or high concentrations for a given constituent was calculated, and an area-weighted average proportion was computed across all sampled grid cells. This process prevents samples from multiple wells clustered within a given grid cell from over-representing aquifer conditions across a broader study area (Belitz and others, 2010, 2015).
Groundwater samples were collected following the methods described in the USGS National Field Manual (U.S. Geological Survey, variously dated) as adapted by Shelton and Fram (2017). Groundwater samples were taken as close to the wellhead as possible and reflect the quality of ambient aquifer water before exposure to household plumbing or treatment systems. The median and interquartile range of sampled well depths were 21 and 15–43 meters (m), respectively (Faulkner and Dupuy, 2024). Quality-control results are detailed by Faulkner and Dupuy (2024).
The presence of modern (post-1950s) groundwater is important for understanding the potential for anthropogenic contamination, and the distribution of groundwater age in a sample can be used to assess the degree of susceptibility to contamination. Anthropogenic contamination (Shelton and others, 2001; Zogorski and others, 2006; Jurgens and others, 2010; Green and others, 2016; Lindsey and others, 2017; Ransom and others, 2017) commonly is associated with groundwater recharged since the 1950s. To evaluate the relation between modern groundwater and groundwater quality, groundwater age was estimated through calibration of environmental tracers (sulfur hexafluoride and carbon-14) to lumped parameter models (LPMs) using the computer program TracerLPM (Jurgens and others, 2012; Faulkner and Jurgens, 2025). The samples were calibrated to a dispersion model (DM) or a binary mixing model (BMM) of two DMs (BMM-DM-DM). The DM is a LPM that assumes the age distribution in the well is because of dispersion in the aquifer. The DM has two free parameters (age and dispersion parameter) or five free parameters (age of the younger and older components, the dispersion parameters of the younger and older components, and the mixing fraction of the two components) in a binary mixture. The dispersion parameter can be adjusted to approximate other LPMs. Relative environmental tracer concentrations guided the calibration of LPMs to tracer concentrations; a DM was used to compute a best-fit mean age when environmental tracers indicated a single age, and a BMM-DM-DM was used to simulate the mixing of modern and premodern groundwater (Jurgens and others, 2012). The age and proportion of modern water determined from the resulting groundwater age distributions were used to examine correlations to groundwater quality. Groundwater age results and detailed processing steps are available by Faulkner and Jurgens (2025).
We used non-parametric, rank-based statistics to test for correlation among continuous variables (Helsel and others, 2020). We applied the Spearman’s rho method in the base R function ‘cor.test’ (Hollander and others, 2014; R Core Team, 2024) to assess correlations among concentrations, detection counts, percentage of agricultural land use, percentage of urban land use, distance from basin boundary, and groundwater age. We evaluated the significance of these statistical tests using a confidence level of 95-percent probability value (p-value; p-value=0.05).
Overview of Water-Quality Results
This report focuses on water-quality constituents with regulatory benchmarks detected at moderate or high concentrations in the study area. Results are presented separately for inorganic and organic constituents. Inorganic constituents include trace elements and nutrients, which are often naturally at low levels in groundwater because of chemical interactions with aquifer materials (Plummer and others, 2002). Organic constituents include volatile organic compounds (VOCs) and pesticides, which tend to originate from human activities at the land surface, such as agriculture, urban land use, or industry. Inorganic constituents were present at high and moderate concentrations in 24 and 19 percent of domestic groundwater resources, respectively (fig. 1). Organic constituents were not present at moderate or high concentrations in domestic groundwater resources (fig. 1). Although microbial indicators and PFAS constituents have regulatory benchmarks, results for those constituents are presented separately and not included in the summary results shown on figure 1.
Inorganic Constituents
Nitrate was the inorganic constituent most prevalent at concentrations greater than a regulatory benchmark; nitrate concentrations exceeded its EPA MCL (10 milligrams per liter as nitrogen [mg-N/L]) in 17 percent of domestic groundwater resources (fig. 2). Nitrate also was detected at moderate and low concentrations in 9 and 46 percent of domestic groundwater resources, respectively. Nitrate is a nutrient that exists naturally in groundwater but is detected at higher concentrations in developed areas because of fertilizer applications, feedlots, and septic systems. Fluoride was detected at moderate concentrations relative to the State of California MCL of 2 mg/L in 6 percent of domestic groundwater resources. The trace elements barium, selenium, and chromium were each detected at concentrations exceeding their respective MCLs (EPA MCL 1,000 micrograms per liter [μg/L] for barium, EPA MCL 50 μg/L for selenium, and State of California MCL 50 μg/L for chromium) in 4 percent of domestic groundwater resources. Hexavalent chromium, Cr(VI), a carcinogenic valence state of chromium, was not analyzed in 18 percent of domestic groundwater resources, and the proportion of domestic groundwater resources exceeding its State of California MCL (10 μg/L) is therefore not included because it may not be spatially representative. Chromium is composed of Cr(VI) and trivalent chromium and thus can be considered a maximum potential concentration of Cr(VI); a statewide assessment of chromium in groundwater found that almost all chromium in groundwater is present as Cr(VI) (Izbicki and others, 2015). The trace elements arsenic and uranium (natural) were detected at moderate concentrations in 7 and 13 percent of domestic groundwater resources, respectively.
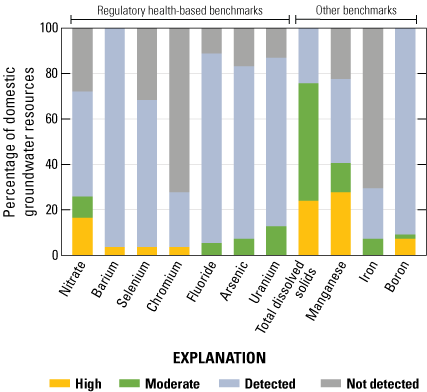
Proportions of domestic groundwater resources in the Gilroy-Hollister Valley groundwater basin and the surrounding areas, California, that have selected inorganic constituents detected at low, moderate, or high concentrations in relation to regulatory health-based or other benchmarks (Faulkner and Dupuy, 2024).
Constituents with secondary maximum contaminant levels (SMCLs; aesthetic-based and technical-based benchmarks) are not included in the overview of water-quality charts (inset on fig. 1) and are considered separately to highlight factors affecting aesthetic and technical properties of groundwater, such as taste, color, scaling, or odor (total dissolved solids [TDS], manganese, and iron on fig. 2). Total dissolved solids are a measure of groundwater salinity and have recommended and upper State of California SMCLs of 500 milligrams per liter (mg/L) and 1,000 mg/L, respectively, which were used as moderate and high thresholds for this study. Total dissolved solids were detected at high and moderate levels in 24 and 52 percent of domestic groundwater resources, respectively (fig. 2). Chloride (Cl−) and sulfate (SO4−2) are major ionic components of TDS and have lower and upper State of California SMCL threshold values of 250 and 500 mg/L, respectively. Chloride and sulfate were greater than the upper State of California SMCL in 4 and 9 percent of domestic groundwater resources, respectively. Manganese, a trace metal that can affect the taste and color of groundwater and can precipitate in pipes, was present at concentrations greater than its State of California SMCL of 50 µg/L in 28 percent of domestic groundwater resources (fig. 2). Manganese also has a SWRCB defined notification level (500 µg/L; California State Water Resources Control Board, 2022) that was exceeded in 2 percent of domestic groundwater resources. Iron, a trace metal that can affect taste and color of groundwater, was detected at moderate concentrations relative to its State of California SMCL of 300 µg/L in 7 percent of domestic groundwater resources (fig. 2). Boron has a non-regulatory, health-based benchmark (EPA lifetime health advisory level of 5,000 mg/L) that was used as the high threshold for this study; boron was present at high concentrations in 7 percent of domestic groundwater resources (fig. 2).
Organic Constituents
No VOC or pesticide constituents were present at concentrations that exceeded regulatory MCL benchmarks in this study area. The VOCs with regulatory benchmarks that were detected in the study area included a fumigant (1,2-dichloropropane [1,2-DCP]), two gasoline components (tert-butyl alcohol and benzene), a solvent (1,1-dichloroethane), and a disinfection byproduct (trichloromethane). Each VOC was detected at low concentrations in less than 10 percent of domestic groundwater resources. No pesticide constituents with regulatory benchmarks were detected.
Microbial Indicators
Microbial indicator constituents can be used to evaluate the potential for bacterial contamination of groundwater from wastewater sources. In this study, groundwater samples were tested for the presence or absence of total coliform bacteria, enterococci, and Escherichia coli. Total coliform bacteria and enterococci were detected in 4 percent of domestic groundwater resources. E. coli bacteria were not detected. Coliform bacteria are common and naturally in soil and surface water and are generally harmless to humans. E. coli and enterococci are more specific indicators of fecal contamination because they are in human and animal wastes (California State Water Resources Control Board, 2019).
Constituents of Special Interest—Per- and Polyfluoroalkyl Substances
Per- and polyfluoroalkyl substances (PFAS) are a family of human-made chemicals that commonly are used as surfactants in a variety of industrial processes and are persistent in the environment (Evich and others, 2022). Of the 28 PFAS constituents analyzed, 10 were detected at concentrations greater than laboratory reporting levels, including 5 that have EPA MCL benchmarks (fig. 3; Faulkner and Dupuy, 2024). At least one PFAS constituent was detected at high concentrations (greater than an EPA MCL) in 10 percent of domestic groundwater resources, and an additional 4 percent of the resource had at least one PFAS constituent detected at moderate concentrations (greater than one-tenth of an EPA MCL). The constituents PFOA and PFOS were detected at concentrations exceeding their EPA MCLs (both 4 μg/L) at the same sites, corresponding to 6 percent of domestic groundwater resources. The constituent PFHxS was detected at a concentration exceeding its EPA MCL of 10 μg/L in 4 percent of domestic groundwater resources. The sites with high concentrations of PFOS, PFOA, or PFHxS also had detections at concentrations greater than laboratory reporting levels as much as 3 of the PFAS constituents comprising the Hazard Index EPA MCL (PFHxS, PFNA, or PFBS). There were no detections of the fourth component of the Hazard Index, HFPO-DA. The site with a high concentration of PFHxS also exceeded the Hazard Index EPA MCL, which is set at 1 (unitless) for mixtures containing two or more of PFHxS, PFNA, PFBS, or HFPO-DA (U.S. Environmental Protection Agency, 2024a).
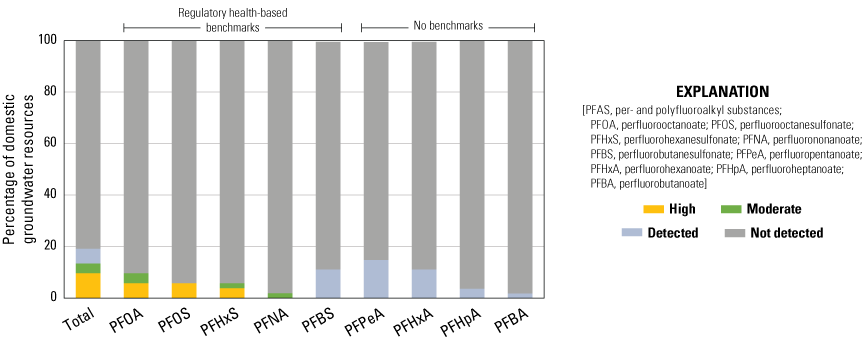
Proportions of domestic groundwater resources in the Gilroy-Hollister Valley groundwater basin and the surrounding areas, California, that have detections of per- and polyfluoroalkyl substances (PFAS) relative to U.S. Environmental Protection Agency maximum contaminant levels, where applicable (Faulkner and Dupuy, 2024).
Factors that Affect Groundwater Quality
Groundwater quality is affected by the cumulative effects of physical and chemical factors. In this study, relevant physical factors include well-construction characteristics, groundwater age, site proximity to groundwater recharge or discharge zones, and potential anthropogenic sources of contamination associated with agricultural and urban land uses. Relevant chemical factors include the initial chemistry of the recharge water, the mineralogy of the aquifer sediments, and the subsequent shifts in chemistry as biologic and geologic reactions alter groundwater in the subsurface. The interplay of these factors can improve or worsen groundwater quality. The following sections discuss how some of these factors may affect the water quality of domestic groundwater resources in the study area.
Agricultural Factors
Nitrate was present at moderate or high concentrations in 26 percent of domestic groundwater resources (fig. 2). Nitrate concentrations greater than the moderate threshold (5 mg-N/L) are commonly associated with agricultural land use (Dubrovsky and others, 2010), and in this study, nitrate was positively correlated with the percentage of agricultural land within 500 m of each well (beige on fig. 4; Spearman’s rho=0.44, p-value=0.01 for land use in 1974; Faulkner and Dupuy, 2024; Dupuy and others, 2025). This correlation implies that the source of moderate and high nitrate in domestic groundwater resources may be related to the application of fertilizers on agricultural land, consistent with the Salt and Nutrient Management Plans for the Llagas and North San Benito subbasins (Todd Groundwater, 2014a, 2014b). Nitrate also was positively correlated with the percentage of urban land within 500 m of each well (pink on fig. 4; Spearman’s rho=0.63, p-value less than 0.001 for land use in 1974; Faulkner and Dupuy, 2024; Dupuy and others, 2025), highlighting the effect of legacy agriculture in the study area (Grossinger and others, 2008). Previous studies of nitrogen and oxygen isotopes of nitrate concluded that applied fertilizer is the primary source of nitrogen in the Gilroy-Hollister Valley groundwater basin (Moran and others, 2005; Visser and others, 2020). Agricultural land use was 23 percent in the study area in 1974 (beige on fig. 4) and slightly decreased to 21 percent in 2012 (Falcone, 2015). Within this same period, nitrate fertilizer application rates on agricultural land in Santa Clara and San Benito counties increased by 51–69 percent (Gronberg, 2012). Because most of the agricultural land use in those two counties is in the Gilroy-Hollister Valley, we assumed that the nitrate fertilizer applications rate in the study area increased by a similar amount. Vegetables and other annual crops accounted for 70 percent of the mapped crop types grown in the study area (Grossinger and others, 2008; California Department of Water Resources, 2018); these crop types account for most of the nitrogen fertilizer application in California (Rosenstock and others, 2013).
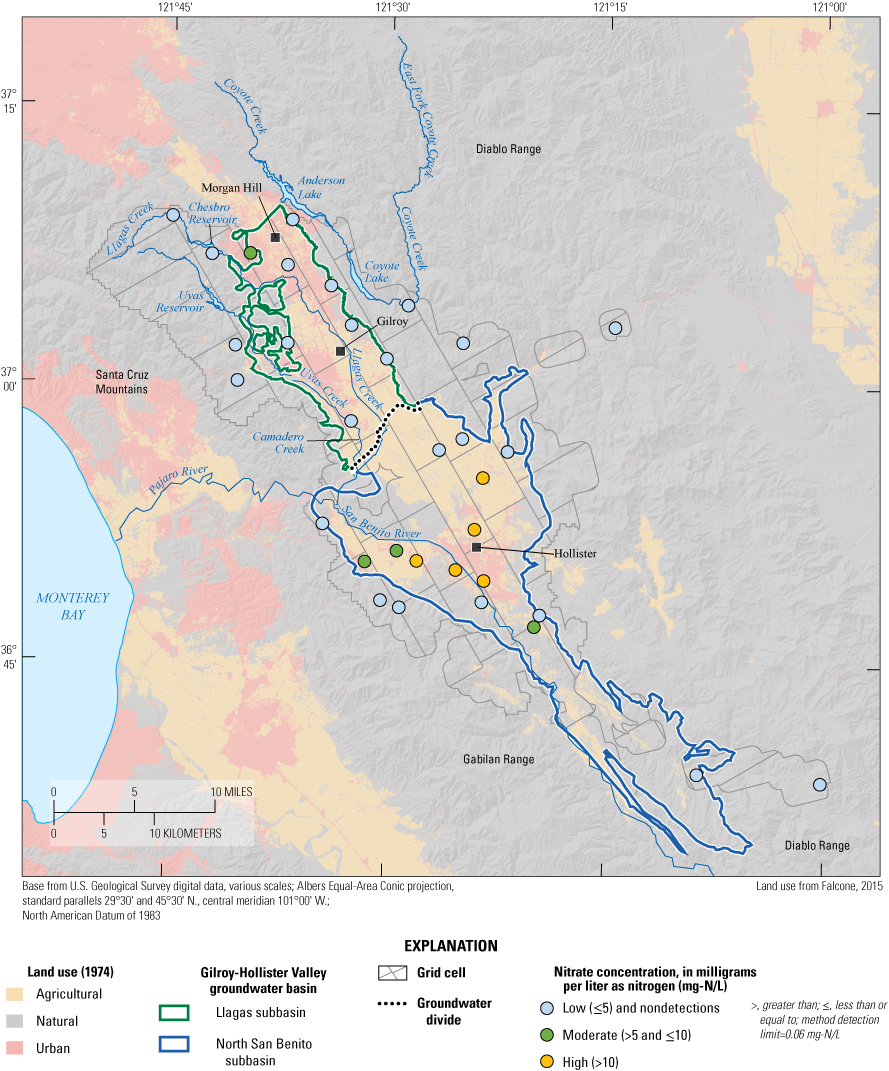
Wells that have low, moderate, and high concentrations of nitrate (as nitrogen) in the Llagas and North San Benito subbasins of the Gilroy-Hollister Valley groundwater basin and the surrounding areas, California (Faulkner and Dupuy, 2024). Grid cells, Gilroy-Hollister Valley groundwater basin and subbasin boundaries, and land use in 1974 also are shown (Falcone, 2015; California Department of Water Resources, 2021).
High nitrate concentrations (greater than 10 mg-N/L) are more prevalent in the North San Benito subbasin than in the Llagas subbasin (fig. 4). The median nitrate concentrations in the North San Benito subbasin and Llagas subbasin were 7.1 mg-N/L and 3.7 mg-N/L, respectively. Nitrate concentrations are positively correlated with distance from the Gilroy-Hollister Valley groundwater basin boundary (green and blue outline on fig. 4; Spearman’s rho=0.53, p-value=0.02; California Department of Water Resources, 2021; Faulkner and Dupuy, 2024). This correlation indicates that wells in the middle of the groundwater basin are more likely to have recharge containing higher nitrate than wells near the groundwater basin margins and surrounding foothills. Most wells sampled in the North San Benito subbasin are farther from the groundwater basin margins (median distance to margin is 2,529 m) than wells sampled in the Llagas subbasin (median distance to margin is 401 m). Wells in the middle of the basin may be more likely to receive recharge with higher nitrate from upgradient agricultural areas. Similarly, wells closer to groundwater basin margins may receive more natural recharge with lower nitrate from creeks and streams draining the adjacent foothills. This finding is consistent with a previous study of nitrate in the Llagas subbasin, which determined that higher nitrate concentrations are in the downgradient parts of the subbasin (Moran and others, 2005) and a 2008 study of groundwater quality in the aquifer used for public supply where nitrate was moderate or high in most (7 of 12) wells in the Llagas subbasin that are downgradient from the wells in this study (Mathany and others, 2009; Parsons and others, 2014). Although nitrate concentrations in this study were low or not detected in wells with the top of the screened interval deeper than 21 m below land surface in the Llagas subbasin, the 2008 study of groundwater quality in the aquifer used for public supply reported that moderate and high concentrations in public supply wells are at greater depths (in wells with the top of the screened interval as deep as at least 110 m below the land surface). These results indicate that although nitrate has reached greater depths in the downgradient parts of the subbasin, it has not reached greater depths in the upgradient parts, and that position of a well relative to the groundwater basin margins has a greater effect on nitrate concentrations than the depth of the screened interval. The domestic supply wells farther from the groundwater basin margins may be more likely to contain moderate or high nitrate concentrations.
The distribution of groundwater age in a sample can be used to assess the degree of susceptibility to nitrate contamination (Tesoriero and others, 2007). Most (85 percent) domestic groundwater resources contain water recharged since the mid-1970s (based on Table_1_AgeInterpretations: Rpt_Age_C1_yrs of Faulkner and Jurgens, 2025). Within the Gilroy-Hollister Valley groundwater basin, groundwater age generally increases along lateral groundwater flow paths. Nitrate concentrations are positively correlated to the proportion of modern water captured by the well (Table_1_AgeInterpretations: Rpt_FracModern of Faulkner and Jurgens, 2025; Spearman’s rho=0.59, p-value less than 0.001), indicating that wells with higher proportions of modern water are more likely to contain higher concentrations of nitrate. Nitrate was not detected in domestic groundwater resources with premodern groundwater ages, which are primarily in the upland areas surrounding the Gilroy-Hollister Valley groundwater basin.
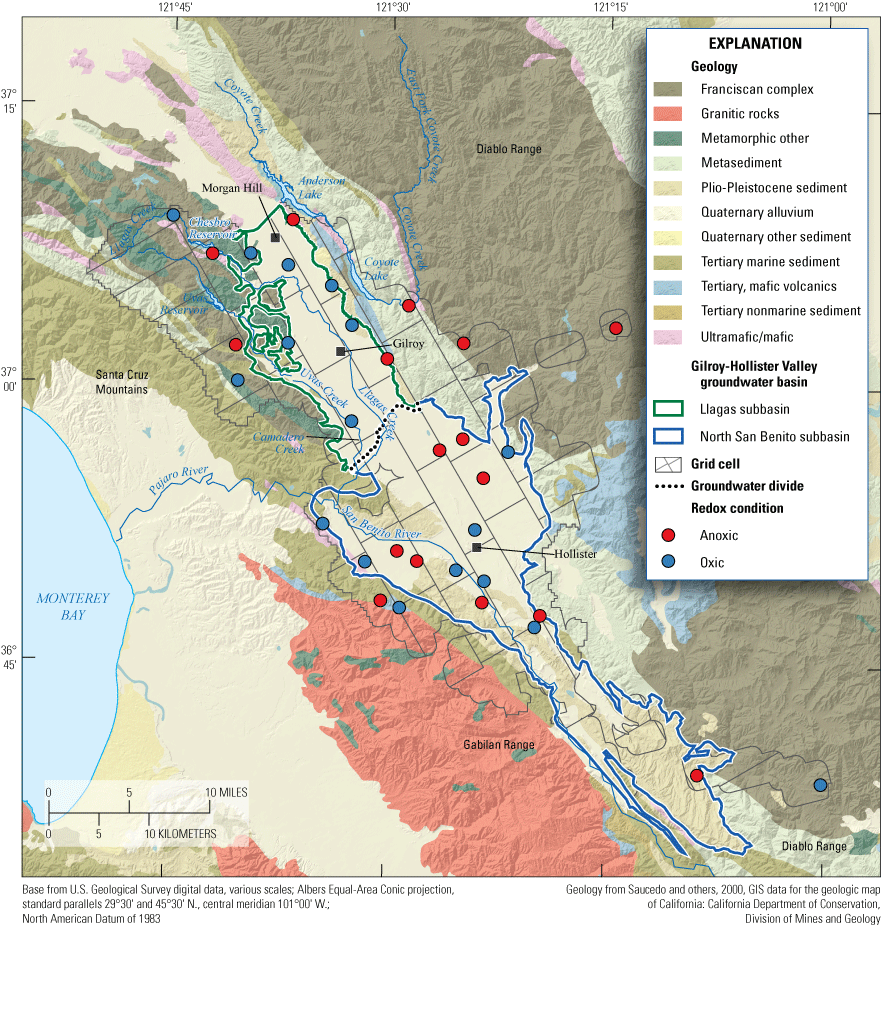
Wells with anoxic (dissolved oxygen [DO] concentrations less than or equal to 0.5 milligrams per liter [mg/L]) and oxic (DO concentrations greater than 0.5 mg/L) redox categories in the Llagas and North San Benito subbasins of the Gilroy-Hollister Valley groundwater basin and the surrounding areas, California. Grid cells and Gilroy-Hollister Valley groundwater basin and subbasin boundaries also are shown, as well as a geologic map (Saucedo and others, 2000; California Department of Water Resources, 2021). Data available from Faulkner and Dupuy (2024).
When redox conditions are anoxic, denitrification can remove dissolved nitrate in groundwater (Payne and Grant, 1981; Dubrovsky and others, 2010). As oxygenated water in equilibrium with the atmosphere moves into the subsurface, oxygen can be consumed by microbes, which leads to anoxic conditions. In this study, samples with dissolved oxygen (DO) greater than 0.5 mg/L were classified as “oxic,” and samples with DO less than or equal to 0.5 mg/L were classified as “anoxic” (fig. 5). About half (48 percent) of domestic groundwater resources in the study area were anoxic (Faulkner and Dupuy, 2024). Nitrate concentrations in groundwater will decrease during denitrification as nitrate is microbially transformed to nitrogen gas. This additional dissolved nitrogen gas exceeds the solubility of nitrogen in water in equilibrium with the atmosphere and is referred to as “excess nitrogen gas.” Excess nitrogen gas was quantified for 26 samples from measurements of dissolved noble gases using the computer program Dissolved Gas Modeling and Environmental Tracer Analysis (DGMETA; Jurgens and others, 2020; Table_2_DissolvedGasModeling: DG_ExcN2_mgL of Faulkner and Jurgens, 2025). The sum of nitrate and excess nitrogen gas (total nitrogen) is the theoretical nitrate concentration prior to the partial transformation to nitrogen gas. Half of the samples had minor amounts of excess nitrogen gas (less than 2 mg-N/L) that accounted for less than half of the total nitrogen. Total nitrogen results indicated that if denitrification did not happen, an additional 9 percent of domestic groundwater resources could have had high nitrate concentrations or 26 percent of domestic groundwater resources overall (fig. 6A). The correlation between total nitrogen and the percentage of agricultural land (Spearman’s rho=0.47, p-value=0.005 for land use in 1974) is stronger than the correlation between measured nitrate concentrations and the percentage of agricultural land (Spearman’s rho=0.44, p-value=0.01 for land use in 1974; Faulkner and Dupuy, 2024; Dupuy and others, 2025). Excess nitrogen gas accounted for more than 50 percent of the total nitrogen in 12 samples, indicating denitrification is an important process mitigating nitrogen inputs from the land surface (fig. 6A).
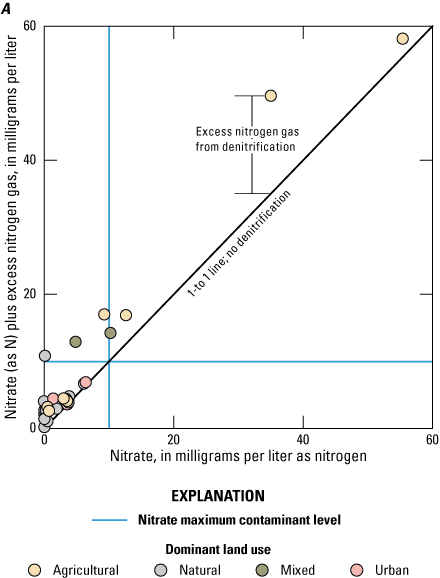
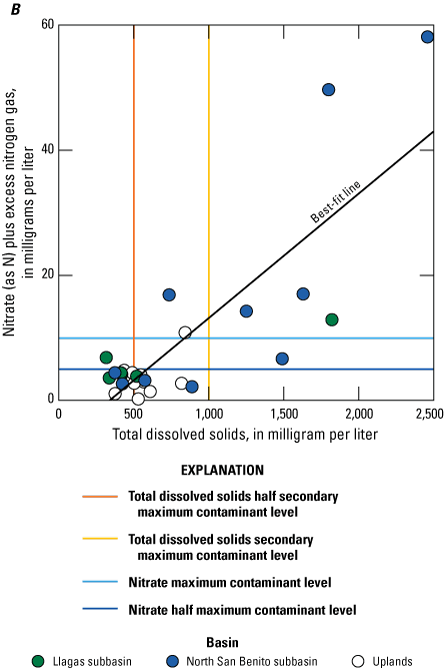
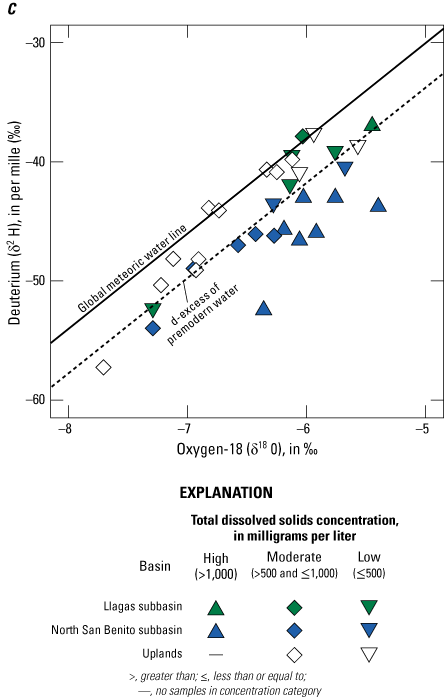

Agricultural factors and water quality of domestic groundwater resources in the Llagas and North San Benito subbasins of the Gilroy-Hollister Valley groundwater basin and the surrounding areas, California: A, The effect of denitrification on nitrate concentrations in wells by land-use; B, relation between total nitrogen and total dissolved solids (TDS) in wells by groundwater subbasin, with a best-fit line in black; C, plot of stable isotopes in wells by groundwater subbasin, with the global meteoric water line in black; and D, the relation between deuterium excess (d-excess) and TDS in wells colored by groundwater subbasin and shaped by nitrate concentration. Light blue and yellow lines show the nitrate maximum contaminant level (MCL) and TDS secondary MCL (SMCL), respectively; dark blue and orange lines show the nitrate half-MCL and TDS half-SMCL, respectively (California Department of Water Resources, 2021; Faulkner and Dupuy, 2024; Dupuy and others, 2025).
Excess nitrogen gas also can originate from deep mantle fluids moving through faults in the area (Mikhail and Sverjensky, 2014). Four samples that had high excess nitrogen gas (greater than 2 mg-N/L) also had high terrigenic helium and helium isotope ratios (greater than 1.65x10⁻⁶; Table_3_ComputedTracerConcentrations: TRC_He_terr_ccpg and 3He_4He_s of Faulkner and Jurgens, 2025), indicating that mantle fluids migrating through faults could be contributing excess nitrogen gas in these samples. However, the excess nitrogen gas in these samples was within the range of excess nitrogen gas in samples with low terrigenic helium and helium isotope ratios, indicating that denitrification was more likely the primary source of excess nitrogen gas.
Salts (TDS) can be concentrated in the water that recharges the aquifer as it evaporates at the surface in transportation or after application for irrigation, uptakes agricultural amendments, accumulates salts in the vadose zone, and increases dissolution and weathering of geologic sources. The relative proportions of TDS loading from agricultural and natural sources varies, where relative agricultural contribution generally decreases from northwest to southeast in the Llagas and North San Benito subbasins (Todd Groundwater, 2014a, 2014b). TDS concentrations are not significantly correlated with the percentage of agricultural land within 500 m of each well. Elevated concentrations of nitrate and TDS are frequently detected together in the North San Benito subbasin, where higher TDS is correlated with higher total nitrogen (Spearman’s rho=0.77, p-value=0.01; fig. 6B; Faulkner and Dupuy, 2024), indicating that agricultural recharge could be a source of TDS in the subbasin. Plots of the stable isotopes of water (deuterium [δ2H] and oxygen-18 [δ18O]) in the study area indicate a shift in isotopic values away from the global meteoric water line, denoting either a local meteoric water line, differences in climatic or recharge conditions, or the effect of evaporation (fig. 6C). Some of the surface water used for engineered recharge is evaporated, imported water, which can account for a shift off of the global meteoric water line; however, the stable isotope signature of the imported water (δ18O range from −10.6 to −9.9 per mil; Moran and others, 2005) is more depleted than in domestic groundwater resources (fig. 6C) and is therefore not considered a major contributor of TDS in domestic groundwater resources at the time of sampling.
The degree of evaporation was characterized by deuterium excess (d-excess, defined as δ2H−8δ18O; Dansgaard, 1964), where lower d-excess values indicate more fractionation through evaporation. TDS were negatively correlated with d-excess (Spearman’s rho=−0.8, p-value less than 0.001) in the North San Benito subbasin, which indicates that TDS had been affected by evaporation. Moreover, d-excess had a negative, although slightly weaker, correlation with TDS for all samples (Spearman’s rho=−0.57, p-value less than 0.001; fig. 6D), indicating that evaporated groundwater recharge has affected groundwater quality to varying degrees in domestic groundwater resources. Because premodern groundwater (containing more than 50 percent premodern water based on Table_1_AgeInterpretations: Rpt_FracModern of Faulkner and Jurgens, 2025) should reflect groundwater recharged under natural conditions, groundwater with d-excess values less than that of premodern groundwater (average d-excess value of 6.28 in domestic groundwater resources; dashed lines on fig. 6C and fig. 6D) are more likely to have been affected by evaporation related to agricultural practices with a modern, evaporative component. Most (88 percent) of the samples with high TDS concentrations had d-excess values less than that of premodern water in domestic groundwater resources. The uptake of agricultural amendments and salts from the vadose zone during irrigation and the addition of salt from imported water used for irrigation (Hansen and others, 2018; Pauloo and others, 2021) also contribute to TDS, particularly in the samples with moderate and high total nitrogen results (fig. 6D). Most (53 percent) of the samples with a modern, evaporative stable isotope signature had low or not-detected total nitrogen results, indicating that the dissolution and weathering of geologic sources likely contribute more TDS to domestic groundwater resources than agriculture (fig. 6D).
Geologic Factors
In the Gilroy-Hollister Valley groundwater basin and surrounding areas, the geology strongly affects groundwater TDS, redox conditions, and trace elements. Valley-fill sediments are derived from the surrounding Diablo Range, Gabilan Range, and Santa Cruz Mountains and contain abundant soluble marine sediments (Kilburn, 1973; Powell and others, 2007; fig. 7A). As water infiltrates through these sediments and recharges the aquifer, it can become naturally elevated in TDS greater than moderate levels (greater than 500 mg/L; Fram, 2017). In this study, 76 percent of domestic groundwater resources had moderate (greater than 500 mg/L) or high (greater than 1,000 mg/L) TDS concentrations (fig. 7A; Faulkner and Dupuy, 2024). Because groundwater TDS in the study area can be naturally elevated, evaporation can cause groundwater to reach higher TDS levels (mentioned earlier in the text; fig. 7A; Faulkner and Dupuy, 2024). The relations between TDS and the major anions (Cl−, bicarbonate [HCO3−], and SO4−2) that constitute TDS can be used to understand the mechanisms controlling groundwater chemistry (Piper, 1944). Moderate concentrations of TDS in many of the HCO3− dominated samples indicated that geology and the dissolution of carbonate from marine sediments is the primary factor contributing to TDS concentrations in the study area (fig. 6B). The higher relative concentrations of both Cl− and SO4−2 in most of the high TDS samples indicate that a combination of evaporation and agricultural inputs further increases TDS in domestic groundwater resources (fig. 6B).
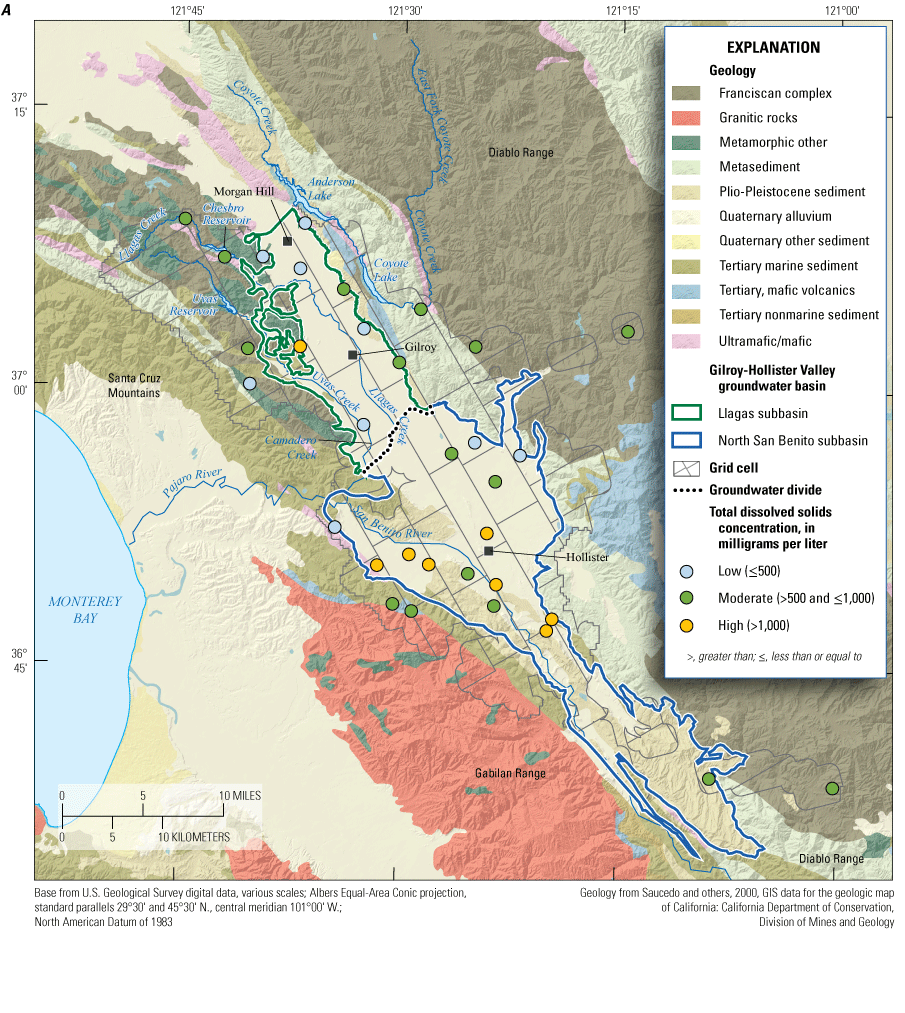
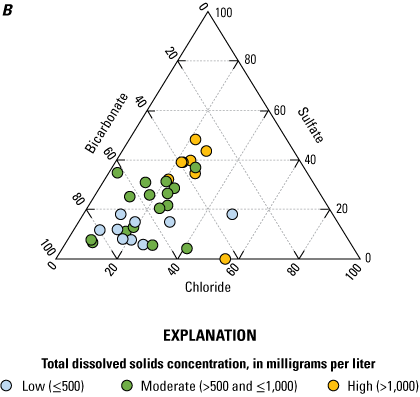
Geologic factors and water quality of domestic groundwater resources in the Llagas and North San Benito subbasins of the Gilroy-Hollister Valley groundwater basin and the surrounding areas, California: A, Wells that have low, moderate, and high concentrations of total dissolved solids (TDS). Grid cells, Gilroy-Hollister Valley groundwater basin and subbasin boundaries, and simplified geology also are shown (Saucedo and others, 2000; California Department of Water Resources, 2021). B, Ternary anion plot by TDS (Piper, 1944). Data available from Faulkner and Dupuy (2024).
Natural geochemical processes can mobilize concentrations of barium, selenium, boron, and chromium from aquifer sediments (Chapman and others, 2013; Izbicki and others, 2015). Each of these constituents was detected at high concentrations in less than 10 percent of domestic groundwater resources and were not detected together, indicating these constituents were mobilized locally. Barium, selenium, and boron are associated with the marine sediments that are dominant in the study area (Deverel and Millard, 1988; Gonneea and Paytan, 2006) and sediments derived from the ultramafic rocks in the southern Coast Range are a dispersed source for chromium (Oze and others, 2003; Izbicki and others, 2015; fig. 7A).
Anoxic redox conditions in groundwater can attenuate nitrate, but anoxic conditions also can mobilize constituents like manganese, iron, and Cr(VI) from aquifer sediments (Tesoriero and others, 2007). Manganese and iron have SMCLs of 50 and 300 µg/L, respectively. Two-thirds of domestic groundwater resources had excess nitrogen gas (presumably from denitrification) greater than 0.5 mg/L, and 28 percent had manganese concentrations greater than the SMCL. One sample had a manganese concentration more than five times the notification level (500 µg/L; Faulkner and Dupuy, 2024); this single very high concentration does not indicate a regional issue. Mixed redox conditions are indicated by an oxic well with a high manganese concentration and by an anoxic well with low manganese and high nitrate concentrations (fig. 8). Of the 19 percent of domestic groundwater resources with chromium concentrations greater than the State of California MCL for Cr(VI) (10 µg/L), most (80 percent) were oxic; chromium is present as Cr(VI) under oxic redox conditions, which is more soluble in groundwater. As these results illustrate, redox reactions can have a positive effect on groundwater quality by attenuating nitrate concentrations through denitrification and a negative effect by mobilizing other trace elements.
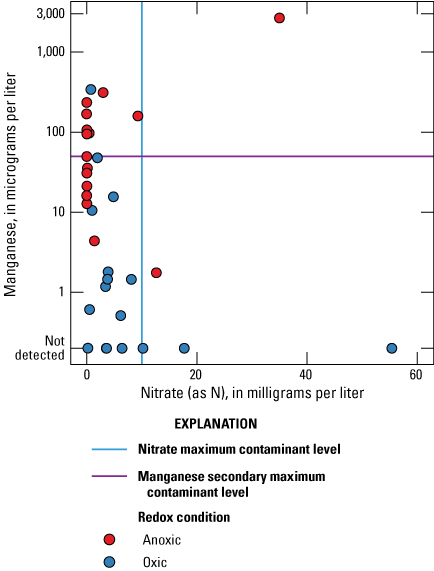
The relation between nitrate and manganese concentrations in wells by redox category in the Llagas and North San Benito subbasins of the Gilroy-Hollister Valley groundwater basin and the surrounding areas, California. Light blue and purple lines show the nitrate maximum contaminant level (MCL) and manganese secondary MCL (SMCL), respectively. Data available from Faulkner and Dupuy (2024).
Urban Factors
PFAS constituents have a broad range of applications and are persistent in the environment, which has led to their widespread distribution and the label “forever chemicals” (California State Water Resources Control Board, 2024c). Sources of PFAS in the study area are mainly collocated with urban land use (fig. 9; Falcone, 2015; Skinner and Wise, 2019; U.S. Environmental Protection Agency, 2024c; U.S. Geological Survey, 2024). Urban land use in the study area increased from 10 to 15 percent between 1974 and 2012 (Falcone, 2015). PFAS was detected in 19 percent of domestic groundwater resources, and the number of PFAS constituents detected in a well, including those with and without EPA MCL benchmarks, was significantly correlated to the percentage of urban land within 500 m of the well (Spearman’s rho=0.55, p-value=0.001 for land use in 2012; Faulkner and Dupuy, 2024; Dupuy and others, 2025). This moderate correlation reflects the nature of point-source contaminants in urban landscapes, where PFAS detection may only be associated with wells that are downgradient from PFAS contamination sources and other wells may be unaffected. The well with the highest number of PFAS constituents detected (S16-GH-08; n=6; app. 1, fig. 1.1) contained high concentrations of PFOA and PFOS, moderate concentrations of PFHxS and PFNA, and detections of PFBS and PFBA (Faulkner and Dupuy, 2024). This well is surrounded by predominantly agricultural land with 25-percent urban land (Dupuy and others, 2025). In this study, the detection frequency of PFAS was 55 percent (6 of 11) in wells that were surrounded by at least 25-percent urban land.
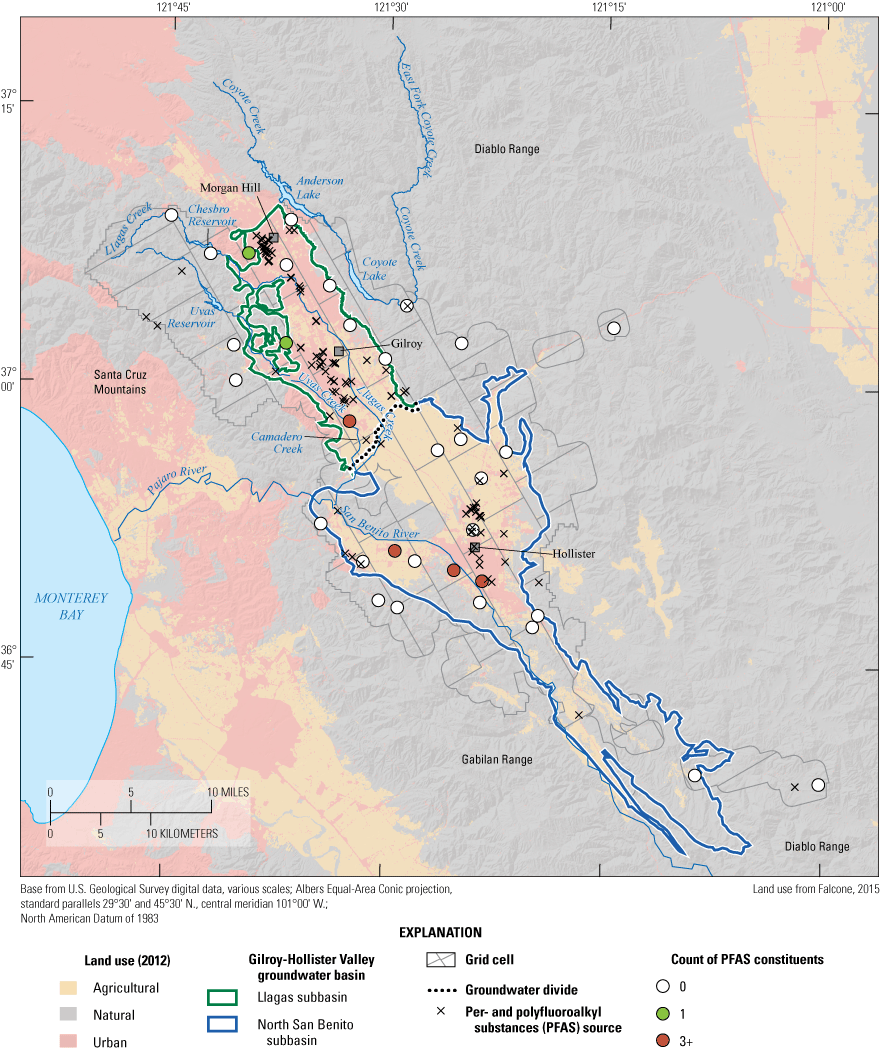
Wells with 0, 1, or 3+ per- and polyfluoroalkyl substance (PFAS) constituents detected at each well and known PFAS source locations in the Llagas and North San Benito subbasins of the Gilroy-Hollister Valley groundwater basin and the surrounding areas, California; grid cells, Gilroy-Hollister Valley groundwater basin boundary, and land use in 2012 also are shown (Falcone, 2015; Skinner and Wise, 2019; California Department of Water Resources, 2021; Faulkner and Dupuy, 2024; U.S. Environmental Protection Agency, 2024c; U.S. Geological Survey, 2024).
The primary sources of PFAS in drinking water are fire response, industrial use, and waste handling (landfills, wastewater treatment plants, and biosolids; California State Water Resources Control Board, 2024c). There are no known PFAS sources within 500 m of any of the wells that have PFAS detections (fig. 9; Skinner and Wise, 2019; U.S. Environmental Protection Agency, 2024c; U.S. Geological Survey, 2024). There are potentially many unknown point sources for PFAS constituents given the broad range of applications and widespread distribution of PFAS. Modern groundwater in a well can indicate greater susceptibility to anthropogenic contamination and a faster response to surface activities compared to wells that do not contain modern groundwater. Most (82 percent) samples, including all samples with PFAS detections, contain modern groundwater recharged after the proliferation of PFAS in manufacturing in the 1940s (U.S. Environmental Protection Agency, 2021; Faulkner and Jurgens, 2025). The number of PFAS constituents detected is weakly correlated with the proportion of modern water captured by the well (Table_1_AgeInterpretations: Rpt_FracModern in Faulkner and Jurgens, 2025; Spearman’s rho=0.4, p-value=0.02), reflecting that although all the wells with PFAS detections (n=6) contain almost completely modern water, half of the wells without PFAS detections do as well (n=13 of 26). Urban land use, locations of PFAS sources, and presence of modern water are important indicators of potential PFAS contamination, but site-specific characterization of groundwater flow paths and identification of additional potential PFAS sources are needed for a comprehensive understanding of PFAS detection in groundwater.
Summary
Groundwater quality in the Gilroy-Hollister Valley groundwater basin and the surrounding areas in the Central Coast of California was studied between August and October of 2022 as part of the Priority Basin Project of the Groundwater Ambient Monitoring and Assessment (GAMA) Program. The study was done in cooperation with the California State Water Resources Control Board. In the study, inorganic constituents in groundwater were greater than regulatory benchmarks (maximum contaminant levels [MCLs]) for public drinking-water quality in 24 percent of domestic groundwater resources. The inorganic constituents that exceeded MCLs for drinking-water were nitrate, barium, chromium, and selenium. Total dissolved solids (TDS) and manganese exceeded aesthetic-based benchmarks. No volatile organic compound or pesticide constituent exceeded regulatory benchmarks in domestic groundwater resources. Total coliform bacteria and enterococci were detected in 4 percent of domestic groundwater resources. Per- and polyfluoroalkyl substances (PFAS) were detected in 19 percent of domestic groundwater resources, with 10 percent exceeding MCLs.
Overall, results of this study indicate that human activities at the land surface have introduced chemicals or exacerbated natural chemical processes that affect the quality of the domestic groundwater resources in the Gilroy-Hollister Valley groundwater basin. Elevated concentrations of nitrate, the most widespread constituent that exceeded its regulatory benchmark, were correlated to agricultural land use, distance from the boundary of the Gilroy-Hollister Valley groundwater basin, and the proportion of modern (post-1950s) water captured by the well. All high nitrate concentrations were in the North San Benito subbasin, where agricultural land use is more prevalent. Excess nitrogen gas in samples from sites surrounded by agricultural land indicates that denitrification under anoxic conditions can mitigate some nitrate derived from fertilizer applications at the land surface; however, these conditions also increase the mobility of manganese in groundwater. Total dissolved solids, the most widespread constituent that exceeded its aesthetic-based benchmark, was derived from water-rock interactions with soils and aquifer materials and from agricultural practices in the study area. Total dissolved solids concentrations were elevated throughout the study area, but the highest concentrations were in the North San Benito subbasin. Elevated nitrate and TDS concentrations were frequently detected together, highlighting the effect of agricultural practices on groundwater quality. Mineralogy of aquifer sediments and rocks also affect barium, selenium, boron, and chromium concentrations in the Gilroy-Hollister Valley groundwater basin. PFAS is introduced to domestic groundwater resources through human activity and was positively correlated with urban land use and the proportion of modern water captured by the well.
References Cited
Belitz, K., Fram, M.S., and Johnson, T.D., 2015, Metrics for assessing the quality of groundwater used for public supply, CA, USA—Equivalent-population and area: Environmental Science & Technology, v. 49, no. 14, p. 8330–8338, accessed December 12, 2024, at https://doi.org/10.1021/acs.est.5b00265.
Belitz, K., Jurgens, B., Landon, M.K., Fram, M.S., and Johnson, T.[D.], 2010, Estimation of aquifer scale proportion using equal area grids—Assessment of regional scale groundwater quality: Water Resources Research, v. 46, no. 11, 14 p., accessed December 12, 2024, at https://doi.org/10.1029/2010WR009321.
Burow, K.R., Shelton, J.L., and Dubrovsky, N.M., 2008, Regional nitrate and pesticide trends in ground water in the eastern San Joaquin Valley, California: Journal of Environmental Quality, v. 37, no. S5, p. S-249–S-263, accessed December 12, 2024, at https://doi.org/10.2134/jeq2007.0061.
California Department of Water Resources, 2003a, Gilroy-Hollister Groundwater Basin, Llagas subbasin (revised February 2004), in California’s groundwater bulletin 118, update 2003: California Department of Water Resources report, 5 p., accessed March 7, 2024, at https://data.cnra.ca.gov/dataset/12e534ff-f604-4ba9-82db-486d81e082ff/resource/4838b124-c1f8-4192-b719-8350c17dc661/download/b118_2003_basindescriptio n_3_003_01.pdf.
California Department of Water Resources, 2003b, Gilroy-Hollister Valley Groundwater Basin, Bolsa area subbasin (revised February 2004), in California’s groundwater bulletin 118, update 2003: California Department of Water Resources report, 5 p., accessed March 7, 2024, at https://data.cnra.ca.gov/dataset/12e534ff-f604-4ba9-82db-486d81e082ff/resource/b857f610-c65d-4d8e-aa06-ba35dbf2a082/download/b118_2003_basindescriptio n_3_003_02.pdf.
California Department of Water Resources, 2003c, Gilroy-Hollister Valley Groundwater Basin, Hollister area subbasin (revised February 2004), in California’s groundwater bulletin 118, update 2003: California Department of Water Resources report, 5 p., accessed March 7, 2024, at https://data.cnra.ca.gov/dataset/12e534ff-f604-4ba9-82db-486d81e082ff/resource/c591c401-b97b-4939-adce-9b0c3485da60/download/b118_2003_basindescriptio n_3_003_03.pdf.
California Department of Water Resources, 2003d, Gilroy-Hollister Valley Groundwater Basin, San Juan Bautista area subbasin (revised February 2004), in California’s groundwater bulletin 118, update 2003: California Department of Water Resources report, 5 p., accessed March 7, 2024, at https://data.cnra.ca.gov/dataset/12e534ff-f604-4ba9-82db-486d81e082ff/resource/cacb31fc-a8e6-419a-8177-11532f0613c3/download/b118_2003_basindescriptio n_3_003_04.pdf.
California Department of Water Resources, 2018, California Department of Water Recourses land use viewer: California Department of Water Resources database, accessed November 2023 at https://gis.water.ca.gov/app/CADWRLandUseViewer.
California Department of Water Resources, 2021, California’s groundwater update 2020: California Department of Water Resources Bulletin 118, 485 p., accessed March 7, 2024, at https://data.cnra.ca.gov/dataset/calgw_update2020/resource/d2b45d3c-52c0-45ba-b92a-fb3c90c1d4be.
California State Water Resources Control Board, 2019, Groundwater fact sheet—Bacteria indicators: California State Water Resources Control Board, Groundwater Ambient Monitoring and Assessment Program (GAMA) report, 5 p., accessed March 7, 2024, at https://www.waterboards.ca.gov/gama/docs/coc_bacteria_indicators.pdf.
California State Water Resources Control Board, 2022, Manganese in drinking water: California State Water Resources Control Board web page, accessed March 7, 2024, at https://www.waterboards.ca.gov/drinking_water/certlic/drinkingwater/Manganese.html.
California State Water Resources Control Board, 2024a, A guide for private domestic well owners: California State Water Resources Control Board, Groundwater Ambient Monitoring and Assessment Program (GAMA) report, 28 p., accessed March 7, 2024, at https://www.waterboards.ca.gov/water_issues/programs/gama/docs/wellowner_guide.pdf.
California State Water Resources Control Board, 2024b, Hexavalent chromium MCL (SWRCB-DDW-21-003): California State Water Resources Control Board web page, accessed April 22, 2024, at https://www.waterboards.ca.gov/drinking_water/certlic/drinkingwater/SWRCBDDW-21-003_hexavalent_chromium.html.
California State Water Resources Control Board, 2024c, PFAS—Per- and polyfluoroalkyl substances: California State Water Resources Control Board web page, accessed April 12, 2024, at https://www.waterboards.ca.gov/drinking_water/certlic/drinkingwater/pfas.html.
Chapman, M.J., Cravotta, C.A., III, Szabo, Z., and Lindsay, B.D., 2013, Naturally occurring contaminants in the Piedmont and Blue Ridge crystalline-rock aquifers and Piedmont Early Mesozoic basin siliciclastic-rock aquifers, eastern United States, 1994–2008: U.S. Geological Survey Scientific Investigations Report 2013–5072, 74 p., accessed December 12, 2024, at https://doi.org/10.3133/sir20135072.
Dansgaard, W., 1964, Stable isotopes in precipitation: Tellus, v. 16, no. 4, p. 436–468, accessed December 12, 2024, at https://doi.org/10.3402/tellusa.v16i4.8993.
Degnan, J.R., Kauffman, L.J., Erickson, M.L., Belitz, K., and Stackelberg, P.E., 2021, Depth of groundwater used for drinking-water supplies in the United States: U.S. Geological Survey Scientific Investigations Report 2021–5069, 69 p., accessed December 12, 2024, at https://doi.org/10.3133/sir20215069.
Deverel, S.J., and Millard, S.P., 1988, Distribution and mobility of selenium and other trace elements in shallow groundwater of the western San Joaquin Valley, California: Environmental Science & Technology, v. 22, no. 6, p. 697–702, accessed December 12, 2024, at https://doi.org/10.1021/es00171a013.
Dupuy, D.I., Watson, E., and Johnson, T.D, 2025, Potential explanatory variables for groundwater quality in California: U.S. Geological Survey data release, https://doi.org/10.5066/P13E3VUU.
Dubrovsky, N.M, Burow, K.R., Clark, G.M., Gronberg, J.M., Hamilton, P.A., Hitt, K.J., Mueller, D.K., Munn, M.D., Nolan, B.T., Puckett, L.J., Rupert, M.G., Short, T.M., Spahr, N.E., Sprague, L.A., and Wilber, W.G., 2010, The quality of our Nation’s waters—Nutrients in the Nation’s streams and groundwater, 1992–2004: U.S. Geological Survey Circular 1350, 174 p., accessed April 10, 2025, at https://doi.org/10.3133/cir1350.
Evich, M.G., Davis, M.J., McCord, J.P., Acrey, B., Awkerman, J.A., Knappe, D.R.U., Lindstrom, A.B., Speth, T.F., Tebes-Stevens, C., Strynar, M.J., Wang, Z., Weber, E.J., Henderson, W.M., and Washington, J.W., 2022, Per- and polyfluoroalkyl substances in the environment: Science, v. 375, no. 6580, accessed April 10, 2025, at https://doi.org/10.1126/science.abg9065.
Falcone, J.A., 2015, U.S. conterminous wall-to-wall anthropogenic land use trends (NWALT), 1974–2012: U.S. Geological Survey Data Series 948, 33 p. plus appendixes 3–6 as separate files, accessed December 12, 2024, at https://doi.org/10.3133/ds948.
Faulkner, K.E., and Dupuy, D.I., 2024, Groundwater-quality data in the Gilroy Hollister basin and surrounding areas Domestic-Supply Aquifer Study Unit, 2022—Results from the California GAMA Priority Basin Project: U.S. Geological Survey data release, https://doi.org/10.5066/P9OY3HT6.
Faulkner, K.E., and Jurgens, B.C., 2025, Data for assessing the susceptibility of groundwater used for domestic-supply, California (April 2025): U.S. Geological Survey data release, https://doi.org/10.5066/P13ISEGA.
Fram, M.S., 2017, Groundwater quality in the Western San Joaquin Valley study unit, 2010—California GAMA Priority Basin Project: U.S. Geological Survey Scientific Investigations Report 2017–5032, 130 p., accessed April 10, 2025, at https://doi.org/10.3133/sir20175032.
Gonneea, M.E., and Paytan, A., 2006, Phase associations of barium in marine sediments: Marine Chemistry, v. 100, nos. 1–2, p. 124–135, accessed December 12, 2024, at https://doi.org/10.1016/j.marchem.2005.12.003.
Green, C.T., Jurgens, B.C., Zhang, Y., Starn, J.J., Singleton, M.J., and Esser, B.K., 2016, Regional oxygen reduction and denitrification rates in groundwater from multi-model residence time distributions, San Joaquin Valley, USA: Journal of Hydrology, v. 543, pt. A, p. 155–166, accessed December 12, 2024, at https://doi.org/10.1016/j.jhydrol.2016.05.018.
Gronberg, J.M., 2012, County-level estimates of nitrogen and phosphorus from commercial fertilizer for the conterminous United States, 1987–2006: U.S. Geological Survey data release, accessed December 12, 2024, at https://doi.org/10.5066/P9E60J5U.
Grossinger, R.M., Beller, E.E., Salomon, M.N., Whipple, A.A., Askevold, R.A., Striplen, C.J., Brewster, E., and Leidy, R.A., 2008, Land use history, chap. 3 of South Santa Clara Valley historical ecology study, including Soap Lake, the Upper Pajaro River, and Llagas, Uvas-Carnadero, and Pacheco Creeks: Santa Clara Valley Water District and The Nature Conservancy, prepared by San Francisco Estuary Institute [SFEI Publication #558], p. 13–38, accessed August 12, 2024, at https://www.sfei.org/sites/default/files/biblio_files/3_landusehistory_SouthSantaClaraValleyHEStudy_HighResolution_0.pdf.
Hansen, J.A., Jurgens, B.C., and Fram, M.S., 2018, Quantifying anthropogenic contributions to century-scale groundwater salinity changes, San Joaquin Valley, California, USA: Science of the Total Environment, v. 642, p. 125–136, accessed April 10, 2025, at https://doi.org/10.1016/j.scitotenv.2018.05.333.
Helsel, D.R., Hirsch, R.M., Ryberg, K.R., Archfield, S.A., and Gilroy, E.J., 2020, Statistical methods in water resources: U.S. Geological Survey Techniques and Methods, book 4, chap. A3, 458 p., accessed December 12, 2024, at https://doi.org/10.3133/tm4A3. [Supersedes U.S. Geological Survey Techniques of Water-Resources Investigations, book 4, chap. A3, version 1.1.]
Hollander, M., Wolfe, D.A., and Chicken, E., 2014, Nonparametric statistical methods: New York, John Wiley and Sons, 848 p., https://doi.org/10.1002/9781119196037.
Izbicki, J.A., Wright, M.T., Seymour, W.A., McCleskey, R.B., Fram, M.S., Belitz, K., and Esser, B.K., 2015, Cr (VI) occurrence and geochemistry in water from public-supply wells in California: Applied Geochemistry, v. 63, p. 203–217, accessed December 12, 2024, at https://doi.org/10.1016/j.apgeochem.2015.08.007.
Johnson, T.D., and Belitz, K., 2019, Domestic well locations and populations served in the contiguous U.S.—Datasets for decadal years 2000 and 2010: U.S. Geological Survey data release, https://doi.org/10.5066/P9FSLU3B.
Jurgens, B.C., Böhlke, J.K., and Eberts, S.M., 2012, TracerLPM (version 1)—An Excel workbook for interpreting groundwater age distributions from environmental tracer data: U.S. Geological Survey Techniques and Methods, book 4, chap. F3, 60 p., accessed December 12, 2024, at https://doi.org/10.3133/tm4F3.
Jurgens, B.C., Böhlke, J.K., Haase, K.[H.], Busenberg, E., Hunt, A.G., and Hansen, J.A., 2020, DGMETA (version 1)—Dissolved gas modeling and environmental tracer analysis computer program: U.S. Geological Survey Techniques and Methods, book 4, chap. F5, 50 p., accessed December 12, 2024, at https://doi.org/10.3133/tm4F5.
Jurgens, B.C., Fram, M.S., Belitz, K., Burow, K.R., and Landon, M.K., 2010, Effects of groundwater development on uranium—Central Valley, California, USA: Groundwater, v. 48, no. 6, p. 913–928, accessed December 12, 2024, at https://doi.org/10.1111/j.1745-6584.2009.00635.x.
Kilburn, C., 1973, Ground-water hydrology of the Hollister and San Juan Valleys, San Benito County, California, 1913–68: U.S. Geological Survey Open-File Report 73–144, 44 p., accessed December 12, 2024, at https://doi.org/10.3133/ofr73144.
Lindsey, B.D., Ayotte, J.D., Jurgens, B.C., and Desimone, L.A., 2017, Using groundwater age distributions to understand changes in methyl tert-butyl ether (MtBE) concentrations in ambient groundwater, northeastern United States: Science of the Total Environment, v. 579, p. 579–587, accessed December 12, 2024, at https://doi.org/10.1016/j.scitotenv.2016.11.058.
Mathany, T.M., Kulongoski, J.T., Ray, M.C., and Belitz, K., 2009, Groundwater-quality data in the South Coast Interior Basins study unit, 2008—Results from the California GAMA Program: U.S. Geological Survey Data Series 463, 82 p., accessed December 12, 2024, at https://doi.org/10.3133/ds463.
Mikhail, S., and Sverjensky, D.A., 2014, Nitrogen speciation in upper mantle fluids and the origin of Earth’s nitrogen-rich atmosphere: Nature Geoscience, v. 7, p. 816–819, accessed December 12, 2024, at https://doi.org/10.1038/ngeo2271.
Moran, J.E., McNab, W.W., Esser, B.K., Hudson, G.B., Carle, S., Beller, H., Kane, S., Tompson, A.F.B., Letain, T., Moore, K., Eaton, G., Leif, R., Moody-Bartel, C., and Singleton, M., 2005, California GAMA Program—Sources and transport of nitrate in shallow groundwater in the Llagas Basin of Santa Clara County, California: Lawrence Livermore National Laboratory report, 37 p., accessed March 20, 2024, at https://water.llnl.gov/sites/water/files/2020-09/llagas_nitrate_shallow_gw2005_llnl.pdf.
Oze, C.J., LaForce, M.J., Wentworth, C.M., Hanson, R.T., Bird, D.K., and Coleman, R.G., 2003, Chromium geochemistry of serpentinous sediment in the Willow core, Santa Clara County, California: U.S. Geological Survey Open-File Report 2003–251, 24 p., accessed December 12, 2024, at https://doi.org/10.3133/ofr03251.
Parsons, M.C., Kulongoski, J.T., and Belitz, K., 2014, Status and understanding of groundwater quality in the South Coast Interior groundwater basins, 2008—California GAMA Priority Basin Project: U.S. Geological Survey Scientific Investigations Report 2014–5023, 68 p., accessed April 10, 2025, at https://doi.org/10.3133/sir20145023.
Pauloo, R.A., Fogg, G.E., Guo, Z., and Harter, T., 2021, Anthropogenic basin closure and groundwater salinization (ABCSAL): Journal of Hydrology, v. 593, 13 p., accessed April 10, 2025, at https://doi.org/10.1016/j.jhydrol.2020.125787.
Payne, W.J., and Grant, M.A., 1981, Overview of denitrification, in Lyons, J.M., Valentine, R.C., Phillips, D.A., Rains, D.W., and Huffaker, R.C., eds., Genetic engineering of symbiotic nitrogen fixation and conservation of fixed nitrogen: New York, Plenum Press, p. 411–427, accessed December 12, 2024, at https://doi.org/10.1007/978-1-4684-3953-3_33.
Piper, A.M., 1944, A graphic procedure in the geochemical interpretation of water-analyses: Eos, Transactions American Geophysical Union, v. 25, no. 6, p. 914–928, accessed April 10, 2025, at https://doi.org/10.1029/TR025i006p00914.
Plummer, L.N., Bexfield, L.M., and Anderholm, S.K., 2002, Chemical characteristics of water in the aquifer system, chap. 6 of Bartolino, J.R., and Cole, J.C., Ground-water resources of the middle Rio Grande Basin, New Mexico: U.S. Geological Survey Circular 1222, p. 91–100, accessed September 11, 2015, at https://pubs.usgs.gov/circ/2002/circ1222/pdf/chap6.pdf.
Powell, C.L., II, Barron, J.A., Sarna-Wojcicki, A.M., Clark, J.C., Perry, F.A., Brabb, E.E., and Fleck, R.J., 2007, Age, stratigraphy, and correlations of the late Neogene Purisima Formation, central California coast ranges: U.S. Geological Survey Professional Paper 1740, 32 p., accessed December 12, 2024, at https://doi.org/10.3133/pp1740.
PRISM Climate Group, 2022, United States average annual precipitation, maximum and minimum temperature, 1981–2023: Oregon State University, PRISM Climate Group website, accessed March 7, 2024, at https://prism.oregonstate.edu/recent/.
R Core Team, 2024, R—A language and environment for statistical computing: Vienna, Austria, R Foundation for Statistical Computing, accessed June 30, 2025, at http://www.R-project.org/.
Ransom, K.M., Nolan, B.T., Traum, J.A., Faunt, C.C., Bell, A.M., Gronberg, J.M., Wheeler, D.C., Rosecrans, C.Z., Jurgens, B.C., Schwarz, G.E., Belitz, K., Eberts, S.M., Kourakos, G., and Harter, T., 2017, A hybrid machine learning model to predict and visualize nitrate concentration throughout the Central Valley aquifer, California, USA: Science of the Total Environment, v. 601 and 602, accessed December 12, 2024, at https://doi.org/10.1016/j.scitotenv.2017.05.192.
Rosenstock, T.S., Liptzin, D., Six, J., and Tomich, T.P., 2013, Nitrogen fertilizer use in California—Assessing the data, trends, and a way forward: California Agriculture, v. 67, no. 1, p. 68–79, accessed May 2024 at https://escholarship.org/uc/item/5mk2q1sm. [Available at https://doi.org/10.3733/ca.E.v067n01p68.]
Shelton, J.L., and Fram, M.S., 2017, Groundwater-quality data for the Madera/Chowchilla–Kings shallow aquifer study unit, 2013–14—Results from the California GAMA Program: U.S. Geological Survey Data Series 1019, 115 p., accessed December 12, 2024, at https://doi.org/10.3133/ds1019.
Shelton, J.L., and Tejeda, E., 2024, California Groundwater Ambient Monitoring and Assessment (GAMA) Program Priority Basin Project—Domestic-supply assessment: U.S. Geological Survey Fact Sheet 2024–3002, 2 p., accessed December 12, 2024, at https://doi.org/10.3133/fs20243002.
Shelton, J.L., Burow, K.R., Belitz, K.B., Dubrovsky, N.M., Land, M., and Gronberg, J., 2001, Low-level volatile organic compounds in active public supply wells as ground-water tracers in the Los Angeles Physiographic Basin, California, 2000: U.S. Geological Survey Water-Resources Investigations Report 2001–4188, 29 p., accessed December 12, 2024, at https://doi.org/10.3133/wri20014188.
Skinner, K.D., and Wise, D., 2019, Point-source nutrient loads to streams of the conterminous United States, 2012: U.S. Geological Survey data release, accessed December 12, 2024, at https://doi.org/10.5066/P9PYVPFT.
Tesoriero, A.J., Saad, D.A., Burow, K.R., Frick, E.A., Puckett, L.J., and Barbash, J.E., 2007, Linking ground-water age and chemistry data along flow paths—Implications for trends and transformations of nitrate and pesticides: Journal of Contaminant Hydrology, v. 94, nos. 1–2, p. 139–155, accessed December 12, 2024, at https://doi.org/10.1016/j.jconhyd.2007.05.007.
Tick, G., and Gurdak, J., 2024, Santa Clara Valley Water District Annual Groundwater Report for Calendar Year 2023: Valley Water, 199 p., accessed April 10, 2025, at https://s3.us-west-1.amazonaws.com/valleywater.org.us-west-1/s3fs-public/web%20version_2023%20Annual_Groundwater_Report_10-9-2024.pdf.
Todd Groundwater, 2014a, Salt and nutrient management plan for Northern San Benito County: San Benito County Water District, 313 p., accessed April 10, 2025, at https://sbcwd.com/wp-content/uploads/2018/08/Final-Salt-and-Nutrient-Management-Plan.pdf.
Todd Groundwater, 2014b, Final salt and nutrient management plan—Llagas subbasin: Santa Clara Valley Water District, 252 p., accessed April 10, 2025, at https://s3.us-west-1.amazonaws.com/valleywater.org.us-west-1/s3fs-public/2018-02/2014%20Llagas%20Basin%20Salt%20and%20Nutirent%20Management%20Plan-op. pdf.
Todd Groundwater, 2024, North San Benito Annual Groundwater Report 2023: Valley Water, 144 p., accessed April 10, 2025, at https://sbcwd.com/wp-content/uploads/2024/04/SGMA-Annual-Report-WY23-FINAL-03252024.pdf.
U.S. Environmental Protection Agency, 2021, Basic information on PFAS: U.S. Environmental Protection Agency web page, accessed June 28, 2024, at https://19january2021snapshot.epa.gov/pfas/basic-information-pfas_.html.
U.S. Environmental Protection Agency, 2024a, Per- and polyfluoroalkyl substances (PFAS) final PFAS national primary drinking water regulation: U.S. Environmental Protection Agency web page, accessed April 22, 2024, at https://www.epa.gov/sdwa/and-polyfluoroalkyl-substances-pfas.
U.S. Environmental Protection Agency, 2024b, Per- and polyfluoroalkyl substances (PFAS) occurrence and contaminant background support document for the final PFAS national primary drinking water regulation, accessed June 2025 at https://www.epa.gov/system/files/documents/2024-04/updated-technical-support-document-on-pfas-occurrence_final508.pdf.
U.S. Environmental Protection Agency, 2024c, PFAS analytic tools: U.S. Environmental Protection Agency web page, accessed March 2024 at https://echo.epa.gov/trends/pfas-tools.
U.S. Geological Survey, 2024, The National Map, TNMCorps structure: U.S. Geological Survey web page, accessed March 2024 at https://edits.nationalmap.gov/tnmcorps.
U.S. Geological Survey, [variously dated], National field manual for the collection of water-quality data: U.S. Geological Survey Techniques of Water-Resources Investigations, book 9, 10 chap. (A0–A8, A10), accessed August 2024 at https://doi.org/10.3133/twri09.
Visser, A., Moran, J., Singleton, M., Deinhart, A., and Oerter, E., 2020, Comprehensive isotopic analyses of sources, flow paths, and geochemical processes affecting nitrate in Central Coast groundwater: Lawrence Livermore National Laboratory report LLNL-TR-810026, 66 p., accessed March 20, 2024, at https://water.llnl.gov/sites/water/files/2021-02/CCWB_LLNL_report_final.pdf.
Zogorski, J.S., Carter, J.M., Ivahnenko, T., Lapham, W.W., Moran, M.J., Rowe, B.L., Squillace, P.J., and Toccalino, P.L., 2006, The quality of our Nation’s waters—Volatile organic compounds in the Nation’s ground water and drinking-water supply wells: U.S. Geological Survey Circular 1292, 101 p., accessed December 12, 2024, at https://doi.org/10.3133/cir1292.
Appendix 1. Study Area and Sampled Wells
Gilroy-Hollister Valley groundwater basin and the surrounding areas, California, extent of the Llagas and North San Benito subbasins, the groundwater divide between the subbasins, sampling grid cells for the study area, and the names and locations of wells sampled to characterize groundwater resources used for domestic drinking-water supply (California Department of Water Resources, 2021; Faulkner and Dupuy, 2024).
References Cited
California Department of Water Resources, 2021, California’s groundwater update 2020: California Department of Water Resources Bulletin 118, 485 p., accessed March 7, 2024, at https://data.cnra.ca.gov/dataset/calgw_update2020/resource/d2b45d3c-52c0-45ba-b92a-fb3c90c1d4be.
Faulkner, K.E., and Dupuy, D.I., 2024, Groundwater-quality data in the Gilroy Hollister basin and surrounding areas Domestic-Supply Aquifer Study Unit, 2022—Results from the California GAMA Priority Basin Project: U.S. Geological Survey data release, https://doi.org/10.5066/P9OY3HT6.
Conversion Factors
International System of Units to U.S. customary units
Supplemental Information
Concentrations of chemical constituents in water are given in either milligrams per liter (mg/L) or micrograms per liter (µg/L). Concentrations of nitrate as nitrogen are given in milligrams per liter as nitrogen (mg-N/L).
Abbreviations
δ2H
deuterium
δ18O
oxygen-18
1,2-DCP
1,2-dichloropropane
BMM
binary mixing model
Cl−
chloride
Cr(VI)
hexavalent chromium
d-excess
deuterium excess
DM
dispersion model
DO
dissolved oxygen
EPA
U.S. Environmental Protection Agency
GAMA
Groundwater Ambient Monitoring and Assessment
HCO3−
bicarbonate
HFPO-DA
perfluoro-2-propoxypropanoate
LPM
lumped parameter model
MCL
maximum contaminant level
p-value
probability value
PBP
Priority Basin Project
PFAS
per- and polyfluoroalkyl substances
PFBA
perfluorobutanoate
PFBS
perfluorobutanesulfonate
PFHpA
perfluoroheptanoate
PFHxA
perfluorohexanoate
PFHxS
perfluorohexanesulfonate
PFNA
perfluorononanoate
PFOA
perfluorooctanoate
PFOS
perfluorooctanesulfonate
PFPeA
perfluoropentanoate
SMCL
secondary maximum contaminant level
SO4−2
sulfate
SWRCB
State Water Resources Control Board
TDS
total dissolved solids
USGS
U.S. Geological Survey
VOC
volatile organic compound
For more information concerning the research in this report, contact the
Director, California Water Science Center
U.S. Geological Survey
6000 J Street, Placer Hall
Sacramento, California 95819
https://www.usgs.gov/centers/california-water-science-center
Publishing support provided by the Science Publishing Network,
Sacramento Publishing Service Center
Disclaimers
Any use of trade, firm, or product names is for descriptive purposes only and does not imply endorsement by the U.S. Government.
Although this information product, for the most part, is in the public domain, it also may contain copyrighted materials as noted in the text. Permission to reproduce copyrighted items must be secured from the copyright owner.
Suggested Citation
Faulkner, K.E., and Jurgens, B.C., 2025, Quality of groundwater used for domestic supply in the Gilroy-Hollister basin and surrounding areas, California, 2022: U.S. Geological Survey Scientific Investigations Report 2025–5097, 26 p., https://doi.org/10.3133/sir20255097.
ISSN: 2328-0328 (online)
Study Area
| Publication type | Report |
|---|---|
| Publication Subtype | USGS Numbered Series |
| Title | Quality of groundwater used for domestic supply in the Gilroy-Hollister basin and surrounding areas, California, 2022 |
| Series title | Scientific Investigations Report |
| Series number | 2025-5097 |
| DOI | 10.3133/sir20255097 |
| Publication Date | December 01, 2025 |
| Year Published | 2025 |
| Language | English |
| Publisher | U.S. Geological Survey |
| Publisher location | Reston, VA |
| Contributing office(s) | California Water Science Center |
| Description | viii, 26 p. |
| Country | United States |
| State | California |
| Other Geospatial | Gilroy-Hollister basin |
| Online Only (Y/N) | Y |