

Water-Budget Simulations for Selected Watersheds in Cameron County, Texas, 2022–23
Links
- Document: Report (6.92 MB pdf) , HTML , XML
- Data Release: USGS Data Release - Hydrological Simulation Program—FORTRAN (HSPF) user-control, input, and output files for simulation of hydrologic conditions in selected watersheds in Cameron County, Texas, 2022–23
- NGMDB Index Page: National Geologic Map Database Index Page (html)
- Download citation as: RIS | Dublin Core
Abstract
The U.S. Geological Survey, in cooperation with the City of Brownsville, Texas, configured and calibrated a set of hydrologic models for a 217-square-mile study area in Cameron County in south Texas during 2022–23. The models were used for estimating runoff and quantities of water diverted from the Rio Grande/Rio Bravo del Norte (hereinafter referred to as the “Rio Grande”) to maintain water-surface elevations in the canals and resacas (former distributary channels cut off from the main channel of the Rio Grande). Resacas provide habitat to aquatic species and help reduce the effects of flooding.
Because of the large size of the study area and diversity of hydrologic conditions, the study area was divided into 11 watersheds, and separate hydrologic models were developed for 9 of the watersheds. Six of the nine modeled watersheds are drained mostly by canals (canal watersheds), and three of the modeled watersheds drain to resacas (resaca watersheds). The Hydrological Simulation Program—FORTRAN was selected for modeling the study area watersheds because it is flexible in simulating a wide variety of watershed conditions.
The models were calibrated with streamflow data collected during 2022–23. The calibrated models were used to simulate water budgets (streamflow, evapotranspiration, water-storage volumes, and water diversions and withdrawals) during 2022–23. Model simulations showed that the resaca watersheds required more diversions from the Rio Grande and released less runoff than did the canal watersheds. Management practices maintaining resaca water levels constrained their runoff.
Introduction
The lower Rio Grande Valley in south Texas consists of Cameron, Hidalgo, Starr, and Willacy Counties and depends on the Rio Grande/Rio Bravo del Norte (hereinafter referred to as the “Rio Grande”) for municipal and irrigation water supply (Baker and Dale, 1964). In addition to the Rio Grande, connected water resources including Amistad Reservoir and Falcon Reservoir are vital to the lower Rio Grande Valley (fig. 1); all of these water resources are shared by the United States and Mexico and managed by the International Boundary and Water Commission and the Texas Commission on Environmental Quality Rio Grande Watermaster (Texas Commission on Environmental Quality, 2025). Most of the inflows to the Rio Grande in Texas are from Mexico (Ewing and Gonzalez, 2016). Treaty agreements between Mexico and the United States establish how these waters are shared (International Boundary and Water Commission, 2025).
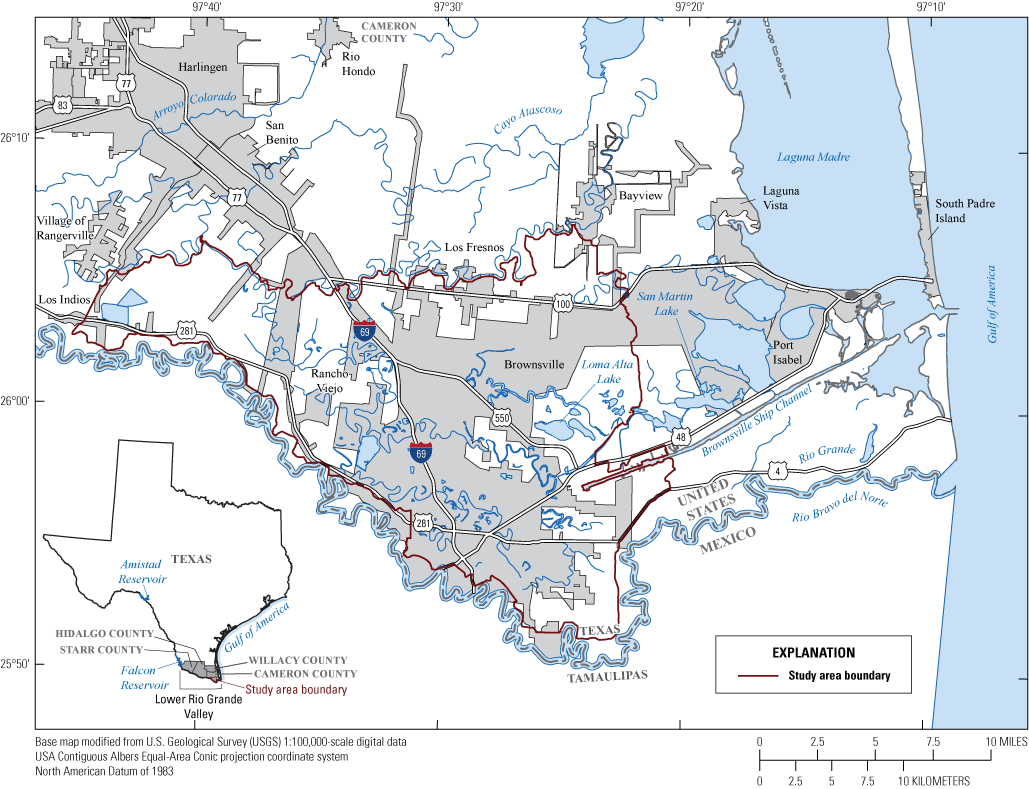
The study area in Cameron County, Texas.
According to the 2021 Rio Grande regional water plan (Black and Veatch Corporation, 2020), the region that includes the eight most downstream Texas counties along the Rio Grande is projected to increase in population from about 2 million to more than 4 million people between 2020 and 2070. Including the Mexico population in this region, the total 2070 population could grow to about 20 million people, exerting enormous demands on the available water resources (Black and Veatch Corporation, 2020). The monitoring and understanding of water use and water budgets for the region can provide crucial information for water-resource managers (Healy and others, 2007).
The effective management of water resources in the region is complex because of several interconnected factors. First, 27 irrigation districts operate in the lower Rio Grande Valley, including two districts operating within the watersheds studied in this report (Knight, 2009). Irrigation can alter the natural water balance and the natural streamflows in the watersheds. Within Brownsville, Tex., there are approximately 70 river miles of resacas, historical Rio Grande distributary channels that formed from a few hundred to more than 10,000 years ago during periods of high streamflow—long before large dams were built on the Rio Grande (Texas Highways, 2025) (fig. 1). Because of anthropogenic changes to the drainage system such as the construction of small dams and dikes, none of the resacas currently have a natural hydrologic connection with the Rio Grande (University of Texas Rio Grande Valley, Texas Water Resources Institute, Texas Commission on Environmental Quality, and Texas Institute for Applied Environmental Research, 2019). As a result, water in the resacas is supplied by diversions from the Rio Grande and direct contributions from local precipitation and runoff. Resacas are a unique part of the landscape in the study area, providing critical aquatic and riparian habitat in urban, suburban, and rural areas. As virtually the sole type of freshwater wetland in the region besides the small linear riparian zone along the banks of the Rio Grande, resacas support a variety of native flora; provide water, food, and shelter for diverse fauna including migratory avian species; and sustain several native fish and amphibian species (University of Texas Rio Grande Valley, Texas Water Resources Institute, Texas Commission on Environmental Quality, and Texas Institute for Applied Environmental Research, 2019). The resacas also provide stormwater retention and irrigation-water storage and are used for recreational activities such as fishing, kayaking, and birding. The flow of water through resacas is regulated by a man-made system of pumps and control structures, contributing to the complexity of water-resource management in the area (Texas State Historical Association, 2023).
In 2021, the U.S. Geological Survey (USGS) began a cooperative study with the City of Brownsville to establish a network of streamgages to help understand the complex hydrologic system of the Cameron County (greater Brownsville, Tex.) area (fig. 1). This network was designed to provide near real-time data to (1) support management of water allocations for municipal, industrial, and irrigation uses and (2) enhance public safety by monitoring and managing flooding and drainage. As part of the cooperative study with the City of Brownsville, the USGS also developed hydrologic models of selected watersheds in Cameron County during 2022–23. The models can be used by water-resource managers to develop an understanding of hydrologic processes and help provide a foundation for effective water-resource and environmental planning and management.
Purpose and Scope
This report describes hydrologic models developed by the USGS in cooperation with the City of Brownsville to simulate water budgets (streamflow, evapotranspiration [ET], water-storage volumes, and water diversions and withdrawals) for the nine watersheds in Cameron County, Tex., that routinely contribute runoff to the resacas and other receiving waters in the study area. The models were used to simulate water-budget quantities during January 2022–December 2023. The emphases of the water-budget simulations were (1) to estimate freshwater deliveries from the study area watersheds to the receiving waters of San Martin Lake, the Brownsville Ship Channel, and the Rio Grande and (2) to estimate Rio Grande water diversions to resacas in the study area. This report includes a description of the functionality of the models and the input data, followed by descriptions of the configuration and calibration of the models. Limitations of the models and the model-simulated estimates of the water-budget quantities are also discussed. Simulated estimates of annual outflows of streamflow and diversion inflows for the study area are presented.
Description of the Study Area
The study area consists of 11 selected watersheds (figs. 1 and 2; table 1) in Cameron County, Tex., and includes all of the area that drains to the lower Laguna Madre by way of San Martin Lake and the Brownsville Ship Channel; however, only 9 of the 11 selected watersheds routinely contribute runoff. Most of the study area is in Brownsville, which is the largest city in Cameron County (fig. 1) and had a 2023 population of about 190,000 people (U.S. Census Bureau, 2024).
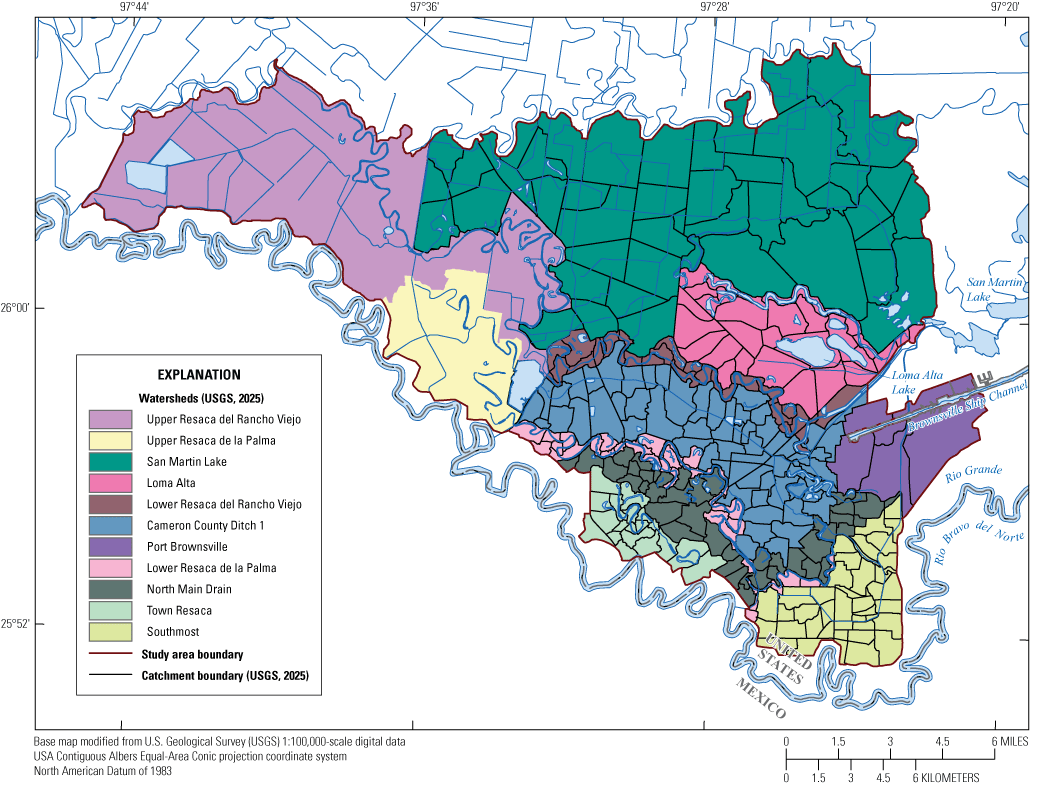
Watersheds and modeling catchments within the Cameron County, Texas, study area.
Table 1.
Characteristics of selected watersheds in Cameron County, Texas, 2022–23.[Data from Ockerman and Choi (2026). --, not applicable]
The climate of the study area is characterized as subtropical subhumid, with hot summers and mild, relatively dry winters (Larkin and Bomar, 1983). The mean monthly temperature ranges from 62.8 degrees Fahrenheit (°F) in January to 87.0 °F in August (National Centers for Environmental Information [NCEI], 2024b). Based on precipitation data collected during 1991–2020, the mean annual precipitation is 25.7 inches (in.), and September is typically the wettest month of the year, with a mean precipitation of 5.73 in. (NCEI, 2024a). In 2022 and 2023, the annual precipitation was 26.18 and 22.15 in., respectively. During 2022–23, daily precipitation exceeded 0.01 in. on 152 days (total number of days from both years) (National Weather Service [NWS], 2024a). The mean interval between daily precipitation amounts equal to or greater than 1.0 in. is about 48 days (Asquith and Roussel, 2004). Although most precipitation occurs in spring, early summer, and fall, amounts greater than 1.0 in. can occur anytime during the year (Larkin and Bomar, 1983). The greatest daily precipitation total during the 2022–23 study period was 4.61 in. on September 20, 2022 (NWS, 2024a).
Tropical storms are relatively frequent in the study area and can generate large amounts of precipitation and extreme storm-tide surge. Hurricane season lasts from June through November, but most tropical storms make landfall or indirectly affect the study area between August and October (NWS, 2024b). The annual mean number of tropical storms is 0.8 (about eight tropical storms every 10 years), and the frequency of occurrence along any 50-mile segment of the Texas coast is one storm about every 6 years (Roth, 2010). During 2022–23, the study area was not subject to tropical storm activity.
The 11 watersheds that compose the study area total about 138,000 acres (about 217 square miles) (fig. 2; table 1). Six of the watersheds are drained mostly by man-made irrigation canals, and five of the watersheds are drained by resacas. The study area includes three major resaca systems: Town Resaca, the upper and lower Resaca de la Palma (also referred to locally as “Resaca de la Guerra”), and the upper and lower Resaca del Rancho Viejo (fig. 2). These systems are intersected and subdivided by roads, railroads, irrigation canals, drainage ditches, and hydraulic control structures (gates and weirs); as a result, the resacas are segmented into a system of individual stream reaches that resemble narrow, linear lakes, ponds, or pools (University of Texas Rio Grande Valley, Texas Water Resources Institute, Texas Commission on Environmental Quality, and Texas Institute for Applied Environmental Research, 2019). The amount of standing or flowing water in these individual waterbodies varies depending on recent precipitation, inflows diverted from the Rio Grande, and hydraulic control structures throughout the resaca network.
In the upper Resaca del Rancho Viejo and upper Resaca de la Palma watersheds (fig. 2), most resaca segments are not sustained by diversions from the Rio Grande and typically resemble marshes or ephemeral lakes. These areas provide for water storage as intermittent pools. The upper Resaca del Rancho Viejo and upper Resaca de la Palma watersheds generally do not contribute runoff in the study area except during or after extreme precipitation events. These upstream watersheds are not included in the watershed model simulations. The resaca segments in the downstream, more developed part of study area remain filled with water by diversions and pumping from the Rio Grande.
The topography of the study area (fig. 3) is relatively flat, with land-surface elevations ranging from approximately 110 feet (ft) above the North American Vertical Datum of 1988 (NAVD 88) in the inland areas to about 10 ft above NAVD 88 closer to the coast (USGS, 2018). Drainage of the study area is eastward towards San Martin Lake and the Brownsville Ship Channel (fig. 1) (University of Texas Rio Grande Valley, Texas Water Resources Institute, Texas Commission on Environmental Quality, and Texas Institute for Applied Environmental Research, 2019). A levee system forms the drainage boundary between the Rio Grande and the study area. Although the Rio Grande is not considered part of the study area (fig. 1), the Rio Grande is the source of the water that is diverted to the study area resacas. Also, some runoff and treated wastewater from the study area are diverted to the Rio Grande. Drainage to the north of the study area flows to the Arroyo Colorado Basin and eventually to the Laguna Madre (fig. 1). The area to the east of the study area consists of low-lying tidal flats and marshes that drain, by way of tidal lakes and marshes, to San Martin Lake and the Brownsville Ship Channel.
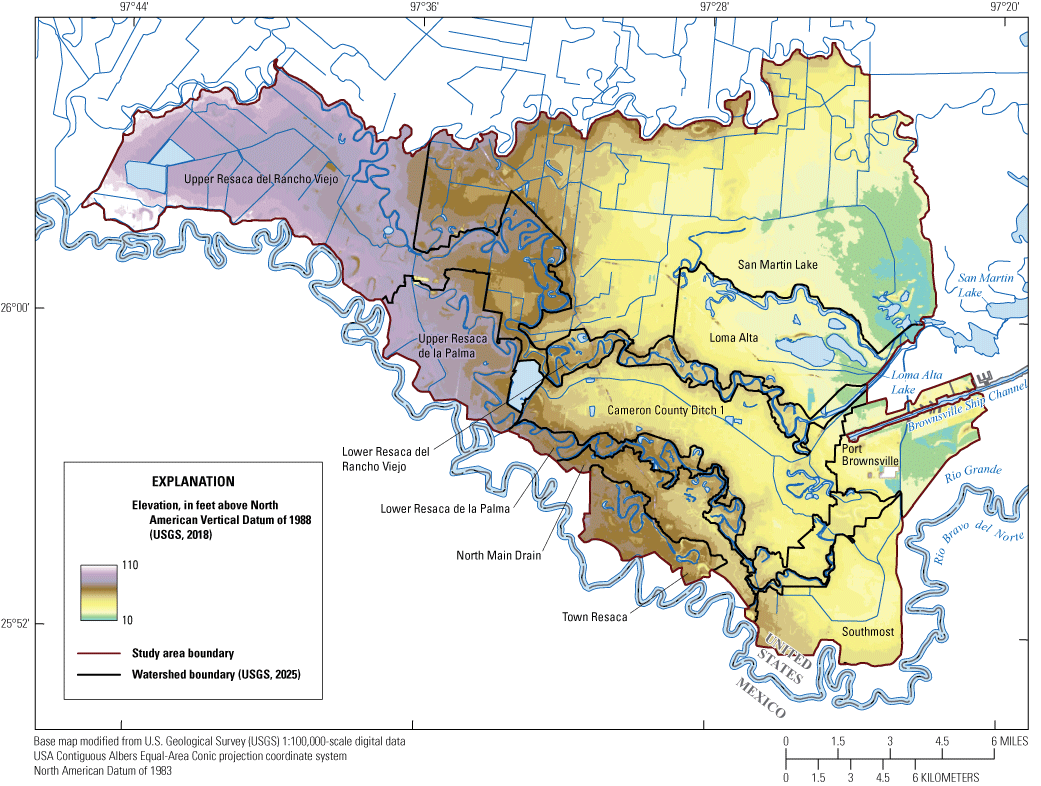
Topography of the selected watersheds in Cameron County, Texas.
The resaca watersheds (where the watersheds drain to resacas) are elevated relative to the canal watersheds (where the watersheds drain to canals) (fig. 3). The alteration of natural floodflows in the Rio Grande from the construction of dams and artificial levees, along with intensive water withdrawals, has contributed to diminished floodflows into these ancient systems. Even before flood control measures on the Rio Grande, these resaca distributary systems, over time, naturally became hydraulically disconnected from their source river through the development of natural levees (Ewing and Gonzalez, 2016). As a further consequence, Town Resaca, lower Resaca del Rancho Viejo, and lower Resaca de la Palma have small drainage areas compared with the adjacent and intervening canal-drained watersheds.
Most of the municipal water supply for the greater Brownsville area is supported by the Rio Grande and the Amistad Reservoir-Falcon Reservoir system (Black and Veatch Corporation, 2020). A supplemental groundwater treatment plant was completed in 2004 as an alternative source of municipal water supply. The plant’s initial (2004) capacity of 7.5 million gallons per day (Mgal/d) was increased to 10 Mgal/d in 2015 (Southmost Regional Water Authority, 2023).
Within the study area, two irrigation districts (Brownsville Irrigation District and Cameron County Irrigation District Number 6) operate infrastructure to deliver water for irrigation. Irrigation district infrastructure (pumps and canals) and water-management operations are independent of the normal drainage and water management of the canal and resaca network that is the subject of this modeling study and report.
Water-Budget Simulations of Cameron County Study Area Watersheds
To simulate streamflow, water storage, ET, and other water-budget components for the study area watersheds, a continuous simulation watershed model was used that could account for all of the water-budget components and processes. The Hydrological Simulation Program—FORTRAN (HSPF), version 12.5 (U.S. Environmental Protection Agency [EPA], 2024a), was selected for modeling the study area watersheds because it was one of the most comprehensive watershed models available and can accurately simulate a wide variety of stream and watershed conditions (Donigian and others, 1995). HSPF has been used to simulate streamflow and river system water budgets and estimate groundwater recharge to aquifers in south-central Texas (Pedraza and Ockerman, 2012).
Functional Description of Hydrological Simulation Program—FORTRAN
The HSPF model software is distributed as part of the Better Assessment Science Integrating Point and Nonpoint Sources (BASINS) system (EPA, 2025). BASINS 4.5 was developed by the EPA (2024b) to support watershed management. BASINS serves as an umbrella-like software package, interfacing with pertinent geodatabases, ancillary datasets, and software programs to facilitate user interaction with HSPF and to help the user understand the hydrological characteristics of a watershed. The HSPF model is one of the primary surface-water modeling components of BASINS. HSPF is an integrated basin-scale model that combines watershed processes with in-stream fate and transport in one-dimensional characterizations of stream channels. The HSPF user’s manual (Bicknell and others, 2001) provides model documentation and underlying model theory. Model parameterization guidance is available in the technical notes provided for the HSPF model (EPA, 2000).
The HSPF model uses a continuous (hourly time step for this study), semilumped-parameter design (Donigian and others, 1995) that can provide continuous water and mass balance by tracking precipitation and streamflow through the conceptual pathways of the hydrologic cycle in a watershed. In HSPF, a watershed is represented by a group of hydrologically distinct areas referred to as “hydrologic response units” (HRUs) that drain to a stream segment, lake, or reservoir; in HSPF, a stream segment, lake, or reservoir is referred to as a “reach reservoir” (RCHRES). The distinct hydrologic characteristics of each HRU are determined on the basis of land use, surficial geography, soil characteristics, and other factors that are deemed to produce similar hydrologic responses to precipitation and potential ET. HRUs are categorized as impervious or pervious land segments, termed impervious land (IMPLND) or pervious land (PERLND), respectively. IMPLND was represented conceptually within HSPF by a surface storage zone, subject to evaporation and runoff processes. PERLND was represented by three interconnected water-storage zones—an upper zone, a lower zone, and a groundwater zone. Each RCHRES was associated with a particular watershed subdivision, referred to as a “catchment,” and receives runoff and sediment from the IMPLNDs and PERLNDs in the catchment. The hydraulics of a RCHRES are simulated by a storage routing method (Donigian and others, 1995).
Figure 4 is a flowchart of HSPF hydrologic processes for IMPLNDs and PERLNDs. The conceptualized movement of overland flow, storage, and evaporation from IMPLNDs is depicted in figure 4A. Overland flow and movement of water through the upper, lower, and groundwater zones of PERLNDs are depicted in figure 4B. The movement of water from IMPLNDs and PERLNDs and between storage zones was controlled by various process-related parameters. Although some parameters are directly measurable, most are determined during model calibration (Martin and others, 2001). The definitions of selected HSPF model process parameters used in the study area are listed in table 2. Complete descriptions of the computational processes and required input model parameters are provided in the HSPF user’s manual (Bicknell and others, 2001).
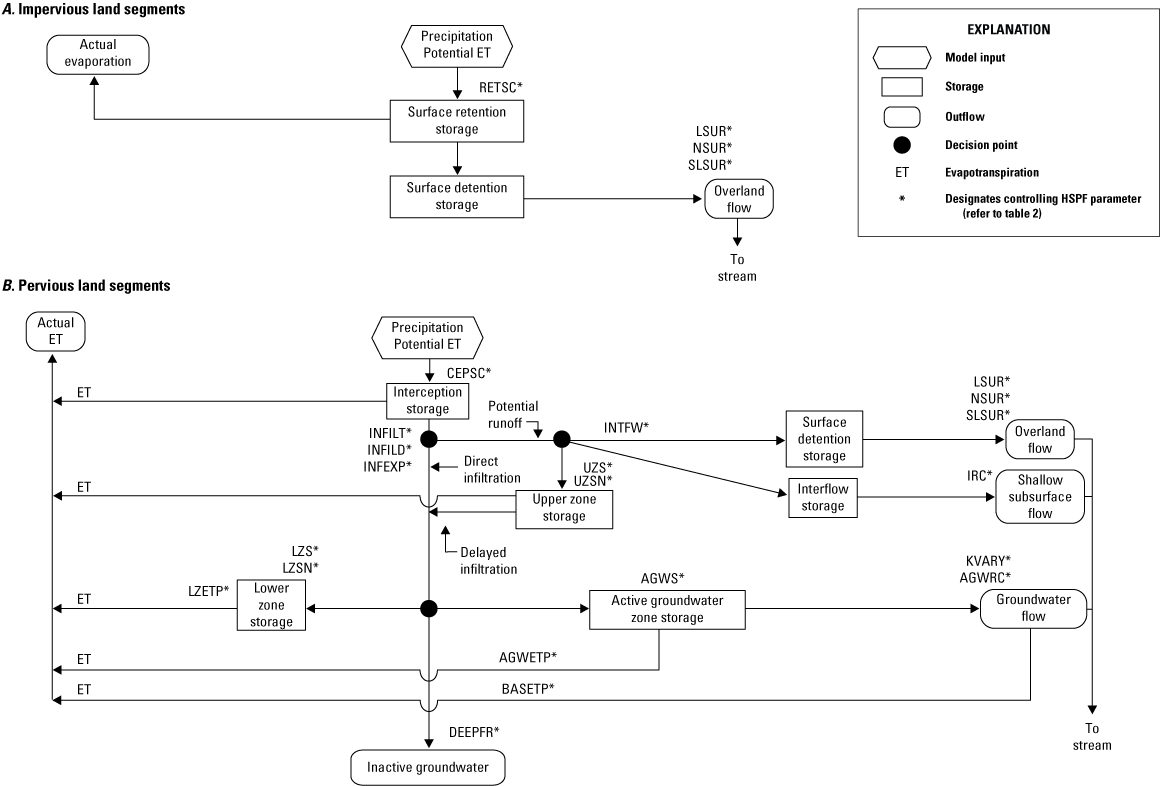
Hydrological Simulation Program—FORTRAN (HSPF) flowchart for hydrologic processes for A, impervious (IMPLND) and B, pervious (PERLND) land segments (modified from fig. 3 in Wicklein and Schiffer [2002]).
Table 2.
Process-related parameters for the Hydrological Simulation Program—FORTRAN (HSPF) models of selected watersheds in Cameron County, Texas, 2022–23.[Data from Bicknell and others (2001). PERLND, pervious land; IMPLND, impervious land]
The user’s manual for the Hydrological Simulation Program—FORTRAN (Bicknell and others, 2001) provides a detailed description of each parameter.
Unsteady overland flow was routed by using a modified kinematic-wave method (EPA, 2000). The Manning’s and continuity equations (Bicknell and others, 2001) were used with mean overland-flow plane length, slope, and roughness estimates to continuously (at each hourly time step) calculate surface detention storage, from which the overland-flow rate was calculated.
The potential infiltration rate of PERLNDs was computed as an empirical function of soil moisture (fig. 4B). Actual infiltration was calculated from the precipitation excess remaining after subtracting interception losses from precipitation. Precipitation excess was available for surface detention, infiltration, or runoff. Infiltrated moisture can move to three subsurface storage zones—upper zone storage, lower zone storage, and active groundwater storage—or it could be lost as inactive groundwater. The upper zone storage includes storage in surface depressions, surface vegetation, ground litter, and the shallow root zone in the upper few inches of soil. Moisture may leave the surface detention/upper zone storage by ET, overland flow, interflow (shallow subsurface runoff), or percolation to the lower zone. The lower zone storage extends a few feet to the depth of deep-rooted vegetation, which evapotranspires a portion of the moisture stored there. Active groundwater storage sustains base flows in streams during periods of no precipitation. Inactive, or deep, groundwater storage (recharge) does not flow to the stream and was considered lost from the system. No base flow was expected in the study area, as the resaca and canal systems are separated from the Rio Grande. All of the streamflow in the resacas and canals is from diversions from the Rio Grande or from precipitation runoff.
IMPLND was represented by surface storage, evaporation, and overland flow processes (fig. 4A). In an HSPF simulation, water is moved through this network of HRUs and RCHRES drainage areas for each time step specified in the model while conserving water mass—that is, inflow equals outflow plus or minus any change in storage. The processes of surface detention, evaporation, and overland flow on impervious surfaces are modeled in the IMPLND secondary module IWATER in HSPF by functional relations similar to those used for pervious surfaces.
The water budget for the overall model (as well as for individual HRUs and RCHRES drainage areas) can be stated as follows:
where (all units are in inches)P
is precipitation (may also include irrigation or other special applications);
Qin and Qout
are waterflow into and out of the model, respectively;
ET
is evapotranspiration; and
ΔS
is change in water storage.
Individual components can be broken down into subcomponents (for example, waterflow from an HRU [Qout] is the sum of surface-water flow and interflow). A simplified water-budget equation for the overall model to incorporate these subcomponents results in the following equation with an assumption that the change in storage over time is minimal:
where (all units are in inches)P
is precipitation (may also include irrigation or other special applications);
Qin sw
is surface-water flow from upstream and other surface-water discharges (such as wastewater treatment plants [WWTPs]);
Qin gw
is groundwater discharge to streams (such as springflow);
ET sw
is ET from the surface water;
ET uz
is ET from the unsaturated zone (upper zone, fig. 4);
ET gw
is ET from the active groundwater zone (lower zone, fig. 4);
Qout sw
is surface-water flow out of the model as runoff and withdrawals; and
R
is groundwater recharge (recharge is defined as including any infiltrating water that becomes inactive groundwater, fig. 4).
While maintaining the overall water balance, the model is used to continuously (at each time step) simulate the interaction among subcomponents of the water-budget equation and variations of these subcomponents over time. A conceptualization of the complex hydrologic processes included in the model is depicted in figure 4. The hydrologic processes are described by empirical equations in the model code. Model parameters used in the empirical equations (table 2) are estimated and then adjusted during the calibration of the model (Donigian and others, 1995). Watershed characteristics and typical values and ranges of model parameters (Donigian and others, 1984; EPA, 2000) were used to develop initial (uncalibrated) values for the model parameters.
Model Development
First, the watershed models were configured to represent the hydrologic characteristics of the study area. Then, time-series input data were compiled that were necessary for model calibration and simulations. The models were calibrated so that the models accurately simulated available measured hydrologic data. Limitations in the model configuration and calibration processes were identified. Finally, the model files were documented and archived.
Model Configuration
The model configuration process included delineation of model watersheds, catchments (watershed subdivisions), and stream networks. The study area was delineated into 11 watersheds (fig. 2; table 1) because of the relatively large study area and the major differences in the hydrologic responses of the watersheds. For example, the hydrologic responses of watersheds that are drained by canals are very different from the hydrologic responses of watersheds that include resaca networks, which are typically highly managed through storage of water diverted from the Rio Grande into the resacas. Each watershed except for the upper Resaca del Rancho Viejo and upper Resaca de la Palma watersheds (which were not modeled because they are generally noncontributing) had a separate HSPF model, but some of the models were linked so that model outputs from upstream watersheds provide model inputs for downstream watersheds.
The nine modeled study area watersheds were divided into catchments (table 1). Each catchment represents a modeled stream (resaca or canal) segment and its associated drainage area. The National Hydrography Dataset Plus (NHDPlus) (ver. 2) dataset (EPA, 2012) was used as the foundation for the initial delineation of catchments and stream segments for the nine modeled study area watersheds.
The NHDPlus catchment delineation of the study area initially provided a set of 235 catchments with a mean drainage area of approximately 440 acres. This original set of catchments was further subdivided to produce a more detailed delineation consisting of 307 catchments with a mean drainage area of 337 acres (fig. 2; table 1). The refinement of the NHDPlus catchment delineation was used to (1) define stream reaches with streamflows such that traveltimes through RCHRES more closely approximate the hourly model simulation time step and (2) locate outlets of RCHRES at strategic points such as control structures, streamgages, tributary confluences, and diversion locations. Given the difficulty of using automated techniques for determining catchment boundaries in flat terrain (Al-Muqdadi and Merkel, 2011), refined catchment boundaries were determined with the aid of topographic maps, digital elevation models, and geographic information system (GIS) editing tools. Given the relatively flat topography of the study area (fig. 3), the catchment boundaries may not be exact, but are considered reasonable approximations of catchment configurations within the watersheds and can more accurately characterize timing of runoff and flow routing for the development of the hydrologic models. Also, because HSPF is a semilumped-parameter model (in contrast to a distributed, or grid-based, model) (Maskey, 2022), catchment-scale boundaries are not defined within the model (Brirhet and Benaabidate, 2016). The uncertainty in the accuracy of catchment boundaries was therefore not considered a limitation regarding model representation of the watershed and catchment configuration. Catchment sizes varied within and between watersheds and were mainly dependent on the original resolution of the NHDPlus catchments delineation. For example, the San Martin Lake watershed mean model catchment area is 1,060 acres compared with the Cameron County Ditch 1 watershed mean model catchment area of 233 acres (table 1). Spatial files of the watershed and catchment boundaries are available in Ockerman and Choi (2026).
Using GIS analysis, each catchment was further subdivided into HRUs on the basis of impervious land cover and soil characteristics. Impervious land cover for the study area was determined from the 2019 National Land Cover Database (NLCD) (Multi-Resolution Land Characteristics Consortium [MRLC], 2019). NLCD impervious land cover data represent urban impervious surfaces as a percentage of developed areas for each 30- by 30-meter grid cell in the United States (Dewitz, 2021). The acreage of impervious area within each catchment was represented in the HSPF models as IMPLND HRUs. As shown in figure 5, the more developed (and highly impervious) urban parts of Brownsville are surrounded by relatively large areas of undeveloped and agricultural land with very low imperviousness. Pervious areas are represented in the HSPF models as PERLND HRUs. PERLND HRUs were further characterized according to soil characteristics. Soils data from the U.S. Department of Agriculture [USDA] Web Soil Survey (USDA, 2022, 2023) were downloaded in shapefile format and analyzed within an ArcGIS application (version 10.8.2) (Esri, 2023). Various soil associations (USDA, 2022, 2023) within the study area were grouped and categorized into five general soil types (table 3; fig. 6). The five general soil types were used to characterize the soils in the study area according to their hydrologic response to infiltration, runoff, and ET (USDA, 1977). All soil types represent level to gently sloping terrain. The pervious acreages of each soil type within each model catchment were determined by using ArcGIS in order to define PERLND HRUs. Soil characteristics were used to guide initial estimates for selected HSPF PERLND process-related parameter values.
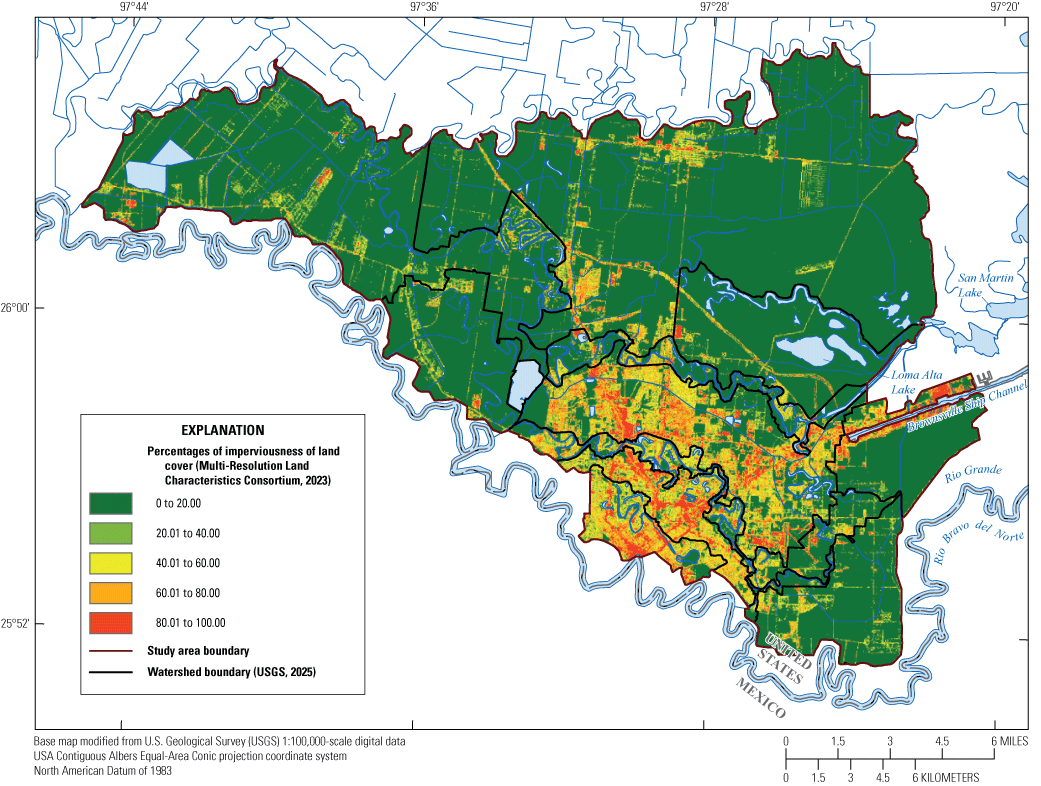
Percentages of imperviousness of land cover for selected watersheds in Cameron County, Texas.
Table 3.
Soil types and characteristics for selected watersheds in Cameron County, Texas.[Data from U.S. Department of Agriculture (1977, 2022, 2023)]
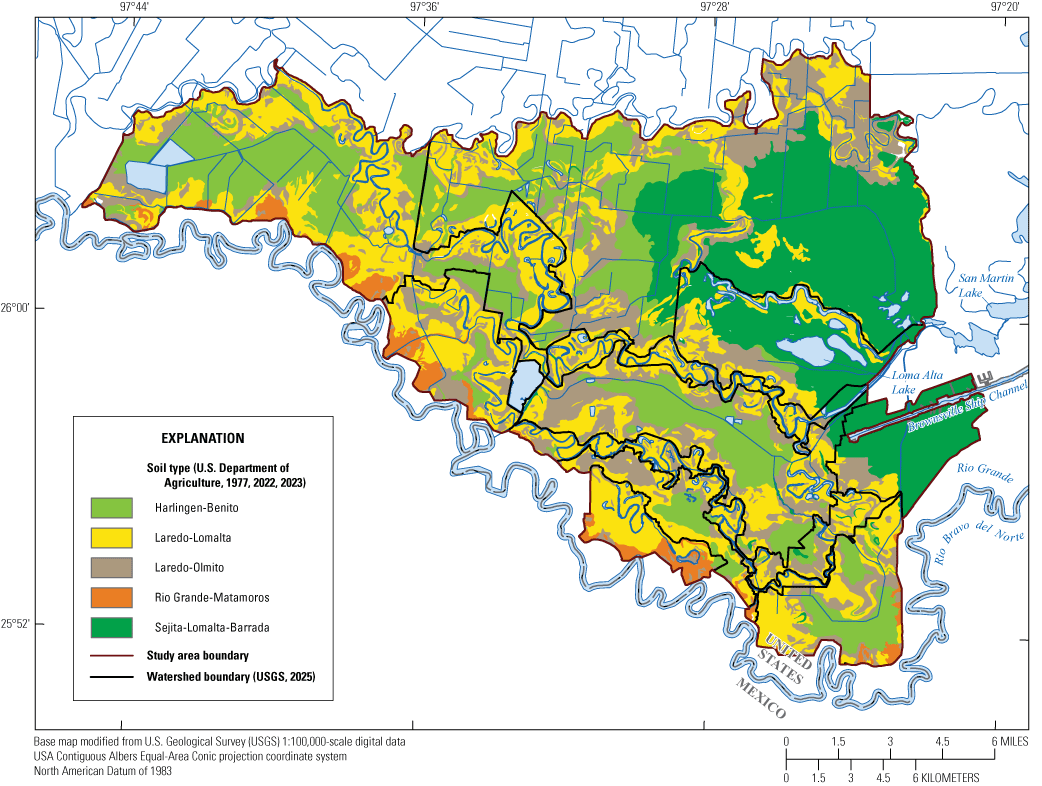
Soil types in selected watersheds in Cameron County, Texas.
In HSPF, “stream channel characteristics” for the RCHRES for a given canal or resaca segment are defined in function tables (FTABLES). FTABLES define the relation among surface area, volume, depth, and outflow for each RCHRES. Outflow from a RCHRES was simulated as a function of reach volume or water-surface elevation. Outflow from a RCHRES can also be simulated from a time-series output, which represents, for example, a municipal or agricultural withdrawal or a runoff diversion. Because the canals were mostly dry in 2018, channel geometry properties for canal RCHRES segments were determined from 2018 south Texas light detection and ranging (lidar) data available from the USGS (2018). For selected resaca RCHRES segments, channel geometry data were derived from available bathymetric surveys completed for 10 resacas (Ockerman, 2024). For 79 resaca RCHRES segments without available bathymetric data, FTABLES were scaled from nearby resaca FTABLES that utilized surveyed bathymetric data based on the ratio of unsurveyed to surveyed resaca surface areas.
Model Time-Series Data
The development of the HSPF models for the study area required compilation of time-series data that were used for model input and calibration. These time-series data included meteorological, streamflow, and diversion data. Meteorological time-series data (precipitation, water-surface evaporation, and land potential ET) were used as model inputs. Streamflow data (water-surface elevation and discharge) were compared with simulated outputs during the calibration of model process-related parameters. Reported diversions from WWTPs were used to quantify water-quantity inputs to appropriate RCHRES segments.
Meteorological and Streamflow Data
Figure 7 shows the locations of the meteorological station and streamgages that provided time-series data used for model input and calibration. Table 4 lists station identification, location, type(s) of data, and period of record of each station used for model input and calibration.
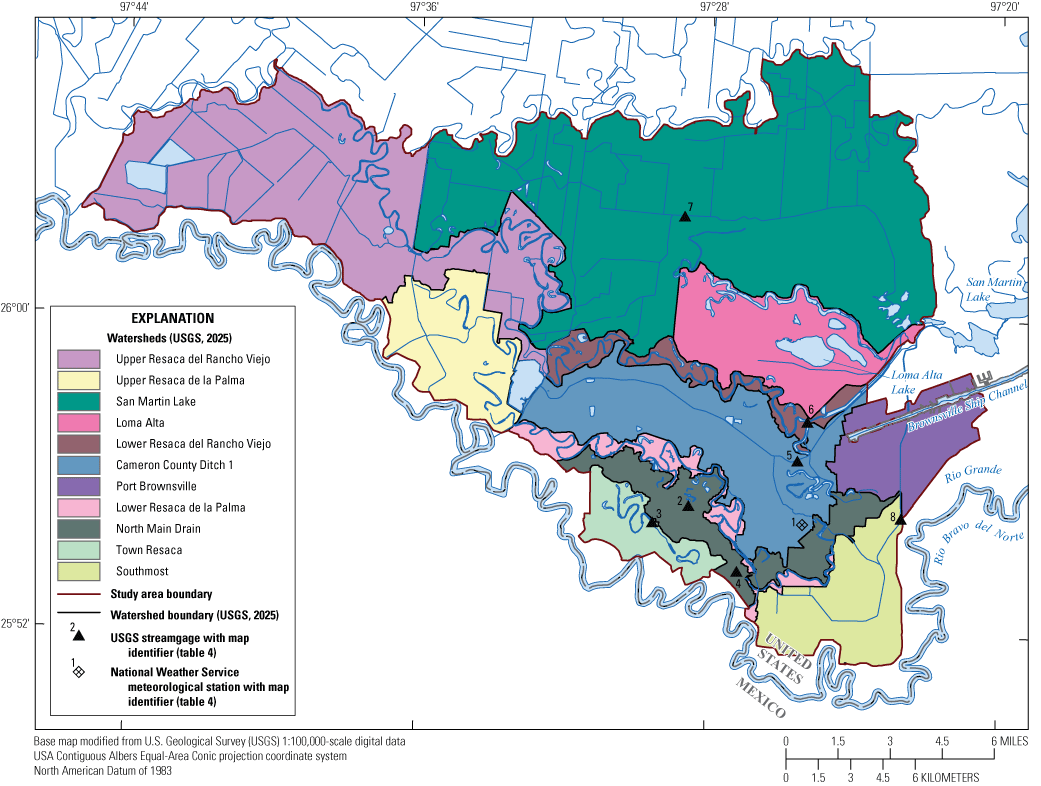
Locations of the National Weather Service meteorological station and U.S. Geological Survey streamgages that provided time-series data used as input for calibration and simulations of the study area hydrologic models, Cameron County, Texas.
Table 4.
Description of the National Weather Service meteorological station and U.S. Geological Survey streamgages from which data were obtained for the Hydrological Simulation Program—FORTRAN (HSPF) models of selected watersheds in Cameron County, Texas.[Data from National Weather Service (2024a) and U.S. Geological Survey (2025). NWS, National Weather Service; USGS, U.S. Geological Survey; N, north; Hwy, Highway; TX, Texas; E, east; St, Street; Co, County; FM, Farm to Market; nr, near; No, number; SH, State Highway]
| Map identifier (fig. 7) | Station number and name | Latitude (decimal degrees) | Longitude (decimal degrees) | Type of data | Period of record used |
|---|---|---|---|---|---|
| 1 | NWS meteorological station, Brownsville/South Padre Island International Airport, Brownsville, Texas | 25.91459 | −97.42314 | Hourly precipitation and daily maximum and minimum air temperature | January 2022–December 2023 |
| 2 | USGS streamgage 08474095 N Main Drain at Boca Chica Hwy, Brownsville, TX | 25.92161 | −97.47541 | Hourly precipitation | March 2022–December 2023 |
| 3 | USGS streamgage 08474107 Town Resaca at E 6th St, Brownsville, TX | 25.91444 | −97.49188 | Hourly precipitation and water-surface elevation | April 2022–December 2023 |
| 4 | USGS streamgage 08474108 N Main Drain at Manzano St, Brownsville, TX | 25.89403 | −97.45289 | Hourly precipitation and stream discharge | March 2022–December 2023 |
| 5 | USGS streamgage 08474110 Cameron Co Ditch 1 at FM 802, Brownsville, TX | 25.94083 | −97.42569 | Hourly precipitation and stream discharge | February 2022–December 2023 |
| 6 | USGS streamgage 08474115 Resaca del Rancho Viejo, Brownsville, TX | 25.95733 | −97.42150 | Hourly precipitation and water-surface elevation | April 2022–December 2023 |
| 7 | USGS streamgage 08474118 Cameron Co Ditch 2 at FM 1847 nr Los Fresnos, TX | 26.04375 | −97.47886 | Hourly precipitation | January 2022–December 2023 |
| 8 | USGS streamgage 08474300 Old Main Drain No 2 at SH 4, Brownsville, TX | 25.91722 | −97.37783 | Hourly precipitation and stream discharge | April 2022–December 2023 |
Sources of precipitation data used for model input included the Brownsville/South Padre Island International Airport NWS meteorological station and precipitation gages installed as part of the monitoring equipment at seven USGS streamgages in the study area (fig. 7; table 4). NWS hourly precipitation data during 2022–23 were obtained for the Brownsville/South Padre Island International Airport NWS meteorological station from the NCEI (2024a, b). Fifteen-minute USGS precipitation data (USGS, 2025) were aggregated to hourly totals for input to the models (Ockerman and Choi, 2026). Periods of missing USGS data during 2022–23 were filled with data from the Brownsville/South Padre Island International Airport NWS meteorological station. The meteorological station nearest the geographical centroid of each watershed (table 5; fig. 7) was used as the source of precipitation input data to each respective watershed model.
Table 5.
Sources of precipitation data used as inputs for Hydrological Simulation Program—FORTRAN (HSPF) models of selected watersheds in Cameron County, Texas.[Data from U.S. Geological Survey (2025). USGS, U.S. Geological Survey; N, north; Hwy, Highway; TX, Texas; St, Street; Co, County; FM, Farm to Market; nr, near; No, number; SH, State Highway; E, east]
Meteorological time-series data of potential evapotranspiration (PEVT) are used in HSPF models to set the upper limit of actual ET that can be simulated for impervious and pervious land surfaces (IMPLNDs and PERLNDs). PEVT is the maximum ET if there is an unlimited supply of water to satisfy the potential ET rate (Wanielista, 1990). PEVT was computed from maximum and minimum daily air temperature by using the Hamon method (Lu and others, 2005). The source of the air temperature data was the Brownsville/South Padre Island International Airport NWS meteorological station (NCEI, 2024a, b).
Evaporation from canals and resacas was calculated from the input of time series of evaporation data applied to HSPF RCHRES segments. Daily reservoir evaporation estimates for Texas reservoirs were previously developed through a collaboration by the Texas Water Development Board (TWDB), the Texas A&M Engineering Experiment Station, the Desert Research Institute, the U.S. Army Corps of Engineers–Fort Worth District, and the Lower Colorado River Authority. This collaborative effort resulted in simulated estimates of reservoir evaporation that explicitly account for reservoir heat storage (Zhao and Gao, 2019). These data are available for 4- by 4-kilometer grid cells, including estimated evaporation rates for six different depth and surface area scenarios for the canals and resacas in the study area (TWDB, 2024a). The depth-surface area scenario used for the study area was depth equal to 5 ft and surface area equal to 5 acres (volume equal to 25 acre-feet). This scenario was the smallest reservoir volume available from the dataset and reasonably approximates the size of most of the canals and resacas in the study area. These daily evaporation estimates were used for all of the RCHRES segments in the study area watershed models, except for Loma Alta Lake (Loma Alta watershed). Actual daily evaporation estimates for Loma Alta Lake were available through the TWDB (2024b), which provides daily evaporation estimates for selected Texas reservoirs, including Loma Alta Lake.
Wastewater Treatment Plant Diversions
Two major WWTPs in the study area discharged treated effluent to the Cameron County Ditch 1 watershed and the Rio Grande (outside of the study area). During 2022–23, the daily mean discharge of treated effluent to the Cameron County Ditch 1 watershed was about 8.1 Mgal/d (table 6) (EPA, 2024c). During 2022–23, the daily mean discharge of treated effluent to the tidal segment of the Rio Grande was about 7.2 Mgal/d (table 6) (EPA, 2024d). Reported monthly effluent discharge volumes are represented in the watershed models as hourly flow rates (disaggregated from monthly means). Effluent discharge quantities to the Rio Grande are included in calculations of the study area watersheds discharging to receiving watersheds outside of the study area.
Table 6.
Watersheds receiving discharge from major wastewater treatment plants in Cameron County, Texas.[Data from U.S. Environmental Protection Agency (2024c, d)]
Rio Grande Diversions to Study Area Resacas
A major source of the water stored in Town Resaca and the lower reaches of Resaca de la Palma and Resaca del Rancho Viejo comes from diversions from the Rio Grande. Actual data on diversion quantities to each resaca were not available. Therefore, time-series data (monthly estimates) for resaca inflows were adjusted as part of the model calibration for each resaca watershed to obtain a suitable match between measured and simulated resaca water volumes.
Withdrawals for Residential Outdoor Water Use
It is common for residential property owners along resaca shorelines to use small pumps to withdraw resaca water for residential outdoor use, primarily lawn watering. These withdrawals are not metered and individually are likely small compared to other components of the water budget for the resaca network. These residential withdrawals were incorporated into the HSPF models of the resaca watersheds to estimate this water-budget component on a resaca-system scale. Time-series data for residential water use were estimated and applied to each residential area resaca RCHRES as a water withdrawal. Residential outdoor water-use withdrawals were estimated from a study by the TWDB of water use in various communities in Texas (Hermitte and Mace, 2012). Because Brownsville was not included in the TWDB study of residential outdoor water use, Corpus Christi residential water-use estimates during 2004–08 were used; Corpus Christi is the nearest city similar in size and climate to Brownsville. The estimated annual outdoor daily water use (66 gallons per day per household) was converted to a monthly time series by multiplying the annual rate by the ratio of monthly to annual PEVT for the period 2022–23 (the development of PEVT time series is explained in the section “Meteorological and Streamflow Data”). Table 7 lists estimated mean annual withdrawals for residential outdoor water use from selected resacas included in modeling during 2022–23.
Table 7.
Estimated mean annual withdrawals for residential outdoor water use from selected resaca watersheds in Cameron County, Texas, 2022–23.[Withdrawals estimated from data from Hermitte and Mace (2012)]
Model Calibration
The primary goal of the hydrologic model calibration was to adjust model process-related parameters so that model-simulated output values, such as streamflow and water-surface elevation, match measured values at streamgages in the study area. In addition, process-related parameter values were determined so that the simulated hydrologic conditions, such as ET and groundwater recharge rates in the study area, were similar to those reported in the literature. The model calibrations were evaluated by following guidelines by Donigian and others (1984), Lumb and others (1994), EPA (2000), Donigian (2002), Moriasi and others (2007), and Duda and others (2012). These guidelines include comparing measured and simulated results such as mean stream discharges of all days, mean of stream discharges of the greatest 10 percent of days, and mean of stream discharges of the lowest 50 percent of days. Additional model-fit statistics (Kittle and others, 1998) were used to characterize the quality of agreement between the measured and simulated hydrologic conditions. Additional model-fit statistics included (1) coefficient of determination (R2) of the linear regression between measured and simulated daily values (stream discharge or water-surface elevation); (2) Nash-Sutcliffe coefficient of model-fit efficiency (NSE) (Nash and Sutcliffe, 1970); and (3) root mean square error. The R2 values and NSE describe the variation in the dependent (simulated) variables that was explained by the independent (measured) variable. Calibration quality was assessed using the evaluation criteria in table 8.
Table 8.
Evaluation criteria for the Hydrological Simulation Program—FORTRAN (HSPF) model simulation results for selected watersheds in Cameron County, Texas.[Modified from Donigian (2002) and Moriasi and others (2007). ≤, less than or equal to; <, less than; >, greater than; --, not available; ≥, greater than or equal to]
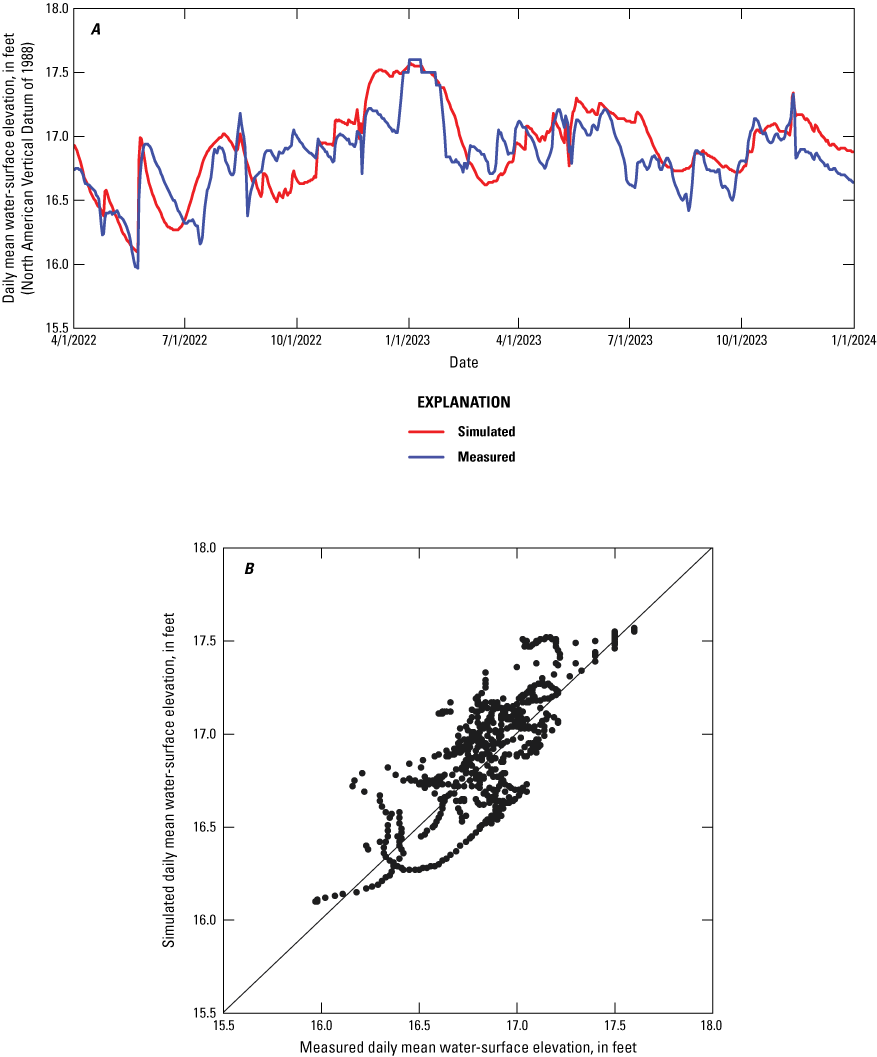
Streamflow calibration data (water-surface elevation and stream discharge) were available from five USGS streamgages (map identifiers 3–6 and 8 in fig. 7 and table 4) located in five of the nine watersheds that routinely contribute runoff to the resacas and other receiving waters in the study area and were included in the model for simulation purposes during 2022–23. Depending on when different streamgages first became operational, streamflow data were available starting in February through April 2022 (table 4). For the streamgages in resaca watersheds (Town Resaca and Resaca del Rancho Viejo, map identifiers 3 and 6 in fig. 7 and table 4), calibration was based on comparison of simulated and measured water-surface elevations (figs. 8 and 9). The calibration performances for simulated water-surface elevations at the Town Resaca and Resaca del Rancho Viejo streamgages were measured using 0.3 ft of absolute difference between simulated and measured water-surface elevations (table 8). This calibration criterion was chosen on the basis of a change in water-surface elevation (and resaca depth) that resulted in a range of approximately 6- to 10-percent change in the resaca water-storage volume. For the streamgages in canal watersheds (4, 5, and 8 in fig. 7 and table 4), calibration was based on comparison of simulated and measured streamflow (flow rate, in cubic feet per second) (figs. 10–12). Calibration results for the five stations (comparison of simulated and measured water-surface elevations or discharge) are shown in table 9. Figures 8–12 show hydrographs and scatterplots comparing simulated and measured water-surface elevation or discharge (streamflow) for the five stations.
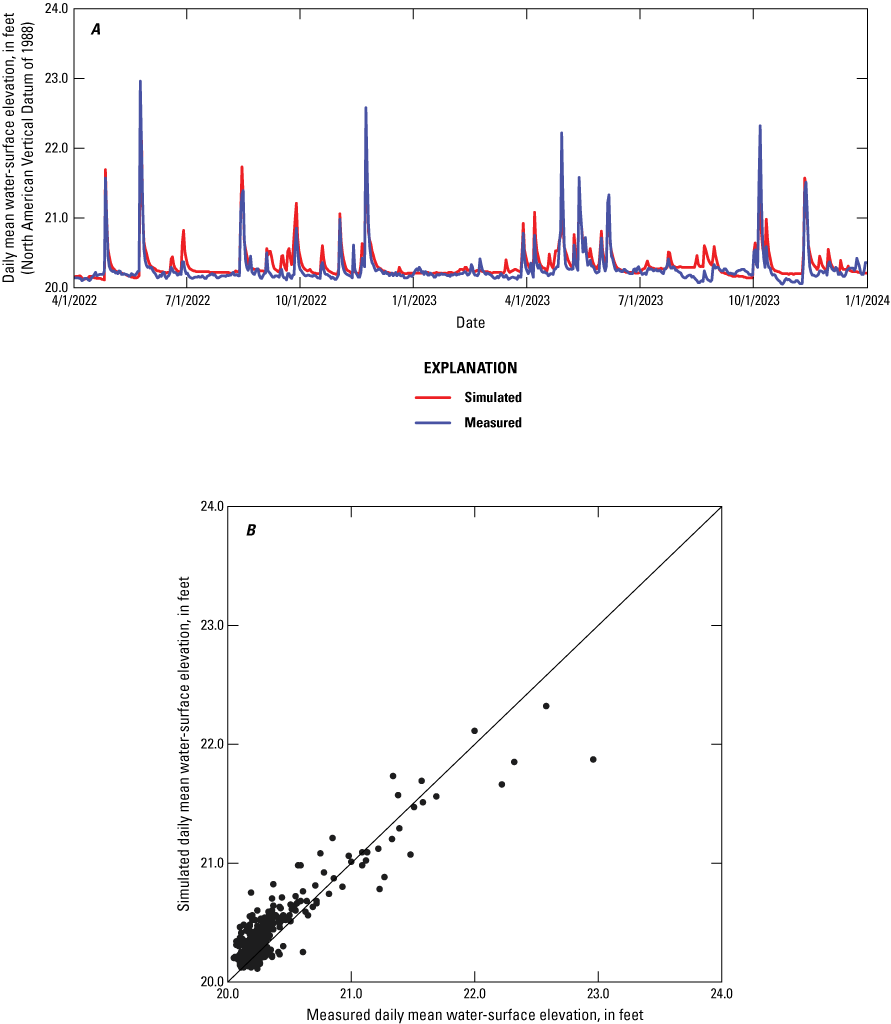
A, Hydrographs and B, scatterplots of measured and simulated daily mean water-surface elevation at U.S. Geological Survey streamgage 08474107 Town Resaca at E. 6th St., Brownsville, Texas, April 2022–December 2023 (data from Ockerman and Choi, 2026).
A, Hydrographs and B, scatterplots of measured and simulated daily mean water-surface elevation at U.S. Geological Survey streamgage 08474115 Resaca del Rancho Viejo, Brownsville, Texas, April 2022–December 2023 (data from Ockerman and Choi, 2026).
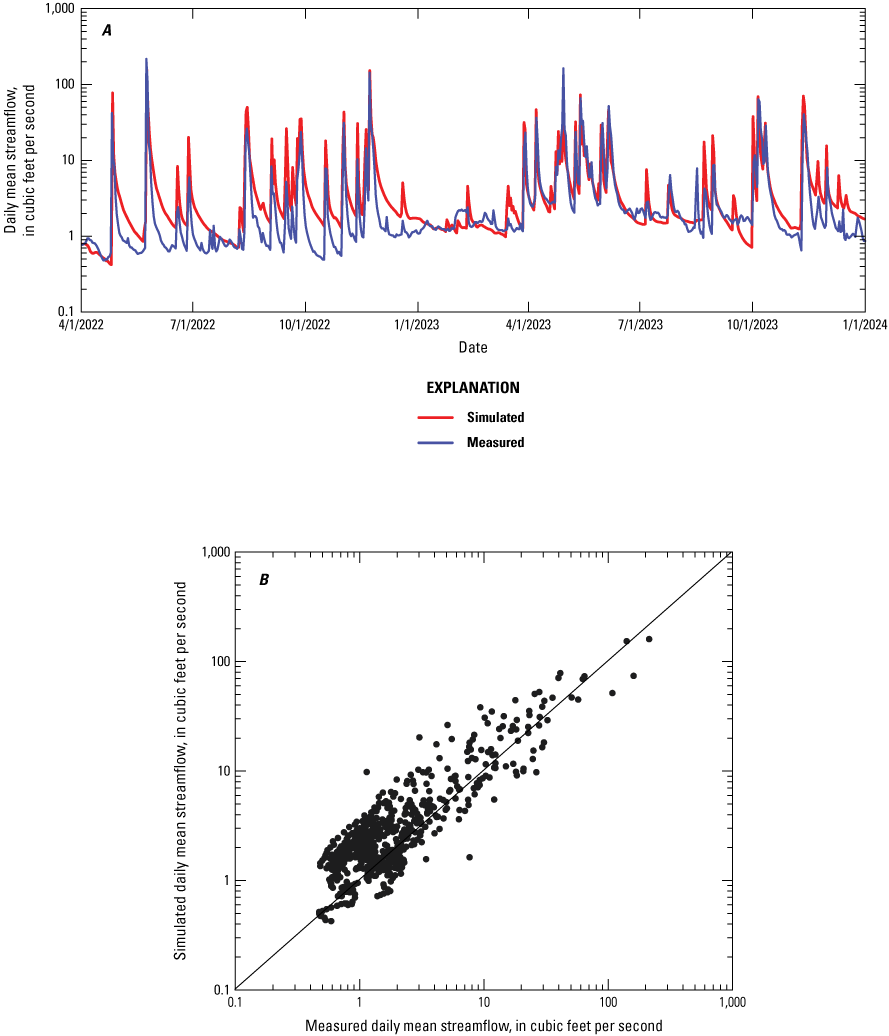
A, Hydrographs and B, scatterplots of measured and simulated daily mean streamflow at U.S. Geological Survey streamgage 08474108 North Main Drain at Manzano St., Brownsville, Texas, April 2022–December 2023 (data from Ockerman and Choi, 2026).
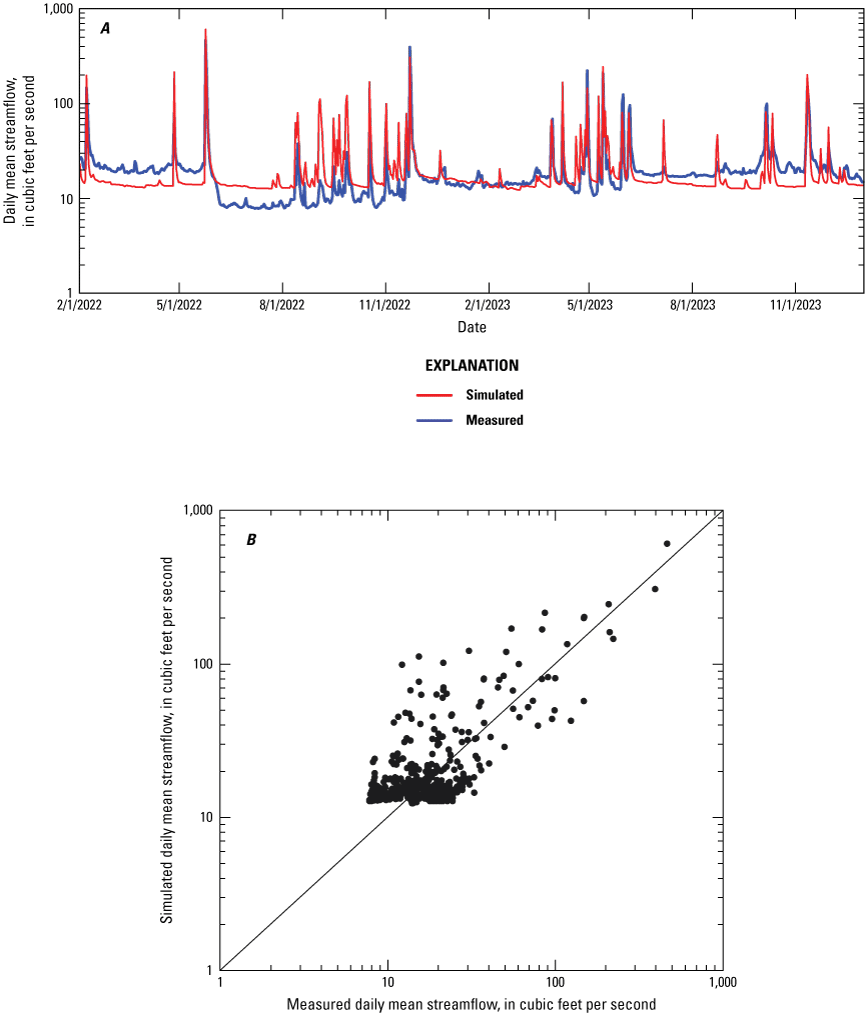
A, Hydrographs and B, scatterplots of measured and simulated daily mean streamflow at U.S. Geological Survey streamgage 08474110 Cameron County Ditch 1 at Farm to Market 802, Brownsville, Texas, February 2022–December 2023 (data from Ockerman and Choi, 2026).
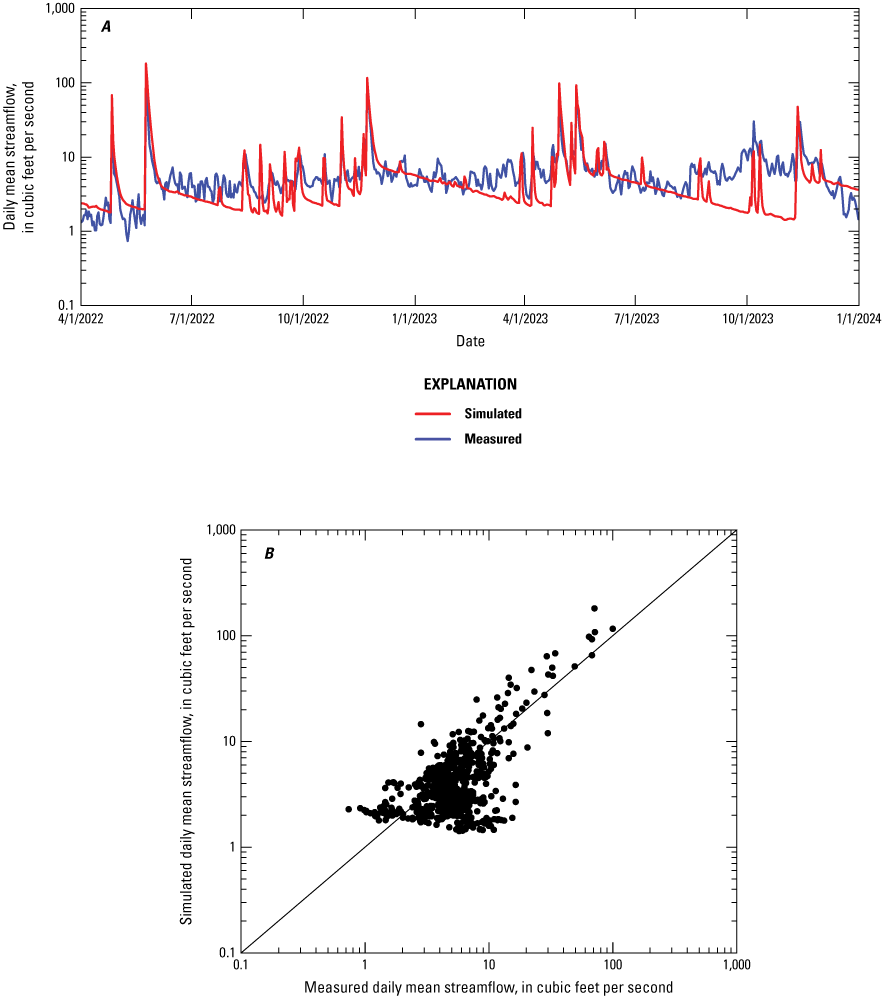
A, Hydrographs and B, scatterplots of measured and simulated daily mean streamflow at U.S. Geological Survey streamgage 08474300 Old Main Drain No. 2 at State Highway 4, Brownsville, Texas, April 2022–December 2023 (data from Ockerman and Choi, 2026).
Table 9.
Calibration results for the Hydrological Simulation Program—FORTRAN (HSPF) models of selected watersheds in Cameron County, Texas.[Data from Ockerman and Choi (2026); calibration data were unavailable for the San Martin Lake, Loma Alta, lower Resaca de la Palma, and Port Brownsville watersheds. USGS, U.S. Geological Survey; --, not applicable; *, the value in absolute difference, coefficient of determination, and Nash-Sutcliffe coefficient of model-fit efficiency is satisfactory according to criteria listed in table 8]
Calibration data were unavailable for the San Martin Lake, Loma Alta, lower Resaca de la Palma, and Port Brownsville watersheds. Simulation of water budgets for these ungaged watersheds was accomplished by using calibrated model hydrology parameters from HRUs in the five gaged watersheds (Cameron County Ditch 1, North Main Drain, Southmost, lower Resaca del Rancho Viejo, and Town Resaca) for the same HRU types in the four ungaged watersheds.
Calibration results for the Town Resaca watershed were considered very good (table 8), considering both the comparison of simulated and measured water-surface elevations and the R2 and NSE model-fit statistics (table 9). Differences between simulated and measured daily water-surface elevations (mean of all days, mean of the highest 10 percent of days, and mean of the lowest 50 percent of days) were within the criterion of 0.3 ft. Model-fit statistics R2 and NSE for simulated daily mean water-surface elevations were 0.84 and 0.76, respectively.
Calibration results for the lower Resaca del Rancho Viejo watershed (table 9) were well within the selected criterion of 0.3-ft difference between simulated and measured water-surface elevations (the absolute difference was 0.06 ft for mean water-surface elevations of all days, 0.13 ft for the mean water-surface elevations of the highest 10 percent of days, and 0.01 ft for the mean water-surface elevations of the lowest 50 percent of days). Other model-fit statistics were fair (table 8) (R2 = 0.61 and NSE = 0.57; table 9). One factor affecting the R2 and NSE statistics was that a substantial part of the streamflow through the Resaca del Rancho Viejo system comes from Rio Grande diversions that are simulated in the model as monthly quantities and divided equally throughout the hourly model time steps. Therefore, the accuracy of the daily water-surface elevation simulation (fig. 9A) was affected by a lack of model input on the actual (hourly or daily) timing of the inflow diversions. Overall, the water-surface elevation simulation is considered satisfactory for water-budget simulations.
Calibration results at USGS streamgage 08474108 North Main Drain at Manzano Street, Brownsville, Tex., for the North Main Drain watershed (table 9) were very good considering the accuracy of daily mean streamflows and other model-fit statistics. The model-fit statistics were considered good (R2 = 0.80 and NSE = 0.74). The difference of the daily mean streamflow of all days was 19.5 percent, which is considered fair. The differences of daily mean streamflows of the highest 10 percent of days and the lowest 50 percent of days were less than 5 percent, which is characterized as a very good result (table 8). Overall, the calibration results at this station are considered good (table 8).
Calibration results at USGS streamgage 08474110 Cameron County Ditch 1 at Farm to Market 802, Brownsville, Tex., for the Cameron County Ditch 1 watershed (table 9) were very good for daily mean streamflow of all days and daily mean streamflow of the lowest 50 percent of days (differences of 4.7 and 7.1 percent, respectively). The results for daily mean streamflow of the highest 10 percent of days were fair (difference of 23.0 percent). Results for other model-fit statistics were good (R2 = 0.76 and NSE = 0.76). Overall, calibration results for the Cameron County Ditch 1 watershed are considered good (table 8).
For the Southmost watershed, calibration results at USGS streamgage 08474300 Old Main Drain No. 2 at State Highway 4, Brownsville, Tex., were considered very good for daily mean streamflow of all days (−8.2 percent difference; table 9). However, the simulated distribution of high and low streamflows was poor. The difference of daily mean streamflow of the highest 10 percent of days at the streamgage was 30.3 percent, and the difference of daily mean streamflow of the lowest 50 percent of days was −32.3 percent. The model-fit statistics R2 and NSE (0.79 and 0.72, respectively) were considered good. Overall, the calibration results for the Southmost watershed are considered fair to good (table 8).
For the five streamgages within the five watersheds that were used for model calibration purposes, simulations of daily mean streamflows or daily mean water-surface elevations were satisfactory (within the range of very good, good, and fair in calibration performance rating, table 8) for all five watershed models. Most of the simulated daily mean water-surface elevation and streamflow values for the highest 10 percent of days and lowest 50 percent of days also were good or very good. Model-fit statistics results for all five watershed models ranged from fair to very good. Calibration results indicate that some of the watershed models (Cameron County Ditch 1 and Southmost) were constrained by the daily mean streamflow accuracy of the highest 10 percent of days and lowest 50 percent of days. However, the overall simulation of stream discharges (streamflow) and water-surface elevations was good to very good for all of the watersheds, indicating that the calibrated watershed models are satisfactory for estimating watershed water budgets.
Sensitivity Analysis
Calibrated values of selected HSPF process-related parameters were further evaluated by a set of sensitivity analyses to better understand the effects that changes (or possible uncertainty) in selected parameter values would have on simulated runoff. The parameters selected for sensitivity analyses were those with the most effect on infiltration, runoff, and ET, which were the index to infiltration capacity of soil (INFILT), the lower zone nominal storage (LZSN), and the upper zone nominal storage (UZSN). Each sensitivity simulation was made by adjusting a single parameter of the model by relatively large amounts (for example, by decreasing the parameter value by 25 percent) while keeping other model parameters unchanged. Three watersheds were selected for the sensitivity analyses on the basis of watershed characteristics. The Cameron County Ditch 1 watershed is a canal-drained watershed with a moderate amount of development (impervious surfaces account for 39 percent of the total cover [MRLC, 2019; fig. 5]). The Town Resaca watershed contains a relatively high amount of development (impervious surfaces account for 53 percent of the total cover). The Southmost watershed is a canal-drained watershed with a relatively low amount of development (impervious surfaces account for 8 percent of the total cover). For each sensitivity analysis, the change in a parameter value was made for all three watersheds for the entire 2022–23 simulation period. Table 10 provides the results of the sensitivity analyses.
Table 10.
Sensitivity of simulated runoff to changes in selected model parameters of the Hydrological Simulation Program—FORTRAN (HSPF) models of the Cameron County Ditch 1, Town Resaca, and Southmost watersheds, Cameron County, Texas, 2022–23.[Data from Ockerman and Choi (2026). INFILT, index to infiltration capacity of soil; LZSN, lower zone nominal storage; UZSN, upper zone nominal storage]
Simulated runoff was relatively insensitive to adjustments of any of the selected parameters—none of the sensitivity simulation scenarios produced changes in runoff greater than 4 percent (table 10). The largest changes in runoff in the sensitivity analyses were caused by increases to LZSN in the Cameron County Ditch 1 and Southmost watersheds (decreases in runoff of 3.0 and 3.4 percent, respectively) and a decrease of UZSN in the Southmost watershed (increase in runoff of 3.7 percent). The Southmost watershed was more sensitive to changes in the parameter values because the three parameters selected for the sensitivity analyses are related to pervious land (PERLNDs) and the Southmost watershed is the least developed watershed in terms of impervious land cover.
Parameter Calibration Values
Given the results of the model calibrations, as well as the relative insensitivity of simulated runoff to changes in the values of selected parameters, calibrated model hydrology parameters from HRUs in the five gaged watersheds (Cameron County Ditch 1, North Main Drain, Southmost, lower Resaca del Rancho Viejo, and Town Resaca) were applied to the same HRU types in the four ungaged watersheds (San Martin Lake, Loma Alta, Port Brownsville, and lower Resaca de la Palma) to perform water-budget simulations for those watersheds. The resulting ranges of parameter values for all nine study area watersheds included in the HSPF model are listed in table 11. Specific values for each watershed are documented in the model user control input (UCI) files for each watershed (Ockerman and Choi, 2026).
Table 11.
Summary of calibrated values for selected hydrology parameters of the Hydrological Simulation Program—FORTRAN (HSPF) models of selected watersheds in Cameron County, Texas, 2022–23.[Data from Ockerman and Choi (2026). PERLND, pervious land; IMPLND, impervious land]
| Parameter | Land cover | Description (units described in table 2) | Value (dimensionless) |
|---|---|---|---|
| AGWETP | PERLND | Fraction of available potential evapotranspiration demand that can be met from stored groundwater | 0 |
| AGWRC | PERLND | Groundwater recession parameter; an index of rate at which groundwater drains from land | 0.99 |
| BASETP | PERLND | Fraction of available potential evapotranspiration demand that can be met from groundwater outflow; simulates evapotranspiration from riparian vegetation | 0 |
| CEPSC | PERLND | Interception storage capacity | 0.05–0.10 |
| DEEPFR | PERLND | Fraction of groundwater that does not discharge to surface within boundaries of the modeled area | 0.03–0.05 |
| INFEXP | PERLND | Infiltration equation exponent; controls rate of infiltration decrease as a function of increasing soil moisture | 2 |
| INFILD | PERLND | Ratio of maximum and mean infiltration capacities | 2 |
| INFILT | PERLND | Index to infiltration capacity of soil; also affects percolation to groundwater zone | 0.10–0.35 |
| INTFW | PERLND | Interflow index; controls amount of infiltrated water that flows as shallow subsurface runoff | 2.0 |
| IRC | PERLND | Interflow recession coefficient; index for rate of shallow subsurface runoff | 0.50–0.60 |
| KVARY | PERLND | Groundwater outflow modifier; index of how much effect recent recharge has on groundwater outflow | 0 |
| LSUR | PERLND or IMPLND | Length of assumed overland-flow plane | 350 or 350 |
| LZETP | PERLND | Lower zone evapotranspiration; index value (ranging from 0 to 0.99) representing the density of deep-rooted vegetation | 0.30–0.70 |
| LZSN | PERLND | Lower zone nominal storage; index to soil moisture holding capacity of unsaturated zone | 2.5–3.8 |
| NSUR | PERLND or IMPLND | Manning’s n roughness coefficient for assumed overland-flow plane | 0.15 or 0.08 |
| RETSC | IMPLND | Impervious retention storage capacity | 0.02 |
| SLSUR | PERLND or IMPLND | Slope of assumed overland-flow plane | 0.005–0.01 or 0.005–0.01 |
| UZSN | PERLND | Upper zone nominal storage; index to amount of surface storage in depressions and the upper few inches of soil | 0.15–0.30 |
Model Limitations
The nine study area watershed models represent a complex hydrologic system described by a set of mathematical equations. Intrinsic to each watershed model is the error and uncertainty associated with the approximations, assumptions, and simplifications that were made when HSPF was used to develop the models. Hydrologic modeling errors typically result from a combination of input data, representation of the physical processes by the algorithms of the model, and parameter estimation during the calibration process (Ely and Kahle, 2004).
A major limitation of the model calibration was the relatively short duration of data (less than 2 years) available from the USGS streamgages in the study area. A longer period of record of streamflow data might facilitate model calibration, model verification, or both over a wider range of hydrologic conditions given that 2022 (watershed area-weighted mean, 26.18 in.) was a typical year and 2023 (watershed area-weighted mean, 22.15 in.) was a drier year based on the mean annual precipitation (1991–2020) of the study area of 25.7 in. (NCEI, 2024a). Also, four of the nine watersheds that routinely contribute runoff to the resacas and other receiving waters in the study area that were used in the model lacked USGS streamgages as a source of calibration data. For the resaca watershed simulations, USGS streamgages in the lower Resaca del Rancho Viejo and Town Resaca watersheds were the only stations available to provide calibration data for simulating water-surface elevations. There were no streamgages in the lower Resaca de la Palma watershed. The streamgages installed near the outlets of their respective watersheds could be valuable for assessing overall water quantities for the resacas. Streamgages in the lower Resaca de la Palma watershed could allow for calibration of model-simulated results. Additional streamgages upstream from the watersheds used in the study could be useful for simulating inflows from the resacas and could also provide information to help characterize the unsteady nature of streamflow routing during runoff events. Three of the six canal-drained watersheds (including San Martin Lake, the largest study area watershed) lacked available streamflow data for model calibration purposes. Model simulations for these ungaged watersheds relied upon use of calibrated parameters from nearby watersheds.
A potentially important source of model uncertainty was the simulation of the operation of control structures (gates and pumps) used by water managers to control runoff during large precipitation events. The watershed models include the capability to simulate these types of management operations. During the time when this report was being written (2024–25), data were not available to quantify the operation of control structures during extreme precipitation and runoff, and the lack of major storm events during the 2022–23 simulation period would have prevented the simulation of any flood-related management actions regardless. However, for future use of the model for simulation of extreme precipitation and runoff, data describing how control structures are operated during large runoff events could improve model accuracy. The effects of control structure operations could be measured by streamgages as well. A streamflow data collection program to measure runoff at selected diversion points, especially during higher streamflow conditions, could provide data for better calibration of management operations within the model.
Quantities and timing of diversions from the Rio Grande into resacas are important model inputs. However, time-series data for these diversions were not available. Estimation of these diversions was treated as part of the calibration process to match simulated resaca volumes with volumes determined from relatively few streamflow data. Therefore, model simulations for periods outside of the original calibration period could require model recalibration, including an estimation of water diversions to resacas. Availability of time-series data for actual measured diversion quantities could enhance the watershed models.
Model Documentation
The study area watershed model files are available in Ockerman and Choi (2026). The USGS data release also includes documentation for running the models. Each study area watershed model includes a UCI file and two watershed data management (WDM) files. The UCI file is a text file containing all program input except for time-series data. There is a separate UCI file for all nine study area watershed models.
Model input time-series datasets and simulation output time-series datasets are stored in the WDM files. The WDM files are binary, direct-access data files that can hold several thousand datasets. Time-series data used to drive model simulations, such as meteorological data and streamgage data, are included in one (input) WDM file. Model-simulated time-series data, such as simulated streamflow and water-surface elevations, evaporation and ET, and groundwater recharge, are stored in separate (output) WDM files for each watershed model. Spatial data files of watershed and catchment boundaries also are included (Ockerman and Choi, 2026).
Water-Budget Simulation Results
The calibrated watershed models were used to simulate hydrologic conditions and estimate water-budget components for the study area during 2022–23. The hydrologic characteristics and water budgets were different for the three resaca watersheds (lower Resaca del Rancho Viejo, lower Resaca de la Palma, and Town Resaca) compared to the canal-drained watersheds (San Martin Lake, Loma Alta, Cameron County Ditch 1, Southmost, North Main Drain, and Port Brownsville). The resaca watersheds have relatively small contributing drainage areas and relatively large water-surface areas, as a percentage of their watershed areas. Thus, the evaporative losses of the resaca watersheds are a much greater part of the water budget compared with the canal-drained watersheds that have larger contributing drainage areas and relatively small water-surface areas. Also, the small drainage areas of the resaca watersheds do not contribute enough runoff to maintain the resaca water-surface elevations; diversion inflows from the Rio Grande are responsible for maintaining water-surface elevations in the resaca watersheds.
Annual results during 2022–23 of the model-simulated hydrologic conditions and water-budget components for each of the nine study area watersheds included in the model are summarized in table 12. Inflow water-budget components include precipitation, diversions from the Rio Grande into resacas, streamflow entering the watershed, and for the Cameron County Ditch 1 watershed, WWTP discharges to receiving streams. Outflow water-budget components include ET from land surfaces, runoff from land surfaces, groundwater recharge, stream and resaca evaporation, runoff diverted to the Rio Grande, and streamflow exiting the watershed. To facilitate comparison of water-budget components between watersheds of varying sizes, all inflows and outflows are expressed in watershed inches—the volume of water, in inches, distributed across each watershed area. Also included in table 12 is a water-balance column listing annual differences between the estimated inflows and outflows during 2022–23. Differences between the annual sum of inflows and the annual sum of outflows result from changes in simulated HRU and RCHRES storage volumes during the 2022–23 simulation periods.
Table 12.
Estimated water budgets for the Hydrological Simulation Program—FORTRAN (HSPF) models of selected watersheds in Cameron County, Texas, 2022–23.[Data from Ockerman and Choi (2026). WWTP, wastewater treatment plant; ET, evapotranspiration; all values are means calculated for each watershed’s entire acreage and reported in inches]
Precipitation totals during 2022 for the study area watersheds ranged from 24.19 to 30.60 in. (the watershed area-weighted mean precipitation in 2022 was 26.18 in.); during 2023, precipitation totals ranged from 18.92 to 26.10 in. (the watershed area-weighted mean precipitation in 2023 was 22.15 in.) (table 12). The 2022–23 annual mean runoff yield (total runoff from land surfaces within the watersheds, in contrast to stream discharges exiting the watersheds) for the study area watersheds ranged from 4.16 to 15.0 in. (table 12). There is little developed (impervious) land cover in the San Martin Lake and Loma Alta watersheds (fig. 5), and the annual mean runoff yield (runoff per acre) during 2022–23 was the lowest for these two watersheds among all of the study area watersheds. The runoff per acre for the San Martin Lake and Loma Alta watersheds was 4.16 and 4.36 in., respectively (table 12). The Town Resaca and North Main Drain watersheds contain the most developed (impervious) area compared to the other watersheds (MRLC, 2019) (fig. 5). The 2022–23 mean annual runoff yields of 15.0 and 12.1 in., from the Town Resaca and North Main Drain watersheds, respectively, were the highest runoff yields among all study area watersheds (table 12).
ET from land surfaces was a major water-budget component and was greater in the less developed watersheds. The 2022–23 mean annual ET ranged from 12.2 in. (Town Resaca watershed) to 19.1 in. (San Martin Lake watershed) (table 12).
A substantial difference in water-surface evaporation quantities was evident between the resaca watersheds and Loma Alta watershed compared to the canal-drained watersheds. The 2022–23 mean annual water-surface evaporation rates expressed as the volume of water, in inches, distributed across each watershed area (watershed inches), from the resaca watersheds were 2.23, 7.88, and 7.98 in. from the Town Resaca, lower Resaca del Rancho Viejo, and lower Resaca de la Palma watersheds, respectively (table 12). The water-surface evaporation rates from the Town Resaca, lower Resaca del Rancho Viejo, and lower Resaca de la Palma watersheds were used to compute a mean resaca evaporation rate for all nine watersheds that routinely contribute runoff to the resacas and other receiving waters in the study area. The simulated water-surface evaporation rates from the resaca watersheds were much greater compared to the simulated water-surface evaporation rates from the canal watersheds (table 12).
The 2022–23 mean annual water-surface evaporation from the canal-drained watersheds (not including Loma Alta Lake) expressed as watershed inches ranged from 0.09 in. (Port Brownsville) to 1.22 in. (Cameron County Ditch 1) (table 12). Because of evaporation from Loma Alta Lake, the 2022–23 mean annual water-surface evaporation rate of 3.77 in. (expressed in watershed inches) for the Loma Alta watershed exceeded the mean annual evaporation rate expressed in watershed inches for the other canal-drained watersheds in the study area.
Groundwater recharge was a relatively small part of the water budget for the study area. For the part of the study area used for simulations in the model, the mean simulated groundwater recharge was 0.15 in. in 2022 and 0.11 in. in 2023 (table 12). These simulated values compare well with published estimates of recharge in the area. Panday and others (2017) reported model simulations of groundwater recharge ranging from 0 to 0.25 inches per year (in/yr) for most of the study area and small, isolated areas of recharge ranging from 0.35 to 0.66 in/yr. Chowdhury and Mace (2007) reported groundwater recharge values ranging from 0.09 to 0.15 in/yr for the lower Rio Grande Valley, which includes the study area for this report.
Diversions from resacas for residential irrigation were included in the model simulations. However, the estimates of these diversion quantities were very small (in the range of 0.001 in/yr) and, as a result, were not included in table 12.
Streamflow Discharge to San Martin Lake, the Brownsville Ship Channel, and the Rio Grande
Streamflow discharge from the study area watersheds drains to San Martin Lake, the Brownsville Ship Channel, and the Rio Grande. Streamflow from the San Martin Lake, Loma Alta, lower Resaca del Rancho Viejo, and Cameron County Ditch 1 watersheds flows directly to the drainage area that includes San Martin Lake (fig. 1). Streamflow exiting the Town Resaca, lower Resaca de la Palma, Southmost, and North Main Drain watersheds all combines to exit the study area through the Port Brownsville watershed, which flows to the Brownsville Ship Channel (fig. 1). Some streamflow in the Town Resaca, lower Resaca de la Palma, North Main Drain, and Southmost watersheds drains (mostly through pumping during runoff events) to the Rio Grande. Table 13 provides a compilation of total annual streamflow quantities, in acre-feet, to San Martin Lake, the Brownsville Ship Channel, and the Rio Grande. The Southside WWTP (EPA, 2024d) also discharges treated effluent directly to the Rio Grande; however, the Southside WWTP discharge was not included in the table 13 accounting because it does not flow through a study area watershed and is discharged directly to the Rio Grande.
Table 13.
Annual freshwater discharges to San Martin Lake, the Brownsville Ship Channel, and the Rio Grande/Rio Bravo del Norte (Rio Grande) from the study area watersheds in Cameron County, Texas, 2022–23.[Data from Ockerman and Choi (2026). All values reported in acre-feet per year]
Discharge to San Martin Lake includes discharge from the San Martin Lake, Loma Alta, Cameron County Ditch 1, and lower Resaca del Rancho Viejo watersheds.
The northern part of the study area (San Martin, Loma Alta, Cameron County Ditch 1, and lower Resaca del Rancho Viejo watersheds) that drains to San Martin Lake is about 63 percent of the total drainage area for the nine watersheds in Cameron County that routinely contribute runoff to the resacas and other receiving waters (the upper Resaca del Rancho Viejo and upper Resaca de la Palma watersheds generally do not contribute runoff and were excluded from the model simulations) (table 1). About 63 percent of the streamflow exiting the study area flowed to San Martin Lake during the 2022–23 study period (table 13). The Cameron County Ditch 1 watershed was the largest contributor of streamflow to San Martin Lake (table 12). The San Martin Lake and Loma Alta watersheds are large watersheds in the study area, but as explained previously in this section of the report, they include relatively little impervious land cover and generate less runoff yield (runoff per acre) than do the more developed watersheds (fig. 5; table 12). The Loma Alta watershed includes Loma Alta Lake (fig. 2), which under some circumstances can retain substantial quantities of runoff. Also, the San Martin Lake watershed includes sizeable marsh areas (fig. 3) that can store large quantities of runoff.
About 26 percent of the surface-water discharge flowed to the Brownsville Ship Channel from the watersheds in the southern part of the study area (Town Resaca, lower Resaca de la Palma, North Main Drain, Southmost, and Port Brownsville) during the 2022–23 study period (table 13). Although the Southmost watershed is the largest watershed that contributes flow to the Brownsville Ship Channel, most of the study area discharge flowing to the Brownsville Ship Channel originated in the North Main Drain watershed, which includes more impervious land cover than does the larger Southmost watershed (fig. 5). Although the Town Resaca and lower Resaca de la Palma watersheds include considerable impervious land cover (fig. 5) and receive inflows from the Rio Grande, evaporation from resaca water surfaces and management operations to maintain resaca water-surface elevations curtailed the amount of streamflow exiting these watersheds (table 12).
The Rio Grande received about 11 percent of the streamflow exiting the study area (from the Town Resaca, lower Resaca de la Palma, North Main Drain, and Southmost watersheds) during the 2022–23 study period (table 13). Although direct discharge from the Southside WWTP to the Rio Grande was not included in table 13, inflows to the Rio Grande of this treated effluent provide 7,920 acre-feet per year (acre-ft/yr) (EPA, 2024d)—a substantial contribution to streamflow.
Rio Grande Streamflow Diversions to Resacas in the Study Area
Precipitation and runoff in the study area watersheds are typically not sufficient to maintain the water-surface elevations in the resacas where inflows and outflows are managed; inflows to the resacas have been supplemented by diversions from the Rio Grande. Diversions to resacas were estimated as part of the model calibration process to balance water-budget inflows and outflows. Although most of the diversions were to the Town Resaca, lower Resaca del Rancho Viejo, and lower Resaca de la Palma watersheds, some minor diversions also were made to isolated, non-mainstem resacas in the North Main Drain and the Cameron County Ditch 1 watersheds. Table 14 provides estimated annual precipitation and simulated diversion inflows with an estimate of mean resaca surface acreage for selected watersheds. Diversion inflow quantities are provided in watershed inches (inches per acre of watershed area) and acre-feet per year.
Table 14.
Estimated annual precipitation and simulated diversion inflows from the Rio Grande/Rio Bravo del Norte (Rio Grande) used in Hydrological Simulation Program—FORTRAN (HSPF) models of selected watersheds in Cameron County, Texas, 2022–23.[Data from Ockerman and Choi (2026)]
Total simulated mean annual Rio Grande diversion to study area resacas during 2022–23 was about 4,000 acre-ft/yr (table 14). The lower Resaca del Rancho Viejo and lower Resaca de la Palma watersheds, with the largest resaca surface areas, required the greatest quantities of Rio Grande diversions during the 2022–23 study period, 1,430 and 1,280 acre-ft/yr, respectively (table 14). These resaca watersheds are similar in size (table 1), amount of impervious area (fig. 5), and amount of resaca surface area (table 14). The Town Resaca watershed has less than half the amount of resaca surface area of the lower Resaca del Rancho Viejo or lower Resaca de la Palma watersheds and therefore required less diversion inflow during the 2022–23 study period (575 acre-ft/yr) (table 14). The North Main Drain and Cameron County Ditch 1 watersheds have smaller resaca surface area and required smaller amounts of diversions during the 2022–23 study period (245 and 418 acre-ft/yr, respectively) (table 14). The diversion quantities, in watershed inches, for the resaca watersheds (Town Resaca, lower Resaca del Rancho Viejo, and lower Resaca de la Palma, which drain to resacas) were considerably greater than those for the canal watersheds (table 14).
Annual precipitation affected diversion quantities, and the amount of precipitation in 2023 was about 4 in. less than it was in 2022 (a decrease of about 15 percent) (table 14). As a result, an increase in diversions of about 44 percent was required in 2023 compared to the diversions made in 2022.
Summary
The U.S. Geological Survey, in cooperation with the City of Brownsville, Texas, developed hydrologic models to simulate water budgets (streamflow, evapotranspiration, water-storage volumes, and water diversions and withdrawals) for a 217-square-mile study area in Cameron County in south Texas during 2022–23. Because of the large size of the study area and diversity of hydrologic conditions, the study area was divided into 11 watersheds, and separate hydrologic models were developed for 9 watersheds (San Martin Lake, Loma Alta, lower Resaca del Rancho Viejo, Cameron County Ditch 1, Port Brownsville, lower Resaca de la Palma, North Main Drain, Town Resaca, and Southmost), as the 9 watersheds routinely contribute runoff to the resacas and other receiving waters in the study area. Six of the nine modeled watersheds are drained mostly by canals (canal watersheds), and three of the modeled watersheds drain to resacas (resaca watersheds). Resacas are former distributary channels of the Rio Grande/Rio Bravo del Norte (hereinafter referred to as the “Rio Grande”) that no longer have a hydrologic connection with the Rio Grande. Although now cut off from Rio Grande floodflows, the water-surface elevations in the network of resacas are sustained by diversions from the Rio Grande. Resacas provide habitat to aquatic species and help reduce the effects of flooding.
The monitoring and understanding of water use and water budgets are used to help manage available water resources. To further understand the water budgets in the study area, the nine watersheds were modeled using the Hydrological Simulation Program—FORTRAN. The models were developed, calibrated, and used to simulate hydrologic conditions and to estimate water budgets for the study area watersheds during 2022–23. The water-budget simulations were used to estimate the quantity of water diversions from the Rio Grande to the study area resacas and to estimate streamflow quantities flowing from the study area watersheds to receiving waters.
Hydrologic models for the nine study area watersheds were developed by (1) defining catchment and stream reach segments; (2) classifying hydrologic response units on the basis of soil type and imperviousness of land cover; (3) compiling and processing meteorological, streamflow, and other time-series data required for model simulation and calibration; and (4) determining initial (uncalibrated) values of associated model parameters. Initial values of parameters were determined or estimated from default values, previous studies, and available data.
Spatial and time-series data were used to configure and calibrate the nine study area watershed models. National Land Cover Database impervious land cover data were used to define pervious and impervious land areas within the model watersheds and catchments. Soil characteristic data were used to further define pervious land hydrologic response units and characterize pervious land hydrological responses to precipitation. Stream segment hydraulic characteristics for canals were determined from available light detection and ranging data. Hydraulic characteristics for resaca segments were determined from available bathymetric data. Time-series data used to calibrate and drive model simulations included meteorological data from the National Weather Service, the Texas Water Development Board, and the U.S. Geological Survey.
Limitations in the use of the models were identified. Both the number of streamgages available and the periods of record available to provide model calibration data were limited. Additional streamgages in the resaca watersheds (lower Resaca del Rancho Viejo, lower Resaca de la Palma, and Town Resaca) could improve understanding of flow routing through the resaca network. Four of the study area watersheds (San Martin Lake, Loma Alta, Port Brownsville, and lower Resaca de la Palma) had no streamflow data available for model calibration. Simulation of operation of control structures (gates and pumps) to manage runoff, especially during large precipitation events, is a potential source of model uncertainty.
Model calibration results and parameter sensitivity analyses indicate that the models are sufficiently accurate and can be used for simulating water budgets for the study area watersheds. During 2022–23, about 58,200 acre-feet per year of streamflow drained to the receiving waters of San Martin Lake, the Brownsville Ship Channel, and the Rio Grande. Streamflow exiting the northern part of the study area (San Martin Lake, Loma Alta, Cameron County Ditch 1, and lower Resaca del Rancho Viejo watersheds) drains to San Martin Lake. San Martin Lake receives most of the total study area discharge (about 63 percent). Most of the streamflow exiting the southern part of the study area (Town Resaca, lower Resaca de la Palma, North Main Drain, Southmost, and Port Brownsville watersheds) discharges to the Brownsville Ship Channel (about 26 percent of total study area discharge). The Rio Grande received a comparatively small amount of discharge from the southern study area watersheds, about 11 percent of the total study area discharge.
Evaporative losses from resacas are a substantial component of the water budget for the resaca watersheds (lower Resaca del Rancho Viejo, lower Resaca de la Palma, and Town Resaca). Precipitation and runoff to the resacas are not sufficient to maintain the resaca water-surface elevations. Therefore, water is diverted from the Rio Grande to maintain the water-surface elevations of many of the resacas. During 2022–23, the resaca watersheds required more diversions from the Rio Grande, about 4,000 acre-feet per year, than did the canal watersheds. The resaca watersheds released less runoff than did the canal watersheds, as management practices maintaining resaca water levels constrained their runoff.
References Cited
Al-Muqdadi, S., and Merkel, B., 2011, Automated watershed evaluation of flat terrain: Journal of Water Resource and Protection, v. 3, no. 12, p. 892–903, accessed October 31, 2022, at https://doi.org/10.4236/jwarp.2011.312099.
Asquith, W.H., and Roussel, M.C., 2004, Atlas of depth-duration frequency of precipitation annual maxima for Texas: U.S. Geological Survey Scientific Investigations Report 2004–5041, 106 p., accessed March 29, 2024, at https://doi.org/10.3133/sir20045041.
Baker, R.C., and Dale, O.C., 1964, Ground-water resources of the lower Rio Grande Valley area, Texas: U.S. Geological Survey Water-Supply Paper 1653, 56 p., 5 pls., accessed January 31, 2024, at https://doi.org/10.3133/wsp1653.
Bicknell, B.R., Imhoff, J.C., Kittle, J.L., Jr., Donigian, A.S., and Johanson, R.C., 2001, Hydrological Simulation Program—FORTRAN, user’s manual for version 12: Research Triangle Park, N.C., U.S. Environmental Protection Agency [EPA], National Exposure Research Laboratory, Office of Research and Development, 843 p., accessed December 16, 2024, at https://nepis.epa.gov/Exe/ZyPURL.cgi?Dockey=P1019SW0.TXT.
Black and Veatch Corporation, 2020, 2021 Rio Grande regional water plan: Rio Grande Regional Water Planning Group, prepared by Black and Veatch Corporation, 982 p., accessed March 31, 2023, at https://www.lrgvdc.org/downloads/regionm/2021_Region%20M%20RWP_Final_2020-10-1.pdf.
Brirhet, H., and Benaabidate, L., 2016, Comparison of two hydrological models (lumped and distributed) over a pilot area of the Issen watershed in the Souss Basin, Morocco: European Scientific Journal, v. 12, no. 18, p. 347–358, accessed July 3, 2024, at https://doi.org/10.19044/esj.2016.v12n18p347.
Chowdhury, A., and Mace, R.E., 2007, Groundwater resource evaluation and availability model of the Gulf Coast aquifer in the lower Rio Grande Valley of Texas: Texas Water Development Board, Report 368, June 2007, 119 p., accessed July 3, 2024, at https://www.twdb.texas.gov/publications/reports/numbered_reports/doc/R368/R368_GulfCoastGAM.pdf.
Dewitz, J., 2021, National Land Cover Database (NLCD) 2019 products (ver. 2.0, June 2021): U.S. Geological Survey data release, accessed March 15, 2023, at https://doi.org/10.5066/P9KZCM54.
Donigian, A.S., Jr., 2002, Watershed model calibration and validation—The HSPF experience: Proceedings of the Water Environment Federation 2002, v. 8, p. 44–73, accessed April 24, 2025, at https://www.researchgate.net/publication/233580244_Watershed_Model_Calibration_and_Validation_The_HSPF_Experience.
Donigian, A.S., Jr., Imhoff, J.C., Bicknell, B.R., and Kittle, J.L., Jr., 1984, Application guide for Hydrological Simulation Program—FORTRAN (HSPF): Athens, Ga., U.S. Environmental Protection Agency [EPA], Environmental Research Laboratory, EPA–600/3–84–065, 177 p., accessed December 18, 2024, at https://nepis.epa.gov/Exe/ZyPURL.cgi?Dockey=2000HMKI.TXT.
Duda, P.B., Hummel, P.R., Donigian, A.S., and Imhoff, J.C., 2012, BASINS/HSPF—Model use, calibration, and validation: Transactions of the ASABE, v. 55, no. 4, p. 1523–1547, accessed August 13, 2025, at https://www.researchgate.net/publication/274344576_BASINSHSPF_Model_use_calibration_and_validation.
Ely, D.M., and Kahle, S.C., 2004, Conceptual model and numerical simulation of the ground-water-flow system in the unconsolidated deposits of the Colville River watershed, Stevens County, Washington: U.S. Geological Survey Scientific Investigations Report 2004–5237, 71 p., accessed April 5, 2024, at https://doi.org/10.3133/sir20045237.
Esri, 2023, ArcGIS Esri’s enterprise geospatial platform: Esri web page, accessed January 21, 2026, at https://www.esri.com/en-us/arcgis/geospatial-platform/overview.
Ewing, T.E., and Gonzalez, J.L., 2016, The late Quaternary Rio Grande Delta—A distinctive, underappreciated geologic system: Gulf Coast Association of Geological Societies Transactions, v. 66, p. 169–180, accessed December 3, 2023, at https://archives.datapages.com/data/gcags/data/066/066001/169_gcags660169.htm.
Healy, R.W., Winter, T.C., LaBaugh, J.W., and Franke, O.L., 2007, Water budgets—Foundations for effective water-resource and environmental management: U.S. Geological Survey Circular 1308, 90 p., accessed December 12, 2023, at https://doi.org/10.3133/cir1308.
Hermitte, S.M., and Mace, R.E., 2012, The grass is always greener… outdoor residential water use in Texas: Texas Water Development Board Technical Note 12–01, 43 p., accessed December 12, 2023, at https://www.twdb.texas.gov/publications/reports/technical_notes/doc/SeasonalWaterUseReport-final.pdf?d=1520432840862.
International Boundary and Water Commission, 2025, Treaties between the U.S. and Mexico: International Boundary and Water Commission web page, accessed February 27, 2025, at https://www.ibwc.gov/treaties/.
Kittle, J.L., Jr., Lumb, A.M., Hummel, P.R., Duda, P.B., and Gray, M.H., 1998, A tool for the generation and analysis of model simulation scenarios for watersheds (GenScn): U.S. Geological Survey Water-Resources Investigations Report 98–4134, 152 p., accessed March 19, 2024, at https://doi.org/10.3133/wri984134.
Knight, L., 2009, A field guide to irrigation in the lower Rio Grande Valley: Texas Department of Transportation Environmental Affairs Division, Historical Studies Branch Historical Studies Report No. 2009–01, 288 p., accessed July 3, 2023, at https://texashistory.unt.edu/ark:/67531/metapth1222694/.
Larkin, T.J., and Bomar, G.W., 1983, Climatic atlas of Texas: Texas Department of Water Resources, Limited Printing Report LP–192, 151 p., accessed May 23, 2024, at https://www.twdb.texas.gov/publications/reports/limited_printing/doc/LP192.pdf.
Lu, J., Sun, G., McNulty, S.G., and Amatya, D.M., 2005, A comparison of six potential evapotranspiration methods for regional use in the southeastern United States: Journal of the American Water Resources Association, v. 41, no. 3, p. 621–633, accessed April 28, 2025, at https://www.srs.fs.usda.gov/pubs/ja/ja_lu004.pdf.
Lumb, A.M., McCammon, R.B., and Kittle, J.L., Jr., 1994, User’s manual for an expert system (HSPEXP) for calibration of the Hydrological Simulation Program—FORTRAN: U.S. Geological Survey Water-Resources Investigations Report 94–4168, 102 p., accessed March 19, 2024, at https://pubs.usgs.gov/wri/1994/4168/report.pdf.
Martin, G.R., Zarriello, P.J., and Shipp, A.A., 2001, Hydrologic and water-quality characterization and modeling of the Chenoweth Run Basin, Jefferson County, Kentucky: U.S. Geological Survey Water-Resources Investigations Report 00–4239, 197 p., accessed April 28, 2025, at https://doi.org/10.3133/wri004239.
Maskey, S., 2022, Introduction, chap. 1 of Catchment hydrological modeling—The science and art: Elsevier, p. 1–16, accessed April 24, 2025, at https://doi.org/10.1016/C2018-0-03853-0.
Moriasi, D.N., Arnold, J.G., Van Liew, M.W., Bingner, R.L., Harmel, R.D., and Veith, T.L., 2007, Model evaluation guidelines for systematic quantification of accuracy in watershed simulations: Transactions of the ASABE, v. 50, no. 3, p. 885–900, accessed April 28, 2025, at https://doi.org/10.13031/2013.23153.
Multi-Resolution Land Characteristics Consortium [MRLC], 2019, NLCD 2019 products now available: Multi-Resolution Land Characteristics Consortium database, accessed August 13, 2025, at https://www.mrlc.gov/card/nlcd-2019-products-now-available.
Nash, J.E., and Sutcliffe, J.V., 1970, River flow forecasting through conceptual models part I—A discussion of principles: Journal of Hydrology, v. 10, no. 3, p. 282–290, accessed April 28, 2025, at https://doi.org/10.1016/0022-1694(70)90255-6.
National Centers for Environmental Information [NCEI], 2024a, Local Climatological Data (LCD) [Brownsville, Texas]: National Centers for Environmental Information database, accessed January 16, 2024, at https://www.ncei.noaa.gov/products/land-based-station/local-climatological-data.
National Centers for Environmental Information [NCEI], 2024b, U.S. climate normals quick access [Brownsville, Texas]: National Centers for Environmental Information web page, accessed May 23, 2024, at https://www.ncei.noaa.gov/access/us-climate-normals/.
National Weather Service [NWS], 2024a, NOAA online weather data [climatological data for Brownsville S Pa, TX]: National Weather Service database, accessed May 23, 2024, at https://www.weather.gov/wrh/climate?wfo=bro.
National Weather Service [NWS], 2024b, Hurricane preparedness, Rio Grande Valley—Hurricane history: National Weather Service web page, accessed May 23, 2024, at https://www.weather.gov/bro/hurrprep_history.
Ockerman, D.J., 2024, Bathymetric data for selected resacas in the Brownsville, Texas area, September 2021 through April 2023: U.S. Geological Survey data release, accessed January 21, 2026, at https://doi.org/10.5066/P1YU58Y7.
Ockerman, D.J., and Choi, N., 2026, Hydrological Simulation Program—FORTRAN (HSPF) user-control, input, and output files for simulation of hydrologic conditions in selected watersheds in Cameron County, Texas, 2022–23: U.S. Geological Survey data release, https://doi.org/10.5066/P1XDLQUJ.
Panday, S., Rumbaugh, J., Hutchison, W.R., and Schorr, S., 2017, Numerical model report—Lower Rio Grande Valley groundwater transport model: Texas Water Development Board, contract no. 1548301854, accessed January 8, 2024, at https://www.twdb.texas.gov/groundwater/models/research/lrgv_t/lrgv_t.asp.
Pedraza, D.E., and Ockerman, D.J., 2012, Watershed modeling applications in south Texas: U.S. Geological Survey Fact Sheet 2012–3005, 4 p., accessed July 3, 2024, at https://doi.org/10.3133/fs20123005.
Roth, D., 2010, Texas hurricane history: Camp Springs, Md., National Weather Service, 83 p., accessed July 3, 2024, at https://www.wpc.ncep.noaa.gov/research/txhur.pdf.
Southmost Regional Water Authority, 2023, SRWA Water Treatment Plant: Southmost Regional Water Authority web page, accessed June 30, 2023, at https://srwadesal.com/water-treatment-plant/.
Texas Commission on Environmental Quality, 2025, Rio Grande Watermaster Program: Texas Commission on Environmental Quality web page, accessed February 27, 2025, at https://www.tceq.texas.gov/permitting/water_rights/wmaster/rgwr.
Texas Highways, 2025, Remnants of the Rio Grande—Resacas are the natural wonders of Texas’ Rio Grande Valley: Texas Highways web page, accessed March 10, 2025, at https://texashighways.com/outdoors/water/resacas-are-the-natural-wonders-of-texas-rio-grande-valley/.
Texas State Historical Association, 2023, Handbook of Texas—Resacas: Texas State Historical Association web page, accessed November 30, 2023, at https://www.tshaonline.org/handbook/entries/resacas.
Texas Water Development Board [TWDB], 2024a, Texas raster evaporation: Texas Water Development Board, accessed January 21, 2026, at https://dri-apps.projects.earthengine.app/view/twdb-raster-lake-evaporation.
Texas Water Development Board [TWDB], 2024b, TWDB reservoir evaporation: Texas Water Development Board, accessed January 21, 2026, at https://dri-apps.projects.earthengine.app/view/twdb-reservoir-evaporation.
University of Texas Rio Grande Valley, Texas Water Resources Institute, Texas Commission on Environmental Quality, and Texas Institute for Applied Environmental Research, 2019, Lower Laguna Madre/Brownsville Ship Channel watershed characterization 2018: Texas Commission on Environmental Quality and U.S. Environmental Protection Agency, TCEQ contract 582–14–41167, 100 p., accessed July 3, 2024, at https://arroyocolorado.org/media/zqjpi1e0/llm_wc_102618_forstakeholderreview.pdf.
U.S. Census Bureau, 2024, QuickFacts: U.S. Census Bureau web page, accessed May 23, 2024, at https://www.census.gov/quickfacts/.
U.S. Department of Agriculture [USDA], 1977, Soil survey of Cameron County, Texas: U.S. Department of Agriculture, Soil Conservation Service, and Texas Agricultural Experiment Station, 92 p., 88 sheets, scale 1:20,000, accessed August 21, 2025, at https://dn721807.ca.archive.org/0/items/cameronTX1977/cameronTX1977.pdf.
U.S. Department of Agriculture [USDA], 2022, Gridded Soil Survey Geographic (gSSURGO) database for the conterminous United States: U.S. Department of Agriculture, Natural Resources Conservation Service, accessed June 24, 2024, at https://data.nal.usda.gov/dataset/soil-survey-geographic-database-ssurgo.
U.S. Department of Agriculture [USDA], 2023, Web Soil Survey: Natural Resources Conservation Service database, accessed December 15, 2023, at https://websoilsurvey.sc.egov.usda.gov/App/HomePage.htm.
U.S. Environmental Protection Agency [EPA], 2000, Estimating hydrology and hydraulic parameters for HSPF: U.S. Environmental Protection Agency, EPA BASINS Technical Note 6, 32 p., accessed January 15, 2024, at https://www.epa.gov/sites/default/files/2015-08/documents/2000_08_14_basins_tecnote6.pdf.
U.S. Environmental Protection Agency [EPA], 2012, NHDPlus (National Hydrography Dataset Plus): U.S. Environmental Protection Agency web page, accessed March 31, 2023, at https://www.epa.gov/waterdata/nhdplus-national-hydrography-dataset-plus.
U.S. Environmental Protection Agency [EPA], 2024a, Hydrological Simulation Program—FORTRAN (HSPF): U.S. Environmental Protection Agency web page, accessed July 9, 2024, at https://www.epa.gov/hydrowq/basins-framework-and-features#models.
U.S. Environmental Protection Agency [EPA], 2024b, BASINS framework and features: U.S. Environmental Protection Agency web page, accessed July 9, 2024, at https://www.epa.gov/hydrowq/basins-framework-and-features.
U.S. Environmental Protection Agency [EPA], 2024c, ECHO—Enforcement and compliance history online—Detailed facility report, Robindale WWTP: U.S. Environmental Protection Agency database, accessed July 9, 2024, at https://echo.epa.gov/detailed-facility-report?fid=110064600944&ej_type=sup&ej_compare=US.
U.S. Environmental Protection Agency [EPA], 2024d, ECHO—Enforcement and compliance history online—Detailed facility report, Brownsville Public Utility Board Southside WWTP: U.S. Environmental Protection Agency database, accessed July 9, 2024, at https://echo.epa.gov/detailed-facility-report?fid=110039876391&ej_type=sup&ej_compare=US.
U.S. Environmental Protection Agency [EPA], 2025, Better Assessment Science Integrating Point and Nonpoint Sources (BASINS): U.S. Environmental Protection Agency web page, accessed August 12, 2025, at https://www.epa.gov/hydrowq/better-assessment-science-integrating-point-and-non-point-sources-basins.
U.S. Geological Survey [USGS], 2018, South Texas lidar 2018: Texas Geographic Information Office DataHub, accessed November 18, 2025, at https://data.geographic.texas.gov/collection/?c=6131ecdd-aa26-433e-9a24-97ac1afda7de.
U.S. Geological Survey [USGS], 2025, USGS water data for Texas, in USGS water data for the Nation: U.S. Geological Survey National Water Information System database, accessed February 27, 2025, at https://doi.org/10.5066/F7P55KJN. [State water data directly accessible at https://waterdata.usgs.gov/tx/nwis/.]
Wicklein, S.M., and Schiffer, D.M., 2002, Simulation of runoff and water quality for 1990 and 2008 land-use conditions in the Reedy Creek watershed, east-central Florida: U.S. Geological Survey Water-Resources Investigations Report 02–4018, 62 p., accessed March 14, 2025, at https://doi.org/10.3133/wri024018.
Zhao, G., and Gao, H., 2019, Estimating reservoir evaporation losses for the United States—Fusing remote sensing and modeling approaches: Remote Sensing of Environment, v. 226, p. 109–124, accessed May 9, 2023, at https://doi.org/10.1016/j.rse.2019.03.015.
Conversion Factors
U.S. customary units to International System of Units
International System of Units to U.S. customary units
Temperature in degrees Fahrenheit (°F) may be converted to degrees Celsius (°C) as follows:
°C = (°F – 32) / 1.8.
Datums
Vertical coordinate information is referenced to the North American Vertical Datum of 1988 (NAVD 88).
Elevation, as used in this report, refers to distance above the vertical datum.
Abbreviations
BASINS
Better Assessment Science Integrating Point and Nonpoint Sources
EPA
U.S. Environmental Protection Agency
ET
evapotranspiration
FTABLE
function table
GIS
geographic information system
HRU
hydrologic response unit
HSPF
Hydrological Simulation Program—FORTRAN
IMPLND
impervious land
INFILT
index to infiltration capacity of soil
lidar
light detection and ranging
LZSN
lower zone nominal storage
MRLC
Multi-Resolution Land Characteristics Consortium
NAVD 88
North American Vertical Datum of 1988
NCEI
National Centers for Environmental Information
NHDPlus
National Hydrography Dataset Plus
NLCD
National Land Cover Database
NSE
Nash-Sutcliffe coefficient of model-fit efficiency
NWS
National Weather Service
PERLND
pervious land
PEVT
potential evapotranspiration
R2
coefficient of determination
RCHRES
reach reservoir
TWDB
Texas Water Development Board
UCI
user control input
USDA
U.S. Department of Agriculture
USGS
U.S. Geological Survey
UZSN
upper zone nominal storage
WDM
watershed data management
WWTP
wastewater treatment plant
For more information about this publication, contact
Director, Oklahoma-Texas Water Science Center
U.S. Geological Survey
1505 Ferguson Lane
Austin, TX 78754–4501
For additional information, visit
https://www.usgs.gov/centers/ot-water
Publishing support provided by
U.S. Geological Survey Science Publishing Network,
Lafayette Publishing Service Center
Disclaimers
Any use of trade, firm, or product names is for descriptive purposes only and does not imply endorsement by the U.S. Government.
Although this information product, for the most part, is in the public domain, it also may contain copyrighted materials as noted in the text. Permission to reproduce copyrighted items must be secured from the copyright owner.
Suggested Citation
Ockerman, D.J., and Choi, N., 2026, Water-budget simulations for selected watersheds in Cameron County, Texas, 2022–23: U.S. Geological Survey Scientific Investigations Report 2025–5098, 37 p., https://doi.org/10.3133/sir20255098.
ISSN: 2328-0328 (online)
Study Area
| Publication type | Report |
|---|---|
| Publication Subtype | USGS Numbered Series |
| Title | Water-budget simulations for selected watersheds in Cameron County, Texas, 2022–23 |
| Series title | Scientific Investigations Report |
| Series number | 2025-5098 |
| DOI | 10.3133/sir20255098 |
| Publication Date | February 04, 2026 |
| Year Published | 2026 |
| Language | English |
| Publisher | U.S. Geological Survey |
| Publisher location | Reston, VA |
| Contributing office(s) | Oklahoma-Texas Water Science Center |
| Description | Report: viii, 37 p.; Data Release |
| Country | United States |
| State | Texas |
| County | Cameron County |
| Online Only (Y/N) | Y |