

Temporal Changes in Nutrient Concentrations in the Lower Grand River and Selected Drainage Basins, Missouri and Iowa, During the Mississippi River Basin Healthy Watersheds Initiative (2010–23)
Links
- Document: Report (2.4 MB pdf) , HTML , XML
- Table: Tables 1.1 to 1.5 (xlsx)
- Dataset: USGS National Water Information System database - USGS water data for the Nation
- Data Release: USGS data release - Archive of the load estimation models used in the analyses of temporal changes in nutrient concentrations in the Lower Grand River and selected drainage basins, Missouri and Iowa (2010–23)
- NGMDB Index Page: National Geologic Map Database Index Page
- Download citation as: RIS | Dublin Core
Acknowledgments
The authors would like to thank the Missouri Department of Natural Resources for providing support for this project. The work of many U.S. Geological Survey staff members made this report possible.
Abstract
This report describes a cooperative study by the U.S. Geological Survey and Missouri Department of Natural Resources that evaluated temporal changes in total nitrogen (TN) and total phosphorus (TP) concentrations in the Lower Grand River hydrologic unit. The study focused on trends since 2010, when the basin was designated as a priority drainage basin of the Mississippi River Basin Healthy Watersheds Initiative (MRBI). At three local drainage basins within the Lower Grand hydrological unit (MRBI sites), stream nutrient trends were evaluated using flow-adjusted (FA) TN and TP concentrations for water years 2011 through 2023. FATN concentration trends were not statistically significant for any MRBI site. One site (site 2) showed a statistically significant increasing trend in FATP concentration, indicating a possible increase in phosphorus sources in parts of the basin. Overall, streamflow variability appeared to be the dominant factor affecting nutrient concentrations at MRBI sites. At five regional drainage basins, including the Grand River and nearby rivers with data from 1994 through 2023 (long-term sites), annual flow-normalized (FN) TN and TP concentrations were evaluated for trends before (water years 2000–10) and during (water years 2010–23) the MRBI. For water years 2010 through 2023, annual FNTN and FNTP concentrations decreased in the Grand River, as well as in the Nodaway and Chariton Rivers, which were not targeted by the MRBI. The Grand River (site 9) reversed from increasing to decreasing FNTP concentrations after 2010, with a 26-percent reduction. Annual FNTN and FNTP concentrations also decreased at the Missouri River sites. While nutrient reductions in the Grand River may reflect the effects of implemented conservation practices, similar trends in nearby, nontargeted rivers and the absence of strong decreasing trends at MRBI sites suggest that broader regional factors, instead of or in addition to MRBI efforts, may have contributed to nutrient reductions in the Grand River.
Plain Language Summary
The U.S. Geological Survey, in cooperation with the Missouri Department of Natural Resources, estimated total nitrogen and total phosphorus concentrations at three local and five regional monitoring sites in Missouri. Temporal changes in total nitrogen and total phosphorus were quantified to evaluate whether instream nutrient concentrations have changed at local or regional scales. At the local scale sites, total phosphorus concentrations substantially increased at one site, which indicated a possible increase in phosphorus sources in the Lower Grand River hydrologic unit, while total nitrogen concentrations did not change substantially. At the regional site, annual total nitrogen and total phosphorus concentrations generally decreased. The regional decline in stream nutrients paired with the lack of nutrient reduction at the local sites indicated that nutrient reductions in the Grand River may have been driven by regional changes in nutrient export, instead of or in addition to conservation practices implemented as part of the Mississippi River Basin Healthy Watersheds Initiative.
Introduction
When excess nutrients enter surface waters, they have the potential to degrade water quality and cause the growth of nuisance or harmful algal blooms (Breitburg and others, 2018). Algal blooms create hypoxic or “dead” zones where oxygen levels are too low to support aquatic life, thereby harming or killing aquatic communities and disrupting their functions. Eutrophication also negatively affects local human populations by degrading drinking water quality and reducing aquatic recreation, habitat, and tourism (Femmer, 2012). Eutrophication, hypoxia, and algal blooms persist in the Nation’s waters (U.S. Environmental Protection Agency, 2017). Of the surveyed stream and river miles in the United States, 46 percent were impaired by excess phosphorus and 41 percent were impaired by excess nitrogen. Also, approximately 40 percent of U.S. lakes are in a “most disturbed” condition because of excess phosphorus. These impairments have been linked to increased anthropogenic nutrient inputs, mainly originating from nonpoint agricultural sources, in the late 20th and early 21st centuries (Brown and Froemke, 2012; Stephenson and others, 2022).
A consequence of excessive nutrients in streams and rivers is the formation of hypoxic or dead zones in Bays and Gulfs at the mouths of large nutrient-rich rivers (including the Mississippi River), which have spread in the coastal oceans during the last five decades (Rabalais and others, 2002, 2010). In the Mississippi River Basin, the task of reducing nutrient loads to the Mississippi River has mostly fallen to individual State nutrient reduction strategies aided by Federal funding (U.S. Environmental Protection Agency, 2014). With respect to nonpoint nutrient sources, State nutrient reduction strategies and Federal programs have focused on funding voluntary implementation of conservation practices by individual farmers and landowners (Kirk and others, 2024). To improve the effectiveness of these nutrient reduction strategies, critical source areas, defined as locations that deliver a disproportionate amount of pollutant, have been targeted for conservation practice implementation (Osmond and others, 2012). To this end, the U.S. Department of Agriculture Natural Resources Conservation Service (NRCS) started a conservation landscape initiative in 2010 known as the Mississippi River Basin Healthy Watersheds Initiative (MRBI; Natural Resources Conservation Service, 2023). The MRBI offers financial and technical assistance to agricultural producers in priority drainage basins within the Mississippi River Basin, including the Lower Grand River hydrologic unit (fig. 1; hereafter referred to as the “Lower Grand”). This assistance focused on implementing voluntary conservation practices that avoid, control, and trap nutrients released from working agricultural lands within the Mississippi River drainage basin (Natural Resources Conservation Service, 2023). The primary goal of the MRBI has been to improve water quality while ensuring the economic viability of agricultural lands. Secondary goals include restoration of wetlands and wildlife habitat.
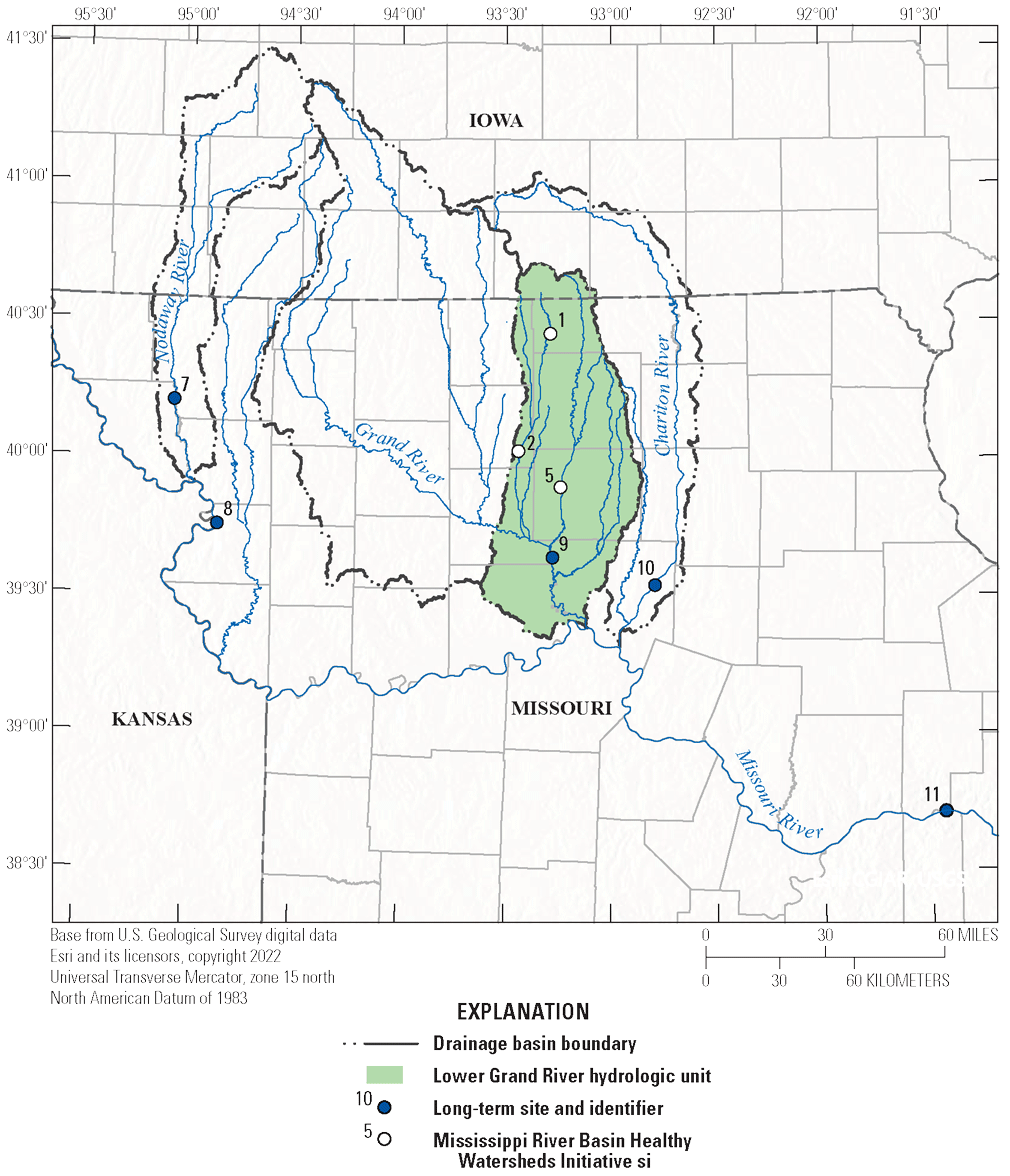
Map showing locations of U.S. Geological Survey water-quality collection sites within the Lower Grand River, selected Missouri River tributary sites, and Missouri River sites upstream and downstream from the confluence with the Grand River in Missouri and Iowa.
Predicting the ability of management activities to improve water quality before implementation is difficult. First, the effectiveness of agricultural conservation practices in reducing nutrient and sediment loads can vary widely (Liu and others, 2017; Webber and others, 2024), especially at the drainage basin scale (Tomer and Locke, 2011). Second, conservation practices can have compounding or counteracting effects. For example, terraces (NRCS Conservation Practice Standard, code 600) have the potential to moderately reduce nutrient transport to surface waters. However, terraces are often paired with underground outlets (NRCS Conservation Practice Standard, code 620), which have the potential to increase nutrient transport to surface waters and negate the nutrient reduction benefit of the terrace conservation practice (Natural Resources Conservation Service, 2024). Third, the release of legacy nutrients, which are nutrients stored in groundwater and soils, can make the effects of conservation practices on water quality difficult to detect for years or decades after implementation (Van Meter and Basu, 2015). Finally, changing climate may accelerate nutrient losses despite increased conservation practices because of increasing extreme precipitation events that increase the amount of nutrients leached from the soil (Sinha and others, 2017; Lu and others, 2020). Monitoring studies quantifying changes in stream nutrient concentrations resulting from implementation of conservation practices help estimate conservation practice effectiveness at the drainage basin scale.
Previous Investigations
In 2010, the U.S. Geological Survey (USGS) and the Missouri Department of Natural Resources began a cooperative study to evaluate temporal changes in total nitrogen (TN) and total phosphorus (TP) concentrations at selected sites within the Lower Grand (Krempa and Flickinger, 2017). The study objectives were to quantify temporal changes in TN and TP concentrations, then compare those concentration changes among sites and relative to the acres of conservation practices implemented.
At the six study sites within the Lower Grand (hereafter referred to as “MRBI sites”), annual mean TN concentrations (referred to as “flow-weighted concentrations” in Krempa and Flickinger [2017]) from 2011 to 2015 ranged from 0.65 to 2.8 milligrams per liter (mg/L). During the same period, annual mean TP concentrations ranged from 0.09 to 0.40 mg/L. In addition to the annual means, flow-adjusted (FA) concentrations were used to qualitatively assess temporal changes in nutrient sources. Visual inspection of FATN and FATP concentrations between 2011 and 2015 revealed stable FATN and FATP concentrations, which indicated that the sources of stream nutrients had not changed during the study period.
At selected Missouri River tributary sites and Missouri River sites upstream and downstream from the confluence with the Grand River (referred to as “long-term sites”), greater decreases in flow-normalized (FN) TN and TP concentrations were observed at the nearby Missouri River tributary sites than at the Grand River site despite the increase in conservation practices in the Lower Grand from 2011 to 2015. A regression analysis indicated weak relations between the acres of conservation practice acres in the regional drainage basins and annual FNTN and FNTP concentrations.
Purpose and Scope
This report describes temporal changes in stream TN and TP concentrations within the Lower Grand and throughout northwest Missouri and southern Iowa focused on the period from October 1, 2010, through September 30, 2023, or water years 2011–23. Within the Lower Grand, temporal changes in TN and TP concentrations were used to evaluate the effects of the MRBI on water quality. Additionally, temporal changes in stream TN and TP concentrations in the regional drainage basins widened the scope of this report to document broader nutrient trends across northwest Missouri and southern Iowa during this period. This report updates the work completed by Krempa and Flickinger (2017).
Site Description
This study focuses on the Lower Grand drainage basin in Missouri and Iowa (fig. 1). The Lower Grand is a subbasin within the Grand River drainage basin (site 9 [USGS streamgage 06902000; Grand River near Sumner, Missouri]), and the Grand River is a tributary of the Missouri River (sites 8 [USGS streamgage 06818000; Missouri River at St. Joseph, Mo.] and 11 [USGS streamgage 06934500; Missouri River at Hermann, Mo.]; fig. 1, table 1). In 2010, the Lower Grand was designated as an MRBI focus area. As a focus area, the Lower Grand received increased funding for conservation practices and water quality monitoring facilitated through the MRBI and its partners (Natural Resources Conservation Service, 2023). Within the Lower Grand, six water-quality sites were established on tributaries in 2010 and labeled as MRBI sites (Krempa and Flickinger, 2017). Of these six MRBI sites, three were selected for continued monitoring in 2019 (sites 1 [USGS streamgage 06899900; Medicine Creek at Lucerne, Mo.], 2 [USGS streamgage 06900050; Medicine Creek near Laredo, Mo.], and 5 [USGS streamgage 06901500; Locust Creek near Linneus, Mo.]; fig. 1, table 1). The drainage areas of these study sites range from 305 to 1,435 square kilometers, and agriculture is the primary land use within each site’s drainage basin (table 1; Krempa and Flickinger, 2017).
Table 1.
Description of U.S. Geological Survey water-quality collection study sites in Missouri.[Sites include the Lower Grand River hydrologic unit (Mississippi River Basin Healthy Watersheds Initiative [MRBI]) sites, selected Missouri River tributary sites, and Missouri River sites upstream and downstream from the confluence with the Grand River (long-term sites) in Missouri and Iowa. Drainage area calculations and percentage of agricultural land cover from Krempa and Flickinger (2017); ID, identifier; USGS, U.S. Geological Survey; km2, square kilometer; MO, Missouri]
Additional long-term monitoring sites included one site on the Grand River (site 9), two additional Missouri River tributary sites (sites 7 [USGS streamgage 06817700; Nodaway River near Graham, Mo.] and 10 [USGS streamgage 06905500; Chariton River near Prairie Hill, Mo.]) and two Missouri River sites, one upstream (site 8) and one downstream (site 11) from the confluence of the Grand and Missouri Rivers (fig. 1, table 1). All long-term USGS monitoring sites were also included in the previous publication by Krempa and Flickinger (2017). Although the Grand River drainage basin includes the Lower Grand, the Grand River site (site 9) could not be directly linked to long-term water-quality changes in the Lower Grand because no long-term sites existed on the Middle or Upper Grand River. Instead, changes in TN and TP concentrations at this site could only reflect potential effect of the MRBI in the Lower Grand on water quality in the broader Grand River Basin upstream of the USGS streamgage.
The two additional Missouri River tributary sites (sites 7 and 10) were of similar size and land use to the Grand River but were not part of NRCS priority drainage basins. As such, they could act as reference sites to help determine if water-quality changes in the Grand River were unique in the region. Finally, differences in temporal changes of water quality between the Missouri River sites upstream and downstream of the Grand River confluence could potentially indicate if the region was reducing its nutrient export.
Streamflow and Water-Quality Data Collection
USGS streamgages were colocated with water-quality collection sites. Stage data were collected every 15 minutes using nonsubmersible pressure transducers and uploaded to the USGS National Water Information System (NWIS) database (U.S. Geological Survey, 2024). Routine streamflow measurements were made to develop and maintain a stage-streamflow relation for each site, which were used to estimate streamflows from stage data (Turnipseed and Sauer, 2010). Daily mean streamflows were computed from the 15-minute streamflows and stored in NWIS.
Water-quality samples were collected and processed using standard equal-width increment collection methods representative of the entire water column (U.S. Geological Survey, variously dated) and analyzed at the USGS National Water Quality Laboratory according to published USGS laboratory methods in use during the time of sample collection and analysis (Patton and Truitt, 1992, 2000; Fishman, 1993; U.S. Environmental Protection Agency, 1993; Fishman and others, 1994; Patton and Kryskalla, 2003, 2011). Concentrations of nitrate plus nitrite (dissolved or total), ammonia plus organic nitrogen, TN, and TP were obtained from the USGS NWIS database (U.S. Geological Survey, 2024). If a date had more than one sample, only the water-quality sample flagged as a regular sample in the NWIS database (sample type code=9) was kept. At the MRBI sites, TN concentrations were pulled directly from the NWIS database using parameter code 00600. For the long-term sites, TN was defined as the sum of nitrate plus nitrite (dissolved or total) and ammonia plus organic nitrogen (total Kjeldahl nitrogen), and only samples with concentrations for both nitrogen constituents were used. Measured nitrogen and phosphorus concentrations from water-quality samples were paired with daily mean streamflow from colocated streamgages to estimate annual TN and TP concentrations.
Methods for Assessing Temporal Changes in Nutrient Concentrations
The primary study objective was to quantify temporal changes in TN and TP concentrations in the Lower Grand and nearby drainage basins. At the MRBI sites, annual mean TN and TP concentrations were estimated to provide a quantitative metric to track temporal changes in the “actual” nutrient concentrations; however, trends in nutrient concentrations can be obscured by interannual flow variability (Rowland and others, 2021). To improve the trend signal, the effect of flow variability was reduced through additional analysis.
Methods to reduce the effect of flow variability include calculating FA and FN concentrations. As of this publication, the best available method to reduce the effect of interannual flow variability is an extension of the Weighted Regressions on Time, Discharge, and Season (WRTDS) model known as flow normalization (Rowland and others, 2021). The WRTDS model generally requires at least 20 years of data and more than 200 samples collected at the sampling site (Hirsch and others, 2010). Furthermore, the daily time step of the WRTDS model makes it unsuitable for small, flashy rivers that can pass most of the streamflow associated with a storm event in less than one day. These requirements make flow normalization using the WRTDS model acceptable for the long-term sites but not for the MRBI sites.
For the MRBI sites, FA concentrations were used as an alternative to FN concentrations to reduce the effect of streamflow on water-quality changes. FA concentrations are defined as the difference between measured sample concentrations and the predicted concentration using the relation with streamflow (White and others, 2004; Simpson and Haggard, 2018). Statistically, they are the model residuals of a concentration-streamflow model. Because the modeled concentration values were predicted from streamflow alone, the residuals from the streamflow-only model represent changes in concentrations not explained by streamflow variation. These residuals can be plotted over time to investigate changes in nutrient delivery to the stream or river regardless of changes in streamflow (Crawford and others, 1983; Heimann and others, 2011).
Overall, at the MRBI sites (sites 1, 2, and 5), annual mean TN and TP concentrations were used to evaluate the “actual” TN and TP concentrations, and FATN and FATP concentrations were used to evaluate trends in TN and TP sources from water year 2011 through water year 2023. At long-term sites (sites 7–11; fig. 1, table 1), FNTN and FNTP concentrations were used to reduce the effects of streamflow variability on estimated nutrient concentrations and evaluate temporal changes in TN and TP concentrations from water year 2010 through water year 2023. MRBI sites did not have complete datasets during water year 2010; therefore, the analysis started with water year 2011. Although the values produced from each analysis cannot be compared directly, the direction of the trends derived from the values can be compared. The combined results complemented each other and added depth to the analysis in the report. All three methods were used in the previous study (Krempa and Flickinger, 2017) and provide continuity to the analysis of water quality in the region.
Computing Annual Mean Nutrient Concentrations at Mississippi River Basin Healthy Watersheds Initiative Sites
Annual mean TN and TP concentrations were estimated using the survival R package (Therneau, 2024) to run tobit (censored) regression models of the load-streamflow relation. The model archive for the models that were used is available in an accompanying USGS data release (Kamrath and others, 2025). The response variable was the logarithm (log) of the daily load (in kilograms per day). Daily loads were calculated by multiplying the discrete sample concentrations by the mean daily streamflow (Q) for the day the sample was taken. Potential explanatory variables included lnQ, lnQ2, lnQ3, lnQ4, sine and cosine terms with 2π and 4π cycles (in which π is the ratio of a circle’s circumference to its diameter [about 3.14159]), and a decimal time trend term. An example equation is shown in equation 1.
whereln
is the natural log,
load
is daily nutrient load,
β0, β1, β2, β3, β4, and β5
are fitted coefficients,
Q
is mean daily streamflow,
t
is time, and
ε
is unexplained variability.
Using the survival R package, a function computed all combinations of the supplied explanatory variables and provided the 10 models with the lowest Akaike information criteria (Cavanaugh and Neath, 2019). For each site and nutrient combination, the model with the lowest Akaike information criterion value was initially selected as the best-fit model. The residual plots, flux biases, and Nash-Sutcliffe model efficiency coefficients of the best-fit model were reviewed. Additional explanatory variables were then used or dropped depending on their statistical significance (statistical probability values [p-values] less than 0.05) and their ability to improve the residual plots, flux bias, or Nash-Sutcliffe model efficiency until a final model was selected (app. 1, table 1.1). Final model performance was assessed using the regression coefficient of determination (Stenback and others, 2011).
Once the optimal model was determined, this model was used to estimate daily TN and TP loads (in kilograms per day). Estimated daily TN and TP loads were divided by daily mean streamflows to provide daily estimated TN and TP concentrations. Daily TN and TP concentrations for each water year were aggregated to annual mean TN and TP concentrations. Mann-Kendall trend tests with Theil-Sen slope estimates were used to test for monotonic trends in annual mean concentrations from water year 2011 through water year 2023 (Helsel and others, 2020). Statistical significance was set to a p-value less than 0.05. Mann-Kendall trend tests were completed using the R package rkt (Marchetto, 2024).
Computing Flow-Adjusted Nutrient Concentrations at Mississippi River Basin Healthy Watersheds Initiative Sites
The flow adjustment procedure was a three-step process for each site and nutrient. This three-step process was described in White and others (2004) and later expanded in Simpson and Haggard (2018). First, nutrient concentrations and their corresponding daily streamflow were log-transformed using the natural log. Second, a locally estimated scatterplot smoothing (LOESS) curve was fitted to the natural log of nutrient concentrations versus the natural log of the corresponding daily streamflow data. The smoothing parameter or span of the LOESS curve was set to 0.5, and the degree of the polynomial was set to 1 (a linear function). Third, the residuals from the LOESS regression (hereafter referred to as “FA concentrations”) were plotted over time.
FATN and FATP concentrations were calculated at each MRBI site from October 2010 through September 2023 (app. 1, tables 1.2 and 1.3). A simple linear regression of FA concentration versus time was used to detect a significant monotonic trend at α=0.05, where α is the significance level for TN and TP. The slope of the simple linear regression was converted to a percentage of change in concentration per year. A nonsignificant trend indicated a likely consistent relation between nutrient concentration and streamflow during the period, and no major changes in the drainage basin’s nutrient sources (for example, the introduction of new sources or reductions in previous sources) were detected. Alternatively, if a trend was significant, then it could be concluded that either a new nutrient source was introduced (a positive percentage change) or a previous nutrient source was reduced (a negative percentage change).
Computing Annual Flow-Normalized Nutrient Concentrations at Long-Term Sites
Annual FNTN and FNTP concentrations were estimated using the WRTDS method in the EGRET R package (Hirsch and others, 2010, 2023). WRTDS models were run on water-quality and hydrology data spanning from October 1, 1994, through September 30, 2023. WRTDS does not assume a stationary relation between concentration and time, discharge, and season; therefore, estimates at the beginning and end of the records tend to be less reliable (Sprague and others, 2011). Results were reported beginning in water year 2000 to improve the reliability of the results. WRTDS estimates of nutrient concentrations before 2000 are published in Krempa and Flickinger (2017). However, the importance of recent conditions required the inclusion of results through water year 2023 (Sprague and others, 2011). Note, annual FN concentration estimates for the most recent years of the period will likely change when the WRTDS model is run with future data (Chanat and others, 2016).
Four of the five sites had complete daily streamflow records. Site 9 was missing eight daily streamflow values. The missing daily streamflows were filled using the fillMiss function from the waterData R package (Ryberg and Vecchia, 2017) with a block equal to 30 and the percentage of missing values equal to 1. The WRTDS model was completed using generalized flow normalization with a windowSide equal to 10, which means a sliding 20-year window of time was used for FN calculations (Hirsch and others, 2023). Confidence intervals (CIs) were calculated for FN estimates using the ciCalculations function with nBoot=100 (bootstrap resampling completed 100 times), blockLength=200 (200 samples pulled in every bootstrapped dataset), and widthCI=90 (90-percent CI). Model bias was computed for WRTDS TN and TP models for each long-term site by taking the difference between the sum of the unbiased estimates of loads on days when samples were collected and the sum of the calculated loads and then dividing by the sum of the unbiased estimates. The absolute bias in the TN and TP WRTDS models was not greater than 8.4 percent at any site (table 2).
Table 2.
Selected total nitrogen and total phosphorus model information, including model bias, in percent, for long-term sites.[Data from U.S. Geological Survey (2024); ID, identifier; USGS, U.S. Geological Survey; TN, total nitrogen; %, percent; TP, total phosphorus]
Patterns in the FN concentrations were analyzed three ways: change in annual FN concentration, in milligrams per liter; change in annual FN concentration, in percent; and rate of change in annual FN concentration, in percent per year. These values were estimated for the period before the MRBI (water years 2000–10) and during its implementation (water years 2010–23) by comparing the FN concentrations among water years 2000, 2010, and 2023.
Temporal Changes in Annual Mean Nutrient Concentrations at Mississippi River Basin Healthy Watersheds Initiative Sites
Annual mean TN concentrations were similar among the three MRBI sites, ranging from 0.31 to 2.13 mg/L; the minimum value was measured at site 2 and the maximum at site 5 (table 3). When ranked by mean value, annual TN concentrations were highest at site 5 and lowest at site 2. Annual mean TP concentrations were also similar across sites with values ranging from 0.08 to 0.66 mg/L. Site 5 generally had the highest annual mean TP concentrations, while site 1 had the lowest. As with TN, the minimum and maximum annual mean TP concentrations were recorded at sites 2 and 5, respectively. The ranges of annual mean TN and TP concentrations were consistent with those reported in the previous study (Krempa and Flickinger, 2017).
Table 3.
Summary of annual mean total nitrogen and total phosphorus concentrations, in milligrams per liter, at Mississippi River Basin Healthy Watersheds Initiative sites in Missouri.[ID, identifier; USGS, U.S. Geological Survey; TN, total nitrogen; mg/L, milligram per liter; TP, total phosphorus; min, minimum; max, maximum]
Annual mean TN and TP concentrations varied considerably from year to year, generally increasing as streamflow increased (figs. 2 and 3). This relation was apparent during the dry year of 2018, which coincided with the minimum concentrations, and the following wet year of 2019, which produced near maximum concentrations. From 2011 to 2023, neither annual mean TN concentrations nor annual mean TP concentrations had statistically significant trends (table 4). Slopes in annual mean TN concentrations ranged from −0.004 to 0.024 milligram per liter per year ([mg/L]/yr). Slopes in annual mean TP concentrations ranged from −0.002 to 0.004 (mg/L)/yr. These slopes indicated no meaningful increase or decrease in annual mean TN and TP concentrations at any of the MRBI sites; for example, the −0.004 (mg/L)/yr slope in the annual mean TN concentration at site 2 would equate to a 0.05-mg/L reduction at a site with a mean TN concentration of 1.08 mg/L over the 13 years of the study.
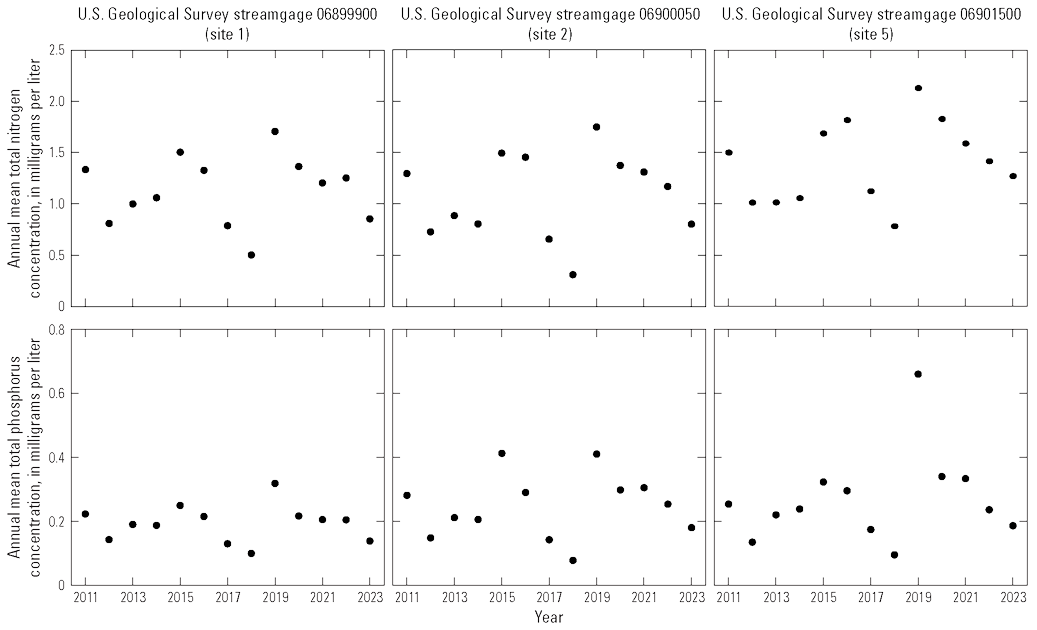
Graphs showing annual mean total nitrogen and total phosphorus concentrations for water years 2011 through 2023 at Mississippi River Basin Healthy Watersheds Initiative sites. The sites are U.S. Geological Survey streamgages 06899900 (Medicine Creek at Lucerne [site 1]), 06900050 (Medicine Creek near Laredo [site 2]), and 06901500 (Locust Creek near Linneus [site 5]) in Missouri.
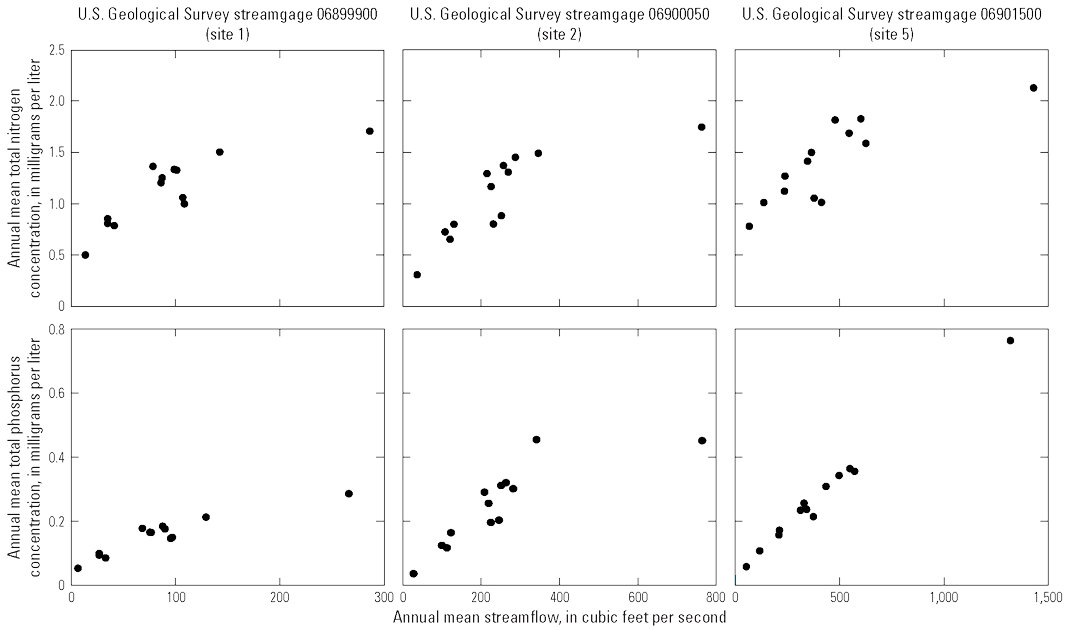
Graphs showing annual mean total nitrogen and total phosphorus concentrations versus annual mean streamflow for water years 2011 through 2023 for Mississippi River Basin Healthy Watersheds Initiative sites. The sites are U.S. Geological Survey streamgages 06899900 (Medicine Creek at Lucerne [site 1]), 06900050 (Medicine Creek near Laredo [site 2]), and 06901500 (Locust Creek near Linneus [site 5]) in Missouri.
Table 4.
Summary of Mann-Kendall test and Theil-Sen’s slopes (Helsel and others, 2020) for annual mean total nitrogen and total phosphorus concentrations for water years 2011 through 2023 at Mississippi River Basin Healthy Watersheds Initiative sites in Missouri.[ID, identifier; USGS, U.S. Geological Survey; TN, total nitrogen; TP, total phosphorus; tau, Kendall’s tau; p-value, statistical probability value; slope, Theil-Sen’s slope; (mg/L)/yr, milligram per liter per year]
Temporal Changes in Flow-Adjusted Nutrient Concentrations at Mississippi River Basin Healthy Watersheds Initiative Sites
FATN and FATP concentrations showed that small to negligible trends in nutrient sources occurred at most sites (fig. 4, table 5). No sites had a significant trend in FATN concentrations, and only one site (site 2) had a significant trend in FATP concentrations. A positive trend in FATP concentrations was detected at site 2, which indicates that sources of TP were likely increasing at this site. Although not significant, the slopes of the linear regressions for FATN were negative at each site, which indicates some possible reduction in TN sources in the Lower Grand. Taken together, these results hint at a potential for increasing phosphorus transport in recent years (especially at site 2) and the potential for a minor decrease in TN concentrations, but they generally indicate that streamflow variability was the most substantial factor affecting temporal changes in TN and TP concentrations at the MRBI sites.
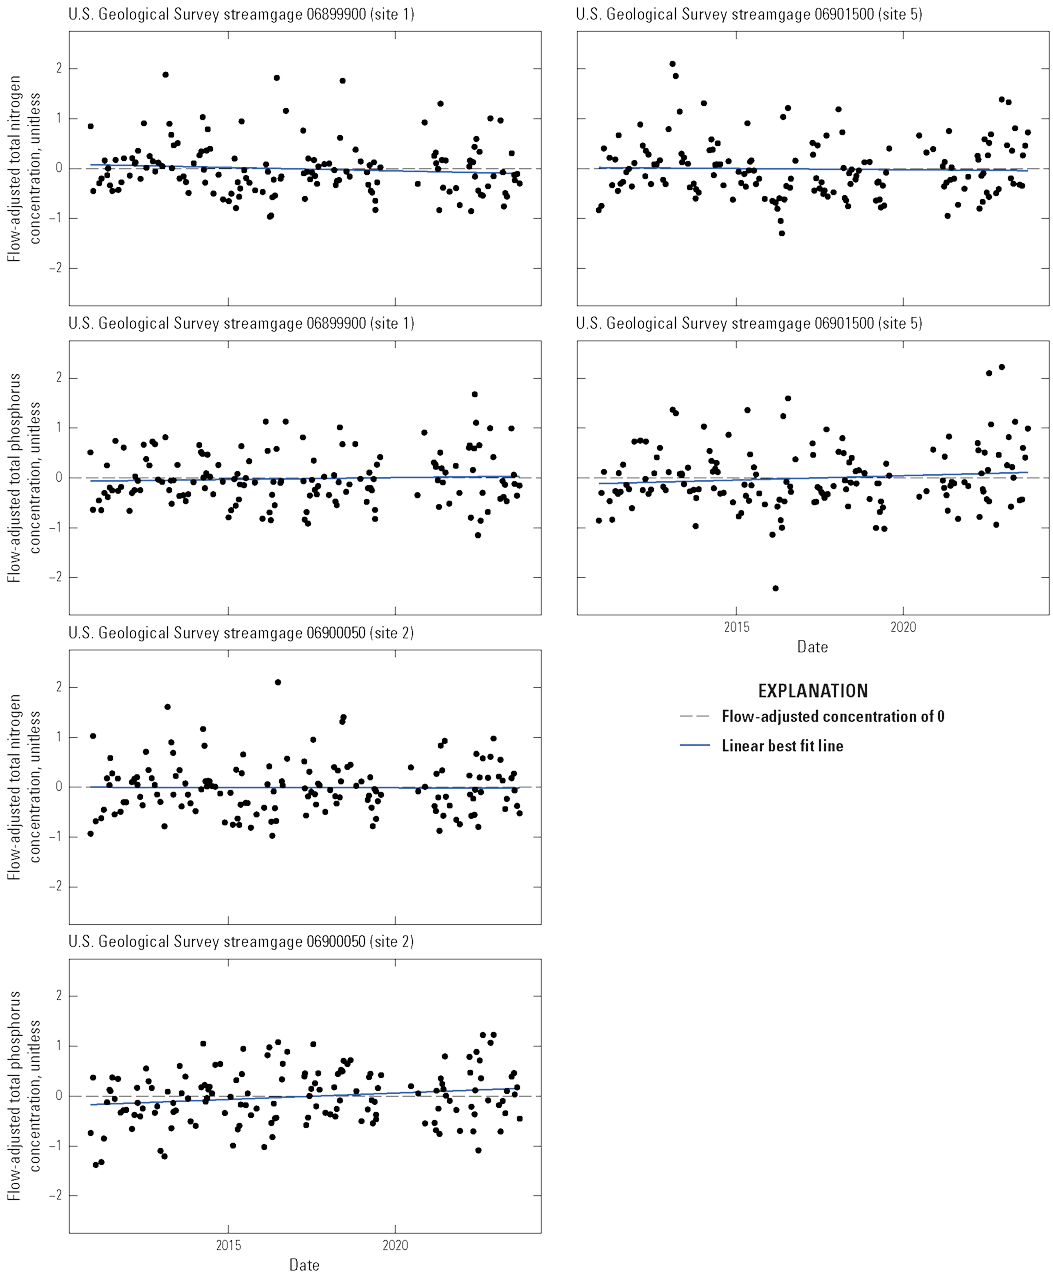
Graphs showing flow-adjusted total nitrogen and total phosphorous concentrations for water years 2011 through 2023 for Mississippi River Basin Healthy Watersheds Initiative sites. The sites are U.S. Geological Survey streamgages 06899900 (Medicine Creek at Lucerne [site 1]), 06900050 (Medicine Creek near Laredo [site 2]), and 06901500 (Locust Creek near Linneus [site 5]) in Missouri.
Table 5.
Summary of results from simple linear regressions of flow-adjusted concentrations versus time for each site and nutrient for water years 2011 through 2023 at Mississippi River Basin Healthy Watersheds Initiative sites in Missouri.[ID, identifier; USGS, U.S. Geological Survey, TN, total nitrogen; TP, total phosphorus; p-value, statistical probability value]
Temporal Changes in Annual Flow-Normalized Concentrations at Long-Term Sites
Visual inspection indicated temporal changes in annual FNTN concentrations were generally similar across the five long-term sites; however, the timing and strength of trends varied among sites (fig. 5A, B). Across sites 7–11, annual FNTN concentrations ranged from 1.23 to 4.26 mg/L (app. 1, table 1.4). In water year 2000, the sites ranked from highest to lowest annual FNTN concentrations as 7, 8, 11, 9, and 10, and this ranking did not change from water year 2000 to water year 2023 (fig. 5A, B). For water years 2000 through 2023, annual FNTN concentrations decreased at all sites (fig. 5A, B, table 6). During the 2010–23 period, the Missouri River sites (8 and 11) had the greatest percentage reductions in annual FNTN concentration (35 percent and 28 percent at sites 8 and 11, respectively). At sites 7, 8, and 11, the magnitude of change and the percentage of change in annual FNTN concentrations flipped from an increase during the 2000–10 period to a decrease during the 2010–23 period. At site 9, where nutrient trends would have the potential to be affected by the implemented conservation practices in the Lower Grand, a greater decrease in annual FNTN concentration was observed during the 2010–23 period (period containing the implementation of the MRBI) relative to the 2000–10 period (period prior to the MRBI). At site 10, annual FNTN concentrations declined after 2010, but this decline was of a lower magnitude than the decline during the 2000–10 period.
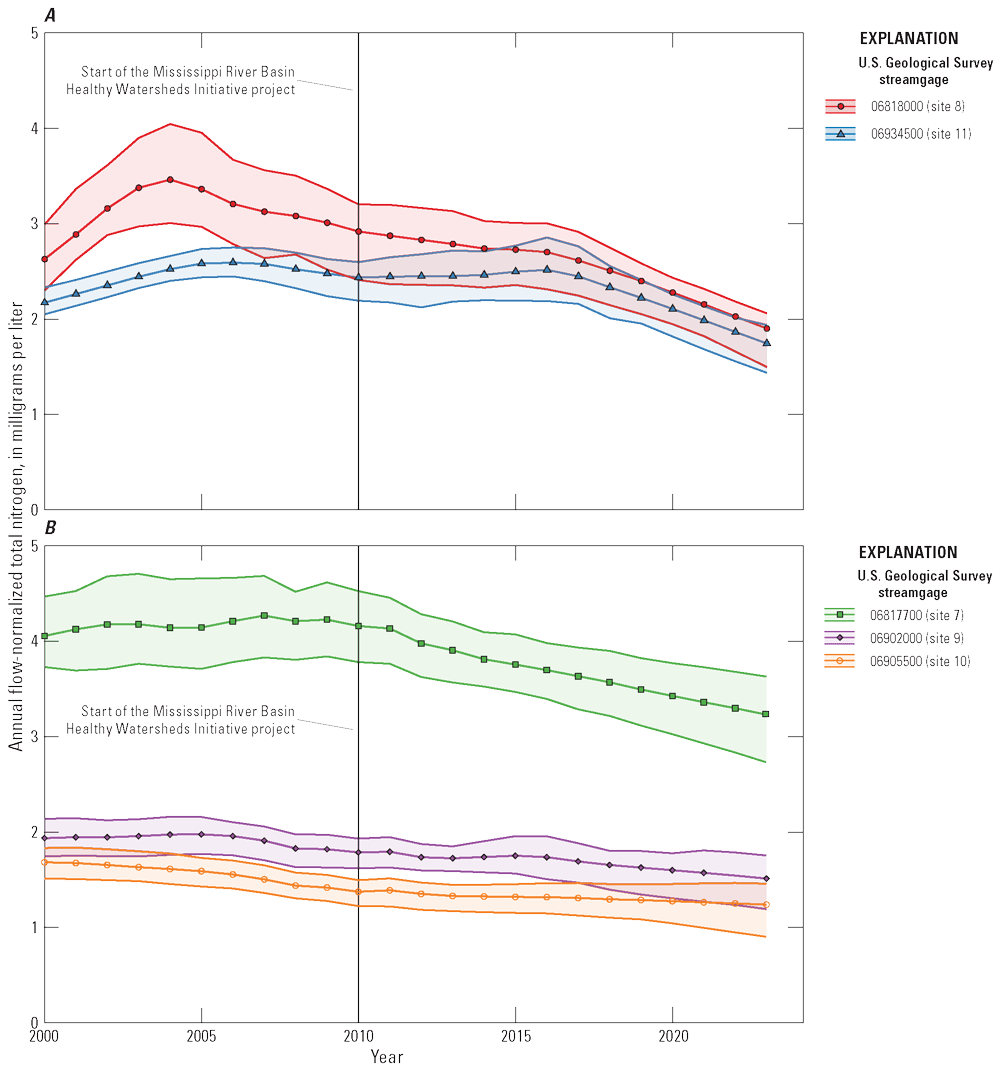
Graphs showing annual flow-normalized total nitrogen concentrations for (A) sites 8 and 11, Missouri River sites, and (B) sites 7, 9, and 10, Missouri River tributary sites. Shaded areas represent the 90-percent confidence intervals for the flow-normalized total nitrogen concentrations. The sites are U.S. Geological Survey streamgages 06818000 (Missouri River at St. Joseph [site 8]), 06934500 (Missouri River at Hermann [site 11]), 06817700 (Nodaway River near Graham [site 7]), 06902000 (Grand River near Sumner [site 9]), and 06905500 (Chariton River near Prairie Hill [site 10]) in Missouri.
Unlike FNTN concentrations, temporal changes in annual FNTP concentrations varied across the five sites since 2000 (fig. 6A, B). Annual FNTP concentrations ranged from 0.28 to 0.65 mg/L among the sites (app. 1, table 1.5). The order of sites from highest to lowest FNTP concentration also varied over the period (fig. 6A, B). Similar to the FNTN results, site 7 had the highest FNTP concentration over the whole period from 2000 to 2023. During the 2010–23 period, four of the sites indicated a decline in annual FNTP concentration (table 6). The exception was at site 10, which had a 7-percent increase during 2010–23. Sites 8 and 9 had the two greatest percentage reductions since the MRBI began in 2010 (−34 percent and −26 percent at sites 8 and 9, respectively). At all sites, except site 10, the magnitude of change and the percentage of change in annual FNTP concentrations flipped from an increase from 2000 to 2010 to a decrease from 2010 to 2023. This change to declining annual FNTP concentrations indicates that progress is being made in reducing TP across the study area. Even site 10, which had increases in FNTP concentration during 2010–23, did not have a substantial increase in annual FNTP concentration over the entire study period (2000–23). At site 9, annual FNTP concentrations declined at a rate of 2 percent per year from 2010 to 2023, which corresponds to a −26-percent change in FNTP concentration (table 6). This decrease is in direct contrast to the 1.6-percent-per-year increase in annual FNTP concentrations before the MRBI.
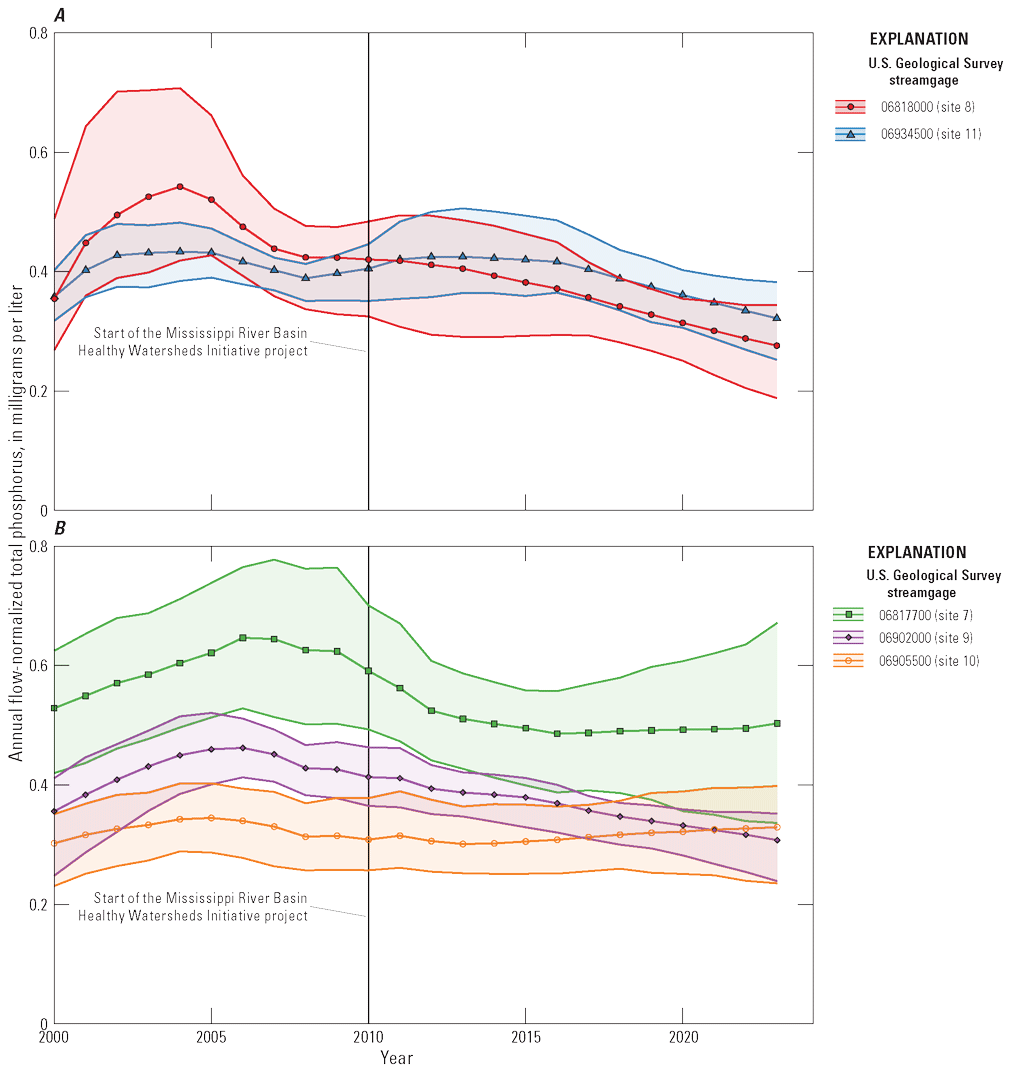
Graphs showing annual flow-normalized total phosphorus concentrations for (A) sites 8 and 11, Missouri River sites, and (B) sites 7, 9, and 10, Missouri River tributary sites. Shaded areas represent the 90-percent confidence intervals for the flow-normalized total nitrogen concentrations. The sites are U.S. Geological Survey streamgages 06818000 (Missouri River at St. Joseph [site 8]), 06934500 (Missouri River at Hermann [site 11]), 06817700 (Nodaway River near Graham [site 7]), 06902000 (Grand River near Sumner [site 9]), and 06905500 (Chariton River near Prairie Hill [site 10]) in Missouri.
Table 6.
Changes in annual flow-normalized total nitrogen and total phosphorus concentrations for water years 2000 through 2023 at each of the five long-term sites in Missouri.[ID, identifier; USGS, U.S. Geological Survey; TN, total nitrogen; TP, total phosphorus; FN, flow normalized; mg/L, milligram per liter; %, percent]
Nutrient Dynamics Within the Lower Grand During the Mississippi River Basin Healthy Watersheds Initiative
The analysis of TN and TP concentrations provided two key insights for nutrient transport in the Lower Grand. First, the continued positive relation between annual mean TN and TP concentration and streamflow (fig. 3) further supported the initial conclusion from Krempa and Flickinger (2017) that most of the stream nitrogen and phosphorus are derived from nonpoint sources. Second, the generally stable FATN and FATP concentrations indicated that changes in nutrient delivery have not been detected in the Lower Grand regardless of streamflow conditions. Together, these results indicate that neither the magnitude nor the transport of nutrients in the Lower Grand has changed substantially since 2010.
Although the results indicate that nutrient concentrations in the Lower Grand have not changed substantially, the conservation practices implemented as part of the MRBI may still be reducing nutrients. Additional monitoring could inform whether there is an observable trend in nutrient reduction because of the MRBI. The noise associated with water-quality data because of variations in streamflow can make parsing out the long-term trend or signal in nutrient dynamics difficult without 15–20 years of data (refer to the data requirements for the commonly used WRTDS model [Hirsch and others, 2010]). Additionally, stream nutrient concentrations may respond slowly to changes in nutrient inputs because of a large storage of nutrients within the drainage basin resulting from decades of nutrient surpluses (Van Meter and Basu, 2015; Vero and others, 2018). As of 2024, the water-quality dataset for the MRBI sites includes 13 years of water-quality samples (minimal samples were collected in 2020 because of the global pandemic). Thus, the potential to begin quantifying a long-term trend with 2–7 more years of data exists. Furthermore, continuous sensors were installed at these sites in 2020 to allow for more accurate estimates of annual nutrient concentrations and loads moving forward.
Nutrient Dynamics in the Grand River and Similar Nearby Tributaries During the Mississippi River Basin Healthy Watersheds Initiative
Since 2010, negative trends in annual FNTN concentrations have been detected at all long-term sites (table 6). The Grand River (site 9), which includes the Lower Grand, had greater reductions in FNTN concentrations than the adjacent Chariton River (site 10) but lower reductions than the nearby Nodaway River (site 7). Furthermore, the Missouri River sites (sites 8 and 11) also had substantial declines in annual FNTN concentrations. These results indicate a regional reduction of TN concentrations in northwestern Missouri drainage basins and that the Grand River generally follows this broader trend. For annual FNTP concentration trends, the Grand River had slightly greater reductions than the Nodaway River and much greater reductions than the Chariton River—a site that had an increase in annual FNTP concentration. In 2023, the annual FNTP concentration in the Grand River, which had declined to 0.31 mg/L, was now lower than the annual FNTP concentration in the Chariton River, which had increased to 0.33 mg/L in 2023. Similar to annual FNTN concentrations, the Missouri River sites indicated substantial declines in annual FNTP concentration since 2010, indicating a regional reduction in TP concentrations.
As previously mentioned, the drainage area to site 9 includes the Grand River drainage basin, not only the Lower Grand area included in the MRBI. The nutrient concentration reductions in the long-term trends of site 9 may hint at improved water quality because of the implementation of conservation practices in the basin. However, similar trends in the Nodaway and Missouri Rivers indicated that the long-term reduction of stream TN and TP detected in the Grand River was not limited to the Grand River. Additionally, the stable or increasing stream nutrient concentrations at the MRBI sites indicated that the conservation practices implemented under the MRBI may not have been a major factor in the decline of TN and TP at site 9. It is unknown how much of the stream nutrient concentration reductions at site 9 were due to conservation practices versus broader changes in agricultural practices in northwestern Missouri.
Summary
This study evaluated temporal changes in total nitrogen (TN) and total phosphorus (TP) concentrations at selected sites in the Lower Grand and regional sites across northwestern Missouri for water years 2010 through 2023. At the three Mississippi River Basin Healthy Watersheds Initiative (MRBI) sites in the Lower Grand, annual mean concentrations and flow-adjusted concentrations were used to assess nutrient concentration variability and potential changes in nutrient sources. At the six long-term U.S. Geological Survey (USGS) monitoring sites, flow-normalized (FN) concentrations were estimated using the Weighted Regressions of Time, Discharge, and Season method to evaluate nutrient trends before and during the MRBI period.
At MRBI sites, annual mean TN and TP concentrations were positively related to streamflow and flow-adjusted TN and flow-adjusted TP concentrations were stable to slightly increasing. These results indicate that the source, magnitude, and transport of nutrients in the Lower Grand have not changed substantially since 2010. Continued monitoring may help to more definitively assess long-term trends in nutrient concentrations within the Lower Grand River hydrologic unit. At the Grand River long-term site (site 9; USGS streamgage 06902000; Grand River near Sumner, Missouri), annual FNTN and FNTP concentrations declined from 2010 to 2023, with the rate of this decline increasing since the start of the MRBI. These reductions were greater than those at the adjacent Chariton River (site 10; USGS streamgage 06905500; Chariton River near Prairie Hill, Mo.), which was not part of the MRBI. However, similar reductions in nutrient concentrations were observed at the other long-term sites during this period, including sites 7 (USGS streamgage 06817700; Nodaway River near Graham, Mo.), 8 (USGS streamgage 06818000; Missouri River at St. Joseph, Mo.), and 11 (USGS streamgage 06934500; Missouri River at Hermann, Mo.). The similar reductions in FNTN and FNTP concentrations across long-term sites, combined with the relatively minor changes in nutrient concentrations observed at the MRBI sites, suggest that while conservation practices in the Lower Grand may be contributing to nutrient reductions, broader regional factors may also be affecting nutrient trends in the Grand River. Continued monitoring may help to quantitatively determine trends in stream nutrient concentrations at the MRBI sites.
References Cited
Breitburg, D., Levin, L.A., Oschlies, A., Grégoire, M., Chavez, F.P., Conley, D.J., Garçon, V., Gilbert, D., Gutiérrez, D., Isensee, K., Jacinto, G.S., Limburg, K.E., Montes, I., Naqvi, S.W.A., Pitcher, G.C., Rabalais, N.N., Roman, M.R., Rose, K.A., Seibel, B.A., Telszewski, M., Yasuhara, M., and Zhang, J., 2018, Declining oxygen in the global ocean and coastal waters: Science, v. 359, no. 6371, article eaam7240, 11 p., accessed May 2, 2024, at https://doi.org/10.1126/science.aam7240.
Brown, T.C., and Froemke, P., 2012, Nationwide assessment of nonpoint source threats to water quality: BioScience, v. 62, no. 2, p. 136–146, accessed May 3, 2024, at https://doi.org/10.1525/bio.2012.62.2.7.
Cavanaugh, J.E., Neath, A.A., 2019, The Akaike information criterion: Background, derivation, properties, application, interpretation, and refinements: WIREs Computational Statistics, v. 11, no. 3, accessed September 23, 2025, at https://doi.org/10.1002/wics.1460.
Chanat, J.G., Moyer, D.L., Blomquist, J.D., Hyer, K.E., and Langland, M.J., 2016, Application of a weighted regression model for reporting nutrient and sediment concentrations, fluxes, and trends in concentration and flux for the Chesapeake Bay Nontidal Water-Quality Monitoring Network, results through water year 2012: U.S. Geological Survey Scientific Investigations Report 2015–5133, 76 p., accessed May 3, 2024, at https://doi.org/10.3133/sir20155133.
Crawford, C.G., Slack, J.R., and Hirsch, R.M., 1983, Nonparametric tests for trends in water-quality data using the statistical analysis system: U.S. Geological Survey Open-File Report 83–550, 102 p., accessed May 2, 2024, at https://doi.org/10.3133/ofr83550.
Femmer, S.R., 2012, Algal community characteristics and response to nitrogen and phosphorus concentrations in streams in the Ozark Plateaus, Southern Missouri, 1993–95 and 2006–07: U.S. Geological Survey Scientific Investigations Report 2011–5209, 25 p., accessed April 8, 2024, at https://doi.org/10.3133/sir20115209.
Fishman, M.J., ed., 1993, Methods of analysis by the U.S. Geological Survey National Water Quality Laboratory—Determination of inorganic and organic constituents in water and fluvial sediments: U.S. Geological Survey Open-File Report 93–125, 217 p., accessed April 24, 2024, at https://doi.org/10.3133/ofr93125.
Fishman, M.J., Raese, J.W., Gerlitz, C.N., and Husband, R.A., 1994, U.S. Geological Survey approved inorganic and organic methods for the analysis of water and fluvial sediment, 1954–94: U.S. Geological Survey Open-File Report 94–351, accessed April 24, 2024, at https://doi.org/10.3133/ofr94351.
Heimann, D.C., Sprague, L.A., and Blevins, D.W., 2011, Trends in suspended-sediment loads and concentrations in the Mississippi River Basin, 1950–2009: U.S. Geological Survey Scientific Investigations Report 2011–5200, 33 p., accessed May 2, 2024, at https://doi.org/10.3133/sir20115200.
Helsel, D.R., Hirsch, R.M., Ryberg, K.R., Archfield, S.A., and Gilroy, E.J., 2020, Statistical methods in water resources: U.S. Geological Survey Techniques and Methods, book 4, chap. A3, [Supersedes USGS Techniques of Water-Resources Investigations, book 4, chap. A3, version 1.1.], 458 p., accessed September 23, 2025, at https://doi.org/10.3133/tm4A3.
Hirsch, R.M., DeCicco, L.A., and Murphy, J.C., 2023, Exploration and Graphics for RivEr Trends (EGRET) (ver. 3.0.9): U.S. Geological Survey software release, accessed May 2, 2024, at https://doi.org/10.5066/P9CC9JEX.
Hirsch, R.M., Moyer, D.L., and Archfield, S.A., 2010, Weighted Regressions on Time, Discharge, and Season (WRTDS), with an application to Chesapeake Bay river inputs: Journal of the American Water Resources Association, v. 46, no. 5, p. 857–880, accessed April 24, 2024, at https://doi.org/10.1111/j.1752-1688.2010.00482.x.
Kamrath, B.J.W., Lauderback, C.N., and Murphy, J.C., 2025, Archive of the load estimation models used in the analyses of temporal changes in nutrient concentrations in the Lower Grand River and selected drainage basins, Missouri and Iowa (2010–23): U.S. Geological Survey data release, https://doi.org/10.5066/P13FQ2YN.
Kirk, L., Compton, J.E., Neale, A., Sabo, R.D., and Christensen, J., 2024, Our national nutrient reduction needs—Applying a conservation prioritization framework to US agricultural lands: Journal of Environmental Management, v. 351, article 119758, 13 p., accessed April 24, 2024, at https://doi.org/10.1016/j.jenvman.2023.119758.
Krempa, H.M., and Flickinger, A.K., 2017, Temporal changes in nitrogen and phosphorus concentrations with comparisons to conservation practices and agricultural activities in the Lower Grand River, Missouri and Iowa, and selected watersheds, 1969–2015: U.S. Geological Survey Scientific Investigations Report 2017–5067, 28 p., accessed April 8, 2024, at https://doi.org/10.3133/sir20175067.
Liu, Y., Engel, B.A., Flanagan, D.C., Gitau, M.W., McMillan, S.K., and Chaubey, I., 2017, A review on effectiveness of best management practices in improving hydrology and water quality—Needs and opportunities: Science of the Total Environment, v. 601–602, p. 580–593, accessed May 2, 2024, at https://doi.org/10.1016/j.scitotenv.2017.05.212.
Lu, C., Zhang, J., Tian, H., Crumpton, W.G., Helmers, M.J., Cai, W.-J., Hopkinson, C.S., and Lohrenz, S.E., 2020, Increased extreme precipitation challenges nitrogen load management to the Gulf of Mexico: Communications Earth & Environment, v. 1, no. 21, 9 p., accessed May 2, 2024, at https://doi.org/10.1038/s43247-020-00020-7.
Marchetto, A., 2024, rkt—Mann-Kendall test, seasonal and regional Kendall tests (ver. 1.7): R Foundation for Statistical Computing software release, accessed May 3, 2024, at https://cran.r-project.org/web/packages/rkt/index.html.
Natural Resources Conservation Service, 2023, Mississippi River Basin Healthy Watersheds Initiative: Natural Resources Conservation Service web page, accessed April 9, 2024, at https://www.nrcs.usda.gov/programs-initiatives/mississippi-river-basin-healthy-watersheds-initiative.
Natural Resources Conservation Service, 2024, Conservation practice physical effects: Natural Resources Conservation Service web page, accessed April 9, 2024, at https://www.nrcs.usda.gov/resources/guides-and-instructions/conservation-practice-physical-effects.
Osmond, D., Meals, D., Hoag, D., Arabi, M., Luloff, A., Jennings, G., McFarland, M., Spooner, J., Sharpley, A., and Line, D., 2012, Improving conservation practices programming to protect water quality in agricultural watersheds—Lessons learned from the National Institute of Food and Agriculture-Conservation Effects Assessment Project: Journal of Soil and Water Conservation, v. 67, no. 5, p. 122A–127A, accessed May 3, 2024, at https://doi.org/10.2489/jswc.67.5.122A.
Patton, C.J., and Kryskalla, J.R., 2003, Methods of analysis by the U.S. Geological Survey National Water Quality Laboratory—Evaluation of alkaline persulfate digestion as an alternative to Kjeldahl digestion for determination of total and dissolved nitrogen and phosphorus in water: U.S. Geological Survey Water-Resources Investigations Report 2003–4174, 33 p., accessed April 24, 2024, at https://doi.org/10.3133/wri034174.
Patton, C.J., and Kryskalla, J.R., 2011, Colorimetric determination of nitrate plus nitrite in water by enzymatic reduction, automated discrete analyzer methods: U.S. Geological Survey Techniques and Methods, book 5, chap. B8, 34 p., accessed April 24, 2024, at https://doi.org/10.3133/tm5B8.
Patton, C.J., and Truitt, E.P., 1992, Methods of analysis by the U.S. Geological Survey National Water Quality Laboratory—Determination of the total phosphorus by a Kjeldahl digestion method and an automated colorimetric finish that includes dialysis: U.S. Geological Survey Open-File Report 92–146, 39 p., accessed April 24, 2024, at https://doi.org/10.3133/ofr92146.
Patton, C.J., and Truitt, E.P., 2000, Methods of analysis by the U.S. Geological Survey National Water Quality Laboratory—Determination of ammonium plus organic nitrogen by a Kjeldahl digestion method and an automated photometric finish that includes digest cleanup by gas diffusion: U.S. Geological Survey Open-File Report 2000–170, 31 p., accessed April 24, 2024, at https://doi.org/10.3133/ofr00170.
Rabalais, N.N., Díaz, R.J., Levin, L.A., Turner, R.E., Gilbert, D., and Zhang, J., 2010, Dynamics and distribution of natural and human-caused hypoxia: Biogeosciences, v. 7, no. 2, p. 585–619, accessed May 2, 2024, at https://doi.org/10.5194/bg-7-585-2010.
Rabalais, N.N., Turner, R.E., and Wiseman, W.J., Jr., 2002, Gulf of Mexico hypoxia, A.K.A. “the dead zone”: Annual Review of Ecology, Evolution, and Systematics, v. 33, p. 235–263, accessed May 2, 2024, at https://doi.org/10.1146/annurev.ecolsys.33.010802.150513.
Rowland, F.E., Stow, C.A., Johnson, L.T., and Hirsch, R.M., 2021, Lake Erie tributary nutrient trend evaluation—Normalizing concentrations and loads to reduce flow variability: Ecological Indicators, v. 125, article 107601, 8 p., accessed May 2, 2024, at https://doi.org/10.1016/j.ecolind.2021.107601.
Ryberg, K.R., and Vecchia, A.V., 2017, waterData—Retrieval, analysis, and anomaly calculation of daily hydrologic time series data (ver. 1.0.8): U.S. Geological Survey software release, accessed April 24, 2024, at https://rdrr.io/github/USGS-R/waterData/.
Simpson, Z.P., and Haggard, B.E., 2018, Optimizing the flow adjustment of constituent concentrations via LOESS for trend analysis: Environmental Monitoring and Assessment, v. 190, no. 103, 12 p., accessed September 10, 2024, at https://doi.org/10.1007/s10661-018-6461-5.
Sinha, E., Michalak, A.M., and Balaji, V., 2017, Eutrophication will increase during the 21st century as a result of precipitation changes: Science, v. 357, no. 6349, p. 405–408, accessed May 3, 2024, at https://doi.org/10.1126/science.aan2409.
Sprague, L.A., Hirsch, R.M., and Aulenbach, B.T., 2011, Nitrate in the Mississippi River and its tributaries, 1980 to 2008—Are we making progress?: Environmental Science & Technology, v. 45, no. 17, p. 7209–7216, accessed April 9, 2024, at https://doi.org/10.1021/es201221s.
Stenback, G.A., Crumpton, W.G., Schilling, K.E., and Helmers, M.J., 2011, Rating curve estimation of nutrient loads in Iowa rivers: Journal of Hydrology, v. 396, nos. 1–2, p. 158–169, accessed May 3, 2024, at https://doi.org/10.1016/j.jhydrol.2010.11.006.
Stephenson, K., Shabman, L., Shortle, J., and Easton, Z., 2022, Confronting our agricultural nonpoint source control policy problem: Journal of the American Water Resources Association, v. 58, no. 4, p. 496–501, accessed May 2, 2024, at https://doi.org/10.1111/1752-1688.13010.
Therneau, T.M., 2024, A package for survival analysis in R (ver. 3.6–4): R Foundation for Statistical Computing software release, accessed April 24, 2024, at https://CRAN.R-project.org/package=survival.
Tomer, M.D., and Locke, M.A., 2011, The challenge of documenting water quality benefits of conservation practices—A review of USDA-ARS’s conservation effects assessment project watershed studies: Water Science and Technology, v. 64, no. 1, p. 300–310, accessed May 7, 2024, at https://doi.org/10.2166/wst.2011.555.
Turnipseed, D.P., and Sauer, V.B., 2010, Discharge measurements at gaging stations: U.S. Geological Survey Techniques and Methods, book 3, chap. A8, 87 p., accessed July 16, 2025, at https://doi.org/10.3133/tm3A8.
U.S. Environmental Protection Agency, 1993, Method 365.1, revision 2.0—Determination of phosphorus by semi-automated colorimetry: U.S. Environmental Protection Agency, 17 p., accessed April 24, 2024, at https://www.epa.gov/sites/default/files/2015-08/documents/method_365-1_1993.pdf.
U.S. Environmental Protection Agency, 2014, Mississippi River Gulf of Mexico watershed nutrient task force new goal framework: U.S. Environmental Protection Agency, 4 p., accessed April 24, 2024, at https://www.epa.gov/sites/default/files/2015-07/documents/htf-goals-framework-2015.pdf.
U.S. Environmental Protection Agency, 2017, National Water Quality Inventory—Report to Congress: U.S. Environmental Protection Agency report EPA 841–R–16–011, 21 p., accessed May 3, 2024, at https://www.epa.gov/sites/default/files/2017-12/documents/305brtc_finalowow_08302017.pdf.
U.S. Geological Survey, 2024, USGS water data for the Nation: U.S. Geological Survey National Water Information System database, accessed May 3, 2024, at https://doi.org/10.5066/F7P55KJN.
U.S. Geological Survey, [variously dated], National field manual for the collection of water-quality data: U.S. Geological Survey Techniques of Water-Resources Investigations, book 9, chaps. A1–A10, [variously paged], accessed April 24, 2024, at https://doi.org/10.3133/twri09.
Van Meter, K.J., and Basu, N.B., 2015, Catchment legacies and time lags—A parsimonious watershed model to predict the effects of legacy storage on nitrogen export: PLoS One, v. 10, no. 5, article e0125971, 22 p., accessed May 7, 2024, at https://doi.org/10.1371/journal.pone.0125971.
Vero, S.E., Basu, N.B., Van Meter, K., Richards, K.G., Mellander, P.-E., Healy, M.G., and Fenton, O., 2018, Review—The environmental status and implications of the nitrate time lag in Europe and North America: Hydrogeology Journal, v. 26, p. 7–22, accessed May 7, 2024, at https://doi.org/10.1007/s10040-017-1650-9.
Webber, J., Chanat, J., Clune, J., Devereux, O., Hall, N., Sabo, R.D., and Zhang, Q., 2024, Evaluating water-quality trends in agricultural watersheds prioritized for management-practice implementation: Journal of the American Water Resources Association, v. 60, no. 2, p. 305–330, accessed May 2, 2024, at https://doi.org/10.1111/1752-1688.13197.
White, K.L., Haggard, B.E., and Chaubey, I., 2004, Water quality at the Buffalo National River, Arkansas, 1991–2001: Transactions of the ASAE, v. 47, no. 2, p. 407–417, accessed September 10, 2024, at https://doi.org/10.13031/2013.16042.
Appendix 1. Supplemental Data for Selected Sites in Missouri and Iowa
References Cited
Kamrath, B.J.W., Lauderback, C.N., and Murphy, J.C., 2025, Archive of the load estimation models used in the analyses of temporal changes in nutrient concentrations in the Lower Grand River and selected drainage basins, Missouri and Iowa (2010–23): U.S. Geological Survey data release, https://doi.org/10.5066/P13FQ2YN.
U.S. Geological Survey, 2024, USGS water data for the Nation: U.S. Geological Survey National Water Information System database, accessed May 3, 2024, at https://doi.org/10.5066/F7P55KJN.
Conversion Factors
International System of Units to U.S. customary units
Datums
Vertical coordinate information is referenced to the North American Vertical Datum of 1988 (NAVD 88).
Horizontal coordinate information is referenced to the North American Datum of 1983 (NAD 83).
Supplemental Information
Concentrations of chemical constituents in water are in milligrams per liter (mg/L).
Model estimates of daily total nitrogen and total phosphorus loads are in kilograms per day (kg/d).
Slopes are given in milligrams per liter per year ([mg/L]/yr).
A water year is the 12-month period from October 1 through September 30 of the following year and is designated by the calendar year in which it ends.
Abbreviations
CI
confidence interval
FA
flow adjusted
FN
flow normalized
LOESS
locally estimated scatterplot smoothing
log
logarithm
MRBI
Mississippi River Basin Healthy Watersheds Initiative
NRCS
Natural Resources Conservation Service
NWIS
National Water Information System
p-value
statistical probability value
TN
total nitrogen
TP
total phosphorus
USGS
U.S. Geological Survey
WRTDS
Weighted Regressions on Time, Discharge, and Season
For more information about this publication, contact:
Director, USGS Central Midwest Water Science Center
405 North Goodwin
Urbana, IL 61801
217–328–8747
For additional information, visit: https://www.usgs.gov/centers/cm-water
Publishing support provided by the
USGS Science Publishing Network
Rolla and Reston Publishing Service Centers
Disclaimers
Any use of trade, firm, or product names is for descriptive purposes only and does not imply endorsement by the U.S. Government.
Although this information product, for the most part, is in the public domain, it also may contain copyrighted materials as noted in the text. Permission to reproduce copyrighted items must be secured from the copyright owner.
Suggested Citation
Kamrath, B.J.W., Lauderback, C.N., and Murphy, J.C., 2025, Temporal changes in nutrient concentrations in the Lower Grand River and selected drainage basins, Missouri and Iowa, during the Mississippi River Basin Healthy Watersheds Initiative (2010–23): U.S. Geological Survey Scientific Investigations Report 2025–5099, 19 p., https://doi.org/10.3133/sir20255099.
ISSN: 2328-0328 (online)
Study Area
| Publication type | Report |
|---|---|
| Publication Subtype | USGS Numbered Series |
| Title | Temporal changes in nutrient concentrations in the Lower Grand River and selected drainage basins, Missouri and Iowa, during the Mississippi River Basin Healthy Watersheds Initiative (2010–23) |
| Series title | Scientific Investigations Report |
| Series number | 2025-5099 |
| DOI | 10.3133/sir20255099 |
| Publication Date | November 26, 2025 |
| Year Published | 2025 |
| Language | English |
| Publisher | U.S. Geological Survey |
| Publisher location | Reston, VA |
| Contributing office(s) | Central Midwest Water Science Center |
| Description | Report: vii, 19 p.; 5 Linked Tables; Data Release; Dataset |
| Country | United States |
| State | Iowa, Missouri |
| Other Geospatial | Lower Grand River |
| Online Only (Y/N) | Y |
| Additional Online Files (Y/N) | Y |