

Evaluation of Water Quality in the Langford Valley–Irwin Groundwater Subbasin, Fort Irwin National Training Center, California, 1993–2019
Links
- Document: Report (5 MB pdf) , HTML , XML
- Data Release: USGS data release - Water-quality data for treated drinking water and treated wastewater effluent at Fort Irwin National Training Center
- NGMDB Index Page: National Geologic Map Database Index Page (html)
- Download citation as: RIS | Dublin Core
Acknowledgments
The authors thank U.S. Army Fort Irwin National Training Center personnel Justine Dishart, Clarence Everly, Chris Woodruff, Paul Gregorio, and David Housman for providing pumpage data, practical knowledge about irrigation practices, and funding for this study. The authors also thank Edgar Ortusiastigue, Jacobs Solutions, Inc., for data about treated wastewater disposal and irrigation practices.
Abstract
The U.S. Army Fort Irwin National Training Center (NTC), 120 miles northeast of Los Angeles in the Mojave Desert of California, obtains its potable water supply from the Bicycle Valley and Langford Valley groundwater basins; Langford Valley groundwater basin is further subdivided into the Langford Well Lake and Irwin groundwater subbasins. The Irwin groundwater subbasin contains younger, unconsolidated deposits that have a saturated thickness of as much as 200 feet (ft) and a lower aquifer within older unconsolidated deposits as thick as 650 ft. Groundwater recharge under predevelopment conditions (before 1941) occurred primarily from infiltration of intermittent streamflow in small washes that cross the Irwin groundwater subbasin. Since that time, groundwater recharge has increased because of growth of the NTC in recent years and as a result of other processes, including (1) infiltration of treated wastewater into the aquifer through ponds near the NTC wastewater treatment facility (WWTF) and (2) infiltration of imported water and treated wastewater used for landscape irrigation at base housing and athletic fields.
Water samples were collected from 17 wells and analyzed for field parameters, chemical constituents, and isotope composition in the Irwin groundwater subbasin between 2014 and 2019. These data were supplemented with water-chemistry data collected during 1993–95 and at other times if available. Between 1993–95 and 2015–19, median dissolved solids and nitrate concentrations in water from wells in the Irwin groundwater subbasin increased from 620 to 1,030 milligrams per liter (mg/L) and from 2.8 to 4.5 mg/L as nitrogen, respectively. After 2014, dissolved solids and nitrate concentrations in water from wells near the NTC WWTF decreased as a result of changes in source water quality attributable to reverse osmosis of treated drinking water delivered within the Irwin groundwater subbasin and to increased levels of treatment at the NTC WWTF. Based on delta oxygen-18 and delta deuterium isotope data, increases in dissolved solids concentrations in water from most wells were consistent with evaporation prior to recharge and mobilization of soluble salts from the unsaturated zone. Arsenic and fluoride concentrations in water from wells decreased between 1993–95 and 2015–19 as the basin filled with treated wastewater, but 2015–19 concentrations generally exceeded the California State Water Resources Control Board maximum contaminant levels of 10 micrograms per liter for arsenic and 2 mg/L for fluoride. Most groundwater in the Irwin groundwater subbasin has unadjusted carbon-14 ages ranging from 18,400 to 12,350 years before present. However, water from well 10E3, located along the wash near the subbasin outflow in the southeastern part of the Irwin groundwater subbasin, contained measurable tritium, which is consistent with infiltration of intermittent streamflow and groundwater recharge from the wash after 1952. Chemical and isotopic data indicate that treated wastewater is present in water from most wells in the upper aquifer that underlies the Irwin groundwater subbasin. Wells were not sampled to adequately determine the extent of treated wastewater and changes in water quality within the lower aquifer that underlies the Irwin groundwater subbasin.
Introduction
The U.S. Army Fort Irwin National Training Center (NTC), 120 miles (mi) northeast of Los Angeles, is composed of 1,177 square miles within the Mojave Desert of California. Potable water for the NTC is pumped from the Bicycle Valley (basin number 6-025) and Langford Valley (basin number 6-036) groundwater basins; the Langford Valley groundwater basin is further subdivided into the Langford Well Lake (basin number 6-036.01) and Irwin (basin number 6-036.02; fig. 1; California Department of Water Resources, 2021) groundwater subbasins (henceforth referred to as the “Langford Well Lake subbasin” and the “Irwin subbasin,” respectively). Most of the water pumped for supply is used within the Irwin subbasin.
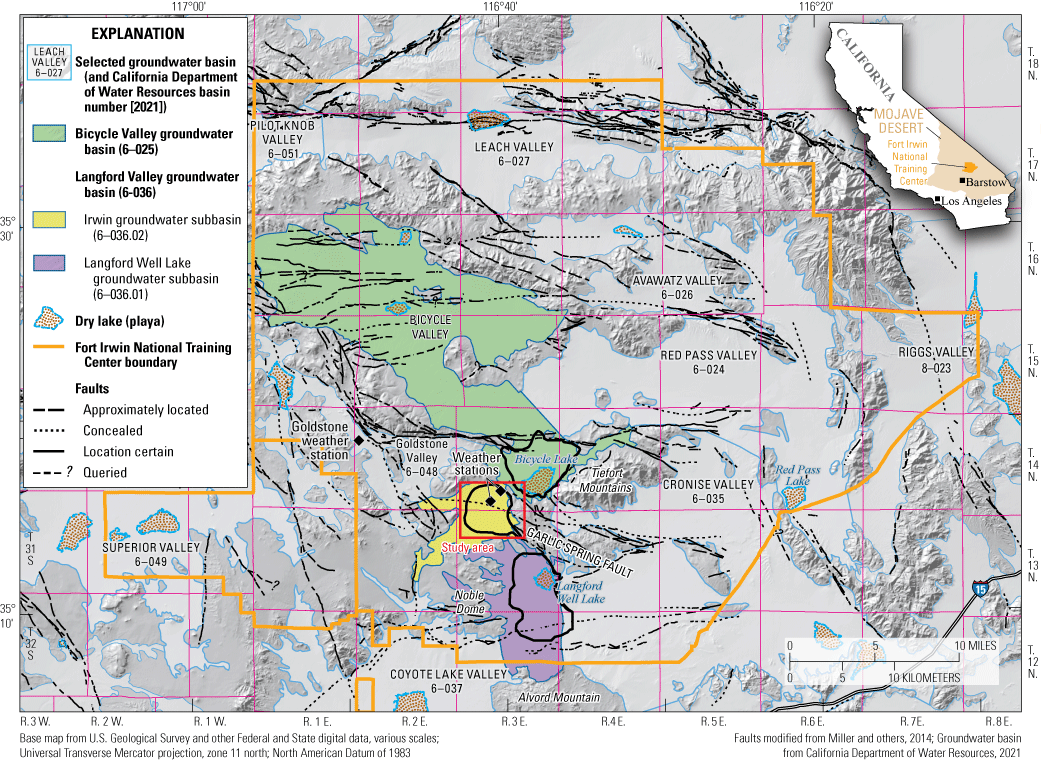
Location of groundwater basins, faults, and weather stations at the U.S. Army Fort Irwin National Training Center, California.
In the Irwin subbasin, groundwater pumping exceeded recharge beginning in the early 1940s, resulting in groundwater-level declines (Voronin and others, 2014). However, importation of water from the Bicycle Valley groundwater basin (beginning in the mid-1960s) and Langford Well Lake subbasin (beginning in the early 1990s), and subsequent groundwater recharge of treated wastewater reversed the water-level declines and water levels in Irwin subbasin began to rise (Voronin and others, 2014). Water-quality changes occurred in some parts of the Irwin subbasin as a result of groundwater recharge from treated wastewater and irrigation practices (Densmore and Londquist, 1997).
The U.S. Geological Survey (USGS) has been studying water-resources issues at Fort Irwin since the early 1990s. One issue of concern is the effect of groundwater development, resulting from training and infrastructure expansion at the NTC, on water quality in the Irwin subbasin. In 2014, the USGS collaborated with the U.S. Army to monitor groundwater resources within the NTC. A groundwater-monitoring network was developed for the NTC that included water-level and water-quality data collection from selected wells in the Bicycle Valley and Langford Valley groundwater basins. This monitoring network was designed to provide data for evaluation of water-level and water-quality changes over time. Wells in the Irwin subbasin within this network include monitoring wells drilled by the USGS (Densmore and Londquist, 1997) and supply wells operated by the NTC (table 1; locations of wells are shown on fig. 2)
Table 1.
State well number, abbreviated State well number, U.S. Geological Survey (USGS) station number, well-construction data, data type, and 2019 water-level elevation for selected wells in the Langford Valley–Irwin groundwater subbasin, U.S. Army Fort Irwin National Training Center, California.[mm/dd/yyyy, month/day/year; NAVD 88, National Vertical Datum of 1988; USGS, U.S. Geological Survey; WL, water level; WQ, water quality; — no data]
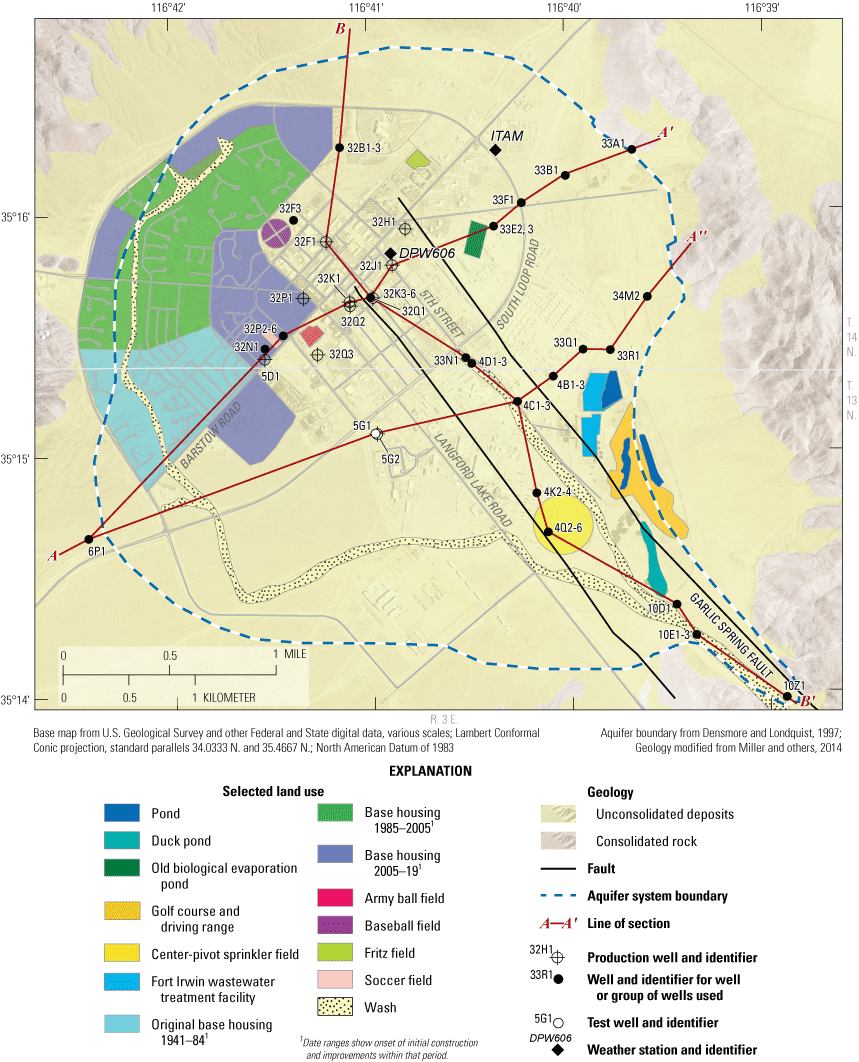
Geology, aquifer system boundary, location of wells (U.S. Geological Survey, 2019), selected land use (Voronin and others, 2014), and geologic section locations, shown on figure 3, in the Langford Valley–Irwin groundwater subbasin, U.S. Army Fort Irwin National Training Center, California. Modified from Densmore and Londquist (1997); well information from U.S. Geological Survey (2019).
Purpose and Scope
The purpose of this report was to evaluate changes in groundwater quality in the Irwin subbasin related to the disposal of treated wastewater and return water from irrigation at base housing landscaping and athletic fields with treated wastewater. This report examines changes in groundwater levels, major-ion compositions, dissolved solids, nitrates, and trace elements in groundwater in the Irwin subbasin between 1993 and 2019. Stable isotopes of oxygen and nitrogen, tritium, and carbon-14 are used to identify sources of groundwater. This study includes interpretation of data collected as part of the USGS study in the Irwin subbasin by Densmore and Londquist (1997) and data collected for this study (U.S. Geological Survey, 2019).
Accessing Data
The groundwater-level data presented in this report were accessed through the USGS National Water Information System Web service (NWISWeb) at (https://waterdata.usgs.gov/ca/nwis/gw/; U.S. Geological Survey, 2019). Water-quality data used in this study were retrieved from NWISWeb. Before publication of this report, the water level and water-quality data services on NWISWeb were decommissioned. The water-level data are now available at the USGS Water Data for the Nation website (https://waterdata.usgs.gov).The water-quality data are now available at the National Water Quality Monitoring Council’s Water Quality Data Portal (https://www.waterqualitydata.us). The temperature, pumping, recharge, and irrigation data presented in this report and provided by the NTC and Jacobs Solutions, Inc. personnel were not published at the time of this report. Original copies of these data are available upon request from the respective owners.
Background
The hydrogeology of the Irwin subbasin, including the effects of groundwater pumping and groundwater recharge with treated wastewater, on groundwater levels and movement are summarized in the following sections of this report. Previous USGS reports document changes in pumping, groundwater use, and recharge as a consequence of groundwater development beginning in 1941 and how those changes in water-management activities affected groundwater in the Irwin subbasin (table 2).
Table 2.
Summary of changes in groundwater and wastewater management practices between 1941 and 2016 and the effects of these changes on the groundwater system of the Langford Valley–Irwin groundwater subbasin, U.S. Army Fort Irwin National Training Center, California.| Year | Water-management change | Effect(s) on basin | References |
|---|---|---|---|
| 1941–55 | Irwin subbasin (exclusively) pumped for municipal and irrigation uses; wastewater disposed of in old biological evaporation ponds | Water levels decline over time; groundwater flows toward area of pumping | Densmore and Londquist (1997); Densmore (2003); Voronin and others (2014) |
| 1955 | Secondary treated wastewater from the Wastewater-Treatment Facility (WWTF) disposed of in percolation ponds and used to irrigate golf course/driving range and sprinkler-pivot area southwest of the WWTF (eastside basin) | Continued water-level declines | Densmore and Londquist (1997); Densmore (2003); Voronin and others (2014) |
| 1967 | Import of groundwater pumped from Bicycle Valley groundwater basin | Slight increase in water levels | Densmore and Londquist (1997); Densmore (2003); Densmore and others (2018) |
| 1990, 1994–99 | Highest basewide pumping rates since 1941 (3,016–3,250 acre-feet per year total) | Cone of depression developed near the center of the basin; pumping within Irwin subbasin reduced during this period | Densmore and Londquist (1997); Densmore (2003); Voronin and others (2014) |
| 1992 | Import of groundwater pumped from Langford Well subbasin | Water levels stabilize and begin to recover | Densmore and Londquist (1997); Densmore (2003); Voronin and others (2013) |
| 1996 | Sprinkler-pivot area, south of WWTF decommissioned | Recharge in sprinkler-pivot area ceases | Densmore and Londquist (1997); Densmore (2003); Voronin and others (2014) |
| 2002–07 | Landscaping changes to xeriscaping; most groundwater pumping is from Bicycle Valley groundwater basin | Reduced pumping from Irwin subbasin; total pumping continues to decline; groundwater levels continue to rise | Voronin and others (2014) |
| 2010 | Tertiary-treated wastewater is recycled and replaces some native groundwater resources for landscape irrigation | Reduced pumping of groundwater from Irwin subbasin | Voronin and others (2014) |
| 2015 | Soccer field converted to artificial turf and no longer irrigated | Less than 8 acres of irrigated area removed along west side of basin; water levels beginning to stabilize | See information in this report. |
| 2016 | Reduced pumping from Bicycle Valley groundwater basin; | Since 2017, the volume of groundwater pumped from Irwin subbasin increased relative to the total volume pumped from all basins (relative to the previous 20-year period) | See information in this report. |
| New Water Works plant provides treated drinking water with low total dissolved solids in Irwin subbasin |
Hydrogeologic Setting
The hydrogeologic setting of the Irwin subbasin was described by Densmore and Londquist (1997) and Densmore (2003). The Irwin subbasin contains unconsolidated deposits that consist of late Tertiary to Quaternary older alluvium and lacustrine (lake) deposits and Quaternary younger alluvium (Densmore, 2003). The deposits are unconsolidated at land surface and become partly consolidated with depth. Older and younger alluvium are the only water-bearing materials in the Irwin subbasin from which large amounts of groundwater can be pumped for water supply; these materials compose a lower aquifer and an upper aquifer in the Irwin subbasin, respectively. The upper aquifer is unconfined and consists of younger alluvium that has a maximum thickness of about 500 feet (ft) in the west-central part of the basin (fig. 3). Much of the younger alluvium is above the regional water table, and the maximum saturated thickness of the upper aquifer is about 200 ft (fig. 3). The lower aquifer consists of Quaternary-Tertiary deposits (older alluvium and lacustrine deposits) and is confined throughout most of the basin. The unconsolidated deposits that compose the upper and lower aquifers are underlain by a basement complex (fig. 3) composed of igneous and metamorphic rocks, which yield only small amounts of water to wells, except in areas where they are jointed, weathered, or fractured (Densmore and Londquist, 1997).
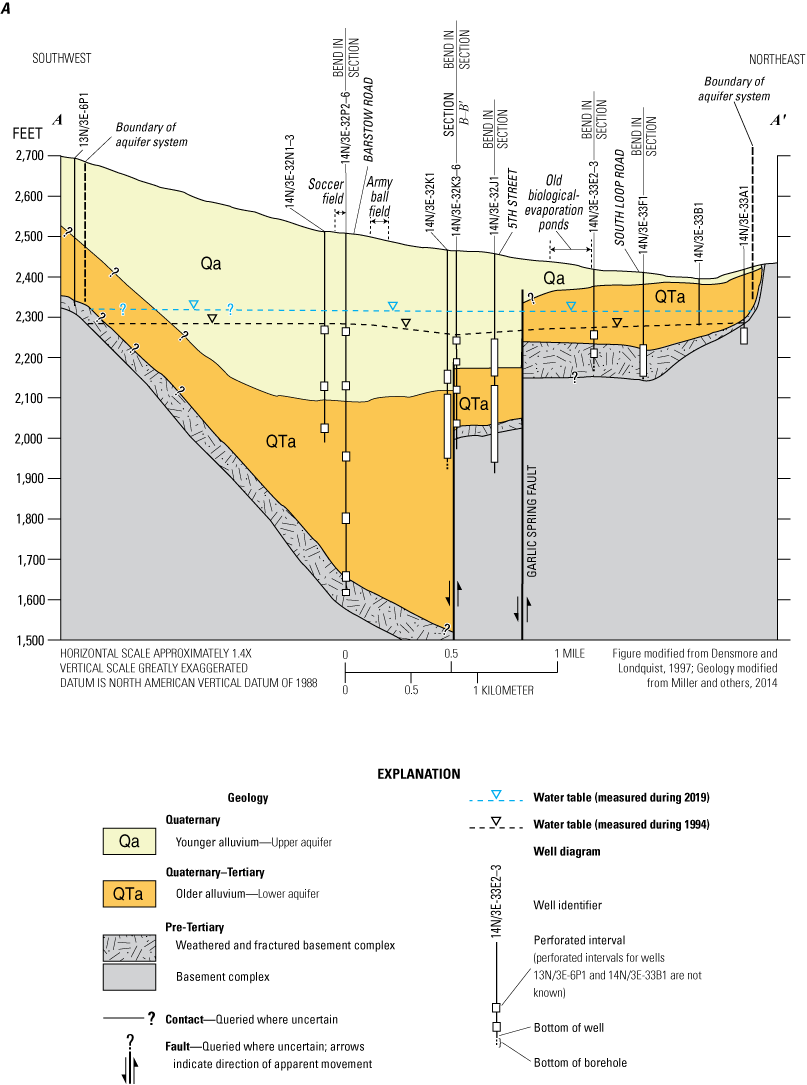
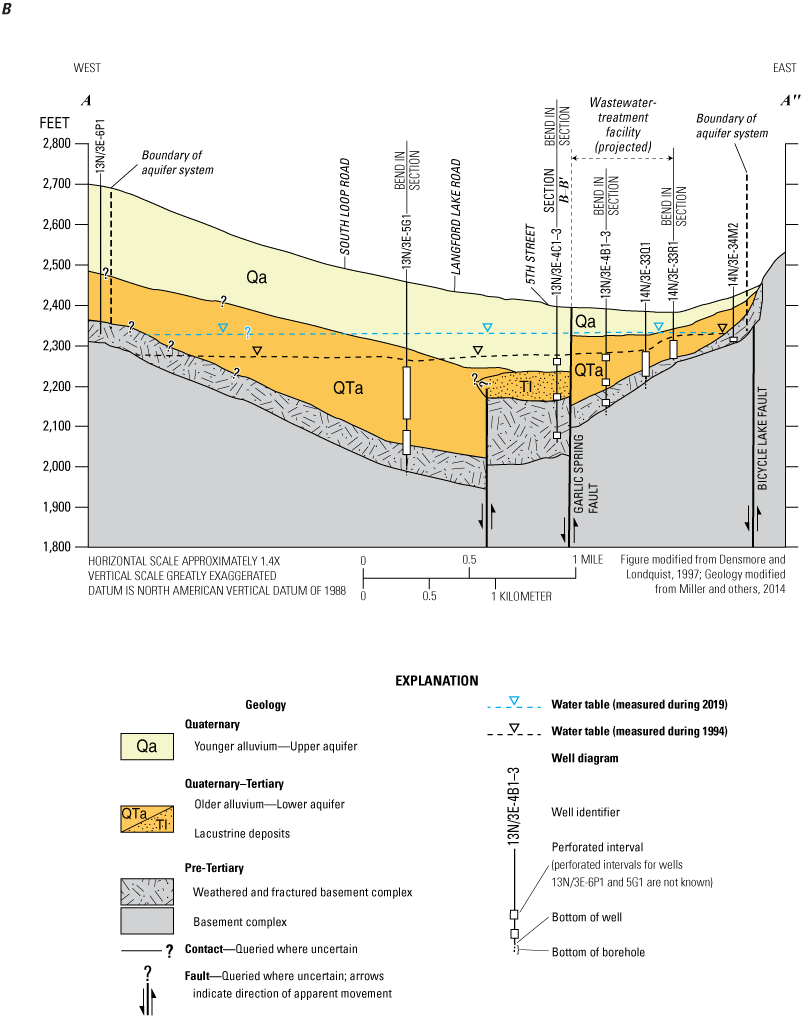
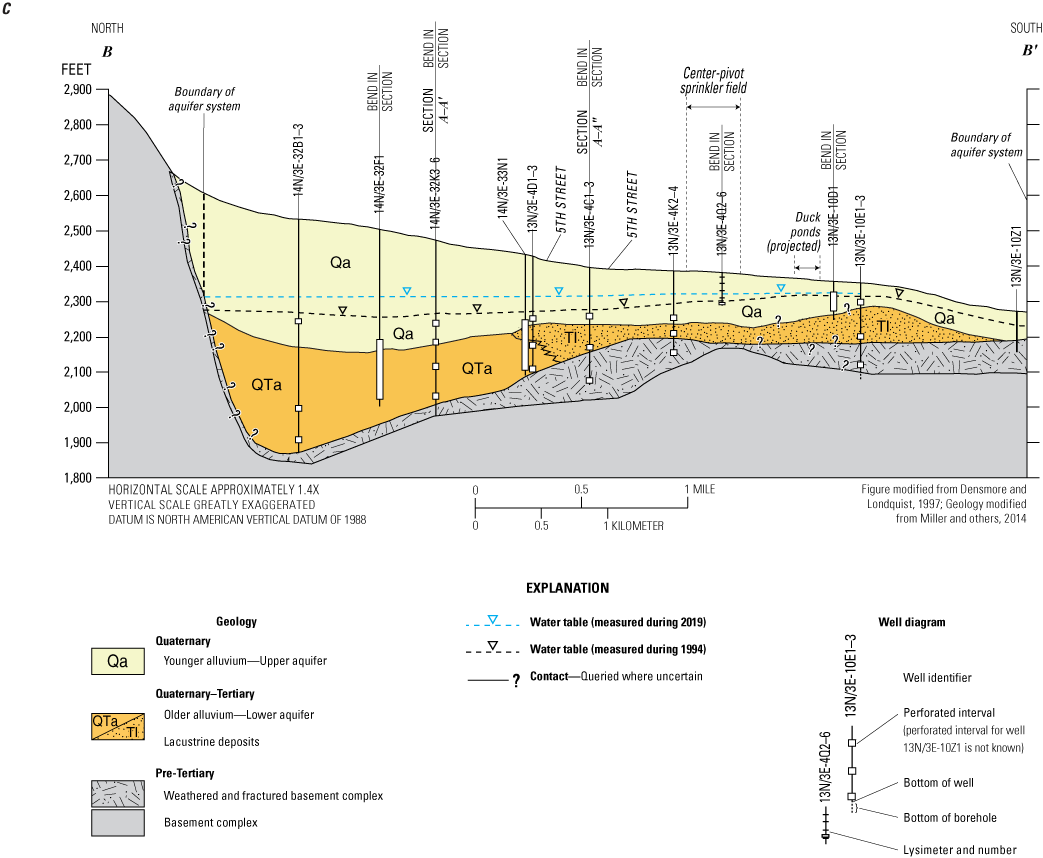
Generalized geologic cross sections of the Langford Valley–Irwin groundwater subbasin. A, southwest to northeast (A–A’ ); B, west to east (A–A” ); and C, north to south (B–B’ ), U.S. Army Fort Irwin National Training Center, California. Section lines are shown on figure 2. Modified from Densmore and Londquist (1997); well information from U.S. Geological Survey (2019).
In the Irwin subbasin, Tertiary deposits (unit QTa, including older alluvium and lacustrine deposits; fig. 3) are as thick as 650 ft (fig. 3A) and are composed of sand, gravel, and clay derived predominantly from granitic material, except in the northern part of the basin, where deposits eroded from volcanic material are present. Where older alluvium is composed predominantly of sand and gravel, it yields moderate amounts of water to wells. In the southeastern part of the basin, the Tertiary deposits are composed almost entirely of low-permeability lacustrine deposits of silt and clay that do not yield large amounts of water to wells (fig. 3C). These low-permeability deposits extend from northwest of well 33N1 near the center of the basin to the southeast, beyond wells 10E1–3 to the southwest.
Younger alluvium (unit Qa, fig. 3) is composed primarily of loose, coarse sand and gravel with small amounts of clay. Most younger alluvium lies above the water table. Areas where the younger alluvium is saturated, primarily in the center of the basin, yield large quantities of water to wells (as much as 1,000 gallons per minute). Wellbore-flow tests of selected production wells indicated that most of the water pumped from wells comes from the younger alluvium (Densmore and Londquist, 1997).
Thin, discontinuous clay lenses within younger alluvium (not shown on fig. 3) impede downward movement of irrigation return water beneath the center-pivot sprinkler field in the southeastern part of the basin (fig. 3C) and beneath base housing and athletic fields to the northwest (fig. 3). These discontinuous clay lenses may result in a perched groundwater layer above the regional water table where present.
The Garlic Spring fault on the northeast and an unnamed fault on the southwest extend through the Irwin subbasin (figs. 2, 3). Older alluvium is present at shallower depths to the northeast of the Garlic Spring fault, and younger alluvium is thicker to the southwest of the fault (fig. 3B). The faults impede the movement of groundwater through the subsurface (Densmore and Londquist, 1997). Traces of the faults are not present at land surface in the northeastern part of the basin where they have been covered by younger alluvium (Densmore and Londquist, 1997).
Between 2012 and 2019, annual precipitation in the Irwin subbasin ranged from 0.66 to 4.85 inches (in.), with an average of 2.66 inches per year (David Housman, U.S. Army Fort Irwin National Training Center, unpub. data, 2019; table 3). Areal recharge to groundwater from infiltration of precipitation in the Mojave Desert does not occur under present-day (2019) climatic conditions (Izbicki and others, 2007). Natural recharge to the aquifer occurs as infiltration of occasional streamflows in small washes that cross the Irwin subbasin after periods of intense rain.
Table 3.
Monthly precipitation data for selected weather stations, U.S. Army Fort Irwin National Training Center, California.[Precipitation data in inches. Locations of weather stations shown on figures 1 and 2. Data from David Housman, U.S. Army Fort Irwin National Training Center, unpub. data, 2019; at the time of publication, data were not available from the U.S. Army. Abbreviation: —, no data]
Although they occur infrequently in the area, large storms (fig. 4; table 3) have resulted in flooding at the NTC. Flooding occurred in the Irwin subbasin after a monsoonal storm on August 25, 2013 (Justine Dishart, U.S. Army, written commun., 2013). Rainfall of 2.25 in. measured at the Goldstone weather station and 1.14 in. at the ITAM weather station during November 21–23, 2013 (table 3; David Housman, U.S. Army Fort Irwin National Training Center, unpub. data, 2019; at the time of publication, data were not available from the U.S. Army) also contributed to flooding in the Irwin subbasin (Clarence Everly, U.S. Army, written commun., 2013). There were similar large storms during the winters of 2016 and 2017 (table 3).
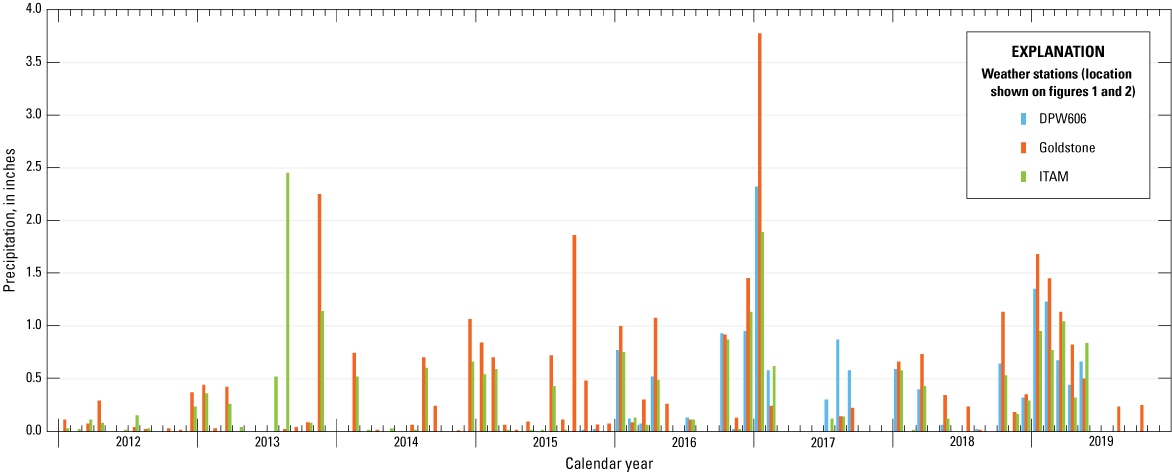
Monthly precipitation data for weather stations during 2012–19, U.S. Army Fort Irwin National Training Center, California (data provided by David Housman, U.S. Army, Fort Irwin National Training Center, unpub. data, 2019. At the time of publication, data were not available from the U.S. Army).
Groundwater Pumpage
Groundwater development in the Irwin subbasin began in 1941 (table 4). From 1941 to 1992, most groundwater pumpage for the NTC was from the Irwin subbasin, which resulted in water-level declines as much as 30 ft in parts of the subbasin during this period (Voronin and others, 2014). In response to declining water levels and to supplement water supply, pumping and importation of water for supply from the Bicycle Valley groundwater basin began in 1967 and from the Langford Well Lake subbasin in 1992 (fig. 5A). The highest levels of groundwater pumping in the Irwin subbasin occurred between 1987 and 1990. Groundwater pumping in the Irwin subbasin occurred at lower levels after 1990 (fig. 5A; table 4).
Table 4.
Annual groundwater pumpage from the Bicycle Valley and Langford Valley groundwater basins and estimated groundwater recharge to the Langford Valley–Irwin groundwater subbasin, U.S. Army Fort Irwin National Training Center, California, 1941–2019.[Pumping and groundwater recharge values in acre-feet]
Pumping data for 1940–2010 from Voronin and others (2014); data for 2011–19 provided by Edgar Ortusiastigue, Jacobs Solutions Inc., unpub. data, 2019.
Groundwater recharge data for 1941–2010 are from Voronin and others (2014). Groundwater recharge data for 2011–19 are derived from records of treated wastewater discharged to ponds (table 5) and records of irrigation at base housing and athletic fields (table 5), provided by Edgar Ortusiastigue, Jacobs Solutions Inc., unpub. data, 2019; at the time of publication, data were not available from Jacobs Solutions Inc.
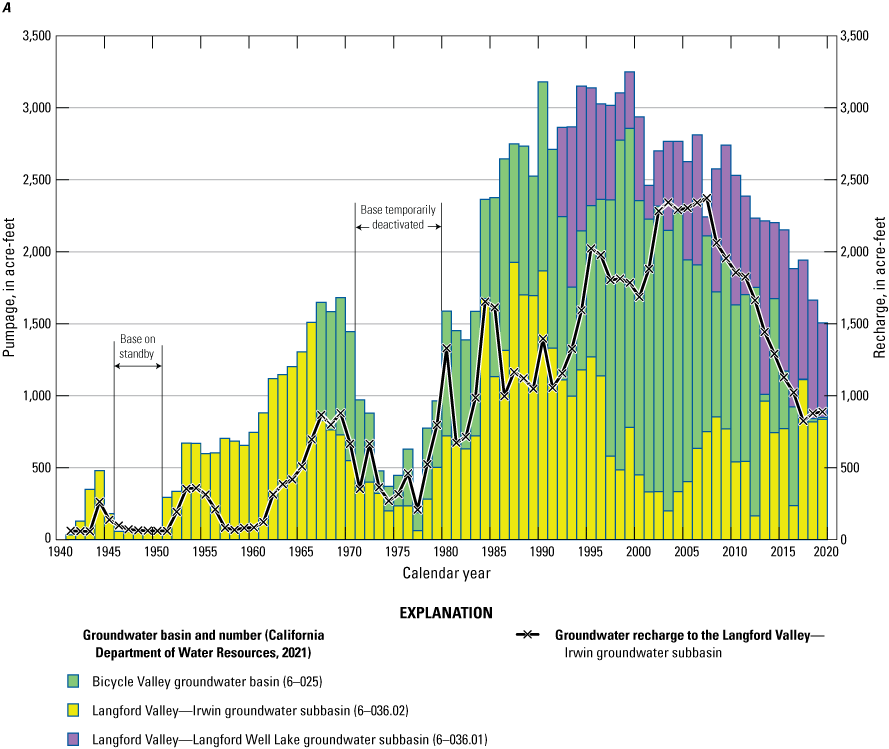
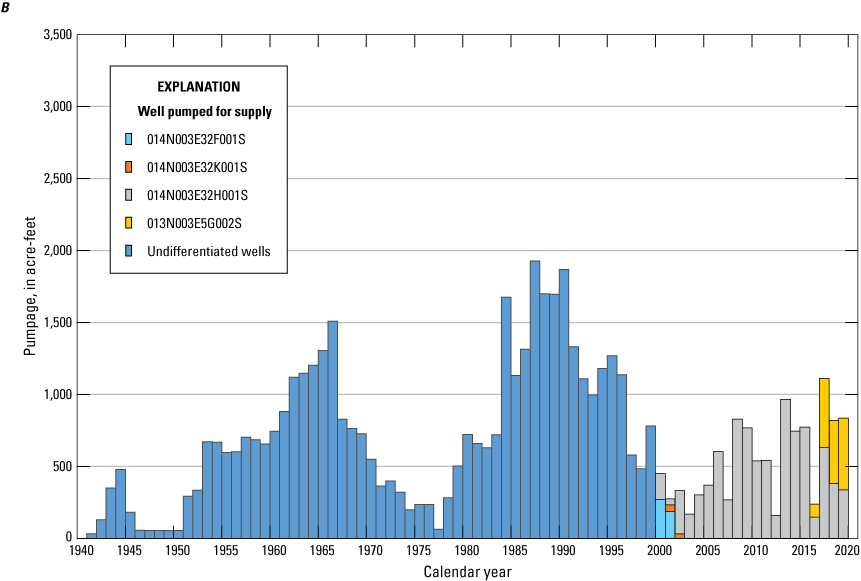
Groundwater pumping for water supply to the U.S. Army Fort Irwin National Training Center, California. A, Annual groundwater pumpage from Bicycle Valley groundwater basin and the Langford Valley–Irwin and Langford Well Lake groundwater subbasins, 1941–2019; and B, annual groundwater pumpage, 1941–99, and pumpage by well, 2000–19, from the Langford Valley–Irwin groundwater subbasin, U.S. Army Fort Irwin National Training Center, California. Data for 1940–2010 are from Voronin and others (2014); data for 2011–19 are from Edgar Ortusiastigue, Jacobs Solutions, Inc., unpub. data, 2019. At the time of publication, data were not available from Jacobs Solutions, Inc.
The combined pumping from the Bicycle Valley groundwater basin and the Langford Well Lake subbasin exceeded pumping in the Irwin subbasin until 2017 (fig. 5B) when well 5G2 was activated in the Irwin subbasin (fig. 2). From January 1993 to December 2019, an average of 1,184 acre-feet per year of groundwater was pumped from the Bicycle Valley groundwater basin and averages of 693 and 657 acre-feet per year of groundwater were pumped from the Langford Well Lake subbasin and the Irwin subbasin, respectively (table 4). The greatest pumping from the three basins was from the Bicycle Valley groundwater basin during the late 1990s and early 2000s; however, pumping in the Bicycle Valley groundwater basin has declined since 2013 (table 4; fig. 5A). Overall pumping from the three basins has been on a steady decline since 1999, and pumping patterns have shifted between basins and wells. Since 2016, pumping from the Irwin subbasin and water imported from the Langford Well Lake subbasin has met, almost equally, the water needs for the NTC within the Irwin subbasin.
Treated Wastewater and Groundwater Recharge
Wastewater in the Irwin subbasin is treated at the NTC wastewater-treatment facility (WWTF) in the southeastern part of the basin (fig. 2). The NTC WWTF has a capacity of 2 million gallons per day (Mgal/d), with a peak capacity of 4 Mgal/d, and is designed to treat residential sewage (Shawn Anderson, Jacobs Solutions Inc., written commun., 2010). The NTC WWTF was upgraded from secondary treatment to tertiary treatment in 2007. After 2015, groundwater delivered for supply within the Irwin subbasin was treated using reverse osmosis to lower dissolved solids concentrations, resulting in a decrease in the dissolved solids concentration of treated wastewater from the NTC WWTF (Dick, 2025). The quality of treated wastewater from the NTC WWTF varied through time as a result of changes in source water, source water quality, and changes in wastewater treatment practices. Water-quality data for treated wastewater collected by Jacobs Solutions Inc. personnel during 2015–19 are published in a USGS data release (Dick, 2025).
Treated wastewater use and discharge to ponds and other locations in the Irwin subbasin changed over time. Between 1945 and 1955, treated wastewater was disposed of in biological evaporation ponds (fig. 2; Densmore and Londquist, 1997). Discharge to ponds near the NTC WWTF began in 1955. Irrigation with treated wastewater in the golf course/driving range area occurred from 1955 to 1971 and after 1981; irrigation of the larger golf course area ceased in the mid-2000s, while the smaller driving range area (known as Pitch and Putt, not shown on fig. 2) is still irrigated with treated wastewater. Beginning in 1986, treated wastewater was disposed through irrigation at the center-pivot sprinkler field in the southeastern part of the basin (fig. 2). This practice ceased in 1996, after a study by Densmore (2003) determined that groundwater degradation was due to leaching of salts beneath the center-pivot sprinkler field. Beginning in 2010, irrigation with treated wastewater replaced irrigation with groundwater on most athletic fields and base housing.
Between 2011 and 2019 (the period detailed records are available), the NTC WWTF produced between 687 and 1,137 acre-feet (acre-ft) of treated wastewater annually (Edgar Ortusiastigue, Jacobs Solutions, Inc., written commun., 2020). During this period, the amount of treated wastewater discharged to ponds near the NTC WWTF, to duck ponds in the southeast part of the Irwin subbasin, or to ponds on the golf course ranged from a high of 996 acre-ft in 2011 to a low of 533 acre-ft in 2017 (table 5; fig. 6).
Table 5.
Summary of treated wastewater discharged to ponds and water used for irrigation in the Langford Valley–Irwin groundwater subbasin, U.S. Army Fort Irwin National Training Center, California, 2011–19.[Selected land use shown on figures 2, 7A, 8, and 10A. Town area and base housing 2005–19 includes irrigation water use in the town area (not shown on figures 2, 7A, 8, and 10A), base housing 2005–19, and soccer field. Barracks, 2005–19 included in base housing 2005–19. Date ranges show onset of initial construction and improvements within that period. Data provided by Edgar Ortusiastigue, Jacobs Solutions, Inc., unpub. data, 2019; at the time of publication, data were not available from Jacobs Solutions, Inc. Groundwater recharge from irrigation estimated from total water use, assuming 50-percent recharge efficiency]
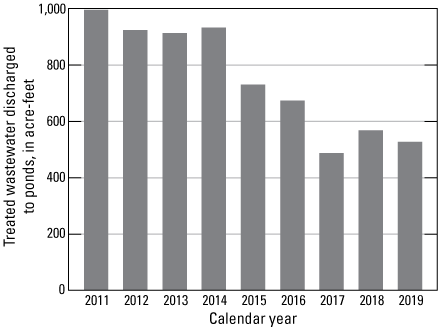
Treated wastewater discharged to ponds in the Langford Valley–Irwin groundwater subbasin, U.S. Army Fort Irwin National Training Center, California, 2011–19. Data provided by Edgar Ortusiastigue, Jacobs Solutions, Inc., unpub. data, 2019. At the time of publication, data were not available from Jacobs Solutions, Inc.
The ponds where treated wastewater is discharged are unlined and most treated wastewater discharged to the ponds infiltrated into the subsurface; infiltration from the ponds is the largest source of groundwater recharge to the underlying aquifer. During 2011–19, between 127 and 215 acre-ft of treated wastewater was used to irrigate base housing (including the town area), parts of the golf course, and various athletic fields at the NTC (table 5). Irrigation return water in these areas would have reached the water table and recharged the underlying aquifer. Smaller amounts of recharge also may have occurred within the Irwin subbasin as leakage from water distribution or sewage pipes (Densmore and Londquist, 1997; Voronin and others, 2013).
Between 2015 and 2019 (the period that detailed records are available; Dick, 2025), treated wastewater sampled weekly at the NTC WWTF had a median specific conductance of 780 microsiemens per centimeter, corresponding to a median dissolved solids concentration of about 515 milligrams per liter (mg/L). Based on available data (Dick, 2025), between 2015 and 2019 the median nitrate concentration in treated wastewater was 21 mg/L as nitrogen (N). Dissolved solids and nitrate concentrations in treated wastewater varied widely during this period, with an interquartile range (50-percent of the values calculated as the difference between the 25-percent and 75-percent quartiles) from 370 to 924 mg/L for dissolved solids and from 8.5 to 26 mg/L nitrate as N. Variations in treated wastewater quality presumably result from a combination of changes in drinking-water source and quality, drinking water treatment (including reverse osmosis after 2015), and NTC WWTF operations.
Groundwater Levels and Movement
Beginning in 1941, groundwater development in the Irwin subbasin resulted in a lowering of the water table (Densmore and Londquist, 1997; Densmore, 2003; Voronin and others, 2014). Since the mid-1990s, reduced pumping and recharge from treated wastewater and irrigation return caused water levels to rise or stabilize throughout the Irwin subbasin (fig. 7; U.S. Geological Survey, 2019).


Water-level data, including A, location of wells with water-level hydrographs and 2019 water table elevation; and B, measured water levels in wells, 1993–2019, in the Langford Valley–Irwin groundwater subbasin, U.S. Army Fort Irwin National Training Center, California (U.S. Geological Survey, 2019).
Since the mid-1990s, water levels rose as much as 45 ft in the northern and central part of the Irwin subbasin (wells 32B3, 32F3, 32K6, 5G1, and 32P6), about 35 ft in wells near the NTC WWTF (wells 4B3 and 4D3), and about 10 ft near the subbasin outflow in the southeast part of the subbasin (well 10E3, fig. 7B). The pumping depression centered near well 32K6 during the mid-1990s (Densmore and Londquist, 1997) diminished by 2019, and the water table flattened out in the area extending from wells 33N1, 32K5, and 32K6 in the center of the subbasin, north to well 32B3, and east to wells 32H1 and 34D1 (fig. 7A, well 32K5 at multiple well site 32K3–6 not shown).
In 2019, the highest water-level elevation (2,329 ft) was in well 33R1 near the ponds at the NTC WWTF (table 1; fig. 7B). Water-level elevations in wells 32F3, 32P6, and 32Q3 were 2,317, 2,321, and 2,316 ft, respectively (table 1; fig. 7B). High water levels in these wells are consistent with recharge from infiltration of irrigation return water at base housing and athletic fields in this part of the Irwin subbasin. In 2019, the water-level elevation in well 5G1 was 2,301 ft (table 1; fig. 7B; U.S. Geological Survey, 2019). The water-level elevation declined in well 5G1 after 2016 as pumping increased from well 5G2 (figs. 2, 7B).
A water-table map (fig. 7A) prepared from 29 discrete measurements collected in November and December 2019 and water-level changes in selected wells within the Irwin subbasin between 1990 and 2020 (fig. 7B) are consistent with movement of treated wastewater infiltrated from ponds at the NTC WWTF (table 5) and with movement of smaller amounts of treated wastewater and groundwater recharged as irrigation return from base housing and athletic fields (table 5) toward the center of the Irwin subbasin. Water-level contours (fig. 7A) also are consistent with impediment to groundwater flow through faults that are oriented to the southeast and northwest and subsequent movement of groundwater to the southeast toward the subbasin outflow along the alluviated channel of the wash at the downgradient end of the Irwin subbasin (fig. 7A). Water-level data for wells in unconsolidated deposits in the southwest part of the Irwin subbasin are not available, and water-level contours in this area are not shown (fig. 7A). Where water-level data are available at multiple well sites, water-level elevations generally were similar in shallower monitoring wells completed in the upper aquifer and in deeper wells completed in the lower aquifer (table 1; U.S. Geological Survey, 2019).
Methods of Sample Collection and Analysis
Groundwater samples were collected and processed by USGS personnel following the protocols established by the USGS National Field Manual for the Collection of Water-Quality Data (U.S. Geological Survey, 2015). Most sampled wells were monitoring wells installed by the USGS (Densmore and Londquist, 1997). Wells were purged before sample collection and sampled using portable piston pumps. Field parameters (including water levels, pH, specific conductance, and temperature) were measured during well purging, and samples were collected after three casing volumes of groundwater were removed and field parameters stabilized. These sample collection protocols were designed to ensure a representative sample of groundwater is collected and potential contamination of samples during collection and handling is minimized. A detailed description of sampling methods is available in Kjos and others (2014).
Groundwater samples were sent to the USGS National Water Quality Laboratory (NWQL) in Denver, Colorado, for analysis of major ions, nutrients, and selected trace elements, using methods by Fishman and Friedman (1989), Fishman (1993), Garbarino and others (2002, 2006), and Patton and Kryskalla (2011). Stable isotopes were analyzed by the USGS Stable Isotope Laboratory using methods described by Epstein and Mayeda (1953), Coplen and others (1991), and Coplen (1994). Oxygen-18 (18O) and deuterium (D or 2H) abundances are reported as ratios with the more abundant isotopes oxygen-16 (16O) and hydrogen-1 (1H), relative to those ratios in the Vienna Standard Mean Ocean Water–Standard Light Antarctic Precipitation scale (Coplen, 1994). The ratios are reported in delta (δ) notation as delta oxygen-18 (δ18O) and delta deuterium (δD), in units of parts per thousand (per mil) differences relative to the isotopic ratios in the standards. Selected samples were sent to the Woods Hole Oceanographic Institute, National Ocean Sciences Accelerator Mass Spectrometry Facility in Woods Hole, Massachusetts, for analysis of carbon-14 (14C) and the stable isotope ratio of carbon-13 to carbon-12 using accelerator mass spectrometry and mass spectrometry, respectively (Vogel and others, 1987; Donahue and others, 1990; McNichol and others, 1992, 1994; Gagnon and Jones, 1993; Schneider and others, 1994). Tritium (3H) was analyzed with a detection limit of 0.3–0.5 picocurie per liter, dependent on sample volume, using electrolytic enrichment-gas scintillation at the University of Miami Tritium Laboratory or electrolytic enrichment-liquid scintillation at the USGS Isotope Tracer Laboratory in Menlo Park, California (Oestlund and Werner, 1962; Thatcher and others, 1977; Beukens, 1992). Water-quality data are available in U.S. Geological Survey (2019).
Quality Assurance
Replicate data provide information on variability resulting from laboratory, field sample collection, and sample handling. Replicate samples were collected for about 9 percent of samples from wells after the monitoring network was established in 2014; replicate data are unavailable before 2014. For constituents analyzed for trends in this report (dissolved solids, nitrate plus nitrite, arsenic, and fluoride), precision, calculated as the relative standard deviation of replicate pairs, is presented in table 6. Precision of replicate samples from this study was comparable to precision calculated from replicate data available for the NWQL (table 6; U.S. Geological Survey, 2024) and within the limits of acceptable reproducibility that would not be expected to interfere with interpretation of data presented in this report. Because variability also results from sample collection and sample handling in addition to analysis within the NWQL, precision data from other studies (Gross and others, 2012; Medalie and Bexfield, 2020) that were collected during similar periods, using similar techniques, and analyzed using the same methods at the NWQL also are provided for comparison (table 6). In general, relative standard deviations were within similar ranges (Gross and others, 2012; Medalie and Bexfield, 2020). Precision for major-ion data analyzed between 2014 and 2019 as part of this study ranged from 1.2 percent for magnesium to 3.2 precent for sulfate (not shown in table 6); precision for these constituents also are similar to precision of data collected during similar periods at the NWQL (U.S. Geological Survey, 2024) and from other studies (Gross and others, 2012; Medalie and Bexfield, 2020) and is not expected to interfere with interpretation of data presented in this report.
Table 6.
Method reporting levels, method precision, and relative standard deviation for replicate pairs of selected constituents, U.S. Army Fort Irwin National Training Center, California, 2014–19 (U.S. Geological Survey, 2019).[Method description from National Environmental Methods Index (NEMI; https://nemi-test.er.usgs.gov/home/). Method precision reported as percent if laboratory precision varies with concentration or reported as a concentration if laboratory precision is independent of concentration. Abbreviations: mg/L, milligrams per liter; mg/L as N, milligrams per liter as nitrogen; NWQL, National Water Quality Laboratory; µ/L, micrograms per liter; <, less than]
Range of replicate data used to calculate relative standard deviation presented in table. Relative standard deviation commonly increases as the concentration of replicates decreases. Laboratory data do not include variation associated with field sample collection and handling. Additional data are available from the U.S. Geological Survey Quality Systems Branch at https://qsb.usgs.gov/ibsp/charts.php (U.S. Geological Survey, 2024).
Data collected 1992–2010 from Gross and others (2012).
Data collected 2013–17 from Medalie and Bexfield (2020).
The median differences between δ18O or δD values in replicate samples collected as part of this study were 0.04 and 0.6 part per thousand, respectively. Laboratory acceptance criterion for these constituents is ±0.15 per mil for δ18O (Révész and Coplen, 2008b) and within ±1.0 per mil for δD (Révész and Coplen, 2008a). Four of five replicate pairs for δ18O were within 0.07 per mil, and one replicate pair differed by 0.17 per mil; all replicate pairs for δD were within 1.0 per mil. Replicate data were not collected for 3H and 14C data.
Blank samples are used to identify systematic issues associated with sample collection, handling, and analytical procedures that may introduce constituents into a sample. Introduction of constituents into a sample may affect study detection limits and thereby limit interpretation of low concentrations in samples. Blank samples were not collected as part of this study; however, constituent concentrations in environmental samples were sufficiently high, so bias associated with this issue was not a concern.
Statistical Analysis
Maximum and minimum values reported for 1993–95 and 2015–19 were the highest and lowest values for wells sampled during those periods. Median values for 1993–95 and 2015–19 were calculated from the median values for each well. Replicate data were not used for the calculation of median values. Comparison of median values calculated for each period were done using the median test (Neter and Wasserman, 1974); differences in median concentrations were considered statistically significant at a confidence criterion (α) of α=0.05, unless otherwise stated. When a different confidence criterion is used, the probability of significance (p-value) also is provided.
Regression analysis, including calculation of slope, intercept, and coefficient of determination, was done using the method of least squares (Neter and Wasserman, 1974; Helsel and others, 2020). Monotonic (consistently upward or consistently downward) trends in concentrations in water from selected wells were evaluated using the Mann-Kendall test (Kendall, 1938; Mann, 1945; Helsel and Hirsch, 2002; Helsel and others, 2020). Kendall’s tau calculated by the test is a nonparametric statistic that is less affected by outlier values than more commonly used parametric statistics. Temporal trends of increasing concentrations or upward trends (positive Kendall’s tau values) and decreasing concentrations or downward trends (negative Kendall’s tau values) were identified as statistically significant or insignificant based on a two-tailed significance level of α=0.05, unless otherwise noted. The magnitudes of the trends are not reported because the different number of data available from sampled wells and the nonuniform temporal distribution of data available from the wells makes comparison of the magnitude of trends calculated for sampled wells difficult.
Maximum, minimum, and median values presented in this report were calculated using the computer program Excel (Microsoft, Inc., Redmond, Washington). Results of statistical tests and regression statistics presented in this report were calculated using software from the Statistical Analysis System (SAS Institute, Cary, North Carolina).
Water Quality
Water-quality samples were collected from 17 selected wells in the Irwin subbasin (table 1; fig. 8) as part of a groundwater monitoring network established in 2014. For the purpose of this report, these data were supplemented with water-quality data collected during 1993–95 (Densmore and Londquist, 1997; U.S. Geological Survey, 2019) to provide a more than 20-year period to evaluate changes in groundwater quality in the Irwin subbasin.
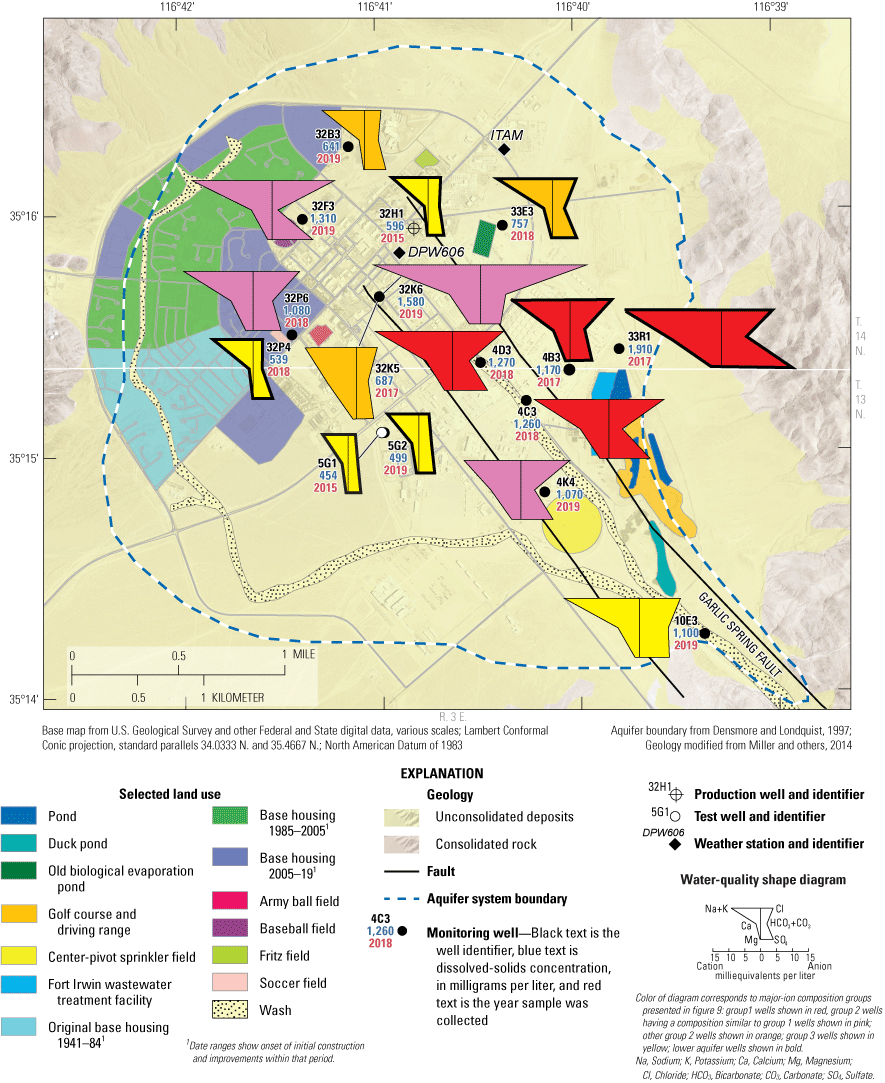
Location of selected wells sampled for water quality and water-quality shape diagrams, Langford Valley–Irwin groundwater subbasin, U.S. Army Fort Irwin National Training Center, California, 2015–19 (U.S. Geological Survey, 2019).
Eleven of the sampled wells were the shallowest wells at selected multiple-well monitoring sites (Densmore and Londquist, 1997; U.S. Geological Survey, 2019). Seven of these shallow wells (4C3, 4D3, 4K4, 32B3, 32F3, 32K6, and 32P6; fig. 3; 32F3 is not shown on fig. 3) were completed in younger alluvium within the main part of the Irwin subbasin; three wells (4B3, 33E3, and 33R1; fig. 3) were completed in older alluvium. Well 10E3 was completed in younger alluvium near the subbasin outflow in the southeast part of the Irwin subbasin. Three deeper wells at multiple well monitoring sites also were sampled; well 32K5 was completed in younger alluvium, and wells 32F2 and 32P4 were completed in the underlying older alluvium (fig. 3; well 32P4 was not sampled in 2015–19 and is not shown on fig. 8). In addition to wells at multiple-well monitoring sites, three wells (5G1, 5G2, and 32H1; fig. 3) also were sampled. Well 5G1 is a test well screened in older alluvium. Wells 5G2 and 32H1 are production wells; well 5G2 is screened in older alluvium and well 32H1 is screened in younger and older alluvium. Wells 5G1 and 5G2 are screened in similar depths; data from well 5G2 were used in place of data from well 5G1 after 2016.
The number of samples collected at each well ranged from 2 at well 32F2 to 11 at well 33R1. In general, shallow wells near the NTC WWTF were sampled more frequently and deeper wells were sampled less frequently. Some samples were analyzed for fewer constituents.
Changes in the major-ion composition, dissolved solids and nitrate concentrations, and selected trace element concentrations in water collected from wells between 1993–95 and 2015–19 are discussed in this section. Changes in the stable oxygen and hydrogen isotope composition of water, indicative of the source of water to wells, and changes in the radioactive isotopes of hydrogen (3H) and carbon (14C) activity, indicative of the age (time since recharge) of water from wells, also are discussed.
Major-Ion Composition
The major-ion composition of water from sampled wells was evaluated using trilinear and water-quality-shape diagrams. Trilinear diagrams were plotted using a method described by Piper (1944) to graphically show differences between the major-ion composition of water from selected wells and changes in the major-ion composition of water from selected wells through time. Water-quality-shape diagrams were plotted using a method developed by Stiff (1951) and show differences in the major-ion composition of water from wells.
Trilinear diagrams (fig. 9) show the relative contribution of major cations as a percentage of the total positive charge in the triangle to the left and major anions as a percentage of the total negative charge in the triangle to the right. The central diamond, with cations on the upper right and lower left and the anions on the upper left and lower right sides, integrates data from the left and right triangles. The position of a sample on the diagram shows the major-ion composition of water and allows comparisons to be made between samples collected at different times and from different wells. The major-ion composition identified on the diagram is named for the cations and anions that contribute more than 50 percent of the respective charge. In general, the major-ion composition of water from most sampled wells in the Irwin subbasin is composed of more than 50-percent sodium on the cationic side, with differing percentages of the two most abundant anions, chloride and sulfate, on the anionic side of the diagram.
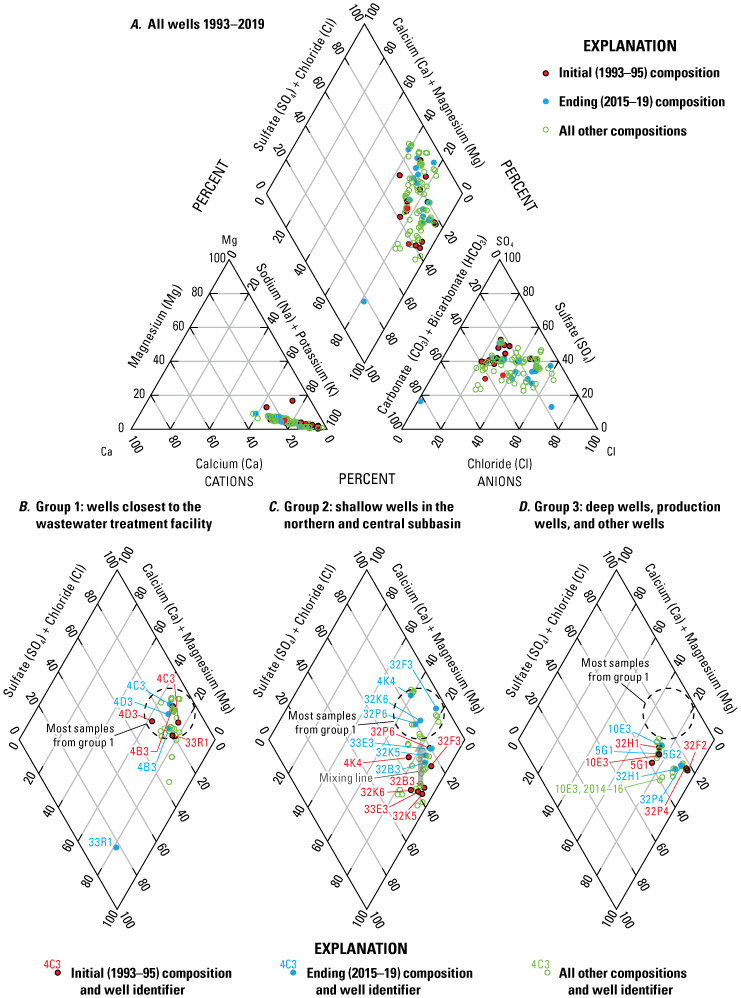
Major-ion composition of water in A, water from wells sampled between 1993 and 2019; B, water from wells closest to the wastewater treatment facility; C, water from shallow wells; and D, water from deep wells, production wells, and other wells, Langford Valley–Irwin groundwater subbasin, U.S. Army Fort Irwin National Training Center, California (U.S. Geological Survey, 2019). Figures 9B–9D identify wells that have water-quality samples in both the initial evaluation period (1993–95) and the ending evaluation period (2015–19) to show how ion composition changed over time in each well grouping. Hollow green dots represent samples from wells that do not have pairs in both the initial and ending evaluation periods or are outside of those timeframes. A dashed circle represents the general composition of wells in group 1 to show how ion composition changes as you move away from the wastewater treatment facility.
For the purpose of comparing changes in the major-ion composition of water from wells over time, the earliest sample collected from each well (1993–95) is shown in red, the latest sample (2015–19) is shown in blue; samples collected between the earliest and latest samples are shown as open green circles (fig. 9A). Samples were subsequently divided into three groups based on their location and depth within the Irwin subbasin: (1) group 1 (fig. 9B) includes samples from monitoring wells 4B3, 4C3, 4D3, and 33R1 closest to the NTC WWTF; (2) group 2 (fig. 9C) includes samples from shallow monitoring wells in the northern and central part of the Irwin subbasin (wells 4K4, 32B3, 32F3, 32K6, 32P6, 33E3, deeper well 32K5 was included in group 2 because it is screened in younger alluvium); (3) group 3 (fig. 9D) includes samples from deeper wells, including monitoring wells 32F2 and 32P4 completed in older alluvium, samples from test well 5G1, and production wells 5G2 and 32H1. Monitoring well 10E3, completed in younger alluvium near the basin outflow, also was included in group 3. Only the central diamond of the trilinear diagram is shown for the three groups (figs. 9B–9D).
Most group 1 wells, closest to the NTC WWTF, (fig. 9B) had a relatively uniform sodium/chloride-sulfate composition, with only comparatively small changes in major-ion composition measured between 1993–95 and 2015–19. Water from these wells presumably contains the highest fraction of treated wastewater. In April 2019, water from well 33R1, closest to the NTC WWTF discharge ponds (fig. 2), had a strongly sodium/carbonate composition that differed from other group 1 samples collected near the WWTF. The difference in major-ion composition was characterized by lower dissolved solids (693 mg/L) and lower nitrate concentrations (1.4 mg/L as N), compared to the average concentrations of other samples of water from well 33R1 (1,050 mg/L and 6 mg/L as N, respectively; U.S. Geological Survey, 2019). Water sampled from well 33R1 in April 2019 may have been altered by precipitation in the Irwin subbasin that accumulated within ponds near the NTC WWTF and subsequently infiltrated to groundwater (the data and the source of water from well 33R1 at that time are discussed in the “Stable Oxygen and Hydrogen Isotopes in Water” section).
Group 2 wells (generally shallow wells in the northern and central Irwin subbasin, fig. 9C), revealed larger changes in major-ion composition between 1993–95 and 2015–19 than group 1 wells closer to the NTC WWTF (fig. 9B). In general, the major-ion composition of water from group 2 wells changed as chloride and sulfate percentages increased and sodium percentages decreased between 1993–95 and 2015–19. By 2019, water from four wells (4K4, 32F3, 32K6, and 32P6) was within the range of major-ion composition of group 1 wells closest to the NTC WWTF—consistent with increasing amounts of treated wastewater in water from these wells. Wells 32F3 and 32P6 are farther from the NTC WWTF than other wells in group 2 and are upgradient from the pumping depression near the center of the subbasin (fig. 7A). These wells are near base housing, and given their major-ion composition, water from these wells has been affected by past septic discharges in this area and ongoing irrigation of base housing and athletic fields with treated wastewater (Groover and others, 2020). Water from three wells (32B3, 32K5, and 33E3) plot along a mixing line extending from their initial (1993–95) composition to the composition of water in group 1 but do not have a major-ion composition in 2015–19 within the range of treated wastewater indicated by group 1 wells (fig. 9C). Wells 32B3 and 33E3 are in the northern part of the Irwin subbasin, in areas less affected by NTC WWTF discharges, past septic discharges, or irrigation using treated wastewater at base housing. Although completed in younger alluvium, well 32K5 (screened from 270 to 290 ft below land surface) is deeper than well 32K6 at the same site (screened from 210 to 230 ft below land surface). The major-ion composition in water from well 32K5 is consistent with groundwater within younger alluvium that contains small amounts of treated wastewater.
Most group 3 wells (deep wells, production wells, and other wells, fig. 9D) generally show only small changes in major-ion composition between 1993–95 and 2015–19 and do not plot within the range of the major-ion composition of wells near the NTC WWTF. Well 32F2 (fig. 9D) was sampled in 1995 and 2019 but was not analyzed for major-ion chemistry in 2019, so it was not possible to determine if the composition of water changed in the older alluvium at this site during the study period. Production well 32H1 shows changes in major-ion composition that differ from other sampled wells. Well 32H1 shows an increase in sodium percentages, whereas chloride and sulfate percentages remain relatively unchanged between 1993 and 2019. Well 32H1 is screened in both younger and older alluvium and seems to have yielded a larger fraction of water from older alluvium by 2019. Well 10E3 is completed in the shallow aquifer near the basin outflow in the southeast part of the basin. There was little difference in the major-ion composition of water from well 10E3 between the earliest sample (1993) and the latest sample (2019), and the major-ion composition of most samples of water from well 10E3 differed only slightly from the composition of water from wells near the NTC WWTF (figs. 9B, 9D). However, during 2014 and 2016, the sodium percentage increased, and the sulfate-chloride percentage decreased in water from well 10E3 (U.S. Geological Survey, 2019). These samples were collected after large storms and resulting runoff in 2013 produced streamflow in the nearby wash that potentially recharged the aquifer along the wash (recharge along the wash is discussed in the “Isotope Composition of Groundwater” section).
To assist with visualizing the spatial distribution of the major-ion composition of water from sampled wells at the end of the study period (2015–19), water-quality-shape diagrams, prepared using a method developed by Stiff (1951), are shown (fig. 8). The diagrams show the cations to the left (sodium plus potassium, calcium, and magnesium) and anions to the right (chloride, bicarbonate plus carbonate, and sulfate) in milliequivalents per liter; the area on the left side of the diagram equals the area on the right side. Similarly shaped diagrams indicate water that has similar major-ion composition; the widths of the diagrams differ according to the total ionic charge of the dissolved constituents, which is proportional to the dissolved solids concentration. For this comparison, data from the sample from well 33R1 in group 1, collected in March 2017, was used instead of the sodium/carbonate water sample collected in April 2019. Samples are grouped in the manner as in the trilinear diagrams (figs. 9B–9D).
Water samples from wells in group 1, closest to the NTC WWTF, are shown in red (fig. 8). The diagrams representing the major-ion composition of water from these wells have a similar shape, showing the most abundant cation sodium (plus potassium) paired with the anions chloride and sulfate, with lower abundances of magnesium and bicarbonate plus carbonate (fig. 8). As previously discussed, water from these wells contains the highest fraction of treated wastewater.
Water samples from shallow monitoring wells within the Irwin subbasin in group 2 that had a major-ion composition similar to the group 1 wells in 2015–19 are shown in pink (fig. 8). The diagrams that represent the major-ion composition of water from these wells are similar in size and shape to diagrams for group 1 wells, although the sodium and chloride abundances are greater. The group 2 wells include shallow monitoring wells 32F3 and 32P6 near the northwestern margin of the basin and upgradient from the pumping depression in the center of the Irwin subbasin. Water from wells 32F3 and 32P6 was recharged from sources other than infiltration from ponds at the NTC WWTF, including past infiltration of treated septic from base housing and return water from irrigation at base housing and athletic fields using groundwater and treated wastewater. As previously discussed, changes in the major-ion compositions of water from these wells are consistent with increasing fractions of treated wastewater (fig. 9B). Other shallow wells in group 2 that do not have a major-ion composition within the range of treated wastewater (32B3, 32K5, and 33E3) are shown in orange (fig. 8). These wells are downgradient from areas that received recharge from past septic discharges or recharge as return from irrigation with treated wastewater at base housing or athletic fields and seem to have some history of recharge from treated wastewater.
Water samples from deep monitoring well 32P4, test well 5G1, and production wells 5G2 and 32H1 in group 3 are shown in yellow (fig. 8). The water-quality-shape diagrams for water from these wells differ in shape and size from the group 1 and group 2 wells. The shapes of the diagrams show sodium (plus potassium) as the most abundant cation, but the diagrams show similar abundances of the anions chloride, bicarbonate plus carbonate, and sulfate. The diagrams are smaller than those in group 1, which is consistent with lower ionic strength and lower dissolved solids concentrations in water from these wells. It is likely that these diagrams show the composition of native water from wells that have been less affected by treated wastewater discharge or infiltration of treated septic from base housing and return water from irrigation using groundwater and treated wastewater.
Water from well 10E3, classified in group 3, near the southeastern margin of the Irwin subbasin, is the result of mixing from different source waters near the subbasin outflow. Based on its major-ion composition (fig. 8), water from well 10E3 also may include a large fraction of treated wastewater.
Temporal Changes in Dissolved Solids and Nitrate Concentrations
The concentrations of dissolved solids and nitrates in water used for public supply are regulated by the State of California; therefore, changes in these constituents are important to water resource managers. The secondary maximum contaminant level (SMCL) for dissolved solids in drinking water is 500 mg/L, with an upper limit of 1,000 mg/L and a short-term limit of 1,500 mg/L (California State Water Resources Control Board, 2021). The SMCLs are based on taste, aesthetics, or scale-forming properties (hardness) of the water and are not enforceable by law. The maximum contaminant level (MCL) for nitrate in drinking water is 10 mg/L as N (California State Water Resources Control Board, 2021) and is enforceable by law.
In 1993–95, dissolved solids concentrations in 16 sampled wells ranged from 453 to 1,530 mg/L, and nitrate concentrations ranged from less than the laboratory reporting level of 0.02–12 mg/L as N (U.S. Geological Survey, 2019). Median dissolved solids and nitrate concentrations in water from sampled wells were 620 mg/L and 2.8 mg/L as N, respectively. By 2015–19, dissolved solids concentrations in water from 17 sampled wells ranged from 454 mg/L (well 5G1) to 1,910 mg/L (well 33R1), and nitrate concentrations ranged from less than the laboratory reporting level of 0.04 mg/L (well 32F2) to 28 mg/L as N (well 33R1). Median dissolved solids and nitrate concentrations in water from sampled wells were 1,030 mg/L and 4.5 mg/L as N, respectively. Although dissolved solids and nitrate concentrations increased between 1993–95 and 2015–19, the change in the overall median concentration of dissolved solids in the Irwin subbasin was not statistically significant based on the results of the median test (Neter and Wasserman, 1974) at a confidence criterion of α=0.05; however, the change in nitrate concentrations was statistically significant at a confidence criterion of α=0.10 (p-value 0.06).
Chemographs for dissolved solids and nitrate concentrations for samples from 15 wells with water-quality data are presented for spatial comparison between wells (fig. 10). Adjacent wells 5G1 and 5G2, perforated in similar intervals, are presented on one chemograph, with data for well 5G1 shown for 1993–2015 and data for well 5G2 shown for 2016–19.
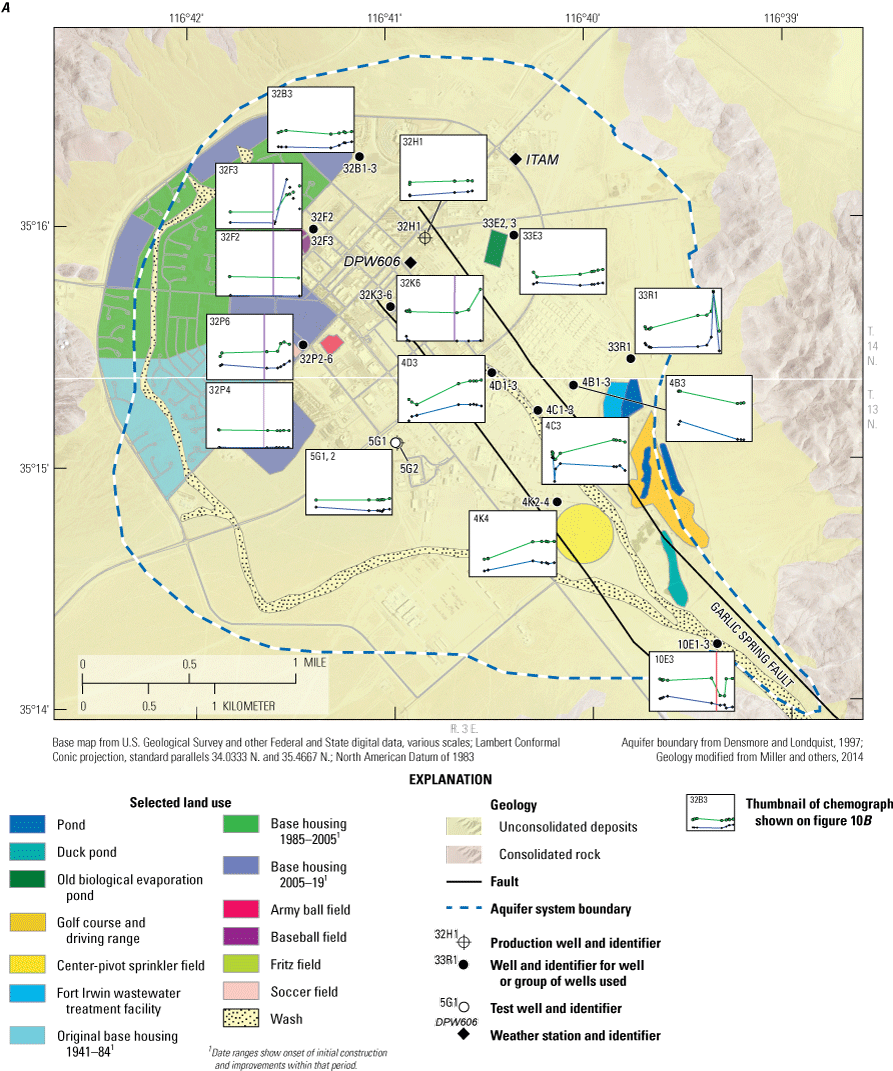
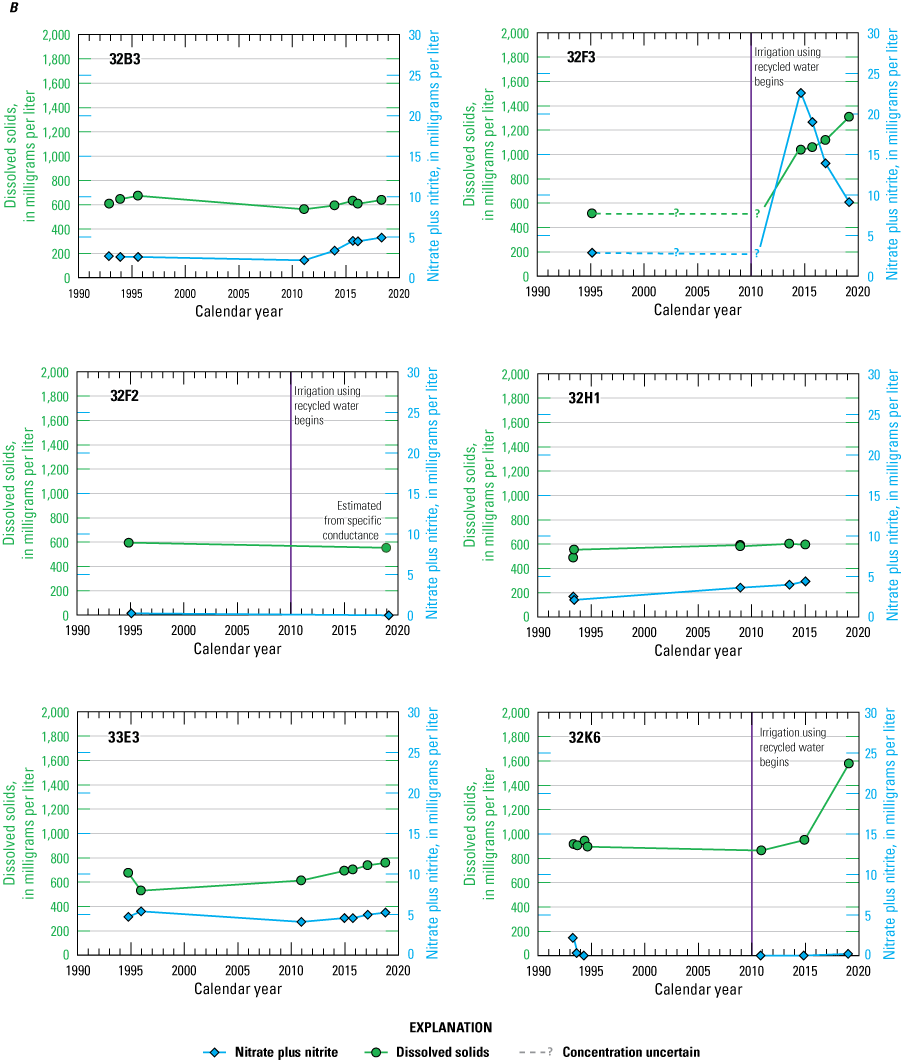
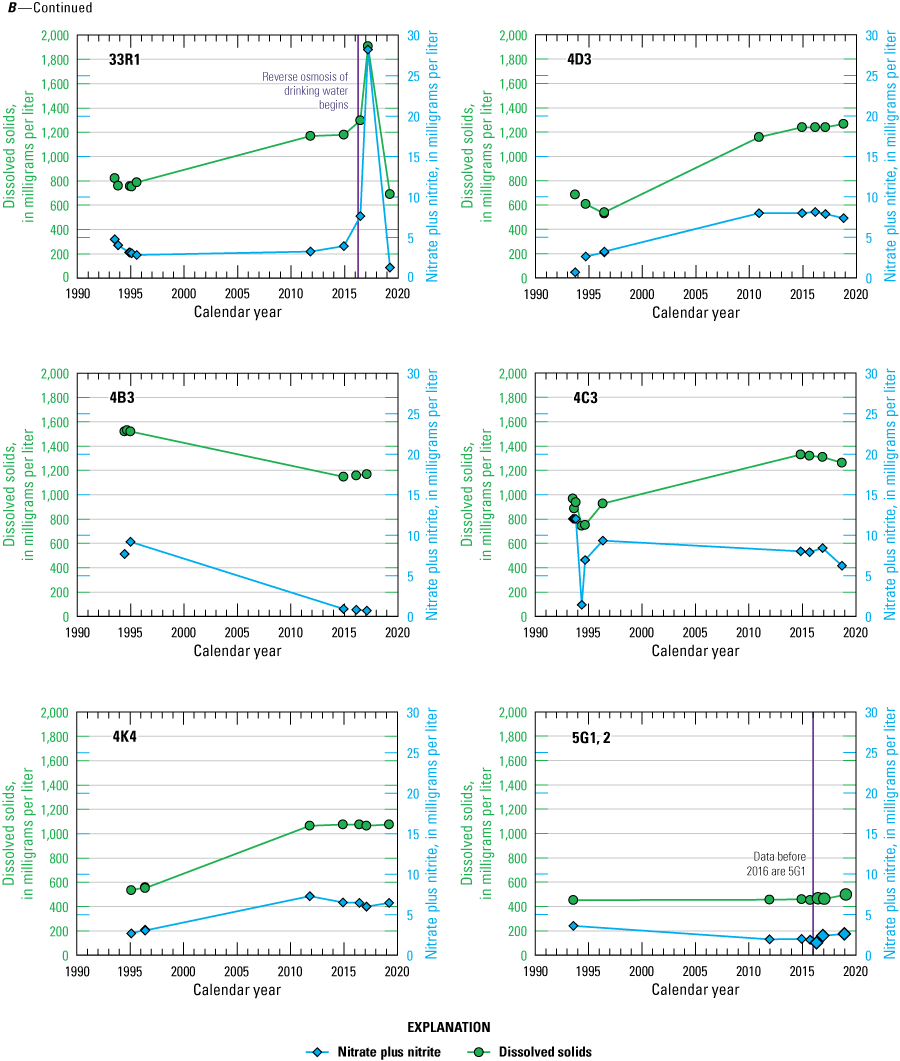
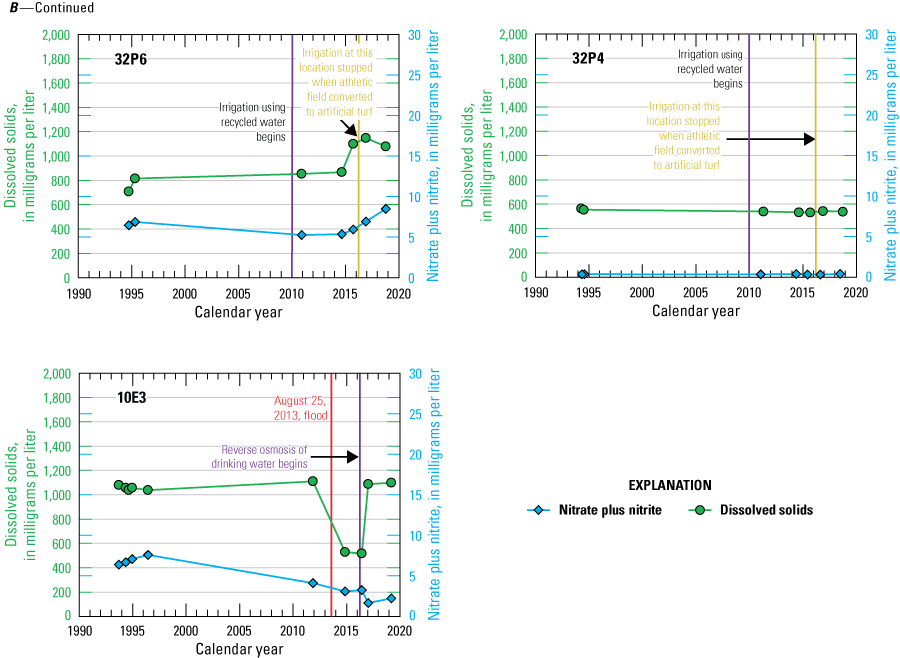
Dissolved solids and nitrate plus nitrite concentrations in water from selected wells. A, Map of well locations; and B, chemographs of dissolved solids and nitrate plus nitrite concentrations in the Langford Valley–Irwin groundwater subbasin, U.S. Army Fort Irwin National Training Center, California, 1993–2019 (U.S. Geological Survey, 2019).
Between 1993–95 and 2015–19, eight wells indicated statistically significant upward trends in dissolved solids concentrations at a confidence criterion of α=0.05 (table 7); well 32K5 had a statistically significant upward trend at a confidence criterion of α=0.10 (p-value 0.051; table 7). Well 32K5 is completed in the upper aquifer at a greater depth than well 32K6 at the same site. Wells with water having significant upward trends in dissolved solids concentrations included wells 32F3 and 32P6 near base housing and irrigated fields. Dissolved solids in water from well 32K6 in the same area also increased from 864 to 1,580 mg/L between 1993 and 2019, but the increase was not statistically significant (table 7). Five other wells, including wells 5G1–2 and 32H1 that yield water primarily from the lower aquifer, indicate statistically significant upward trends in dissolved solids concentrations. Well 32P4, completed in the underlying Tertiary deposits, had a statistically significant downward trend in dissolved solids concentrations at a confidence criterion of α=0.10 (p-value 0.099; table 7).
Table 7.
Trends in dissolved solids, nitrate plus nitrite, arsenic, and fluoride concentrations in water from selected wells in the Langford Valley–Irwin groundwater subbasin, U.S. Army Fort Irwin National Training Center, California, 1993–2019.[Wells grouped by similarity in major-ion composition (fig. 9). Linear trends were calculated using the Mann-Kendall test (Kendall, 1938; Mann, 1945): U and u are upward concentration trends at a confidence criterion of α=0.05 and α=0.10, respectively; D and d are downward concentration trends at a confidence criterion of α=0.05 and α=0.10, respectively. The p-value is the probability of significance calculated using the Mann-Kendall test. Data are available in U.S. Geological Survey (2019). Values are rounded for presentation. Abbreviations: N, number of samples; —, no statistically significant trend; <, less than]
Sample collected on April 3, 2019, has anomalous chemistry and was potentially affected by precipitation (fig. 11); it was not included.
Dissolved solids concentration trends were not statistically significant in water from two wells in group 1 nearest the NTC WWTF (wells 4B3 and 4C3, table 7), largely because water from these wells had high dissolved solids concentrations as a result of treated wastewater discharges before 1993. Dissolved solids concentrations in water from well 4B3 decreased from 1,520 mg/L in 1994 to 1,170 mg/L in 2017, and concentrations in water from well 4C3 decreased from a maximum concentration of 1,340 mg/L in 2014 to 1,260 in 2018. Although downward concentration trends were not statistically significant, decreases in dissolved solids concentrations in water from wells near the NTC WWTF may result from changes in source water quality attributable to reverse osmosis of treated drinking water delivered within the Irwin subbasin beginning in 2016. Decreases in dissolved solids concentrations are likely to continue and become measurable in other wells if reverse osmosis of the source water supply continues.
Only water from production well 32H1 indicated a statistically significant upward trend in nitrate concentrations between 1993–95 and 2015–19 at a confidence criterion of α=0.05 (table 7); water from well 32B3 indicated a significant upward trend at a confidence criterion of α=0.10 (p-value=0.062; table 7). Water from well 4B3, in group 1 near the NTC WWTF, indicated a statistically significant downward trend in nitrate concentrations (table 7). The decrease in nitrate concentrations in water from well 4B3 may have resulted from changes in wastewater treatment practices that remove nitrate from treated wastewater. Water from well 10E3 in the southwestern part of the Irwin subbasin also indicated statistically significant downward trends in nitrate concentrations (table 7). As previously discussed, water from well 10E3 is a mixture of water from different sources near the basin outflow and, based on its major-ion composition, may contain a large fraction of treated wastewater (fig. 8). Downward nitrate concentration trends in water from well 10E3 may result from changes in several wastewater management practices (table 2) and from natural recharge along the wash that drains the Irwin subbasin.
The lowest nitrate concentrations were in water from well 32K6 near the center of the Irwin subbasin; low nitrate concentrations were measured when dissolved oxygen concentrations in water from well 32K6 were at or less than the reporting limit of 0.2 mg/L (U.S. Geological Survey, 2019). Low dissolved oxygen concentrations are consistent with reducing conditions and indicate that nitrate in wastewater may be reduced and removed from groundwater in this area.
Selected Trace Elements
Arsenic and fluoride in groundwater may be present naturally at concentrations of concern for public health and are known as geogenic contaminants. In groundwater worldwide, arsenic and fluoride are the two geogenic contaminants of greatest public health concern (Howard and others, 2006; Johnson and others, 2017). Other geogenic constituents of potential public health concern in groundwater in the western Mojave Desert include chromium, uranium, and vanadium (Izbicki and others, 2023). Arsenic and other trace element concentrations in groundwater often increase as groundwater levels decline. This increase is a result of pumping as wells yield older, more alkaline water from deeper deposits (González and others, 2022; Izbicki and Seymour, 2023; Izbicki and others, 2023).
Between 1993 and 95, arsenic concentrations in water from wells in the Irwin subbasin ranged from 8 to 81 micrograms per liter (µg/L; U.S. Geological Survey, 2019), with a median concentration of 28 µg/L. At that time, water from 15 of 16 sampled wells exceeded the MCL of 10 µg/L (U.S. Environmental Protection Agency, 2023), with water from 3 wells exceeding the MCL of 50 µg/L that was mandated at that time (U.S. Environmental Protection Agency, 2001). By 2015–19, arsenic concentrations in water from 16 sampled wells ranged from 4.8 µg/L (well 32K6) to 37 µg/L (well 32B3), with a median concentration of 16 µg/L; water from 14 of 16 wells had concentrations that exceeded the MCL of 10 µg/L (U.S. Geological Survey, 2019).
Statistically significant downward trends in arsenic concentration were measured between 1993–95 and 2015–19 using the Kendall test for trend in four shallow monitoring wells and in deeper well 32K5 (confidence criterion α=0.05 and α=0.10; table 7). These wells all indicated changes in major-ion composition, consistent with wastewater disposal from ponds or return from irrigation with treated wastewater (fig. 9). Downward trends in arsenic concentrations measured in water from wells between 1993–95 and 2015–19 were likely the result of dilution of native groundwater that contains arsenic by treated wastewater that has lower arsenic concentrations. Statistically significant downward trends in arsenic concentrations during this period were not measured in deeper wells 32H1 and 32P4 (table 7) that yield water from Tertiary deposits. In contrast to other wells, a statistically significant upward trend in arsenic concentrations was measured in water from well 10E3 near the southeast corner of the Irwin subbasin and in water from well 5G1–2 (table 7).
Between 1993 and 95, fluoride concentrations in water from wells in the Irwin subbasin ranged from less than the laboratory reporting limit of 0.10 to 21 mg/L (U.S. Geological Survey, 2019), with a median concentration of 5.4 mg/L. During that time, fluoride concentrations in water from all 16 sampled wells exceeded the MCL set by the State of California of 2 mg/L (California State Water Resources Control Board, 2023). By 2015–19, fluoride concentrations in water from wells in the Irwin subbasin ranged from 1.8 mg/L (well 4K4) to 14 mg/L (well 32P4), with a median concentration of 4.3 mg/L. During that period, concentrations of fluoride in water from 15 of 16 wells sampled exceeded the California MCL of 2 mg/L (U.S. Geological Survey, 2019).
Statistically significant downward trends in fluoride concentration were measured between 1993–95 and 2015–19 using the Kendall test for trend in six shallow monitoring wells, in deeper well 32K5 completed in the upper aquifer, and in water from well 32P4 completed in underlying Tertiary deposits (table 7). Fluoride concentrations in water from wells 32K6 and 32P6, which indicated significant downward trends in arsenic concentrations, decreased from maximum concentrations of 6.9 and 4.6 during 1993–95 to 4.1 mg/L and 1.8 mg/L during 2015–19, respectively, but fluoride concentration trends were not statistically significant (table 7). These changes are consistent with dilution of groundwater with treated wastewater that has a lower fluoride concentration. Downward trends in fluoride concentrations in water from well 32P4 are consistent with small amounts of treated wastewater present within the underlying Tertiary deposits.
Chromium, uranium, and vanadium are geogenic trace elements that also occur naturally at high concentrations in groundwater in some areas of the western Mojave Desert (Izbicki and others, 2023). In 2015–19, chromium concentrations (presumably in the form of hexavalent chromium [Cr(VI)]) ranged from less than the laboratory reporting level of 0.3 to 9.9 µg/L (U.S. Geological Survey, 2019); no wells exceeded the proposed California MCL for Cr(VI) of 10 µg/L (California State Water Resources Control Board, 2022). In 2015–19, uranium concentrations ranged from 0.13 to 106 µg/L (U.S. Geological Survey, 2019), with a median concentration of 8.0 µg/L. At that time, water from wells 4B3, 10E3, 32P6, 32K6, and 33R1 exceeded the MCL for uranium of 30 µg/L (U.S. Environmental Protection Agency, 2023). Statistically significant increasing uranium concentration trends were measured in water from wells 4K4, 4D3, and 4C3 near the NTC WWTF from 2015 to 2019, although none of these wells exceeded the MCL for uranium (not shown in table 7). In 2015–19, vanadium concentrations ranged from 3.0 to 40 µg/L (U.S. Geological Survey, 2019), with a median concentration of 14 µg/L; no wells exceeded the California notification level for vanadium of 50 µg/L (California State Water Resources Control Board, 2023). Low chromium concentrations and high uranium concentrations in water from wells in the Irwin subbasin are consistent with the local granitic geology and the regional occurrence of these constituents in alkaline, oxic groundwater in the western Mojave Desert (Izbicki and others, 2023).
Isotope Composition of Groundwater
The stable isotopes of oxygen and hydrogen (reported as δ18O and δD, respectively) are tracers of the source and movement of water and are used to understand the source, movement, and hydrologic history of water from sampled wells. The radioactive isotopes of hydrogen and carbon (3H and 14C, respectively) are used to determine the age (time since recharge) of groundwater, locate sources of recharge, and identify geologic controls on the movement of groundwater. In this study, δ18O, δD, 3H, and 14C were analyzed in water samples from wells to determine their source and age.
Stable Oxygen and Hydrogen Isotopes in Water
Oxygen-18 and D are natural stable isotopes of oxygen and hydrogen, respectively. The ratios of oxygen isotopes (18O to the more abundant isotope 16O) and hydrogen isotopes (D to the more abundant isotope hydrogen, 1H) in groundwater are indicators of the source, movement, and hydrologic history of the water. The stable water isotope ratios (δ18O and δD) are expressed in delta notation (δ) as per mil differences, relative to the standard known as Vienna Standard Mean Ocean Water (Gonfiantini, 1978).
The linear relation between δ18O and δD in natural precipitation throughout the world (Craig, 1961) is known as the global meteoric water line (GMWL; fig. 11). The GMWL exists because most precipitation is derived from the evaporation of ocean water, which undergoes fractionation during evaporation from the ocean surface to the vapor phase. Further fractionation occurs as precipitation condenses from the atmosphere, leaving the remaining water vapor relatively depleted in the heavier isotopes of 18O and D compared to the isotope composition of seawater. Latitude, elevation, and air temperature affect the isotope composition of atmospheric water. Precipitation from a given storm becomes isotopically lighter (more negative) as the storm moves inland and over higher elevations with cooler temperatures (Fournier and Thompson, 1980). These effects combine to give precipitation in a given area a range of δ18O and δD compositions distributed along a global meteoric water line that has a slope of 8.
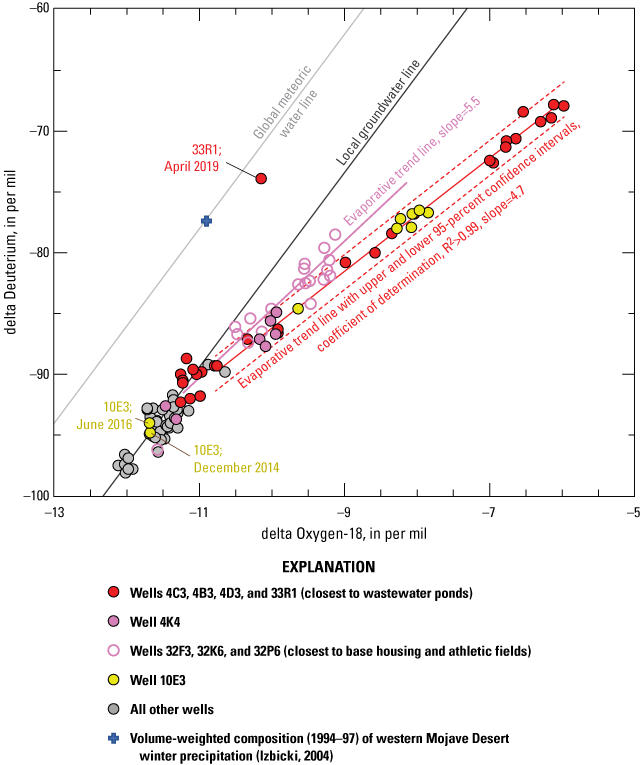
The delta oxygen-18 composition as a function of delta deuterium composition in water from selected wells in the Langford Valley–Irwin groundwater subbasin, U.S. Army Fort Irwin National Training Center, California, 1993–2019. Data summarized from U.S. Geological Survey (2019).
The δ18O and δD composition of groundwater derived from precipitation in a given area is distributed along a line known as the local groundwater line. In the Mojave Desert area, the local groundwater line is commonly subparallel (also with a slope of 8) to the GMWL (fig. 11; Izbicki, 2004; Groover and others, 2024). More negative values of δ18O and δD distributed along the local groundwater line represent enrichment in the lighter isotopes of oxygen and hydrogen, respectively (or a depletion in the heavier isotopes), and less negative values represent enrichment in the heavier isotopes.
As the lighter isotopes of oxygen and hydrogen are preferentially removed during evaporation, the remaining water is enriched in the heavier isotopes relative to its original composition. The remaining partly evaporated water has δ18O and δD values that plot below and to the right of the local groundwater line along a line known as the evaporative trend line (fig. 11). Evaporative trend lines commonly have a slope between 3 and 6 (Gat and Gonfiantini, 1981). The slope of the evaporative trend line is less for evaporation under drier, less humid conditions and higher for evaporation under wetter, more humid conditions.
At the low temperatures within most groundwater systems, there is no change in the isotope composition of groundwater after infiltration below the depth of evaporation; therefore, any subsequent differences in the isotopic composition of groundwater along a flow line generally reflect either mixing within the aquifer system or fractionation by evaporation in groundwater discharge areas. The δ18O and δD composition of groundwater, relative to the GMWL, the local groundwater line, and the isotopic composition of water from other sources can be an indicator of the source, movement, and hydrologic history of groundwater (Gat and Gonfiantini, 1981; Izbicki, 2004).
Isotope Composition of Water from Wells
The δ18O and δD isotope composition of 107 water samples from 17 wells in the Irwin subbasin collected between 1993 and 2019 ranged from −5.98 to −12.12 per mil for δ18O and from −67.8 to −98.1 per mil for δD (fig. 11; U.S. Geological Survey, 2019). Most samples plotted along a local groundwater line subparallel, with a slope of 8 and 13 per mil below the GMWL, or along evaporative trend lines intersecting the local groundwater line (fig. 11). Only one sample, from well 33R1 collected in April 2019, plotted close to the GMWL near the volume-weighted average δ18O and δD composition of −10.9 and −77 for recent (1994–97) Mojave Desert winter precipitation (Izbicki, 2004). It is possible that water sampled from well 33R1 in April 2019 is related to precipitation from large storms in the Irwin subbasin in earlier years. All other samples plotted either along the local groundwater line or along an evaporative trend line, with unevaporated δ18O and δD compositions more negative than those of recent (1994–97) precipitation (fig. 11).
In 1993–95, the δ18O and δD composition of water from wells 4B3, 4C3, 4D3, and 33R1 near the NTC WWTF (in major-ion group 1, fig. 9) initially plotted along the local groundwater line with δ18O and δD compositions more negative than −10.7 and −88 per mil, respectively (fig. 11). By 2011, water from well 33R1 indicated changes in δ18O and δD composition consistent with evaporation, and, by 2014, water from wells 4B3, 4C3, and 4D3 also indicated changes consistent with evaporation. Evaporation likely occurred in ponds where treated wastewater from the NTC WWTF was discharged and allowed to infiltrate and recharge groundwater. Wells were not consistently sampled and analyzed for δ18O and δD between 1993–94 and 2011–14; consequently, the timing of the evaporative changes in water from these wells is not precisely known. Data from these wells were used to estimate an evaporative trend line that has a slope of 4.7. The comparatively low slope of the evaporative trend line estimated from these data is consistent with evaporation under dry conditions typical of the Mojave Desert and with a hydrologic history of water sourced from the NTC WWTF and infiltrated through ponds.
The oxygen and hydrogen isotope composition of water from well 4K4 (in major-ion group 2, fig. 9C) also was fractionated, which is consistent with evaporation of treated wastewater infiltrated through ponds. Additionally, water from well 4K4 indicated changes in major-ion chemistry consistent with the presence of treated wastewater (fig. 9C). The δ18O and δD compositions from well 4K4 plotted within the 95-percent confidence interval about the evaporative trend line estimated for wells 4B3, 4C3, 4D3, and 33R1; however, the evaporative fractionation for well 4K4 was less than the fractionation measured in water from wells closer to the ponds where water from the NTC WWTF is infiltrated. The change in the δ18O and δD composition in water from well 4K4 attributable to evaporative fractionation is about 25 percent of the maximum fractionation measured in wells 4B3 and 33R1 and is consistent with a smaller fraction of treated wastewater present in water from wells farther from the NTC WWTF. Although evaporative fractionation of water from well 4K4 was apparent in 2018, the timing of the evaporative shift in δ18O and δD composition of water from this well is not precisely known.
Water from wells 32F3, 32K6, and 32P6 (in major-ion group 2; fig. 9C), farther from the NTC WWTF and closer to base housing, had changes in major-ion chemistry between 1993–95 and 2015–19 consistent with the presence of treated wastewater (fig. 9B). Although partly evaporated, water from these wells has a different evaporative history than water from wells closer to the NTC WWTF; more than half of the measured δ18O and δD values for these wells do not plot within the 95-percent confidence interval about the evaporative trend line estimated for wells closer to the WWTF (fig. 11). The data indicate less evaporative fractionation, and the evaporative trend line has a greater slope (about 5.5) than water from wells closer to the NTC WWTF. The greater slope is consistent with evaporation under higher humidity likely present during irrigation at base housing and athletic fields.
Water from wells 32B3, 32K5, and 33E3 (in major-ion group 2, fig. 9) plot along the local groundwater line, and the δ18O and δD composition of water from these wells did not change in a manner consistent with evaporation (not identified on fig. 11). The major ion composition of water from these three wells changed but was not within the range of treated wastewater by 2015–19 (fig. 9). Changes in the δ18O and δD composition consistent with evaporation were not measured in water from deeper monitoring well 32P4, wells 5G1 and 5G2 completed in older alluvium (major-ion group 3, fig. 9; not identified on fig. 11), and production well 32H1 (major-ion group 3, fig. 9; not identified on fig. 11). Based on their major-ion composition, water from these wells is relatively unaffected by infiltration of treated wastewater from the NTC WWTF.
Water from well 10E3, along the wash in the southeastern part of the Irwin subbasin (major-ion group 3, fig. 9), is evaporated and plots within the 95-percent confidence interval about the evaporative trend line estimated for wells 4B3, 4C3, 4D3, and 33R1 near the NTC WWTF (fig. 11). Although consistent with treated wastewater discharges from the NTC WWTF, some water from this well may have originated from ponds on the base golf course. These ponds were used to infiltrate treated wastewater in the past before upgrades at the NTC WWTF (Densmore and Londquist, 1997), and evaporative fractionation of the δ18O and δD composition of water from well 10E3 was measured as early as 1993–94. Water from well 10E3 sampled in December 2014 and June 2016 plots along the local groundwater line and does not indicate a δ18O and δD composition consistent with evaporative fractionation. Although the δ18O and δD compositions of these samples differ from the composition expected for regional precipitation (Izbicki, 2004) and water from well 33R1 affected by precipitation (April 3, 2019; fig. 11), these samples have been attributed to infiltration of stormflow along the wash that occurred after large storms in 2013 and 2016. It is likely that the δ18O and δD composition of precipitation may differ greatly in different storms (Izbicki, 2004). In the Mojave Desert, precipitation from large storms that produce intermittent streamflow in desert washes have a δ18O and δD composition similar to native groundwater from wells within the Irwin subbasin that were recharged as much as 18,400–12,500 years before present.
Changes in Dissolved Solids and Nitrate Concentrations Associated with Evaporation
Increases in dissolved solids and nitrate concentrations in treated wastewater that occur as a result of evaporation before infiltration from ponds and irrigation at base housing and athletic fields were estimated based on changes in δD composition using graphical techniques developed by Gonfiantini (1986). The approach estimates the fraction of water remaining in a water sample with a given change in the δD composition; the dissolved solids and nitrate concentration of the remaining water was then calculated assuming no chemical reactions with aquifer materials or constituents dissolved in the water. Differences between the calculated and measured concentrations were used to evaluate the relative contribution of mixing with native groundwater, evaporation, mobilization of saline water from the unsaturated zone, and dissolution of mineral salts to dissolved solids and nitrate concentrations in groundwater. Interpretation of data using this approach is limited because detailed information on wastewater composition is not available before 2015; however, Densmore and Londquist (1997) reported higher dissolved solids concentrations in treated wastewater discharged to the Irwin subbasin in the past.
The dissolved solids concentrations of water from wells in the Irwin subbasin increases as water becomes progressively more evaporated (fig. 12A). Assuming only evaporation of treated wastewater from ponds before recharge (at a relative humidity of 25 percent), the median dissolved solids concentration in treated wastewater between 2015 and 2019 of 515 mg/L (Dick, 2025) would increase linearly to 770 mg/L as δD values change from −90 to −68 per mil (fig. 12A). Similarly, the dissolved solids concentrations for the upper and lower interquartile range, representing 50 percent of treated wastewater samples, would increase linearly from 358 and 896 to 550 and 1,380 mg/L, respectively (fig. 12A). These data do not capture the range of treated wastewater concentrations (Dick, 2025), but concentrations in groundwater would be expected to approach the median value over time and with distance from the NTC WWTF. Most data plot above the median 2015–19 dissolved solids concentration expected for treated wastewater and seem to contain a large amount of dissolved solids from other sources, potentially including mobilization of chloride and other soluble salts from the unsaturated zone as wastewater infiltrated to the water table.
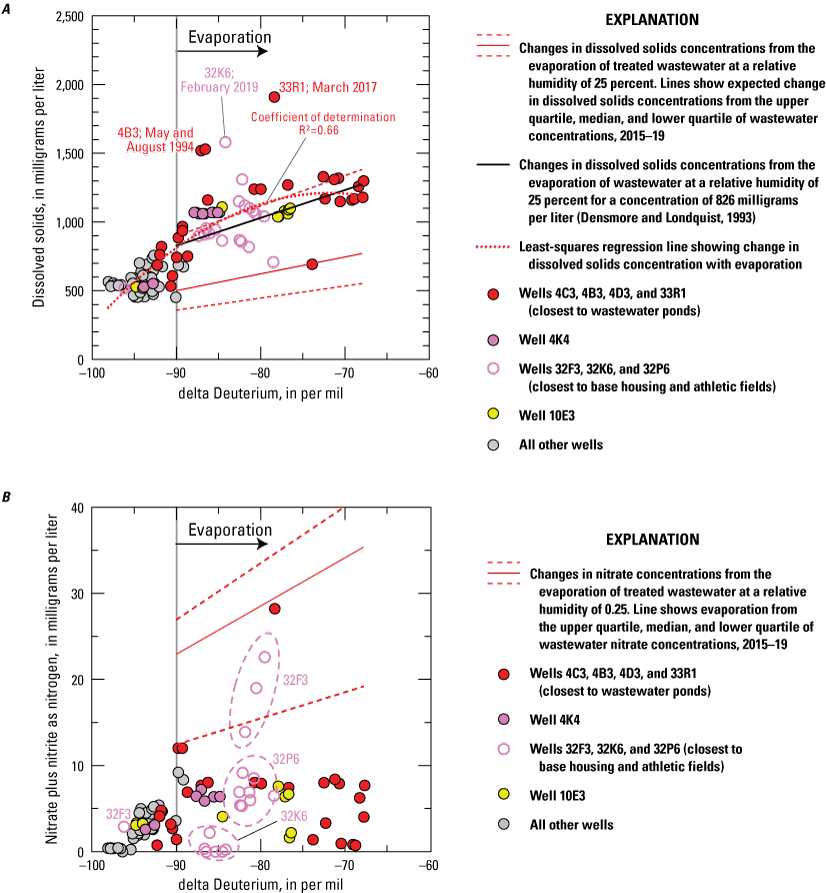
Estimated evaporative effects on A, dissolved solids; and B, nitrate concentrations in water from wells in the Langford Valley–Irwin groundwater subbasin, U.S. Army Fort Irwin National Training Center, California, 1993–2019. Data summarized from U.S. Geological Survey (2019).
Although historical data are limited, Densmore and Londquist (1997) reported dissolved solids concentrations in treated wastewater discharge of 826 mg/L. Given changes in the water supply and NTC WWTF operations that occurred since 2015, dissolved solids concentrations in treated wastewater in the past would have been higher than concentrations in 2015–19. A dissolved solids concentration of 826 mg/L would increase to a concentration of 1,270 mg/L as a result of evaporation prior to groundwater recharge (fig. 12A). Most water from wells in the Irwin subbasin plot near concentrations expected from evaporation of treated wastewater sampled in 1993 (Densmore and Londquist, 1997) and seem largely consistent with evaporation of treated wastewater prior to recharge. Some water from wells 4B3 (May 26, 1994, and August 24, 1994), 33R1 (March 19, 2017), and 32K6 (February 8, 2019) have higher dissolved solids concentrations than would be expected solely from evaporation of treated wastewater (fig. 12A). Examination of the data indicate a nonlinear trend (fig. 12A), with more rapid initial increases in dissolved solids concentrations than expected solely from evaporation. The data indicate stable, or even decreasing, dissolved solids concentrations as water becomes progressively more evaporated (fig. 12A). The nonlinear trend in the data is consistent with initial mobilization of dissolved salts from the unsaturated zone during recharge of treated wastewater from ponds.
In contrast to dissolved solids, most nitrate concentrations plot below the concentration range expected solely from evaporation of treated wastewater (fig. 12B). Nitrate concentrations in treated wastewater declined beginning in July 2019 (Dick, 2025), and lower than expected nitrate concentrations in some samples of water from wells near the NTC WWTF can be attributed to changes in operations at the WWTF. However, most samples were collected before July 2019, and the nitrate data are consistent with mixing of treated wastewater with native groundwater that has lower nitrate concentrations and with removal of nitrate prior to groundwater recharge. Mixing of treated wastewater with native groundwater was not obvious for changes in dissolved solids with evaporation (fig. 12A) because dissolved solids concentrations of treated wastewater and native groundwater were more similar than nitrate concentrations. Nitrate removal in water reaching wells 4C3,4B3, 4D3, and 33R1 may have occurred through assimilation into microbial biomass within ponds before infiltration. Less nitrate removal was measured in water from wells 32F3 and 32P6 (fig. 12B), which was not infiltrated from ponds near the NTC WWTF and was recharged from infiltration of irrigation return from base housing and athletic fields. Almost complete nitrate removal occurred in water from well 32K6 (fig. 12B). Most groundwater within the Irwin subbasin is oxic (contains dissolved oxygen), and denitrification would not be expected to occur. However, water from well 32K6 in the center of the Irwin subbasin has dissolved oxygen concentrations less than the reporting limit of 0.2 mg/L, and denitrification is possible in this area.
Before upgrades at the NTC WWTF, most N was in the form of ammonia or organic N (Densmore and Londquist, 1997). As a result, increases in nitrate concentration associated with historical wastewater discharges were not evaluated.
Tritium and Carbon-14
Tritium is a naturally occurring radioactive isotope of hydrogen that has a half-life of 12.4 years (Michel, 1976). For the purposes of this report, the concentration of 3H is reported in tritium units (TU). One TU is equal to one atom of 3H in 1018 molecules of water. About 1,760 pounds of 3H was released into the atmosphere as a result of the atmospheric testing of nuclear weapons between 1952 and 1962 (Michel, 1976). As a result, 3H concentrations in precipitation and groundwater recharge increased during that time. Tritium concentrations are not affected by chemical reactions other than radioactive decay because 3H is part of the water molecule. Therefore, 3H can be used as a tracer of the movement and relative age of water on timescales ranging from about 70 years before present (post-1952) to present. For the purposes of this report, groundwater that had 3H concentrations less than the detection limit of 0.2 TU was interpreted as water recharged before 1952. Samples that had measurable 3H concentrations were interpreted as containing at least some water recharged after 1952.
Carbon-14 is a naturally occurring radioactive isotope of carbon that has a half-life of about 5,730 years (Mook, 1980). Carbon-14 data are expressed as percent modern carbon (pmc) by comparing 14C activities to the specific activity of National Bureau of Standards oxalic acid: 13.56 disintegrations per minute per gram of carbon in the year 1950 equals 100 pmc (Kalin, 1999; Mook and van der Plicht, 199947). Carbon-14 and 3H was produced by the atmospheric testing of nuclear weapons (Mook, 1980). As a result, 14C activities may exceed 100 pmc in areas where groundwater contains 3H. Carbon-14 activities are used to determine the age of a groundwater sample on timescales ranging from more than 20,000 years before present to recent. Carbon-14 is not part of the water molecule and, therefore, 14C activities may be affected by chemical reactions that remove or add carbon to solution. Izbicki and Michel (2004) reported an initial 14C activity for recently (less than 50 years before present) recharged groundwater in alluvial aquifers within the Mojave Desert of 85 pmc before atmospheric testing of nuclear weapons. Groundwater that has a 14C activity greater than 85 pmc may contain some fraction of recent water—even if 3H is less than the study reporting level. In addition to reactions with aquifer materials, 14C activities are affected by the mixing of younger water that has high 14C activity with older water that has low 14C activity.
Tritium and 14C were not measured consistently as part of this study and were not measured in water samples collected from all wells. However, where measured, 3H and 14C data provide information on the timing of groundwater recharge to wells.
Tritium was measured at least once in water from 11 of the 17 wells sampled as part of this study; 14C was measured in water from 9 of the 17 sampled wells (U.S. Geological Survey, 2019). Tritium concentrations in six wells were less than the reporting level of 0.2 TU; 14C activities in water from these wells ranged from 10.8 to 22 pmc, which is consistent with older groundwater that have ages unadjusted from reactions that may occur in the aquifer between 18,400 and 12,500 years before present.
Samples from wells 4K4 and 32K6 had 3H values near the reporting level of 0.5 and 0.7 TU; small amounts of precipitation containing 3H may have infiltrated to the water table near these wells with irrigation return water. However, when interpreted with 14C values of 43.9 and 21.9, these values are not consistent with a large fraction of post-1952 recharge water in water from wells 4K4 and 32K6, respectively, although some post-1952 water may be present. Water from well 32K6 is reduced (does not contain dissolved oxygen), and reactions with aquifer material may have lowered the 14C activity in water from the well.
Water from wells 10E3, 32P6, and 33R1 had 3H concentrations of 2.0, 2.4, and 2.0 TU, respectively. Carbon-14 values of 90.7 and 83 pmc in water from wells 10E3 and 33R1, respectively, are consistent with a large fraction of post-1952 recharge. Carbon-14 was not measured in water from well 32P6. Tritium and 14C activities in water from well 10E3, located along the wash near the subbasin outflow in the southeastern part of the Irwin subbasin, are consistent with major-ion and stable water isotope data that indicate large changes in composition after precipitation and resulting stormflows in the wash. Consistent with δ18O and δD data (fig. 11A), small amounts of precipitation may have entered ponds where treated wastewater is infiltrated into the ground, contributing to post-1952 water in well 33R1 and to a lesser extent in water from well 4K4. Similarly, small amounts of precipitation may have infiltrated into the subsurface along with treated wastewater used for irrigation at base housing and athletic fields near wells 32K6 and 32P6. Areal groundwater recharge from infiltration of precipitation did not occur during predevelopment. It is not known if development and runoff from impermeable road surfaces may have increased streamflow in washes within the Irwin subbasin and increased recharge to well 10E3.
Most 14C data, where available, are consistent with older groundwater that has unadjusted ages ranging from 18,400 to 12,350 years before present. Consistent with water-level declines from pumping, these data indicate that natural groundwater recharge to the Irwin subbasin is small under present-day climatic and hydrologic conditions. It also is likely that younger groundwater that may have been present within the subbasin has been largely removed by pumping. Under present-day conditions, groundwater recharge to the Irwin subbasin occurs as infiltration of treated wastewater from ponds near the NTC WWTF and as irrigation return from landscape watering near base housing and athletic fields in the study area. Data from well 10E3 indicate that some groundwater recharge may occur in the Irwin subbasin, even under present-day climatic conditions, as infiltration of intermittent streamflow in washes after large storms. The δ18O and δD composition of water infiltrated from these storms was similar to the composition of older groundwater recharged 18,400–12,350 years before present and differed from the composition of present-day precipitation.
Study Limitations
This study is based on data from 17 wells in the Irwin subbasin collected between 1993 and 2019. Before the establishment of a groundwater monitoring network in 2014, water-level and groundwater-quality data were not consistently collected from all wells of interest in the study area. Similarly, water-chemistry and isotope data for some wells in the older alluvium and Tertiary deposits that underlie recent alluvium are unavailable because only two wells (32F2 and 32P4) completed in the older alluvium and Tertiary deposits were included in the 2014 well network. The lack of well data limits the ability to assess possible movement of treated wastewater into these underlying deposits. In addition, ancillary data, including chemistry (specific conductance, dissolved solids, and nitrate) data for water discharged from the wastewater treatment facility and ponds used to infiltrate treated wastewater, are not available for the earlier part of this study (1993–95). For many constituents (including major ion and stable water isotope [δD and δ18O] data), treated wastewater data are not available. As a result of water-level rises as much as 45 ft in parts of the Irwin subbasin, shallow wells designed to sample the shallowest groundwater during periods when the water table was lower are now below the water table and do not sample the shallowest groundwater. Groundwater near the 2019 water table may contain higher fractions of treated wastewater infiltrated from ponds at the NTC WWTF or return water from landscape irrigation at base housing and athletic fields than data discussed in this study. Future data collection, including expansion of the 2014 well network to include deeper wells, installation and sample collection of water table monitoring wells, and increased sample collection from the NTC WWTF, may resolve some of these limitations.
Summary and Conclusions
The U.S. Army Fort Irwin National Training Center (NTC), 120 miles northeast of Los Angeles in the Mojave Desert of California, obtains its potable water supply from the Bicycle Valley and Langford Valley groundwater basins; the Langford Valley groundwater basin is further subdivided into the Langford Well Lake and Irwin subbasins. The Irwin subbasin contains unconsolidated deposits that constitute an upper aquifer that has a saturated thickness of as much as 200 feet (ft) and a lower aquifer as thick as 650 ft. Groundwater pumping in excess of natural recharge beginning in 1941 resulted in water-level declines in the Irwin subbasin; by 1990, water-level declines were as much as 30 ft in some parts of the subbasin. Water was imported from the Bicycle Valley groundwater basin into the Irwin subbasin for potable supply beginning in the late 1960s and from the Langford Well Lake subbasin beginning in the early 1990s, reducing pumpage in Irwin subbasin. In Irwin subbasin, treated wastewater was recharged as infiltration through ponds near the NTC wastewater treatment facility (WWTF) in the southeastern part of the subbasin and as return flow from landscape irrigation at base housing and athletic fields in the northwestern part of the subbasin. This combination of recharge activities and reduced pumpage has offset water-level declines in the Irwin subbasin.
Localized water-quality changes occurred in parts of the Irwin subbasin from infiltration of treated wastewater through ponds and use of treated wastewater for landscape and athletic field irrigation. In 2014, a groundwater-monitoring network was developed that included collection of water-level and water-quality data from selected wells in the Irwin subbasin. This report presents an evaluation of water-level and water-quality conditions in the Irwin subbasin and documents changes that occurred between 1993 and 2019.
Since the early 1990s, reduced pumping, recharge of treated wastewater, and irrigation return from landscape irrigation at base housing and athletic fields in the Irwin subbasin has caused water levels to rise or stabilize throughout the subbasin. Water levels rose as much as 45 ft near the center of the basin (wells 32B3, 32F3, and 32K6), about 35 ft in wells north of the NTC WWTF, and about 10 ft south of the duck ponds in well 10E3 near the basin outflow in the southeast part of the basin.
Water-quality samples were collected from 17 wells in the Irwin subbasin between 2014 and 2019. These data were supplemented with water-quality data collected during 1993–95 and at other times, if available. Samples were analyzed for (1) selected chemistry, including major-ion composition, dissolved solids, nitrate, and selected trace elements and (2) selected stable and radioactive isotopes for groundwater source and age-dating purposes.
The major-ion composition of groundwater in the Irwin subbasin differs spatially and with depth; the composition of water from wells ranges from sodium-sulfate and sodium-chloride-sulfate to sodium-bicarbonate compositions. Water from wells near ponds used to infiltrate treated wastewater (4K4, 4C3, 4D3, and 33R1) has a sodium-chloride-sulfate composition. The major-ion composition of water from these wells has not changed greatly between 1993–95 and 2015–19; this composition likely is consistent with the long-term major-ion composition of treated wastewater discharged from the NTC WWTF and infiltrated in ponds near the WWTF. Water from shallow wells 4K4, 32F3, 32K6, and 32P6, farther from the NTC WWTF, indicated changes in major-ion composition between 1993–95 and 2015–19 and resembled the composition of water from wells near the WWTF. In the northwestern part of the subbasin, wells 32F3 and 32P6 are upgradient from lower water levels in the center of the basin, and the composition of water in these wells was likely affected by recharge from ongoing landscape and athletic field irrigation with treated wastewater. Water from deep wells completed in the lower aquifer and production wells are a sodium mixed-anion composition and generally indicated only small changes in major-ion composition between 1993 and 2019.
By 2015–19, dissolved solids concentrations in the 17 sampled wells ranged from 454 milligrams per liter (mg/L) in water from well 5G1 to 1,910 mg/L in water from well 33R1. Between 1993–95 and 2015, the change in the overall median concentration of dissolved solids in the Irwin subbasin from 620 to 1,030 mg/L was not statistically significant; however, data from nine wells used to calculate trends had statistically significant upward trends in dissolved solids concentrations. Between 2014 and 2019, dissolved solids concentrations in water from wells 4B3 and 4C3 near the NTC WWTF decreased; these decreases may result from changes in source water quality attributable to reverse osmosis of treated drinking water delivered within the Irwin subbasin. Decreases in dissolved solids concentrations are likely to continue and become measurable in other wells if reverse osmosis of source water supply continues.
By 2015–19, nitrate concentrations ranged from less than the reporting level of 0.2 mg/L as nitrogen (N) in water from well 33K6 to 28 mg/L as N in water from well 33R1 near the NTC WWTF. Between 1993–95 and 2015–19, the change in the overall median nitrate concentration in the Irwin subbasin from 2.8 to 4.5 mg/L as N was statistically significant (at a confidence criterion of α=0.10, p-value=0.06); however, only two wells indicated statistically significant upward trends in nitrate concentration, whereas well 4B3 near the NTC WWTF indicated a statistically significant downward trend in nitrate concentrations.
Between 1993 and 1995, arsenic concentrations in water from wells in the Irwin subbasin ranged from 8 to 81 micrograms per liter (µg/L), with a median concentration of 28 µg/L. By 2015–19, arsenic concentrations in samples of water from wells ranged from 4.8 to 37 µg/L, with a median concentration of 16 µg/L; 14 of 16 samples exceeded the maximum contaminant level (MCL) of 10 µg/L. Between 1993 and 1995, fluoride concentrations in water from wells in the Irwin subbasin ranged from 0.5 to 21 mg/L, with a median concentration of 5.4 mg/L. By 2015–19, fluoride concentrations in water from wells in the Irwin subbasin ranged from 1.8 to 12 mg/L, with a median concentration of 4.3 mg/L; 15 of 16 samples exceeded the MCL of 2 mg/L. No samples exceeded the proposed California MCL for hexavalent chromium of 10 µg/L. Water from wells 4B3, 10E3, 32P6, 32K6, and 33R1 exceeded the MCL for uranium of 30 µg/L; no wells exceeded the California notification level for vanadium of 50 µg/L.
The stable isotopes of oxygen and hydrogen (δ18O and δD) were used as tracers of the source, movement, and hydrologic history of water in the Irwin subbasin. Water from wells 4B3, 4C3, 4D3, 4K4, and 33R1 indicated changes in δ18O and δD compositions consistent with evaporation of treated wastewater infiltrated from ponds at the NTC WWTF, whereas water from wells 32F3, 32K6, and 32P6 closer to base housing and athletic fields in the northwestern part of the subbasin indicated changes consistent with infiltration of return water from irrigation of treated wastewater. Examination of δ18O, δD, and water-chemistry data indicated increases in dissolved solids concentrations in water from wells in the Irwin subbasin are within ranges consistent with evaporation of treated wastewater prior to recharge and mobilization of soluble salts from the unsaturated zone. In contrast, nitrate data are consistent with mixing with native groundwater that has lower nitrate concentrations, evaporation, and removal of nitrate, likely through assimilation within microbial biomass within ponds prior to infiltration and groundwater recharge; less nitrate removal was measured in water from wells recharged from infiltration of landscape irrigation return water than in water infiltrated from ponds near the NTC WWTF.
The radioactive isotope of hydrogen (tritium, 3H) and carbon-14 (14C) are used for determining the age (time since recharge) of recent (post-1952) and older groundwater, locating sources of recharge, and identifying geologic controls on the movement of groundwater. Most 14C data are consistent with older groundwater in the Irwin subbasin that has unadjusted ages ranging from 18,400 to 12,350 years before present. However, water from wells 10E3, 32P6, and 33R1 had 3H concentrations consistent with a large fraction of post-1952 recharge water. Post-1952 water from well 10E3, located along the wash near the subbasin outflow in the southeastern part of the Irwin subbasin, is consistent with infiltration of stormflow in the wash. Small amounts of precipitation may have entered ponds where treated wastewater is infiltrated into the ground, contributing to post-1952 water in well 33R1; small amounts of precipitation may have infiltrated into the subsurface along with treated wastewater used for irrigation at base housing and athletic fields near wells 32K6 and 32P6. Consistent with water-level declines from pumping, these data indicate that natural groundwater recharge to the Irwin subbasin is small under present-day climatic and hydrologic conditions.
Ongoing water-management practices in the Irwin subbasin, including reduction in demand, importation of water from the Bicycle Valley groundwater basin and Langford Well Lake subbasin, reverse osmosis of treated drinking water, and increased wastewater treatment from secondary to tertiary, has resulted in increases in groundwater levels and changes in water quality in the Irwin subbasin compared to 1993–95 conditions. Although between 1993–95 and 2015–19 dissolved solids indicated upward concentration trends, declines in dissolved solids and nitrate concentrations were observed in water from wells near the NTC WWTF beginning in 2014. The continuation of water-management practices in place at the time of this report may result in additional improvement as water recharged from ponds near the NTC WWTF propagates throughout the Irwin subbasin.
References Cited
Beukens, R.P., 1992, Radiocarbon accelerator mass spectrometry—Background, precision, and accuracy, in Taylor, R.E., Long, A., and Kra, R.S., eds., Radiocarbon after four decades—An interdisciplinary perspective: New York, N.Y., Springer-Verlag, p. 230–239, accessed November 19, 2024, at https://doi.org/10.1007/978-1-4757-4249-7_16.
California Department of Water Resources, 2021, California’s groundwater update 2020—Full report: California Department of Water Resources Bulletin 118, Update 2020, 485 p., accessed June 5, 2023, at https://water.ca.gov/Programs/Groundwater-Management/Bulletin-118.
California State Water Resources Control Board, 2021, California safe drinking water laws: Sacramento, California, California Water Boards, 205 p., accessed October 10, 2022, at https://www.waterboards.ca.gov/laws_regulations/docs/drinking_water_code_2021.pdf.
California State Water Resources Control Board, 2022, Hexavalent chromium MCL: 2022 amendment to Title 22, Division 4, Chapter 15, Article 4, Section 64431: California Water Boards draft regulation, 13 p., accessed May 30, 2023, at https://www.waterboards.ca.gov/drinking_water/certlic/drinkingwater/documents/chromium6/cr6_draftregtextv2_2022.pdf.
California State Water Resources Control Board, 2023, MCLs, DLRs, and PHGs for regulated drinking water contaminants: Sacramento, California, California State Water Resources Control Board, 11 p., accessed September 1, 2023, at https://www.waterboards.ca.gov/drinking_water/certlic/drinkingwater/documents/mclreview/mcls_dlrs_phgs.pdf.
Coplen, T.B., 1994, Reporting of stable hydrogen, carbon, and oxygen isotopic abundances: Pure and Applied Chemistry, v. 66, no. 2, p. 273–276. [Available at https://doi.org/10.1351/pac199466020273.]
Coplen, T.B., Wildman, J.D., and Chen, J., 1991, Improvements in the gaseous hydrogen-water equilibration technique for hydrogen isotope-ratio analysis: Analytical Chemistry, v. 63, no. 9, p. 910–912, accessed November 19, 2024, at https://doi.org/10.1021/ac00009a014.
Craig, H., 1961, Isotopic variations in meteoric waters: Science, v. 133, no. 3465, p. 1702–1703, accessed November 19, 2024, at https://doi.org/10.1126/science.133.3465.1702.
Densmore, J.N., 2003, Simulation of ground-water flow in the Irwin Basin aquifer system, Fort Irwin National Training Center, California: U.S. Geological Survey Water-Resources Investigations Report 02–4264, 69 p., accessed November 19, 2024, at https://doi.org/10.3133/wri024264.
Densmore, J.N., and Londquist, C.J., 1997, Ground-water hydrology and water quality of the Irwin Basin at Fort Irwin National Training Center, California: U.S. Geological Survey Water-Resources Investigations Report 97–4092, 159 p., accessed September 22, 2022, at https://doi.org/10.3133/wri974092.
Densmore, J.N., Woolfenden, L.R., Rewis, D.L., Martin, P.M., Sneed, M., Ellett, K.M., Solt, M., and Miller, D.M., 2018, Geohydrology, geochemistry, and numerical simulation of groundwater flow and land subsidence in the Bicycle Basin, Fort Irwin National Training Center, California: U.S. Geological Survey Scientific Investigations Report 2018–5067, 176 p., accessed November 19, 2024, at https://doi.org/10.3133/sir20185067.
Dick, M.C., 2025, Water-quality data for treated drinking water and treated wastewater effluent at Fort Irwin National Training Center: U.S. Geological Survey data release, available at https://doi.org/10.5066/P9HQ9C4W.
Donahue, D.J., Linick, T.W., and Jull, A.J.T., 1990, Isotope-ratio and background corrections for accelerator mass spectrometry radiocarbon measurements: Radiocarbon, v. 32, no. 2, p. 135–142, accessed November 19, 2024, at https://doi.org/10.1017/S0033822200040121.
Epstein, S., and Mayeda, T.K., 1953, Variation of O18 content of waters from natural sources: Geochimica et Cosmochimica Acta, v. 4, no. 5, p. 213–224, accessed November 19, 2024, at https://doi.org/10.1016/0016-7037(53)90051-9.
Fishman, M.J., ed., 1993, Methods of analysis by the U.S. Geological Survey National Water Quality Laboratory—Determination of inorganic and organic constituents in water and fluvial sediments: U.S. Geological Survey Open-File Report 93–125, 217 p., accessed November 19, 2024, at https://doi.org/10.3133/ofr93125.
Fishman, M.J., and Friedman, L.C., 1989, Methods for determination of inorganic substances in water and fluvial sediments: U.S. Geological Survey Techniques of Water-Resources Investigations, book 5, chap. A1, 545 p., accessed November 19, 2024, at https://doi.org/10.3133/twri05A1.
Fournier, R.O., and Thompson, J.M., 1980, The recharge area for the Coso, California, geothermal system deduced from δD and δ18O in thermal and nonthermal waters in the region: U.S. Geological Survey Open-File Report 80–454, 25 p., accessed November 19, 2024, at https://doi.org/10.3133/ofr80454.
Gagnon, A.R., and Jones, G.A., 1993, AMS-graphite target production methods at the Woods Hole Oceanographic Institution during 1986–1991: Radiocarbon, v. 35, no. 2, p. 301–310, accessed November 19, 2024, at https://doi.org/10.1017/S0033822200064985.
Garbarino, J.R., Bednar, A.J., and Burkhardt, M.R., 2002, Methods of analysis by the U.S. Geological Survey National Water Quality Laboratory-Arsenic speciation in natural-water samples using laboratory and field methods: U.S. Geological Survey Water-Resources Investigations Report 2002–4144, 40 p., accessed November 19, 2024, at https://doi.org/10.3133/wri024144.
Garbarino, J.R., Kanagy, L.K., and Cree, M.E., 2006, Determination of elements in natural-water, biota, sediment, and soil samples using collision/reaction cell inductively coupled plasma-mass spectrometry: U.S. Geological Survey Techniques and Methods, book 5, chap. B1, 87 p., accessed November 19, 2024, at https://doi.org/10.3133/tm5B1.
Gat, J.R., and Gonfiantini, R., eds., 1981, Stable isotope hydrology—Deuterium and oxygen-18 in the water cycle: Vienna, Austria, International Atomic Energy Agency Technical Reports Series, no. 210, 339 p., accessed November 19, 2024, at https://inis.iaea.org/records/f7xsc-z1683.
Gonfiantini, R., 1978, Standards for stable isotope measurements in natural compounds: Nature, v. 271, p. 534–536, accessed November 19, 2024, at https://doi.org/10.1038/271534a0.
Gonfiantini, R., 1986, Environmental isotopes in lake studies, chap. 3 of Fritz, P. and Fontes, J.-Ch., eds., Handbook of environmental isotope geochemistry: Amsterdam, Netherlands, Elsevier, accessed November 19, 2024, at https://doi.org/10.1016/B978-0-444-42225-5.50008-5.
González, V.P., Avilés, R.M., Hernandez Anguiano, J.H., Knappett, P.S.K., Martinez, J.L.M., Alquiza, M.J.P., Naves, A., Bian, J., Liu, J., González, L.M.R., Céspedes,J.M.N., and Li, Y., 2022, Influence of geological faults on dissolved arsenic concentrations in an overexploited aquifer with shallow geothermal heat: Applied Geochemistry, v. 144. [Available at https://doi.org/10.1016/j.apgeochem.2022.105395.]
Groover, K.D., Densmore, J.N., Ely, C.P., and Brown, A.A., 2020, Irrigated field characterization at Fort Irwin National Training Center, San Bernardino County, California, 2018–2020: U.S. Geological Survey data release, accessed November 19, 2024, at https://doi.org/10.5066/P9T8OLSL.
Groover, K.D., Fram, M.S., and Levy, Z.F., 2024, Status and understanding of groundwater quality in the Mojave Basin Domestic-Supply Aquifer study unit, 2018—California GAMA Priority Basin Project: U.S. Geological Survey Scientific Investigations Report 2024–5019, 62 p., accessed November 19, 2024, at https://doi.org/10.3133/sir20245019.
Gross, E.L., Lindsey, B.D., and Rupert, M.G., 2012, Quality of major ion and total dissolved solids data from groundwater sampled by the National Water-Quality Assessment Program, 1992–2010: U.S. Geological Survey Scientific Investigations Report 2011–5153, 26 p., accessed November 19, 2024, at https://doi.org/10.3133/sir20115153.
Helsel, D.R., and Hirsch, R.M., 2002, Statistical methods in water resources: U.S. Geological Survey Techniques of Water-Resources Investigations, book 4, chap. A3, 522 p., accessed July 14, 2017, at https://doi.org/10.3133/twri04A3.
Helsel, D.R., Hirsch, R.M., Ryberg, K.R., Archfield, S.A., and Gilroy, E.J., 2020, Statistical methods in water resources: U.S. Geological Survey Techniques and Methods, book 4, chap. A3, 458 p., accessed November 19, 2024, at https://doi.org/10.3133/tm4A3.
Howard, G., Bartram, J., Pedley, S., Schmoll, O., Chorus, I., and Berger, P., 2006, Groundwater and public health, chap. 1 of Schmoll, O., Howard, G., Chilton, J., and Chorus, I., eds., Protecting groundwater for health—Managing the quality of drinking-water sources: London, IWA Publishing, p. 3–19, accessed November 19, 2024 at https://www.who.int/publications/i/item/9241546689.
Izbicki, J.A., 2004, Source and movement of ground water in the western part of the Mojave Desert, Southern California, USA: U.S. Geological Survey Water-Resources Investigations Report 2003–4313, 36 p., accessed November 19, 2024, at https://doi.org/10.3133/wri034313.
Izbicki, J.A., Groover, K.D., and Seymour, W.A., 2023, Arsenic, chromium, uranium, and vanadium in rock, alluvium, and groundwater, western Mojave Desert, southern California: U.S. Geological Survey Scientific Investigations Report 2023–5089, 96 p., accessed November 25, 2023, at https://doi.org/10.3133/sir20235089.
Izbicki, J.A., Johnson, R.U., Kulongoski, J., and Predmore, S., 2007, Ground-water recharge from small intermittent streams in the western Mojave Desert, California: U.S. Geological Survey Professional Paper 1703–G, p. 157–184, accessed November 19, 2024, at https://doi.org/10.3133/pp1703G.
Izbicki, J.A., and Michel, R.L., 2004, Movement and age of ground water in the western part of the Mojave Desert, Southern California, USA: U.S. Geological Survey Water-Resources Investigations Report 2003–4314, 42 p., accessed November 19, 2024, at https://doi.org/10.3133/wri034314.
Izbicki, J.A., and Seymour, W.A., 2023, Analyses of regulatory water-quality data, Chapter D in Natural and anthropogenic (human-made) hexavalent chromium, Cr(VI), in groundwater near a mapped plume, Hinkley, California: U.S. Geological Survey Professional Paper 1885–D, 28 p., accessed October 20, 2023, at https://doi.org/10.3133/pp1885D.
Johnson, A., Johnson, R.B., and Bretzler, A., 2017, Geogenic contamination, chap. 2 of Johnson, C.A., and Bretzler, A., eds., Geogenic contamination handbook—Addressing arsenic and fluoride in drinking water: Dubendorf, Switzerland, Swiss Federal Institute for Aquatic Science and Technology, p. 16–24.
Kendall, M.G., 1938, A new measure of rank correlation: Biometrika, v. 30, nos. 1–2, p. 81–93, accessed March 15, 2018, at https://doi.org/10.1093/biomet/30.1-2.81.
Kjos, A.R., Densmore, J.N., Nawikas, J.M., and Brown, A.A., 2014, Construction, water-level, and water-quality data for multiple-well monitoring sites and test wells, Fort Irwin National Training Center, San Bernardino County, California, 2009–12: U.S. Geological Survey Data Series 788, 140 p., accessed November 19, 2024, at https://doi.org/10.3133/ds788.
Mann, H.B., 1945, Nonparametric tests against trend: Econometrica, v. 13, no. 3, p. 245–259, accessed November 19, 2024, at https://doi.org/10.2307/1907187.
McNichol, A.P., Gagnon, A.R., Jones, G.A., and Osborne, E.A., 1992, Illumination of a black box—Analysis of gas composition during graphite target preparation—Proceedings of the 14th International Radiocarbon Conference: Radiocarbon, v. 34, no. 3, p. 321–329, accessed November 19, 2024, at https://doi.org/10.1017/S0033822200063499.
McNichol, A.P., Jones, G.A., Hutton, D.L., Gagnon, A.R., and Key, R.M., 1994, The rapid preparation of seawater ΣCO2 for radiocarbon analysis at the National Ocean Sciences Ams Facility: Radiocarbon, v. 36, no. 2, p. 237–246, accessed November 19, 2024, at https://doi.org/10.1017/S0033822200040522.
Medalie, L., and Bexfield, L.M., 2020, Quality of data from the U.S. Geological Survey National Water Quality Network for water years 2013–17: U.S. Geological Survey Scientific Investigations Report 2020–5116, 21 p., accessed November 19, 2024, at https://doi.org/10.3133/sir20205116.
Michel, R.L., 1976, Tritium inventories of the world oceans and their implications: Nature, v. 263, p. 103–106, accessed November 19, 2024, at https://doi.org/10.1038/263103a0.
Miller, D.M., Menges, C.M., and Lidke, D.J., 2014, Generalized surficial geologic map of the Fort Irwin area, San Bernardino County, California, chap. B of Buesch, D.C., ed., Geology and geophysics applied to groundwater hydrology at Fort Irwin, California: U.S. Geological Survey Open-File Report 2013–1024, 11 p., scale 1:100,000, accessed November 19, 2024, at https://doi.org/10.3133/ofr20131024B.
Mook, W.G., and van der Plicht, J., 1999, Reporting 14C activities and concentrations: Radiocarbon, v. 41, no. 3, p. 227–239, accessed November 19, 2024, at https://doi.org/10.1017/S0033822200057106.
Oestlund, H.G., and Werner, E., 1962, The electrolytic enrichment of tritium and deuterium for natural tritium measurements, in Symposium on tritium in the physical and biological sciences, v.1, Vienna, Austria, May 3–10, 1961 [Proceedings]: Vienna, Austria, International Atomic Energy Agency, p. 95–104, accessed November 19, 2024, at https://inis.iaea.org/search/43116776.
Patton, C.J., and Kryskalla, J.R., 2011, Colorimetric determination of nitrate plus nitrite in water by enzymatic reduction, automated discrete analyzer methods: U.S. Geological Survey Techniques and Methods, book 5, chap. B8, 34 p., accessed November 19, 2024, at https://doi.org/10.3133/tm5B8.
Piper, A.M., 1944, A graphic procedure in the geochemical interpretation of water-analyses: Eos, Transactions American Geophysical Union, v. 25, no. 6, p. 914–928, accessed November 19, 2024, at https://doi.org/10.1029/TR025i006p00914.
Révész, K., and Coplen, T.B., 2008a, Determination of the δ(2H/1H) of water—RSIL lab code 1574, chap. 1 of Stable isotope-ratio methods, sec. C of Révész, K., and Coplen, T.B., eds., Methods of the Reston Stable Isotope Laboratory: U.S. Geological Survey Techniques and Methods, book 10, chap. C1, 27 p., accessed November 19, 2024, at https://doi.org/10.3133/tm10C1.
Révész, K., and Coplen, T.B., 2008b, Determination of the δ (18O/16O) of water—RSIL lab code 489, chap. 2 of Stable isotope-ratio methods, sec. C of Révész, K., and Coplen, T.B., eds., Methods of the Reston Stable Isotope Laboratory: U.S. Geological Survey Techniques and Methods, book 10, chap. C2, 28 p., accessed November 19, 2024, at https://doi.org/10.3133/tm10C2.
Schneider, R.J., Jones, G.A., McNichol, A.P., von Reden, K.F., Elder, K.L., Huang, K., and Kessel, E.D., 1994, Methods for data screening, flagging, and error analysis at the National Ocean Sciences AMS Facility: Nuclear Instruments and Methods in Physics Research, Section B—Beam Interactions with Materials and Atoms, v. 92, nos. 1–4, p. 172–175, accessed November 19, 2024, at https://doi.org/10.1016/0168-583X(94)96000-3.
Stiff, H.A., Jr., 1951, The interpretation of chemical water analysis by means of patterns: Journal of Petroleum Technology, v. 3, no. 10, p. 376–379. [Available at https://doi.org/10.2118/951376-G.]
Thatcher, L.L., Janzer, V.J., and Edwards, K.W., 1977, Methods for determination of radioactive substances in water and fluvial sediments: U.S. Geological Survey Techniques of Water-Resources Investigations, book 5, chap. A5, 95 p., accessed November 19, 2024, at https://doi.org/10.3133/twri05A5.
U.S. Environmental Protection Agency, 2001, Technical fact sheet—Final rule for arsenic in drinking water: U.S. Environmental Protection Agency Fact Sheet 815-F-00-016, accessed October 26, 2023, at https://archive.epa.gov/water/archive/web/html/regulations_techfactsheet.html#area.
U.S. Environmental Protection Agency, 2023, Drinking water regulations: U.S. Environmental Protection Agency, accessed October 26, 2023, at https://www.epa.gov/dwreginfo/drinking-water-regulations.
U.S. Geological Survey, 2015, National field manual for the collection of water-quality data (ver. 7): U.S. Geological Survey website, accessed April 5, 2019, at https://water.usgs.gov/owq/FieldManual/.
U.S. Geological Survey, 2019, USGS water data for the Nation: U.S. Geological Survey National Water Information System database, accessed December 20, 2019, at https://doi.org/10.5066/F7P55KJN.
U.S. Geological Survey, 2024, Inorganic blind sample project: U.S. Geological Survey web page, accessed September 3, 2024, at https://qsb.usgs.gov/ibsp/.
Vogel, J.S., Nelson, D.E., and Southon, J.R., 1987, 14C background levels in an accelerator mass spectrometry system: Radiocarbon, v. 29, no. 3, p. 323–333. [Available at https://doi.org/10.1017/S0033822200043733.]
Voronin, L.M., Densmore, J.N., and Martin, P., 2014, Analysis of potential water-supply management options, 2010–60, and documentation of revisions to the model of the Irwin Basin Aquifer System, Fort Irwin National Training Center, California: U.S. Geological Survey Scientific Investigations Report 2014–5081, 34 p., accessed November 19, 2024, at https://doi.org/10.3133/sir20145081.
Voronin, L.M., Densmore, J.N., Martin, P., Brush, C.F., Carlson, C.S., and Miller, D.M., 2013, Geohydrology, geochemistry, and groundwater simulation (1992–2011) and analysis of potential water-supply management options, 2010–60, of the Langford Basin, California: U.S. Geological Survey Scientific Investigations Report 2013–5101, 86 p., accessed November 19, 2024, at https://doi.org/10.3133/sir20135101.
Conversion Factors
U.S. customary units to International System of Units
International System of Units to U.S. customary units
Temperature in degrees Celsius (°C) may be converted to degrees Fahrenheit (°F) as follows:
°F = (1.8 × °C) + 32.
Temperature in degrees Fahrenheit (°F) may be converted to degrees Celsius (°C) as follows:
°C = (°F − 32) / 1.8.
Datums
Vertical coordinate information is referenced to the North American Vertical Datum of 1988 (NAVD 88).
Horizontal coordinate information is referenced to the North American Datum of 1983 (NAD 83).
Elevation, as used in this report, refers to distance above the vertical datum (North American Vertical Datum 1988 [NAVD 88]), in feet.
Supplemental Information
Specific conductance is given in microsiemens per centimeter at 25 degrees Celsius (µS/cm at 25 °C).
Concentrations of chemical constituents in water are given in either milligrams per liter (mg/L) or micrograms per liter (µg/L).
Activities for radioactive constituents in water are given in picocuries per liter (pCi/L).
Results for measurements of stable isotopes of an element (with symbol E) in water, solids, and dissolved constituents commonly are expressed as the relative difference in the ratio of the number of the less abundant isotope (iE) to the number of the more abundant isotope of a sample with respect to a measurement standard.
Delta (δ) notation ratios are given in units of parts per thousand (per mil).
Concentrations in water-quality shape diagrams are given in units of milliequivalents per liter.
Abbreviations
14C
carbon-14
δD
deuterium to hydrogen ratio relative to the standard concentration in seawater
16O
oxygen-16
18O
oxygen-18
δ18O
oxygen-18 to oxygen-16 ratio relative to the standard concentration in seawater
Cr(VI)
hexavalent chromium
D
deuterium
1H
hydrogen-1
2H
deuterium
3H
tritium
MCL
maximum contaminant level
N
nitrogen
NTC
U.S. Army Fort Irwin National Training Center
NWQL
National Water Quality Laboratory
pmc
percent modern carbon
SMCL
secondary maximum contaminant level
TU
tritium unit
USGS
U.S. Geological Survey
WWTF
wastewater treatment facility
For more information concerning the research in this report, contact the
Director, California Water Science Center
U.S. Geological Survey
6000 J Street, Placer Hall
Sacramento, California 95819
https://www.usgs.gov/centers/california-water-science-center
Publishing support provided by the USGS Science Publishing Network,
Sacramento Publishing Service Center
Disclaimers
Any use of trade, firm, or product names is for descriptive purposes only and does not imply endorsement by the U.S. Government.
Although this information product, for the most part, is in the public domain, it also may contain copyrighted materials as noted in the text. Permission to reproduce copyrighted items must be secured from the copyright owner.
Suggested Citation
Densmore, J.N., Izbicki, J.A., Dick, M.C., and Bond, S., 2026, Evaluation of water quality in the Langford Valley–Irwin Groundwater Subbasin, Fort Irwin National Training Center, California, 1993–2019: U.S. Geological Survey Scientific Investigations Report 2025–5105, 45 p., https://doi.org/10.3133/sir20255105.
ISSN: 2328-0328 (online)
Study Area
| Publication type | Report |
|---|---|
| Publication Subtype | USGS Numbered Series |
| Title | Evaluation of water quality in the Langford Valley–Irwin Groundwater Subbasin, Fort Irwin National Training Center, California, 1993–2019 |
| Series title | Scientific Investigations Report |
| Series number | 2025-5105 |
| DOI | 10.3133/sir20255105 |
| Publication Date | January 09, 2026 |
| Year Published | 2026 |
| Language | English |
| Publisher | U.S. Geological Survey |
| Publisher location | Reston, VA |
| Contributing office(s) | California Water Science Center |
| Description | Report: x, 45 p.; Data Release |
| Country | United States |
| State | California |
| Other Geospatial | Fort Irwin National Training Center, Langford Valley–Irwin Groundwater Subbasin |
| Online Only (Y/N) | Y |