

Sediment Accumulation Rates and Volume in Pahranagat Wash above Arrow Canyon Dam in Northern Moapa Valley, Nevada
Links
- Document: Report (3.7 MB pdf) , HTML , XML
- Data Releases:
- USGS data release - Radiometric analysis (cesium-137 and lead-210) at selected depth intervals from borehole core of impounded sediments in Pahranagat Wash behind Arrow Canyon Dam, northern Clark County, Nevada
- USGS data release - Geospatial data for impounded sediments in Pahranagat Wash above Arrow Canyon Dam, in northern Moapa Valley, Nevada
- NGMDB Index Page: National Geologic Map Database Index Page
- Download citation as: RIS | Dublin Core
Abstract
An evaluation of sediment deposition rates and volume of impounded sediments in Pahranagat Wash behind Arrow Canyon dam in southeastern Nevada was done between 2016 and 2022. Data were collected and interpreted to address concerns by the Moapa Band of Paiutes and local historical preservation groups regarding the burial of culturally important sites by the impounded sediment deposited behind the dam. Sediment cores from two wells, drilled to depths that reflect the original stream-channel profile, and a third site drilled and sampled at a finer resolution, were analyzed radiometrically for lead-210 (210Pb) and cesium-137 (137Cs) isotopes. The analysis of the 210Pb data yielded an overall estimated sediment deposition rate of 2.4 inches per year (in/yr). Using the 137Cs data, the sediment deposition rate declined from 9.4 in/yr from 1934 to 1951 to 4.2 in/yr from 1951 to 1964 to 1.0 in/yr between 1964 and 2019.
Sediment volume was determined by defining boundaries using a 1-foot contour map generated using Unmanned Aerial Survey datasets and field observations. The volume calculation involved segmenting the study area based on the availability of sediment thickness data. The average sediment thickness in each segment was multiplied by the surface area of each segment to obtain the total sediment volume of 4.3×10⁷ cubic feet.
Introduction
Pahranagat Wash is a tributary to the Muddy River in southeastern Nevada (fig. 1), with a drainage area of approximately 994 square miles (mi2). Ephemeral runoff in Pahranagat Wash drains through a narrow channel in Arrow Canyon below Dead Man Wash (fig. 1). Discharge in the wash below the Arrow Canyon dam was measured between 1988 and 1993 at U.S. Geological Survey (USGS) surface-water gaging station 09415850 ( U.S. Geological Survey, 2020). The monthly mean discharge recorded during the period of record at this site includes a high of 0.92 cubic feet per second (ft3/s) in January and a low of 0.06 ft3/s in May, with several months of zero flow (table 1).
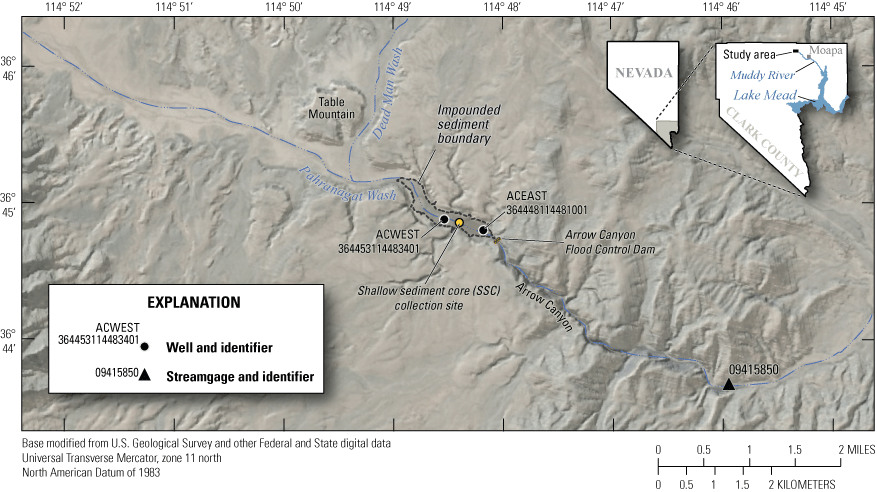
Pahranagat Wash, Nevada, study area with location of sample sites, Arrow Canyon Dam, and downstream streamgage.
Table 1.
Monthly mean discharge at U.S. Geological Survey surface-water gaging station 09415850 in Pahranagat Wash below Arrow Canyon Dam, Nevada (U.S. Geological Survey, 2020).[—, no data]
Floodwater in Pahranagat Wash is slowed at Arrow Canyon Dam (sometimes referred to as “the dam”) about 12.5 miles (mi) northwest of Moapa in Clark County, Nevada (fig. 1). The dam was constructed in 1934 by the Civilian Conservation Corps as a flood control and surface-water diversion (White, 2003) and was designed to store flood water and protect downstream property in Moapa Valley. The dam consists of a main structure built from locally quarried limestone approximately 35 feet (ft) tall and 30 ft wide at its base. A 2-ft-diameter outlet pipe extends through the base of the dam and allows drainage to a 32 ft wide, 6 ft-tall secondary dam and shallow rock apron that extends 33 ft downstream (White, 2003). Since its construction, periods of flooding that would have naturally transported sediments down the canyon have trapped fine-grained sediment behind the dam, filling the upstream pool to within approximately 7 ft of the dam’s crest. Sediments extend about 1 mile upstream in the basin and have covered culturally important sites, raising concern from the Moapa Band of Paiutes and local historical preservation groups. Additionally, because of sediment buildup behind the dam, it no longer functions as a flood control structure and is thus no longer protecting homes and tribal lands downstream from Moapa Valley (Federal Emergency Management Agency, 2011).
In 2019, the Bureau of Land Management (BLM) formed a cooperative agreement with the USGS to assess the volume and timing of sediment deposition behind Arrow Canyon Dam. The USGS evaluated the age, depositional rates, and volume of sediment in Pahranagat Wash by analyzing sediment cores from three data collection sites and conducting an unmanned aerial survey of the area behind Arrow Canyon Dam. The goal of this effort is to enhance understanding of the timing and magnitude of historical sediment accumulation and to assess the quantity of sediment behind the dam. This information will assist the BLM in determining which strategies are feasible for the management of the site.
Purpose and Scope
This report documents the methodology and results of an investigation of the sediment trapped behind Arrow Canyon Dam in Pahranagat Wash. The study objectives were to (1) evaluate the sediment accumulation rate behind Arrow Canyon Dam and how it has changed over time and (2) estimate the volume of stored sediment. The study results discussed in this report will assist the BLM in evaluating management options in the study area. In addition, a more thorough understanding of sediment impoundment behind dams in dry washes was gained. Pertinent data for this study can be found in the accompanying data releases by Wilson and Fuller (2025) and Wilson and others (2025).
Radiometric Dating of Sediment
Lead-210 has a half-life of 22.3 years and is part of the uranium-238 (238U) decay series formed after the radioactive decay of radon-222 (222Rn). Uranium-238 is found naturally in sediment, rocks, and soils and decays to radium-226 (226Ra). The decay of 226Ra releases 222Rn, an inert gas, into the atmosphere where it ultimately decays to 210Pb, which attaches to airborne particles and aerosols that are deposited by precipitation and dry deposition onto the Earth's surface. This deposition results in a surface accumulation of 210Pb higher than expected from in situ decay of 226Ra. Within the soil profile, 210Pb decays over time, at a known constant rate until its activity equals the parent 226Ra activity. Excess 210Pb activity (the difference of 210Pb and 226Ra) is widely used to age date and trace sediment accumulation in ecosystems (Mabit and others, 2014). Interpreting 210Pbex activity in sediments accumulated in the reservoir involves measuring the isotope's activity in a depth profile and fitting it to an exponential decay curve. The parameters of this curve can be translated into a deposition rate using the CF:CS method (Appleby and Oldfieldz, 1983).
Cesium-137 is the product of nuclear fission, and its presence in the environment can be traced to atmospheric high-yield thermonuclear testing beginning in summer 1951, with larger scale testing beginning in November 1952 (Van Metre and others, 2004; Rosen and Van Metre, 2010). After a voluntary moratorium on testing between 1958 and 1961, additional tests in 1963 resulted in a peak in the amount of atmospheric fallout. The maximum fallout of 137Cs was in 1964. Fallout decreased after 1964 and decreased to zero in 1976 when a full ban on atmospheric and ocean testing was implemented. The half-life of 137Cs is approximately 30.17 years, and like 210Pb, 137Cs was principally deposited through precipitation directly onto the sediment surface and onto the soils in the drainage basin; the soils are subsequently eroded and deposited, providing a tracer of the timing of sediment deposition. The timing of deposition is determined by measuring the activity of 137Cs in a depth profile. The depth of the first (deepest) detection is assumed to correspond to the date of 1952, and the depth of the highest activity is assumed to correspond to the date of 1964.
Methods
To determine the age, accumulation rate, and volume of the sediment behind the dam, the sediment analysis included sediment core sampling, radiometric analysis, and elevation mapping. The sediment core sampling was analyzed at three different sites, with the objective to capture a detailed account of historical sediment deposition upstream from the Arrow Canyon Dam. This process was followed by a thorough radiometric analysis to assess the age and accumulation rates of the sediments, using isotopes to derive insights into sedimentation over time. Additionally, elevation mapping was used to create high-resolution topographic models that provided contour maps to estimate the volume of sediment.
Sediment Core Sampling
In July 2016, the USGS collected cores from two wells that were drilled to depths representative of the original channel profile (fig. 2). The original purpose of these cores was to allow the BLM to examine changes in the seed bank over time, but they were also used for this study. Sediment cores at well installation sites ACWEST (USGS site number 364453114483401) and ACEAST (USGS site number 364448114481001; fig. 1) were collected every 2.5 ft using a tractor-mounted, direct-push drill rig. Core depths were 14.0 ft at ACWEST, and 24.4 ft ACEAST. Coring stopped when gravels and cobbles were detected and downward progression with the coring bit slowed. Coarser sediments composed of sand, gravels, and cobbles were consistent with the natural channel deposits upstream from Dead Man Wash and were interpreted as the top of the pre-dam wash channel. Approximately 92 percent of the core from ACWEST well and 99 percent of the core from ACEAST well was recovered. Core loss-gaps primarily were caused by challenges during drilling, which included sediment being dislodged from the shoe because of increased turbulence and the flushing of unconsolidated sediments during sample retrieval (table 2). Additionally, some sections of core had been lost or discarded before this study began, resulting in additional gaps between samples.
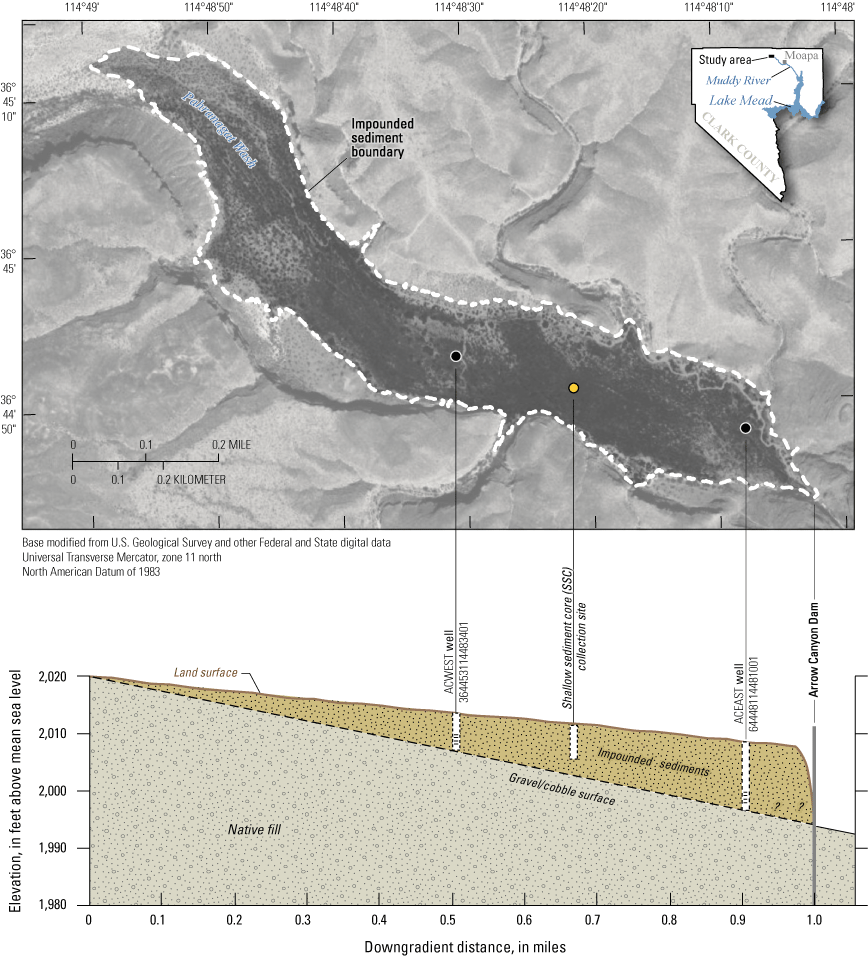
Location, depth, and cross-sectional interpretation of borehole observations in Pahranagat Wash above Arrow Canyon Dam, Nevada.
Table 2.
Depth and lithology of core from data collection sites at Pahranagat Wash upstream from Arrow Canyon Dam, Nevada.[Core ID: "cap" sediment from top of core, "shoe" sediment from bottom of drill bit. Abbreviation: ID, identification]
In February 2019, sediment from wells ACWEST (U.S. Geological Survey, 2019a) and ACEAST (U.S. Geological Survey, 2019b) were divided into vertical subsections, dried, sieved, and radiometrically analyzed at the USGS Menlo Park Sediment Radioisotope Lab. Results from the analysis prompted additional sediment sample collection and analysis. In April 2019, core from the shallow sediment core (SSC) site, between ACWEST and ACEAST, was collected to improve the depth resolution of the radiometric analysis (fig. 2). Samples were collected using a hand auger at intervals of 0.3–0.5 ft, with the differences in sample interval depending on either changes in lithology or changes in coring difficulty (table 2). The total depth of the SSC was 11.1 ft, and 100 percent of the core was retrieved.
Radiometric Analysis
Sediment cores were divided into vertical subsections spanning 0.2–0.6-ft depths, which represents depths from near surface to 13.0 ft at ACWEST, 19.6 ft at ACEAST, and 11.0 ft at the SSC (table 3; Wilson and Fuller, 2025). Activity concentrations of 137Cs, 210Pb, and 226Ra were measured from 40 to 124 grams of less than 75-micron fraction of dried and sieved sediment from each subsection, using a high-resolution intrinsic Germanium, planar detector gamma spectrometer following methods described in Fuller and others (1999) and Drexler and others (2018). The parent activity of 226Ra was subtracted from the measured total 210Pb activity to yield the 210Pbex activity. Activities of 226Ra were quantified from its short-lived daughter products lead-214 and bismuth-214, assuming secular equilibrium (Baskaran and Naidu, 1995), and 137Cs were decay corrected to the sample collection date (Leslie and Hancock, 2008).
Table 3.
Sample weight, representative depth, cesium-137 (137Cs), and excess lead-210 (210Pbex) values from sediment core at Pahranagat Wash upstream from Arrow Canyon Dam, Nevada (Wilson and Fuller, 2025).[DPM/g, disintegrations per minute per gram; N, not analyzed for radionuclides; pCi/g, picocurie per gram; SSC, shallow sediment core; STD, standard deviation; —, no data; <, less than]
Elevation Maps
The USGS created a topographic map of the Arrow Canyon area before the construction of Arrow Canyon Dam (U.S. Geological Survey, 1937). The benchmarks used to create the map were not clearly defined for the elevation contours to be used quantitatively in this study, but qualitatively, the map shows a steep-sided, flat-bottomed canyon.
In 2022, two Unmanned Aerial Survey datasets were collected and processed for the area around Pahranagat Wash above Arrow Canyon Dam; data are available in an accompanying data release (Wilson and others, 2025). Elevation and depth data collected at drill and sediment collection sites were used to determine total sediment volume.
Lidar data were collected using an uncrewed aircraft system on January 24, 2022 (Wilson and others, 2025). Nine check points were collected to compare to the lidar point-cloud data. The raw point cloud was filtered, and the bare-Earth points were used to produce a 1-meter resolution, bare-Earth digital elevation model (DEM). A 1-ft contour map was generated from the DEM (fig. 3).
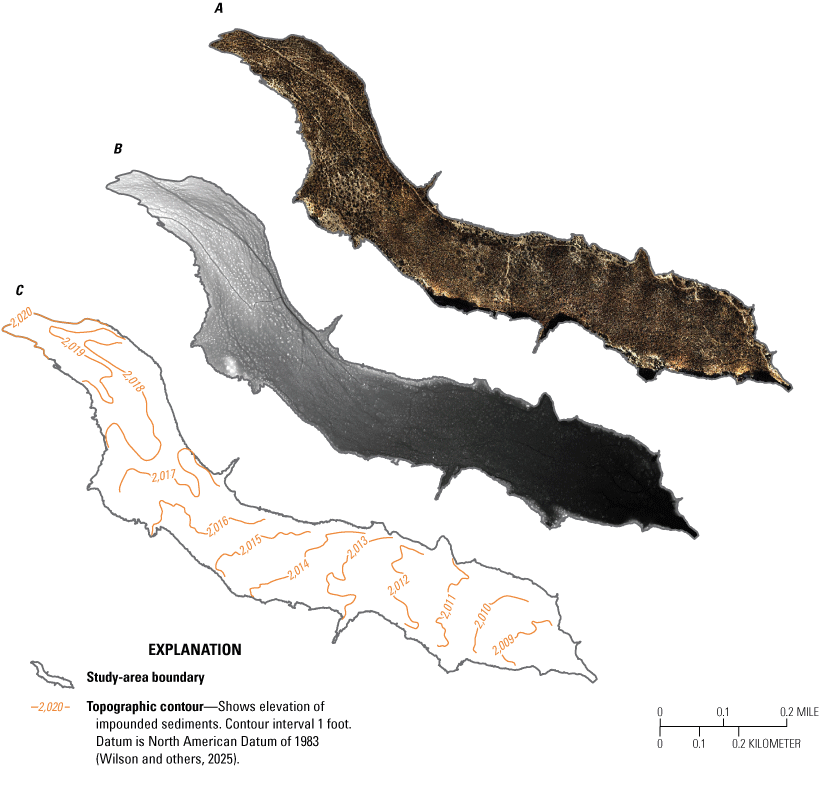
Uncrewed aircraft system data collected in Pahranagat Wash above Arrow Canyon Dam, Nevada. A, Orthorectified aerial image; B, digital elevation model; and C, contour map of elevation.
Sediment Accumulation Rates
Concentrations of 210Pbex activity with depth at core sites were graphically compared, averaged together, and fitted to an exponential decay curve for the SSC site (fig. 4). Values generally decrease with increasing depth, although there are several depths at which sediments with lower 210Pbex overlay sediments with higher 210Pbex. This pattern could be the result of older sediment from larger floods being deposited on top of more recent sediment from smaller floods. The CF:CS method was used to estimate an overall sedimentation rate of 2.4 inches per year.
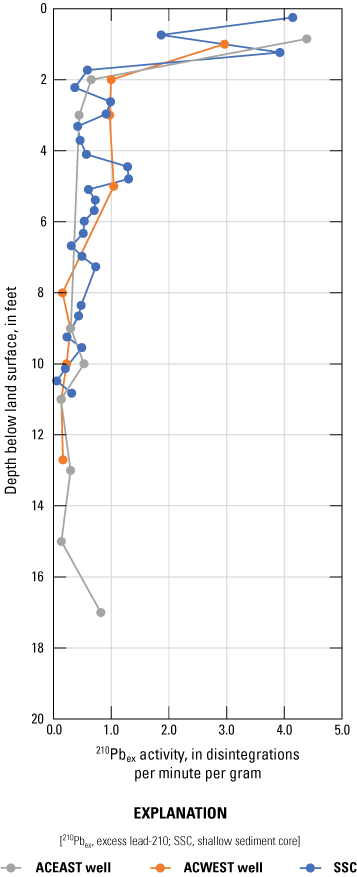
Profile of excess lead-210 (210Pbex) activity from core sediments collected in Pahranagat Wash behind Arrow Canyon Dam, Nevada.
The distribution of 137Cs activities with depth observed in the three sediment collection sites also are similar. The following results for 137Cs are presented for the SSC because it has the finest depth resolution; however, the patterns were consistent across all three sites (fig. 5). The first occurrence of 137Cs activity above the detection limit is at 9.0 ft below land surface. The combined 137Cs profile reaches maximum activity (interpreted as occurring approximately in the year 1964) at 4.4 ft below land surface, but there is a peak of similar magnitude at 5.7 ft below land surface (fig. 5). Because many atmospheric nuclear tests were carried out at the Nevada National Security Sites in southern Nevada, sediments in nearby areas may have separate 137Cs peaks for each individual test (Rosen and others, 2012). The SSC does not have sufficient vertical resolution to detect all the atmospheric tests carried out at the Nevada National Security Sites, so the maximum value at 4.4 ft below land surface was presumed to represent the 1964 fallout peak.
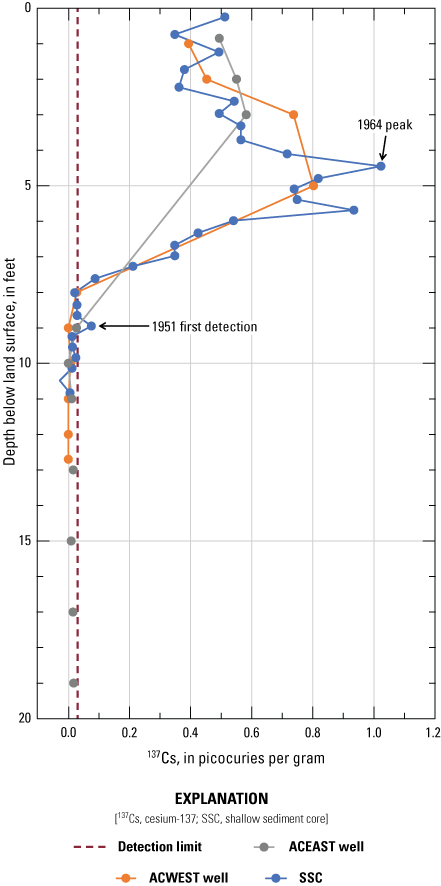
Profile of cesium-137 activity used to determine deposition dates in cores from Pahranagat Wash above Arrow Canyon Dam, Nevada.
Table 4 shows the sediment deposition rates calculated for 1934–51, 1951–64, and 1964–2019. The sediment deposition rate decreases over time. It is likely that a larger part of total sediment load transported in the first floods after dam construction was trapped behind the dam because of the large storage pool, resulting in a higher sediment deposition rate, whereas in later years, as sediment filled in the dam storage pool, less sediment deposition was possible, allowing floods to carry sediment downstream, which consequently reduced the deposition rate.
Table 4.
Sediment deposition rates calculated for 1934–51, 1951–64, and 1964–2019 using cesium-137 data in cores from Pahranagat Wash above Arrow Canyon Dam, Nevada.Sediment Volume
The sediment volume in the study area was estimated using indirect observations of flood deposits, primarily consisting of sand and clay, that developed after 1934 in the area between Dead Man Wash and Arrow Canyon Dam. The sediment volume was calculated by dividing the accumulated sediment into three subvolumes using the 1-ft contour map, sediment depth measurements from the ACWEST and ACEAST well sites, and elevation data from the DEM near Arrow Canyon Dam (fig. 6). The upstream area near Dead Man Wash was recorded as having zero depth. The measured depth of 4 ft at Arrow Canyon Dam was determined as the difference between the elevation below and above the dam, as indicated by the DEM. The depths between well sites are categorized into upstream, midstream, and downstream subvolumes. It is assumed that the depths within each subvolume change linearly from the upstream to downstream measurement points.
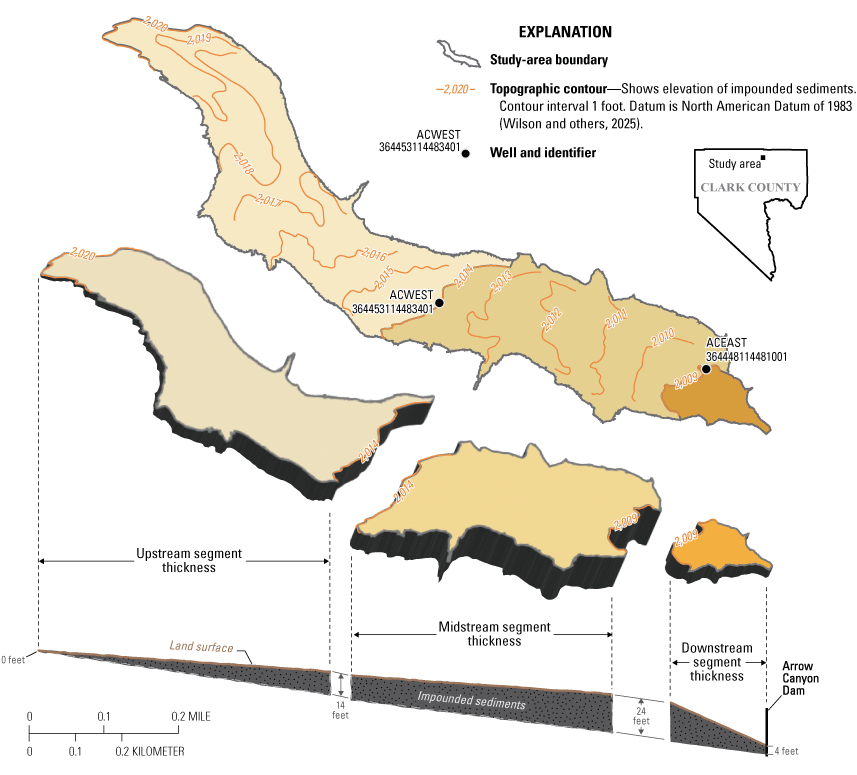
Topographic boundaries and segments of sediment thickness in Pahranagat Wash (note shown) above Arrow Canyon Dam, Nevada.
The upstream sediment subvolume represents the volume of sediment between well ACWEST and the elevation at which the sediment thins into cobbles and gravels. The area of this subvolume is defined as the area between the 2014- and 2020-foot contours, which correspond to the surface elevation of ACWEST and field observations of the easternmost impounded sediment, respectively. The average depth used to calculate the volume was 7 ft (the average of zero ft of impounded sediment at the upstream edge and 14 ft of impounded sediment at ACWEST).
The midstream sediment subvolume is between well ACWEST and well ACEAST. The area of this subvolume is defined as the area between the 2014- and 2009-foot contours, which correspond to the surface elevations of ACWEST and ACEAST, respectively. The average depth used to calculate the volume was 19 ft (the average of the 24 ft of impounded sediment at ACEAST and the 14 ft of impounded sediment at ACWEST).
The downstream sediment subvolume is between well ACEAST and the Arrow Canyon Dam. The area of this subvolume is defined as the area between the 2009-foot contour, which corresponds to the surface elevation of ACEAST and the dam. The average depth used to calculate the volume was 14 ft (the average of the 24 ft of impounded sediment at ACEAST and the estimated 4 ft of impounded sediment at the dam, where elevation drops sharply).
To determine sediment volume, the area of sediment behind the wash was divided into three distinct segments. For each of these segments, the average thickness of the sediment was measured and then multiplied by the corresponding surface area to determine the total volume for that segment (table 5). The cumulative total of the sediment volume across all three segments was 4.3×107 ft3.
Conclusions
Using the constant flux: constant sedimentation method, the estimated overall sediment accumulation rate of the sediment behind Arrow Canyon Dam was estimated to be 2.4 inches per year (in/yr) from the excess lead-210 (210Pbex) profile. Using the cesium-137 (137Cs) chronology, the rate declined from 9.4 in/yr from 1934 to 1951 to 4.2 in/yr from 1951 to 1964 to 1.0 in/yr between 1964 and 2019. The greater deposition rate in the years immediately after the dam was built indicate that even if all the sediment behind the dam was removed, the dam pool would refill quickly, likely because sediment-laden floodwaters would be impounded behind the dam.
The primary source of uncertainty in the 137Cs chronology is the identification of the 1964 peak, which could be as deep as 5.7 feet (ft) below land surface. Using the 5.7-ft depth does not affect the 1934–51 deposition rate. The 1951–64 and 1964–2019 deposition rates change slightly but still decrease with time.
The sediment volume in the study area was determined by defining sediment boundaries with elevation maps and field observations. The volume calculation involved segmenting the study area into upstream, midstream, and downstream segments based on the availability of sediment depth data. The average sediment thickness in each segment was multiplied by the surface area of each segment to obtain the total sediment volume of 4.3×10⁷ cubic feet. This total is the amount of sediment that would have to be removed to restore the area behind the dam to its original topography.
The largest source of uncertainty in the calculated sediment volume is the assumption that the area of the impounded sediment is the same at the surface as it is at depth. This assumption likely overestimates the calculated volume. Arrow Canyon was surveyed by the U.S. Geological Survey before construction. The resulting contour map shows that the canyon had steep walls and a broad, flat bottom, but the resolution of the map (20-ft contour intervals on the canyon walls) is insufficient to quantitatively evaluate the area of the canyon bottom. Further sediment coring to characterize the original canyon bottom surface would be needed to refine the calculated volume.
References Cited
Appleby, P.G., and Oldfieldz, F., 1983, The assessment of 210Pb data from sites with varying sediment accumulation rates: Hydrobiologia, v. 103, p. 29–35, accessed January 2, 2020, at https://doi.org/10.1007/BF00028424.
Baskaran, M., and Naidu, A.S., 1995, 210Pb-derived chronology and the fluxes of 210Pb and 137Cs isotopes into continental shelf sediments, East Chukchi Sea, Alaskan Arctic: Geochimica et Cosmochimica Acta, v. 59, no. 21, p. 4435–4448, accessed April 18, 2025, at https://doi.org/10.1016/0016-7037(95)00248-X.
Drexler, J.Z., Fuller, C.C., and Archfield, S., 2018, The approaching obsolescence of 137Cs dating of wetland soils in North America: Quaternary Science Reviews, v. 199, p. 83–96, accessed April 18, 2025, at https://doi.org/10.1016/j.quascirev.2018.08.028.
Federal Emergency Management Agency, 2011, Flood insurance study, Clark County, Nevada, and incorporated areas (revised November 16, 2011): Federal Emergency Management Agency Food Insurance Study Number 32003CV001C, v. 1 of 2, 113 p., accessed April 18, 2025, at https://map1.msc.fema.gov/data/32/S/PDF/32003CV001C.pdf.
Fuller, C.C., van Geen, A., Baskaran, M., and Anima, R., 1999, Sediment chronology in San Francisco Bay, California, defined by 210Pb, 234Th, 137Cs, and 239,240Pu: Marine Chemistry, v. 64, nos. 1–2, p. 7–27, accessed December 19, 2019, at https://doi.org/10.1016/S0304-4203(98)00081-4.
Leslie, C., and Hancock, G.J., 2008, Estimating the date corresponding to the horizon of the first detection of 137Cs and 239+240Pu in sediment cores: Journal of Environmental Radioactivity, v. 99, no. 3, p. 483–490, accessed April 18, 2025, at https://doi.org/10.1016/j.jenvrad.2007.08.016.
Mabit, L., Benmansour, M., Abril, J.M., Walling, D.E., Meusburger, K., Iurian, A.R., Bernard, C., Tarján, S., Owens, P.N., Blake, W.H., and Alewell, C., 2014, Fallout 210Pb as a soil and sediment tracer in catchment sediment budget investigations—A review: Earth-Science Reviews, v. 138, p. 335–351, accessed April 18, 2025, at https://doi.org/10.1016/j.earscirev.2014.06.007.
Rosen, M.R., Turner, K., Goodbred, S.L., and Miller, J.M., eds., 2012, A synthesis of aquatic science for management of Lakes Mead and Mohave: U.S. Geological Survey Circular 1381, 162 p., accessed January 3, 2020, at https://doi.org/10.3133/cir1381.
Rosen, M.R., and Van Metre, P.C., 2010, Assessment of multiple sources of anthropogenic and natural chemical inputs to a morphologically complex basin, Lake Mead, USA: Palaeogeography, Palaeoclimatology, Palaeoecology, v. 294, nos. 1–2, p. 30–43, accessed April 18, 2025, at https://doi.org/10.1016/j.palaeo.2009.03.017.
U.S. Geological Survey, 1937, Plan of Muddy River, Nevada—Above a point 3 miles below Overton, miscellaneous dam sites: U.S. Geological Survey unnumbered series, 2 plates, Map Scale 1:31,680, accessed October 30, 2019, at https://doi.org/10.3133/70200389.
Van Metre, P.C., Wilson, J.T., Fuller, C.C., Callender, E., and Mahler, B.J., 2004, Collection, analysis, and age dating of sediment cores from 56 U.S. lakes and reservoirs sampled by the U.S. Geological Survey, 1992–2001: U.S. Geological Survey Scientific Investigation Report 2004–5184, 187 p., accessed April 18, 2025, at https://doi.org/10.3133/sir20045184.
Wilson, J.W., and Fuller, C.C., 2025, Radiometric analysis (cesium-137 and lead-210) at selected depth intervals from borehole core of impounded sediments in Pahranagat Wash behind Arrow Canyon Dam, northern Clark County, Nevada: U.S. Geological Survey data release, at https://doi.org/10.5066/P9P9Q1A8.
Wilson, J.W., Bauer, M.A., and Burgess, M.A., 2025, Geospatial data for impounded sediments in Pahranagat Wash above Arrow Canyon Dam, in northern Moapa Valley, Nevada: U.S. Geological Survey data release, at https://doi.org/10.5066/P9C4DRI5.
Conversion Factors
U.S. customary units to International System of Units
Datums
Horizontal coordinate information is referenced to the North American Datum of 1983 (NAD 83)
Elevation, as used in this report, refers to distance above the vertical datum.
Supplemental Information
Activities for radioactive constituents in sediment are given in activity units of picocuries per gram (pCi/g), and disintegrations per minute per gram (dpm/g).
For more information concerning the research in this report, contact the
Nevada Water Science Center
U.S. Geological Survey
2730 N. Deer Run Road
Suite 3
Carson City, Nevada 89701
https://www.usgs.gov/centers/nevada-water-science-center
Publishing support provided by the USGS Science Publishing Network,
Sacramento Publishing Service Center
Disclaimers
Any use of trade, firm, or product names is for descriptive purposes only and does not imply endorsement by the U.S. Government.
Although this information product, for the most part, is in the public domain, it also may contain copyrighted materials as noted in the text. Permission to reproduce copyrighted items must be secured from the copyright owner.
Suggested Citation
Wilson, J.W., Poff, B., and Fuller, C.C., 2025, Sediment accumulation rates and volume in Pahranagat Wash above Arrow Canyon Dam in northern Moapa Valley, Nevada: U.S. Geological Survey Scientific Investigations Report 2025–5106, 14 p., https://doi.org/10.3133/sir20255106.
ISSN: 2328-0328 (online)
Study Area
| Publication type | Report |
|---|---|
| Publication Subtype | USGS Numbered Series |
| Title | Sediment accumulation rates and volume in Pahranagat Wash above Arrow Canyon Dam in northern Moapa Valley, Nevada |
| Series title | Scientific Investigations Report |
| Series number | 2025-5106 |
| DOI | 10.3133/sir20255106 |
| Publication Date | December 16, 2025 |
| Year Published | 2025 |
| Language | English |
| Publisher | U.S. Geological Survey |
| Publisher location | Reston, VA |
| Contributing office(s) | Nevada Water Science Center |
| Description | Report: vi, 14 p.; 2 Data Releases |
| Country | United States |
| State | Nevada |
| Other Geospatial | Pahranagat Wash above Arrow Canyon Dam |
| Online Only (Y/N) | Y |