

A Probabilistic Assessment Methodology for the Evaluation of Geologic Energy Storage Capacity—Natural Gas Storage in Depleted Hydrocarbon Reservoirs
Links
- Document: Report (2.34 MB pdf) , HTML , XML
- NGMDB Index Page: National Geologic Map Database Index Page (html)
- Download citation as: RIS | Dublin Core
Acknowledgments
This report relied on previous energy resource assessment methodologies at the U.S. Geological Survey and we thank the authors of those reports. The authors acknowledge input from previous project task members, including Steven Anderson and Celeste Lohr. We appreciate the motivation for this work provided through conversations with Richard Esposito from Southern Company and Angela Goodman and Greg Lackey from the National Energy Technology Laboratory. We further appreciate the technical input provided by Autumn Haagsma and Bill Harrison from the Michigan Geological Survey and by Joseph Mozelewski from NITEC, LLC. Substantial improvements and modifications to earlier versions could not have occurred without peer reviews from Jane Hearon, Ӧzgen Karacan, and Clinton Scott.
Abstract
The need for energy storage, particularly underground, where capacity and duration may far exceed battery storage technologies, is especially relevant given the increasing demands for reliable power alongside the development of intermittent renewable electricity sources. Geologic energy storage facilities already exist, and expanded use would enable storing gases such as methane and hydrogen. In 2018, a National Academies of Sciences, Engineering, and Medicine report, “Future Directions for the U.S. Geological Survey's Energy Resources Program,” recommended that the U.S. Geological Survey (USGS) prioritize assessing underground energy storage in geologic formations in the United States.
The USGS has since developed a methodology for assessing natural gas storage capacities in depleted hydrocarbon reservoirs on a national scale. The methodology introduced in this report prescribes three approaches for calculating gas storage capacity. This methodology relies on the availability of input data, including cumulative hydrocarbon production records, reservoir petrophysical properties, and reservoir pressure data. Assessment inputs can be obtained from public State-level databases and propriety national-scale databases, although the use of analogs could be warranted for estimating input parameters. Probabilistic assessment results are aggregated to play, petroleum province, regional, and national scales. The steps defined in this report are demonstrated on the Michigan Basin Province, which includes the Mississippian Sandstone Gas Play and the Clinton Structural Play. This methodology could be used to systematically and consistently assess hydrocarbon plays and provinces for natural gas storage capacity across the United States.
Plain Language Summary
Energy storage for future use is relevant at the national scale due to increasing power requirements and the desire for high-reliability supply. Having the ability to store energy gases underground, specifically natural gas, enables access during seasonal periods or times of unexpected demand. Geologic formations—namely depleted hydrocarbon reservoirs—are ideal underground settings for storing natural gas because they retained gas over geologic time scales. This report presents a methodology for estimating potential volumes of natural gas that can be stored in depleted hydrocarbon reservoirs. The methodology draws on the expertise of geologists and hydrocarbon production databases to first identify candidate reservoirs and then estimate probable storage volumes. The computed results may be combined into regional and national estimates for follow-on analysis and decision making. An example is provided that shows this methodology being used to evaluate the storage capacity for two “plays”—oil and gas accumulations where similar geologic conditions exist—in the Michigan Basin.
Introduction
Background
Geologic Energy Storage
The storage of energy for future use accommodates seasonal demand, allows for strategic stockpiles, and provides baseload power when renewable energy sources are variable. Energy consumption in the United States is shifting away from traditional fossil fuels like coal and oil and toward the inclusion of natural gas and renewable sources (U.S. Energy Information Administration [EIA], 2023a). Geologic energy storage refers to the storage of excess energy in underground settings. Above-ground energy storage often occurs in batteries and tanks, whereas underground storage in geologic formations allows for the retention of much greater quantities of energy—especially compressed gases and fluids—over much longer periods (Crotogino and others, 2018; Matos and others, 2019). Increased energy storage can benefit from an approach that encompasses all available storage types, including underground and above-ground technologies (Comello and Reichelstein, 2019). Underground storage affords flexibility, as different types and configurations of geologic formations can host different forms of energy.
In 2023, the U.S. Geological Survey (USGS) released Fact Sheet 2022–3082, “Geologic Energy Storage” (Buursink and others, 2023), which describes geologic energy storage and potential methods and settings for underground storage. Three broad categories of geologic storage, which include chemical, mechanical, and thermal methods, are described. The possible storage settings discussed are depleted hydrocarbon reservoirs, abandoned mines, purpose-drilled shafts, solution-mined salt caverns, and nonpotable aquifers (fig. 1) (Buursink and others, 2023). The work was motivated by the National Academies of Sciences, Engineering, and Medicine (NASEM) report “Future Directions for the U.S. Geological Survey's Energy Resources Program” (NASEM, 2018).
The NASEM report found that “Assessing the storage potential for various basins in the United States could become a new and strategically important priority for the ERP [USGS Energy Resources Program]” (NASEM, 2018, p. 101). The assessment methodology detailed in this report focuses on estimating capacities for storing natural gas and potentially storing other gaseous energy sources, such as hydrogen (using chemical storage methods), in depleted reservoirs that primarily produced natural gas. Other approaches being designed at the USGS focus on different combinations of storage methods and underground settings.

Schematic cross section showing examples of chemical (methane and hydrogen), mechanical (compressed air, pumped hydroelectric, and gravity), and thermal (warm and cool water) geologic energy storage methods in potential underground settings in a sedimentary basin. Storage in depleted hydrocarbon reservoirs, with primarily gas reservoirs the topic of this methodology, is circled with red dashes. Image is modified from Buursink and others (2023). The image shows shaft-, mine-, and well-based methods on the surface, along with shafts, mines, caverns, and reservoirs in the subsurface. Also depicted are warm temperature, cool temperature, and gas accumulations. Geologic intervals depicted include potable and nonpotable aquifers, shale, coal, salt, sandstone, and bedrock.
Natural Gas Storage
Natural gas is commonly stored to balance seasonal variation; for example, between colder months, when demand exceeds production, and warmer months, when production exceeds demand (Evans and Chadwick, 2009; Plaat, 2009). About 20 percent of the natural gas consumed each winter in the United States comes from underground storage (American Petroleum Institute, 2021). Additionally, storing natural gas lets existing pipeline system capacity be used more efficiently, as natural gas purchased at a lower price can be stored near local facilities and then used to meet swings in demand and accommodate favorable pricing through a process known as arbitrage (Aneke and Wang, 2016; Attanasi and Freeman, 2023). Unlike the Strategic Petroleum Reserve in Louisiana and Texas, natural gas is not stockpiled for national security purposes (Bamberger, 2006). The methods presented in this report can help address natural gas storage.
Natural gas is currently stored underground in the United States by commercial operators in geologic settings such as depleted hydrocarbon reservoirs, nonpotable aquifers, and solution-mined salt caverns (refer to Katz and Tek [1981], American Gas Association [1990], and Wang and Economides [2012] for examples). Use of these storage facilities depends upon the qualities of the geologic formations, the presence of natural gas transmission pipelines, surface or pore-space ownership, and the proximity of these formations to users in urban centers (Wang and Economides, 2012; Schultz and Evans, 2020). To complement these established industry drivers, the USGS developed a geology-based method that can successfully assess additional underground natural gas storage capacity nationwide.
Assessment Methodology Scope
The methodology presented in this report examines natural gas storage in depleted hydrocarbon reservoirs in U.S. sedimentary basins. Methods for storing other energy gases, such as hydrogen, may be derived using additional steps that involve fluid substitution (refer to Lackey and others [2023] and Jones and others [2024] for further information). For this assessment, a gas reservoir is defined as any hydrocarbon accumulation with a cumulative produced gas-to-oil ratio (GOR) above 10,000 standard cubic feet of gas per barrel of oil (SCF/Bbl) (which is a conservative definition according to Carolus and others [2018] and Warwick and others [2019]). While the GOR of a reservoir can change during its production lifecycle, the cumulative production ratio is considered a fair representation for this assessment.
This report does not describe assessing gas storage in depleted oil reservoirs, aquifers, or salt caverns, because these features comprise a smaller resource base (Pipeline and Hazardous Materials Safety Administration, 2023). The storage of natural gas in depleted oil reservoirs also involves uncertainty, given the complicated gas and fluid phase interactions and the potential for contaminating stored gas, which is commonly encountered by storage operators (Plaat, 2009). Buoyant aquifer storage is not addressed due to the technical and geologic risks, the expense of characterizing the potential interaction with groundwater, and a lack of new U.S. projects of this type in recent decades (Schultz and Evans, 2020). However, storing gas, compressed air, and other fluids in salt caverns is relevant and could be addressed in future assessments.
Objective
The objective of this report is to describe an assessment methodology for estimating the volumes of natural gas, and possibly other energy gases, that could be stored in depleted hydrocarbon reservoirs using current technologies. The development of this methodology is guided by (1) established engineering practices used by gas storage facility operators to maximize seasonal storage capacity, (2) State regulations, and (3) economic factors (Coats, 1966; Katz and Coats, 1968).
The approach in this report does not account for all of the real-world conditions and external constraints under which natural gas storage facilities operate. Reservoir-specific engineering considerations not addressed by this assessment include leakage from abandoned wells, groundwater infiltration, and the compaction of pore space after reservoir production (for example, Chang and others [2014] and Michanowicz and others [2017]). The estimation process described here does not include economic or technical constraints, such as the availability of pipelines for gas transmission and limits on surface ownership related to accessing injection and withdrawal wells. In the “Demonstrating Storage Capacity in the Michigan Basin” section of this report, example assessment results are aggregated and reported for two plays in the Michigan Basin and show a first order estimate of additional gas storage capacity to demonstrate the application of this probabilistic methodology.
Assessment Framework
U.S. Geological Survey Assessment Background
The USGS periodically assesses major stratigraphic intervals in petroliferous basins to evaluate the potential volumes of undiscovered, technically recoverable, conventional, and continuous oil and gas resources onshore in the United States and in State waters (for examples, refer to Gautier and others [1996], Charpentier and Klett [2005], and the U.S. Geological Survey [2024]). The USGS also released methods and assessments of buoyant and residual trapping for the geologic sequestration of carbon dioxide (CO2) (Brennan and others, 2010; Blondes and others, 2013a; U.S. Geological Survey Geologic Carbon Dioxide Storage Resources Assessment Team, 2013), CO2 enhanced oil recovery (Warwick and others, 2019; Warwick and others, 2022), and helium resources (Brennan and others, 2021). The assessment of underground gas storage capacity presented here builds on the experience of these established, nationwide USGS resource assessments. Subsequently, estimates of gas storage capacity are computed at the play, basin, and regional scales and not focused on specific reservoirs or wells.
Current Underground Gas Storage Practices
Currently, about 400 natural gas storage facilities occupy underground settings and geologic settings across the United States. Starting in 2016, the Pipeline and Hazardous Materials Safety Administration (PHMSA) began inspecting and collecting data on the operations of interstate storage facilities across 31 States. There are currently about 300 of these facilities (PHMSA, 2023). State data collection on intrastate-only facilities—those not linked to interstate pipelines, which constitutes another 80 facilities, according to the PHMSA—varies widely in reporting requirements and frequency. The number of active and inactive facilities is usually tracked by regulators (PHMSA, 2023).
Storage facilities often report both working gas and base gas volumes. These reports are based on proprietary studies and measured flows and usually sum to the total gas volume. The underground storage of natural gas requires a volume of base or cushion gas that remains in the reservoir. This base gas is intended to maintain pressure support to reduce groundwater encroachment and pore space compaction in the reservoir (Katz and Tek, 1981; Plaat, 2009). The working gas volume is the gas expected to be injected into the reservoir for later withdrawal and marketplace availability, exclusive of the base gas (Plaat, 2009; U.S. Energy Information Administration [EIA], 2015). The U.S. Energy Information Administration (EIA) collects data from storage facility operators and publishes selected capacity data weekly, monthly, and annually. In 2022, based on EIA data, about 9.27 trillion cubic feet (Tcf) of total gas storage capacity, including about 4.79 Tcf of working gas storage capacity, was available in the United States (EIA, 2023b). Of the total working gas storage capacity, about 82 percent of the gas was stored in depleted hydrocarbon reservoirs, with the remainder stored in salt caverns (10 percent) and typically nonpotable aquifers (8 percent) (EIA, 2023b). Underground gas storage is currently the most evaluated and applied of all energy storage methods among the varied geologic settings used (Crotogino and others, 2018; Matos and others, 2019).
Additional Storage in Depleted Reservoirs
Depleted hydrocarbon reservoirs—primarily those that produced oil, gas, and natural gas liquids—are the most common storage setting, having been used for gas storage in the United States since 1916 (for example, near Buffalo, New York; refer to Beckman and others [1995]). Consequently, these formations are likely to continue to be used in future geologic energy storage projects. These conventional hydrocarbon reservoirs are usually well-defined by previous geophysical characterizations and development drilling and, therefore, are less costly to develop than other geologic storage options, such as saline aquifers and salt caverns (Lake and Carroll, 1986; Plaat, 2009).
Depleted hydrocarbon reservoirs have a demonstrated storage capability because they trapped hydrocarbons for as long as hundreds of millions of years before production. Regardless, the continuous monitoring of existing storage facilities is a standard industry practice (Orr and Dominguez, 2016; Callas and others, 2022). Depleted hydrocarbon reservoirs are primarily used to store natural gas, but given appropriate pressures and seals, they could be used to store liquid petroleum gas (LPG), carbon dioxide, hydrogen, ammonia (a hydrogen carrier), or compressed air. For examples, refer to Lord and others (2014), Budt and others (2016), Attanasi and Freeman (2023), and Lackey and others (2023). Natural gas can also be stored in depleted oil reservoirs, where it occupies the primary gas cap or a secondary cap formed during oil production; however, contamination of the injected gas is possible (Goodman, 1968; Plaat, 2009).
Sandstone and carbonate lithologies are both amenable to underground gas storage facilities (Wang and Economides, 2012; Schultz and Evans, 2020), and geologic considerations of existing projects are summarized in this report. Sedimentary basins, often composed of geologic formations with these lithologies could, therefore, provide substantial capacities for additional gas storage, given favorable reservoir properties (for example, porosity and permeability). Furthermore, underground gas storage projects can inject and withdraw gas from multiple zones comprising one or more geologic formations or pressure-connected intervals (also known as reservoirs).
The focus of the methodology presented in this report is assessing depleted conventional reservoirs that primarily trapped significant accumulations of gas. These reservoirs are presumed to have porosity and permeability qualities that enable holding and transmitting gas and also have working seals or caprocks that limit gas leakage.
Assessing Storage Capacity
Flow Chart and Assessment Procedure
A methodology for assessing the potential storage of natural gas (and other energy gases) and the associated capacity in depleted hydrocarbon reservoirs benefits from a robust understanding of geology, reservoir engineering, and the operational aspects of gas storage. A summary of the steps that constitute this methodology are shown in the flowchart in figure 2. The flowchart illustrates the process for (1) using databases to obtain reservoir data, (2) identifying candidate depleted reservoirs using GIS, (3) computing three probabilistic estimates for storage, and then (4) aggregating these results for further understanding. The assessment steps and inputs, along with necessary classifications, are explained in the following sections.
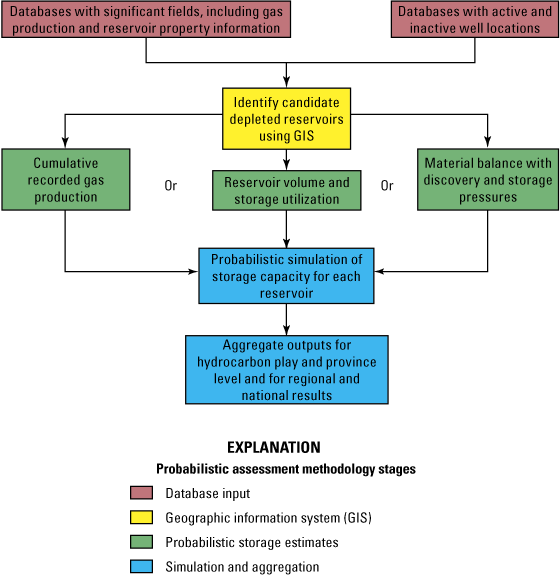
Flowchart showing the framework of the U.S. Geological Survey (USGS) probabilistic assessment methodology for estimating gas storage capacity in candidate hydrocarbon reservoirs. The data input stages, including gas production records, reservoir property information, and well activity (and inactivity) data are the initial two flowchart box options (shown in red). The geographic information system (GIS) stage, which involves identifying depleted reservoirs occurs next (shown in yellow). The three possible approaches with qualitative descriptions of the inputs—the corresponding equations and detailed descriptions of the input variables, which are shown in section “Step 2. Calculating Storage Capacity” in the report—follow the GIS step (and are shown in green). The two final, successive steps—the Monte Carlo simulation (probabilistic simulation of storage capacity for each reservoir) and aggregation steps (aggregate outputs for hydrocarbon play and province level, and for regional and national results) are the final steps in the flow chart (and are shown in blue). The choice of calculating gas storage capacity with one or more of the approaches is primarily determined by the available assessment input data.
Step 1. Identifying Candidate Gas Reservoirs
Reservoirs are candidates for storage when depleted after primarily producing gas. Reservoir depletion is related to field abandonment, which occurs when hydrocarbon production is no longer economically favorable due to external market factors or technical conditions. These external factors can include a drop in commodity prices or a lack of affordable access to transmission infrastructure. Changing technical conditions can include a drop in reservoir pressure affecting the production drive or water production (water cut), often requiring additional disposal measures and increased expenses. Also, as described in the “Assessment Methodology Scope” section, this methodology focuses on hydrocarbon reservoirs with a GOR of 10,000 SCF/Bbl or greater. A consistent and repeatable approach is needed for identifying depleted gas reservoirs potentially available for new storage projects.
One approach for identifying depleted reservoirs is based on applying a predetermined gap in production noted at the well or entity level (for example, lease, reservoir, or field) (Varela and Buursink, 2025). If a collection of wells or producing entities associated with a specific reservoir show an extended time gap since production (greater than 5 years) or were not assigned production, then abandonment is assumed. A 5-year production gap was determined significant after a review of the full range of gaps in a commercial oil and gas production database (S&P Global Commodity Insights [SPGCI], 2023). Although production gaps ranging from months to decades were observed, wells with a 5-year or greater production gap returned to production status at a rate of less than 1 percent (Varela and Buursink, 2025). An example application of this approach is shown in figure 3, wherein both active and abandoned wells are shown around a selected reservoir under consideration in the Michigan Basin. Active wells located in and around a field under consideration and producing from the target formation indicate that the reservoir is not necessarily depleted and not a candidate for storage.

Map of a demonstration assessment area (also shown on inset map of Michigan) with locations for active and abandoned (inactive; those without activity for 5 years) hydrocarbon production wells (Varela and Buursink, 2025). Also shown are outlines of existing gas storage fields and Michigan stray sandstone hydrocarbon fields, based on data from the Michigan Public Service Commission (2024). Significant fields, based on data from Nehring Associates, Inc. (2017), are highlighted. Although active and inactive wells are located in and around Evart field, the few active wells do not produce from the Michigan stray, part of the hydrocarbon play being evaluated. Therefore, this reservoir is confirmed as abandoned and a candidate for a storage capacity calculation.
Another approach for identifying depleted reservoirs involves reviewing yearly reservoir-level production data. An example is reviewing data from commercial databases (Nehring Associates, Inc., 2017). This practice is often called decline curve analysis (Arps, 1945; Fetkovich and others, 1987; Jahediesfanjani, 2017). However, reservoir-level production data in a database are often calculated from comingled field-level production numbers, as reported by the operator. These field-level data are called unallocated production and might be allocated to reservoirs based on historical information. There is no reliable substitute for this reservoir-level information, which could complicate decline curve analysis. Secondary or tertiary recovery efforts could also alter the production record. Only reliable and allocated time-series production data can allow this approach to be consistently applied. If the reservoir shows no production for more than a fixed number of years, based on localized State-level conditions determined during the assessment, the reservoir is assumed abandoned and available for storage.
Gas Storage Reservoir Classes
Assessment results can be organized into classes to better relate gas storage estimates at the reservoir level to potential end users. Other USGS assessments consider conventional and continuous undiscovered hydrocarbon resources (U.S. Geological Survey, 2024) and regular and deep CO2 sequestration (U.S. Geological Survey Geologic Carbon Dioxide Storage Resources Assessment Team, 2013). Only conventional gas reservoirs are addressed in this report. Regardless, for underground gas injection, a practical way to distinguish storage classes is by reservoir depth. As reservoir depth increases, the cost of gas compression typically increases (Coats, 1966; Katz and Tek, 1981).
In this methodology, an 8,000 foot (ft) true vertical-depth cutoff is used for the reservoir top, based on (1) the maximum operating depths at most existing storage facilities and (2) decreasing porosity with depth. The literature on sandstone porosity (for example, Ehrenberg and Nadeau, [2005] and Okoroafor and others, [2022]) reports significant porosity reduction due to compaction and connects diagenesis to increased depth. Separately, when plotting the reservoir depths for existing natural gas storage facilities tabulated in the American Gas Association (2021) and PHMSA (2024) databases, a histogram of these data shows a marked dropoff at about 8,000 ft. Consequently, these assessment results are reported as two depth classes: a regular class (reservoirs less than 8,000-ft deep) and a deep class (reservoirs greater than 8,000-ft deep). A minimum reservoir size should be established to focus assessment efforts; this matter is discussed in Step 3.
Step 2. Calculating Storage Capacity
Underground gas storage capacity can be calculated using the three governing equations defined in this step:
• the recorded production approach (eq. 1),
• the reservoir volumetric approach (eq. 2),
• or the material balance approach (eq. 3).
Each approach considers different gas and reservoir properties and includes a governing equation for calculating storage capacity, or working gas volume, specifically (Katz and Coats, 1968; Tek, 1987; Wang and Economides, 2009b). In this methodology, the three approaches are presented in order of increasing complexity; however, each can be used separately or combined using statistical approaches such as linear regression models or measurement error models to produce more accurate predictions of storage resources (Jones and others, 2024). For example, if only cumulative gas production is known, the first equation is used. If successive production and pressure values are recorded, the third equation can be used instead. As explained in the following section, the applicability of each approach relies on the availability of data about a given reservoir. A combined application of these approaches that uses input data from the Michigan Basin is shown in the “Demonstrating Storage Capacity in the Michigan Basin” section.
Recorded Production Approach
For the recorded production approach, storage capacity is calculated based on recorded cumulative gas production from the target reservoir using curve-fitting parameters. This calculation results in a net storage or working gas capacity because it is assumed that the cushion or base gas is accounted for by the volume of unproduced gas remaining in the reservoir. The operating premise is that the unproduced gas previously provided pressure support during production and would again (as cushion gas) during the delivery of stored gas (Katz and Coats, 1968).
This governing equation (eq. 1) explains the recorded production approach:
where
Gstor
is the estimated storage or working gas capacity calculated at standard conditions, in billion cubic feet (Bcf);
Gprod
is the recorded cumulative gas production measured at standard conditions (Bcf);
m
is a discretionary, unitless, empirical correction factor based on the curve fitting of data from existing representative storage facilities; and
b
is a discretionary, empirical correction factor based on curve fitting of data from existing representative storage facilities (Bcf).
This approach considers standard conditions or surface gas volumes and does not correct with a formation volume factor. It does not consider available capacity due to oil and natural gas liquids (NGLs) from a high GOR gas reservoir, as this is often a fraction within the uncertainty range of the assessment inputs described in Step 3 (Nehring Associates, Inc., 2017; Mokhatab and others, 2019).
For equation 1, the discretionary correction factor, m, may be needed to account for a discrepancy between the record of produced gas and any record of other unproduced hydrocarbons when these data are available (Katz and Coats, 1968; Jones and others, 2024). This factor may be greater than 1 when gas storage pressures exceed initial reservoir pressures, as explained below. The other discretionary correction factor, b, is an empirical value based on the curve fitting of data from representative existing storage facilities when they are in the assessment area (Jones and others, 2024).
Reservoir Volumetric Approach
For the reservoir volumetric approach, the total storage-capacity calculation is based on the pore-space volume in the target reservoir and involves a conversion to gas surface volumes to obtain storage capacity at reservoir conditions. This capacity is total storage and accounts for both working gas and cushion gas volumes until multiplied by a storage utilization factor.
This governing equation (eq. 2) explains the reservoir volumetric approach:
where
Gstor
is the estimated storage or working gas capacity calculated at standard conditions, in billion cubic feet (Bcf);
Vgross
is the gross rock volume = reservoir area (A) × gross thickness (tgross) (in cubic feet);
is the unitless net-to-gross ratio for the reservoir height;
θ
is the unitless porosity (or porosity of net-porous interval) fraction;
Sgi
is the unitless initial gas saturation, assuming an insignificant fraction of oil or natural gas liquids;
Bgas
is the gas formation volume factor (Bcf at reservoir conditions per Bcf at standard conditions); and
fstor.util
is the unitless storage utilization factor converting total storage to working gas capacity.
This approach assumes that the net pore space is mainly scaled by porosity and initial gas saturation, making the calculation of total gas storage possible. Issues related to gas injection and deliverability, including reservoir permeability and well spacing, can be addressed when modeling and designing a new storage facility. The storage utilization factor may be (1) estimated through a statistical analysis of existing facilities, (2) calculated as the recovery factor (the ratio of the cumulative production to estimated ultimate recovery), or (3) determined through the technical characterization of an individual storage facility.
Material Balance Approach
For the material balance approach, which is sometimes referred to as the pressure drop approach, the storage capacity calculation is based on the difference between the depleted reservoir pressure and the initial reservoir pressure when the production of the original gas in-place started (Dake, 1978; Moghadam and others, 2011). This calculation is a net storage or working gas-capacity estimate because it is assumed that the cushion or base gas is accounted for by the volume of unproduced gas remaining in the depleted reservoir (Katz and Coats, 1968; Tek, 1987).
This governing equation (eq. 3) explains the material balance approach:
where
Gstor
is the estimated storage or working gas capacity calculated at standard conditions, in billion cubic feet (Bcf);
Gprod
is the recorded cumulative gas production measured at standard conditions (Bcf);
Pinit
is the initial (otherwise known as discovery) reservoir pressure, in pound-force per square inch absolute (psia);
Pbase
is the base reservoir pressure (psia);
Pmax
is the maximum storage pressure (psia); and
Zinit, Zbase, Zmax
are the pressure-respective, unitless, gas-compressibility factors.
Figure 4 is a plot illustrating the material balance or pressure drop approach, including the three pressure points and three gas volumes, respectively. The ideal plotted relation is linear when only gas pressure drive is assumed. Ultimately, this approach assumes no pressure support from outside the reservoir, such as water drive, that would make the relation nonlinear (for example, Dake [1978] and Moghadam and others [2011]). If water drive is measured, another approach may be more suitable, or the reservoir should not be assessed.
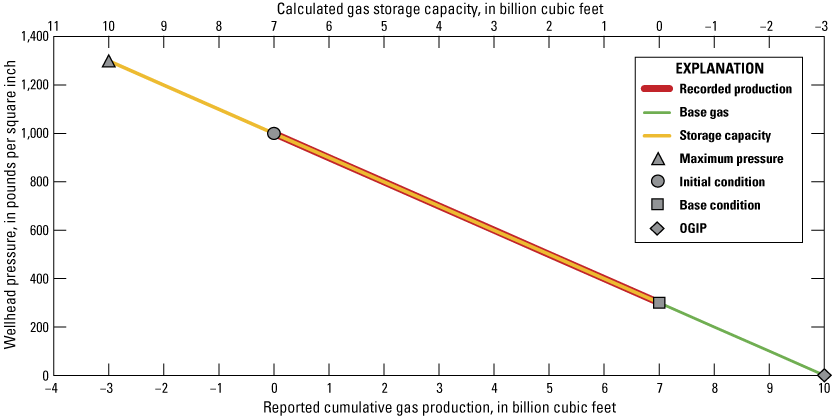
Illustrative graph for the material balance (also known as pressure-drop) approach for calculating gas storage capacity (Katz and Lee, 1990). The vertical axis shows wellhead pressure, which is the reservoir pressure normalized by the gas compressibility as (p/Z) (measured pressure [p] adjusted for the gas compressibility factor [Z]) in pounds per square inch (psi). The upper horizontal axis shows gas storage capacity in billion cubic feet (Bcf), whereas the lower horizontal axis shows cumulative gas production (in Bcf) ranging in the opposite direction. The calculation for this approach relies on pressure estimates for three conditions, including base (depletion), initial, and maximum (initial condition plus delta pressure) pressure (all shown as symbols) and assumes pressure drive during production or withdrawal. Three gas pressure ranges (as measured at the wellhead) are also shown, including initial gas production down to base conditions, base or cushion gas capacity related to original gas in place (OGIP), and storage capacity up to the maximum pressure condition.
Gas storage facilities commonly operate at pressures that exceed the pressure at discovery, which is often termed “initial reservoir pressure,” to accommodate a higher working gas capacity. The extra storage pressure, known as delta pressure (Pdelta), is usually set by operators at about 10 percent above the initial pressure (for example, Katz and Coats [1968] and Ibrahim and others [1970]), although this value may be adjusted as the operator learns more about the facility. To maintain the seal integrity of the storage reservoir, Pmax = Pinit + Pdelta must not exceed the fracture pressure gradient. The fracture pressure gradient is a complex parameter that varies by depth and basin (Eaton, 1969; Osborne and Swarbrick, 1997). Therefore, during the assessment, the Pmax parameter is estimated between the hydrostatic pressure and the fracture pressure based on a review of regional data for existing storage facilities or rock mechanics. As described in later sections, obtaining accurate records or estimates of initial pressure (Pinit) and base pressure (Pbase) are important when using the material balance approach. A gas compressibility factor (Z) may be calculated for the three pressure states to increase the accuracy of this approach. “Z” is a function of pressure, temperature, and gas composition, and is further described in the “Reservoir Hydrocarbon Properties” section below.
Application of Governing Equations
The material balance governing equation is the more robust but more complicated approach, relying on at least two sets of pressure and production data to calculate a slope (fig. 4). When these data are unavailable, an end-member point at the depletion condition that is assumed to be a base storage condition can be calculated using the first two equations (recorded production [eq. 1] and reservoir volumetric [eq. 2]). In effect, base pressure can be derived from the gas production information and the calculated reservoir volume. This staggered approach is used in the example calculations for the Michigan Basin described in the “Demonstrating Storage Capacity in the Michigan Basin” section later in this report.
After a review of gas storage literature dating from the 1960s through 2010, and to account for the various physical phenomena dictating storage capacity, different approaches are summarized in this methodology. Nevertheless, in assessment areas lacking data, only one approach can be used. For example, if no data on reservoir dimensions or pressures are available, then only the recorded production approach is feasible. Conversely, if no unique reservoir gas production data are available (when gas production is reported at the field- or State-level; for example, in Illinois Department of Natural Resources [2024]), then the volumetric approach is appropriate.
Step 3. Assembling Assessment Inputs and Associated Uncertainties
This section describes how the input data and related uncertainties can be assembled to calculate the most robust storage capacity. Given each approach described in Step 2, assessment inputs include datasets with gas production volumes along with various reservoir and gas properties. The following three subsections describe how these input data can be obtained. The availability of assessment data dictates the most appropriate use of one or more of the governing equations, as is demonstrated later. A demonstration of the data gathering process for two gas plays in the Michigan Basin is given in the “Demonstrating Storage Capacity in the Michigan Basin” section.
Gas Production Records
Cumulative gas production data are required for the recorded production approach and for the more rigorous material balance approach. Hydrocarbon production information is found in open-access State databases or proprietary nationwide databases. State databases may include the gas, oil, water, or NGL production when reported by month or year at the lease, field, reservoir, or well level (for example, Michigan Public Service Commission [MPSC], [2024]). There is currently no standard or mandate for the consistent or universal reporting of hydrocarbon production data at the State or national level. In some cases, petroleum production information is available through severance tax data only, without field-level gas production data (for example, refer to Illinois Department of Natural Resources [2024] and Illinois State Geological Survey [2024]). Another limitation exists when production data are collected intermittently, because continuous production records are needed for capacity calculations. Assembling these data for a nationwide assessment could be overwhelming; therefore, this methodology, like other USGS energy resource assessments, relies on proprietary databases, as demonstrated in the “Demonstrating Storage Capacity in the Michigan Basin” section.
Geologic and Petrophysical Reservoir Properties
This subsection describes reservoir properties required as inputs to the assessment. Geologic inputs include estimates for the reservoir size, including values for thickness and area along with respective uncertainty ranges. Reservoir thickness can be determined by averaging measurements from well penetrations through the producing interval or by analyzing the distribution to obtain summary statistics. Producing interval top and bottom depths picked from geophysical logs are ideally used. Development drilling around a field can be used to determine reservoir presence and, therefore, well locations that do not penetrate the producing interval to help constrain the reservoir area.
Petrophysical measurements include estimates of the reservoir porosity, net-to-gross thickness ratio, and pressure differences between discovery and depletion. Reservoir porosity quantifies the fraction (often expressed as a percentage) of pore space in the host rock. These pores may or may not be connected. A reservoir net-to-gross ratio quantifies the fraction of the host rock thickness that is sandstone or carbonate with good porosity as opposed to mudstone with poor reservoir quality. Due to time constraints, these inputs can be obtained from reservoir databases, but they may also be interpreted from geophysical wells logs and obtained from available literature. Uncertainty in porosity can be expressed as an input range, including the (1) minimum, (2) most likely, and (3) maximum values.
Three types or levels of reservoir pressure are considered in this assessment. The first two include the discovery or initial pressure being greater than the later depletion pressure. At discovery, hydrocarbon reservoirs usually have pressures greater than the ambient hydrostatic pressure, although commonly pressured or under-pressured reservoirs can also be discovered and produced (for example, refer to Huffman and Bowers [2002] and Nelson and Gianoutsos [2011]).
In the pore spaces of sedimentary rocks, the pressure usually increases along the hydrostatic gradient, which is the pressure generated by a column of water of height equal to the depth of the reservoir. This relation holds because the pore space is mostly filled with water and may be connected along a permeable path to the surface (Holloway, 2001). Nevertheless, when the pore space is not connected—due to a working seal, for example—the pressure may deviate from the predicted hydrostatic gradient pressure and result in overpressure of the reservoir. The opposite condition, underpressure, may also happen, either naturally or due to fluid withdrawals. These special pressure cases, which are identified when the data are available, can complicate gas storage due to increased compression costs or insufficient gas deliverability (Kabir and Soliman, 2009; EIA, 2015).
The third pressure level is the maximum storage pressure and is earlier described as part of the material balance approach. To account for the uncertainty of this probabilistic input, an upper limit for subsurface storage pressure may be set around a pressure gradient of 0.65 pounds per square inch per foot (psi/ft), falling between the textbook hydrostatic or brine water gradient of 0.45 psi/ft and a typical fracture gradient of 0.7 psi/ft (Huffman and Bowers, 2002). This range is supported by operator records reported by Ibrahim and others (1970).
Reservoir Hydrocarbon Properties
Assessment inputs related to the hydrocarbon properties in the reservoir are initial gas saturation, gas formation volume factor, and gas compressibility. The initial gas saturation (Sgi) value is the fraction (from 0 to 1) of pore space in a hydrocarbon reservoir occupied by gas prior to production and can be obtained from reservoir-specific studies or databases, as described later in the “Available Data Sources” section. The formation volume factor (Bgas) converts the gas volume at reservoir conditions (higher pressure and sometimes higher temperature) to gas volume at standard conditions (typically at the surface with pressure of 1 atmosphere or 14.7 psi and a temperature at 60 degrees Fahrenheit; Carolus and others, 2018). Because most measurements of hydrocarbon production are made at the surface, even though hydrocarbon flow takes place in the formation, volume factors are needed to convert measured surface volumes to reservoir conditions. These input data can be obtained from reservoir-specific studies or from databases, as described later in the “Available Data Sources” section.
The gas compressibility factor (Z) is a measure of how much the produced reservoir gas differs from the ideal gas law at reservoir conditions. Z is a function of pressure and temperature and was derived empirically, although several equations now exist to calculate Z (Standing and Katz, 1942; Dranchuk and Abou-Kassem, 1975; Lemmon and others, 2018). Z also changes depending on the composition of stored gas; in this methodology, it is expected that the natural gas composition is unlikely to change considerably between production and injection (for example, Katz and Coats [1968], Ludtke [1986], and Mokhatab and others [2019] and as discussed in the “Current Underground Gas-Storage Practices” section). Z would be changed when different gas mixtures are considered for storage, with an example being methane-hydrogen blends, which may be a future energy storage need (for example, Standing and Katz [1942], Mihara and others [1977], and Kunz and Wagner [2012]).
The GOR for hydrocarbons produced from a reservoir and the corresponding cut-off for this methodology, which is 10,000 SCF/Bbl, is described in the “Assessment Methodology Scope” section.
Step 4. Deriving Probabilistic Estimates and Aggregating Results
This section details probabilistically estimating and aggregating storage capacity based on a set of equations and occasionally uncertain input values. Specifically, this gas storage assessment methodology is different from other USGS energy resource assessments because three governing equations can apply. Each governing equation relies on a different approach and, therefore, requires different input parameters as described above. When inputs for all three governing equations (eqs. 1–3) are available, probabilistic outputs can be calculated using all three governing equations. The weight of each equation’s contribution is affected by the uncertainty around the respective inputs. Consequently, probabilistic estimates for storage capacity should be more representative because these consider multiple physical properties. Nevertheless, in practice, the input parameters are often less well known, and a staggered application of the approaches may be appropriate. A staggered approach is reasonable due to the varied availability of data for an assessment, and this application is demonstrated for the Michigan Basin example described in the “Demonstrating Storage Capacity in the Michigan Basin” section.
Monte Carlo Simulation
A Monte Carlo simulation of the calculations is performed to estimate a probabilistic distribution of the gas storage capacity for a given reservoir. A Monte Carlo simulation is a statistical method that produces a distribution of possible results from a probability distribution, such as a uniform or normal distribution, for input variables with inherent uncertainty (Vose, 1996; IBM Think, 2025). A Monte Carlo simulation for the storage capacity of a reservoir is configured to sample 10,000 times from distributions of each of the assessment inputs, when available, and as described in the previous sections. Summary statistics, including the mean, P5, P50, and P95, or any other probability percentile, can be calculated directly from this distribution. The P5, P50, and P95 statistic represent the 5-, 50-, and 95-percent probabilities, respectively, that the actual storage capacity is less than the value shown (for example, refer to Warwick and others [2019]).
Aggregation of Results
Aggregation is performed to better express the assessment results at increasingly granular levels from the reservoir, through the basin level, up to the national level, which is standard for USGS energy resource assessments (for example, refer to U.S. Geological Survey National Oil and Gas Resource Assessment Team [1995] and Warwick and others [2019]). To determine the probability distribution at the “play” level during aggregation, reservoir storage capacity distributions are summed appropriately by taking into account dependencies, or correlations, between reservoirs. Natural resource assessors recognize that correlations between assessment entities may be present due to geologic similarities, the use of analog data, and human factors involved in the assessment process (for example, refer to Delfiner and Barrier [2008] and van Elk and others [2010]). In general, as potential correlations between inputs increase, the output distributions for the aggregated resource estimates have greater dispersion or spread (Blondes and others, 2013b).
As part of the assessment, a correlation matrix is generated with values that represent the dependencies between reservoirs according to expert elicitation from the assessment geologists (Meyer and Booker, 2001). For example, it is assumed that the assessment geologists possess the greatest knowledge about the applicability of analogs (when reservoir-specific inputs are missing, for example), though use of analogs in turn increases dependency between inputs. This matrix is used to induce a rank correlation structure between the reservoir probability distributions as they are combined to form an aggregate sum at the play level (for example, refer to Kaufman and others [2018]). An example play-level aggregation for the Michigan Basin is discussed in the “Demonstrating Storage Capacity in the Michigan Basin” section.
Practical Considerations
Assessment Arrangement
This section describes the spatial arrangement of the assessment, which relies on established USGS practices. The country is divided into regions and provinces, as defined by the USGS 1995 National Oil and Gas Assessment, to systematically assess the storage capacity for the entire United States (U.S. Geological Survey National Oil and Gas Resource Assessment Team, 1995; Beeman and others, 1996). While the assessment provinces are named based on major sedimentary basins, the basin boundaries do not necessarily align with published basin boundaries. Instead, the provinces are drawn to cover all areas of onshore and State waters for the United States. If typical basin boundaries were used, then areas between basins would be unassessed. Functionally, these provinces serve as geographic groups of storage reservoirs that are useful for sorting assessment input data and aggregating output estimates.
An important difference in this methodology, when compared with those used for previous USGS undiscovered oil and gas assessments (for example, refer to Schmoker and Klett [2007]) and the USGS geologic carbon dioxide sequestration assessment (Brennan and others, 2010; Blondes and others, 2013a), is that the reservoir is the basic assessment level rather than a hydrocarbon assessment unit or storage assessment unit (porous interval along with a regional seal), respectively. This assessment level is further prescribed because reservoir-specific data are available in important databases described in the “Available Data Sources” section below.
Reservoirs within each province are grouped into plays for this assessment. Plays are defined as “a set of hydrocarbon accumulations sharing similar geologic, geographic, and temporal properties, such as source rock, migration pathway, timing, trapping mechanism, and hydrocarbon type” (Magoon and Schmoker, 2000). The EIA (2024) similarly defines a play as a “set of known or postulated oil and gas accumulations sharing similar geologic, geographic, and temporal properties, such as source rock, migration pathway, timing, trapping mechanism, and hydrocarbon type.” Besides providing an additional assessment structure, organizing at the play level helps quantify assessment inputs, especially when reservoir-specific properties are unknown. In effect, plays become useful analogs, as they include geologic information in their descriptions. The application of reservoir- and play-level data is further explained in the following section.
Available Data Sources
This section describes several potential data sources for the assessment. Usually, a combination of proprietary commercial and public domain databases are used by geologists to gather input data and related uncertainties. Proprietary data sources currently (2025) available at the USGS include the Nehring Associates, Inc. (2017) “Significant Oil and Gas Fields of the United States Database” and the “Comprehensive Resource Database” (CRD) (Carolus and others, 2018; Warwick and others, 2019). As a primary source, the CRD provides hydrocarbon production data, and reservoir fluid and gas properties derived from the legacy Nehring Associates, Inc. (2017) database along with modern production and drilling data, by well, from IHS Inc. (2012).
Even though the CRD used recent production volumes from IHS Inc., the assessment geologists may refer to the S&P Global Commodity Insights (SPGCI), ENERDEQ database (SPGCI, 2023) for more current production information as necessary. Note that well- and lease-level production data from SPGCI were combined to field level in the CRD and that for fields where the two databases matched, the updated production data for SPGCI were allocated to reservoirs in the Nehring database according to each reservoir’s historical shares (Nehring Associates, Inc., 2017; Carolus and others, 2018; Warwick and others, 2019; SPGCI, 202393).
Lastly, the Nehring database only considers significant fields with a known recovery (the sum of cumulative production and proved reserves) of 500,000 barrels of oil equivalent or 3 billion cubic feet of gas-equivalent barrels, or more (Nehring Associates, Inc., 2017). Therefore, this assessment focuses on calculating the potential gas storage capacity for larger reservoirs that can more effectively add to a storage capacity assessment.
When available, other publicly available reservoir production and property databases can be used to verify and supplement the estimates and ranges of reservoir data found in the CRD. Potential ancillary sources include the Department of Energy-contracted Gas Information System (GASIS) database (Hugman and others, 2000), the Tertiary Oil Recovery Information System (TORIS) database originally developed by the National Petroleum Council and rereleased by the National Energy Technology Laboratory (NETL) (Guinn and Remson, 1999), and supplementary data compiled by the Appalachian Oil and Natural Gas Research Consortium (1996), and others. Commercial databases, like the CRD and SPGCI described above, provide consistent national data otherwise too complicated to gather and quality control using public (often State-level) databases. Ultimately, database entries are verified as valid inputs by the assessment geologists, who typically review complementary play- or basin-specific literature that could help support these estimates.
As described earlier, when reservoir-specific data are unavailable, play or province averages may be computed in the CRD (Carolus and others, 2018; Warwick and others, 2019). More specifically, when reservoir pressure or temperature data are unavailable, basin-averaged gradients are used, although these do not necessarily account for local variations (for example, refer to Bahr and others [1994] and Buursink [2014]). A textbook hydrostatic gradient for saline produced water (0.45 psi/ft) may be assumed where initial pressure data do not exist. Sometimes, input data are so sparse that a national average is needed, as with initial gas saturation (Sgi) (fig. 5). Figure 5 shows the distribution for Sgi values used in the assessment as 0.50 for the minimum, 0.67 for the most likely, and 0.84 for the maximum.
For the other inputs, the assessment geologists, through expert elicitation, assign minimum, most likely, and maximum estimates for the input parameters consistent with reservoirs in the given geologic play. As is common in USGS resource assessments, a Beta-PERT distribution is assumed (fig. 5), which is a three-parameter special case of the four-parameter Beta distribution and is more amenable to geologic data (for example, Vose, [1996] and Olea [2011]). Regardless, reservoirs in the CRD are listed by the geologic plays and petroleum provinces identified during the 1995 USGS National Oil and Gas Assessment (NOGA) project (U.S. Geological Survey National Oil and Gas Resource Assessment Team, 1995; Beeman and others, 1996). This play and province arrangement, as described earlier, provides a convenient organizational and geographic structure through which the previously described assessment can be conducted.
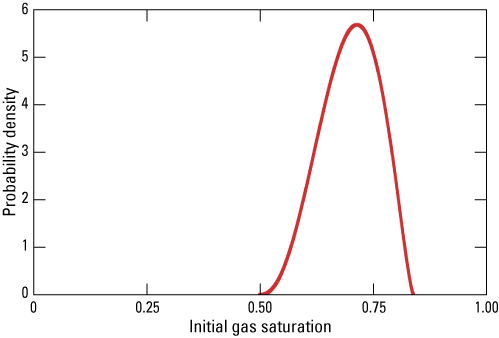
Graph showing an example Beta-PERT distribution curve, which shows (unitless) probability density, for initial gas saturation (Sgi) values greater than zero (from 0 to 1.00) for all (n = 2,662) siliciclastic and carbonate reservoirs with gas to oil ratios greater than 10,000 cubic feet per barrel in a proprietary and commercial national database (Nehring Associates, Inc., 2017).
Assessment Scope and Storage Correction Factor
This section elaborates on the scope and correction factor applied in this assessment (eq. 2). The consideration of reservoir property changes due to pressure depletion (resulting in, for example, reservoir compaction or induced seismicity) that typically occur during end-stage hydrocarbon production or withdrawal (for example, Chang and others, [2014] and Van Wees and others [2014]) may be within the scope of this assessment. Reservoir property changes related to gas leakage and contamination are not within the scope of this assessment.
Characterizing individual reservoirs for leakage risk—for example, stratigraphic or fault seal integrity—is beyond the scope of this assessment. This time-consuming work requires core plug analysis or seismic data interpretation (as in Knipe and others [1997] and Foschi and van Rensbergen [2022]) but is recommended when storage facilities are developed. Hydrocarbon reservoir risks should be considered broadly (for example, Roberts and Cordell [1980] and Dandekar [2006]); however, if an abandoned reservoir has trapped gas before being produced, it is assumed suitable for future gas storage (as demonstrated by existing underground storage facilities described in the earlier “Current Underground Gas Storage Practices” section). Another recommendation pertains to assessing gas deliverability when evaluating future gas storage facilities, such as conducting reservoir permeability or flow tests, and modeling well spacing (refer to Tek [1987] and Katz and Lee [1990]). Consideration of microbial activity that can contribute to contamination of the stored gas in underground storage facilities such as methanotrophy and sulfate reduction (as in Hemme and van Berk [2017] and Molíková and others [2022]) is beyond the scope of this assessment.
A storage correction factor may be determined during the assessment when supporting reservoir data and observations from the field operator are available. This factor can quantify and lump reservoir issues that might arise during injection or withdrawal operations at a storage facility. These storage issues may include (1) groundwater intrusion, (2) formation compaction, or (3) changes in storage efficiency, among others. Groundwater intrusion can occur when water infiltrates the pore space originally used for gas storage (for example, refer to Katz and Coats, [1968] and Wang and Economides [2009a]). Reservoir compaction can occur when formation pore space is lost due to overburden pressure reducing the porosity or permeability, particularly in reservoirs hosted in young sedimentary rocks before significant lithification occurs (for example, Martin and Serdengecti, [1984] and Zoback and Smit [2023]). Storage efficiency is the fraction of the total available pore space accessible for gas injection (as in Barbieri and others [2011] and Al-Shafi and others [2023]). Decreased storage efficiency or reduced access to pore space (as with clogging) can occur due to geochemical or microbial processes (refer to Eddaoui and others [2021] and Azin and Izadpanahi [2022]). These reservoir issues can usually be quantified as unitless slope and intercept variables in the recorded production approach equation and by the storage utilization factor in the volumetric approach (Katz and Coats, 1968; Jones and others, 2024).
Demonstrating Storage Capacity in the Michigan Basin
Motivation for Demonstration Evaluation
This section presents an example of a storage capacity estimate by (1) describing the province geology and two hydrocarbon plays of the Michigan Basin (2) and then demonstrating a probabilistic calculation of natural gas storage capacity. Steps discussed in this section refer to Steps 1–4 defined in the “Assessing Storage Capacity” section. Initially, candidate reservoirs are identified and assessment inputs are determined. Subsequently, assessment output distributions are evaluated and total storage capacity results are aggregated. This section provides example guidance for consistent USGS assessments of hydrocarbon provinces across the United States.
Michigan Basin Province
Reservoirs in the Michigan Basin Province are used as examples to demonstrate the storage capacity methods presented in this report. This province was selected because of the significant number of existing underground gas storage facilities and the reliable reporting of capacity in available reservoirs (Michigan Public Service Commission, 2024). According to the EIA (2023b), Michigan has over 1 Tcf of total storage and 690 Bcf of working storage primarily available in depleted reservoirs. Because reliable data for a large number of reservoirs were available, Jones and others (2024) were able to test the assessment equations described in the “Step 2. Calculating Storage Capacity” section. This example workflow on reservoirs in the Michigan Basin is expected to be applicable for assessing other U.S. petroleum provinces, although adjustments due to reservoir presence and data availability are expected.
Most of the Michigan Basin is located in the State of Michigan and is represented by the USGS assessment province of the same name (Gautier and others, 1996). The Michigan Basin Province includes the Lower Peninsula and eastern Upper Peninsula of the State of Michigan, a large part of eastern Wisconsin, 12 counties in northeast Indiana, 5 counties in northwest Ohio, and adjoining parts of the Great Lakes. Almost the entire assessment province (about 119,000 square miles) is underlain by sedimentary rocks of the Michigan Basin in the United States (excluding only small parts of the basin in Canada) (Dolton, 1996; Swezey and others, 2015).
The Michigan Basin, with its roughly circular shape, is a classic interior cratonic basin, having boundaries defined by a series of bedrock highs and structural features. Clockwise from the west, these highs and features are the Wisconsin arch, the contact with Precambrian Canadian Shield, the Algonquin arch, the Findlay arch, the Logansport fault, the Kankakee arch, and the Sandwich fault (Catacosinos and others, 1990; Dolton, 1996; Swezey and others, 2015). Basin evolution, structure, and stratigraphy are summarized by Fisher and others (1988), Catacosinos and others (2001), and more; in focusing on process steps and not framework geology, these publications give further information on basin physiography and detailed formation mapping and figures.
Oil and gas were first discovered in the Michigan Basin at the Port Huron field in 1886, whereas modern hydrocarbon production in the basin began in 1925 with the discovery of the Saginaw field (Catacosinos and others, 1990). Oil and gas in the Michigan Basin are produced from reservoirs from the Middle Ordovician to the Pleistocene (Dolton, 1996). A combination of stratigraphy and structure allows a division of the Michigan Basin fields and prospects into 16 principal hydrocarbon plays (Dolton, 1996), consistent with the definition of a play described in the “Assessment Arrangement” section.
Geology of Demonstration Plays
This section describes the petroleum geology for two example hydrocarbon plays in the Michigan Basin along with the consideration of other plays in the province. Based on the number of existing facilities and the potential for additional storage capacity, the contrasting Mississippian Sandstone Gas and Clinton Structural Plays are considered representative settings for demonstrating this methodology. The Mississippian Sandstone Gas Play consists of small, shallow Mississippian sandstone reservoirs on anticlinal structures in the central part of the Michigan Basin. The reservoirs are part of a primarily clastic sequence that shows considerable stratigraphic variability. Most of the gas production is from the informal stray sandstone of the Michigan Formation and from the Marshall Sandstone (Dolton, 1996); Dolton assigned non-gas-producing Devonian Berea Sandstone reservoirs to a separate play. Representative play reservoir depths range around 1,500 ft; net reservoir (as opposed to gross) thicknesses range between 5 and 20 ft; and porosities range between 10 and 15 percent (Dolton, 1996; Nehring Associates, Inc., 2017). Catacosinos and others (1990, p. 574) and Swezey and others (2015, p. 54) provide additional details and maps for these reservoir intervals.
The Clinton Structural Play comprises gas reservoirs in Silurian Clinton Formation carbonate rock and trapped in deep structural features in the northern Michigan Basin. Most of the reservoirs in this play have been deep pool additions at fields with previously discovered shallower reservoirs. Reservoirs are typically open-shelf limestones that have dissolution-generated porosity and have undergone dolomitization (Dolton, 1996). Equivalent Silurian Burnt Bluff Group dolomite gas reservoirs were also considered in this play interval (Swezey and others, 2015). Representative reservoir depths range around 7,000 ft, net reservoir thicknesses range from 20 to 100 ft, and porosities are around 5 percent (Dolton, 1996; Nehring Associates, Inc., 2017). Catacosinos and others (1990, p. 590) and Swezey and others (2015, p. 128) provide additional details and maps for these reservoir intervals.
This demonstration does not include results from the large Northern and Southern Niagaran Reef Plays (Dolton, 1996). These Michigan Basin plays already host significant volumes of gas storage, particularly the northern trend, which is well characterized (Haagsma and others, 2020; Jones and others, 2024). These formations are planned for assessment in the future and may serve to evaluate storage in settings that include vuggy porosity (due to the dolomitized reef structure of the reservoirs) akin to cavern storage. The deeper reservoirs in the Ordovician Sandstone Gas Play in the Michigan Basin (Dolton, 1996) would also be evaluated as part of planned future work, although some may be too deep for conventional use given the assessment-depth cutoff of 8,000 ft, as explained in the “Gas Storage Reservoir Classes” section.
Demonstration Assessment Approaches
As part of Step 1 in this demonstration in the Michigan Basin, 2 available reservoirs were identified out of 16 significant fields in the Mississippian Sandstone Gas Play, and 5 available reservoirs were identified out of 8 significant fields in the Clinton Structural Play. These depleted reservoirs were identified using the Varela and Buursink (2025) approach described earlier, which is based on well abandonment. An example of an available Michigan sandstone reservoir in the Evart field surrounded by nonamenable fields is shown in figure 3. Figure 3 shows selected fields in the Michigan Basin with corresponding active and abandoned wells. As is the case in multiple Michigan Basin Province plays (fig. 3), many reservoirs are already used for gas storage (MPSC, 2024). These reservoirs are considered unavailable and are not assessed. Fields not meeting the significant field cutoff from Nehring Associates, Inc. (2017) are also ignored.
In preparing to calculate storage capacity, values for deterministic and probabilistic inputs for the demonstration reservoirs were from the data sources described in the “Available Data Sources” section. The following input data values were gathered: cumulative gas production, initial gas saturation, gas formation volume factor and gravity, reservoir thickness and area, porosity of the net interval, and discovery and depletion pressures. Table 1 shows the representative input ranges, including the maximums and minimums for the two plays considered in the Michigan Basin (one is generally deeper than the other). While this table does not show proprietary data at the reservoir level, it does show the differences in the reservoir properties between the two plays. Also, when reservoir-specific inputs were unavailable, play- or basin-level, or even national averages, were used as described in the “Available Data Sources” section (as with Sgi).
Table 1.
Representative ranges for various input parameters considered for the capacity calculation for the two example plays in the Michigan Basin.[Ranges are derived from Nehring Associates, Inc. (2017), and Carolus and others (2018). Values are reported to only the significant figures available, given the limitations of the input data. Bcf, billion cubic feet; OGIP, original gas in place; PSI, pounds per square inch]
Given the available inputs for the Michigan Basin plays described above, storage capacities were calculated using all the approaches detailed in Step 2. For this demonstration, staggered calculations relied on recorded cumulative production values along with the reservoir volume to derive a depletion pressure (Pbase) that was then used in the material balance equation to calculate storage capacity. In effect, the more robust material balance approach was used, while depletion pressure was derived using gas production records and reservoir volume calculations according to Carolus and others (2018). This staggered approach may be appropriate for assessing remaining plays and provinces when not all input data are available as described in Step 3.
Example Michigan Basin Probabilistic Results
The results of the capacity estimates are given as histograms from Monte Carlo simulations in which each input distribution was sampled 10,000 times. This is part of Step 4 and was coded in R (R Core Team, 2024). Example probabilistic output distributions are provided in figure 6 for the seven reservoirs identified as available for storage in the two plays in the Michigan Basin. Table 2 lists the P5, P50, and P95 probability percentiles that represent the 5-, 50-, and 95-percent probabilities, respectively, that the true storage capacity is less than the value shown. The terminology used in this report follows standard statistical practice (and may differ from that used by the petroleum industry [Everitt and Skrondal, 2010]) such that percentiles, or quantiles, represent the value of a variable below which a certain proportion of observations fall. Table 2 provides the anonymized entity identification and reservoir depth class.
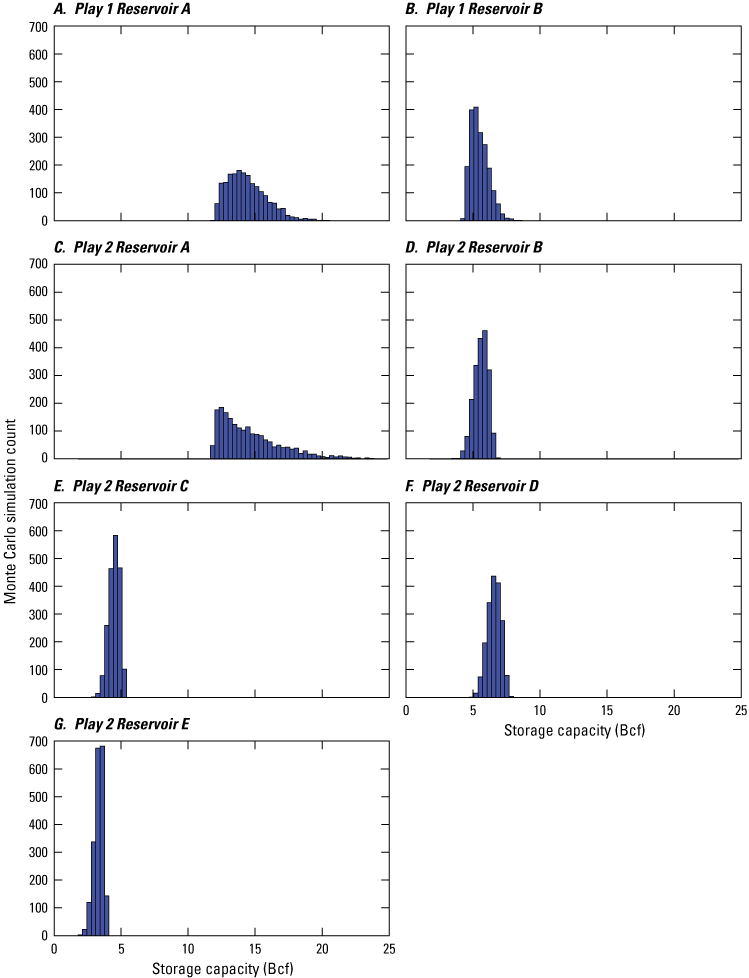
Histograms (A–G) showing distributions for assessed gas storage capacity in billions of cubic feet (Bcf) for the seven anonymized candidate reservoirs in two demonstration plays in the Michigan Basin in the United States. Play 1 is the Mississippian Sandstone Gas Play and Play 2 is the Clinton Structural Play. The histograms show the probabilistic results (with the count ranging from 0 to 700) obtained from a Monte Carlo simulation in which each uncertain assessment input distribution was sampled 10,000 times.
Table 2.
Gas storage capacity estimates for seven newly available reservoirs identified in two demonstration plays in the Michigan Basin Province.[Anonymized entity (for example, reservoir [R], play [P], and basin [B]) codes are provided along with whether this is a regular or deep (greater than 8,000 feet deep) reservoir class. Estimates are derived from probabilistic Monte Carlo simulations and assessment inputs with uncertainty distributions, when available. P5, P50, and P95 are probability percentiles and represent the 5-, 50-, and 95-percent probabilities, respectively, that the true storage capacity is less than the value shown. Total storage capacity estimates for each of the two plays are given following aggregation of the individual reservoir estimates. An example total storage capacity estimate for Michigan Basin follows aggregation of the individual play estimates. Values are reported to only two significant figures given the limitations of the input data. Bcf, billion cubic feet]
Also listed in table 2 are example aggregated results for the total storage capacity of the candidate reservoirs in each of the two example plays in the Michigan Basin. Additional gas capacity, ranging from 47 to 64 Bcf, with a likely capacity of 54 Bcf, was estimated, representing an 8-percent increase in the existing total storage capability in Michigan. The capacity percentile calculations used the aggregation method described in Step 4. The correlation coefficients for the aggregation at the reservoir level (ranging from 0.82 to 0.86) are primarily based on reservoir porosity and original gas saturation. Even though not all plays in the Michigan Basin were assessed for this example, as a demonstration, the play level results were aggregated at the basin level using a correlation coefficient (0.6) that primarily considered the different lithologies, depth ranges, and average porosities of the two plays (table 2).
Summary
This report describes a new probabilistic assessment methodology for estimating storage capacities for natural gas in depleted conventional hydrocarbon reservoirs that produced mostly gas by assuming a cumulative gas-to-oil ratio of 10,000 standard cubic feet of gas per barrel of oil (or greater). This methodology describes focusing the assessment on reservoirs that produced mostly gas with a known recovery of 3 billion cubic feet (Bcf) or greater. The method prescribes these reservoirs as candidates for geologic storage by verifying that wells assigned to the producing formation had no recorded production for 5 years or longer. The methodology does not include a full consideration of hydrogen storage or natural gas storage in solution-mined salt caverns, which are investigations that could be part of follow-on studies.
Three traditional petroleum engineering approaches to calculating gas storage capacity are summarized in order of increasing complexity and included the recorded production approach, the reservoir volumetric approach, and the pressure drop approach. Each governing equation relies on different physical concepts and input variables. Therefore, to complete the assessment calculations for probabilistic storage capacity estimates—including the Michigan Basin example provided in this report—a staggered approach is described. This staggered approach uses the curated, proprietary national database available to the USGS, which contains gas production and fluid property information and reservoir petrophysical-property data. Given these available data, a new probabilistic assessment is possible. Using State-level public databases, when available, may require time-consuming quality control. This assessment also allows for uncertainty distributions for key inputs and delivers probabilistic estimates of gas storage capacity.
Demonstrably, the methodology was applied to two hydrocarbon plays in the Michigan Basin: the Mississippian Sandstone Gas Play and the Clinton Structural Play. The latter structural play primarily consists of dolomite reservoirs, whereas the former sandstone play is shallower and has thinner reservoirs, which have higher porosities than the deeper carbonate play. While these plays provide a representative sample of the possible reservoir geology in the Michigan Basin, an evaluation of other conventional gas plays (deep Ordovician sandstones, for example) along with the unique pinnacle reefs of the Niagara Group, is planned. Using the depleted wells approach, two available reservoirs were identified in the first play and five in the second. No reservoirs in these two plays were assigned to the deep (greater than 8,000-ft depth) class, although deep class occurrences are likely if assessment work continues on other plays and provinces.
From the calculations in the Michigan Basin, it is apparent that additional storage capacity exists and could contribute significantly to the natural gas storage endowment. A mean aggregated storage capacity of 54 Bcf for the two plays could represent an 8-percent increase to the current working gas capacity in Michigan in depleted reservoirs.
Ultimately, this new methodology combines established engineering approaches with probabilistic simulations and demonstrates the calculation of estimated natural gas storage capacity. This report provides both a pathway to fulfill the recommendation proffered by the 2018 National Academies of Sciences, Engineering, and Medicine review of the U.S. Geological Survey Energy Resources Program and a means to systematically assess geologic energy storage in hydrocarbon reservoirs across the United States.
References Cited
Al-Shafi, M., Massarweh, O., Abushaikha, A.S., and Bicer, Y., 2023, A review on underground gas storage systems—Natural gas, hydrogen and carbon sequestration: Energy Reports, v. 9, p. 6251–6266, accessed August 5, 2025, at https://doi.org/10.1016/j.egyr.2023.05.236.
American Gas Association [AGA], 2021, Survey of underground storage of natural gas in The United States and Canada—2020/2021: [Washington, D.C.,] AGA, AGA report/survey XU2101, 1 file. [Microsoft Excel spreadsheet; available at https://store.accuristech.com/aga.]
American Petroleum Institute [API], 2021, Energy infrastructure—Underground natural gas storage: API website, accessed August 9, 2025, at https://www.energyinfrastructure.org/energy-101/natural-gas-storage.
Aneke, M., and Wang, M., 2016, Energy storage technologies and real life applications—A state of the art review: Applied Energy, v. 179, p. 350–377, accessed August 5, 2025, at https://doi.org/10.1016/j.apenergy.2016.06.097.
Appalachian Oil and Natural Gas Research Consortium, 1996, Enhancement of the TORIS database of Appalachian Basin oil fields (Final report): U.S. Department of Energy [Technical report DOE/MC/28176–1], [23 p.], accessed August 5, 2025, at https://doi.org/10.2172/251348.
Arps, J.J., 1945, Analysis of decline Curves: Transactions of the AIME, v. 160, no. 01, paper no. SPE–945228–G, p. 228–247, accessed August 7, 2025, at https://doi.org/10.2118/945228-G.
Attanasi, E.D., and Freeman, P.A., 2023, Reconnaissance survey for potential energy storage and carbon dioxide storage resources of petroleum reservoirs in Western Europe: Natural Resources Research, v. 32, no. 4, p. 1839–1858, accessed August 7, 2025, at https://doi.org/10.1007/s11053-023-10218-z.
Azin, R., and Izadpanahi, A., eds., 2022, Fundamentals and practical aspects of gas Injection (1st ed.): Cham, Switzerland, Springer International, Petroleum engineering series, 464 p., accessed August 7, 2025, at https://doi.org/10.1007/978-3-030-77200-0.
Bahr, J.M., Moline, G.R., and Nadon, G.C., 1994, Anomalous pressures in the deep Michigan Basin, chap. 11 of Ortoleva, P.J. ed., Basin compartments and seals: Tulsa, Okla., American Association of Petroleum Geologists, AAPG Memoir 61, p. 153–165, accessed August 7, 2025, at https://doi.org/10.1306/M61588C11.
Barbieri, E., Zanchi, A., Ripa, G., Ferrara, G., Barbedo, R., Jeanpert, J., and Plank, A., 2011, Enhancing storage efficiency in underground gas storage wells through open-hole completions, in [proceedings] Offshore Mediterranean Conference and Exhibition 2011: Offshore Mediterranean Conference and Exhibition 2011, March 23–25, Ravenna, Italy, paper OMC–2011–179, 14 p., accessed August 9, 2025, at https://onepetro.org/OMCONF/proceedings-abstract/OMC11/OMC11/OMC-2011-179/1305.
Beckman, K.L., Determeyer, P.L., and Mowrey, E.H., 1995, Natural gas storage—Historical development and expected evolution (Final report [December 1994–February 1995]): Chicago, Ill., Gas Research Institute (GRI), prepared by International Gas Consulting, Inc., Houston, Tex., under GRI contract 5094–270–3142, GRI–95/0214, 49 p., accessed August 7, 2025, at https://ntrl.ntis.gov/NTRL/dashboard/searchResults/titleDetail/PB95249900.xhtml.
Blondes, M.S., Brennan, S.T., Merrill, M.D., Buursink, M.L., Warwick, P.D., Cahan, S.M., Cook, T.A., Corum, M.D., Craddock, W.H., DeVera, C.A., Drake, R.M., II, Drew, L.J., Freeman, P.A., Lohr, C.D., Olea, R.A., Roberts-Ashby, T.L., Slucher, E.R., and Varela, B.A., 2013a, National assessment of geologic carbon dioxide storage resources—Methodology implementation: U.S. Geological Survey Open–File Report 2013–1055, 26 p., accessed August 7, 2025, at https://doi.org/10.3133/ofr20131055.
Blondes, M.S., Schuenemeyer, J.H., Olea, R.A., and Drew, L.J., 2013b, Aggregation of carbon dioxide sequestration storage assessment units: Stochastic Environmental Research and Risk Assessment, v. 27, no. 8, p. 1839–1859, accessed August 7, 2025, at https://doi.org/10.1007/s00477-013-0718-x.
Brennan, S.T., Burruss, R.C., Merrill, M.D., Freeman, P.A., and Ruppert, L.F., 2010, A probabilistic assessment methodology for the evaluation of geologic carbon dioxide storage: U.S. Geological Survey Open-File Report 2010–1127, 31 p., accessed August 7, 2025, at https://doi.org/10.3133/ofr20101127.
Brennan, S.T., Rivera, J.L., Varela, B.A., and Park, A.J., 2021, National assessment of helium resources within known natural gas reservoirs: U.S. Geological Survey Scientific Investigations Report 2021–5085, 5 p., accessed August 7, 2025, at https://doi.org/10.3133/sir20215085.
Budt, M., Wolf, D., Span, R., and Yan, J., 2016, A review on compressed air energy storage—Basic principles, past milestones and recent developments: Applied Energy, v. 170, p. 250–268, accessed August 7, 2025, at https://doi.org/10.1016/j.apenergy.2016.02.108.
Buursink, M.L., 2014, Significance of carbon dioxide density estimates for basin-scale storage resource assessments: Energy Procedia, v. 63, p. 5130–5140, accessed August 7, 2025, at https://doi.org/10.1016/j.egypro.2014.11.543.
Buursink, M.L., Anderson, S.T., Brennan, S.T., Burns, E.R., Freeman, P.A., Gallotti, J.S., Lohr, C.D., Merrill, M. D., Morrissey, E.A., Plampin, M.R., and Warwick, P.D., 2023, Geologic energy storage: U.S. Geological Survey Fact Sheet 2022–3082, 4 p., accessed August 7, 2025, at https://doi.org/10.3133/fs20223082.
Callas, C., Saltzer, S.D., Davis, J.S., Hashemi, S.S., Kovscek, A.R., Okoroafor, E.R., Wen, G., Zoback, M.D., and Benson, S.M., 2022, Criteria and workflow for selecting depleted hydrocarbon reservoirs for carbon storage: Applied Energy, v. 324, article 119668, accessed August 7, 2025, at https://doi.org/10.1016/j.apenergy.2022.119668.
Carolus, M., Biglarbigi, K., Warwick, P.D., Attanasi, E.D., Freeman, P.A., and Lohr, C.D., 2018, Overview of a comprehensive resource database for the assessment of recoverable hydrocarbons produced by carbon dioxide enhanced oil recovery (ver. 1.1, June 2018): U.S. Geological Survey Techniques and Methods, book 7, chap. C16, 31 p., accessed August 7, 2025, at https://doi.org/10.3133/tm7C16.
Catacosinos, P.A., Daniels, P.A., Jr., and Harrison, W.B., III, 1990, Structure, stratigraphy, and petroleum geology of the Michigan Basin, in Leighton, M.W., Kolata, D.R., Oltz, D.F., and Eidel, J.J., eds., Interior cratonic basins: Tulsa, Okla., American Association of Petroleum Geologists [AAPG], AAPG Memoir v. 51, p. 561–601, accessed August 7, 2025, at https://doi.org/10.1306/M51530C31.
Chang, C., Mallman, E., and Zoback, M., 2014, Time-dependent subsidence associated with drainage-induced compaction in Gulf of Mexico shales bounding a severely depleted gas reservoir: AAPG Bulletin, v. 98, no. 6, p. 1145–1159, accessed August 7, 2025, at https://doi.org/10.1306/11111313009.
Charpentier, R.R., and Klett, T.R., 2005, Guiding principles of USGS methodology for assessment of undiscovered conventional oil and gas resources: Natural Resources Research, v. 14, no. 3, p. 175–186, accessed August 7, 2025, at https://doi.org/10.1007/s11053-005-8075-1.
Coats, K.H., 1966, Some technical and economic aspects of underground gas storage: Journal of Petroleum Technology, v. 18, no. 12, p. 1561–1566, accessed August 7, 2025, at https://doi.org/10.2118/1657-PA.
Comello, S., and Reichelstein, S., 2019, The emergence of cost effective battery storage: Nature Communications, v. 10, no. 1, article 2038, 9 p., accessed August 7, 2025, at https://doi.org/10.1038/s41467-019-09988-z.
Crotogino, F., Schneider, G.-S., and Evans, D.J., 2018, Renewable energy storage in geological formations: Proceedings of the Institution of Mechanical Engineers, Part A—Journal of Power and Energy, v. 232, no. 1, p. 100–114, accessed January 31, 2022, at https://doi.org/10.1177/0957650917731181.
Dandekar, A.Y., 2006, Petroleum reservoir rock and fluid properties: Boca Raton, Fla., CRC Press, 488 p., accessed August 7, 2025, at https://doi.org/10.1201/9781420004540.
Delfiner, P., and Barrier, R., 2008, Partial probabilistic addition—A practical approach for aggregating gas resources: SPE Reservoir Evaluation and Engineering, v. 11, no. 2, paper SPE–90129–PA, p. 379–385, accessed August 7, 2025, at https://doi.org/10.2118/90129-PA.
Dolton, G.L., 1996, Michigan basin province (063), in Gautier, D.L., Dolton, G.L., Takahashi, K.I., and Varnes, K.L., eds., 1995 national assessment of United States oil and gas resources—Results, methodology, and supporting data: U.S. Geological Survey Digital Data Series, DDS–30, 62 p., accessed August 7, 2025, at https://doi.org/10.3133/ds30.
Dranchuk, P.M., and Abou-Kassem, H., 1975, Calculation of Z factors for natural gases using equations of state: Journal of Canadian Petroleum Technology, v. 14, no. 03, paper PETSOC–75–03–03, p. 34-36, accessed August 7, 2025, at https://doi.org/10.2118/75-03-03.
Eaton, B.A., 1969, Fracture gradient prediction and its application in oilfield operations: Journal of Petroleum Technology, v. 21, no. 10, paper SPE–2163–PA, p. 1353–1360, accessed August 9, 2025, at https://doi.org/10.2118/2163-PA.
Eddaoui, N., Panfilov, M., Ganzer, L., and Hagemann, B., 2021, Impact of pore clogging by bacteria on underground hydrogen storage: Transport in Porous Media, v. 139, no. 1, p. 89–108, accessed August 9, 2025, at https://doi.org/10.1007/s11242-021-01647-6.
Ehrenberg, S.N., and Nadeau, P.H., 2005, Sandstone vs. carbonate petroleum reservoirs—A global perspective on porosity-depth and porosity-permeability relationships: AAPG Bulletin, v. 89, no. 4, p. 435–445, accessed August 9, 2025, at https://doi.org/10.1306/11230404071.
Evans, D.J., and Chadwick, R.A., eds., 2009, Underground gas storage—Worldwide experiences and future development in the UK and Europe: London, Geological Society of London, Special Publication 313, 293 p., accessed August 9, 2025, at https://doi.org/10.1144/SP313.
Fetkovich, M.J., Vienot, M.E., Bradley, M.D., and Kiesow, U.G., 1987, Decline-curve analysis using type curves—Case histories: SPE Formation Evaluation, v. 2, no. 04, p. 637–656, accessed August 9, 2025, at https://doi.org/10.2118/13169-PA.
Fisher, J.H., Barratt, M.W., Droste, J.B., and Shaver, R.H., 1988, Michigan Basin, chap. 13 of Sloss, L.L., ed., Sedimentary cover—North American craton—U.S., v. D–2 of The geology of North America: Boulder, Colo., Geological Society of America, p. 361–382, accessed August 9, 2025, at https://doi.org/10.1130/DNAG-GNA-D2.361.
Foschi, M., and van Rensbergen, P., 2022, Topseal integrity assessment using seal properties and leakage phenomena: Marine and Petroleum Geology, v. 139, article 105573, 15 p., accessed August 9, 2025, at https://doi.org/10.1016/j.marpetgeo.2022.105573.
Gautier, D.L., Dolton, G.L., Takahashi, K.I., and Varnes, K.L., eds., 1996, 1995 National assessment of United States oil and gas resources; Results, methodology, and supporting data (release 2): U.S. Geological Survey Digital Data Series DDS–30, accessed August 9, 2025, at https://doi.org/10.3133/ds30.
Goodman, J.V., 1968, Underground gas storage in oil and gas reservoirs, in Beebe, B.W., ed., Natural gases of North America—A symposium: Tulsa, Okla., American Association of Petroleum Geologists [AAPG], AAPG Memoir 9, 2 v., p. 1865–1889, accessed August 9, 2025, at https://doi.org/10.1306/M9363C128.
Guinn, H, and Remson, D., 1999, TORIS data preparation guidelines (Final report): [U.S.] National Petroleum Technology Office, prepared by BDM-Oklahoma, Inc., Bartlesville, Okla., under contract DE–AC22–94PC91008 (as report NIPER/BDM–0042), report number DOE/PC/91008–0042, [103 p.; variously paged], accessed August 9, 2025, at https://doi.org/10.2172/4167.
Haagsma, A., Main, J., Pasumarti, A., Valluri, M., Scharenberg, M., Larsen, G., Goodman, W., Conner, A., Cotter, Z., Keister, L., Harrison, W., Mishra, S., Pardini, R., and Gupta, N., 2020, A comparison of carbon dioxide storage resource estimate methodologies for a regional assessment of the Northern Niagaran Pinnacle Reef Trend in the Michigan Basin: Environmental Geosciences, v. 27, no. 1, p. 9–23, accessed August 9, 2025, at https://doi.org/10.1306/eg.11051919019.
Hemme, C., and van Berk, W., 2017, Potential risk of H2S generation and release in salt cavern gas storage: Journal of Natural Gas Science and Engineering, v. 47, p. 114–123, accessed August 9, 2025, at https://doi.org/10.1016/j.jngse.2017.09.007.
Holloway, S., 2001, Storage of fossil fuel-derived carbon dioxide beneath the surface of the Earth: Annual Reviews of Energy and the Environment, vol. 26, p. 145–166, accessed August 9, 2025, at https://doi.org/10.1146/annurev.energy.26.1.145.
Huffman, A.R. and Bowers, G.L., eds., 2002, Pressure regimes in sedimentary basins and their prediction: Tulsa, Okla., American Association of Petroleum Geologists [AAPG], and Houston, Tex., Houston Chapter of The American Association of Drilling Engineers, AAPG Memoir 76, 238 p., accessed August 9, 2025, at https://doi.org/10.1306/M76870.
Hugman, R.H., Vidas, E.H., and Springer, P.S., 2000, Development of the DOE Gas Information System (GASIS)—Final report: U.S. Department of Energy, Federal Energy Technology Center report, prepared by Energy and Environmental Analysis, Inc., Arlington, Va., under contract DE–AC21–93MC28139–23, [161 p.; variously paged,] accessed August 9, 2025, at https://netl.doe.gov/node/3304.
Ibrahim, M.A., Tek, M.R., and Katz, D.L., 1970, Threshold pressure in gas storage: Arlington, Va., American Gas Association, 309 p., accessed August 9, 2025, at https://doi.org/10.55274/R0010060.
IBM Think, 2025, What is Monte Carlo simulation?: IBM website, accessed August 9, 2025, at https://www.ibm.com/think/topics/monte-carlo-simulation.
Illinois Department of Natural Resources, 2024, Oil & gas resource management: State of Illinois website, accessed August 6, 2025, at https://dnr.illinois.gov/oilandgas.html.
Illinois State Geological Survey, 2024, Geological records: University of Illinois Urbana-Champaign website, accessed August 6, 2025, at https://isgs.illinois.edu/data/geological-records/.
Jahediesfanjani, H., 2017, Application of decline curve analysis to estimate recovery factors for carbon dioxide enhanced oil recovery, chap. C of Verma, M.K., ed., Three approaches for estimating recovery factors in carbon dioxide enhanced oil recovery: U.S. Geological Survey Scientific Investigations Report 2017–5062–C, p. C1–C20, accessed August 9, 2025, at https://doi.org/10.3133/sir20175062C.
Jones, M.M., Wiens, A.M., Buursink, M.L., Brennan, S.T., Freeman, P.A., Varela, B.A., Gallotti, J.S., and Warwick, P.D., 2024, A methodology to estimate CO2 and energy gas storage resources in depleted conventional gas reservoirs: 17th International Conference on Greenhouse Gas Control Technologies, GHGT–17, October 20–24, 2024, Calgary, Canada, 11 p., accessed August 9, 2025, at https://doi.org/10.2139/ssrn.5014690.
Knipe, R.J., Fisher, Q.J., Jones, G., Clennell, M.R., Farmer, A.B., Harrison, A., Kidd, B., Mcallister, E., Porter, J.R., and White, E.A., 1997, Fault seal analysis—successful methodologies, application and future directions, in Møller-Pedersen, P., and Koestler, A.G., eds., Volume 7—Hydrocarbon seals—Importance for exploration and production: New York, Elsevier Science, Norwegian Petroleum Society Special Publications 7, p. 15–38, accessed August 9, 2025, at https://doi.org/10.1016/S0928-8937(97)80004-5.
Lackey, G., Freeman, G.M., Buscheck, T.A., Haeri, F., White, J.A., Huerta, N., and Goodman, A., 2023, Characterizing hydrogen storage potential in U.S. underground gas storage facilities: Geophysical Research Letters, v. 50, no. 3, article e2022GL101420, 9 p., accessed August 9, 2025, at https://doi.org/10.1029/2022GL101420.
Lemmon, E.W., Bell, I.H., Huber, M.L., McLinden, M.O., 2018, NIST Standard Reference Database 23—Reference Fluid Thermodynamic and Transport Properties-REFPROP, Version 10.0: National Institute of Standards and Technology, Standard Reference Data Program database, accessed August 9, 2025, at https://doi.org/10.18434/T4/1502528.
Magoon, L.B., and Schmoker, J.W., 2000, The total petroleum system—The natural fluid network that constrains the assessment unit, chap. PS of U.S. Geological Survey World Petroleum Assessment 2000—Description and results: U.S. Geological Survey Digital Data Series DDS–60, [31 p.; variously paged], accessed August 9, 2025, at https://pubs.usgs.gov/dds/dds-060/chaps/PS.pdf.
Matos, C.R., Carneiro, J.F., and Silva, P.P., 2019, Overview of large-scale underground energy storage technologies for integration of renewable energies and criteria for reservoir identification: Journal of Energy Storage, v. 21, p. 241–258, accessed August 9, 2025, at https://doi.org/10.1016/j.est.2018.11.023.
Meyer, M.A., and Booker, J.M., 2001, Eliciting and analyzing expert judgement—A practical guide: Philadelphia, Pa., Society for Industrial and Applied Mathematics and American Statistical Association, ASA–SIAM series on statistics and applied probability, 459 p., accessed August 9, 2025, at https://doi.org/10.1137/1.9780898718485.
Michanowicz, D.R., Buonocore, J.J., Rowland, S.T., Konschnik, K.E., Goho, S.A., and Bernstein, A.S., 2017, A national assessment of underground natural gas storage—Identifying wells with designs likely vulnerable to a single-point-of-failure: Environmental Research Letters, v. 12, no. 6, article 064004, 11 p., accessed August 9, 2025, at https://doi.org/10.1088/1748-9326/aa7030.
Michigan Public Service Commission [MPSC], 2024, Transportation & storage—Natural gas well permitting and production: State of Michigan website, accessed August 9, 2025, at https://www.michigan.gov/mpsc/regulatory/natural-gas/transportation-storage.
Mihara, S., Sagara, H., Arai, Y., and Saito, S., 1977, The compressibility factors of hydrogen-methane, hydrogen-ethane and hydrogen-propane gaseous mixtures: Journal of Chemical Engineering of Japan, v. 10, no. 5, p. 395–399, accessed August 9, 2025, at https://doi.org/10.1252/jcej.10.395.
Moghadam, S., Jeje, O., and Mattar, L., 2011, Advanced gas material balance in simplified format: Journal of Canadian Petroleum Technology, v. 50, no. 01, p. 90–98, accessed August 9, 2025, at https://doi.org/10.2118/139428-PA.
Mokhatab, S., Poe, W.A., and Mak, J.Y., 2019, Handbook of natural gas transmission and processing—Principles and practices (4th ed.): Cambridge, Mass., Gulf Professional Publishing, 826 p., accessed August 9, 2025, at https://doi.org/10.1016/C2017-0-03889-2.
Molíková, A., Vítězová, M., Vítěz, T., Buriánková, I., Huber, H., Dengler, L., Hanišáková, N., Onderka, V., and Urbanová, I., 2022, Underground gas storage as a promising natural methane bioreactor and reservoir?: Journal of Energy Storage, v. 47, article 103631, 13 p., accessed August 9, 2025, at https://doi.org/10.1016/j.est.2021.103631.
National Academies of Sciences, Engineering, and Medicine [NASEM], 2018, Future directions for the U.S. Geological Survey's Energy Resources Program: Washington, D.C., National Academies Press, Washington, D.C., 156 p., accessed August 9, 2025, at https://doi.org/10.17226/25141.
Nelson, P.H., and Gianoutsos, N.J., 2011, Evolution of overpressured and underpressured oil and gas reservoirs, Anadarko Basin of Oklahoma, Texas, and Kansas: U.S. Geological Survey Open File Report 2011–1245, 3 sheets, accessed August 6, 2025, at https://doi.org/10.3133/ofr20111245.
Okoroafor, E.R., Saltzer, S.D., and Kovscek, A.R., 2022, Toward underground hydrogen storage in porous media—Reservoir engineering insights: International Journal of Hydrogen Energy, v. 47, no. 79, p. 33781–33802, accessed August 9, 2025, at https://doi.org/10.1016/j.ijhydene.2022.07.239.
Olea, R.A., 2011, On the use of the beta distribution in probabilistic resource assessments: Natural Resources Research, v. 20, no. 4, p. 377–388, accessed August 9, 2025, at https://doi.org/10.1007/s11053-011-9153-1.
Orr, F.M. and Dominguez, M.T. (eds.), 2016, Ensuring safe and reliable underground natural gas storage—Final Report of the Interagency Task Force on Natural Gas Storage Safety: Department of Energy report, 83 p., accessed August 9, 2025, at https://www.energy.gov/articles/report-ensuring-safe-and-reliable-underground-natural-gas-storage.
Osborne, M.J., and Swarbrick, R.E., 1997, Mechanisms for generating overpressure in sedimentary basins—A reevaluation: AAPG Bulletin, v. 81, no. 6, p. 1023–1041, accessed August 6, 2025, at https://doi.org/10.1306/522B49C9-1727-11D7-8645000102C1865D.
Pipeline and Hazardous Materials Safety Administration [PHMSA], 2023, Underground natural gas storage: U.S. Department of Transportation website, accessed August 6, 2025, at, https://www.phmsa.dot.gov/pipeline/underground-natural-gas-storage/underground-natural-gas-storage.
Pipeline and Hazardous Materials Safety Administration [PHMSA], 2024, Gas distribution, gas gathering, gas transmission, hazardous liquids, liquefied natural gas (LNG), and underground natural gas storage (UNGS) annual report data: U.S. Department of Transportation website, accessed August 6, 2025, at https://www.phmsa.dot.gov/data-and-statistics/pipeline/gas-distribution-gas-gathering-gas-transmission-hazardous-liquids.
Plaat, H., 2009, Underground gas storage—Why and how, in Evans, D.J. and Chadwick, R.A., eds., Underground gas storage—Worldwide experiences and future development in the UK and Europe: London, Geological Society of London, Special Publications v. 313, p. 25–37, accessed August 6, 2025, at https://doi.org/10.1144/SP313.4.
R Core Team, 2024, The R Project for statistical computing: R Foundation website, accessed August 6, 2025, at https://www.R-project.org/.
Roberts, W.H., III, and Cordell, R.J., 1980, Problems of petroleum migration: Tulsa, Okla., American Association of Petroleum Geologists [AAPG], AAPG studies in geology no. 10, 273 p., accessed August 6, 2025, at https://doi.org/10.1306/St10411.
Schmoker, J.W., and Klett, T.R., 2007, U.S. Geological Survey assessment concepts for conventional petroleum accumulations—Chapter 24 in Petroleum systems and geologic assessment of oil and gas in the San Joaquin Basin Province, California: U.S. Geological Survey Professional Paper 1713–24, 7 p., accessed August 6, 2025, at https://doi.org/10.3133/pp171324.
Schultz, R.A., and Evans, D.J., 2020, Occurrence frequencies and uncertainties for US underground natural gas storage facilities by State: Journal of Natural Gas Science and Engineering, v. 84, 18 p., accessed August 6, 2025, at https://doi.org/10.1016/j.jngse.2020.103630.
Standing, M.B., and Katz, D.L., 1942, Density of natural gases: Transaction of the American Institute of Mining, Metallurgical and Petroleum Engineers, v. 146, no. 1, p. 140–149, https://doi.org/10.2118/942140-G.
Swezey, C.S., Hatch, J.R., East, J.A., Hayba, D.O., and Repetski, J.E., 2015, Total petroleum systems of the Michigan Basin—Petroleum geology and geochemistry and assessment of undiscover resources, chap. 2 of U.S. Geological Survey Michigan Basin Province Assessment Team, Geologic assessment of undiscovered oil and gas resources of the U.S. portion of the Michigan Basin: U.S. Geological Survey Digital Data Series, DDS–69–T, 162 p., accessed August 6, 2025, at https://doi.org/10.3133/ds69T.
U.S. Energy Information Administration [EIA], 2015, The basics of underground natural gas storage: EIA website, accessed August 6, 2025, at https://www.eia.gov/naturalgas/storage/basics/.
U.S. Energy Information Administration [EIA], 2023a, U.S. electric capacity mix shifts from fossil fuels to renewables in AEO2023: EIA website, accessed August 6, 2025, at https://www.eia.gov/todayinenergy/detail.php?id=61108.
U.S. Energy Information Administration [EIA], 2023b, Natural gas—Underground natural gas storage capacity: EIA website, accessed August 6, 2025, at https://www.eia.gov/dnav/ng/ng_stor_cap_dcu_NUS_a.htm.
U.S. Energy Information Administration [EIA], 2024, Glossary: EIA website, accessed August 6, 2025, at https://www.eia.gov/tools/glossary/index.php.
U.S. Geological Survey Geologic Carbon Dioxide Storage Resources Assessment Team, 2013, National assessment of geologic carbon dioxide storage resources—Results (ver. 1.1, September 2013): U.S. Geological Survey Circular 1386, 41 p., accessed July 30, 2025, at https://pubs.usgs.gov/circ/1386/. [Supersedes ver. 1.0 released June 26, 2013.]
U.S. Geological Survey National Oil and Gas Resource Assessment Team, 1995, 1995 national assessment of United States oil and gas resources: U.S. Geological Survey Circular 1118, 20 p., accessed March 11, 2024, at https://pubs.usgs.gov/circ/1995/circ1118/execsum.html.
U.S. Geological Survey, 2024, United States assessments of undiscovered oil and gas resources: U.S. Geological Survey website, accessed August 8, 2024, at https://www.usgs.gov/centers/central-energy-resources-science-center/science/united-states-assessments-undiscovered-oil.
van Elk, J.F., Gupta, R., and Wann, D.J., 2010, Probabilistic aggregation of oil and gas field resource estimates and project portfolio analysis: SPE Reservoir Evaluation and Engineering, v. 13, no. 1, paper SPE–116395–PA, p. 72–81, accessed August 6, 2025, at https://doi.org/10.2118/116395-PA.
Van Wees, J.D., Buijze, L., Van Thienen-Visser, K., Nepveu, M., Wassing, B.B.T., Orlic, B., and Fokker, P.A., 2014, Geomechanics response and induced seismicity during gas field depletion in the Netherlands: Geothermics, v. 52, p. 206–219, accessed August 6, 2025, at https://doi.org/10.1016/j.geothermics.2014.05.004.
Varela, B.A., and Buursink, M.L., 2025, Methodology for defining and compiling abandoned and active hydrocarbon well inventories: U.S. Geological Survey Scientific Investigations Report 2025–5030, 7 p., accessed August 6, 2025, at https://doi.org/10.3133/sir20255030.
Wang, X., and Economides, M.J., 2009a, Natural gas basics, chap. 1 of Wang, X., and Economides, M.J., eds., Advanced natural gas engineering: Gulf Publishing Company, Houston, Tex., p. 1–34, accessed August 6, 2025, at https://doi.org/10.1016/B978-1-933762-38-8.50008-3.
Wang, X., and Economides, M.J., 2009b, Underground natural gas storage, chap. 8 of Wang, X., and Economides, M.J., eds., Advanced natural gas engineering: Houston, Tex., Gulf Publishing Company, p. 289–302, accessed August 6, 2025, https://doi.org/10.1016/B978-1-933762-38-8.50015-0.
Wang, X., and Economides, M.J., 2012, Purposefully built underground natural gas storage: Journal of Natural Gas Science and Engineering, v. 9, p. 130–137, accessed August 6, 2025, at https://doi.org/10.1016/j.jngse.2012.06.003.
Warwick, P.D., Attanasi, E.D., Blondes, M.S., Brennan, S.T., Buursink, M.L., Cahan, S.M., Doolan, C.A., Freeman, P.A., Karacan, C.Ö., Lohr, C.D., Merrill, M.D., Olea, R.A., Shelton, J.L., Slucher, E.R., and Varela, B.A., 2022, National assessment of carbon dioxide enhanced oil recovery and associated carbon dioxide retention resources—Results: U.S. Geological Survey Circular 1489, 39 p., accessed August 6, 2025, at https://doi.org/10.3133/cir1489.
Warwick, P.D., Attanasi, E.D., Olea, R.A., Blondes, M.S., Freeman, P.A., Brennan, S.T., Merrill, M.D., Verma, M.K., Karacan, C.Ö., Shelton, J.L., Lohr, C.D., Jahediesfanjani, H., and Roueché, J.N., 2019, A probabilistic assessment methodology for carbon dioxide enhanced oil recovery and associated carbon dioxide retention: U.S. Geological Survey Scientific Investigations Report 2019–5115, 51 p., accessed August 6, 2025, at https://doi.org/10.3133/sir20195115.
Zoback, M., and Smit, D., 2023, Meeting the challenges of large-scale carbon storage and hydrogen production: Proceedings of the National Academy of Sciences, v. 120, no. 11, article e2202397120, accessed August 6, 2025, at https://doi.org/10.1073/pnas.2202397120.
Conversion Factors
U.S. customary units to International System of Units
Temperature in degrees Celsius (°C) may be converted to degrees Fahrenheit (°F) as follows:
°F = (1.8 × °C) + 32.
Temperature in degrees Fahrenheit (°F) may be converted to degrees Celsius (°C) as follows:
°C = (°F – 32) / 1.8.
Abbreviations
Bcf
billion cubic feet
CO2
carbon dioxide
CRD
Comprehensive Resource Database [Nehring Associates, Inc.]
EIA
[U.S.] Energy Information Administration
ERP
[U.S. Geological Survey] Energy Resources Program
ft
foot
GIS
geographic information system
GOR
gas-to-oil ratio
LPG
liquid petroleum gas
NASEM
National Academies of Sciences, Engineering, and Medicine
NETL
National Energy Technology Laboratory
NGL
natural gas liquid
OGIP
original gas in place
PHMSA
Pipeline and Hazardous Materials Safety Administration
psia
pound-force per square inch absolute
psi/ft
pounds per square inch per foot
SCF/Bbl
standard cubic feet of gas per barrel of oil
Tcf
trillion cubic feet
USGS
U.S. Geological Survey
For more information about this publication contact:
Program Coordinator, USGS Energy Resources Program
12201 Sunrise Valley Drive
Mail Stop 913
Reston, VA 20192
Publishing support provided by the Reston Publishing Service Center
Disclaimers
Any use of trade, firm, or product names is for descriptive purposes only and does not imply endorsement by the U.S. Government.
Although this information product, for the most part, is in the public domain, it also may contain copyrighted materials as noted in the text. Permission to reproduce copyrighted items must be secured from the copyright owner.
Suggested Citation
Buursink, M.L., Wiens, A.M., Jones, M.M., Varela, B.A., Freeman, P.A., Brennan, S.T., Merrill, M.D., and Warwick, P.D., 2025, A probabilistic assessment methodology for the evaluation of geologic energy storage capacity—Natural gas storage in depleted hydrocarbon reservoirs: U.S. Geological Survey Scientific Investigations Report 2025–5108, 26 p., https://doi.org/10.3133/sir20255108.
ISSN: 2328-0328 (online)
Study Area
| Publication type | Report |
|---|---|
| Publication Subtype | USGS Numbered Series |
| Title | A probabilistic assessment methodology for the evaluation of geologic energy storage capacity—Natural gas storage in depleted hydrocarbon reservoirs |
| Series title | Scientific Investigations Report |
| Series number | 2025-5108 |
| DOI | 10.3133/sir20255108 |
| Publication Date | December 19, 2025 |
| Year Published | 2025 |
| Language | English |
| Publisher | U.S. Geological Survey |
| Publisher location | Reston, VA |
| Contributing office(s) | Geology, Energy & Minerals Science Center |
| Description | vii, 26 p. |
| Country | United States |
| State | Michigan |
| Online Only (Y/N) | Y |
| Additional Online Files (Y/N) | N |