

Environmental Characterization of Blue Mesa Reservoir and Potential Causes of and Management Strategies for Harmful Algal Blooms, 1970 through 2023, Curecanti National Recreation Area, Colorado
Links
- Document: Report (9.8 MB pdf) , HTML , XML
- Tables:
- Appendix 1 (zip) - Tables 1.1 to 1.5
- Appendix 2 (zip) - Tables 2.1 to 2.3
- Dataset: USGS National Water Information System database - USGS water data for the Nation
- Data Release: USGS data release - Phytoplankton, algal toxin, and water-quality data for Blue Mesa Reservoir, Colorado, 1970–2023
- Download citation as: RIS | Dublin Core
Acknowledgments
The authors thank numerous individuals at the National Park Service, Curecanti National Recreation Area, and others, who assisted with sampling and logistics including Brandon Hallock, Jessica Frey, Bridget Goddard, Bethany Powhida, Samantha Shelafo, Lucca Sterrer, Alexander Baca, and Itziar Lopez Zandueta. Sonja Chavez of the Upper Gunnison River Water Conservancy District provided invaluable assistance with field work and project funding logistics.
The authors also thank U.S. Geological Survey staff who assisted with sample collection and report preparation including Lesleigh Anderson, Robert Bean, and Sharon Qi. Thomas Chapin designed and installed the refrigerated nutrient autosamplers described herein. Paul Bradley and Kelly Smalling provided helpful discussions about analysis of samples for pharmaceutical compounds. Bridget Deemer and Sarah Stackpoole provided thoughtful reviews that helped improve the quality and clarity of this report. Construction of the conceptual diagrams by Benjamin Siebers is greatly appreciated. Thanks to personnel at U.S. Geological Survey Rolla Science Publishing Network for their efficiency and professionalism in constructing the layout for this report.
Abstract
Blue Mesa Reservoir, in the Curecanti National Recreation Area, is the largest storage reservoir in Colorado and consists of three distinct basins: Iola (the shallowest), Cebolla, and Sapinero. After algal toxins were first documented in Iola basin in 2018, the U.S. Geological Survey began a study in cooperation with the National Park Service, Colorado River Water Conservation District, Upper Gunnison River Water Conservancy District, Gunnison County, Project 7 Water Authority, and Uncompahgre Valley Water Users Association to better understand occurrence of toxic cyanobacteria harmful algal blooms (cyanoHABs) and identify possible causal mechanisms to potentially inform management strategies.
Toxic cyanoHABS occurred when the algal toxin microcystin exceeded a concentration of 8 micrograms per liter primarily in Iola basin in 2018 and 2020–22, years having some of the lowest reservoir water-level elevations (reservoir levels) since 1984. The toxic cyanoHABs started in mid-September and continued through the fall months. Algal abundance was greatest in Iola basin compared to Cebolla and Sapinero basins, with Aphanizomenon, a toxin-producing cyanobacterium, being the most abundant. During blooms, enhanced algal photosynthesis caused elevated pH and dissolved oxygen concentrations especially in Iola basin. Continuous monitor data in Iola basin indicated peaks in phycocyanin fluorescence, pH, and dissolved oxygen concentration that preceded the onset of toxic cyanoHABs by about 2 weeks potentially indicating a useful early warning monitoring strategy for future response to toxic cyanoHABs. Long-term trends showed increases in mean air and surface-water temperatures and chlorophyll-a concentrations in the reservoir but no change in nutrient inputs from major tributaries. In Iola basin, reservoir level was positively correlated with Secchi disk depth and inversely correlated with total phosphorus concentration. Because of its shallow depth, the effect of low reservoir levels may disproportionately affect Iola basin compared to other basins, resulting in algal blooms and toxin production especially at reservoir levels below about 7,470 feet above North American Vertical Datum of 1988. Elevated phosphorus at low reservoir level likely was primarily phosphorus contained in algal tissue.
This report indicates that the main driver for recent toxic cyanoHABs in Iola basin is low reservoir level that likely causes favorable conditions (shallow and warm) for algal growth and increased recruitment of algae from bottom sediments such as during wind-driven turbulence. Control of external nutrients to the reservoir is unlikely to help control algal blooms because Aphanizomenon fixes nitrogen from the atmosphere, and there is an abundant geogenic source of phosphorus. Maintenance of reservoir levels greater than about 7,470 feet might help minimize the occurrence of toxic cyanoHABs. Additional data could help better understand how the timing and duration of reservoir levels below 7,470 feet contribute to toxic cyanoHABs.
Plain Language Summary
Blue Mesa Reservoir (Blue Mesa), in the Curecanti National Recreation Area, is the largest storage reservoir in Colorado and consists of three distinct basins: Iola (the shallowest), Cebolla, and Sapinero. After algal toxins were first documented in Iola basin in 2018, the U.S. Geological Survey began a study to better understand occurrence of toxic harmful algal blooms (HABs) and identify possible causal mechanisms to potentially inform management strategies. Harmful algal blooms occurred in Blue Mesa when concentration of a toxic substance produced by dying algae was greater than health advisory levels, prompting no contact warnings for humans and their pets in Blue Mesa. This condition occurred starting in September and lasted as late as early November in Iola basin in 2018 and 2020–22. These years had some of the lowest recorded reservoir water-level elevations since 1984. Iola basin had the greatest amount of algae compared to Cebolla and Sapinero Basins, and a type of algae that could produce toxins was the most abundant. Multiple climate and water-quality indicators were examined in the reservoir and its tributaries to determine the causes of toxic HABs in Blue Mesa. The results indicate that the main cause for recent toxic HABs in Iola basin may be low reservoir level that likely causes favorable conditions (shallow and warm) for algal growth and increased release of algae from bottom sediments, for example, during wind-driven turbulence. Control of external nutrients to the reservoir is unlikely to help control algal blooms because the toxin-producing algae can use nitrogen from the atmosphere, and there are abundant geologic sources of phosphorus providing that nutrient to Blue Mesa. Maintenance of reservoir water-level elevation greater than about 7,470 feet might help minimize the occurrence of toxic HABs in Blue Mesa.
Introduction
In many parts of the world, eutrophication of water bodies has accelerated since the middle of the 20th century (Ho and others, 2019). Excessive growth of algae in water bodies is termed an “algal bloom,” and algal blooms increase with eutrophication (Glibert, 2017). Multiple factors affect the occurrence and severity of algal blooms in lakes and reservoirs. Nitrogen and phosphorus are essential nutrients in aquatic ecosystems but can cause excessive growth of algae when present in large amounts (Smith, 2003; Wilhelm and others, 2020). In addition to nutrient supply, environmental conditions such as warm water temperature and light availability can promote algal growth (Rus and others, 2018). Water levels and hydraulic retention time may also contribute to formation of algal blooms (Kann and Walker, 2020; Xiao and others, 2024). Algal blooms can also produce toxins; however, the conditions that lead to toxin production are not well understood (Carmichael, 2001; Graham and others, 2006; Beversdorf and others, 2013; Neilan and others, 2013; Rus and others, 2018; Chorus and Welker, 2021b). Algal toxins, if present in sufficient concentration, are harmful to ecosystems in which they occur, to humans and their companion animals, and to other animals that ingest or contact the water (Carmichael, 2001; Backer and others, 2015; Loftin and others, 2016; Svirčev and others, 2019). Algal blooms are termed harmful when they produce toxins or result in other possible deleterious effects including hypoxia (lack of oxygen in the water column) that can lead to fish kills, food web impairment, taste and odor problems, lost recreation opportunities, and diminishing property values (Christensen and others, 2024).
In addition to the noted increase in algal blooms, there has been an increase in the occurrence of cyanobacterial blooms where they had not previously been documented (Griffith and Gobler, 2020; Chorus and Welker, 2021a). Cyanobacteria, commonly known as blue-green algae, are technically prokaryotic bacteria (single celled and lacking a cell nucleus and other organelles) that photosynthesize similarly to eukaryotic organisms such as algae (Vidal and others, 2021; Gorney and others, 2023). Like photosynthetic algae, cyanobacteria possess the photosynthetic pigment chlorophyll-a as well as other photosynthetic pigments (phycocyanin and phycoerythrin) that extend the range of wavelengths for photosynthesis beyond those used by chlorophyll-a (Vidal and others, 2021). Phycocyanin appears blue, particularly after cyanobacterial cells die and lyse (rupture), which explains their common name “blue-green” algae (Vidal and others, 2021). Large blooms of cyanobacteria, which are considered the primary source of algal toxins in freshwater ecosystems, can produce highly potent toxins called cyanotoxins (U.S. Environmental Protection Agency [EPA], 2025). Cyanotoxins are released into water bodies mostly during cell death and lysis of cyanobacteria. The most frequently detected cyanotoxins in the United States are microcystins, cylindrospermopsins, anatoxins, guanitoxins, saxitoxins, and nodularins (EPA, 2025).
Physiological characteristics vary between and within species of cyanobacteria (Yoshida and others, 2008; de Figueiredo and others, 2011; Pierangelini and others, 2014; Xiao and others, 2017). Some cyanobacteria possess traits that allow them to thrive under a variety of conditions and dominate phytoplankton assemblages (Paerl and Huisman, 2008; Carey and others, 2012; Paerl and Otten, 2013; Wilhelm and others, 2020; Chorus and Welker, 2021b; Patiño and others, 2023). For example, some species have gas vesicles and are buoyant (Walsby, 1994), allowing them to remain near the surface of the water where light is abundant (Jöhnk and others, 2008; Yang and others, 2016), shading and potentially limiting competition from nonbuoyant phytoplankton (Paerl and Huisman, 2008). Warm water temperatures promote lake stratification and increased water-column stability, which creates favorable conditions for buoyant cyanobacteria (Jöhnk and others, 2008; Paerl and Huisman, 2008; Wagner and Adrian, 2009; Carey and others, 2012). In addition, in experimental warming conditions, cyanobacteria had higher growth rates than eukaryotic phytoplankton (Lürling and others, 2017). Certain species tolerate nutrient shortages by storing phosphorus (Isvánovics and others, 2000; Li and Dittrich, 2019) or fixing nitrogen from the atmosphere (Beversdorf and others, 2013; Willis and others, 2016). Furthermore, some cyanobacteria may survive in lake sediments or water during winter and contribute to blooms the following summer (Walsby and Schanz, 2002; Verspagen and others, 2004; Kitchens and others, 2018). Further, blooms of Aphanizomenon flos-aquae have been observed in winter, under ice in oligo-mesotrophic lakes (Üvegas and others, 2012), demonstrating the wide temperature tolerance of some cyanobacteria.
Blue Mesa Reservoir (hereafter referred to as “Blue Mesa”) is the largest storage reservoir in Colorado (fig. 1) and is part of the Curecanti National Recreation Area managed by the National Park Service (NPS). Water in Blue Mesa is used for recreation (fishing, birding, and boating), domestic and agricultural water supply, and hydroelectric power generation (Bauch and Malick, 2003). Algae and cyanobacteria are common in Blue Mesa and were noted shortly after reservoir impoundment in 1965 (Bauch and Malick, 2003). In September 2018, algal bloom sitings triggered sampling for toxins that produced the first known detections of toxin (microcystin) in Blue Mesa and prompted public warning to avoid contact (National Park Service, 2018). Toxin monitoring and detections continued from 2019 through 2023, though toxin concentrations did not reach health advisory levels every year. Each time toxins were detected, NPS issued a “No Contact Advisory,” published a news release, and posted warning signs to protect the health of visitors and their pets (for example, National Park Service, 2021). These toxic algal blooms were occurring against a backdrop of prolonged regional drought that limited snowmelt and rainfall to refill Blue Mesa. This drought includes the worst 15-year drought on record in the Colorado River region from 2000 to 2014 (Udall and Overpeck, 2017). In addition, the regional drought caused the first ever “call on the Colorado River,” meaning upstream users must provide adequate water to meet downstream water demand (Bureau of Reclamation, 2021). In 2021, the “call on the river” included increased withdrawals from Blue Mesa to support water supply downstream in Lake Powell (not shown in fig. 1) (Bureau of Reclamation, 2021; Booth, 2021).
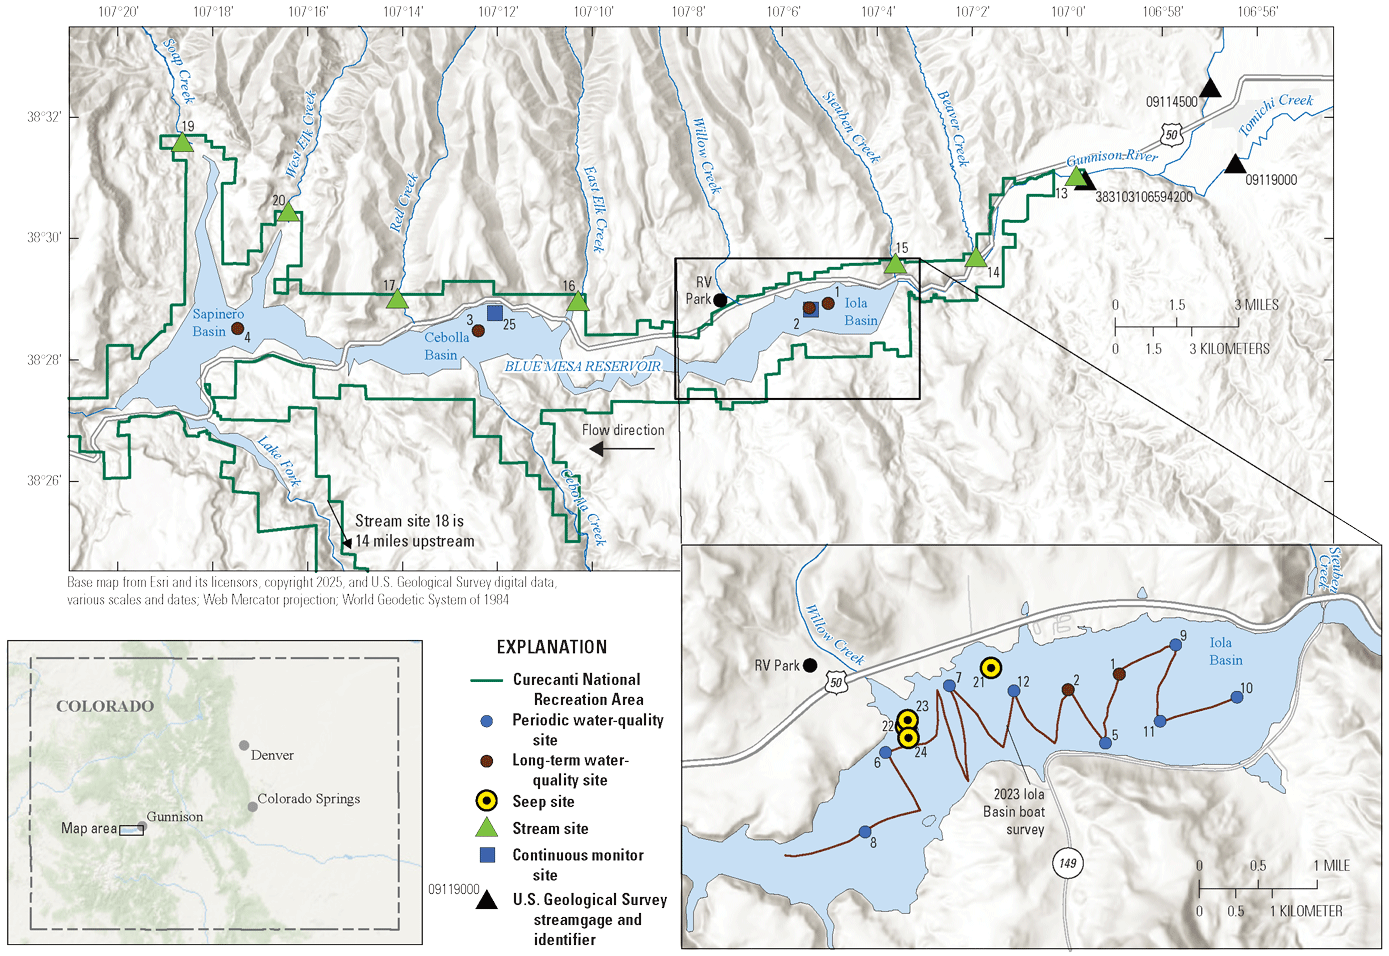
Map of study area showing the three reservoir basins (Iola, Cebolla, and Sapinero), and locations of three U.S. Geological Survey streamgages with site numbers, periodic and long-term water-quality reservoir sites, stream and seep sites, recreational vehicle campground (RV park), and continuous monitor sites in and adjacent to Blue Mesa Reservoir, Colorado. Inset map shows the path of the 2023 Iola basin boat survey as well as seep sites not shown on the main map.
The occurrence of macroscopic algae or cyanobacteria in Blue Mesa discussed in this report will, in general, be referred to as algal blooms. If cyanobacteria or the toxins are associated with a bloom, then it will be called a cyanobacteria harmful algal bloom (cyanoHAB) because only cyanobacteria can produce toxins. Herein, the term “toxic cyanoHAB” is used for periods when detected toxins exceed the 8 micrograms per liter (µg/L) concentration for human health (EPA, 2024a). The “harmful” aspect of cyanoHABs in Blue Mesa indicates their potential to produce toxins that may affect human and ecosystem health. Ancillary “harm” caused by the blooms includes discoloration of the water and formation of scum and mats on the surface (fig. 2) and disruption to recreation and related economic activity in Blue Mesa and surrounding communities. The “bloom” aspect of cyanoHABs in Blue Mesa is the excessive growth of algae and elevated concentrations of chlorophyll-a.
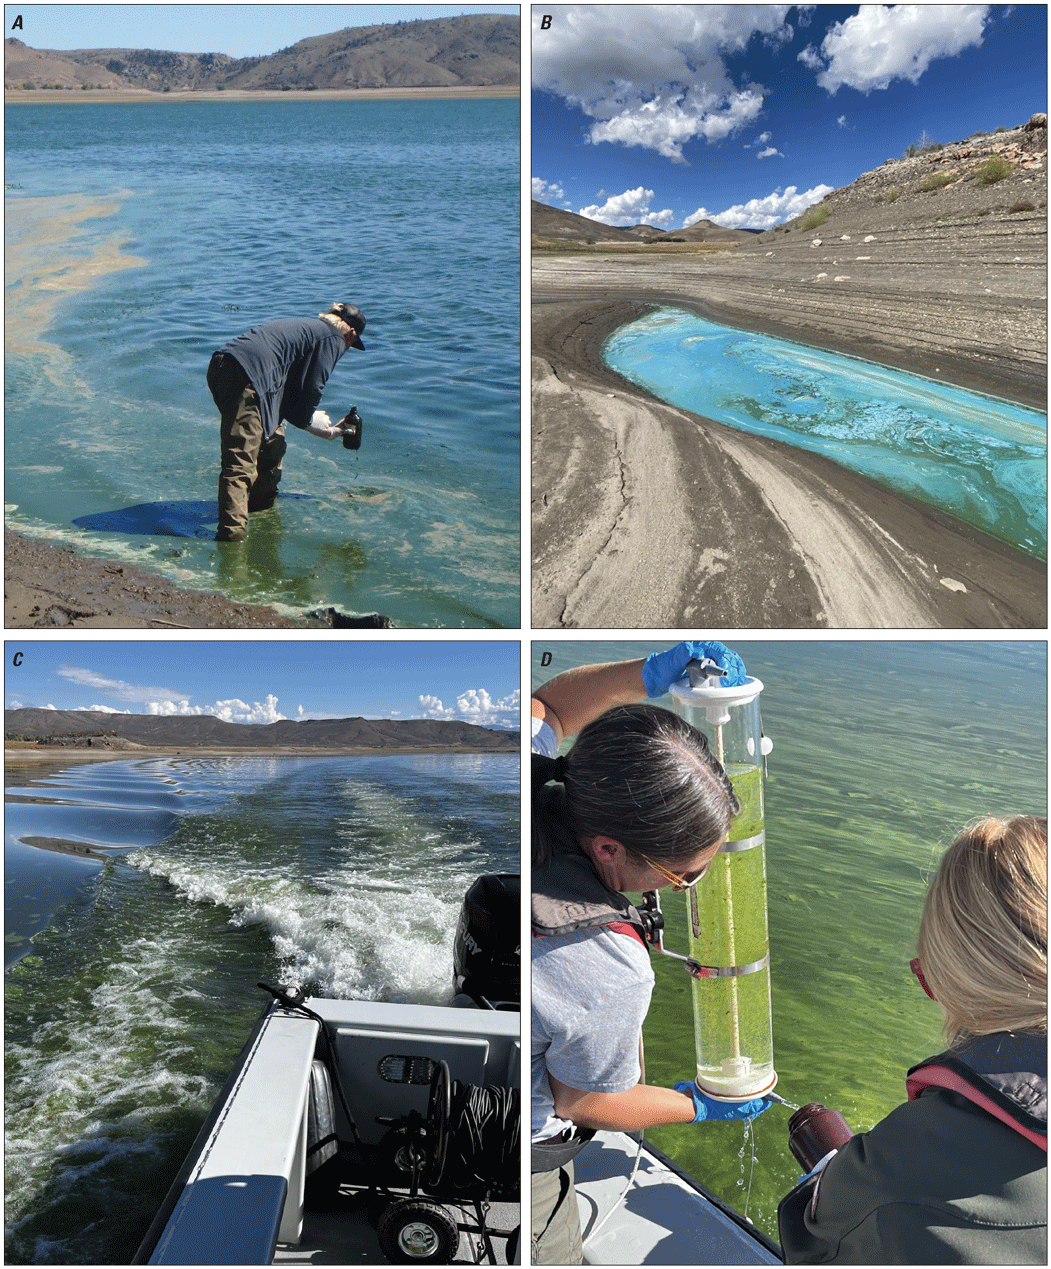
Photographs of algal blooms on Blue Mesa Reservoir. A, National Park Service personnel collecting a toxin sample from an algal mat on July 21, 2021 (photograph by N.J. Bauch, U.S. Geological Survey [USGS]). B, Cyan-colored algal mat area (approximately 10 feet across at maximum width) in small inlet on the north shore of Iola basin, September 16, 2022 (photograph by E. Gohring, USGS). C, Abundance of algae indicated in green color of boat wake on September 28, 2022, (photograph by K. Walton-Day, USGS). D, Algal mats on reservoir surface and abundant algae in Van Dorn sampler as National Park Service personnel collect a sample on September 28, 2022 (photograph by K. Walton-Day, USGS).
In 2021, the U.S. Geological Survey (USGS), in cooperation with NPS, began a study to better understand algal blooms in Blue Mesa and the recent occurrence of cyanoHABs in the reservoir. In 2022, Colorado River Water Conservation District, Upper Gunnison River Water Conservancy District, Gunnison County, Project 7 Water Authority, and Uncompahgre Valley Water Users Association joined the study. The objectives of this study are to better understand seasonal and long-term variations in environmental conditions (physical, chemical, and biological conditions) in Blue Mesa; identify potential conditions causing formation of cyanoHABs in Blue Mesa using short- and long-term datasets; and provide information that could be used to support development of management strategies by NPS for the public health aspects of the cyanoHABs, including the objective to develop a method to use satellite data to map chlorophyll-a concentrations in Blue Mesa. The results for the last objective are described in a separate report (King and others, 2025) which is described in the “Concurrent Investigation” section.
Purpose and Scope
The purpose of this report is to combine newly collected water-quality and biological data with longer-term water quality, climate, and hydrologic data from Blue Mesa to describe the environmental conditions supporting the occurrence of cyanoHABs and potential causal mechanisms that could be used to formulate management strategies. An additional purpose of this report is to demonstrate the use of remote-sensing data to map chlorophyll-a concentrations in Blue Mesa. That work is briefly described herein, but largely reported elsewhere (King and others, 2025).
The report presents results of water-quality data collected by USGS at reservoir sites in Blue Mesa and selected tributaries and seeps flowing into Blue Mesa during 2021–23. Discrete water-quality samples were analyzed for field measurements, nutrients, chlorophyll-a, algal taxonomy, and select major and trace elements. Some samples were also analyzed for wastewater indicators and nitrogen isotopes. Continuous water-quality measurements were collected just below the surface using continuous monitors installed at two sites in Blue Mesa during 2022 and during two boat surveys in Iola basin in September 2023. In addition, nutrient samples were collected using refrigerated autosamplers at three tributary sites in 2022. Some of these data (selected major and trace elements, water-quality data from boat surveys in 2023, and refrigerated autosamplers) were not used for interpretations herein.
This report also presents water-quality and hydrologic data compiled from different sources during longer periods of record. Reservoir hydrologic data collected by the Bureau of Reclamation (Reclamation) were compiled for 1970–2023 (Bureau of Reclamation, 2024), and streamflow data measured by USGS were compiled for 1980–2023 (USGS, 2024a). Gridded surface air temperature datasets were compiled for 1970–2023 (PRISM Climate Group, 2024). Discrete water-quality data collected by the NPS for the reservoir and selected tributaries were compiled for 2001–23 (National Water Quality Monitoring Council, 2024). Algal toxin data collected by NPS at Blue Mesa were compiled for 2018–23 (Qi and others, 2025). Comparisons to water-quality standards are included to provide environmentally relevant context to observations of stream or lake conditions and not to characterize or rate the “condition” of any stream or lake, or to assess the impairment or health of the watershed. Finally, geochemical data for rock samples collected in the Blue Mesa watershed (USGS, 2024b) were compiled to examine the potential for geogenic sources of the nutrient phosphorus and for the possible wastewater indicator lithium.
Data compiled during two time periods were examined to assess physical, chemical, and biological conditions in Blue Mesa. The shorter time period, 2016–23, starting 2 years before algal toxins were reported in Blue Mesa, permits examination of the conditions present before, during, and sometimes after documented toxic cyanoHABs in the reservoir. The longer time periods, 2001–23 for water-quality data and 1970–2023 for hydrologic data, were investigated to assess whether long-term changes contributed to the recent increased occurrence of cyanoHABs and toxic cyanoHABs.
Description of Study Area
Blue Mesa is located within Curecanti National Recreation Area and begins about 5 miles west of the town of Gunnison and extends about 16 miles to the west (fig. 1). Operation of Blue Mesa is controlled by Reclamation, and the recreational uses of Blue Mesa are administered by the NPS. Blue Mesa is the largest body of water (by volume) in Colorado, with a maximum storage capacity of 938,141 acre-feet and a surface area of 9,219 acres at maximum reservoir water-level elevation (hereafter referred to as “reservoir level”) of 7,519.4 feet (ft) above North American Vertical Datum of 1988 (Hilldale, 2019). Herein, 7,519 ft is used as the maximum reservoir level during 1970–2023. The average residence time for Blue Mesa was 230 days for 1970–2023 (Bureau of Reclamation, 2024) but differs annually depending on inflow and outflow rates to the reservoir.
Blue Mesa consists of three distinct reservoir basins from upstream (east) to downstream (west) including Iola, Cebolla, and Sapinero (fig. 1). The morphology and bathymetry of Iola basin is different from that of Cebolla and Sapinero basins; it is shallower (median depth, 61 ft) with a reservoir bottom having much less relief and topography than Cebolla (median depth, 102 ft), and Sapinero (median depth, 118 ft) basins, which have narrow canyons in the deepest regions adjacent to broadly sloping reservoir bottom (fig. 3) (reservoir depths from Hilldale, 2019). Consequently, low reservoir levels expose a relatively larger part of reservoir bottom in Iola basin than in Cebolla or Sapinero basins.
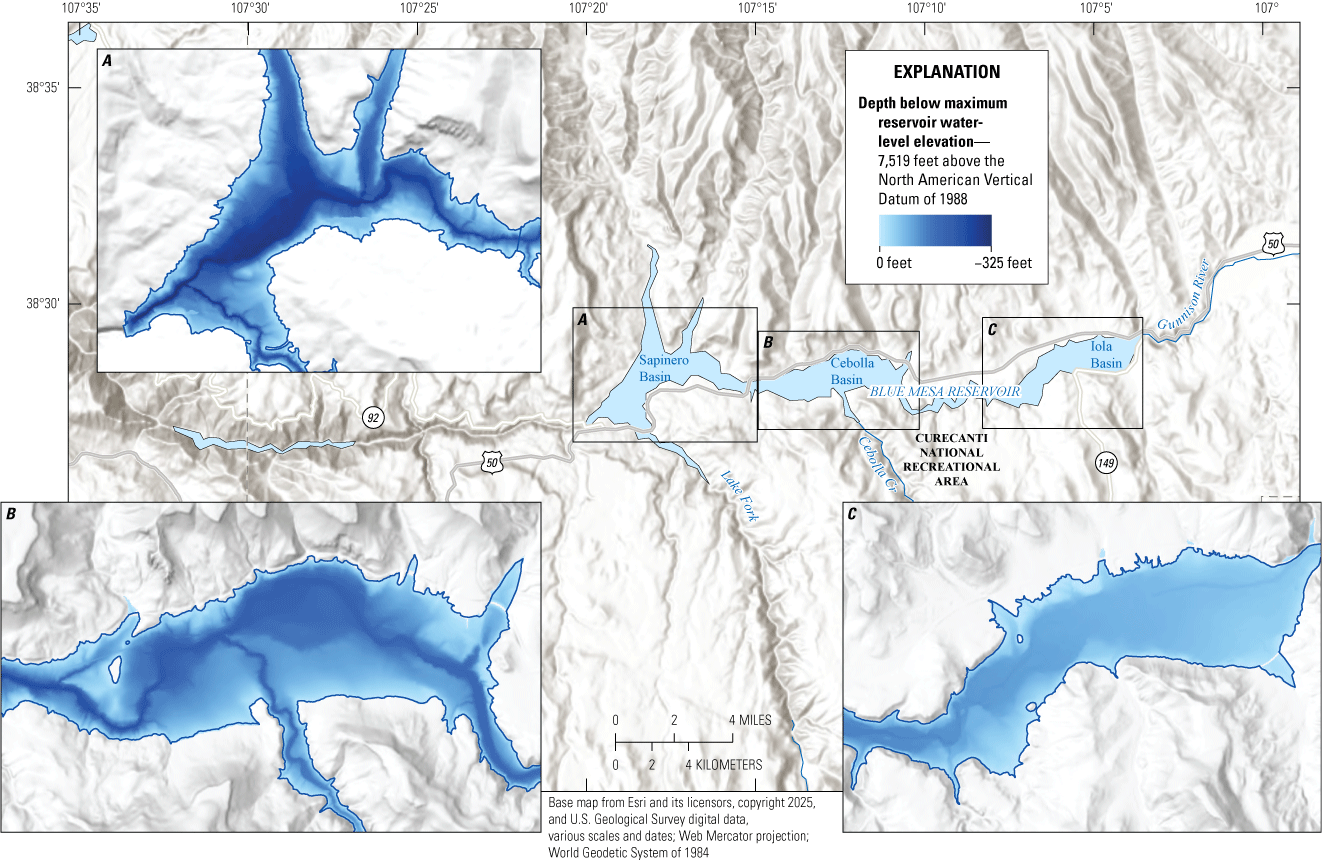
Bathymetry of Blue Mesa Reservoir in Colorado showing contrasting depths and morphology of Iola, Cebolla, and Sapinero basins. Bathymetry data from Hilldale (2019).
The Blue Mesa has 98 miles of shoreline that are bordered by rolling hills with dominant vegetation of sagebrush (Artemisia sp.) and Gambel’s oak (Quercus gambelii) (Bauch and Malick, 2003). The Gunnison River (fig. 1) is the main tributary to the reservoir and, based on a streamgage located at Gunnison River at County Road 32 below Gunnison, Colorado (USGS site 383103106594200; fig. 1; hereafter referred to as “Gunnison River site 13”), supplied about 60 percent of the inflow to Blue Mesa during 2018–23 (USGS, 2024a). Lake Fork of the Gunnison River, Cebolla Creek, and Soap Creek are additional primary inflows to Blue Mesa (fig. 1). The watershed containing Blue Mesa is dominated by forest and scrubland (85 percent), with less than 2 percent agricultural land that primarily occurs along river channels (Dewitz, 2023; fig. 4). A wastewater treatment facility discharges effluent to the Gunnison River approximately 2.5 miles upstream from the reservoir.
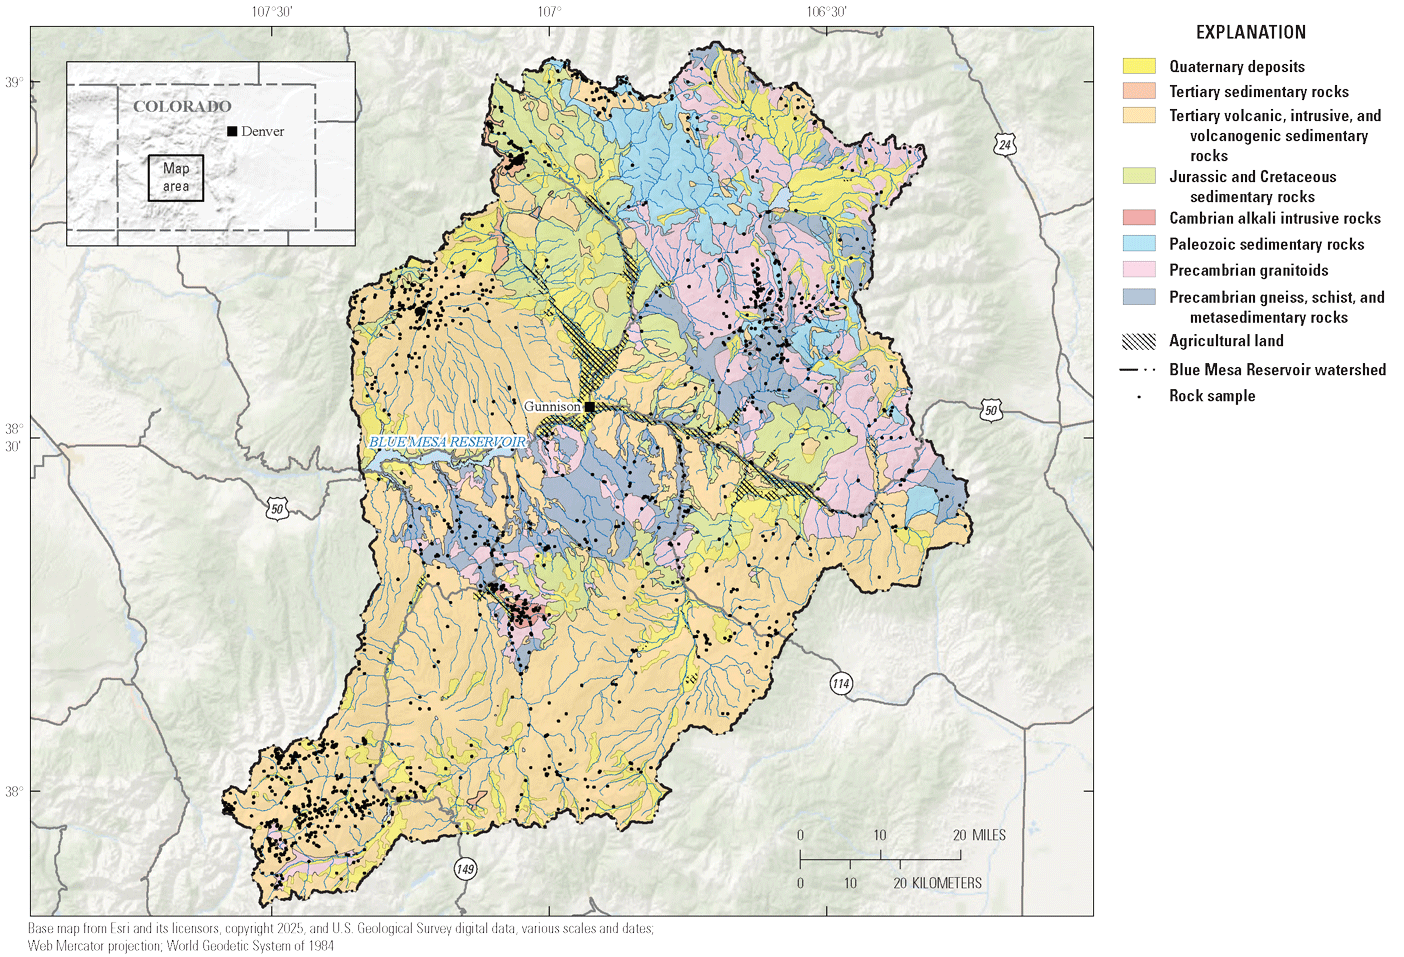
Generalized geologic map of Blue Mesa Reservoir watershed including distribution of agricultural land (from Dewitz, 2023) and location of rocks samples used in geochemical analysis (modified from Day and others, 1999).
The oldest rocks in the Blue Mesa watershed are Proterozoic gneiss, schist, and granites; Paleozoic sedimentary rocks; Cambrian alkalic intrusions; and Jurassic and Cretaceous sedimentary rocks (fig. 4, modified from Day and others, 1999). These rock types mainly are present in the headwater areas of the Gunnison River (east on fig. 4) and to the south of Blue Mesa. The lower part of the watershed (downstream from Gunnison River site 13; fig. 1) is dominated by younger Tertiary volcanic, intrusive, and volcanogenic sedimentary rocks (fig. 4), which form the highland areas to the north of Blue Mesa where they are deeply eroded. The Tertiary rocks are dominated by tuffaceous volcanic breccias, some of which contain vitrophyres, which are rich in volcanic glass (Hedlund and Olson, 1973). More details on the geology and geologic history of the area are available in Day and Bove (2003).
Previous Investigations
Several early studies characterized water quality, algal taxonomy, and primary productivity in Blue Mesa after algae and cyanobacteria were observed in the reservoir soon after impoundment (Blackwell and Boland, 1979; Britton and Wentz, 1980; Cudlip and others, 1987; Long and others, 1996; Bauch and Malick, 2003). In 1999, the USGS and the NPS completed an intensive study of nutrient status and productivity in Blue Mesa Reservoir (Bauch and Malick, 2003). They reported that nitrogen and phosphorus concentrations were low in Blue Mesa, and conditions were likely nitrogen limited during summer and fall. Diatoms (primarily Asterionella and Melosira sp.) dominated the phytoplankton community composition during spring and early winter; cyanobacteria (primarily Aphanizomenon) dominated during summer and fall when temperatures were warmer. Phytoplankton density was highest in Iola basin compared to the downstream basins. Bauch and Malick (2003) also computed trends using historical nutrient and chlorophyll-a data during 1992–99. They reported there were no statistically significant trends in concentrations of nutrients or chlorophyll-a within Blue Mesa except for a small downward trend in phosphorus at the west end of the reservoir, suggesting that the reservoir had not experienced increased nutrient enrichment and productivity prior to 1999 (Bauch and Malick, 2003).
Previous studies have also evaluated nutrient inputs to Blue Mesa from tributary streams. Brown and Thoma (2012) compiled nutrient data for streams in the Blue Mesa watershed for 1974–2007. They compared concentrations to EPA-recommended nutrient criteria for forested mountain and xeric west ecoregions (EPA, 2000) and evaluated trends for selected sites during varying periods of record between 1995 and 2007. More recently, Weissinger and Gibney (2019) analyzed water-quality data collected by the NPS at Blue Mesa during 2010–18. They reported elevated total phosphorus in several tributaries and in Blue Mesa that sometimes exceeded the State of Colorado interim aquatic life standard of 0.11 milligram per liter (mg/L) (Colorado Department of Public Health and Environment, 2023). Trend analysis by Weissinger and Gibney (2019) for 2001–14 determined a few statistically significant trends in pH and major-ion concentrations at tributary sites but no trends in nutrients for the tributary or reservoir sites.
Concurrent Investigation
A companion investigation completed concurrently with this study assessed the potential use of remote-sensing data to map chlorophyll-a concentrations and water temperature to support algal bloom monitoring in Blue Mesa (King and others, 2024, 2025). In situ chlorophyll-a measurements collected during this study and multispectral satellite imagery were used to train a machine learning model that reconstructed summertime chlorophyll-a concentrations throughout all basins in Blue Mesa from 2016 to 2023. Historical water surface temperature measurements and a remote-sensing temperature product were used to reconstruct summertime water surface temperatures in Blue Mesa from 2000 through 2023. The chlorophyll-a results indicated that the algal blooms (as mapped by chlorophyll-a concentration) exhibit a consistent spatial pattern across multiple years, initiating in Iola basin and spreading west to Cebolla and Sapinero basins through the season. The temperature records indicate that water temperatures in Blue Mesa increased linearly at a rate of 0.3 degree Celsius (°C) per decade for 2000–23. This increase was 0.04, 0.03, and 0.02 °C per year for Iola, Cebolla, and Sapinero basins, respectively. Further, the temperature records showed that, in general, years with below average reservoir levels had above average water temperatures. Finally, there was a moderate positive correlation between summertime remotely sensed chlorophyll-a concentrations and summertime remotely sensed surface water temperature (King and others, 2025).
Study Methods
This section describes methods used by USGS to collect, process, and analyze discrete water-quality samples and to collect continuous water-quality measurements at Blue Mesa for 2021–23. Quality assurance results for discrete water-quality samples are presented. This section also presents methods for compiling and analyzing geologic and geochemical data. Lastly, the compilation of long-term datasets and statistical methods used for trend analysis is described.
Sample Collection, Processing, and Analytical Methods
The USGS collected discrete and continuous water-quality data at several sites within and adjacent to Blue Mesa during 2021–23 (table 1, fig. 1). Water sample collection sites and depths, constituents, and sample timing varied during the study and are summarized in tables 1.1, 1.2, and 1.3. Discrete sampling at reservoir sites coincided with overpass of the Sentinel 2 satellite to complement a concurrent remote-sensing report (King and others, 2025; described in “Concurrent Investigation” section).
Table 1.
Water-quality sites in and adjacent to Blue Mesa Reservoir, Colorado, sampled by U.S. Geological Survey during 2021–23.[Coordinate datum is North American Datum of 1983. No., number; USGS, U.S. Geological Survey; blw, below; Hwy, Highway; Res, Reservoir; abv, above; Cr, Creek; N, North; W, West; nr, near; rd, road; CO, Colorado; bt, boat; Cnty, county; Long term, long-term water-quality reservoir site; --, not sampled; Periodic, periodic water-quality reservoir site. Sample site information from USGS (2024a)]
| No. (fig. 1) |
USGS site | Site name | Site type | Latitude | Longitude | Basin | No. of samples | ||
|---|---|---|---|---|---|---|---|---|---|
| 2021 | 2022 | 2023 | |||||||
| 1 | 382856107050000 | Blue Mesa Reservoir below Hwy 149 near Gunnison, CO | Long term | 38.4822 | −107.0839 | Iola | 6 | -- | 2 |
| 2 | 382852107054801 | Blue Mesa Reservoir in Iola Basin nr Gunnison, CO | Long term | 38.4807 | −107.0902 | Iola | -- | 18a | 2 |
| 3 | 382829107122200 | Blue Mesa Reservoir above Cebolla Cr near Sapinero, CO | Long term | 38.4747 | −107.2067 | Cebolla | 6 | 9 | 2 |
| 4 | 382831107172600 | Blue Mesa Reservoir abv Soap Cr near Sapinero, CO | Long term | 38.4753 | −107.2912 | Sapinero | 6 | 8 | 1 |
| 5 | 382832107050801 | Blue Mesa Reservoir abv Iola bt ramp nr Gunnison, CO | Periodic | 38.4756 | −107.0856 | Iola | 3 | -- | 2 |
| 6 | 382829107064501 | Blue Mesa Reservoir blw Willow Cr nr Gunnison, CO | Periodic | 38.4747 | −107.1125 | Iola | 3 | -- | 2 |
| 7 | 382852107061701 | Blue Mesa Reservoir near Old Stevens near Gunnison, CO | Periodic | 38.4811 | −107.1047 | Iola | 3 | -- | 2 |
| 8 | 382802107065401 | Blue Mesa Reservoir nr Blaine Rock nr Gunnison, CO | Periodic | 38.4671 | −107.1150 | Iola | -- | -- | 2 |
| 9 | 382906107043701 | Blue Mesa Res W of Steuben Creek nr Gunnison, CO | Periodic | 38.4850 | −107.0770 | Iola | -- | -- | 2 |
| 10 | 382848107041001 | Blue Mesa Res nr Cnty Rd 31, nr Gunnison, CO | Periodic | 38.4800 | −107.0695 | Iola | -- | -- | 2 |
| 11 | 382840107044401 | Blue Mesa Res abv Hwy 149 W of Rd 41, near Gunnison, CO | Periodic | 38.4777 | −107.0789 | Iola | -- | -- | 2 |
| 12 | 382850107054901 | Blue Mesa Reservoir nr Stevens Cr nr Gunnison, CO | Periodic | 38.4806 | −107.0968 | Iola | -- | -- | 2 |
| 13 | 383103106594200 | Gunnison River at Cnty Rd 32 below Gunnison, CO | Stream | 38.5173 | −106.9955 | Iola | -- | 14 | -- |
| 14 | 382943107015300 | Beaver Creek at Hwy 50 near Gunnison, CO | Stream | 38.4953 | −107.0320 | Iola | 3 | 14 | -- |
| 15 | 382937107033500 | Steuben Creek near mouth near Gunnison, CO | Stream | 38.4936 | −107.0603 | Iola | 3 | 14 | -- |
| 16 | 382900107101600 | East Elk Creek near mouth near Sapinero, CO | Stream | 38.4833 | −107.1717 | Cebolla | 4 | -- | -- |
| 17 | 382902107140400 | Red Creek near mouth near Sapinero, CO | Stream | 38.4839 | −107.2351 | Cebolla | 4 | -- | -- |
| 18 | 381934107133500 | Lake Fork Gunnison River below Gateview, CO | Stream | 38.3261 | −107.2270 | Sapinero | 3 | -- | -- |
| 19 | 383137107183600 | Soap Creek above Chance Creek near Sapinero, CO | Stream | 38.5269 | −107.3106 | Sapinero | 3 | -- | -- |
| 20 | 383028107162200 | West Elk Cr below forest boundary nr Sapinero, CO | Stream | 38.5078 | −107.2734 | Sapinero | 3 | -- | -- |
| 21 | 382858107055901 | Old Stevens Seep near Gunnison, CO | Seep | 38.4828 | −107.0996 | Iola | -- | 1 | -- |
| 22 | 382838107063601 | Middle North Willow Seep nr Gunnison, CO | Seep | 38.4772 | −107.1100 | Iola | -- | 1 | -- |
| 23 | 382840107063501 | N Willow Seep in N Willow Channel nr Gunnison, CO | Seep | 38.4778 | −107.1098 | Iola | -- | 1 | -- |
| 24 | 382834107063501 | North Willow Seep at Blue Mesa Res near Gunnison, CO | Seep | 38.4761 | −107.1097 | Iola | 1 | 1 | -- |
| 25 | 382847107120401 | Blue Mesa Res west of Dry Gulch near Sapinero, CO | Periodic | 38.4797 | −107.2012 | Cebolla | -- | --a | -- |
Water-quality sampling of the reservoir generally occurred during the late spring through early fall at the long-term monitoring sites in Iola basin, Blue Mesa Reservoir below Highway 149 near Gunnison, Colo. (USGS site 382856107050000; site 1, table 1, fig. 1) and Blue Mesa Reservoir in Iola Basin near Gunnison, Colo. (USGS site 382852107054801; site 2, table 1, fig. 1); Cebolla basin, Blue Mesa Reservoir above Cebolla Creek near Sapinero, Colo. (USGS site 382829107122200; site 3, table 1, fig. 1); and Sapinero basin, Blue Mesa Reservoir above Soap Creek near Sapinero, Colo. (USGS site 382831107172600; site 4, table 1, fig. 1). Iola basin site 2 was established in 2022 because reservoir-level projections indicated Iola basin site 1 would likely be too shallow to sample during late summer. In 2021, sampling occurred bimonthly in the three reservoir basins at the surface, 3.3-ft depth, and 3.3 ft above the reservoir bottom (labeled “Deep”; table 1.1). Sampling frequency in 2022 increased to nearly weekly in Iola basin and biweekly in Cebolla and Sapinero basins, including collection at mid-depth (labeled “Mid”) and above and below the thermocline (table 1.2). In September 2023, additional near-surface samples were collected at the four main sites (sites 1–4) plus eight additional sites in Iola basin (sites 5–12). These samples were analyzed for chlorophyll-a to provide more spatial detail for the concurrent report by King and others (2025). All of these data are available in USGS (2024a).
Periodic sampling occurred at additional sites including three reservoir sites (sites 5–7) in 2021 (table 1.1), and at tributaries (sites 13–20) and seeps (sites 20–24) in 2021–22 (table 1.3). The seep sites emerged on exposed reservoir bottom on the north shore of Iola basin as the reservoir level fell below 7,460 ft.
In 2022, automated, refrigerated nutrient samplers were used to collect weekly composite samples on the three tributaries: Gunnison River site 13, Beaver Creek at Highway 50 near Gunnison, Colo. (USGS site 382943107015300; hereafter referred to as “Beaver Creek site 14”; table 1, fig. 1), and Steuben Creek near mouth near Gunnison, Colo. (USGS site 382937107033500; hereafter referred to as “Steuben Creek site 15”; table 1, fig. 1). Results for composite samples are not discussed in this report; however, a summary of methods, results, and data availability are provided in appendix 3.
Equipment preparation, sampling, and processing procedures followed USGS standard procedures as detailed in the USGS National Field Manual chapters A2, A3, A4, A5, and A10 (USGS, variously dated). Generally, three aliquots of unfiltered samples were collected at each reservoir site from a boat using a Van Dorn sampler and were transported on ice to the laboratory for processing. One aliquot was for algal taxonomy, a second for chlorophyll-a, and the third for all other analyses. For streams and seeps, grab samples were collected into polypropylene jugs and processed at the sampling site.
During each reservoir sampling event, an EXO-2 multiparameter monitor (Xylem, Inc., 2023) was used to measure in situ field water-quality measurements including water temperature, pH, specific conductance, and dissolved oxygen (DO). Depth profiles were typically made at 3.3-ft intervals between the surface and 3.3 ft above the reservoir bottom (data available in Qi and others, 2025) by manually deploying the monitor at each depth. Calibration of the monitor followed guidelines in the EXO-2 user manual (Xylem, Inc., 2023) and USGS guidelines (Wagner and others, 2006; USGS, 2023).
Samples were processed at the NPS laboratory facility at Blue Mesa and included collection of unfiltered and filtered aliquots into different bottle types and sample preservation (table 1.4). Unfiltered aliquots (hereafter referred to as “total”) were preserved for algal taxonomy, and samples for chlorophyll-a were concentrated on glass fiber filters. Unfiltered water was transferred into a churn splitter to mix and dispense unfiltered aliquots into polyethylene bottles for nutrient constituents. Additional aliquots from the churn were filtered through a 0.45-micrometer capsule filter (hereafter referred to as “dissolved”) for nutrients and major and trace elements. Stream and seep samples were processed in the field using a peristaltic pump to collect unfiltered aliquots and filtered (0.45 micrometer) aliquots for nutrients and major and trace elements. Samples collected for wastewater indicators (pharmaceuticals) were filtered through a 0.7-micrometer glass-fiber syringe filter and collected in an amber glass vial (Furlong and others, 2014).
Water-quality samples were analyzed for a mixed suite of constituents including chlorophyll-a, algal taxonomy, dissolved and total nutrients, and dissolved major and trace elements, with additions of pharmaceuticals, lithium, boron, and nitrogen isotopes in ammonia at some sites (refer to tables 1.1, 1.2, and 1.3 for a summary of constituents collected on specific dates at sites). Dissolved major and trace element results are not discussed further in this report. All analyses except algal taxonomy were completed at the USGS National Water Quality Laboratory (NWQL), in Lakewood, Colo., according to methods in table 1.4. A complete list of constituents is documented in table 1.5. All water-quality data analyzed at NWQL are published in the USGS National Water Information System (NWIS) database (USGS, 2024a) and can be downloaded from the Water Quality Portal (National Water Quality Monitoring Council, 2024) using site numbers in table 1 preceded by “USGS-” for example “USGS-382856107050000.” Algal taxonomy was analyzed at the PhycoTech laboratory in St. Joseph, Michigan (PhycoTech, Inc., 2024b), and methods and results are in Qi and others (2025).
Continuous Water-Quality Measurements
Multiparameter continuous water-quality monitors (EXO-2) were installed at 3.3-ft depth at Iola basin at site 2 (USGS site 382852107054801) and at Blue Mesa Reservoir west of Dry Gulch near Sapinero, Colo. (USGS site 382847107120401; site 25, table 1, fig. 1). The Iola basin monitor at site 2 (Iola monitor) operated from July 25 through September 28, 2022, and the Cebolla basin monitor at site 25 (Cebolla monitor) operated from September 1 through September 24, 2022. Each monitor conducted field water-quality measurements using wiped sensors that measured water temperature (degrees Celsius), specific conductance (microsiemens per centimeter at 25 °C), pH (standard units), DO (milligrams per liter), turbidity (formazin nephelometric units), and total algae in relative fluorescence units for chlorophyll-a and phycocyanin (fPC). The EXO-2 monitors were wrapped in protective sleeves, and each sensor was wrapped in copper antifouling tape. Monitor calibrations at both sites were checked before and after deployment according to USGS guidelines (Wagner and others, 2006). At the Iola monitor, a cleaning and fouling check was performed 6 weeks after deployment. The monitor recorded measurements every 15 minutes and data are published in NWIS database using USGS site numbers (table 1; USGS, 2024a).
During September 2023, two boat surveys were conducted in Iola basin using an EXO-2 monitor that was continuously deployed to obtain additional data to aid in constructing the satellite-derived chlorophyll-a maps (King and others, 2025). The EXO-2 monitor was configured and calibrated as described in the previous paragraph. The monitor data are available in Qi and others (2025), and results are briefly discussed in appendix 3.
Quality Assurance
Quality-control samples for nutrients, chlorophyll-a, and major and selected trace elements included 14 field blanks and 18 sequential replicates collected during the study period (USGS, 2024a). Field blanks were used to evaluate the potential for sample contamination from sample collection, processing, and analysis, and replicate samples were used to evaluate sampling and analytical variability (Mueller and others, 2015). For the main constituents discussed in this report (ammonia, nitrate plus nitrite, organic nitrogen plus ammonia, orthophosphate, total phosphorus, and chlorophyll-a), detections in field blanks were no more than two times the laboratory reporting limits except for one detection of total phosphorus and two detections of chlorophyll-a (table 2.1). However, concentrations in the associated environmental samples (USGS, 2024a) were well above (more than five times) the amount detected in the blanks, indicating that the analytical results for the environmental samples are not affected by contamination. Detections of total nitrogen occurred in 4 of the 8 blanks indicating possible contamination. Therefore, the measured values in 2022 were not used in this report and instead total nitrogen for reservoir samples was computed as the sum of nitrite plus nitrate and organic nitrogen plus ammonia from unfiltered samples.
For the replicate samples, relative percent difference (RPD) was computed for each replicate pair as the absolute difference between replicate analyses divided by the average of the analyses and expressed as percent (table 2.2) (Mueller and others, 2015). The RPD was not computed if the pair included censored values. Most of the RPD values were less than 10 percent, indicating analytical results were reproducible for the constituents of interest. Values of RPD were most often above 10 percent for nutrient species (for example, total phosphorus and orthophosphate). Nutrient concentrations tended to be closer to the reporting levels, and their concentrations may have a higher degree of variability and uncertainty compared to other constituents (Mueller and others, 2015).
For the 2022 analytical results produced by the NWQL, a large percentage of nutrient analyses were flagged by the NWQL for hold-time exceedance owing to delays in analysis at the laboratory (Struzeski, 2025). Of the constituents discussed in this report, dissolved nitrate plus nitrite and total phosphorous concentrations were most affected by this laboratory issue. A recent hold-time study conducted by the NWQL determined that total phosphorus was stable for as many as 180 days and dissolved nitrite plus nitrate was stable for as many as 60 days (Struzeski, 2025). Because holding times were only greater than 60 days for 5 out of 233 analyses, hold-time exceedances likely had a minimal effect on the data interpretations presented in this report.
Algal taxonomy samples were analyzed using Imaging FlowCytobot (IFCB), which is a somewhat new semi-automated procedure (PhycoTech, Inc., 2024a). Seven sequential field replicates were collected and analyzed by IFCB, and results are summarized in table 2.3. The replicate pairs compared fairly well (median RPD of 23 percent) for taxa with high cell counts (above 1,000 cells per milliliter), but comparisons were poor for taxa with low cell counts. Although the variability for replicates was less than ideal, this report focuses on algal blooms when cell counts are high, and the IFCB reliably detected dominant taxa in replicate samples. A subset of algal taxonomy samples also was analyzed using traditional microscopy wherein phytoplankton are identified and counted manually using optically clear slide mounts to compare with IFCB counts, and results are presented in appendix 3.
Geological and Geochemical Data Compilation
The geology and available rock geochemical data in the watershed were compiled from published data to help understand the potential input of natural geogenic sources of lithium and phosphorus to surface water. A simplified geologic map (fig. 4) was generated by combining geologic units into major geologic time units and rock types using the spatial data model developed by Day and others (1999). Geochemical data were extracted from the USGS National Geochemical Database (USGS, 2024b) for rock samples collected within the Blue Mesa watershed (locations in fig. 4). The geochemical data were assigned a “best value” for the various types of analyses for a given element using the procedure outlined by Granitto and others (2024). To estimate the lithium and phosphorus concentrations for the dominant rock types, a geospatial analysis was completed using ArcGISPro 3.3.2 (Esri Inc., 2024) applied to the simplified geologic map units in figure 4. Using the polygons from the digital geologic map, the geochemical data were averaged for each mapped rock type and the percentage of each rock type in the Blue Mesa watershed was computed.
Long-Term Datasets and Trend Analysis
An assessment of long-term changes (trends) in reservoir hydrology and air temperature (1970–2023), streamflow (1980–2023), and selected water-quality constituents (2001–23) was conducted to help understand potential causes for cyanoHABs beyond the 3-year study period. Data types, sources, and timeframes for these datasets are summarized in table 2.
Table 2.
Long-term hydrologic and water-quality datasets used in this study, Blue Mesa Reservoir, Colorado.[--, not applicable; USGS, U.S. Geological Survey; NPS, National Park Service; PRISM, Parameter-elevation Regressions on Independent Slopes Model; Reclamation, Bureau of Reclamation; all water-quality data including data in USGS National Water Information System database were retrieved from the Water Quality Portal (National Water Quality Monitoring Council, 2024); to retrieve data from the Water Quality Portal precede site number by ‘USGS-‘ for USGS data and ‘11NPSWRD_WQX-CURE_’ for NPS data]
| Location | Data type | Frequency | Time period | Agency | Site number | Source |
|---|---|---|---|---|---|---|
| Blue Mesa Reservoir | Reservoir hydrology | Daily | 1970–2023 | Reclamation | -- | Bureau of Reclamation (2024) |
| Blue Mesa Reservoir | Air temperature | Monthly | 1970–2023 | Oregon State University | -- | PRISM Climate Group (2024) |
| Gunnison River | Streamflow | Daily | 2018–23 | USGS | 383103106594200 | USGS (2024a) |
| Gunnison River, Tomichi Creek | Streamflow | Daily | 1980–2023 | USGS | 09119000, 09114500 | USGS (2024a) |
| Gunnison River | Water quality | 5 to 8 samples per year | 1980–2023 | USGS | 383103106594200 | USGS (2024a) |
| Beaver Creek, Steuben Creek | Water quality | 4 to 7 samples per year | 2001–23 | NPS | 382943107015300, 382937107033500 | National Water Quality Monitoring Council (2024) |
| Blue Mesa Reservoir sites (Iola, Cebolla, Sapinero) |
Water quality | Monthly from June to September | 2001–23 | NPS | 382856107050000, 382829107122200, 382831107172600 | National Water Quality Monitoring Council (2024) |
| Blue Mesa Reservoir sites (Iola, Cebolla, Sapinero) |
Water quality | Bimonthy to monthly from May to October | 2021–22 | USGS | 382856107050000, 382852107054801, 382829107122200, 382831107172600 | USGS (2024a) |
Hydrology and Air Temperature
Hydrologic data for Blue Mesa were retrieved from the Reclamation website (Bureau of Reclamation, 2024) to characterize trends in select metrics from water years (WYs) 1970 through 2023 (a water year is defined as a 12-month period beginning October 1 and ending September 30 of the following year and is designated as the year in which it ends). Hydrologic data included daily reservoir level (in feet), storage volume (in acre-feet), total volume released (in acre-feet per day), and residence time (in days). Residence time is calculated as storage volume divided by total volume released. Mean, minimum, and maximum air temperature data for 1970–2023 were retrieved from the PRISM database (PRISM Climate Group, 2024), for three 2.5-mile grids, one centered across each of the three reservoir basins in Blue Mesa.
Trends in streamflow were analyzed for the Gunnison River site 13 from WY 1980 to 2023. This site only had streamflow data from 2018 to 2023; therefore, a record of daily streamflow was estimated by adding together daily streamflow records from the two upstream contributing streams: Gunnison River near Gunnison, Colo. (USGS site 09114500) and Tomichi Creek at Gunnison, Colo. (USGS site 09119000) (fig. 1; table 2; USGS, 2024a). For the 6 years with streamflow at all three streamgages, the sum of Gunnison River near Gunnison and Tomichi Creek at Gunnison was within 5 percent of the measured streamflow at Gunnison River site 13, indicating this was a reasonable approach for estimating the long-term daily streamflow record for the Gunnison River site 13.
Water-Quality Data
Trends were assessed in water temperature, Secchi disk depth, chlorophyll-a, total phosphorus concentrations, and select trophic state indices in the Iola, Cebolla, and Sapinero basins (sites 1–4), during the growing season (June–September) from WY 2001 to 2023. Trophic state indices based on Secchi disk (TSI–SD), chlorophyll-a (TSI–CHLa), and total phosphorus (TSI–TP) measurements were calculated using the following formulas from Carlson (1977):
whereSD
is Secchi disk depth, in feet;
CHLa
is chlorophyll-a concentration, in micrograms per liter; and
TP
is total phosphorus concentration, in micrograms per liter.
Trophic state index transforms chlorophyll-a, Secchi disk depth, and total phosphorus measurements to a common scale ranging from 0 to 100, with higher TSI values indicating greater productivity.
Trends also were analyzed for 2001–23 for dissolved concentrations and loads of nitrite plus nitrate, total nitrogen, organic nitrogen plus ammonia, and total phosphorus at the Gunnison River site 13. Loads were computed by multiplying the concentration in milligrams per liter by the daily streamflow in cubic feet per second times a conversion factor of 5.39 to obtain loads in pounds per day. Trends in dissolved concentrations of nitrite plus nitrate and total phosphorus were analyzed at Beaver Creek site 14 and Steuben Creek site 15. The water-quality data analyzed included samples collected by USGS and NPS (table 2). The NPS utilized USGS collection and processing techniques, and samples were analyzed at the NWQL (Weissinger and Gibney, 2019). The consistency of data collection and analytical techniques justified merging USGS data with data collected by NPS.
Statistical Methods
Trends in hydrologic and air temperature data were computed using the nonparametric Mann-Kendall trend test (Helsel and others, 2020) using the “trend” R package (R Core Team, 2021; Pohlert, 2023). Trend slopes were calculated using the Sens slope estimate (Sen, 1968) and represent the median change per year. The statistical strength of the trends was assessed using the Mann-Kendall trend test (Helsel and others, 2020), and 90-percent confidence intervals were used to determine significance. These nonparametric statistical methods were chosen because the methods require no assumptions of sample distribution, trend shape, or data continuity when measuring the strength of trends. Trends were calculated for growing season means for select reservoir hydrologic data and air temperature, and for annual (WY) means for streamflow. Growing season includes the months of June to September when most water-quality sampling occurred in the reservoir and when cyanoHABs were most active.
Trends in water-quality constituents were analyzed using the nonparametric seasonal Kendall test with the “restrend” R package (Lorenz, 2014; R Core Team, 2021). Trends were computed for 2001–23 using four seasonal periods per year (June, July, August, and September) at the reservoir sites and Beaver Creek site 14 and Steuben Creek site 15, and six seasonal periods (January–February, March–April, May–June, July–August, September–October, and November–December) for the Gunnison River site 13. The magnitude of the trend slope was determined using the Theil-Sen slope estimator (Helsel and others, 2020). Trends were not computed for constituents with greater than 40 percent of the results below the laboratory reporting limit. Trends were considered strongly statistically significant for a probability value (p-value) less than or equal to 0.05 and weakly significant for a p-value greater than 0.05 and less than or equal to 0.10.
Environmental Characterization of the Blue Mesa Reservoir System
This section investigates the environmental conditions of the reservoir system that can affect algal bloom formation including limnology (physical, chemical, and biological characteristics of the reservoir), long-term trends in physical and climatic variables and trophic status of Blue Mesa, and input of nutrients into the reservoir from tributaries. This section starts by examining more recent limnological data concurrent with occurrence of algal blooms during 2016–23. Next, historical datasets (1970–2023) are investigated to evaluate long-term conditions that might affect algal blooms. Following is a discussion on sources and trends in nutrient inputs from tributaries to the reservoir. Finally, the section concludes with examination of relation between harmful algal blooms and limnologic conditions.
Harmful Algal Blooms and Limnological Conditions, 2016–23
This section examines more recent (2016–23) conditions in the reservoir including reservoir level, algal toxins and taxonomy, depth profiles of limnological properties, and continuous and discrete water-quality data. Analysis of these different data types permits descriptions of when algal blooms occurred and water-quality conditions before, during, and after the blooms, moving towards a goal of identifying the possible drivers of cyanoHABs in Blue Mesa.
Reservoir Water-Level Elevation
Reservoir levels in Blue Mesa generally increase during spring and early summer in response to snowmelt runoff from the surrounding mountains, peak in June or July, and then decline through the late summer and fall months (fig. 5). In addition to the timing and amount of snowmelt runoff, reservoir operations also affect reservoir level, particularly during the summer (Bureau of Reclamation, 2012). Snowpack, represented by snow-water equivalent (table 3; Natural Resources Conservation Service, 2024) was above average in 2019 and 2023, and the resulting snowmelt runoff (“Annual inflow” in table 3; Natural Resources Conservation Service, 2024) supported high reservoir levels during the summer growing seasons in 2019 and 2023 (fig. 5). In contrast, reservoir levels during 2018, 2021, and 2022 were below the 30-year growing season mean of 7,492.8 ft (fig. 5). The April 1 snow-water equivalent for the upper Gunnison River watershed (table 3) indicates below mean snowpack occurred in 2018 (66 percent), 2021 (88 percent), and 2022 (95 percent), with 2022 being close to mean (Natural Resources Conservation Service, 2024). Gunnison County was in drought conditions for those 3 years (National Oceanic and Atmospheric Administration, 2024). Summer reservoir levels were low in 2018, 2021, and 2022 (fig. 5) in part because of lower snowpack and drought conditions, but also because reservoir outflows exceeded inflows in those 3 years (table 3). This result reflects reservoir operations because additional releases from Blue Mesa were necessary during late summer to provide water for downstream uses as well as “calls on the river” for Lake Powell, which began in 2021 (Bureau of Reclamation, 2021).
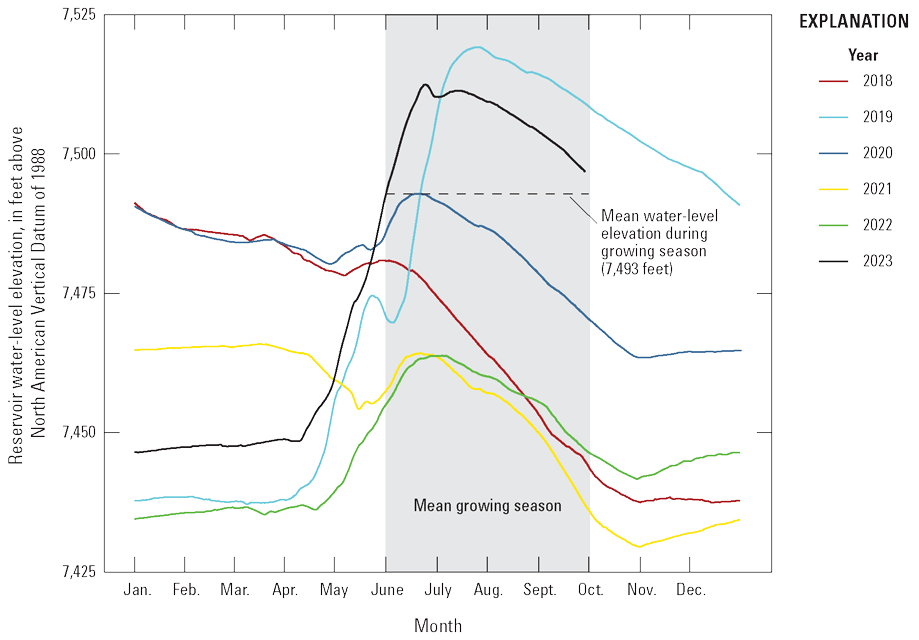
Variations in reservoir water-level elevations of Blue Mesa Reservoir, Colorado, during 2018–23 (data from Bureau of Reclamation, 2024).
Table 3.
Annual hydrologic inputs and outputs during 2018–23 to Blue Mesa Reservoir, Colorado.[Snowpack data from Natural Resources Conservation Service (2024); reservoir hydrologic data from Bureau of Reclamation (2024); SWE, snow-water equivalent for upper Gunnison River watershed; ft3/s, cubic foot per second]
Algal Toxins
Algal toxin data were collected by the NPS during 2018–23 at shore locations in Blue Mesa that were easily accessible to the public. These data are presented to identify the years and time periods during which toxic cyanoHABs occurred in Blue Mesa (Qi and others, 2025). Microcystin was the dominant toxin in Blue Mesa and was detected in 2018 through 2023 (fig. 6) with a single detection of anatoxin-a in 2022. Most of the 91 microcystin detections were in Iola basin, although there were 11 detections in Cebolla basin, including 4 that exceeded the concentration of 8 µg/L in 2022 mainly at a site on the far east end of the basin. Microcystin concentrations in Iola and Cebolla basins occurred at concentrations of greater than 8 µg/L in 2018 and 2020–22, and at concentrations up to 8 µg/L in 2019 and 2023. The warning concentration of 8 µg/L for microcystin is the threshold concentration to protect human health and can be used as the basis for recreational contact (table 4; EPA, 2024a). The caution concentration is a lower-level recreation threshold and occurs from detection up to 8 µg/L for microcystin (EPA, 2024a). The duration of toxin detections above the warning concentration varied among years but typically started in early to mid-September and continued through the fall months, ending on September 26 in 2018, October 11 in 2020, September 14 in 2021, and November 1 in 2022 (fig. 6).
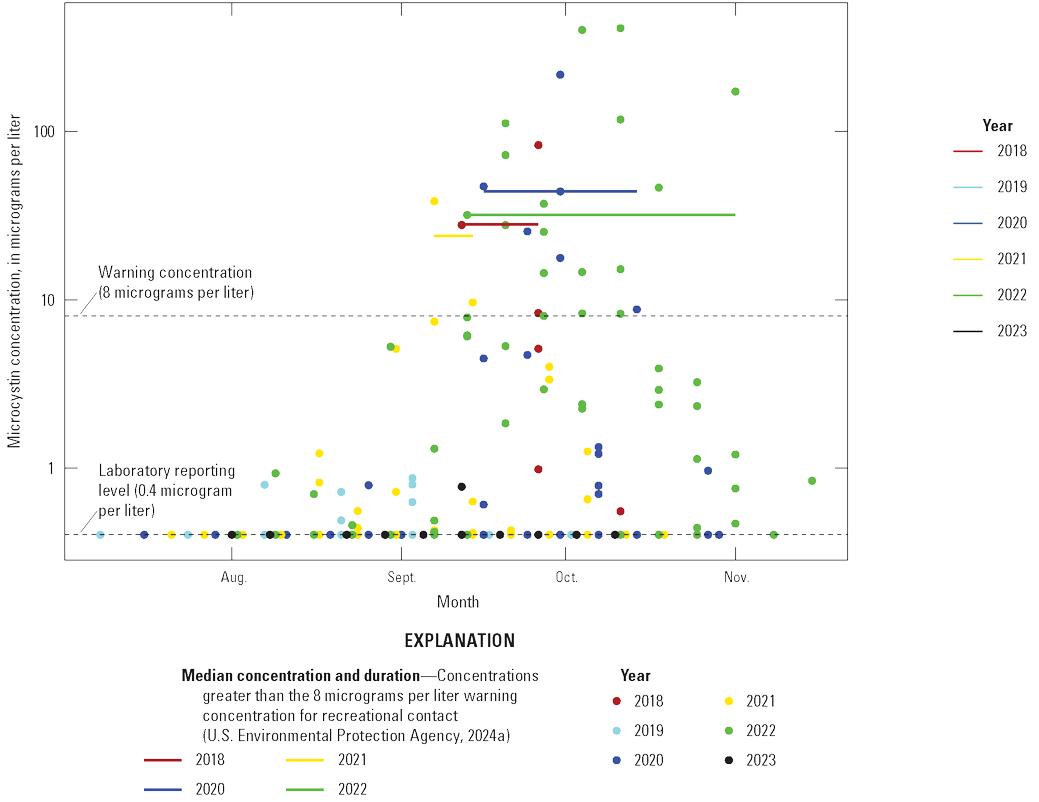
Algal toxin concentrations in shore samples collected from Blue Mesa Reservoir during 2018–23. Data available in Qi and others (2025).
Table 4.
Colorado Department of Public Health and Environment (CDPHE) interim water-quality standards for chlorophyll-a, total nitrogen, and total phosphorus concentrations for lakes and streams (CDPHE, 2024a) and U.S. Environmental Protection Agency (EPA) recreational contact criteria for microcystin concentration (EPA, 2024a).[CDPHE, Colorado Department of Public Health and Environment; µg/L, microgram per liter; EPA, U.S. Environmental Protection Agency; --, not applicable]
Summer (July 1–September 30) seasonal average concentration from the mixed layer of lakes, allowable exceedance frequency 1 in 5 years.
If used as a swimming advisory, these values should not be exceeded on any single day. If used as a water-quality criterion for assessment and listing purposes, the EPA recommends a maximum of three excursions across a recreational season and observation of that pattern across multiple years. An excursion from the recreational criterion is when toxin concentrations exceed the criterion during a 10-day assessment period (EPA, 2019).
Algal Taxonomy
Phytoplankton abundance and community composition varied by time, basin, and depth (fig. 7). Phytoplankton abundance based on biovolume (cells per milliliter) was greatest in Iola basin and generally peaked in mid- to late summer (fig. 7). Cyanobacteria were the dominant taxa in Iola basin with Aphanizomenon being the most abundant although some early and late-season samples had greater proportions of Gloeotrichia, Microcystis, and Woronichinia (fig. 7). This result is generally consistent with results from Bauch and Malick (2003) that identified Aphanizomenon in samples composited across the 0–16-ft depth interval in August, October, and November 1999 in Iola basin, indicating that cyanobacteria have existed in Iola basin for many decades. Phytoplankton abundance was smaller in Cebolla and Sapinero basins compared to Iola basin (fig. 7), and the community composition in Cebolla and Sapinero basin was different, being mostly dominated by nontoxin-producing cyanobacteria, although toxin-producing cyanobacteria were dominant in some near-surface samples (surface and 3.3 ft) collected in late summer. Aphanizomenon generally was the most abundant toxin-producing cyanobacteria in Cebolla and Sapinero basins, followed by Dolichospermum and Woronichinia. Middle and deep samples mostly contained nontoxin-producing cyanobacteria taxa such as Aphanocapsa-Aphanothece and Merismopedia (Qi and others, 2025).
Some cyanobacteria, including Aphanizomenon, possess certain traits that allow them to dominate phytoplankton assemblages, which may partly explain the dominance of Aphanizomenon in Iola basin (Patiño and others, 2023). Along with Dolichospermum, Microcystis, and others, Aphanizomenon species regulate buoyancy allowing them to remain near the surface of the water where light is abundant and they dominate the phytoplankton assemblage (Walsby, 1994; Jöhnk and others, 2008; Paerl and Huisman, 2008; Yang and others, 2016). Furthermore, Aphanizomenon and Dolichospermum can fix nitrogen from the atmosphere, which allows them to thrive even in water bodies with low levels of inorganic nitrogen provided there is sufficient phosphorus (Chorus and Welker, 2021b).
Of the cyanobacteria taxa detected in Blue Mesa, Aphanizomenon, Dolichospermum, Gloeotrichia, Microcystis, and Woronichinia, are potentially capable of producing the toxin microcystin (Carey and others, 2012; Bernard and others, 2016). Aphanizomenon and Dolichospermum also can potentially produce anatoxin-a (Bernard and others, 2016), which was only detected once in Blue Mesa in 2022. Because Aphanizomenon is the dominant taxa in Blue Mesa, it is likely the main source of algal toxins detected in the reservoir.
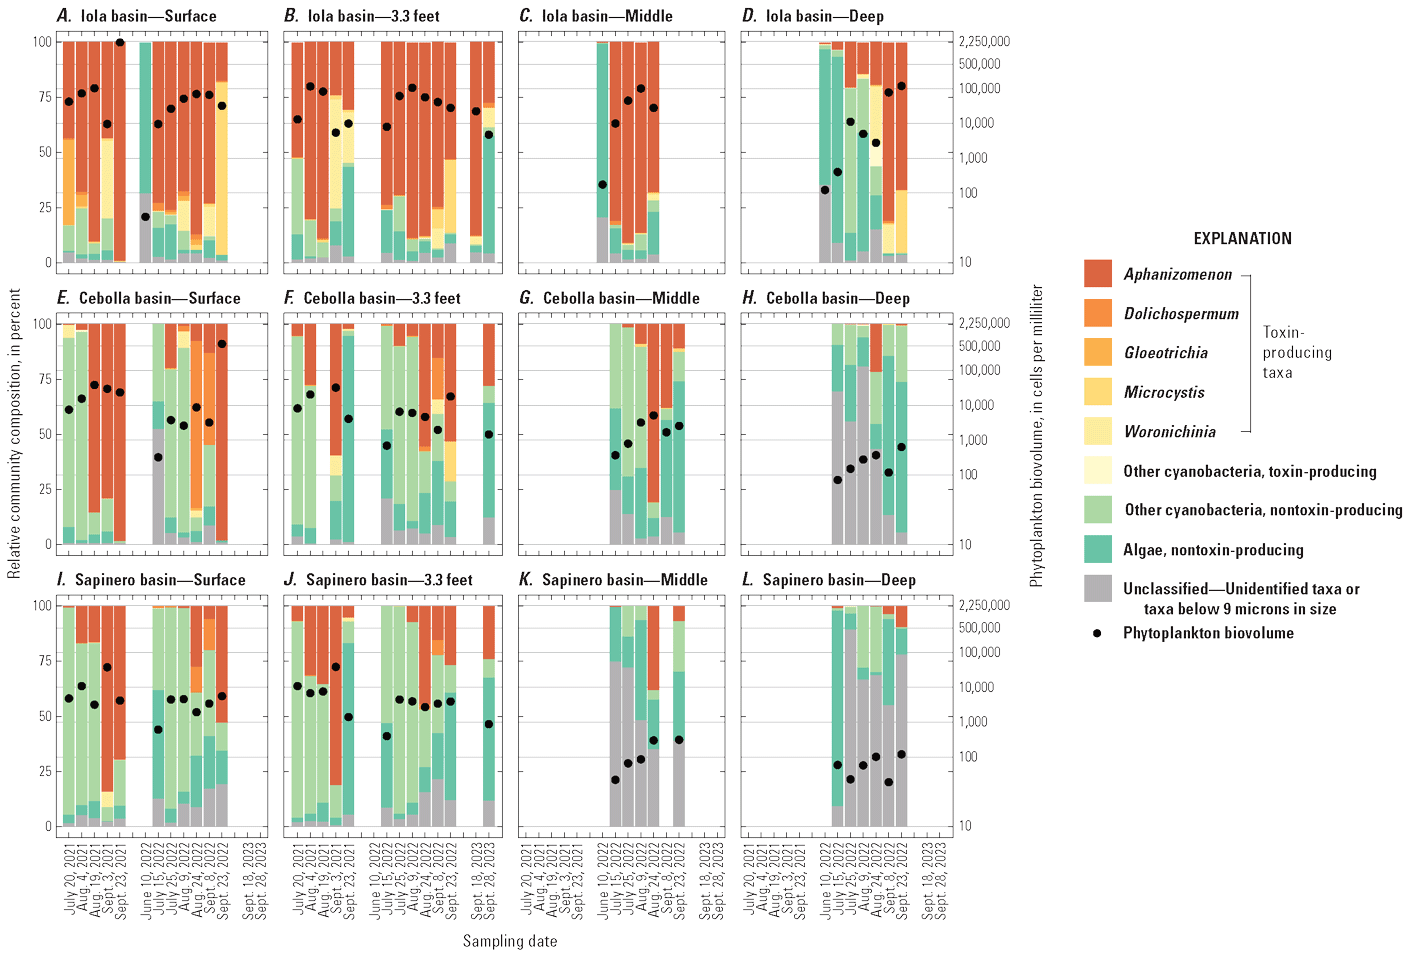
Phytoplankton community composition in percent biovolume and phytoplankton biovolume in cells per milliliter in A–D, Iola basin at surface, 3.3-foot, middle, and deep depths (U.S. Geological Survey [USGS] site 38285610705000 in 2021 and 2023, and USGS site 382852107054801 in 2022); E–H, Cebolla basin at surface, 3.3-foot, middle, and deep depths (USGS site 382829107122200); and I–L, Sapinero basin at surface, 3.3-foot, middle, and deep depths (USGS site 382831107172600), Blue Mesa Reservoir, Colorado, 2021–23. Site information in table 1 and USGS (2024a), and taxonomy data in Qi and others (2025).
Depth Profiles of the Reservoir
Depth profiles of discrete field water-quality measurements including water temperature, DO, and pH illustrate degree of stratification of Blue Mesa during the growing season and show distinct differences among the basins (note that in 2022, the Iola basin site was moved about 1 mile to the west from site 1 to site 2 [fig. 1] to a deeper part of the reservoir). Profiles generally show temperature maxima at the surface and decreasing temperature with depth (fig. 8A). Iola basin was the warmest at all depths, and Cebolla and Sapinero basins were the coolest. Because of its shallow depth, Iola basin showed minimal mid-summer temperature stratification, whereas Sapinero basin was strongly stratified by mid-summer, with temperature gradients of nearly 20 °C. Cebolla basin was also stratified, but the temperature gradients were not as steep or well defined as in Sapinero basin. Across all basins, water temperatures increased following spring runoff, peaked between mid-July and early August (fig. 8A), and declined during late summer and fall. Surface water temperatures in the reservoir in 2021 and 2022 were higher compared to other years, especially at Iola basin (site 1, 2021; site 2, 2022) where temperature at 3.3-foot depth reached 22.8 °C on July 15, 2021 (fig. 9A).
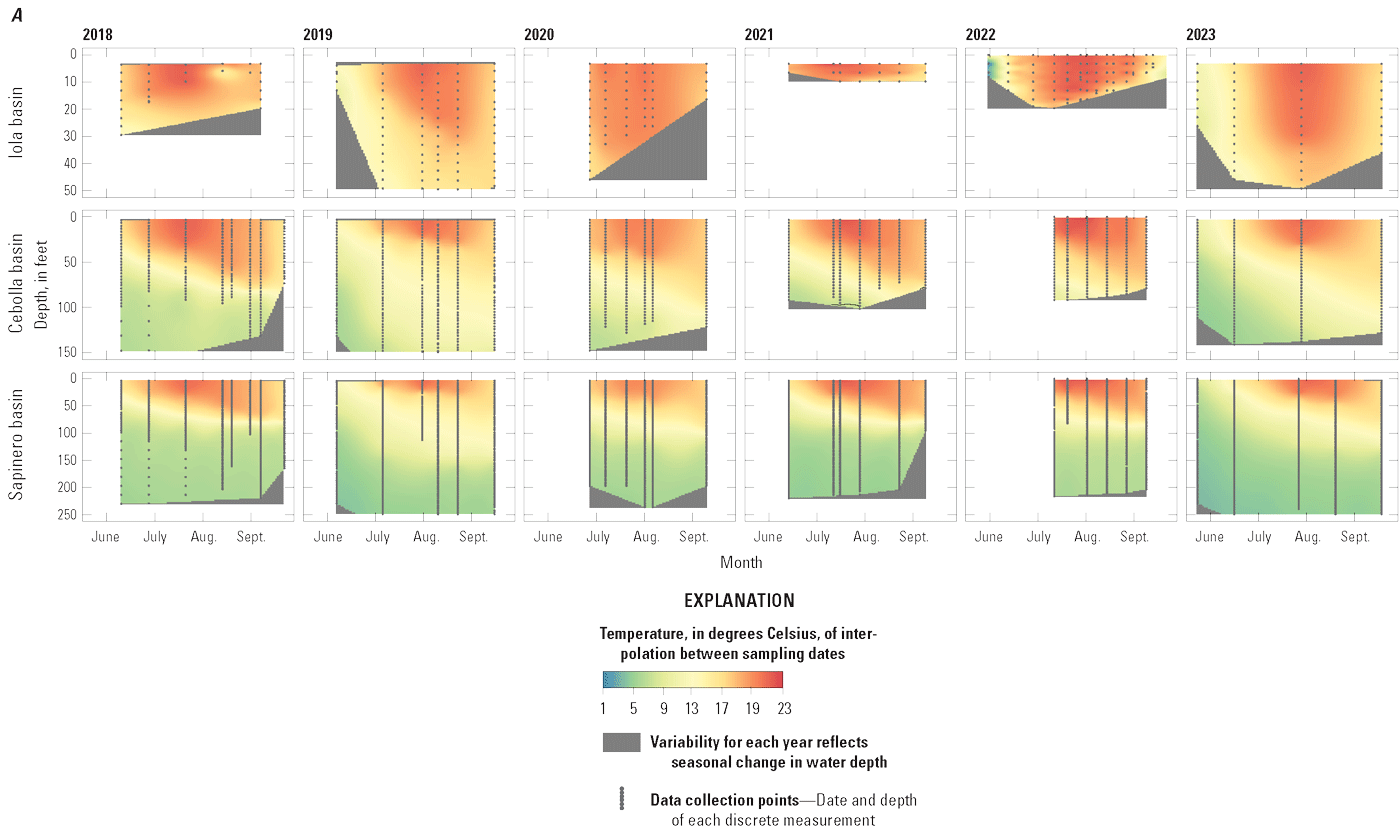
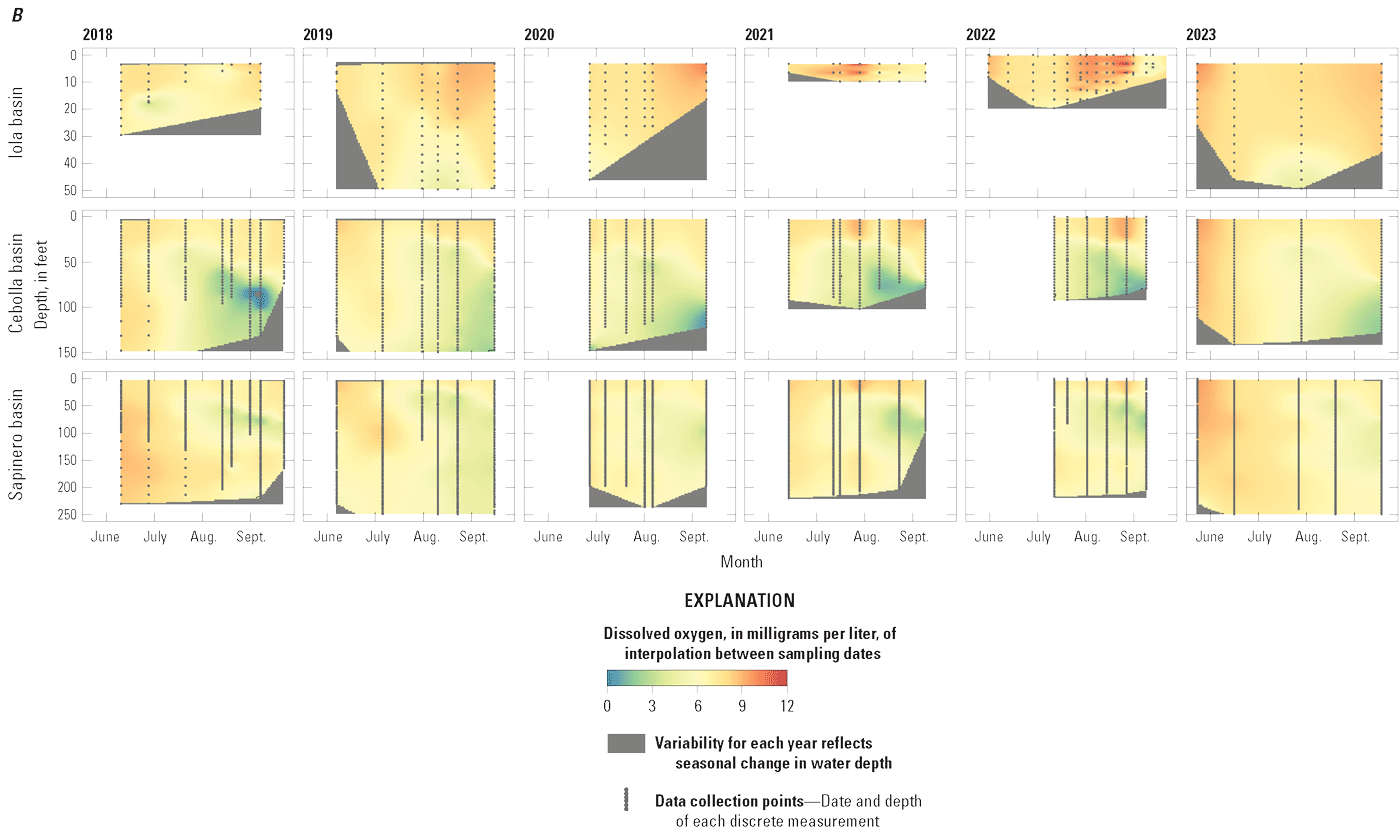
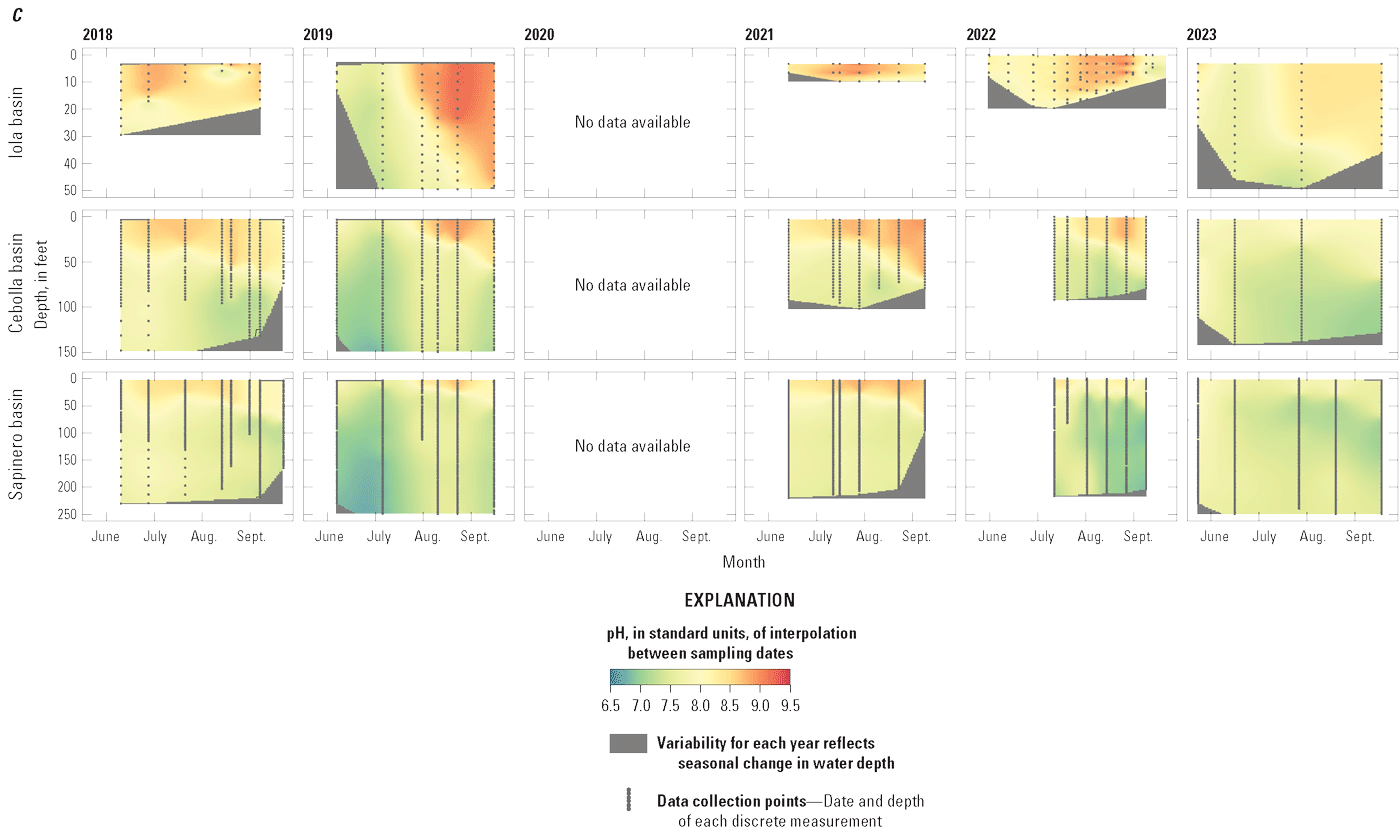
Depth profiles of field water-quality measurements in Iola (U.S. Geological Survey [USGS] site 38285610705000 in 2018–21 and 2023, and USGS site 382852107054801 in 2022), Cebolla (USGS site 382829107122200), and Sapinero (USGS site 382831107172600) basins in Blue Mesa Reservoir, Colorado, 2018–23. A, Water temperature. B, Dissolved oxygen. C, pH. Data available in Qi and others (2025).
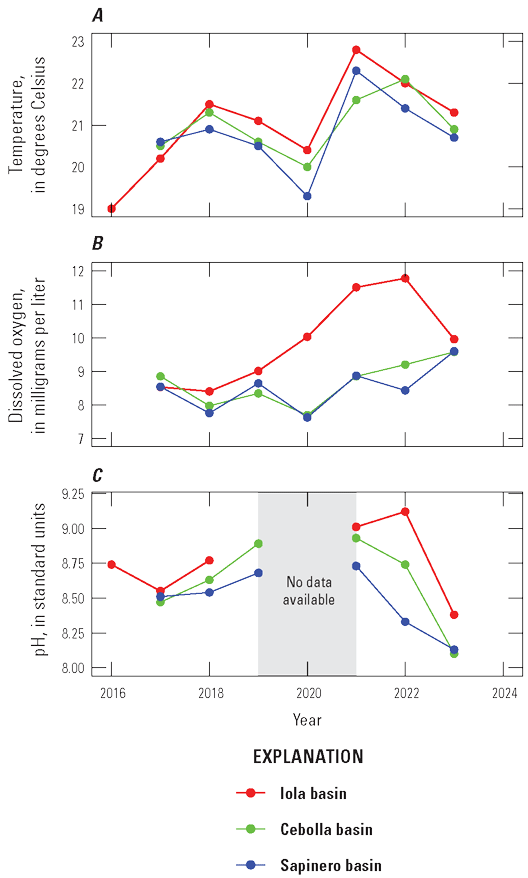
Graphs showing maximum values for field water-quality measurements at 3.3-foot depth in Blue Mesa Reservoir, Colorado, 2016–23 in Iola (U.S. Geological Survey [USGS] site 38285610705000 in 2016–21 and 2023, and USGS site 382852107054801 in 2022), Cebolla (USGS site 382829107122200), and Sapinero (USGS site 382831107172600) basins. A, Water temperature. B, Dissolved oxygen. C, pH. Data available in Qi and others (2025).
Dissolved oxygen profiles (fig. 8B) display several characteristics typical of productive (biologically active) water bodies. The DO patterns in Cebolla and Sapinero basins parallel the stratification observed in the water temperature profiles. At the start of each season, DO showed minimal variation with depth. As the seasons progressed, DO decreased with depth in Iola basin, and Cebolla and Sapinero basins developed a metalimnion (middle layer of a thermally stratified water column) DO minima, particularly in 2018. Cebolla and Sapinero basins, and to a lesser extent Iola basin, also had some oxygen depletion near the sediment water interface at the reservoir bottom. Microbial degradation of organic matter consumes oxygen and likely causes the DO minima in the metalimnion and hypolimnion (below the thermocline) (Marcé and others, 2024). Metalimnion oxygen minima dropped below the hypoxic threshold of 2 mg/L on at least one date in Cebolla basin every year (fig. 8B). Maximum DO occurred near the water surface in all basins, with the highest DO recorded in Iola basin in 2022 (DO greater than 11.5 mg/L in 2021 and 2022; fig. 9B). The elevated DO values in Iola basin indicate the water column was supersaturated with respect to oxygen. For example, at Iola basin (site 2) on September 8, 2022, DO values at the surface, 3.3-ft, and 9.8-ft depths were greater than 11 mg/L with saturation greater than 120 percent. These elevated, supersaturated DO values result from abundant algae and photosynthesis (Ignjatovic, 1968; Marcé and others, 2024). Photosynthesis (eq. 4) uses carbon dioxide (CO2) plus water to create chemical energy from light energy and produces oxygen (O2):
whereDuring photosynthesis (Marcé and others, 2024), the loss of CO2 from the water column increases pH while the production of O2 increases DO faster than it can equilibrate with the overlying atmosphere. Maximum DO values at 3.3-ft depth in Iola basin were generally greater than those in Cebolla and Sapinero basins, particularly from 2019 to 2022 (fig. 9B), and indicate the dominance of photosynthesis in Iola basin relative to Cebolla and Sapinero basins.
The pH in all three basins in Blue Mesa was generally greatest at the surface, decreasing with depth except for the last measurement period in Iola basin in 2019 when pH was almost constant with depth (fig. 8C). Near the surface, pH generally increased during the season, peaking usually after July to values as great about 9.5 in Iola basins in late August and early September 2019 (fig. 8C). In 2018, Iola basin had a different pattern with pH near the surface, peaking early in the season, decreasing, and then increasing toward the end of the season. Iola basin consistently had the greatest pH values each year (figs. 8C and 9C). The pattern of elevated pH at the surface with decreasing pH at depth in all three basins in Blue Mesa is typical of productive reservoirs where the increased pH at the surface is caused by photosynthesis that removes CO2, a weak acid, thus increasing pH. With depth, organic degradation and respiration produce CO2 and decrease pH (eq. 4) (Ibelings and others, 2021; Cole and Prairie, 2024; Marcé and others, 2024). The highest pH values in Iola basin are evidence that photosynthesis was more active in that basin than in Cebolla and Sapinero basins. Some cyanobacteria outcompete other algae at elevated pH levels because they are more effective at maintaining photosynthesis at elevated pH when other algae may become carbon-limited or otherwise stressed owing to the elevated pH (Glibert and Burkholder, 2018). Thus, it may be possible that the elevated pH during blooms in Blue Mesa and particularly in Iola basins is potentially exacerbating the dominance of HAB species.
In summary, water-quality depth profiles collected from 2018 to 2023 indicated that Iola basin behaved differently than Cebolla and Sapinero basins. Iola basin was shallower and sometimes weakly stratified, whereas the deeper Cebolla and Sapinero basins became stratified during summer with Sapinero basin generally exhibiting stronger and steeper metalimnion water temperature and DO gradients than Cebolla basin. Iola basin had greater maximum temperatures, pH, and DO concentrations near the surface than Cebolla and Sapinero basins, with the elevated pH and DO indicating enhanced photosynthesis in Iola basin.
Continuous Water-Quality Measurements
The continuous water-quality monitor data collected during July–September 2022 in Iola and Cebolla basins (fig. 1) were examined to help understand and potentially estimate the timing of algal blooms. One of the most evident patterns was diurnal fluctuations in DO and pH (fig. 10), where DO and pH reach maximum levels during daytime and minimum levels at night, indicative of active photosynthesis by algae and cyanobacteria at the Iola monitor. Photosynthesis (eq. 4) uses CO2 to create chemical energy from light energy and produce oxygen. During photosynthesis, the loss of CO2 from the water column increases pH via the carbonic acid buffer while the production of O2 increases DO. At night, photosynthesis ceases, and cellular respiration dominates, which consumes oxygen and produces CO2, decreasing the DO and pH of the water column (Marcé and others, 2024).
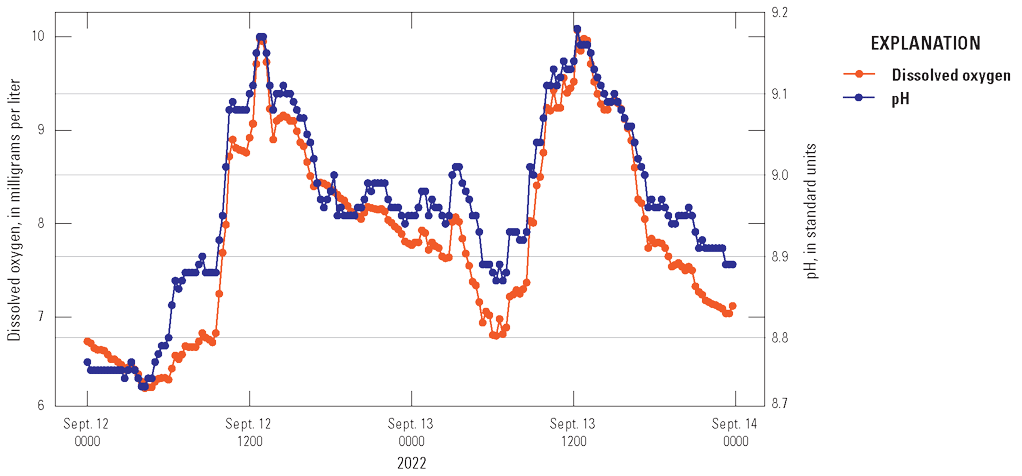
Graph showing diurnal patterns of dissolved oxygen and pH resulting from photosynthesis and cellular respiration from the water-quality monitor at 3.3 feet below the water surface in Iola basin (U.S. Geological Survey site 382852107054801) during September 12–14, 2022. Data from U.S. Geological Survey (2024a).
The continuous water-quality monitor data also were examined graphically for patterns that might help predict the timing of cyanoHABs. In Iola basin, discrete dissolved oxygen data and continuous monitor data were collected at the same Iola site (site 2). In Cebolla basin, discrete dissolved oxygen data were collected at site 3 and the continuous monitor was at site 25 (fig. 1). At the Iola monitor, the fPC signal was stronger than at the Cebolla monitor (fig. 11), which was parallel to the greater abundance of cyanobacteria in Iola basin (fig. 7). In addition, the fPC at the Iola monitor reached its maximum peak on August 28, 2022, about 2 weeks before toxin samples started to exceed the warning concentration for microcystin (September 14, 2022). Values of DO (fig. 11) and pH (fig. 8C) also peaked approximately 2 weeks prior to the detection of toxins greater than the warning concentration. The observed patterns in continuously monitored fPC, DO, and pH have potential to be used as an early warning monitoring strategy for future response to toxic cyanoHABs. Stackpoole and others (2024) also examined the utility of continuous chlorophyll measurements in freshwater as an early warning indicator of harmful algal blooms. More data collection of this type, along with collocated algal taxonomy and toxin sample collection, could help clarify whether continuous water-quality measurements could be used as an early indication of toxic cyanoHABs.
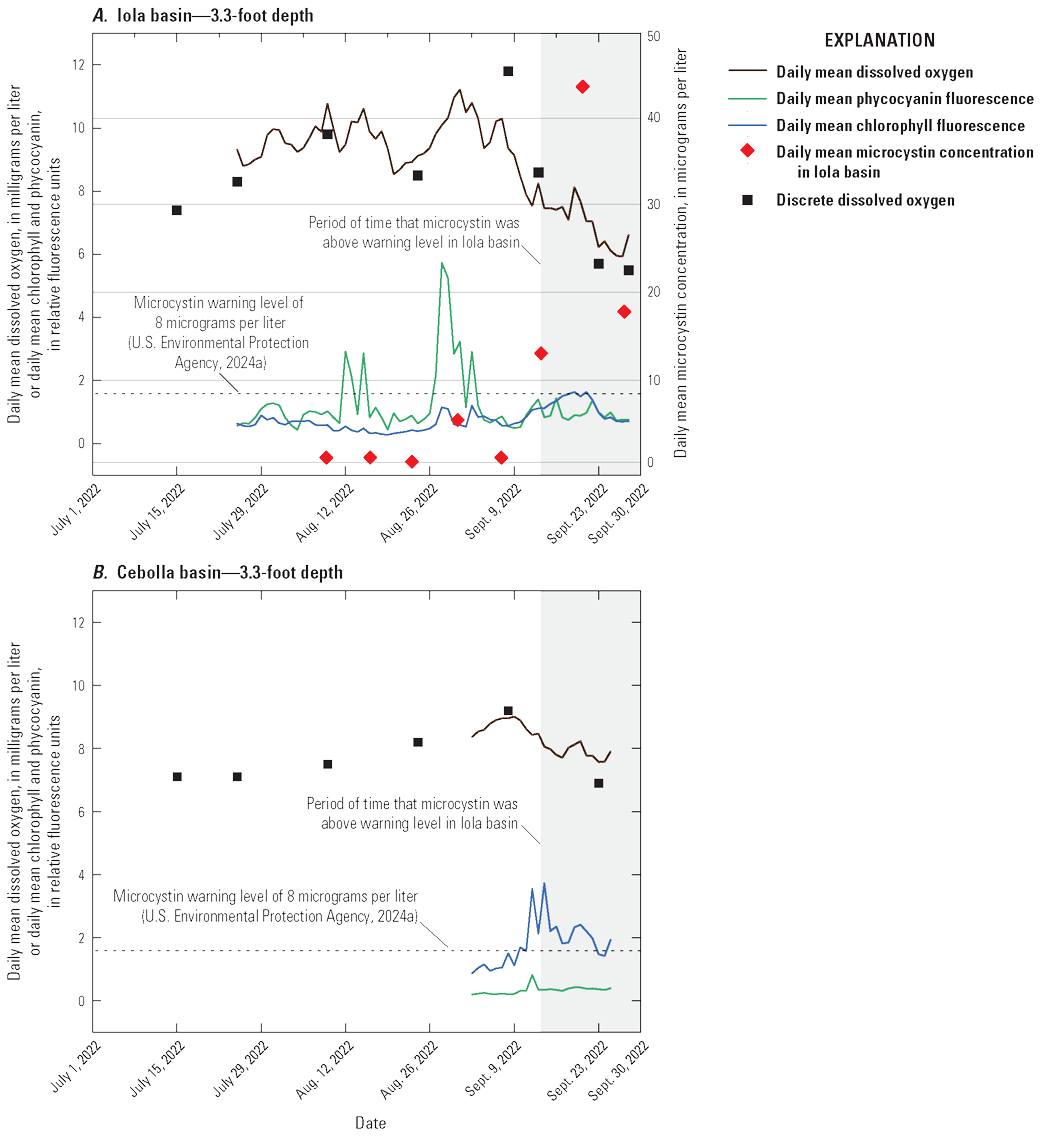
Graphs showing daily mean dissolved oxygen concentrations, and phycocyanin and chlorophyll-a fluorescence from the continuous water-quality monitor at 3.3-foot depth, discrete dissolved oxygen concentrations for 3.3-foot depth, and mean microcystin toxin concentrations calculated from multiple shore locations for each sampling date from July to September 2022. A, Blue Mesa Reservoir in Iola Basin near Gunnison, Colo. (U.S. Geological Survey [USGS] site 382852107054801). B, Blue Mesa Reservoir west of Dry Gulch near Sapinero, Colo. (USGS site 382847107120401). Continuous monitor and discrete data from U.S. Geological Survey (2024a) and microcystin and some discrete dissolved oxygen data from Qi and others (2025).
Spatial and Temporal Variability
Selected constituents from discrete samples collected at 3.3-ft depth are displayed graphically and discussed to potentially identify factors that may drive cyanoHABs and the release of algal toxins. These constituents are compared to water-quality standard concentrations and across reservoir basins and years to explore how conditions change from late spring into fall. Data presented include water temperature, chlorophyll-a concentrations, three trophic state indices (TSI–CHLa, TSI–SD, TSI–TP), and nutrient concentrations. The discussion incorporates variations in trophic status in each basin (Iola, Cebolla, and Sapinero) and for Blue Mesa. Trophic status is a measure of the biological productivity of a water body and is typically measured using chlorophyll-a concentrations with generally accepted divisions being oligotrophic (less than 2 µg/L), mesotrophic (2–7 µg/L), eutrophic (7–30 µg/L), and hypereutrophic (greater than 30 µg/L) (EPA, 2024b). The Colorado Department of Public Health and Environment (CDPHE) water-quality standard for chlorophyll-a is 8 µg/L for aquatic life and recreation (table 4). Trophic state indices (TSI) are another measure of biological productivity, and three independent estimates of biomass were calculated from chlorophyll-a, Secchi depth, and total phosphorus using equations 1–3 (Carlson, 1977). Productivity divisions for these metrics are oligotrophic (TSI less than 30), mesotrophic (TSI between 30 and 50), eutrophic (TSI between 50 and 70); and hypereutrophic (TSI greater than 70) (Carlson and Simpson, 1996; Dillon and Molot, 2024). The TSI–CHLa is considered a better predictor of trophic status than TSI–SD or TSI–TP (North American Lake Management Society, 2024), but relations between them can be used to understand different drivers for lake productivity (Carlson and Havens, 2005).
Water temperature in the three reservoir basins closely paralleled one another increasing through the season to maximum values in mid-July to late August (fig. 12A). Chlorophyll-a concentrations generally peaked near or after the temperature peaked (fig. 12B). On average, chlorophyll-a concentrations in Iola, Cebolla, and Sapinero basins indicated mesotrophic conditions in most years except 2021–22, when conditions were primarily eutrophic. It is worth noting that chlorophyll-a sampling in 2018 and 2020 did not extend to the period when algal toxins were detected in late summer. Chlorophyll-a concentrations in Iola basin were almost always greater than Cebolla and Sapinero basins (fig. 12B), exceeded 8 µg/L on at least one sampling date each year from 2018 to 2023, and reached hypereutrophic conditions in 2021 and 2022. Concentrations in Cebolla basin exceeded 8 µg/L and reached eutrophic conditions in 2021 and 2022 as did concentrations in Sapinero basin in 2019 and 2021, although concentrations in both basins were generally lower than in Iola basin. In 2021 and 2022, chlorophyll-a maxima generally coincided with algal biomass maxima at 3.3 ft in all three basins (fig. 7). In 4 of the 6 years shown in figure 12, algal toxins were detected in late summer and seemed to follow spikes in chlorophyll-a by several weeks particularly in 2021 and 2022 (years with higher sampling frequency). In years with late September sampling events, chlorophyll-a concentrations typically showed another increase following the August decline, which sometimes coincided with toxin detections in those years (fig. 12B).
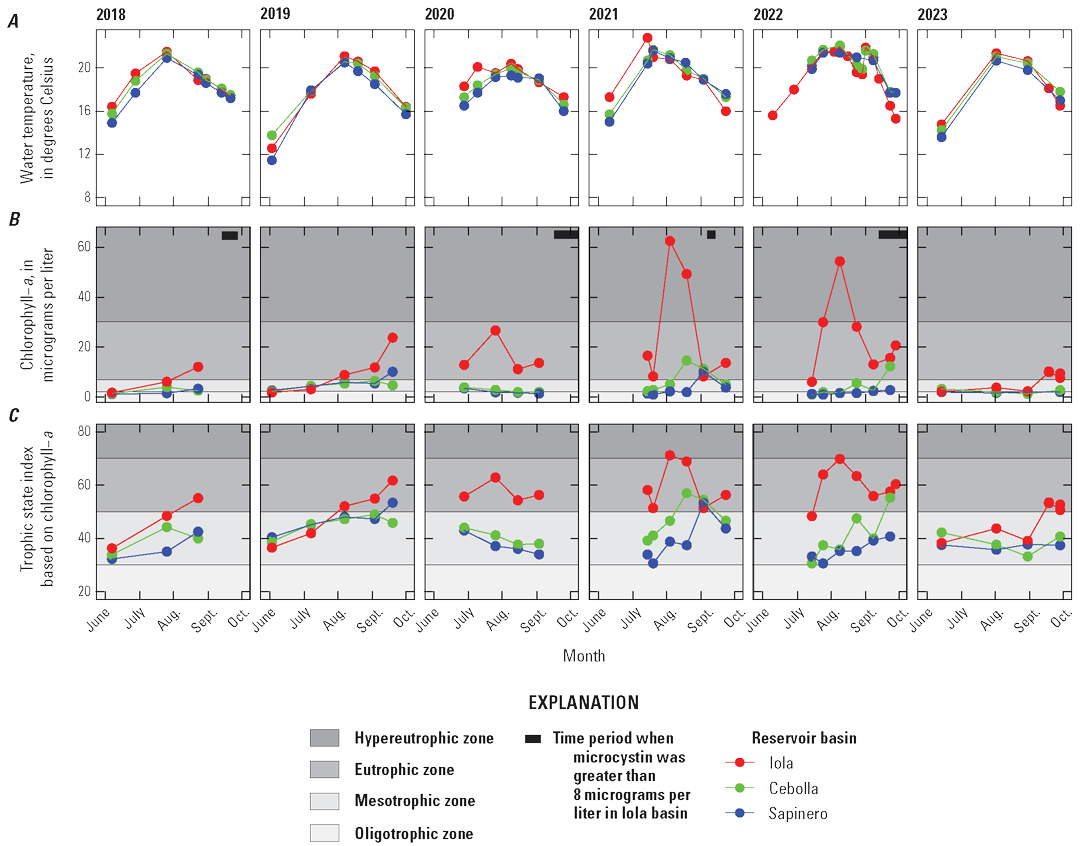
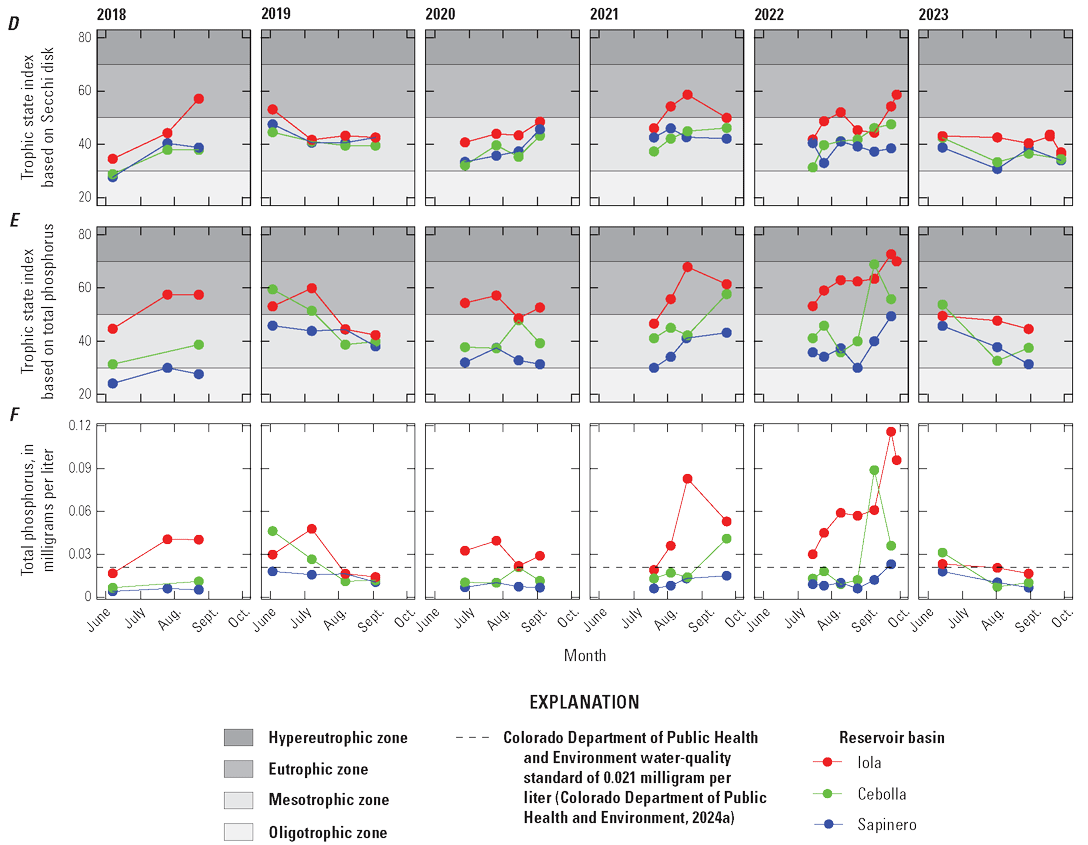
Time series graphs of discrete and derived (Trophic state indices) water-quality data at 3.3-foot depth during the growing season in the three basins of Blue Mesa Reservoir, Colorado, 2018–23. A, Water temperature. B, Chlorophyll-a concentration. C, Trophic state index for chlorophyll-a. D, Trophic state index for Secchi depth. E, Trophic state index for total phosphorus. F, Total phosphorus concentration.
Trophic state indices for chlorophyll-a, Secchi depth, and total phosphorus generally increased through the seasons in all three basins (fig. 12C, D, E). Decreases in TSI–SD and TSI–TP during 2019 and 2023 may indicate early season turbidity and sediment-phosphorus input from elevated runoff (increased inflow to Blue Mesa) those years (fig. 12D, E; table 3). Iola basin generally exhibited a higher trophic state and more productive conditions than Cebolla and Sapinero basins for most sampling dates and most years. In 2021 and 2022, conditions were generally eutrophic to hypereutrophic in Iola basin and mesotrophic to eutrophic in Cebolla and Sapinero basins (fig. 12C, D, E).
Bauch and Malick (2003) reported trophic state indices by the same three methods and reported values from 34 to 55 for Blue Mesa Reservoir during 1999. In this study, values varied from about 27 to 73 (fig. 12C, D, E) during 2018–23 indicating a wider variation in trophic states, and some instances of hypereutrophic conditions not previously reported. Previous work characterized the overall reservoir as mesotrophic (EPA, 1977; Blackwell and Boland, 1979; Long and others, 1996; Bauch and Malick, 2003). Consistent with these previous results, the median trophic state of Blue Mesa for chlorophyll-a, TSI–CHLa, TSI–SD, and TSI–TP was mesotrophic from 2018 to 2023 for each metric (fig. 12B–E).
Because the three index variables (TSI–CHLa, TSI–SD, and TSI–TP) are interrelated by linear regression models developed in Carlson (1977), they are expected to produce approximately the same index value for a given combination of chlorophyll-a, Secchi disk, and total phosphorus measurements. According to Carlson and Havens (2005), differences between the values for the same samples may provide additional insights into limnological processes, especially those not controlled by nutrients. The TSI–CHLa values for Blue Mesa are plotted against TSI–SD and TSI–TP in 2022 to illustrate how they deviate in time and space within Blue Mesa. Where TSI–SD is greater than TSI–CHLa (above the 1:1 line in fig. 13A), nonalgal particles may be limiting Secchi disk depths (table 1 in Carlson and Havens, 2005). The three highest values of TSI–SD occurred in Iola basin during May when the inflowing Gunnison River and Iola basin had higher levels of turbidity (USGS, 2024a), indicating suspended inorganic (nonalgal) sediment likely contributed to the Secchi disk reading in Iola basin during the spring months. When TSI–CHLa is greater than TSI–SD (below the 1:1 line in fig. 13A), large chlorophyll-containing particles, such as Aphanizomenon, which tends to aggregate into clumps, may be dominating light attenuation (Carlson and Havens, 2005), allowing more light penetration than from more dispersed algal particles. This result is indicated for most samples from Iola and Cebolla basins, especially surface samples (fig. 13A), and is consistent with the algal taxonomy showing a dominance of Aphanizomenon (fig. 7). When TSI–TP is greater than TSI–CHLa, there is excess phosphorus in the system, and some other factor may be limiting growth of algae (Carlson and Havens, 2005). Many of the samples with elevated TSI–TP relative to TSI–CHLa in figure 13B were collected at Iola basin in May or September 2022. A possible explanation is algal growth during the early and late part of the growing season may be limited by light availability and (or) cooler water temperature rather than phosphorus. Together, the information indicates that large chlorophyll-containing particles (likely from Aphanizomenon), rather than inorganic sediment, dominate light attenuation in Iola and Cebolla basins, and that something other than phosphorus limits algal growth in the early and late season.
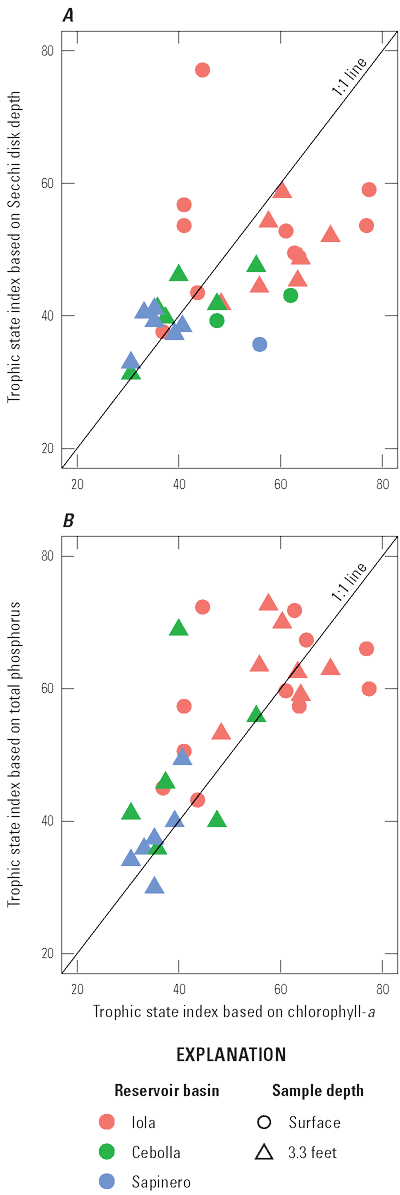
Comparison of trophic state index based on chlorophyll-a concentrations with other trophic state indices for samples collected in the three basins of Blue Mesa Reservoir at the surface and 3.3-foot depth in 2022. A, Trophic state index based on Secchi disk depth. B, Trophic state index based on total phosphorus concentrations.
Total phosphorus concentrations were generally greater in Iola basin than in other basins, except on a few occasions, and were greater than 0.021 mg/L (the CDPHE standard which equals 21 µg/L, table 4) at least twice each year (fig. 12F). There were no consistent seasonal patterns in total phosphorus concentrations among years. Concentrations increased with increasing chlorophyll-a in 2021 and 2022 (fig. 12B, F), and total phosphorus continued to increase following chlorophyll-a declines at 3.3-ft depth in late September 2022. Phosphorus concentrations in Iola basin were often greater than 0.021 mg/L (fig. 12F), with the highest observed concentrations in 2021 and 2022. Total phosphorus concentrations in Cebolla and Sapinero basins were greater than 0.021 mg/L at least twice from 2018 to 2023 with more exceedances in Cebolla basin than Sapinero basin.
Nutrient concentrations (total phosphorus, orthophosphate, and inorganic nitrogen) were examined with depth and among the three reservoir basins for surface, 3.3 ft, middle, and deep samples in each basin collected in 2021–22, when samples collected at multiple depths. Patterns in Cebolla and Sapinero basins were similar where total phosphorus, orthophosphate, and inorganic nitrogen (nitrate plus nitrite plus ammonia) increase with depth (fig. 14A–C). In contrast, patterns among constituents differ for Iola basin. Total phosphorus concentrations are similar at all depths, orthophosphate is greater at depth than the near surface or middle depths (somewhat like Cebolla and Sapinero basins), and inorganic nitrogen is similar at all depths having many values less than laboratory reporting limit (fig. 14A–C). Censored concentrations of nitrogen species were set at the laboratory reporting limit, which is indicated on figure 14. Depletion of nutrients at the surface is likely caused by phytoplankton usage and is consistent with previous patterns reported in Blue Mesa by Bauch and Malick (2003). Depth enrichment is typical for stratified lakes (Dillon and Molot, 2024). Total phosphorus is enriched in Iola basin at almost all depths compared to Cebolla and Sapinero basins, likely reflecting phosphorus inputs from the Gunnison River into Iola basin and progressive removal by algae moving downstream through the reservoir. In contrast, orthophosphate and inorganic nitrogen concentrations were lower in Iola basin, likely because of their utilization by the more abundant algal biomass in Iola basin (fig. 7).
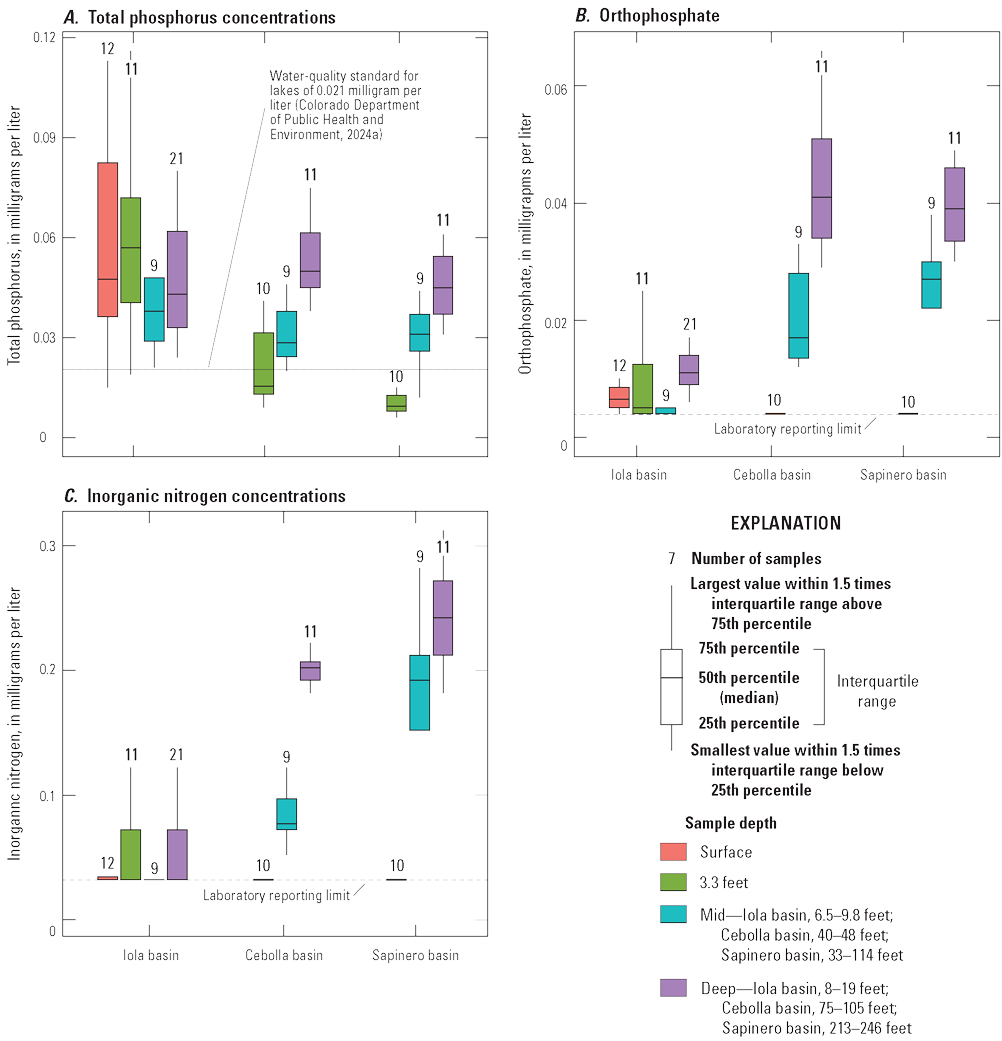
Boxplots showing range of nutrient concentrations in the three Blue Mesa Reservoir basins at different sample depths for data collected from 2021 to 2022. A, Total phosphorus. B, Orthophosphate. C, Inorganic nitrogen. Nutrient data from U.S. Geological Survey (2024a).
The total nitrogen to total phosphorus ratio (TN:TP) can be used to understand whether nitrogen or phosphorus is a limiting nutrient for productivity in aquatic systems (Bergström, 2010). The TN:TP mass ratios were calculated using Iola basin samples collected at all depths in 2022 (fig. 15), which was the year that exhibited the most severe algal bloom of the study period (fig. 6). It is notable that the largest fraction of the total nitrogen concentration was organic nitrogen because inorganic nitrogen species (ammonia and nitrate) were often below the laboratory reporting level (USGS, 2024a). Thus, TN:TP ratios were larger than they would be if only total inorganic nitrogen was included. Nonetheless, the 2022 data show TN:TP ratios generally less than 19, indicating that Iola basin was almost always nitrogen limited during summer of 2022 according to the predicted thresholds from Bergström (2010). Low TN:TP ratios are characteristic of conditions that allow cyanobacteria to dominate (Smith, 1983) because cyanobacteria can fix atmospheric nitrogen (Beversdorf and others, 2013; Willis and others, 2016).
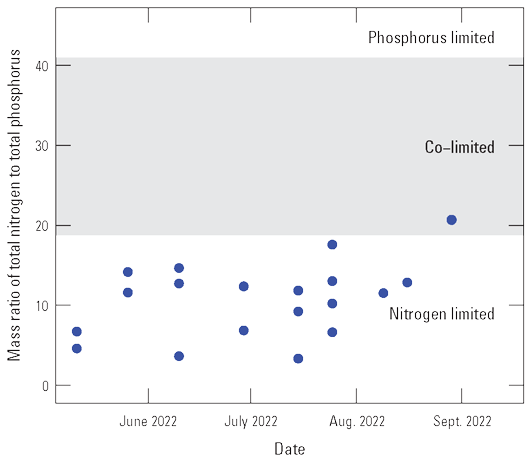
Mass ratio of total nitrogen to total phosphorus for samples collected in Iola basin during 2022 at all depths. Limitation data from Bergström (2010). Nutrient data from U.S. Geological Survey (2024a).
In summary, chlorophyll-a data and TSI values indicated increased trophic status of Iola basin during 2018–23 relative to previous reports, whereas Blue Mesa remained overall mesotrophic consistent with previous reports. In Iola basin, the longest periods of toxicity warnings from cyanoHABs blooms and the lowest recorded reservoir level since 1984 occurred during 2021–22 (Bureau of Reclamation, 2024). During this time, chlorophyll-a and TSI–TP indicated hypereutrophic conditions at some points in each year. The relation between TSI–CHLa and TSI–SD values and the low TN:TP ratio indicate that the reservoir is nitrogen limited and that turbidity is primarily from algae and cyanobacteria, rather than suspended sediment. Total phosphorus is enriched in Iola basin at almost all depths compared to Cebolla and Sapinero basins. In contrast, orthophosphate and inorganic nitrogen concentrations were lower in Iola basin, likely because of their utilization by the more abundant algal biomass in Iola basin. The TN:TP ratios are consistent with conditions that allow cyanobacteria to dominate. Nitrogen limitation is consistent with the ability of cyanobacteria to fix nitrogen from the atmosphere and thus the cyanobacteria do not require exogenous nitrogen. The relation between TSI–CHLa and TSI–TP during the early and late part of the growing season indicates that something other than nutrients (possibly water temperature or light availability) limits algal growth in Blue Mesa during these times of the year.
Long-Term Trends in Hydrologic and Limnological Conditions
To examine potential effect of changes in long-term conditions on development of algal blooms in Blue Mesa, temporal trends in hydrologic conditions of the reservoir and air temperature are assessed for 1970–2023 and trends in streamflow at the Gunnison River site 13 are assessed for 1980–2023. Temporal trends in water-quality constituents and trophic status indices for the reservoir are assessed for 2001–23.
Reservoir Hydrology, Air Temperature, and Streamflow
Change in climate has emerged as a potentially important factor affecting the frequency and severity of algal blooms in lakes and reservoirs (Paerl and Huisman, 2009; Ho and Michalak, 2020). In the Colorado River watershed, there have been recent periods of extended drought (Udall and Overpeck, 2017) and unprecedented increases in air temperatures (Milly and Dunne, 2020) with model-based analyses indicating that warming and reduced streamflows will continue in the region (Udall and Overpeck, 2017). In anticipation of changes in regional climate and in particular reduced wintertime precipitation (Woodhouse and others, 2021), management strategies in western reservoirs are adapting to best maintain or augment current water resource availability (Bureau of Reclamation, 2025). In Blue Mesa, the reservoir level is predominately controlled by snowmelt runoff and releases of water related to hydropower generation and downstream water needs (Bureau of Reclamation, 2012). To evaluate long-term changes in Blue Mesa that may be driven by climate or reservoir management, trends in reservoir hydrologic conditions, including reservoir level, release volume, residence time, streamflow inputs from the Gunnison River (the primary tributary), and air temperature were explored. Trends in growing season (June–September) and annual means are presented graphically (fig. 16).
No trend was detected in the growing season mean for reservoir level during 1970–2023 (fig. 16A). Mean reservoir levels during the growing season were below the long-term mean in 4 out of the last 10 years (2014–23) and included the 2 lowest years since 1970 when mean reservoir levels were 42 ft (2021) and 39 ft (2022) below mean reservoir level (7,493 ft), and 69 ft and 66 ft below the maximum reservoir level of 7,519 ft. A statistically significant upward trend in mean release volumes of 16.6 acre-feet per day per year was detected during the growing season from 1970 to 2023 (fig. 16B). As a result, a downward trend in growing season residence time of 1.75 days per year was detected from 1970 to 2023 (fig. 16C). Decreased residence time (in the range of days) may dilute cyanobacteria faster than they can multiply and (or) alter other growth conditions like nutrient concentrations (Ibelings and others, 2021); however, it is not known how changes in Blue Mesa residence time may affect cyanobacteria growth. Residence times in Blue Mesa are long (200 days) for the whole reservoir (Bureau of Reclamation, 2024) but they may be considerably shorter for the smaller and shallower Iola basin.
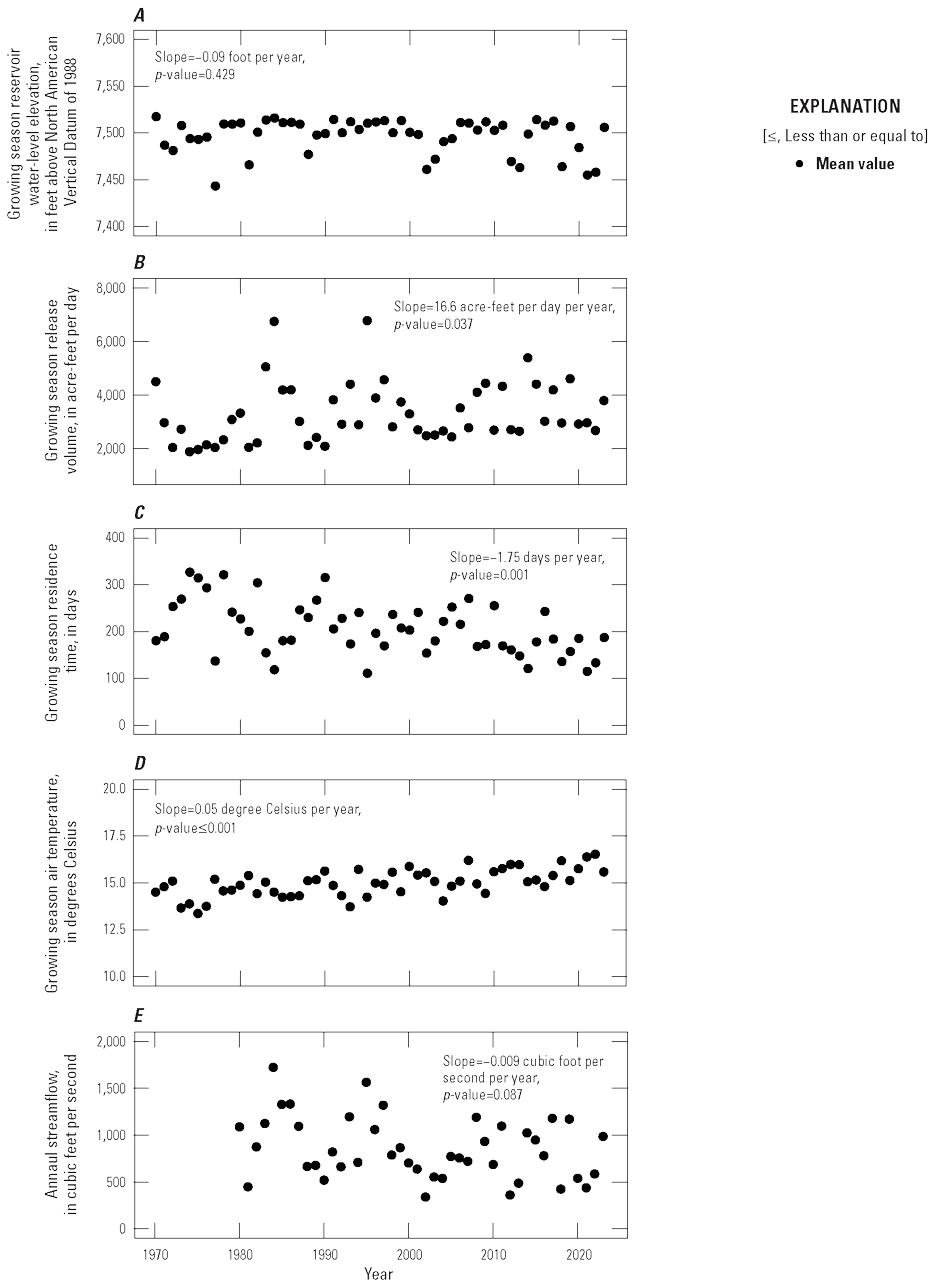
Temporal trends in hydrologic and climate conditions. Growing-season mean A, reservoir water-level elevation; B, release volume; C, residence time; and D, air temperature at Blue Mesa Reservoir, 1970–2023; and E, annual mean streamflow at Gunnison River at County Road 32 near Gunnison, Colorado (U.S. Geological Survey site 383103106594200, table 1), 1980–2023. Data sources in table 2.
Statistically significant upward trends in air temperature were observed for growing season mean temperatures (0.05 °C per year) from 1970 to 2023. For the Gunnison River site 13, statistically significant downward trends were detected in annual streamflow (31 percent during the 43-year period or −0.0087 cubic foot per second [ft3/s] per year from 1980 to 2023 [fig. 16E]). Because the Gunnison River is unregulated upstream from the reservoir, these declines in streamflow could reflect decreases in precipitation and (or) changes in snowmelt timing in addition to air temperature increases and withdrawals for agricultural, municipal, and industrial uses.
Water Quality and Trophic Status
In addition to the long-term hydrologic datasets, water-quality data have been collected at Blue Mesa during the growing season since 2001 (table 2). The seasonal Kendall test was used to evaluate trends in Secchi disk depth, water temperature, chlorophyll-a, total phosphorus concentrations, and the three trophic state indices (TSI–SD, TSI–CHLa, and TSI–TP) for the period 2001–23 at 3.3-ft depth at reservoir sites, and results are summarized in table 5. Statistically significant trends (p-value less than 0.05) were detected for water temperature at Cebolla basin and for chlorophyll-a and TSI–CHLa in all three reservoir basins. Slightly less significant trends (p-value between 0.05 and 0.10) were also detected for water temperature in Iola and Sapinero basins and total phosphorus and TSI–TP in Iola and Cebolla basins. The chlorophyll-a trends were upward in all three basins and were greatest in Iola basin (0.218 µg/L per year) and less than half that in Cebolla (0.106 µg/L per year) and Sapinero (0.069 µg/L per year) basins (table 5). Despite the upward trends in chlorophyll-a, Secchi disk depth showed no statistically significant trends from 2001 to 2023 although the slopes were all negative. This result indicates that the chlorophyll-a trends, less than 5 µg/L across the 23-year period, did not substantially affect reservoir clarity as measured with Secchi disk readings. Significant upward trends in TSI–CHLa values indicate that all basins are shifting to higher trophic states through time (table 5), corresponding to a change in trophic status of 10–15 units across the 23-year period of record.
Table 5.
Long-term trends for 2001–23 in nutrient concentrations at 3.3-foot depth at reservoir sites and nutrient concentrations and loads at selected tributaries to Iola basin determined by the seasonal Kendall test (Helsel and others, 2020), Blue Mesa Reservoir, Colorado.[p-value, probability value of trend test; Slope, trend slope in constituent units per year; Percent censored, percent of the dataset less than the laboratory reporting limit; TSI, trophic state index (unitless); Org N plus amm., Organic nitrogen plus ammonia; --, insufficient data to compute trend; data sources listed in table 2]
| Location | Site number (table 1) |
Constituents | p-value | Slope | Percent censored |
|---|---|---|---|---|---|
| Iola basin | 382856107050000c | Secchi depth, in feet | 0.540 | −0.048 | 0 |
| Cebolla basin | 382829107122200 | Secchi depth, in feet | 0.295 | −0.071 | 0 |
| Sapinero basin | 382831107172600 | Secchi depth, in feet | 0.610 | −0.031 | 0 |
| Iola basin | 382856107050000c | Water temperature, in degree Celsius | 0.096 | 0.024a | 0 |
| Cebolla basin | 382829107122200 | Water temperature, in degree Celsius | 0.016 | 0.031b | 0 |
| Sapinero basin | 382831107172600 | Water temperature, in degree Celsius | 0.079 | 0.030a | 0 |
| Iola basin | 382856107050000c | Chlorophyll-a concentration, in micrograms per liter | 0.029 | 0.218b | 0 |
| Cebolla basin | 382829107122200 | Chlorophyll-a concentration, in micrograms per liter | 0.006 | 0.106b | 0 |
| Sapinero basin | 382831107172600 | Chlorophyll-a concentration, in micrograms per liter | 0.004 | 0.069b | 0 |
| Iola basin | 382856107050000c | Total phosphorus concentration, in milligrams per liter | 0.080 | 0.0004a | 0 |
| Cebolla basin | 382829107122200 | Total phosphorus concentration, in milligrams per liter | 0.058 | 0.0002a | 1 |
| Sapinero basin | 382831107172600 | Total phosphorus concentration, in milligrams per liter | 0.151 | 0.0001 | 3 |
| Iola basin | 382856107050000c | TSI–Secchi | 0.559 | 0.067 | 0 |
| Cebolla basin | 382829107122200 | TSI–Secchi | 0.288 | 0.080 | 0 |
| Sapinero basin | 382831107172600 | TSI–Secchi | 0.614 | 0.033 | 0 |
| Iola basin | 382856107050000c | TSI–chlorophyll-a | 0.028 | 0.631b | 0 |
| Cebolla basin | 382829107122200 | TSI–chlorophyll-a | 0.007 | 0.440b | 0 |
| Sapinero basin | 382831107172600 | TSI–chlorophyll-a | 0.004 | 0.506b | 0 |
| Iola basin | 382856107050000c | TSI–phosphorus | 0.080 | 0.271a | 0 |
| Cebolla basin | 382829107122200 | TSI–phosphorus | 0.055 | 0.315a | 1 |
| Sapinero basin | 382831107172600 | TSI–phosphorus | 0.137 | 0.222 | 3 |
| Gunnison River | 383103106594200 | Nitrite plus nitrate concentration, in milligrams per liter as nitrogen | 0.099 | −0.0007a | 15 |
| Gunnison River | 383103106594200 | Org N plus amm. concentration, in milligrams per liter as nitrogen | 0.391 | <0.0001 | 1 |
| Gunnison River | 383103106594200 | Total nitrogen concentration, in milligrams per liter as nitrogen | 0.091 | −0.0025a | 15 |
| Gunnison River | 383103106594200 | Total phosphorus concentration, in milligrams per liter | 0.300 | 0.0002 | 0 |
| Beaver Creek | 382943107015300 | Nitrite plus nitrate concentration, in milligrams per liter as nitrogen | -- | -- | 87 |
| Beaver Creek | 382943107015300 | Org N plus amm. concentration, in milligrams per liter as nitrogen | 0.229 | −0.0011 | 8 |
| Beaver Creek | 382943107015300 | Total phosphorus concentration, in milligrams per liter | 0.675 | 0.0002 | 0 |
| Steuben Creek | 382937107033500 | Nitrite plus nitrate concentration, in milligrams per liter as nitrogen | -- | -- | 91 |
| Steuben Creek | 382937107033500 | Org N plus amm. concentration, in milligrams per liter as nitrogen | 0.544 | −0.0012 | 8 |
| Steuben Creek | 382937107033500 | Total phosphorus concentration, in milligrams per liter | 0.502 | −0.0004 | 0 |
| Gunnison River | 383103106594200 | Nitrite plus nitrate load, in pounds per day | 0.413 | −1.41 | 15 |
| Gunnison River | 383103106594200 | Org N plus amm. load, in pounds per day | 0.402 | 4.03 | 1 |
| Gunnison River | 383103106594200 | Total nitrogen load, in pounds per day | 0.821 | −3.35 | 15 |
| Gunnison River | 383103106594200 | Total phosphorus load, in pounds per day | 0.328 | 0.57 | 0 |
Surface water temperatures during the growing season showed statistically significant upward trends in Cebolla basin (0.031 °C per year) with less significant upward trends in Iola (0.024 °C per year) and Sapinero (0.030 °C per year) basins. These increases are similar to those derived from the 2000–23 satellite modelling (King and others, 2025) of 0.04, 0.03, and 0.02 °C per year for Iola, Cebolla, and Sapinero basins, respectively. These results are also consistent with the trend of increasing growing-season air temperatures of 0.05 °C per year from 1970 to 2023 reported in the “Long-term trends in hydrologic and limnological conditions” section. Together, these different temperature records provide evidence that water temperatures in Blue Mesa have risen during the past several decades.
From 2001 to 2023, there were weak (p-value greater than 0.05 and less than or equal to 0.10) upward trends in total phosphorus and TSI–TP in Iola and Cebolla basins. The magnitude of the trends is relatively small with Iola basin showing a 0.0092-mg/L increase (0.0004 mg/L slope per year for 23 years) and Cebolla basin showing a 0.0046-mg/L increase (0.0002 mg/L slope per year for 23 years). Although the increase in total phosphorus could reflect real environmental change, these detected changes are small compared to the laboratory reporting limit of 0.01 mg/L.
Nutrients in Tributaries
Nutrients in selected tributaries were assessed to better understand external nutrient inputs to Blue Mesa. Nutrient concentrations in the 2022 samples are described and long-term trends in nutrient concentrations and loads (2001–23) are evaluated. Geologic sources are explored as a potential source of phosphorus to tributaries in Iola and Cebolla basins. Nutrients and wastewater indicators are investigated in several seeps that occur along the north shore of Iola basin.
Nutrient Concentrations and Trends
Nutrient concentrations in 2022 are presented for Iola basin tributaries including the Gunnison River site 13, Beaver Creek 14, and Steuben Creek site 15. Data for Beaver Creek site 14 and Steuben Creek site 15 were collected as part of this study (table 1.3). Data for Gunnison River site 13 were collected as part of routine monitoring by USGS and were retrieved from NWIS database (USGS, 2024a) (refer to appendix 3 for discussion of 2022 grab samples collected at Gunnison River site 13 during this study). Inorganic nitrogen was detected in all samples from the Gunnison River site 13, and concentrations ranged from 0.01 to 0.05 mg/L (USGS, 2024a). Inorganic nitrogen (nitrate plus nitrite) was below laboratory reporting limits (0.01 mg/L) for all Steuben Creek site 15 samples and all but two Beaver Creek site 14 samples collected between July and October 2022. Thus, inorganic nitrogen concentrations generally were low or not detected in tributaries. However, a comprehensive nitrogen load analysis for all reservoir inputs and output, though beyond the scope of this study, would assist better understanding of the magnitude of tributary nitrogen input to Iola basin.
All 2022 results for total phosphorus in these tributaries were greater than the laboratory reporting limit of 0.01 mg/L (USGS, 2024a). In general, concentrations were slightly higher at Beaver Creek site 14 (mean of 0.14 mg/L) and Steuben Creek site 15 (mean of 0.086 mg/L) compared to the Gunnison River site 13 (mean of 0.034 mg/L). Two of 14 grab samples collected in 2022 at Steuben Creek site 15 and 13 of 14 grab samples collected in 2022 at Beaver Creek site 14 had phosphorus concentrations greater than the State of Colorado interim standard for phosphorus in rivers of 0.11 mg/L (or 110 µg/L, table 4; CDPHE, 2024a). None of the 2022 samples collected at the Gunnison River site 13 were greater than 0.11 mg/L. Additional discussion of phosphorus concentrations in tributaries is discussed in the “Geologic Sources of Phosphorus” section.
Changes in land use, streamflow, and watershed management can contribute to changes in nutrient concentrations and loads through time (Murphy and Sprague, 2019; Stets and others, 2020). Identifying the causes of nutrient trends can aid land managers in designing nutrient-control strategies and can serve as ongoing measures of progress toward nutrient reduction. Trend analysis was used to assess temporal changes in nitrogen and phosphorus concentrations in tributaries to Iola basin because Iola basin is primarily where toxic cyanoHABs are present (fig. 7), and increasing nutrient input can make water-quality conditions more favorable to algal growth. Trends for the Gunnison River site 13, which is downstream from a wastewater treatment plant, were computed for 2001–23 (table 5) and showed no statistically significant trends at the p-value less than 0.05 for either concentration or load. For nitrite plus nitrate and total nitrogen, less significant downward trends were detected (p-value between 0.05 and 0.10; table 5), indicating weak downward trends in inorganic nitrogen at this site. For Beaver Creek site 14 and Steuben Creek site 15, no statistically significant trends were detected in total phosphorus or organic nitrogen plus ammonia concentrations. Trends could not be computed for nitrite plus nitrate because more than 80 percent of concentrations were below the laboratory reporting limit, and total nitrogen at these sites is not available (table 5). These results likely indicate nitrogen and phosphorus inputs from major tributaries entering the Iola basin have not changed substantially during the past several decades and may have decreased slightly, indicating they are likely not the main trigger for algal blooms in this part of the reservoir. These results are consistent with previous work that did not detect phosphorus trends in Beaver Creek site 14, Steuben Creek site 15, or the Gunnison River site 13 for 2010–18 (Weissinger and Gibney, 2019). Weissinger and Gibney (2019) also did not detect trends in total ammonia and nitrite plus nitrate at Gunnison River site 13 and were unable to test for trends in nitrogen species at Beaver Creek site 14 and Steuben Creek 15 because the data were highly censored. However, Weissinger and Gibney (2019) indicated that Beaver Creek site 14 and Steuben Creek site 15 exceeded water-quality standards for total phosphorus.
Geologic Sources of Phosphorus
The elevated total phosphorus concentrations in Beaver and Steuben Creeks were noteworthy (fig. 17) and consistent with previous observations (Weissinger and Gibney, 2019). This observation was investigated further by compiling total phosphorus data collected by the NPS (and including data from this study) from 2021 to 2023 for additional tributaries flowing into Blue Mesa (Weissinger and Gibney, 2019; National Water Quality Monitoring Council, 2024). Phosphorus concentrations in most tributaries were greater than in any of the three reservoir basins and the Gunnison River site 13 (fig. 17). Total phosphorus was highest in tributaries draining the north side of the Blue Mesa particularly those located north of Iola and Cebolla basins (Beaver, Steuben, East Elk, and Red Creeks, fig. 1). Total phosphorus in tributaries, especially in East Elk and Red Creeks, frequently exceeded 0.11 mg/L (or 110 µg/L, the State of Colorado interim standard for phosphorus in rivers, table 4; CDPHE, 2024a). These two creeks are on the monitoring and evaluation list for total phosphorus in the most recent 303(d) list for Colorado (CDPHE, 2023). Previous work noted elevated phosphorus concentrations in Elk and Red Creeks and proposed that these streams flowed through volcanic rocks that might be a source for phosphorus, but no supporting evidence was provided (Brown and Thoma, 2012). The geologic map indicates that streams on the north shore of Blue Mesa drain areas that are primarily underlain by Tertiary volcanic rocks and that have no agricultural land use (fig. 4). The mean phosphorus concentration estimated for volcanic rocks of 0.11 weight percent is nearly twice that of the crustal abundance of 0.0655 weight percent for phosphorus (table 6; USGS, 2024b), indicating the volcanic rocks are enriched in phosphorus and could be a potential source to streams that drain them. The alkali intrusions on the south side of Blue Mesa (fig. 4) are also highly enriched in phosphorus having a phosphorus concentrations more than 10 times the crustal abundance (Cambrian alkalic intrusive rocks 0.99 weight percent, table 6). Total phosphorus concentrations at the Cebolla Creek at Powderhorn, Colo. (USGS site 381633107054700; 15 mi upstream from Blue Mesa, not shown on fig. 1; USGS, 2024a), which flows into Blue Mesa and drains the alkali intrusions, are elevated and concentrations are greater than the CDPHE stream standard concentration (fig. 17), likely indicating this rock type also contributes phosphorus to surface water.
Geologically derived nutrients are often an overlooked source of nutrients to surface water, but a recent study in California attributed elevated concentrations of phosphorus in surface water to weathering of phosphate minerals in volcanic rocks (Deas and others, 2024). They suggested phosphorus was released from weathering of apatite but also volcanic glass, which weathers rapidly and can contain considerable amounts of phosphorus. Given the lack of agricultural development and the dominance of intrusive and volcanic rocks in the lower Blue Mesa watershed, some of which contain volcanic glass, it seems likely that phosphorous from weathering of bedrock is a potential source of elevated phosphorus in tributaries (fig. 17) that then most likely contributes phosphorus to the reservoir. This geologic source supporting elevated phosphorus concentrations in streams has probably been generally consistent through time and is likely not a trigger for the 2018–23 cyanoHABs in Blue Mesa. However, it nonetheless is an important source of phosphorus supporting algal growth in the reservoir.
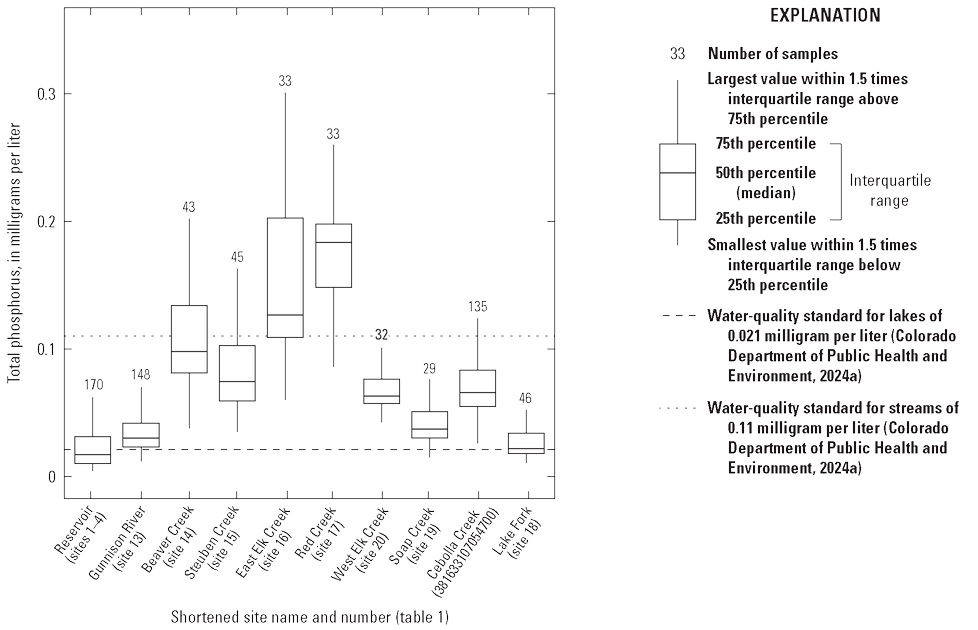
Boxplot showing range of total phosphorus concentrations in reservoir samples from all three basins; Gunnison River at County Road 32 below Gunnison, Colorado (U.S. Geological Survey site 383103106594200); and major tributaries on the north side of Blue Mesa Reservoir during 2001–23 arranged in order from east to west (left to right) and Lake Fork and Cebolla Creek, which drain into Blue Mesa Reservoir from the south (fig. 1). Use site number on this figure to cross reference with longer site names on table 1.
Table 6.
Lithium and phosphorus concentrations in selected bedrock types in the Blue Mesa Reservoir watershed compared to crustal abundances.[ppm, parts per million; std. dev., standard deviation; --, not applicable; wt., weight; concentration data from U.S. Geological Survey (2024b) and watershed area from Day and others (1999)]
Lower watershed includes drainage area between the dam on Blue Mesa Reservoir and the reservoir inflow at the Gunnison River at County Road 32 near Gunnison, Colo. (site 13 in table 1)
Water Quality of Seeps Along the North Shore of Iola Basin
When reservoir levels were low in Blue Mesa in 2021 and 2022, several seeps appeared in the exposed reservoir bed on the north shore of Iola basin (sites 21–24 in fig. 1 and table 1). Sites 22–24 are within the drainage channel of a small tributary, North Willow Creek, where a seasonal recreational vehicle (RV) park (fig. 1) with domestic wastewater treatment facilities is located. In 2021, North Willow Seep at Blue Mesa Reservoir near Gunnison, Colorado (USGS site 382834107063501, hereafter referred to as “site 24”) had elevated concentrations of dissolved nitrogen (25.8 mg/L as nitrogen) and total phosphorus (2.48 mg/L as phosphorus, sampled September 24, 2021) (table 7) that were 1–2 orders of magnitude greater than CPDHE stream and lake water-quality standard concentrations of 0.380 mg/L for total nitrogen for lakes and 0.11 mg/L and 0.021 mg/L total phosphorus for streams and lakes, respectively (table 4). Concentrations at site 24 in 2022 were lower than in 2021 by a factor of 3 but were still greater than the water-quality standard concentrations. In general, nutrient concentrations at site 24 were much higher than at Old Stevens Seep near Gunnison, Colo. (USGS site 38285810705590, hereafter referred to as “site 21”), which was sampled as a background site in 2022 (fig. 1). The elevated nutrient data, especially the high ammonia concentration (21.3 mg/L as nitrogen) collected at site 24 in September 2021, along with a field comment noting a distinct waste-like odor when sampling in 2022 (USGS, 2024a) potentially indicate a wastewater source for water in site 24. North Willow Seep in North Willow Channel near Gunnison, Colorado (USGS site 382840107063501, hereafter referred to as “site 23”) and Middle North Willow Seep near Gunnison, Colorado (USGS site 382838107063601, hereafter referred to as “site 22”) also had elevated total nitrogen (from 0.51 to 1.1 mg/L) and total phosphorus (from 0.217 to 1.22 mg/L) concentrations relative to the CPDHE stream and lake water-quality standard concentrations of 0.380 mg/L for total nitrogen for lakes and 0.11 mg/L and 0.021 mg/L total phosphorus for streams and lakes (table 4). However, the total nitrogen concentrations at each site may have been affected by contamination (refer to “Quality Assurance” section).
Table 7.
Water-quality results for seeps sampled during 2021–22 along the north shore of Iola basin, Blue Mesa Reservoir, Colorado.[µS/cm at 25 °C, microsiemens per centimeter at 25 degrees Celsius; --, not analyzed; mg/L, milligram per liter; <, less than; µg/L, microgram per liter; ng/L, nanogram per liter; E, detected but concentration below lowest calibration standard; N, nitrogen; per mil, parts per thousand. Site numbers and results from U.S. Geological Survey (2024a)]
Pharmaceutical compounds, nitrogen isotopes in ammonia, and concentrations of boron and lithium also were analyzed as potential wastewater indicators (Vengosh and others, 1994; Furlong and others, 2017). Three pharmaceutical compounds were detected at site 24 in 2022 (table 7) including erythromycin (antibiotic), triamterene (diuretic), and glipizide (hypoglycemic agent) (Furlong and others, 2017). Site 23 (just upstream from site 24, was sampled in 2022 before reservoir levels had fallen enough to reveal site 24) had an estimated detection (detected but concentration below lowest calibration standard; table 7) of one wastewater indicator, desmethyl diltiazem (a metabolite of a blood pressure medication) (Furlong and others, 2017). Research indicates that the presence of low levels of human pharmaceuticals in groundwater with or without elevated nitrate concentrations is unambiguous evidence that domestic wastewater contributed to the groundwater (Seiler and others, 2005).
The 2022 nitrogen isotope values for site 22 and site 24 (table 7) are within the range for septic waste and natural soils (refer to fig. 16.4 in Kendall, 1998), and thus not uniquely diagnostic of wastewater. Boron is a bleaching agent in detergents and is enriched in wastewater (Vengosh and others, 1994). Lithium is used to treat bipolar disorder (Furlong and others, 2017) and tends to remain in solution (Hem, 1985) and through sewage treatment processes (Furlong and others, 2017). Boron and lithium were detected in the seeps but at relatively low concentrations (table 7). Lithium concentrations were lower in sites 22–24 than in site 21 (background), and boron in site 23 was similar to site 21, but site 24 was higher than site 21 (table 7). Because concentrations were low overall with no consistent patterns among the sites, boron and lithium do not provide a clear signal of wastewater discharge and more likely are naturally occurring and potentially sourced from weathering of volcanic rocks as described for phosphorus in the “Geologic Sources of Phosphorus” section. Lithium data compiled for rock samples in the Blue Mesa watershed (fig. 4, table 6) indicated lithium concentrations in the volcanic rocks were similar to crustal abundances, indicating bedrock weathering could be a potential source of lithium.
Although some seeps had very high nutrient concentrations, it is worth noting that the discharge from these seeps was very low, and the load of nutrients into the reservoir from these sources is likely minor. Assuming a hypothetical discharge of 0.01 ft3/s at site 24 in September 2021, the estimated load of total phosphorus would be 0.13 pound per day (lb/day) and total nitrogen load would be 1.39 lb/day. By comparison, at the Gunnison River site 13 in August 2021, the streamflow of 635 ft3/s and total phosphorus and nitrogen concentrations of 0.030 and 0.209 mg/L (USGS, 2024a), yield loads of 101 lb/day for total phosphorus and 717 lb/day for total nitrogen, which are more than two orders of magnitude higher than the estimated seep loads.
In summary, the nitrogen isotopes in ammonia and concentrations of lithium and boron were not unambiguously diagnostic of wastewater. However, the occurrence of elevated nutrient concentrations and detection of a few pharmaceuticals provides evidence for a wastewater source to sites 23 and 24, potentially a point source like the upstream RV park (which was not in compliance with county wastewater regulations in 2023 [permit number COX634063, document identification number 20580845 and 20580890; CDPHE, 2024b]). Although it is unlikely the seeps contribute enough nutrients to affect development of algal blooms throughout the reservoir, there might be highly localized blooms occurring in the vicinity of these sites (for example, fig. 2B) and controlling nutrient sources such as these could be considered part of a management strategy.
Relation Between Algal Blooms and Limnological Conditions
Discrete chlorophyll-a data and remotely sensed data collected from 2016 to 2023 indicate that blooms typically initiate in Iola basin (King and others, 2025). Exceedances of chlorophyll-a and microcystin standard concentrations occurred almost exclusively in Iola basin and were more severe during the growing season in years with low reservoir levels (2018 and 2020–22) (fig. 12B). In addition to chlorophyll-a and algal toxins, total phosphorus was noticeably greater in Iola basin during 2021–22 when reservoir levels were the lowest since 1984 (figs. 5, 12F). This section focuses on examining relations between TSI–CHLa and reservoir level, water temperature, Secchi disk depth, and total phosphorus concentrations. The strength of these relations is used to assess factors that could contribute to Iola basin having more frequent toxic algal blooms compared to Cebolla and Sapinero basins.
Correlations of TSI–CHLa in Iola basin with water temperature, Secchi disk depth, reservoir level, and total phosphorus at 3.3-ft depth ranged in direction and strength (fig. 18A). The correlation between water temperature and TSI–CHLa was weak (Pearson correlation coefficient [r]=0.084). King and others (2025) determined a moderate positive correlation (r=0.62) between mean growing season (July–August 2016–23) remotely sensed chlorophyll-a concentrations and remotely sensed water temperatures in Iola basin. The difference in results may be due to the type of data and period of record; King and others (2025) used growing season mean values for 2016–23, whereas results herein were based on multiple discrete samples per year during 2001–23. In figure 18A, maximum TSI–CHLa values (greater than about 60) occurred at higher water temperatures (greater than about 18 °C). In contrast, lower TSI–CHLa values (less than 60) were observed across all temperatures. These results indicate possible multifaceted controls on algal growth such as nutrients, light availability, and competition with other organisms (Xiao and others, 2024).
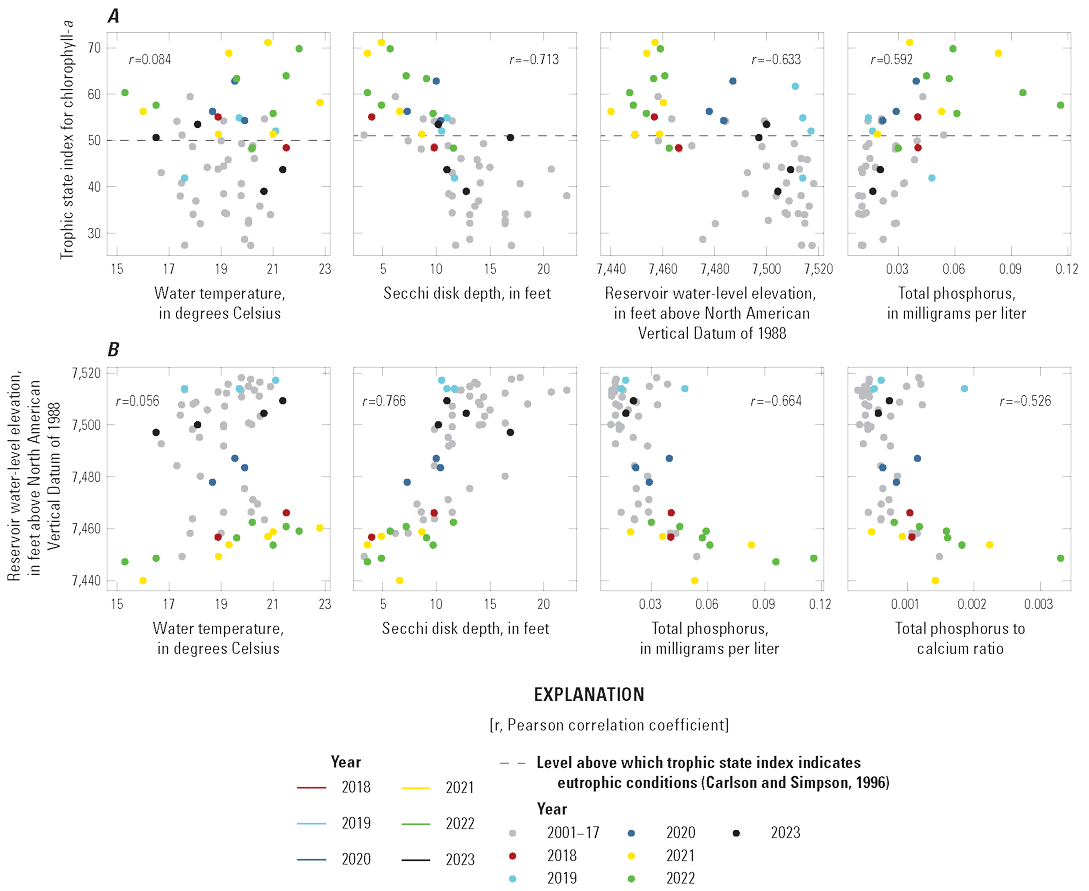
Graphs showing correlations between reservoir properties (water temperature, Secchi disk depth, and reservoir water-level elevation), calculated variables (Trophic state index and total phosphorus to calcium ratio), and total phosphorus in Iola basin (U.S. Geological Survey [USGS] site 38285610705000 in 2016–21 and 2023 and USGS site 382852107054801 in 2022) for growing season samples only (July through September) collected at 3.3-foot depth, 2001–23. A, Correlations between trophic state index based on chlorophyll-a with water temperature, Secchi disk depth, reservoir water-level elevation, and total phosphorus. B, Correlations between reservoir water-level elevation with water temperature, Secchi disk depth, total phosphorus, and total phosphorus to calcium mass ratio.
Secchi depth had a relatively strong negative correlation (r=−0.713) with TSI–CHLa (fig. 18A). Total phosphorus had a moderate positive correlation with TSI–CHLa (r=0.592), indicating that higher phosphorus concentrations may relate to elevated chlorophyll-a concentrations. There was a strong inverse correlation between TSI–CHLa and reservoir levels (r=−0.633), where lower reservoir levels resulted in higher TSI–CHLa values (fig. 18A). It is apparent that at reservoir levels greater than around 7,470 ft, TSI–CHLa can be high or low, but at reservoir levels less than about 7,470 ft, concentrations were always high (primarily in 2018 and 2021–22, but also 2002, 2003, and 2012, which were drought years; National Oceanic and Atmospheric Administration, 2024). Further, for 2018 and 2021–22, the TSI–CHLa indicated eutrophic to hypereutrophic conditions (fig. 12C). Based on bathymetry, Iola basin is the shallowest basin, with depths as low as 10–30 ft at the long-term sampling sites (fig. 8) when reservoir level was as low as about 7,430 ft during drought years in 2018 and 2020–22 (fig. 5). Thus, the effect of low reservoir levels may disproportionately affect Iola basin compared to other basins, resulting in algal blooms and toxin formation when reservoir levels are below a certain “threshold.” In shallow reservoirs (such as Iola basin in Blue Mesa), reservoir level decrease can increase light availability and wind-driven turbulence and sediment resuspension that may lead to increased nutrient concentrations (refer to Kann and Walker, 2020, and references therein). Boats are also capable of impairing water quality in shallow water bodies by resuspending sediment and nutrients from the lake bottom (Daeger and others, 2022). Finally, in shallow lakes, mixing can cause recruitment of cyanobacteria from sediments to the water column, which can promote algal blooms (Karlsson-Elfgren and Brunberg, 2004; Carey and others, 2014).
Correlations between reservoir level and water temperature, Secchi depth, and phosphorus in Iola basin were also examined (fig. 18B). Reservoir level and temperature had a weak positive relation (r=0.056), though temperatures were noticeably related to reservoir level in 2021 and 2022, when reservoir levels were extremely low, indicating there may be different controls on temperature when reservoir levels are higher. In contrast, King and others (2025) determined an inverse relation between remotely sensed summer water temperature and mean summer reservoir level for 2000–23, indicating that reservoir levels below mean had water temperatures above the mean. Again, the different correlations herein compared to King and others (2025) may be due to the differences in areal extent (satellite-generated data representing entire basins), consistency in data collection timing (satellite measurements made at same time of day), or number of data points (satellites having many more data points) between the datasets.
The correlation between phosphorus and reservoir level was negative (r=−0.664), indicating that phosphorus concentrations increased at lower reservoir levels. This relation was especially driven by data from 2021 and 2022, where extremely low reservoir levels (the lowest levels since 1984; Bureau of Reclamation, 2024) were observed with phosphorus concentrations around 0.075 mg/L. This negative relation could be caused by evapoconcentration, or input of less dilute water from tributaries during low-flow years. Accordingly, when phosphorus concentrations were normalized to calcium concentrations for each sample to account for evapoconcentration (fig. 18B), the negative relation with reservoir level persisted (r=−0.526), indicating that something beyond evapoconcentration accounts for the relation. Furthermore, at elevations less than about 7,470 ft, the slope between phosphorus concentrations and reservoir level flattens to where small declines in reservoir levels are associated with large increases in phosphorus (fig. 18B). Similar patterns are noted for chlorophyll-a (fig. 18A) and Secchi depth (fig. 18B).
A potential explanation for elevated phosphorus levels at low reservoir levels is that total phosphorus simply represents phosphorus contained in the increased amounts of phytoplankton (all taxa represented on fig. 7) present during that time. In other words, the total phosphorus is largely a result of the algal blooms not the cause (Lewis and Wurtsbaugh, 2008). To investigate this possibility, total biovolume from the algal taxonomy samples (Qi and others, 2025) was used to compute phosphorus concentration in phytoplankton (TPphy). The biovolume (cubic centimeter per liter) was multiplied by the mean density of cyanobacteria of 870 milligrams per cubic centimeter (milligrams/centimeter3) reported by (Hu, 2014) yielding the cyanobacteria concentration in milligrams per liter. This concentration of cyanobacteria was converted to the phosphorus concentration of algae by using the mean molar ratio of C:N:P in algal tissue of 225:26:1 estimated for large freshwater lakes (table 2 in Sterner and others, 2008) to estimate the mass ratio of phosphorus to the sum of carbon, nitrogen, and phosphorus (31 to 3,097) in algae. This calculation is an estimate as the C:N:P stoichiometry for Blue Mesa is not known. Sterner and others (2008) showed the freshwater lake stoichiometry varying by as much as about a factor of 2 because of scale- and location-dependent biogeochemical processes. Further, other density estimates for green algae in Hu (2014) are lower (by less than a factor of two) than the estimate for cyanobacteria (870 milligrams/centimeter3). Thus, the TPphy estimates for deeper samples where noncyanobacteria phytoplankton dominated (fig. 7), may be biased slightly high.
The results for samples having algal taxonomy and total phosphorus analysis at all depths in 2021 and 2022 indicated that estimated TPphy is similar to measured total phosphorus in Iola basin and less than measured total phosphorus in Cebolla and Sapinero basins (fig. 19). This result indicates that phytoplankton-rich particulate matter dominates total phosphorus in Iola basin, whereas in Cebolla and Sapinero basins, total phosphorus is likely dominated by dissolved and particulate inorganic phosphorus. Total phosphorus and TPphy increased from Sapinero to Cebolla to Iola basins (from downstream to upstream), consistent with previous results (figs. 12F and 14). These results indicate that the elevated total phosphorus observed in Iola basin during low reservoir levels is likely predominantly phosphorus contained in algal tissue rather than dissolved or inorganic particulate phosphorus in the water column. However, it is still unclear how total phosphorus in algae became so concentrated at low reservoir levels. The phosphorus could be coming from either additional internal (derived within the reservoir basin) or external (for example, streams) phosphorus sources. This study provides no evidence to support increases in external phosphorus sources coincident with the toxic cyanoHABs. Although phosphorus could be released from reservoir sediment, Iola basin does not develop anerobic conditions at the sediment interface (fig. 7) that could promote phosphorus release (Dillon and Molot, 2024). Alternately, the algae may take up phosphorus from various depths in the water column as they grow then eventually rise to the surface where they form dense blooms and concentrate phosphorus. This phenomenon, often associated with cyanobacterial blooms, is due to the ability of the cyanobacteria ability to regulate their buoyancy, allowing them to float to the surface and accumulate (Walsby, 1994). Finally, because Iola basin is much shallower than Cebolla and Sapinero basins, low reservoir levels may create conditions with warmer temperatures, greater sunlight penetration, slower flowing water, and recruitment of cyanobacteria from bottom sediment—all of which favor growth of cyanobacteria (Graham and others, 2017; Reinl and others, 2021) but are not evaluated in detail herein due to lack of specific data. Ultimately, processes causing the elevated phosphorus concentrations in Iola basin at low reservoir levels are not entirely resolved by this study.
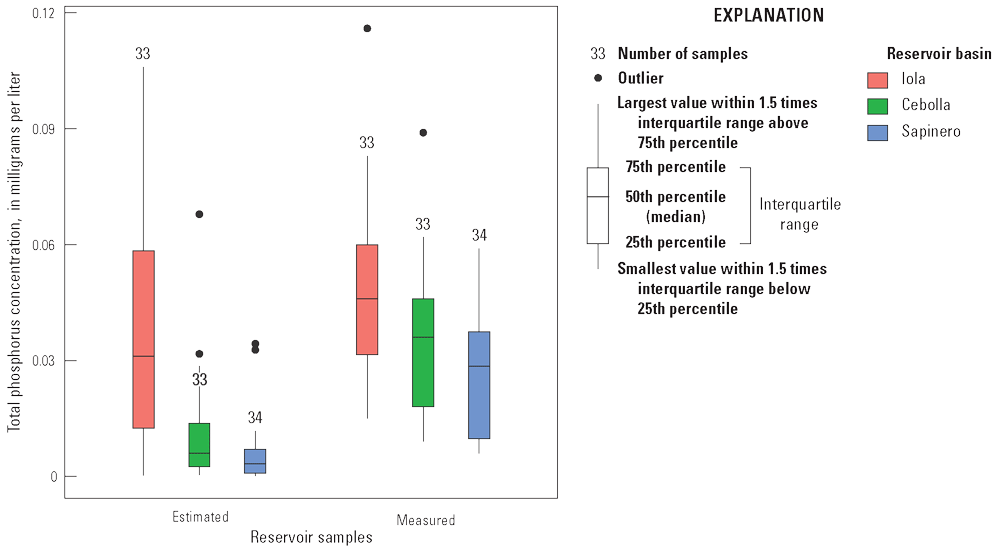
Boxplot comparing total phosphorus concentration in phytoplankton estimated using total biovolume from the taxonomy results to total phosphorous concentrations measured in water samples collected in Blue Mesa Reservoir in 2021–22.
Potential Causes of Harmful Algal Blooms
Factors that may contribute to increased occurrence of HABs include water depth, increased nutrient availability, and increased temperature (Burch and others, 2021; Xiao and others, 2024; Hoffman and others, 2025). Findings from this multiyear study indicate that the effects caused by low reservoir levels (and resultant shallow depth) and water temperature, may be the dominant controls on the occurrence of toxic cyanoHABs in Iola basin. An assessment of existing long-term data (2001–23) indicates that water-quality conditions have indicated increasing occurrence of cyanoHABs during varying timescales. Chlorophyll-a concentrations and trophic state indicators have increased in all three basins but especially in Iola basin, with noticeably higher concentrations and hypereutrophic conditions during the two low reservoir level years 2021 and 2022. Low reservoir levels in 2018 and 2020–22 were caused by a combination of drought, which caused decreased snowpack and streamflow to the reservoir (notably in the Gunnison River [USGS, 2024a], the largest source of water to Blue Mesa) and released outflow that was greater than inflow in multiple recent years (table 3) (Bureau of Reclamation, 2025).
This study found no evidence of increasing nutrient concentrations or loads into Iola basin in the Gunnison River (table 5). Nonetheless, total phosphorus has been increasing in Iola and Cebolla basins since 2001, and the pattern is particularly pronounced during the low reservoir level years of 2021–22 (fig. 18B) when these high total phosphorus concentrations are likely mostly phosphorus in algae (fig. 19). Despite the lack of trends for inflowing phosphorus, some streams flowing into Blue Mesa along the north side have concentrations greater than the state of Colorado water-quality standard concentration for total phosphorus (0.11 mg/L, fig. 17; CDPHE, 2024a). These north-side tributaries occur where the dominant geology is volcanic rocks, and there is no agriculture (fig. 4). These volcanic rocks and another phosphorus-rich rock unit, an alkalic intrusion in Cebolla Creek, have phosphorus concentrations that exceed crustal mean (up to 10 times) indicating a likely geogenic, rather than anthropogenic source for elevated phosphorus in these creeks (table 6). In addition, seeps present during extreme low reservoir level on the exposed reservoir bottom on the north side of Iola had elevated nutrient concentrations and detections of pharmaceutical compounds, potentially indicating a point source of wastewater, like the upstream RV park, to the seeps. Estimated loads of nitrogen species and total phosphorus from these seeps are hundreds of times lower than loads in the Gunnison River and thus do not represent a substantial source of nutrients to Blue Mesa overall. Their role in contributing to or triggering cyanoHABs in Iola basin is unknown.
This study determined substantial effect of low reservoir levels on increasing TSI–CHLa and TSI–SD in Iola basin. When reservoir level is less than about 7,470 ft (or about 49 ft below maximum reservoir level), small changes in reservoir level resulted in large changes in total phosphorus and chlorophyll-a concentrations. The years having toxic cyanoHABs during this study had differing onsets and duration of reservoir levels below 7,470 ft. In 2018, 2021, and 2022, the reservoir level of 7,470 ft occurred in July or earlier and remained below this threshold as reservoir levels continued to decline throughout the growing season (fig. 5). In 2020, the reservoir level of 7,470 ft was reached in September as reservoir levels continued to decline (fig. 5). It is likely that the timing and duration of reservoir level decline relative to the reservoir level of 7,470 ft are also important in the development of the algal blooms, though presently there are insufficient data to evaluate this aspect.
Factors during low reservoir level that likely contribute to the toxic cyanoHABs in Iola basin include (1) warmer water temperatures in extensive near-shore shallow areas, (2) more extensive stagnant water zones, and (or) (3) recruitment of cyanobacteria from bottom sediments during mixing (fig. 20B compared to fig. 20A). Ultimately, although the exact role of total phosphorus is not entirely understood, it is important to note that at reservoir levels below about 7,470 ft, algal blooms in Iola basin are exacerbated; however, additional data about the role of the timing and duration of low reservoir levels could help refine this hypothesis.
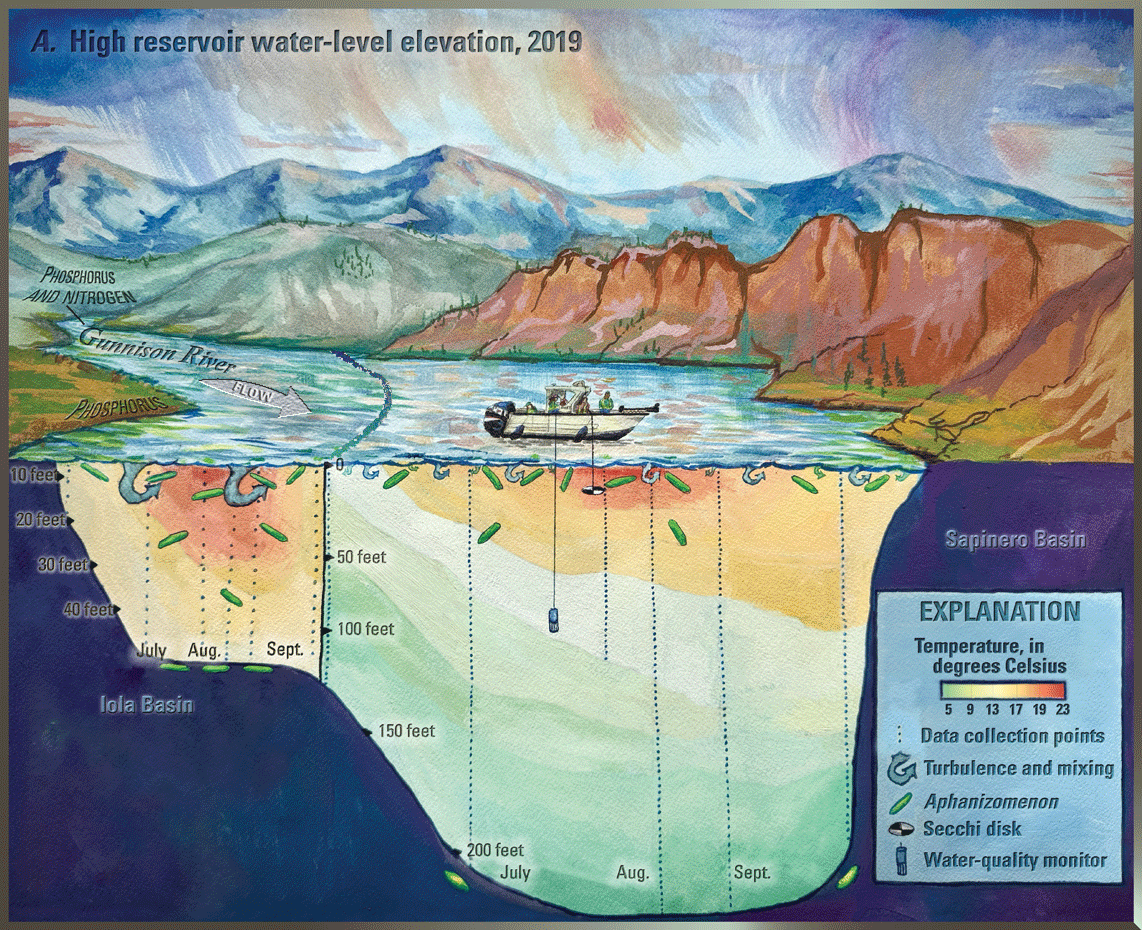
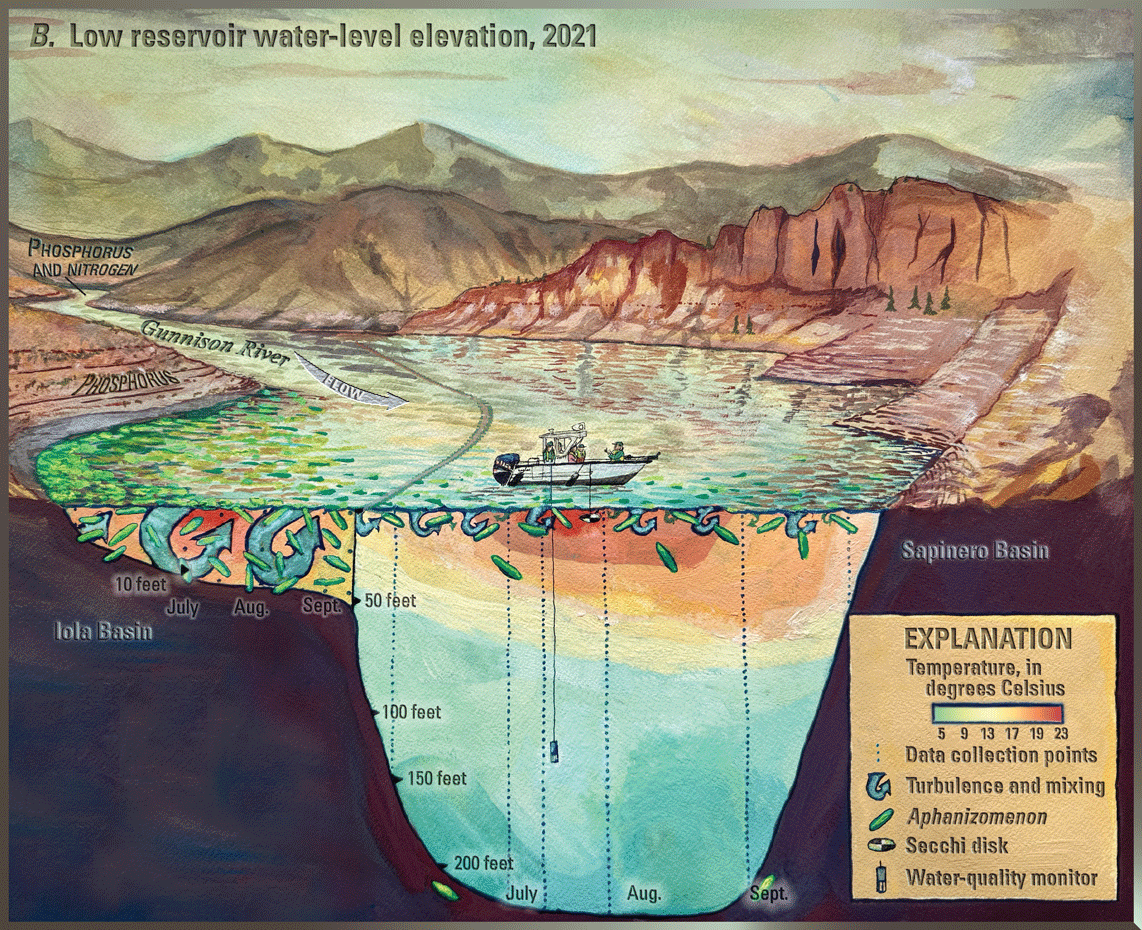
Conceptual diagram contrasting water temperature profiles (fig. 8A), algal abundance, and turbulence during high and low reservoir water-level elevations. A, High reservoir levels in 2019 when turbulent conditions in bottom sediment are limited to nonexistent. B, Low reservoir water-level elevations in 2021 when warm, shallow water and resulting turbulence driven by wind and boats within Iola basin potentially causes recruitment of cyanobacteria from bottom sediment contributing to toxic cyanobacteria harmful algal blooms. Artwork by Benjamin Siebers, U.S. Geological Survey.
This study also determined statistically significant upward trends in air temperature (1970–2023) and Blue Mesa water temperature (2001–23). A companion study also indicated significant upward trends in remotely sensed water temperature in all basins of Blue Mesa (King and others, 2025). During 2001–23, chlorophyll-a concentrations increased by 5 µg/L, perhaps in response to warming temperatures. Together, results from this study indicate that drivers for toxic cyanoHABs in Iola basin are primarily decreased reservoir levels and resulting warmer water temperatures. Because of its shallow depth, the effect of low reservoir levels may disproportionately affect Iola basin compared to other basins, resulting in algal blooms and toxin production especially at reservoir levels below about 7,470 ft. In addition, increasing air and water temperatures may play a role over several decades.
Potential Management Strategies for Cyanobacteria Harmful Algal Blooms
This report indicates that potential drivers for recent toxic cyanoHABs in Iola basin are low reservoir levels that likely cause favorable conditions for algal growth and increased recruitment of algae from bottom sediments such as during wind-driven turbulence. In addition, increasing air and water temperatures may play a role over several decades. Because long-term air temperature trends are external to Blue Mesa and not subject to local control, potential management targets include reservoir levels and methods to directly interrupt the cyanobacteria life cycle. Nutrient controls are also discussed because ultimately nutrient availability supports the algal blooms, even if there is no strong evidence herein that upward trends in nutrients caused the 2018–23 cyanoHABs. Additionally, the results of the companion report (King and others, 2025) are summarized here to illustrate the potential for remote sensing to help manage algal blooms.
One strategy to potentially help avoid or minimize the occurrence of cyanoHABs in Blue Mesa could involve efforts to maintain reservoir levels as high as possible during the growing season. The reservoir level elevation of about 7,470 ft (about 49 ft below full) may be a threshold above which toxic cyanoHABs are minimized. When reservoir level is less than about 7,470 ft, small changes in reservoir level result in large changes in phosphorus concentrations (fig. 18B), chlorophyll-a (fig. 18A), and Secchi depth (fig. 20B) most likely indicating increased total phosphorus in the increased biomass of the bloom (represented by increased chlorophyll-a and decreased visibility). Thus, managing reservoir levels might limit HABs for reasons that are not completely understood herein but include minimizing (1) warmer temperatures in extensive near-shore shallow areas and (or) (2) recruitment of cyanobacteria from bottom sediments during mixing enhanced by shallow conditions (fig. 20). The hypothesis, that there could be a threshold reservoir level that would inhibit development of toxic cyanoHABs, is based on limited data from years having low reservoir levels, and more data at additional reservoir levels could help support this conclusion. The longer period of seasonal sampling (into late September and October) during 2021–23 allowed acquisition of more data during the time when toxic cyanoHABs occurred. It might be worth considering shifting continued data acquisition from June through August to August through October to acquire more data when algal blooms in Blue Mesa are potentially most severe. In addition, this study potentially indicated that continuous monitoring of water-quality properties, particularly fluorescence of phycocyanin, pH, and DO, could provide an early warning of the onset of toxic algal blooms. Additional monitoring of this type with co-located algal toxin sampling could help investigate the potential benefit of implementation of this strategy.
Techniques that address controlling HABs directly, include biocides (for example, copper-containing compounds or hydrogen peroxide) or other techniques that disrupt the algal life cycle such as ultrasound (Burch and others, 2021). The potential for success of these techniques in Blue Mesa is not known and outside the scope of this study, but worth mentioning.
Management of external and internal nutrient sources to reservoirs is a long-standing strategy to help minimize eutrophication and algal blooms (Cooke and others, 2005). The likely success of strategies to reduce either nitrogen or phosphorus in Blue Mesa is not known; however, this study has indicated that there are no trends in external sources of nutrients to Blue Mesa to explain the recent (2018–23) increased occurrence of toxic cyanoHABs. In addition, in Blue Mesa, there is a nearly unlimited source of phosphorus in the surrounding volcanic rocks that could render any attempt at phosphorus control ineffective. Finally, the cyanobacteria that dominate the phytoplankton community are capable of fixing nitrogen from the atmosphere and thus are not dependent on external sources of nitrogen to sustain algal growth, indicating that controls on external nitrogen sources might have little effect on the toxic cyanoHABs. This study determined that seeps present during extreme low reservoir level on the exposed reservoir bottom on the north side of Iola had elevated nutrient concentrations and detections of pharmaceutical compounds, potentially indicating a point source of wastewater, like the upstream RV park, to the seeps. Sources such as these may be targets for management strategies. However, the role of input from these seeps to bloom location or initiation is not known.
Remote-Sensing Data to Monitor Algal Blooms
Remote sensing is a potentially powerful and cost-effective tool that can be used by reservoir managers to detect the onset and progression of algal blooms including potentially HABs. As described in the “Concurrent Investigation” section, a companion report used data collected in this study to construct chlorophyll-a maps from satellite remote-sensing data (King and others, 2025). These maps show chlorophyll-a concentrations throughout the entire reservoir and expand upon spatial and temporal interpretations possible using only the discrete data. The maps in figure 21 show changes in mapped chlorophyll-a concentrations during the summers of 2021, a low reservoir level year, and 2023, a high reservoir level year. Toxic cyanoHABs in 2021, as represented by chlorophyll-a greater than the CDPHE standard concentration of 8 µg/L (table 4), appear in Iola basin earliest in summer, then the algal bloom expands westward to Cebolla and Sapinero basins (King and others, 2025). By comparison, in the high reservoir level year (2023), there are no blooms apparent during the summer (fig. 21). Information on the maps can be summarized to show more detail on timing and areal extent of concentration ranges, (for example, in Iola basin, fig. 22). In figure 22, the total bar height reflects the number of pixels identified as water within a given satellite image. Because a concentration of 0 µg/L is included in the lowest bin (0 to less than 4 µg/L), variation in total bar height between images reflects interference from clouds as well as variations in lake surface area owing to changing reservoir level. This information generally indicates greater areal extent of algae at greater chlorophyll-a concentrations in low reservoir level years (2018, 2020–22) than high reservoir level years (fig. 5). The exception is a larger areal extent of chlorophyll-a in Iola basin in 2019. The satellite estimates indicate algal blooms during September 2019 despite September reservoir levels being the highest observed for 2018 through 2023 (fig. 5). The elevated chlorophyll-a concentration estimate with satellite imagery in the fall of 2019 is supported by a relatively high (23 µg/L) chlorophyll-a concentration in a sample collected at 3.3-ft depth in Iola basin on September 19, 2019 (fig. 12B). Despite the high chlorophyll-a satellite and in situ levels, cyanotoxins were below detection in fall of 2019 (fig. 6) and total phosphorus concentrations were low in September (fig. 12F). Without additional discrete chlorophyll-a measurements and algal taxonomy data in September 2019, it is not known whether the satellite model was perhaps affected by a factor other than chlorophyll-a, if the algal boom was dominated by taxa other than cyanobacteria, or if the bloom was dominated by cyanobacteria that did not produce cyanotoxins. This result does not conflict with the observation that toxic cyanoHABs occur during years having low reservoir levels but points out that nontoxin-producing algal blooms may also occur during high reservoir level years for reasons not yet understood.
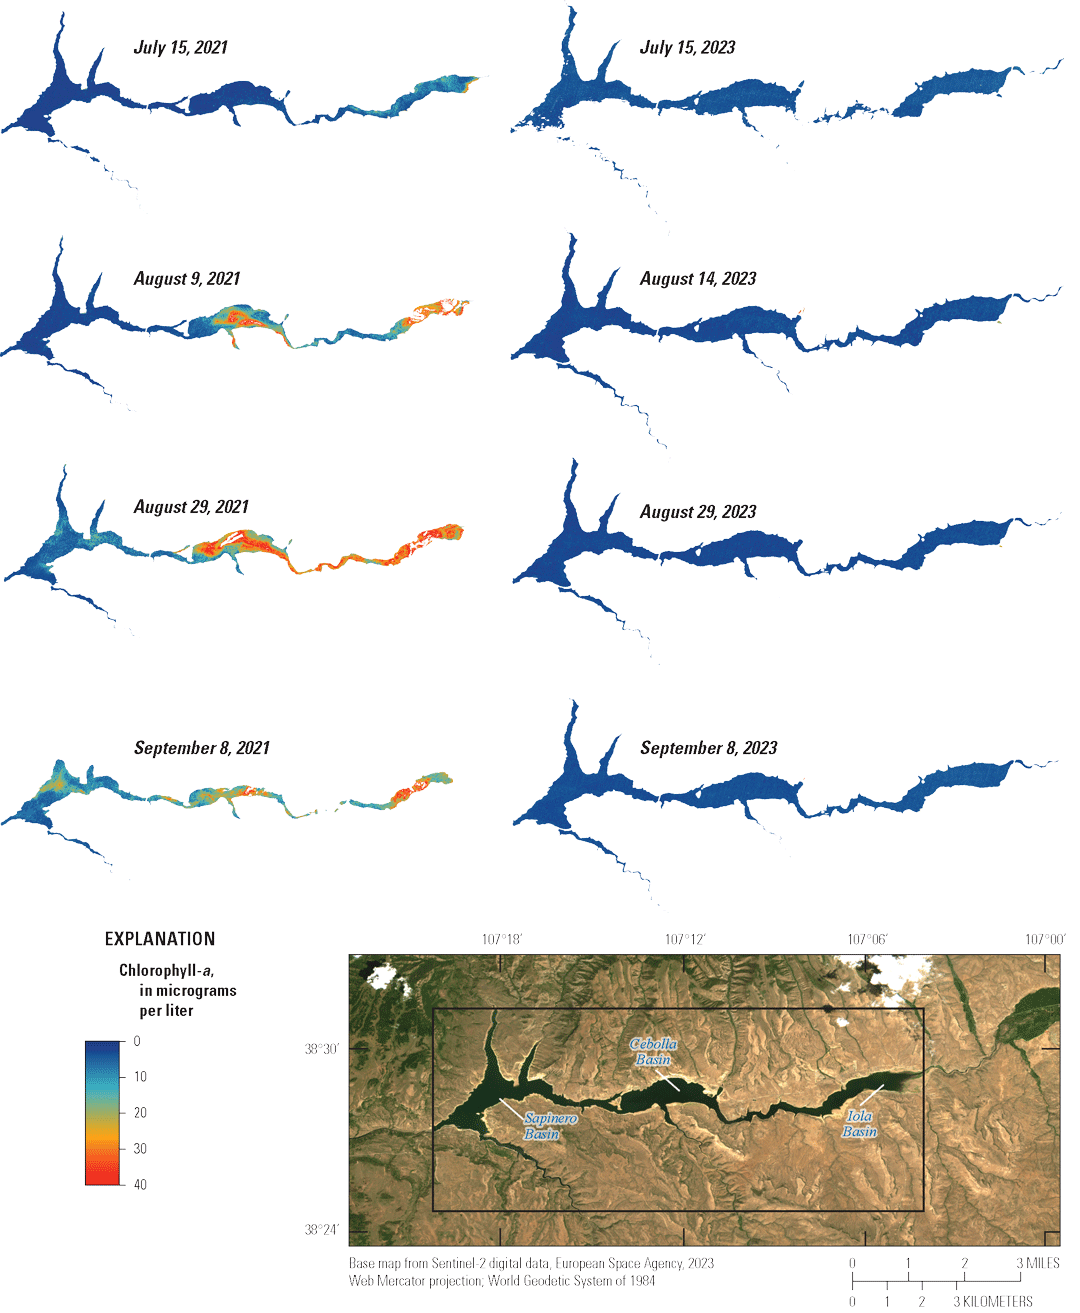
Maps showing progression of remotely sensed, estimated chlorophyll-a concentrations in 2021 and 2023 from July to September for Blue Mesa Reservoir, Colorado. Adapted from King and others (2024, 2025).
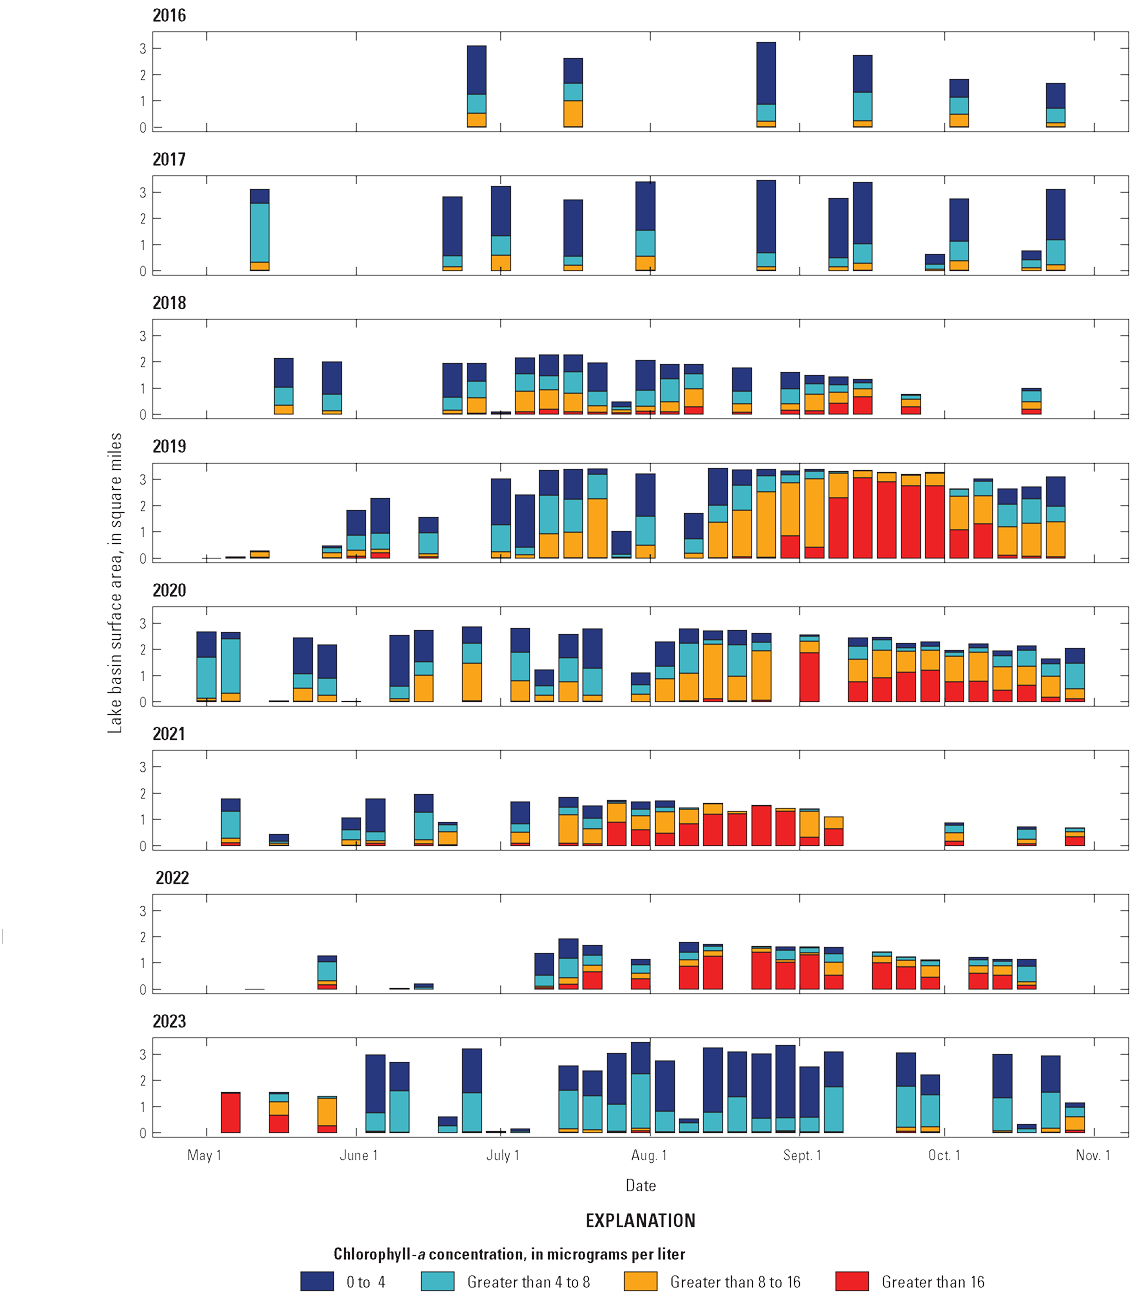
The areal extent of satellite-mapped chlorophyll-a concentration bins in Iola basin for each cloud-free satellite pass for May to October for each year during 2016–23. Data from King and others (2024).
Summary
Blue Mesa Reservoir (hereafter referred to as “Blue Mesa”) is the largest storage reservoir in Colorado and is part of the Curecanti National Recreation Area managed by the National Park Service. Blue Mesa consists of three distinct reservoir basins: Iola basin (the shallowest), and Cebolla and Sapinero basins. After the first documented toxic algal bloom occurred in Iola basin in 2018, the U.S. Geological Survey in cooperation with the National Park Service, Colorado River Water Conservation District, Upper Gunnison River Water Conservancy District, Gunnison County, Project 7 Water Authority, and Uncompahgre Valley Water Users Association began a study combining water-quality and biological data from 2021 to 2023 collected as part of this study with longer term water-quality, climate, and hydrologic data (from as early as 1970 through 2023) to better understand occurrence of toxic cyanobacteria harmful algal blooms (toxic cyanoHABs) and identify possible causal mechanisms to potentially inform management strategies.
Owing to a combination of low snowpack, drought, and reservoir operations, reservoir water-level elevations (hereafter referred to as “reservoir levels”) during 2018 and from 2020 to 2022 were below the 30-year growing season (July–September) average, and reservoir levels in 2021 and 2022 were the lowest since 1984. Toxic cyanoHABs occurred when the algal toxin microcystin exceeded a warning concentration of 8 micrograms per liter, which happened primarily in Iola basin in 2018 and from 2020 to 2022, coincident with the years having the lowest reservoir levels. The duration of toxin detections above the warning concentration varied among years but typically started in early to mid-September and continued through the fall months. Algal abundance was greatest in Iola basin compared to Cebolla and Sapinero basins, and was dominated by Aphanizomenon, a toxin-producing cyanobacterium. Phytoplankton community composition in Cebolla and Sapinero basins was different, being mostly dominated by nontoxin-producing cyanobacteria, although toxin-producing cyanobacteria occasionally were dominant in some surface samples. Because Aphanizomenon is the dominant taxa in Blue Mesa, it is likely the main source of microcystin detected in the reservoir.
From 2018 to 2023, Cebolla and Sapinero basins were consistently stratified with respect to water temperature, dissolved oxygen (DO), and pH, whereas Iola, the shallowest basin, was not. During 2016–23, Iola basin had greater near surface maximum water temperatures, pH (as high as 9.5), and DO concentrations (greater than 11.5 milligrams per liter) than Cebolla and Sapinero basins. The elevated pH and DO are due to enhanced photosynthesis in Iola basin, consistent with the greater abundance of algae. In 2022, continuous monitor data in Iola basin showed peaks in phycocyanin fluorescence, pH, and DO concentration that preceded the onset of toxic cyanoHABs by about 2 weeks, indicating potential utility for this type of monitoring to provide early warning for future response to toxic cyanoHABs.
During 2018–23, chlorophyll-a concentrations and trophic state indices based on chlorophyll-a, Secchi disk depth, and total phosphorus indicated more productive conditions and higher trophic state in Iola basin compared to Cebolla and Sapinero basins. During 2021–22, years having the longest periods of toxic cyanoHABs and the lowest recorded reservoir levels, the trophic state indices indicated hypereutrophic conditions in Iola basin at some points in each year. Additionally, comparison of different trophic state indices and low total nitrogen to total phosphorus ratios indicated that the reservoir is nitrogen limited and that turbidity is dominantly from algae and cyanobacteria, rather than suspended sediment.
Long term climatic, hydrologic, and water-quality trends were examined as potential drivers of algal blooms in the reservoir. Trend analysis showed increases in mean air and surface-water temperatures and chlorophyll-a concentrations in the reservoir and a slight decrease in streamflow at the Gunnison River at County Road 32 below Gunnison, Colorado, (USGS site 383103106594200) during 1980–2023, which is the primary tributary to Blue Mesa. Increases in chlorophyll-a concentration were detected in all three basins and small upward trends in total phosphorus in Iola and Cebolla basins were detected during 2001–23. Upward trends in air and water temperatures coincident with the upward trends in chlorophyll-a may indicate long-term increasing air temperatures have increased productivity in the reservoir.
Upward trends were not detected in nutrients concentrations and loads in the major tributaries to Blue Mesa indicating nutrient inputs into the reservoir have not changed substantially during the past two decades. However, phosphorus concentrations were elevated in multiple tributaries on the north and south sides of Iola and Cebolla basins where there is no agricultural land use. These streams drain volcanic and intrusive rocks that are enriched as much as 10 times crustal abundance in phosphorus, indicating natural weathering processes may be the dominant source of external phosphorus to Blue Mesa. Two seeps on the north shore of Iola basin that were exposed during low reservoir levels had elevated nutrient concentrations and pharmaceutical compounds diagnostic of wastewater. Estimated nutrient loads in the seeps were small compared to loads in the Gunnison River. The extent to which these seeps contributed to development of algal blooms in Blue Mesa is not known.
In Iola basin, reservoir level was positively correlated with Secchi depth and inversely correlated with total phosphorus concentrations. Data indicate that below a potential threshold reservoir level of about 7,470 feet (ft) above North American Vertical Datum of 1988, the trophic state index based on chlorophyll-a was always high. Elevated phosphorus at low reservoir level likely was primarily phosphorus contained in algal tissue. Because Iola basin is much shallower than Cebolla and Sapinero basins, low reservoir levels may create conditions favorable for algal growth and for recruitment of cyanobacteria from bottom sediments which may be enhanced by wind-driven turbulence. However, additional data could help better understand how the timing and duration of reservoir levels below 7,470 ft contribute to toxic cyanoHABs.
Although the exact role of total phosphorus is not entirely understood, it is important to note that at reservoir levels below about 7,470 ft, algal blooms are exacerbated. Moreover, the role of nutrients in controlling cyanoHABS in Blue Mesa is complicated. Not only does the dominant cyanobacteria Aphanizomenon fix nitrogen from the atmosphere, but phosphorus is plentiful in Blue Mesa owing to weathering of the volcanic and intrusive bedrock, which may indicate nutrients are not the main factor triggering algal blooms.
This report indicates that potential drivers for recent toxic cyanoHABs in Iola basin are low reservoir levels that likely cause favorable conditions for algal growth and increased recruitment of algae from bottom sediments such as during wind-driven turbulence. In addition, increasing air and water temperatures may play a role over several decades. Control of external nutrients is unlikely to be successful in Blue Mesa because of the ability of Aphanizomenon to fix nitrogen, and abundant geogenic phosphorus in the watershed. Maintenance of reservoir water-level elevation greater than about 7,470 ft could help minimize the occurrence of toxic cyanoHABs; however, processes causing the elevated phosphorus levels and increased occurrence of toxic cyanoHABs in Iola basin at low reservoir levels are not entirely resolved by this report and remain potential avenues for additional investigation.
References Cited
Backer, L.C., Manassaram-Baptiste, D., LePrell, R., and Bolton, B., 2015, Cyanobacteria and algae blooms—Review of health and environmental data from the Harmful Algal Bloom-Related Illness Surveillance System (HABISS) 2007–2011: Toxins, v. 7, no. 4, p. 1048–1064, accessed July 7, 2023, at https://doi.org/10.3390/toxins7041048.
Bauch, N.J., and Malick, M., 2003, Limnology of Blue Mesa, Morrow Point, and Crystal Reservoirs, Curecanti National Recreation Area, during 1999, and a 25-year retrospective of nutrient conditions in Blue Mesa Reservoir, Colorado: U.S. Geological Survey Water-Resources Investigations Report 02–4199, 101 p., accessed December 12, 2024, at https://pubs.usgs.gov/wri/wri024199/pdf/WRIR02-4199.pdf.
Bergström, A.K., 2010, The use of TN:TP and DIN:TP ratios as indicators for phytoplankton nutrient limitation in oligotrophic lakes affected by N deposition: Aquatic Sciences, v. 72, no. 3, p. 277–281, accessed January 3, 2025, at https://doi.org/10.1007/s00027-010-0132-0.
Bernard, C., Ballot, A., Thomazeau, S., Maloufi, S., Furey, A., Mankiewicz-Boczek, J., Pawlik-Skowrońska, B., Capelli, C., and Salmaso, N., 2016, Cyanobacteria associated with the production of cyanotoxins, in Meriluoto, J., Spoff, L., and Codd, G.A., eds., Handbook of cyanobacterial monitoring and cyanotoxin analysis: Chichester, West Sussex, John Wiley and Sons, p. 501–525, accessed October 11, 2024, at https://doi.org/10.1002/9781119068761.app2.
Beversdorf, L.J., Miller, T.R., and McMahon, K.D., 2013, The role of nitrogen fixation in cyanobacterial bloom toxicity in a temperate, eutrophic lake: PLoS One, v. 8, no. 2, p. e56103, accessed December 11, 2024, at https://doi.org/10.1371/journal.pone.0056103.
Blackwell, R.J., and Boland, D.H.P., 1979, Trophic classification of Colorado Lakes: Jet Propulsion Laboratory Publication 78-100, prepared for National Aeronautics and Space Administration and U.S. Environmental Protection Agency, 210 p., accessed January 8, 2025, at https://ntrs.nasa.gov/api/citations/19790014420/downloads/19790014420.pdf.
Booth, M.,, 2021, Three Colorado River Basin reservoirs will be partially drained to keep Lake Powell producing hydropower: The Colorado Sun, July 19, 2021, accessed August 21, 2024, at https://coloradosun.com/2021/07/19/lake-powell-drought-blue-mesa-reservoir-drained/.
Britton, L.J., and Wentz, D.A., 1980, Characteristics of selected lakes and reservoirs in Colorado: U.S. Geological Survey Open-File Report 80–436, 139 p., accessed January 13, 2025, at https://doi.org/10.3133/ofr80436.
Brown, J.B., and Thoma, D.P., 2012, Assessment of total nitrogen and total phosphorus in selected surface water of the National Park Service Northern Colorado Plateau Network, Colorado, Utah, and Wyoming, from 1972 through 2007: U.S. Geological Survey Scientific Investigations Report 2012–5043, 112 p., accessed November 27, 2024, at https://doi.org/10.3133/sir20125043.
Burch, M., Brookes, J., and Chorus, I., 2021, Assessing and controlling the risk of cyanobacterial blooms, Waterbody conditions, chap. 8 of Chorus, I., and Welker, M., eds., Toxic Cyanobacteria in water (2d ed.): Boca Raton, Florida, CRC Press, on behalf of the World Health Organization, p. 505–562, accessed September 17, 2025, at https://doi.org/10.1201/9781003081449.
Bureau of Reclamation, 2012, Aspinall unit operations—Final environmental impact Statement, volume 1: Grand Junction, Colo., Bureau of Reclamation, 289 p., accessed July 22, 2025, at https://www.usbr.gov/uc/envdocs/eis/AspinallEIS/Final%20Volume%20I.pdf.
Bureau of Reclamation, 2021, Reclamation’s July 24-Month Study implements contingency operations in the Upper Colorado River Basin, News and multi-media webpage: Bureau of Reclamation website, accessed November 14, 2024, at https://www.usbr.gov/newsroom/news-release/3917.
Bureau of Reclamation, 2024, Hydrologic database access portal for HydroData: Bureau of Reclamation website, accessed May 1, 2024, at https://www.usbr.gov/uc/water/hydrodata/.
Bureau of Reclamation, [2025], Colorado River Basin—Drought response operations agreement: Bureau of Reclamation website, accessed January 30, 2025, at https://www.usbr.gov/ColoradoRiverBasin//dcp/droa.html.
Carey, C.C., Ewing, H.A., Cottingham, K.L., Weathers, K.C., Thomas, R.Q., and Haney, J.F., 2012, Occurrence and toxicity of the cyanobacterium Gloeotrichia echinulata in low-nutrient lakes in the northeastern United States: Aquatic Ecology, v. 46, no. 4, p. 395–409, accessed August 21, 2024, at https://doi.org/10.1007/s10452-012-9409-9.
Carey, C.C., Weathers, K.C., Ewing, H.A., Greer, M.L., and Cottingham, K.L., 2014, Spatial and temporal variability in recruitment of the cyanobacterium Gloeotrichia echinulata in an oligotrophic lake: Freshwater Science, v. 33, no. 2, p. 577–592, accessed September 26, 2025, at https://doi.org/10.1086/675734.
Carlson, R.E., 1977, A trophic state index for lakes: Limnology and Oceanography, v. 22, no. 2, p. 361–369, accessed August 21, 2024, at https://doi.org/10.4319/lo.1977.22.2.0361.
Carlson, R.E., and Havens, K.E., 2005, Simple graphical methods for the interpretation of relationships between trophic state variables: Lake and Reservoir Management, v. 21, no. 1, p. 107–118, accessed November 21, 2024, at https://doi.org/10.1080/07438140509354418.
Carlson, R.E., and Simpson, J., 1996, A coordinator’s guide to volunteer lake monitoring methods: North American Lake Management Society, 96 p., accessed January 13, 2025, at https://files.knowyourh2o.com/pdfs/CGVLMM.pdf.
Carmichael, W.W., 2001, Health effects of toxin-producing cyanobacteria—“The CyanoHABs”: Human and Ecological Risk Assessment, v. 7, no. 5, p. 1393–1407, accessed July 7, 2023, at https://doi.org/10.1080/20018091095087.
Chorus, I., and Welker, M., 2021a, Introduction, chap. 1 of Chorus, I., Welker M., eds., Toxic Cyanobacteria in Water, 2nd edition. CRC Press, Boca Raton, FL, on behalf of the World Health Organization, accessed November 18, 2024, at https://doi.org/10.1201/9781003081449.
Chorus, I., and Welker, M., eds., 2021b, Toxic cyanobacteria in water (2d ed.): Boca Raton, Florida, CRC Press, on behalf of the World Health Organization, accessed November 18, 2024, at https://doi.org/10.1201/9781003081449.
Christensen, V.G., Crawford, C.J., Dusek, R.J., Focazio, M.J., Fogarty, L.R., Graham, J.L., Journey, C.A., Lee, M.E., Larson, J.H., Stackpoole, S.M., Mazzei, V., Pindilli, E.J., Rattner, B.A., Slonecker, T., McSwain, K.B., Reilly, T.J., and Lopez, A.E., 2024, Interdisciplinary science approach for harmful algal blooms (HABs) and algal toxins—A strategic science vision for the U.S. Geological Survey: U.S. Geological Survey Circular 1520, 39 p., accessed November 18, 2024, at https://doi.org/10.3133/cir1520.
Cole, J.J., and Prairie, Y.T., 2024, The inorganic carbon complex, chap. 13 of Cole, I.D., and Smol, J.P., eds., Wetzel’s limnology—Lake and river ecosystems (4th ed.): London, Academic Press, p. 301–323, accessed January 13, 2025, at https://doi.org/10.1016/B978-0-12-822701-5.00013-6.
Colorado Department of Public Health and Environment [CDPHE], 2023, Water Quality Control Commission—Regulation No. 93, Colorado’s section 303(d) list of impaired waters and monitoring and evaluation list: Colorado Water Quality Control Commission, 295 p., accessed January 14, 2025, at https://www.sos.state.co.us/CCR/GenerateRulePdf.do?ruleVersionId=11077&fileName=5%20CCR%201002-93.
Colorado Department of Public Health and Environment [CDPHE], 2024a, Water Quality Control Commission—Regulation No. 31, The basic standards and methodologies for surface water: Colorado Water Quality Control Commission, 278 p., accessed September 17, 2025, at https://www.sos.state.co.us/CCR/GenerateRulePdf.do?ruleVersionId=11749&fileName=5%20CCR%201002-31.
Colorado Department of Public Health and Environment [CDPHE], 2024b, Permits record search: Colorado Department of Public Health and Environment web page, accessed December 31, 2024, at https://cdphe.maps.arcgis.com/apps/webappviewer/index.html?id=82d0cff9cb9b49b8944b9f02f72798da.
Cooke, G.D., Welch, E.B., Peterson, S.A., and Nichols, S.A., 2005, Restoration and management of lakes and reservoirs (3d ed.): Boca Raton, Florida, Taylor and Francis Group, 591 p., accessed January 13, 2025, at https://doi.org/10.1201/9781420032109.
Daeger, A., Nathan, S., Bosch, N.S., and Johnson, R., 2022, Impacts on nutrient and sediment resuspension by various watercraft across multiple substrates, depths, and operating speeds in Indiana’s largest natural lake: Proceedings of the Indiana Academy of Sciences, v. 130, no. 2, p. 112–122, accessed April 9, 2025, at https://lakes.grace.edu/wp-content/uploads/2023/04/Impacts-on-Nutrient-and-Sediment-Resuspension-by-Various-Watercraft-Proceedings-of-the-Indiana-Acad emy-of-Science-2023.pdf
Day, W.C., and Bove, D.J., 2003, Review of the geology of western Colorado, chap. B of Bankey, V., ed., Resource potential and geology of the Grand Mesa, Uncompahgre, and Gunnison (GMUG) National Forests and Vicinity, Colorado: U.S. Geological Survey Bulletin 2213, p. 11–37, accessed January 13, 2025, at https://doi.org/10.3133/b2213.
Day, W.C., Green, G.N., Knepper, D.H., Jr., and Phillips, R.C., 1999, Spatial geologic data model for the Gunnison, Grand Mesa, Uncompahgre National Forests mineral assessment area, southwestern Colorado and digital data for the Leadville, Montrose, Durango, and the Colorado parts of the Grand Junction, Moab, and Cortez 1° × 2° geologic maps: U.S. Geological Survey Open-File Report 99–427, accessed January 13, 2025, at https://doi.org/10.3133/ofr99427.
Deas, M., Laird, J., Tanaka, S., and Dahlgren, R.A., 2024, Geologically-derived nitrogen and phosphorus as a source of riverine nutrients: Earth Critical Zone, v. 1, no .1, accessed December 16, 2024, at https://doi.org/10.1016/j.ecz.2024.100003.
de Figueiredo, D.R., Goncalves, A.M.M., Castro, B.B., Goncalves, F., Pereira, M.J., and Correia, A., 2011, Differential inter- and intra-specific responses of Aphanizomenon strains to nutrient limitation and algal growth inhibition: Journal of Plankton Research, v. 33, no. 10, p. 1606–1616, accessed July 24, 2023, at https://doi.org/10.1093/plankt/fbr058.
Dewitz, J., 2023, National Land Cover Database (NLCD) 2021 products: U.S. Geological Survey data release, accessed August 5, 2024, at https://doi.org/10.5066/P9JZ7AO3.
Dillon, P.J., and Molot, L.A., 2024, The phosphorus cycle, chap. 15 of Jones, I.D., and Smol, J.P., eds., Wetzel’s limnology—Lake and river ecosystems (4th ed.): London, Academic Press, p. 359–425, accessed January 13, 2025, at https://doi.org/10.1016/B978-0-12-822701-5.00015-X.
Esri Inc., 2024, ArcGIS Pro, Version 3.3.2: accessed November 24, 2025, at https://www.esri.com/en-us/arcgis/products/arcgis-pro/overview.
Furlong, E.T., Noriega, M.C., Kanagy, C.J., Kanagy, L.K., Coffey, L.J., and Burkhardt, M.R., 2014, Determination of human-use pharmaceuticals in filtered water by direct aqueous injection–high-performance liquid chromatography/tandem mass spectrometry: U.S. Geological Survey Techniques and Methods, book 5, chap. B10, 49 p., accessed January 17, 2025, as https://doi.org/10.3133/tm5B10.
Furlong, E.T., Batt, A.L., Glassmeyer, S.T., Noriega, M.C., Kolpin, D.W., Mash, H., and Schenck, K.M., 2017, Nationwide reconnaissance of contaminants of emerging concern in source and treated drinking waters of the United States—Pharmaceuticals: Science of the Total Environment, v. 579, p. 1629–1642, accessed January 2, 2025, at https://doi.org/10.1016/j.scitotenv.2016.03.128.
Glibert, P.M., 2017, Eutrophication, harmful algae and biodiversity—Challenging paradigms in a world of complex nutrient changes: Marine Pollution Bulletin, v. 124, no. 2, p. 591–606, accessed January 30, 2025, at https://doi.org/10.1016/j.marpolbul.2017.04.027.
Glibert, P.M., and Burkholder, J.M., 2018, Causes of harmful algal blooms, chap. 1 of Shumway, S.E., Burkholder, J.M., and Morton, S.T., eds., Harmful algal blooms—A compendium desk reference (1st ed.): Hoboken, N.J., John Wiley and Sons, p. 1–38, accessed January 13, 2025, at https://doi.org/10.1002/9781118994672.ch1.
Gorney, R.M., June, S.G., Stainbrook, K.M., and Smith, A.J., 2023, Detections of cyanobacteria harmful algal blooms (cyanoHABs) in New York State, United States (2012–2020): Lake and Reservoir Management, v. 39, no. 1, p. 21–36, accessed November 14, 2024, at https://doi.org/10.1080/10402381.2022.2161436.
Graham, J.L., Dubrovsky, N.M., and Eberts, S.M., 2017, Cyanobacterial harmful algal blooms and U.S. Geological Survey science capabilities (ver 1.1, December 2017): U.S. Geological Survey Open-File Report 2016–1174, 12 p., accessed September 17, 2025, at https://doi.org/10.3133/ofr20161174.
Graham, J.L., Jones, J.R., Jones, S.B., and Clevenger, T.E., 2006, Spatial and temporal dynamics of microcystin in a Missouri reservoir: Lake and Reservoir Management, v. 22, no. 1, p. 59–68, accessed July 12, 2023, at https://doi.org/10.1080/07438140609353884.
Granitto, M., Labay, K.A., and Wang, B., 2024, Alaska Geochemical Database Version 4.0 (AGDB4) including best value data compilations for rock, sediment, soil, mineral, and concentrate sample media: U.S. Geological Survey data release, accessed January 13, 2025, at https://doi.org/10.5066/P14THGQH.
Griffith, A.W., and Gobler, C.J., 2020, Harmful algal blooms—A climate change co-stressor in marine and freshwater ecosystems: Harmful Algae, v. 91, accessed November 18, 2024, at https://doi.org/10.1016/j.hal.2019.03.008.
Hedlund, D.C., and Olson, J.C., 1973, Geologic map of the Carpenter Ridge quadrangle, Gunnison County: Colorado: U.S. Geological Survey Geologic Quadrangle, v. 1070, accessed January 17, 2025, at https://doi.org/10.3133/gq1070.
Helsel, D.R., Hirsch, R.M., Ryberg, K.R., Archfield, S.A., and Gilroy, E.J., 2020, Statistical methods in water resources: U.S. Geological Survey Techniques and Methods, book 4, chap. A3, 458 p., accessed August 21, 2024, at https://doi.org/10.3133/tm4A3.
Hem, J.D., 1985, Study and interpretation of the chemical characteristics of natural water: U.S. Geological Survey Water-Supply Paper 2254, 263 p., accessed January 2, 2025, at https://pubs.usgs.gov/wsp/wsp2254/pdf/wsp2254a.pdf.
Hilldale, R.C., 2019, Blue Mesa Reservoir 2019 sedimentation survey: Bureau of Reclamation, Technical Report No. ENV-2021-019, accessed August 21, 2024, at https://www.usbr.gov/tsc/techreferences/reservoir/BlueMesaReservoir2019SedimentationSurvey_Final508.pdf.
Ho, J.C., and Michalak, A.M., 2020, Exploring temperature and precipitation impacts on harmful algal blooms across continental U.S. lakes: Limnology and Oceanography, v. 65, no. 5, p. 992–1009, accessed August 21, 2024, at https://doi.org/10.1002/lno.11365.
Ho, J.C., Michalak, A.M., and Pahlevan, N., 2019, Widespread global increase in intense lake phytoplankton blooms since the 1980s: Nature, v. 574, no. 7780, p. 667–670, accessed December 8, 2024, at https://doi.org/10.1038/s41586-019-1648-7.
Hoffman, K.K., Deemer, B.R., Lofton, M.E., Gibney, N.D., and Carey, C.C., 2025, Assessing risk for enhanced cyanobacteria, phytoplankton, and pathogens with changes in water level regime with potential application to Lake Powell and Lake Mead—A mixed methods literature review: National Park Service Science Report NPS/SR—2025/226, accessed April 8, 2025, at https://doi.org/10.36967/2307521.
Hu, W., 2014, Dry weight and cell density of individual algal and cyanobacterial cells for algae research and development: University of Missouri-Columbia, Master’s Thesis, 81 p., accessed April 16, 2025, at https://mospace.umsystem.edu/xmlui/bitstream/handle/10355/46477/research.pdf.
Hu, Z., and Gao, S., 2008, Upper crustal abundances of trace elements—A revision and update: Chemical Geology, v. 253, no. 3–4, p. 205–221, accessed January 13, 2025, at https://doi.org/10.1016/j.chemgeo.2008.05.010.
Ibelings, B.W., Kurmayer, R., Azevedo, S.M.F.O., Wood, S.A., Chorus, I., and Welker, M., 2021, Understanding the occurrence of cyanobacteria and cyanotoxins, chap. 4 of Chorus, I., and Welker, M., eds., Toxic cyanobacteria in water: Boca Raton, Forida, CRC Press, p. 213–294, accessed January 13, 2025, at https://doi.org/10.1201/9781003081449.
Ignjatovic, L.R., 1968, Effect of photosynthesis on oxygen saturation: Journal Water Pollution Control Federation, v. 40, no. 5, Research Supplement, p. R151–R161, accessed November 5, 2024, at https://www.jstor.org/stable/25036350.
Isvánovics, V., Shafik, H.M., Présing, M., and Juhos, S., 2000, Growth and phosphate uptake kinetics of the cyanobacterium, Cylindrospermopsis raciborskii (Cyanophyceae) in throughflow cultures: Freshwater Biology, v. 43, no. 2, p. 257–275, accessed July 24, 2023, at https://doi.org/10.1046/j.1365-2427.2000.00549.x.
Jöhnk, K.D., Huisman, J., Sharples, J., Sommeijer, B., Visser, P.M., and Stroom, J.M., 2008, Summer heatwaves promote blooms of harmful cyanobacteria: Global Change Biology, v. 14, no. 3, p. 495–512, accessed July 6, 2023, at https://doi.org/10.1111/j.1365-2486.2007.01510.x.
Kann, J., and Walker, J.D., 2020, Detecting the effect of water level fluctuations on water quality impacting endangered fish in a shallow, hypereutrophic lake using long-term monitoring data: Hydrobiologia, v. 847, no. 8, p. 1851–1872, accessed January 6, 2025, at https://doi.org/10.1007/s10750-020-04215-z.
Karlsson-Elfgren, I., and Brunberg, A.K., 2004, The importance of shallow sediments in the recruitment of anabaena and Aphanizomenon (cyanophyceae): Journal of Phycology, v. 40, p. 831–836, accessed September 19, 2025, at https://doi.org/10.1111/j.1529-8817.2004.04070.x.
Kendall, C., 1998, Tracing nitrogen sources and cycling in catchments, chap. 16 of Kendall, C., and McDonnell, J.J., eds., Isotope tracers in catchment hydrology: Elsevier, Amsterdam, p. 519–576, accessed January 13, 2025, at https://doi.org/10.1016/B978-0-444-81546-0.50023-9.
King, T.V., Bean, R.A., Walton-Day, K., Mast, M.A., Gohring, E.J., Gidley, R.G., Day, N.K., and Gibney, N.D., 2025, Remote sensing of chlorophyll-a and temperature to support algal bloom monitoring in Blue Mesa Reservoir, Colorado: Journal of the American Water Resources Association, v. 61, no. 4, accessed September 17, 2025, at https://doi.org/10.1111/1752-1688.70038.
King, T.V., Mast, M.A., Bean, R.A., and Gohring, E.J., 2024, Remotely sensed and in-situ chlorophyll a and temperature data from Blue Mesa Reservoir, Colorado: U.S. Geological Survey data release, accessed September 17, 2025, at https://doi.org/10.5066/P9XULQAS.
Kitchens, C.M., Johengen, T.H., and Davis, T.W., 2018, Establishing spatial and temporal patterns in microcystis sediment seed stock viability and their relationship to subsequent bloom development in Western Lake Erie: PLoS One, v. 13, no. 11, accessed July 26, 2023, at https://doi.org/10.1371/journal.pone.0206821.
Lewis, W.M., and Wurtsbaugh, W.A., 2008, Control of lacustrine phytoplankton by nutrients—Erosion of the phosphorus paradigm: International Review of Hydrobiology, v. 93, p. 446–465, accessed September 22, 2025, at https://doi.org/10.1002/iroh.200811065.
Li, J., and Dittrich, M., 2019, Dynamic polyphosphate metabolism in cyanobacteria responding to phosphorus availability: Environmental Microbiology, v. 21, no. 2, p. 572–583, accessed July 12, 2023, at https://doi.org/10.1111/1462-2920.14488.
Loftin, K.A., Graham, J.L., Hilborn, E.D., Lehmann, S.C., Meyer, M.T., Dietze, J.E., and Griffith, C.B., 2016, Cyanotoxins in inland lakes of the United States—Occurrence and potential recreational health risks in the EPA National Lakes Assessment 2007: Harmful Algae, v. 56, p. 77–90, accessed July 7, 2023, at https://doi.org/10.1016/j.hal.2016.04.001.
Long, B.A., Cudlip, L.S., and Smith, R.A., 1996, Water quality data analysis and interpretation—Curecanti National Recreation Area: National Park Service, Natural Resource Technical Report 95/68, 149 p., accessed June 5, 2025, at https://npshistory.com/publications/cure/nrtr-95-68.pdf.
Lorenz, D.L., 2014, restrend—an R package for trend estimation in hydrologic data, version 0.4.1: accessed November 14, 2024, at https://code.usgs.gov/water/analysis-tools/restrend.
Lürling, M., Van Oosterhout, F., and Faassen, E., 2017, Eutrophication and warming boost cyanobacterial biomass and microcystins: Toxins, v. 9, p. 64, accessed September 12, 2025, at https://doi.org/10.3390/toxins9020064.
Marcé, R., Gómez-Gener, L., and Carey, C.C., 2024, Oxygen, chap. 11 of Jones, I.D., and Smol, J.P., eds., Wetzel’s limnology—Lake and river ecosystems (4th ed.): London, Academic Press, p. 237–274, accessed January 13, 2025, at https://doi.org/10.1016/B978-0-12-822701-5.00011-2.
Milly, P., and Dunne, C.A., 2020, Colorado River flow dwindles as warming-driven loss of reflective snow energizes evaporation: Science, v. 367, no. 6483, p. 1252–1255, accessed August 21, 2024, at https://doi.org/10.1126/science.aay9187.
Mueller, D.K., Schertz, T.L., Martin, J.D., and Sandstrom, M.W., 2015, Design, analysis, and interpretation of field quality-control data for water-sampling projects: U.S. Geological Survey Techniques and Methods, book 4, chap. C4, 54 p., accessed August 21, 2024, at https://doi.org/10.3133/tm4C4.
Murphy, J., and Sprague, L., 2019, Water-quality trends in US rivers—Exploring effects from streamflow trends and changes in watershed management: Science of the Total Environment, v. 656, p. 645–658, accessed January 13, 2025, at https://doi.org/10.1016/j.scitotenv.2018.11.255.
National Oceanic and Atmospheric Administration, 2024, National Integrated Drought Information System—Colorado: National Oceanic and Atmospheric Administration web page, accessed January 27, 2025, at https://www.drought.gov/historical-information?dataset=0&selectedDateUSDM=20180220&state=Colorado&countyFips=08051.
National Park Service, 2018, Blue Mesa water quality advisory—Toxic algae news release: National Park Service website, accessed August 21, 2024, at https://www.nps.gov/cure/learn/news/pr-18-17.htm.
National Park Service, 2021, Blue Mesa water quality advisory—Toxic algae news release: National Park Service website, accessed August 21, 2024, at https://www.nps.gov/cure/learn/news/toxicalgae.htm.
National Water Quality Monitoring Council, 2024, Water Quality Portal: National Water Quality Monitoring Council website, accessed April 1, 2024, at https://doi.org/10.5066/P9QRKUVJ.
Natural Resources Conservation Service, 2024, Data, tools, and reports available to the public for the Snow Survey and Water Supply Forecasting Program: accessed October, 31, 2024, at https://www.nrcs.usda.gov/programs-initiatives/sswsf-snow-survey-and-water-supply-forecasting-program.
Neilan, B.A., Pearson, L.A., Muenchhoff, J., Moffitt, M.C., and Dittmann, E., 2013, Environmental conditions that influence toxin biosynthesis in cyanobacteria: Environmental Microbiology, v. 15, no. 5, p. 1239–1253, accessed July 24, 2023, at https://doi.org/10.1111/j.1462-2920.2012.02729.x.
North American Lake Management Society, 2024, The Robert Carlson Secchi dip-in: North American Lake Management Society web page, accessed December 13, 2024, at https://www.nalms.org/secchidipin/monitoring-methods/trophic-state-equations/.
Paerl, H.W., and Huisman, J., 2008, Blooms like it hot: Science, v. 320, no. 5872, p. 57–58, accessed December 11, 2024, at https://doi.org/10.1126/science.1155398.
Paerl, H.W., and Huisman, J., 2009, Climate change—A catalyst for global expansion of harmful cyanobacterial blooms: Environmental Microbiology Reports, v. 1, no. 1, p. 27–37, accessed August 21, 2024, at https://doi.org/10.1111/j.1758-2229.2008.00004.x.
Paerl, H.W., and Otten, T.G., 2013, Harmful cyanobacterial blooms—Causes, consequences, and controls: Microbial Ecology, v. 65, no. 4, p. 995–1010, accessed July 7, 2023, at https://doi.org/10.1007/s00248-012-0159-y.
Patiño, R., Christensen, V., Graham, J.L., Rogosch, J., and Rosen, B.H., 2023, Toxic algae in inland waters of the conterminous United States–A review and synthesis: Water (Basel), v. 15, no. 15, accessed November 18, 2024, at https://doi.org/10.3390/w15152808.
PhycoTech, Inc., 2024a, Semi-automated IFCB analysis: PhycoTech, Inc., webpage, accessed December 30, 2024, at https://www.phycotech.com/Our-Services/Phytoplankton/IFCB-Analysis.
PhycoTech, Inc., 2024b, Phytoplankton analysis: PhycoTech, Inc., webpage, accessed December 30, 2024, at https://www.phycotech.com/Our-Services/Phytoplankton.
Pierangelini, M., Stojkovic, S., Orr, P.T., and Beardall, J., 2014, Photosynthetic characteristics of two Cylindrospermopsis raciborskii strains differing in their toxicity: Journal of Phycology, v. 50, no. 2, p. 292–302, accessed July 24, 2023, at https://doi.org/10.1111/jpy.12157.
Pohlert, T., 2023, Trend—Non-parametric trend tests and change-point detection: R package version 1.1.6, accessed May 21, 2024, at https://CRAN.R-project.org/package=trend.
PRISM Climate Group, 2024, Parameter-elevation Regressions on Independent Slopes Model (PRISM) gridded climate data: Oregon State University, accessed August 21, 2024, at https://prism.oregonstate.edu.
Qi, S.L., Mast, M.A., Gohring, E.J., Bean, R.A., Walton-Day, K., and Day, N.K., 2025, Phytoplankton, algal toxin, and water-quality data for Blue Mesa Reservoir, Colorado, 1970–2023: U.S. Geological Survey data release, https://doi.org/10.5066/P14VZMGQ.
R Core Team, 2021, R—A language and environment for statistical computing, ver. 4.4.2: The R Project for Statistical Computing website, accessed November 18, 2024, at https://www.R-project.org/.
Reinl, K.L., Brookes, J.D., Carey, C.C., Harris, T.D., Ibelings, B.W., Morales-Williams, A.M., De Senerpont Domis, L.N., Atkins, K.S., Isles, P.D.F., Mesman, J.P., North, R.L., Rudstam, L.G., Stelzer, J.A.A., Venkiteswaran, J.J., Yokota, K., and Zhan, Q., 2021, Cyanobacterial blooms in oligotrophic lakes—Shifting the high-nutrient paradigm: Freshwater Biology, v. 66, no. 9, p. 1846–1859, accessed April 20, 2025, at https://doi.org/10.1111/fwb.13791.
Rudnick, R., and Gao, S., 2003, Composition of the continental crust, in Holland, H.D., and Turekian, K.K., eds., The crust—Treatise on geochemistry: Oxford, Elsevier-Pergamon, v. 3, p. 1–64, accessed January 30, 2025, at https://doi.org/10.1016/B0-08-043751-6/03016-4.
Rus, D.L., Hall, B.M., and Thomas, S.A., 2018, Relating cyanobacteria and physicochemical water-quality properties in Willow Creek Lake, Nebraska, 2012–14: U.S. Geological Survey Scientific Investigations Report 2018–5121, accessed November 18, 2024, at https://doi.org/10.3133/sir20185121.
Sen, P.K., 1968, Estimates of the regression coefficient based on Kendall’s Tau: Journal of the American Statistical Association, v. 63, no. 324, p. 1379–1389, accessed November 14, 2024, at https://doi.org/10.1080/01621459.1968.10480934.
Seiler, R.L., Zaugg, S.D., Thomas, J.M., and Howcroft, D.L., 2005, Caffeine and pharmaceuticals as indicators of waste water contamination in wells: Groundwater, v. 37, no. 3, p. 405–410, accessed July 24, 2025, at https://doi.org/10.1111/j.1745-6584.1999.tb01118.x.
Smith, V.H., 1983, Low nitrogen to phosphorus ratios favor dominance by blue-green algae in lake phytoplankton: Science, v. 221, no. 4611, p. 669–671, accessed December 18, 2024, at https://doi.org/10.1126/science.221.4611.669.
Smith, V.H., 2003, Eutrophication of freshwater and coastal marine ecosystems a global problem: Environmental Science and Pollution Research International, v. 10, no. 2, p. 126–139, accessed November 18, 2024, at https://doi.org/10.1065/espr2002.12.142.
Stackpoole, S.M., Zwart, J.A., Graham, J.L., Harvey, J.W., Schmadel, N.M., and Murphy, J.C., 2024, Evaluation of metrics and thresholds for use in national-scale river harmful algal bloom assessments: Ecological Indicators, v. 162, article 111970, accessed April 3, 2025, at https://doi.org/10.1016/j.ecolind.2024.111970.
Sterner, R.W., Andersen, T., Elser, J.J., Hessen, D.O., Hood, J.M., McCauley, E., and Urabe, J., 2008, Scale-dependent carbon:nitrogen:phosphorus seston stoichiometry in marine and freshwaters: Limnology and Oceanography, v. 53, no. 3, p. 1169–1180, accessed April 14, 2025, at https://doi.org/10.4319/lo.2008.53.3.1169.
Stets, E.G., Sprague, L.A., Oelsner, G.P., Johnson, H.M., Murphy, J.C., Ryberg, K., Vecchia, A.V., Zuellig, R.E., Falcone, J.A., and Riskin, M.L., 2020, Landscape drivers of dynamic change in water quality of US rivers: Environmental Science & Technology, v. 54, no. 7, p. 4336–4343, accessed January 13, 2025, at https://doi.org/10.1021/acs.est.9b05344.
Struzeski, T.M., 2025, Data for evaluation of nutrient, alkalinity, and acid neutralizing capacity stabilities in water samples analyzed by the National Water Quality Laboratory—2023–2024: U.S. Geological Survey data release, accessed September 17, 2025, at https://doi.org/10.5066/P1BRC2GJ.
Svirčev, Z., Lalić, D., Bojadžija Savić, G., Tokodi, N., Backović, D.D., Chen, L., Meriluoto, J., and Codd, G.A., 2019, Global geographical and historical overview of cyanotoxin distribution and cyanobacterial poisonings: Archives of Toxicology, v. 93, no. 9, p. 2429–2481, accessed July 7, 2023, at https://doi.org/10.1007/s00204-019-02524-4.
Udall, B., and Overpeck, J., 2017, The twenty-first century Colorado River hot drought and implications for the future: Water Resources Research, v. 53, no. 3, p. 2404–2418, accessed November 18, 2024, at https://doi.org/10.1002/2016WR019638.
U.S. Environmental Protection Agency [EPA], 1977, Report on Blue Mesa Reservoir, Gunnison County, Colorado, EPA Region VIII, Working Paper No. 767, accessed January 13, 2025, at https://nepis.epa.gov/Exe/ZyPDF.cgi?Dockey=9100F2K9.PDF.
U.S. Environmental Protection Agency [EPA], 2019, Recommended human health recreational ambient water quality criteria or swimming advisories for microcystins and cylindrospermopsin: U.S. Environmental Protection Agency website, accessed November 21, 2025, at https://www.epa.gov/sites/default/files/2019-05/documents/hh-rec-criteria-habs-factsheet-2019.pdf.
U.S. Environmental Protection Agency [EPA], 2000, Nutrient criteria technical guidance manual—Rivers and streams: Washington D.C., Office of Water, EPA 822-B-00-002, accessed January 14, 2025, at https://www.epa.gov/sites/default/files/2018-10/documents/nutrient-criteria-manual-rivers-streams.pdf.
U.S. Environmental Protection Agency [EPA], 2024a, State and Tribal toxin thresholds and HAB advisory decision methods: U.S. Environmental Protection Agency website, accessed August 4, 2024, at https://www.epa.gov/habs/state-tribal-toxin-thresholds-and-assessment-methods.
U.S. Environmental Protection Agency [EPA], 2024b, National Lakes Assessment—The fourth collaborative survey of the lakes of the United States: Washington, D.C., U.S. Environmental Protection Agency Office of Research and Development, EPA 841-R-24-006, accessed December 9, 2024, at https://nationallakesassessment.epa.gov/webreport/#top.
U.S. Environmental Protection Agency [EPA], 2025, Harmful algal blooms (HABs) in water bodies: Washington, D.C., U.S. Environmental Protection Agency website, accessed January 17, 2025, at https://www.epa.gov/habs.
U.S. Geological Survey, 2023, Guidelines for field-measured water-quality properties: U.S. Geological Survey Techniques and Methods, book 9, chap. A6.0 [version 1.1, July 17, 2023), 22 p., accessed September 17, 2025, at https://doi.org/10.3133/tm9A6.0. [Supersedes USGS Techniques of Water-Resources Investigations, book 9, chap. A6.0, version 2.0.]
U.S. Geological Survey [USGS], 2024a, USGS water data for the Nation: U.S. Geological Survey National Water Information System database, accessed August 1, 2024, at https://doi.org/10.5066/F7P55KJN.
U.S. Geological Survey [USGS], 2024b, National Geochemical Database, website accessed December 16, 2024, at https://mrdata.usgs.gov/ngdb/.
U.S. Geological Survey [USGS], variously dated, National field manual for the collection of water-quality data: U.S. Geological Survey Techniques of Water-Resources Investigations, book 9, chap. A1–A10, accessed August 1, 2024, at https://doi.org/10.3133/twri09.
Vengosh, A., Heumann, K.G., Juraske, S., and Kasher, R., 1994, Boron isotope application for tracing sources of contamination in groundwater: Environmental Science & Technology, v. 28, no. 11, p. 1968–1974, accessed January 2, 2025, at https://doi.org/10.1021/es00060a030.
Verspagen, J.M.H., Snelder, E.O.F.M., Visser, P.M., Huisman, J., Mur, L.R., and Ibelings, B.W., 2004, Recruitment of benthic Microcystis (Cyanophyceae) to the water column—Internal buoyancy changes or resuspension?: Journal of Phycology, v. 40, no. 2, p. 260–270, accessed July 26, 2023, at https://doi.org/10.1111/j.1529-8817.2004.03174.x.
Vidal, L., Ballot, A., Azevedo, S.M.F.O., Padisák, J., and Welker, M., 2021, Introduction to cyanobacteria, chap. 3 of Chorus, I., and Welker M., eds., Toxic cyanobacteria in water (2d ed.): Boca Raton, Florida, CRC Press, on behalf of the World Health Organization, accessed November 18, 2024, at https://doi.org/10.1201/9781003081449.
Wagner, C., and Adrian, R., 2009, Cyanobacteria dominance—Quantifying the effects of climate change: Limnology and Oceanography, v. 54, no. 6, part 2, p. 2460–2468, accessed July 12, 2023, at https://doi.org/10.4319/lo.2009.54.6_part_2.2460.
Wagner, R.J., Boulger, R.W., Jr., Oblinger, C.J., and Smith, B.A., 2006, Guidelines and standard procedures for continuous water-quality monitors—Station operation, record computation, and data reporting: U.S. Geological Survey Techniques and Methods, book 1, chap. D3, 51 p. + 8 attachments, accessed November 24, 2025, at https://doi.org/10.3133/tm1D3.
Walsby, A.E., 1994, Gas vesicles: Microbiological Reviews, v. 58, p, 94–144, accessed July 7, 2024, at https://doi.org/10.1128/MMBR.58.1.94-144.1994.
Walsby, A.E., and Schanz, G., 2002, Light-dependent growth rate determines changes in the population of Planktothrix rubescens over the annual cycle in Lake Zurich, Switzerland: The New Phytologist, v. 154, no. 3, p. 671–687, accessed July 25, 2023, at https://doi.org/10.1046/j.1469-8137.2002.00401.x.
Weissinger, R., and Gibney, N., 2019, Status and trends in water quality at Curecanti National Recreation Area and Black Canyon of the Gunnison National Park, 2001–2014: National Park Service, Natural Resource Report NPS/NCPN/NRR–2019/1858, 138 p., accessed November 18, 2024, at https://doi.org/10.13140/RG.2.2.28039.85920.
Wilhelm, S.W., Bullerjahn, G.S., and McKay, R.M.L., 2020, The complicated and confusing ecology of microcystis blooms: mBio, v. 11, no. 3, e00529-20, accessed November 18, 2024, at https://doi.org/10.1128/mBio.00529-20.
Willis, A., Chuang, A.W., and Burford, M.A., 2016, Nitrogen fixation by the diazotroph Cylindrospermopsis raciborskii (Cyanophyceae): Journal of Phycology, v. 52, no. 5, p. 854–862, accessed July 12, 2023, at https://doi.org/10.1111/jpy.12451.
Woodhouse, C.A., Smith, R.M., McAfee, S.A., Pederson, G.T., McCabe, G.J., Miller, W.P., and Csank, A., 2021, Upper Colorado River Basin 20th century droughts under 21st century warming—Plausible scenarios for the future: Climate Services, v. 21, 100206, accessed November 18, 2024, at https://doi.org/10.1016/j.cliser.2020.100206.
Xiao, M., Adams, M.P., Willis, A., Burford, M.A., and O’Brien, K.R., 2017, Variation within and between cyanobacterial species and strains affects competition—Implications for phytoplankton modelling: Harmful Algae, v. 69, p. 38–47, accessed July 24, 2023, at https://doi.org/10.1016/j.hal.2017.10.001.
Xiao, Y., Du, M., Deng, Y., Deng, Q., Wang, X., Yang, Y., Zhang, B., and Zhang, Y.-Q., 2024, Modulation of growth, microcystin production, and algal-bacterial interactions of the bloom-forming algae Microcystis aeruginosa by a novel bacterium recovered from its phycosphere: Frontiers in Microbiology, v. 15, accessed November 18, 2024, at https://doi.org/10.3389/fmicb.2024.1295696.
Xylem, Inc., 2023, YSI home page: Xylem, Inc., website, accessed August 21, 2023, at https://www.ysi.com/.
Yang, Y., Colom, W., Pierson, D., and Pettersson, K., 2016, Water column stability and summer phytoplankton dynamics in a temperate lake (Lake Erken, Sweden): Inland Waters, v. 6, no. 4, p. 499–508, accessed July 6, 2023, at https://doi.org/10.1080/IW-6.4.874.
Yoshida, M., Yoshida, T., Satomi, M., Takashima, Y., Hosoda, N., and Hiroishi, S., 2008, Intra-specific phenotypic and genotypic variation in toxic cyanobacterial Microcystis strains: Journal of Applied Microbiology, v. 105, no. 2, p. 407–415, accessed July 24, 2023, at https://doi.org/10.1111/j.1365-2672.2008.03754.x.
Appendix 1. Tables Presenting Collection Schedules, Analytical Methods, and Water-Quality Constituents Used during the Study
References Cited
Arar, E.J., and Collins, G.B., 1997, Method 445.0 In Vitro determination of chlorophyll-a and pheophytin a in marine and freshwater algae by fluorescence: Washington, D.C., U.S. Environmental Protection Agency, 22 p., accessed November 27, 2024, at https://cfpub.epa.gov/si/si_public_record_report.cfm?Lab=NERL&dirEntryId=309417.
Brenton, R.W., and Arnett, T.L., 1993, Methods of analysis by the U.S. Geological Survey National Water Quality Laboratory—Determination of dissolved organic carbon by UV-promoted persulfate oxidation and infrared spectrometry: U.S. Geological Survey Open-File Report 92–480, 12 p., accessed January 17, 2025, at https://doi.org/10.3133/ofr92480.
Fishman, M.J., ed., 1993, Methods of analysis by the U.S. Geological Survey National Water Quality Laboratory—Determination of inorganic and organic constituents in water and fluvial sediments: U.S. Geological Survey Open-File Report 93–125, 217 p., accessed January 17, 2025, at https://doi.org/10.3133/ofr93125.
Fishman, M.J., and Friedman, L.C., 1989, Methods for determination of inorganic substances in water and fluvial sediments: U.S. Geological Survey Techniques of Water-Resources Investigations, book 5, chap. A1, 545 p., accessed January 17, 2025, at https://doi.org/10.3133/twri05A1.
Furlong, E.T., Noriega, M.C., Kanagy, C.J., Kanagy, L.K., Coffey, L.J., and Burkhardt, M.R., 2014, Determination of human-use pharmaceuticals in filtered water by direct aqueous injection–high-performance liquid chromatography/tandem mass spectrometry: U.S. Geological Survey Techniques and Methods, book 5, chap. B10, 49 p., accessed January 17, 2025, at https://doi.org/10.3133/tm5B10.
Garbarino, J.R., Kanagy, L.K., and Cree, M.E., 2006, Determination of elements in natural-water, biota, sediment, and soil samples using collision/reaction cell inductively coupled plasma-mass spectrometry: U.S. Geological Survey Techniques and Methods, book 5, chap. B1, 88 p., accessed January 17, 2025, at https://pubs.usgs.gov/tm/2006/tm5b1/.
Hannon, J.E., and Böhlke, J.K., 2008, Determination of the δ(15N/14N) of ammonium (NH4+) in water—RSIL lab code 2898: U.S. Geological Survey Techniques and Methods, book 10, chap. C15, 30 p., accessed January 17, 2025, at https://doi.org/10.3133/tm10C15.
National Water Quality Monitoring Council, 2024, Water Quality Portal home page: National Water Quality Monitoring Council website, accessed April 1, 2024, at https://doi.org/10.5066/P9QRKUVJ.
Patton, C.J., and Kryskalla, J.R., 2003, Methods of analysis by the U.S. Geological Survey National Water Quality Laboratory—Evaluation of alkaline persulfate digestion as an alternative to Kjeldahl digestion for determination of total and dissolved nitrogen and phosphorus in water: U.S. Geological Survey Water-Resources Investigations Report 03–4174, 33 p., accessed January 20, 2025, at https://doi.org/10.3133/wri034174.
Patton, C.J., and Truitt, E.P., 2000, Methods of analysis by the U.S. Geological Survey National Water Quality Laboratory—Determination of ammonium plus organic nitrogen by a Kjeldahl digestion method and an automated photometric finish that includes digest cleanup by gas diffusion: U.S. Geological Survey Open-File Report 00–170, 31 p., accessed January 17, 2025, at https://doi.org/10.3133/ofr00170.
PhycoTech, Inc., 2024, PhycoTech, Inc., website accessed August 21, 2024, at https://www.phycotech.com/.
Qi, S.L., Mast, M.A., Gohring, E.J., Bean, R.A., Walton-Day, K., and Day, N.K., 2025, Phytoplankton, algal toxin, and water-quality data for Blue Mesa Reservoir, Colorado, 1970–2023: U.S. Geological Survey data release, https://doi.org/10.5066/P14VZMGQ.
U.S. Environmental Protection Agency [EPA], 2016, Method 546—Determination of total microcystins and nodularins in drinking water and ambient water by Adda enzyme-linked immunosorbent assay: U.S. Environmental Protection Agency, accessed January 16, 2025, at https://www.epa.gov/esam/method-546-determination-total-microcystins-and-nodularins-drinking-water-and-ambient-water.
U.S. Geological Survey, 2024, USGS water data for the Nation: U.S. Geological Survey National Water Information System database, accessed August 1, 2024, at https://doi.org/10.5066/F7P55KJN.
Appendix 2. Quality-Assurance Results for Field Blanks and Replicate Samples
References Cited
Qi, S.L., Mast, M.A., Gohring, E.J., Bean, R.A., Walton-Day, K., and Day, N.K., 2025, Phytoplankton, algal toxin, and water-quality data for Blue Mesa Reservoir, Colorado, 1970–2023: U.S. Geological Survey data release, https://doi.org/10.5066/P14VZMGQ.
U.S. Geological Survey [USGS], 2024, USGS water data for the Nation: U.S. Geological Survey National Water Information System database, accessed August 1, 2024, at https://doi.org/10.5066/F7P55KJN.
Appendix 3. Supplemental Data Collection
Comparison of Methods for Algal Taxonomy
A subset of algal taxonomy samples was analyzed using traditional microscopy wherein phytoplankton are identified and counted manually using optically clear slide mounts to compare with the Imaging FlowCytobot (IFCB) counts (PhycoTech, Inc., 2024). The results for 38 samples analyzed by both methods are available in Qi and others (2025). The IFCB produced lower cell counts than the traditional method especially in samples with low total cell counts, indicating IFCB may be less reliable for uncommon taxa or samples with less phytoplankton (fig. 3.1A). However, for taxa with typically high cell counts, such as Aphanizomenon, the two methods compared fairly well, indicating IFCB was suitable for monitoring dominant taxa during algal blooms in Blue Mesa Reservoir (fig. 3.1B). A recent comparison study of the two methods indicated that IFCB captured community dynamics well and potentially detected cyanobacterial bloom-forming taxa at lower abundance than microscopy (Gifford and others, 2024).
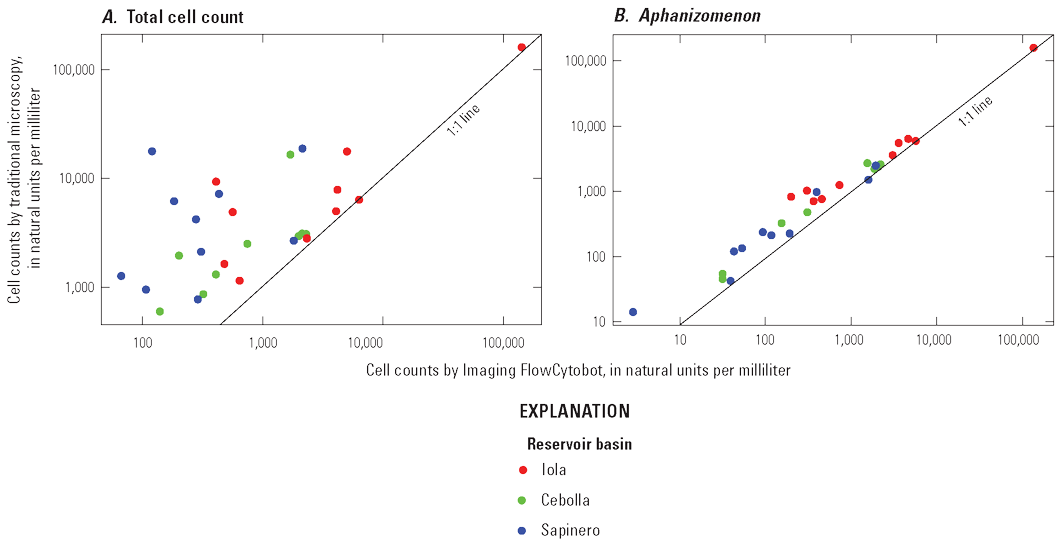
Comparison of analytical methods used to identify and quantify algal taxa. A, Total cell counts for algal taxonomy by Imaging FlowCytobot (IFCB) versus cell counts by traditional microscopy. B, Cell counts of Aphanizomenon by IFCB versus cell counts by traditional microscopy. Data available in Qi and others (2025).
Automated Collection of Integrated and Grab Nutrient Samples at Selected Tributaries
Refrigerated automatic samplers (ServoSippers) were installed on three tributaries including Gunnison River at County Road 32 below Gunnison, Colorado (U.S. Geological Survey [USGS] site 383103106594200), Beaver Creek at Highway 50 near Gunnison, Colo. (USGS site 382943107015300), and Steuben Creek near mouth near Gunnison, Colo. (USGS site 382937107033500) (table 1 and fig. 1 in main report) to monitor nutrient concentrations from July through October 2022. The Servosipper is a novel automated water sampler that uses a peristaltic pump and pinch valves to collect samples (Chapin and Todd, 2012). The ServoSippers were configured with filtered and unfiltered intake lines connected to separate sample bottles. The filtered intake was equipped with a series of polypropylene mesh prefilters (down to 100 micrometers) and a 0.45-micrometer filter. The unfiltered intake was housed in a single polypropylene 100-micrometer prefilter to prevent clogging the line with sediment.
These ServoSippers collected samples integrated during 1 week to compare to discrete samples collected at the end of the week. The ServoSippers were programmed to collect water every 6 hours for 7 days, resulting in approximately 100 milliliters of composite sample per intake line per week. Every week, the composite samples were retrieved, and clean bottles were installed. A new filter was connected to the filtered intake, and bottles for the unfiltered sample were pre-acidified with 7.5 normal nitric acid for sample preservation. A grab sample was collected from the stream every week for comparison with the composite samples. Field water-quality measurements (water temperature, pH, specific conductance, and dissolved oxygen) at the tributary sites were measured using an Aqua Troll multiparameter monitor that was calibrated the day of sample collection according to USGS guidelines (chapter A6 in U.S. Geological Survey, variously dated). Composite and grab samples were analyzed at the National Water Quality Laboratory, and water-quality data are available in National Water Information System (NWIS) database (USGS, 2024). Data for the composite samples are not included in the interpretations presented in this report, but comparisons between nutrient concentrations in the composite samples and grab samples are discussed briefly, and grab samples are included in data interpretation in the “Nutrients in Tributaries” section of the main report.
At Beaver Creek and Steuben Creek, the composite samples compared fairly well to the grab samples for total phosphorus and orthophosphate. The exception was at Beaver Creek in August when the orthophosphate was about 20 percent lower in the composite compared to the grab samples. A possible explanation is that the refrigerated sampler was not staying cold owing to insufficient battery power during this time, so orthophosphate may have degraded some as the samples sat in the collection bottle during the week. Inorganic nitrogen in the grab and composite samples was nearly always below the detection level of 0.01 milligram per liter (USGS, 2024).
At USGS site 383103106594200, the composite samples were almost always lower in concentration than the grab samples for total phosphorus, orthophosphate, and inorganic nitrogen. One possible explanation is the grab samples were usually collected during the morning when nutrient concentrations would be expected to reach maximum levels during the 24-hour cycle (Richards and Henneberg, 2021), whereas composite samples were collected at multiple times throughout the day and represent an average concentration at the site.
A noted complication with the USGS site 383103106594200 grab and composite samples is that they were nearly always higher in total phosphorus and orthophosphate concentrations compared to routine samples collected by the USGS at the same site retrieved from NWIS database (USGS, 2024). The grab and composite samples were collected on the left bank of the river, whereas the routine samples were integrated samples collected across the entire width of the channel. The Gunnison Wastewater Treatment Plant is just upstream from the sampling site and discharges treated effluent along the left bank. If the river was not well mixed at the autosampler location, the treated effluent could cause higher phosphorus in the grab and composite samples likely biasing them high compared to the fully integrated river samples. For this reason, all the phosphorus data for the grab and composite samples collected at this site in 2022 are not discussed in this report and are not publicly available in NWIS database.
Collection of Continuous Water-Quality Properties in Iola Basin during Boat Surveys in September 2023
Boat surveys in Iola basin were completed on September 18 and 28, 2023, during which a multiparameter EXO-2 monitor was continuously deployed from the watercraft. The monitor measured water temperature, specific conductance, pH, dissolved oxygen, turbidity, and total algae in relative fluorescence units for chlorophyll-a (fCHL) and phycocyanin (fPC). These surveys provided more detailed spatial data in Iola basin to compare against the satellite and chlorophyll-a maps simulated by King and others (2025).
Because of cloud cover on September 18, only the results from September 28 were able to be compared to the satellite map for chlorophyll-a on Blue Mesa Reservoir (King and others, 2024). The results are shown in figure 3.2 and indicate general agreement between chlorophyll-a mapped by the satellite and fChl as measured by the monitor, generally confirming the variability of chlorophyll-a concentrations as mapped using the satellite data (King and others, 2024). Data for all monitor measurements collected during the two boat surveys are available in Qi and others (2025), but only data for fChl on September 28 are shown in figure 3.2.
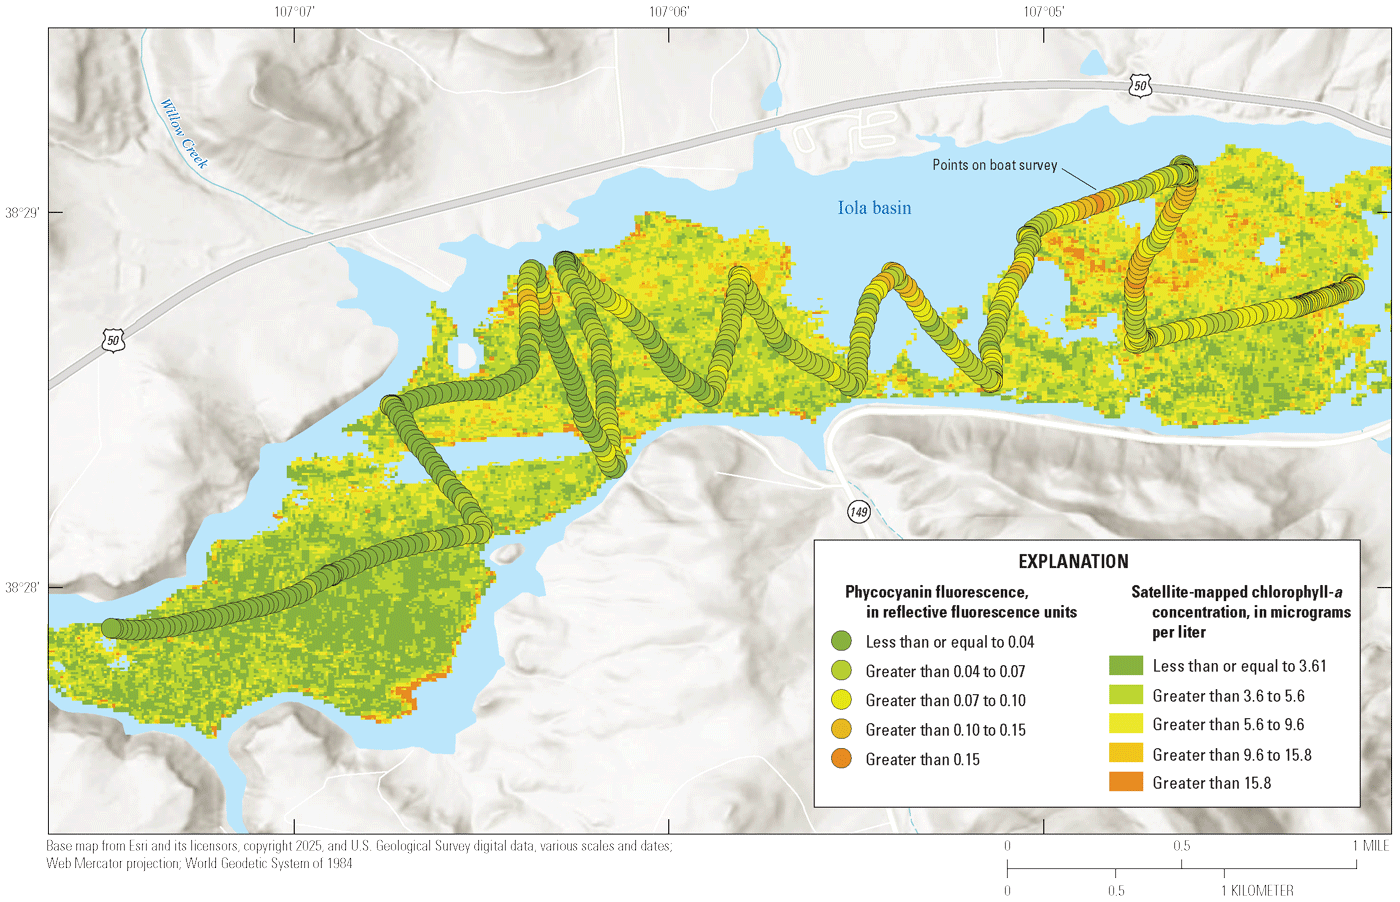
Map showing chlorophyll-a concentrations as mapped by Sentinel 2 satellite and fluorescence of chlorophyl data from EXO-2 monitor during a boat survey on September 28, 2023. Fluorescence data from Qi and others (2025) and mapped chlorophyll data from King and others (2024).
References Cited
Chapin, T.P., and Todd, A.S., 2012, MiniSipper—A new in situ water sampler for high-resolution, long-duration acid mine drainage monitoring: Science of the Total Environment, v. 439, p. 343–353, accessed January 20, 2025, at https://doi.org/10.1016/j.scitotenv.2012.07.083.
Gifford, S.R., St. Amand, A., Graham, J.L., Foster, G.M., Suave, C., Clark, D., and Schroeder-Larkins, H., 2024, Comparison of imaging flow cytometry and microscopy for freshwater algal bloom detection: Lake and Reservoir Management, v. 40, accessed January 30, 2024, at https://doi.org/10.1080/10402381.2024.2370828.
King, T.V., Bean, R.A., Walton-Day, K., Mast, M.A., Gohring, E.J., Gidley, R.G., Day, N.K., and Gibney, N.D., 2025, Remote sensing of chlorophyll-a and temperature to support algal bloom monitoring in Blue Mesa Reservoir, Colorado: Journal of the American Water Resources Association, v. 61, no. 4, p. e70038, accessed September 18, 2025, at https://doi.org/10.1111/1752-1688.70038.
King, T.V., Mast, M.A., Bean, R.A., and Gohring, E.J., 2024, Remotely sensed and in-situ chlorophyll a and temperature data from Blue Mesa Reservoir, Colorado: U.S. Geological Survey data release, accessed January 20, 2025, at https://doi.org/10.5066/P9XULQAS.
PhycoTech, Inc., 2024, PhycoTech, Inc., website, accessed August 21, 2024, at https://www.phycotech.com/.
Qi, S.L., Mast, M.A., Gohring, E.J., Bean, R.A., Walton-Day, K., and Day, N.K., 2025, Phytoplankton, algal toxin, and water-quality data for Blue Mesa Reservoir, Colorado, 1970–2023: U.S. Geological Survey data release, https://doi.org/10.5066/P14VZMGQ.
Richards, R.J., and Henneberg, M.F., 2021, Assessment of diel cycling in nutrients and trace elements in the Eagle River Basin, 2017–18: U.S. Geological Survey Scientific Investigations Report 2021–5066, 36 p., accessed January 15, 2025, at https://doi.org/10.3133/sir20215066.
U.S. Geological Survey [USGS], 2024, USGS water data for the Nation: U.S. Geological Survey National Water Information System database, accessed August 1, 2024, at https://doi.org/10.5066/F7P55KJN.
U.S. Geological Survey [USGS], variously dated, National field manual for the collection of water-quality data: U.S. Geological Survey Techniques of Water-Resources Investigations, book 9, chap. A1–A10, accessed August 1, 2024, at https://doi.org/10.3133/twri09.
Conversion Factors
U.S. customary units to International System of Units
Temperature in degrees Celsius (°C) may be converted to degrees Fahrenheit (°F) as follows:
°F = (1.8 × °C) + 32.
Datums
Vertical coordinate information is referenced to the North American Vertical Datum of 1988 (NAVD 88).
Horizontal coordinate information is referenced to the North American Datum of 1983 (NAD 83).
Elevation, as used in this report, refers to distance above the vertical datum.
Supplemental Information
Specific conductance is given in microsiemens per centimeter at 25 degrees Celsius (µS/cm at 25 °C).
Concentrations of chemical constituents in water are given in either milligrams per liter (mg/L) or micrograms per liter (µg/L).
Results for measurements of stable isotopes of an element (with symbol E) in water, solids, and dissolved constituents commonly are expressed as the relative difference in the ratio of the number of the less abundant isotope (iE) to the number of the more abundant isotope of a sample with respect to a measurement standard.
Abbreviations
C:N:P
carbon to nitrogen to phosphorus molar ratio
CDPHE
Colorado Department of Public Health and Environment
CO2
carbon dioxide
cyanoHABs
cyanobacteria harmful algal blooms
DO
dissolved oxygen
EPA
U.S. Environmental Protection Agency
fPC
relative fluorescence units for phycocyanin
IFCB
Imaging FlowCytobot
NPS
National Park Service
NWIS
National Water Information System
NWQL
National Water Quality Laboratory
p-value
probability value
r
Pearson correlation coefficient
Reclamation
Bureau of Reclamation
RPD
relative percent difference
RV
recreational vehicle
TN:TP
total nitrogen to total phosphorus ratio
TPphy
phosphorus concentration in phytoplankton
TSI–CHLa
trophic state index based on chlorophyll-a
TSI–SD
trophic state index based on Secchi disk
TSI–TP
trophic state index based on total phosphorus
USGS
U.S. Geological Survey
WY
water year
For additional information, contact:
Director, Colorado Water Science Center
U.S. Geological Survey
Box 25046, Mail Stop 415
Denver, CO 80225
For additional information, visit: https://www.usgs.gov/centers/colorado-water-science-center/
Publishing support provided by the
Rolla Publishing Service Center
Disclaimers
Any use of trade, firm, or product names is for descriptive purposes only and does not imply endorsement by the U.S. Government.
Although this information product, for the most part, is in the public domain, it also may contain copyrighted materials as noted in the text. Permission to reproduce copyrighted items must be secured from the copyright owner.
Suggested Citation
Walton-Day, K., Day, N.K., Mast, M.A., Gidley, R.G., Gohring, E.J., King, T.V., Day, W.C., Gibney, N.D., and Bauch, N.J., 2025, Environmental characterization of Blue Mesa Reservoir and potential causes of and management strategies for harmful algal blooms, 1970 through 2023, Curecanti National Recreation Area, Colorado: U.S. Geological Survey Scientific Investigations Report 2025–5109, 64 p., https://doi.org/10.3133/sir20255109.
ISSN: 2328-0328 (online)
Study Area
| Publication type | Report |
|---|---|
| Publication Subtype | USGS Numbered Series |
| Title | Environmental characterization of Blue Mesa Reservoir and potential causes of and management strategies for harmful algal blooms, 1970 through 2023, Curecanti National Recreation Area, Colorado |
| Series title | Scientific Investigations Report |
| Series number | 2025-5109 |
| DOI | 10.3133/sir20255109 |
| Publication Date | December 17, 2025 |
| Year Published | 2025 |
| Language | English |
| Publisher | U.S. Geological Survey |
| Publisher location | Reston, VA |
| Contributing office(s) | Colorado Water Science Center |
| Description | Report: ix, 64 p.; 8 Linked Appendix Tables; Data Release; Dataset |
| Country | United States |
| State | Colorado |
| Other Geospatial | Blue Mesa Reservoir, Curecanti National Recreation Area |
| Online Only (Y/N) | Y |
| Additional Online Files (Y/N) | Y |