

Treatability Study to Evaluate Bioremediation of Trichloroethene at Site K, Former Twin Cities Army Ammunition Plant, Arden Hills, Minnesota, 2020–22
Links
- Document: Report (6.92 MB pdf) , HTML , XML
- Data Release: USGS data release - Former Twin Cities Army Ammunition Site K treatability test data including various field measurements, laboratory tests and degradation constituents in the bioremediation of trichloroethylene and dichloroethylene, Arden Hills, Minnesota 2020–2022
- NGMDB Index Page: National Geologic Map Database Index Page (html)
- Download citation as: RIS | Dublin Core
Executive Summary
Chlorinated solvents, including trichloroethene (TCE) and other chlorinated volatile organic compounds (cVOCs), are widespread contaminants that can be treated by bioremediation approaches that enhance anaerobic reductive dechlorination. Reductive dechlorination can be enhanced either through the addition of an electron donor (biostimulation) or the addition of a known dechlorinating culture (bioaugmentation) along with an electron donor. Although bioremediation has been applied at many TCE-contaminated groundwater sites, application in source zones at sites where residual dense nonaqueous phase liquid (DNAPL) is present is more limited. In this study, laboratory and field treatability tests were completed to evaluate the potential application of anaerobic bioremediation for a shallow groundwater plume containing TCE in a perched alluvial aquifer at Site K, former Twin Cities Army Ammunition Plant, Arden Hills, Minnesota, which was on the National Priorities List as the New Brighton/Arden Hills Superfund site until 2019. In addition to the presence of residual DNAPL at the site, temporal variability in groundwater flow directions and input of oxygenated recharge were possible complicating factors for the application of enhanced anaerobic biodegradation in the shallow plume. The Site K plume extends beneath the footprint of Building 103, which was demolished in 2006, and soil excavations to a maximum depth of 6 feet (ft) below ground surface in 2014 were known to leave some deeper contaminated soil in place in the TCE source area. Groundwater treatment at the site, formalized as part of the 1997 Record of Decision, has been in operation since 1986 and consists of an extraction trench at the downgradient edge of the plume to collect groundwater, which is then pumped to an on-site air stripper. Groundwater concentrations in the plume have been relatively stable since treatment began, indicating a continued source of TCE in the aquifer. The desire for a destructive remedy that would enhance the removal of cVOCs in the aquifer at Site K and shorten the remediation timeframe led the U.S. Army to request that the U.S. Geological Survey conduct a groundwater treatability study to assess bioremediation. This report describes the U.S. Geological Survey bioremediation treatability study conducted during 2020–22, including pre-design site characterization to assist in formulating the bioremediation approach, laboratory experiments to support the design of the field pilot test, and implementation and 1-year performance monitoring results for the pilot test.
Pre-design site characterization included the collection of soil cores for cVOC analysis and lithologic descriptions and the re-installment of three wells to obtain hydrologic measurements and initial groundwater chemistry. Relatively flat head gradients were measured at the site, and substantial decreases in water-level elevations occurred from spring to summer (May–July 2021). Continuous water-level monitoring indicated a rapid response to precipitation. Groundwater flow velocities were consistently less than 0.5 foot per day, and the pilot bioremediation test was therefore designed with short lateral distances (about 5 ft) between injection and individual monitoring points. Soil analyses confirmed that high volatile organic compound contamination was left in place in the source area. The highest concentrations were near or in clay at the base of the perched aquifer. Concentrations of cVOCs measured in the replaced wells were consistent with historical data and had a maximum TCE concentration of 57,700 micrograms per liter (μg/L), indicative of nearby residual DNAPL based on the general rule of observed concentrations exceeding 1 percent of solubility (Kueper and Davies, 2009). The primary TCE daughter product detected was 1,2-cis-dichloroethene (cisDCE), which indicated limited reductive dechlorination in the plume. Groundwater in both the source and downgradient areas was relatively reducing during the pre-design characterization, particularly in the source area where methane concentrations greater than 400 μg/L were measured.
Initial laboratory tests conducted using native aquifer microorganisms from the three replacement wells showed that anaerobic TCE biodegradation rates were low when biostimulated with the addition of sodium lactate as an electron donor, also known as a carbon donor, and resulted in the production of only cisDCE. Addition of a known dechlorinating culture, WBC-2, however, resulted in rapid biodegradation and production of ethene, verifying complete reductive dechlorination of TCE. Microcosms constructed with aquifer soil collected from the site were used to evaluate other electron donors besides lactate to support reductive dechlorination by WBC-2, including corn syrup as an alternative fast-release compound and whey, soy-based vegetable oil, and 3-D Microemulsion (Regenesis, San Clemente, California) as slow-release compounds. First-order rate constants for total organic chlorine removal in these WBC-2 amended microcosms were greatest with either lactate or vegetable oil as the donor, ranging between 0.061 and 0.047 per day or corresponding half-lives of 11–15 days. Testing of commercial products in other WBC-2-bioaugmented microcosms led to selection for the field pilot test of an emulsified vegetable oil product that also contained some sodium lactate as a fast-release donor. Delaying the addition of WBC-2 relative to the donor in the microcosms resulted in the most rapid overall biodegradation rates.
The selected design for the pilot test utilized three separate test plots, each about 30 ft wide and 60 ft long: plots GS1 and GS2 in the source area of the plume and plot GS3 in the downgradient area of the plume near the excavation trench. Each test plot had one injection well, one monitoring well upgradient from the injection point, and 12 surrounding monitoring wells in a grid to capture variable groundwater flow directions. Donor injections, which included a bromide tracer, were completed in October 2021, immediately following baseline sampling, and the WBC-2 culture was injected about 40 days later, between November 30 and December 2, 2021. Performance monitoring conducted until December 2022 included hydrologic measurements and analyses of cVOCs, redox-sensitive constituents, dissolved organic carbon, bromide, volatile fatty acids, compound-specific carbon isotopes, and microbial communities.
The biogeochemical data collected during the pilot tests in the three treatment plots showed that enhanced, complete reductive dechlorination of cVOCs in the groundwater was achieved in the GS1 and GS3 plots. In contrast, evidence of distribution of the injected amendments and subsequent biodegradation was limited in GS2, which was in an area of more heterogeneous soil lithology and low water table elevations. The molar composition of volatile organic compounds in the GS1 and GS3 plots was dominated by ethene in wells that were reached by the injected amendments by the end of the monitoring period. In the GS1 and GS3 plots, similar patterns were observed of cVOC concentrations decreasing to near detection levels, or below, at some wells sampled in July and October 2022, whereas ethene became dominant and indicated sustained complete reductive dechlorination. Baseline cVOC concentrations were more than a factor of 10 higher in the groundwater in the GS1 plot than in GS3, but no apparent inhibition of complete dechlorination occurred. As expected from the initial pre-design site data and the laboratory experiments, enhanced dissolution of residual DNAPL coupled to biodegradation was evident in the GS1 plot, where a marked increase in dichloroethene (DCE) above the initial baseline and upgradient TCE and DCE concentrations occurred. DCE concentrations subsequently declined where DNAPL dissolution was evident, concurrent with production of vinyl chloride and then predominantly ethene. Thus, overall biodegradation rates outpaced the DNAPL dissolution and desorption and DCE production in the source area. This success in complete degradation to predominantly ethene was achieved even in areas where the DCE concentrations reached a maximum of about 30,000 μg/L. Compound specific isotope analysis of carbon in TCE, cisDCE, trans-1,2-dichloroethene, and vinyl chloride was conducted to provide another line of evidence of the occurrence and extent of anaerobic biodegradation. Along a flow path in each plot that was affected by the injected amendments, carbon isotopes in the TCE and daughter cVOCs in the groundwater became isotopically heavier, indicating biodegradation.
Enhanced biodegradation rates calculated from the field tests in GS1 and GS3 showed half-lives of 36.9–75.3 days for DCE degradation and 9.48–38.5 days for ethene production. Notably, these ethene production rates calculated from the field tests are consistent with the results of WBC-2-bioaugmented microcosms amended with either lactate or vegetable oil, which had half-lives for total organic chlorine removal that ranged from 11 to 15 days. These rates indicated rapid enhanced biodegradation, which is promising for application of a full-scale bioremediation remedy. Ultimately, however, the mass of residual or sorbed TCE in the aquifer that remains accessible for dissolution and biodegradation would likely control the time required for a full-scale bioremediation effort to achieve performance goals for TCE and cisDCE specified in the Record of Decision for Site K.
The field pilot tests showed that the relatively low hydraulic head gradients and temporal changes in groundwater flow directions in the shallow aquifer would add complexity to a full-scale bioremediation effort. The radius of influence for the injections determined for each test plot was relatively small, ranging from 20 to 30 ft centers in GS1 and GS2 and even lower (12.7 ft) in area GS3 near the trench. In addition, the low temperatures following WBC-2 injection in late November to early December 2021, in combination with the low hydraulic head gradients, were probably major factors in the delay observed before the onset of enhanced biodegradation following injection of the culture. Additional test injections could be beneficial to optimize the timing of donor and culture injections with the variable temperatures and hydraulic head in the shallow aquifer.
Reference Cited
Kueper, B., and Davies, K., 2009, Assessment and delineation of DNAPL source zones at hazardous waste sites: Cincinnati, Ohio, U.S. Environmental Protection Agency Ground Water Issue, EPA/600/R-09/119, 18 p. [Also available at https://nepis.epa.gov/Exe/ZyPURL.cgi?Dockey=P1006Y98.txt.]
Introduction and Background
Chlorinated solvents, including trichloroethene (TCE) and other chlorinated ethenes, are widespread contaminants in soil and groundwater in the United States, occurring as contaminants of concern at many Superfund sites. Many TCE-contaminated groundwater sites that have not achieved final remediation goals contain residual dense nonaqueous phase liquid (DNAPL) in source zones or distributed in low permeability layers or rock matrix (Rivett and others, 2014; Shapiro and others, 2019). Continued DNAPL dissolution can occur over decades, providing a long-term source to the aquifer (Rivett and others, 2014). A shallow groundwater plume containing TCE is present in a perched alluvial aquifer at Site K, former Twin Cities Army Ammunition Plant (TCAAP), Arden Hills, Minnesota, which was on the National Priorities List as the New Brighton/Arden Hills Superfund site until 2019. The Site K plume extends beneath and immediately northwest of former Building 103, which was demolished in 2006 (fig. 1). A groundwater remedy was selected for Site K as part of the Operable Unit 2 (OU2) 1997 Record of Decision (ROD; U.S. Army and others, 19971 ) consisting of an extraction trench to collect groundwater and pump it to an air stripper unit for treatment. The trench-air stripper remedy has been operating since August 1986, removing a cumulative 389 pounds (lb) of volatile organic compounds (VOCs; PIKA Arcadis, 20191). However, groundwater concentrations in the plume have been relatively stable since treatment began, indicating a continued source of TCE in the aquifer. The desire for a destructive remedy that would enhance the removal of TCE and other VOCs in the aquifer led the U.S. Army to request that the U.S. Geological Survey (USGS) conduct a groundwater treatability study to assess bioremediation.
The availability of this source is limited. For more information, contact U.S. Army Environmental Command, Midwest and Central America Division (Fort Sam Houston, Joint Base San Antonio, Texas).
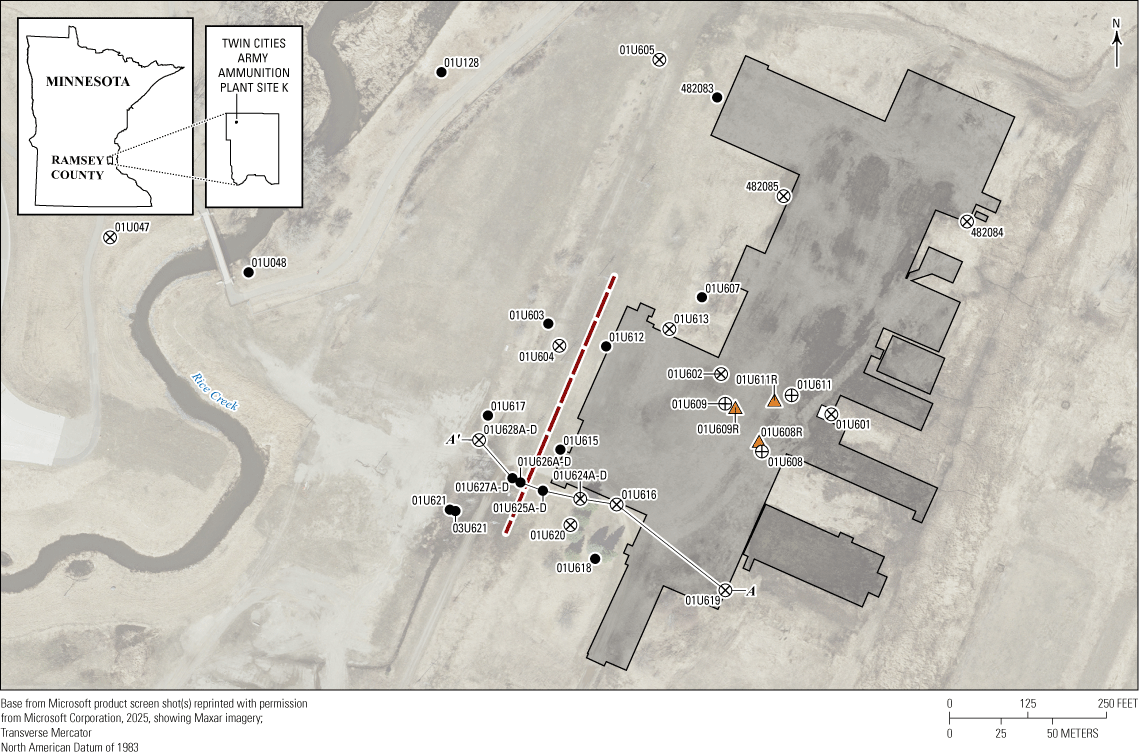
Map showing Site K, former Twin Cities Army Ammunition Plant, Arden Hills, Minnesota.
In situ bioremediation, including biostimulation with organic donors with or without bioaugmentation to add microorganisms, can provide a cost-effective remediation approach for contaminated groundwater (Luo and others, 2024). Anaerobic bioremediation is commonly utilized for chlorinated solvents, largely because of the difficulty in maintaining sufficient oxygen to enable efficient aerobic degradation in the subsurface. TCE can be anaerobically biodegraded by sequential reductive dechlorination by dehalorespiring bacteria, also referred to as organohalide-respiring bacteria (OHRB), that utilize the chlorinated compounds as terminal electron acceptors to derive energy (Yan and others, 2016; Hellal and others, 2021; Underwood and others, 2022). Chloride atoms are sequentially removed and replaced with hydrogen atoms in reductive dechlorination, degrading TCE first to dichloroethene (DCE) isomers (most commonly cis-1,2-dichloroethene [cisDCE]), then to vinyl chloride (VC), and finally to the nonchlorinated end products of ethene or ethane. A mixture of bacteria typically is needed to achieve complete reductive dechlorination of TCE because not all OHRB are able to utilize each compound (Chen and others, 2022). Other microorganisms also assist in breaking down organic donor compounds and providing the cyanocobalamin, or vitamin B12, necessary for OHRB activity (Yan and others, 2016). In addition to degrading dissolved TCE in groundwater, in situ bioremediation can enhance the removal of sorbed or residual TCE because degradation leads to concentration gradients that promote desorption from and diffusion out of low permeability layers and rock matrix (Schaefer and others, 2018; Underwood and others, 2022).
Previous monitoring in the core of the Site K plume had shown a maximum TCE concentration in the groundwater of 11,000 micrograms per liter (μg/L; PIKA Arcadis, 2019), which is equal to 1 percent of the solubility of TCE and may indicate DNAPL presence (either past or present; Kueper and Davies, 2009). However, the wells in the core of the plume were removed in 2014 for site redevelopment activities (PIKA Arcadis, 2019). TCE DNAPL was suspected to be present in the storm sewer bedding that was present underneath the former Building 103 and could be remobilized by high water table conditions (PIKA Arcadis, 2019). Extensive site redevelopment activities continued through 2018 and included the removal of stormwater piping, a former sump, and soil in suspected source areas (Wenck Associates, Inc., 20161; PIKA Arcadis, 2019), making it uncertain if DNAPL remained at the site when the USGS bioremediation study began in 2020.
The challenges to achieving effective enhanced anaerobic bioremediation of the TCE at Site K included the potential presence of DNAPL in the aquifer or low permeability units and the potential variability in water levels and dissolved oxygen in the shallow perched aquifer. The treatability study was designed to investigate these challenges and determine the best bioremediation strategy for the field pilot test at Site K. The treatability study consisted of (1) a preliminary investigation of Site K, (2) laboratory microcosm experiments to evaluate natural and enhanced degradation processes using site aquifer material, and (3) a field pilot test of enhanced bioremediation at the site. Biostimulation alone and combined biostimulation and bioaugmentation were evaluated as remedies. The WBC-2 dehalogenating culture was selected as a mixed culture that contains several known OHRB, including Dehalococcoides and Dehalogenimonas (Lorah and others, 2008; Manchester and others, 2012; Molenda and others, 2016a, b), and is relatively resistant to exposure to dissolved oxygen (Lorah and others, 2014). We originally enriched the WBC-2 culture to degrade chlorinated ethanes, particularly 1,1,2,2-tetrachloroethane, and chlorinated ethenes, including TCE and its daughter products, by reductive dechlorination (Jones and others, 2006; Lorah and others, 2008). The resilient nature of the WBC-2 culture has been shown by previous laboratory and field tests in bioreactors (Lorah and others, 2015), wetland sediments (Majcher and others, 2009; Lorah and others, 2014; Chow and others, 2020), and fractured rock (Lorah and others, 2022). The culture was applied in a shallow aquifer that potentially contained DNAPL for the first time during this Site K study.
Purpose and Scope
This report presents the approach and results of the USGS treatability study of TCE bioremediation at Site K, TCAAP, Arden Hills, Minnesota, from October 2020 through December 2022 (fig. 1). The purpose of the report is to describe (1) the initial evaluation of the site’s history and characteristics that was completed to establish site conditions and formulate the approach for the laboratory and field treatability tests, (2) the results of laboratory experiments conducted to design the field pilot test, (3) the implementation and results of the pilot test, and (4) the implications of pilot test data for the design of a full-scale bioremediation remedy at the site. In the following section, the site’s history is described, and investigations that took place prior to the USGS study are summarized. The initial site characterization activities by the USGS are reported in the “Pre-Design Site Characterization” section, which is followed by sections summarizing the laboratory and field pilot tests of enhanced biodegradation. Laboratory tests included the determination of natural TCE biodegradation rates occurring in the groundwater at Site K and the evaluation of amendments that could be used in the pilot test to enhance natural biodegradation rates. The pilot test presented in this report includes the first injections of amendments for biostimulation and bioaugmentation and 1 year of performance monitoring to evaluate the feasibility of TCE bioremediation for the Site K plume.
Site Description and Previous Investigations
Site Description
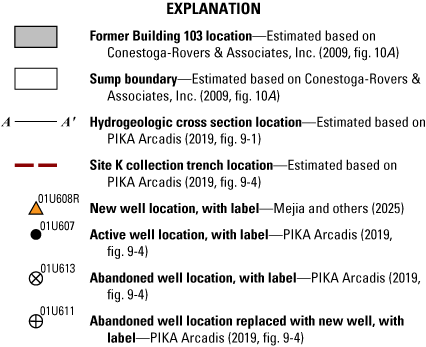
Site K is a 21-acre area that is part of OU2 at TCAAP, the former New Brighton/Arden Hills Superfund site (fig. 1). The contaminant plume (fig. 2) is in a shallow perched aquifer, containing TCE and DCE (primarily cisDCE), as the contaminants of concern in the plume. The perched aquifer contains alluvial sand of the Fridley Formation, called Unit 1 at TCAAP, that has been disturbed in some areas of Site K by past remediation activities (refer to the “Previous Remedial Investigations and Activities” section). Treated water from the air stripper plant, which has been operating since 1986, is discharged into Rice Creek. Water-quality and water-level monitoring downgradient from the collection trench indicates that the approximately 18-foot (ft) deep trench typically captures the groundwater plume in Unit 1, which is upgradient from the trench and beneath the former Building 103 footprint (fig. 2; PIKA Arcadis, 2019). Four wells near the trench (01U625D, 01U626D, 01U627D, and 01U628D) that are screened at the interface of Unit 1 and the underlying aquitard, Unit 2 (fig. 2), were sampled in March 2000 to determine the potential for DNAPL migration beneath the trench along the Unit 1 aquifer base, and no DNAPL presence was found (PIKA Arcadis, 2019). A sentinel well (03U621) was incorporated by the Army in the TCAAP monitoring plan to monitor potential VOC migration through the Unit 2 aquitard and into the underlying aquifer at Site K. No VOCs were detected in the sentinel well; 1,4-dioxane has been detected but is not considered to result from remedial activities at Site K (PIKA Arcadis, 2019). Under the OU2 1997 ROD, the extraction trench and air stripper treatment at Site K will continue to be implemented until groundwater cleanup levels of 30 μg/L for TCE and 70 μg/L for total DCE are attained. Treated water discharges to the storm sewer that outlets to Rice Creek.
Hydrogeologic cross section showing Site K plume, former Twin Cities Army Ammunition Plant, Arden Hills, Minnesota. Modified from PIKA Arcadis (2019, fig. 9-3).
Previous Remedial Investigations and Activities
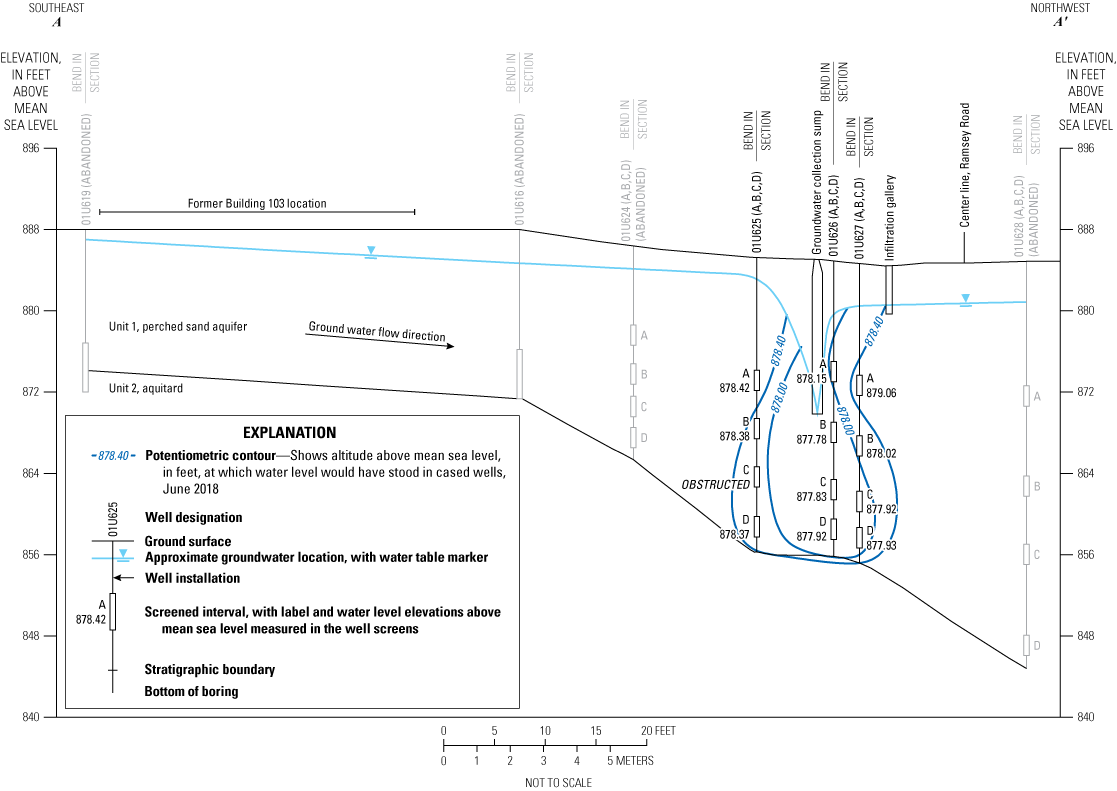
The history of remedial activities at Site K is summarized in figure 3. After construction of Building 103 was completed in 1942, it was used to produce small caliber ammunition, operating until 1945 and then again in 1950–51 (Conestoga-Rovers & Associates, Inc., 20092 ). Between 1946 and 1950, Building 103 was used to clean and store production machinery. The building was inactive after 1951 until reactivated from 1961 to 1998 for the production of fuses, mines, and weapons systems by Honeywell and its successor, Alliant Techsystems, Inc. Materials used in former Building 103 included chlorinated solvents and degreasers (TCE, 1,1,1-trichloroethane, and dichlorofluoromethane), radioactive materials, and petroleum products (xylene, toluene; Conestoga-Rovers & Associates, Inc., 2009). Contamination from Building 103 was first detected in 1983 and consisted of TCE, oil, and cyanide in stormwater that was discharging into Rice Creek (Conestoga-Rovers & Associates Limited, 19842). Subsequent investigations identified the groundwater VOC plume in Unit 1 at Site K, but a soil source was not found (Conestoga-Rovers & Associates, Inc., 2009). Thus, the OU2 1997 ROD stipulated additional characterization of the unsaturated soil of Unit 1 at Site K to locate the source area of the groundwater VOC contamination.
The availability of this source is limited owing to such restrictions as attorney-client privilege. For more information, contact U.S. Army Environmental Command, Midwest and Central America Division (Fort Sam Houston, Joint Base San Antonio, Texas).
Timeline of remedial activities at Site K, former Twin Cities Army Ammunition Plant, Arden Hills, Minnesota, 1981–2022. [TCE, trichloroethene; HRC, Hydrogen Release Compound; USGS, U.S. Geological Survey]
Soil and soil gas sampling for VOCs was conducted in 2000 with direct-push probes, leading to the identification of a sump on the east side of Building 103 (fig. 4) as the source of the Site K groundwater contamination (Conestoga-Rovers & Associates, Inc., 2009). In 2008, remediation goals for contaminated soil were set at 46 milligrams per kilogram (mg/kg) for TCE and 22 mg/kg for cisDCE, which were the industrial Soil Reference Values established by the Minnesota Pollution Control Agency for the two identified contaminants of concern (Conestoga-Rovers & Associates, Inc., 2009); soil excavation and off-site disposal was the recommended remedial alternative (Conestoga-Rovers & Associates, Inc., 2009). After the signing of an Action Memorandum (October 16, 2008), the recommended soil remedy, which included the removal of 41 tons of soil and additional rubble and clean concrete in a 20-square-foot (ft2) area of the sump and an additional 112-ft2 area to the east, was completed in June–August 2009 (Conestoga-Rovers & Associates, Inc., 2009).
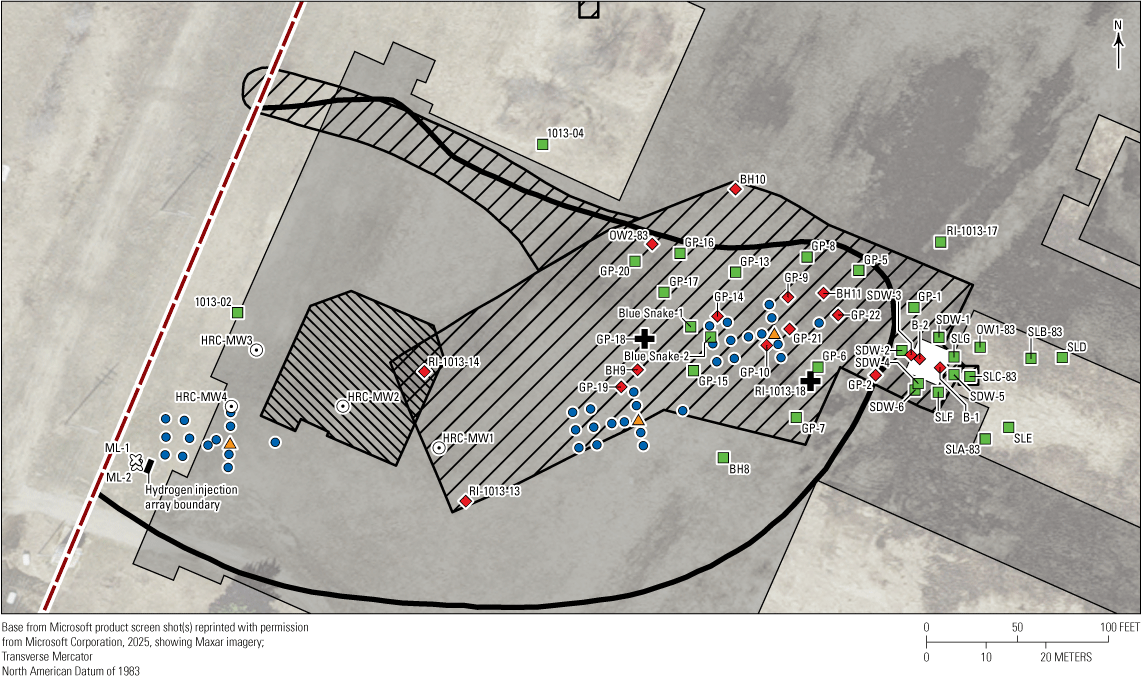
Map of soil excavation areas, historical soil sampling locations, and historical and current U.S. Geological Survey (USGS) bioremediation pilot test areas, Site K, former Twin Cities Army Ammunition Plant, Arden Hills, Minnesota. [TCE, trichloroethene; VOCs, volatile organic compounds]
In the vicinity of the former sump, soil excavation was initially done to the water table at a depth of about 6 feet below ground surface (ft bgs) but was then extended to the clay at the bottom of Unit 1 at a depth of about 8 ft bgs. Although not required as part of the removal action or ROD for Site K, 450 lb of granular potassium permanganate (KMnO4) were added at the bottom of the 2009 excavation area before covering, in an attempt to enhance contaminant mass removal of VOCs in the saturated zone by chemical oxidation (Conestoga-Rovers & Associates, Inc., 2009; Wenck Associates, Inc. and others, 2010, 20112). Excavated site soil that was determined to be clean was used in backfilling. Post-excavation testing determined that the unsaturated soils in the excavation area were acceptable for unrestricted use (Conestoga-Rovers & Associates, Inc., 2009), and a ROD amendment stated that no further action regarding the soil was necessary (U.S. Army and others, 20121).
Groundwater samples were collected from the bottom of the excavation and from two downgradient wells (01U611 and 01U609) before and after the addition of the KMnO4. Groundwater TCE concentrations that had pooled in the excavation pit decreased from 710 μg/L to below detection within 2 hours after KMnO4 addition. However, the concentrations in wells 01U611 and 01U609 did not show a decreasing trend between baseline conditions (June 23, 2009) and samples collected 4 months (October 2009) and 12 months (June 2010) post-KMnO4 treatment (Conestoga-Rovers & Associates, Inc., 2009; Wenck Associates, Inc. and others, 2011).
Additional activities at Site K have included removal of Building 103’s foundation slabs and utility infrastructure in 2013–14 and targeted soil excavation of suspected sources in 2014 under a Response Action Plan (Wenck Associates, Inc., 2016). These activities were referred to as “site redevelopment activities” and were completed by Ramsey County after acquiring a 427-acre portion of TCAAP, including Site K, on April 15, 2013. Before the slab at the northern end of Building 103 was removed, it was temporarily used to stage and compost petroleum-contaminated soil excavated from various locations on the TCAAP property (Wenck Associates, Inc., 2016). Soil excavation was done in November 2014 and removed approximately 7,000 cubic yards of VOC-effected soil from the former Building 103 area, including soil in and downgradient from the former sump area. At the time of excavation, the water table was about 5 ft bgs, and soil was excavated to a depth of about 0.5–1 ft below the water table. Figure 4 shows the 2014 excavation footprint and locations where soil VOC contamination was known to be deeper than the 6 ft excavation depth, based on 2007 soil sampling by TetraTech and earlier sampling (Wenck Associates, Inc., 2016). This contaminated soil was left in place. Additional excavation was completed along stormwater piping, in a linear area west of the sump removal area (fig. 4).
Removal of the stormwater piping may have allowed an increase in recharge and a rise in the water table in the aquifer. Prior to 2014, the contaminated aquifer in the former building area was only 1- to 2-ft thick; it increased to about 5- to 6-ft thick after 2014 (PIKA Arcadis, 2019).
Historical Plume Concentrations and Movement
In the plume in Unit 1 at Site K, historical TCE concentrations were generally highest in wells 01U609 and 01U611, which were located within the former Building 103 footprint and near the former sump area (fig. 4), although 01U609 was not part of the monitoring plan for yearly sampling. In the fiscal year 2018 Annual Performance Report, TCE concentrations in the Site K plume were a maximum of 1,500 micrograms per liter (µg/L), but several wells monitored in the core of the plume, including 01U611, were removed in 2014 (PIKA Arcadis, 2019). Prior to 2014, 01U611 had a maximum concentration of 11,000 μg/L (PIKA Arcadis, 2019). Historical maps of TCE concentrations placed both 01U608 and 01U609 inside the 1,000 µg/L contour for the plume (fig. 4), and 01U609 had particularly high concentrations. In 2000, TCE concentrations in samples from well 01U609 ranged from 61,000 to 110,000 µg/L (Sola, 20011). Thus, both 01U609 and 01U611 had historical concentrations above 1 percent of TCE solubility in water (or 1,100 milligrams per liter [mg/L] at 20 degrees Celsius [°C]), which indicates potential presence of groundwater contact with nearby DNAPL (Kueper and Davies, 2009). Abandoned wells 01U608, 01U609, and 01U611 were replaced by the USGS in 2020–21 as part of the treatability study. These wells are listed as 01U608R, 01U609R, and 01U611R in table 1.
Table 1.
Construction information for monitoring wells utilized during the bioremediation treatability study, Site K, former Twin Cities Army Ammunition Plant, Arden Hills, Minnesota, 2020–22.[Data from Mejia and others (2025). Dates are given in Month/Day/Year. USGS, U.S. Geological Survey; NAD 83, North American Datum of 1983; —, no sand pack; ft bls, feet below land surface; in., inches]
In addition to TCE, historical data show that the plume at Site K contained cisDCE and trans-1,2-dichloroethene (transDCE), which are likely produced by reductive dechlorination of TCE. However, cisDCE and transDCE were generally at concentrations more than an order of magnitude lower than the TCE concentrations, and VC generally was undetected. There are few historical measurements of constituents that would indicate the redox conditions in the plume.
The Site K plume trends northwest toward the excavation trench (fig. 4). Water-quality and water-level monitoring downgradient from the trench indicates that the trench typically captures the plume groundwater. An exception is that the TCE concentration in the downgradient well 01U603 was 5,600 μg/L in 2014, whereas TCE was not previously detected in this well (PIKA Arcadis, 2019). TCE concentrations decreased to 5.1 μg/L in fiscal year 2018 (PIKA Arcadis, 2019). High groundwater levels in April and May 2014 are believed to have mobilized TCE DNAPL in the former storm sewer bedding that was present underneath the former building footprint (PIKA Arcadis, 2019). Removal of the stormwater piping in 2014 may have allowed an increase in recharge and a rise in the water table elevation of the aquifer, as reported through 2018 (PIKA Arcadis, 2019). Historical water levels in 01U608, 01U609, and 01U611 were a maximum of 886.83–888.06 ft above mean sea level (PIKA Arcadis, 2019).
Previous Bioremediation Studies
Two pilot studies of enhanced bioremediation, both designed to promote reducing conditions and a subsequent increase in reductive dechlorination of TCE, were performed in the perched aquifer at Site K in 2000 (Sola, 2001). The locations of the studies’ test injection wells are shown in figure 4. The objective of the studies was to determine if bioremediation could be applied to the plume, leaving only the source area soils to be remediated and allowing the groundwater extraction system to be shut down. The field tests were conducted prior to the demolition of Building 103 (2006) and removal of the concrete and stormwater piping (2012–15).
The first test consisted of injection of 2,700 lb of commercially available Hydrogen Release Compound (HRC) in a 65-by-70-ft area of the aquifer beneath Building 103 (fig. 4), distributed through 89 injection points using a high-pressure pump. Although drilling showed that the aquifer was thinner than expected (about 2 ft thick), the injection location was not moved closer to the excavation trench, where the aquifer was known to be over 15-ft thick, because the goal was to treat the plume underlying the building. The results from monitoring conducted May–November 2000 showed that TCE concentrations in the test area did not change after HRC injection. Four monitoring wells were installed for performance sampling within and downgradient from the injection area, but one of these wells had insufficient water for sampling. Well 01U609 was upgradient from the test area and was used as a background monitoring location, although VOC concentrations were much higher in this well (61,000–110,000 μg/L) than in the injection area (140–1,600 μg/L) during the test period (Sola, 2001). The unexpectedly thin aquifer beneath the building area was believed to have caused the failure of the HRC injection test, either because the HRC was insufficiently hydrated or lost into the vadose zone (Sola, 2001).
The second test was conducted outside of Building 103, in the downgradient edge of the plume between well 01U615 and the trench, where the thickness of the perched aquifer extended to a depth of 24 ft bgs (Sola, 2001). This test consisted of hydrogen delivery to the aquifer through experimental gas permeable membranes, using an array of 16 injection and monitoring points in 3 rows within an 8-by-4-ft area. The goal of this test was to evaluate the use of a permeable bioremediation barrier to treat the groundwater transported from the source area as a potentially more cost-effective plume treatment than the groundwater extraction system.
The hydrogen was delivered in the first upgradient row of the array (fig. 4). Two additional monitoring wells were installed and sampled downgradient from the array, and well 01U615, located 8-ft upgradient from the first row of the injection array, was the planned background monitoring location. Natural advection and diffusion were found to distribute the hydrogen throughout the array and upgradient from well 01U615. The hydrogen gas test successfully showed a decrease in TCE concentrations and an increase in ethene, which indicated that complete reductive dechlorination of TCE was achieved. Thus, the hydrogen test indicated that native bacteria in the aquifer downgradient from the source area are capable of complete biodegradation of TCE, if stimulated using an electron donor. The bioremediation method, however, was determined to be relatively costly (Sola, 2001).
In addition to biotic reductive dechlorination, a natural attenuation microcosm study was conducted for the adjacent Building 102 plume and showed that abiotic degradation of cVOCs occurred at substantial rates (PIKA Arcadis, 2019). This abiotic degradation was believed to be associated with a reduction of iron and manganese oxides present in the sands in the aquifer, including magnetite. Abiotic degradation associated with magnetite was shown to be significant for cisDCE and 1,1-dichloroethene (11DCE) in the Building 102 plume (Ferrey and others, 2004). Similar abiotic degradation rates were determined for cisDCE and 11DCE in plumes in the glacial outwash sand aquifer at Site A at TCAAP (Ferrey and others, 2004). These sites had substantially lower TCE and DCE concentrations than the Site K plume, however.
Methods
Three work plans were submitted (dates indicated) and approved by the U.S Army for field work required for this study:
-
Site K Investigation Work Plan, Phase 1 (November 2020).—Collection of samples for laboratory tests and installation and sampling of one replacement well in the source area.
-
Site K Investigation Work Plan, Phase 2 (May 2021).—Installation and sampling of two additional replacement wells in the source area and hydrologic measurements.
-
Site K Treatability Work Plan, Phase 3 (August 2021).—Installation of the pilot test bioremediation injection well network and post-injection performance monitoring.
Pre-Design Site Characterization
Soil removal and site redevelopment activities at Site K through 2014 led to the abandonment of wells and a lack of soil and groundwater data in the core of the plume and near the suspected source area for the TCE after those activities. Soil coring, well installation, groundwater sample collection, and hydrologic measurements were completed during December 2020–July 2021 by the USGS to assist in developing a current conceptual site model (CSM) and to collect data and site materials needed for designing the field bioremediation test.
A direct-push coring rig was used to drill replacements of previously abandoned wells 01U608, 01U609, and 01U611 in the source area (table 1). Soil cores were collected in acetate liners at each location, recovering 1.75-inch (in.)-diameter cores to the base of the perched aquifer (Unit 1) to describe lithology and determine well screen placement. Intact soil cores were then collected in an adjacent hole at each location and used for well installation. Intact cores were capped, placed on ice, and sent overnight to the USGS Maryland-Delaware-DC Water Science Center (MD-DE-DC WSC) for sectioning of cores to obtain soil samples for VOC analyses. Soil samples (approximately 5 grams each) were placed in pre-weighed VOC vials containing 10 milliliters (mL) of methanol and stored in the refrigerator for a minimum of 48 hours of contact time. The methanol extract was then transferred to VOC vials and analyzed for VOCs within 14 days. The method used was the same as that applied to the water samples and is described in the “Groundwater Sampling and Geochemical Analyses” section. Remaining soil from the cores was transferred to mason jars that were filled to leave minimum headspace and refrigerated for use in microcosm experiments. Sandy soil from the aquifer was kept separately from clayey layers near the base of the aquifer.
Stainless-steel piezometers with 2-ft-long stainless-steel wire-wrapped screens were installed in the replacement wells 01U608R, 01U609R, and 01U611R (table 1). The piezometers were left undisturbed for a minimum of 24 hours after installation before development occurred. The piezometers were developed by removing a minimum of three casing volumes of water from the well using a peristaltic pump. Water-quality parameters, including temperature, pH, dissolved oxygen, and specific conductance, were measured and recorded using a water-quality meter during well development. Measurements were taken periodically during the purging process until the parameters stabilized. Sampling occurred 24 hours or more after well development.
Groundwater samples were collected from the replacement wells and from two existing wells (01U603 and 01U615) for the initial site characterization. Groundwater was collected using a peristaltic pump and dedicated tubing. Samples were analyzed for VOCs, field parameters, redox-sensitive constituents (nitrate, ammonia, sulfide, ferrous iron [Fe2+], methane), dissolved organic carbon, major ions, and metals using methods summarized in the “Groundwater Sampling and Geochemical Analyses” section. Groundwater was also collected from 01U611R, 01U603, and 01U615 for use in microcosm experiments described in the “Microcosm Experiments” section. Unfiltered water was collected for experiments in glass mason jars that were sterilized by autoclaving, rinsed with groundwater before filling with minimum headspace, and then refrigerated until use. Initial site characterization also included water-level measurements and slug tests of the newly replaced wells to obtain data for evaluation of groundwater flow directions and transmissivity in the perched aquifer. Hydrologic methods used in this initial site characterization are the same as those described in the “Performance Monitoring” section.
Microcosm Experiments
A series of anaerobic microcosm experiments was conducted to determine the natural degradation potential in the aquifer and to determine the amendments needed to enhance TCE biodegradation at the site (table 2). All treatments were prepared in an anaerobic chamber in 160-mL glass serum bottles closed with crimped butyl stoppers and contained 100 milliliters (mL) of liquid and 10 mL of solids. Water used in the microcosm treatments was either site groundwater or simulated groundwater, depending on the objective of the experiment. Simulated groundwater had a pH of 7.0 and contained 8.5 mg/L KH2PO4, 22 mg/L K2HPO4, 33 mg/L Na2HPO4, 10 mg/L Ca3(PO4)2, 1.25 mg/L FeCl3·6H2O, 18.5 mg/L (NH4)2SO4, and 25 mg/L MgSO4·7H2O. Solids used in the experiments included autoclaved sand for controls, sand incubated in site wells in passive microbial samplers (PMSs), or soil from cores collected at the site. Soil core samples were passed through a 2-millimeter sieve in an anaerobic glove chamber and thoroughly mixed before use in experiments. Microcosm experiments included treatments to evaluate different fast- and slow-release electron donors to support reductive dechlorination of TCE and amendments containing the WBC-2 dehalogenating culture to evaluate bioaugmentation. WBC-2 was obtained from SiREM Lab (Guelph, Ontario, Canada), where it is grown and maintained in large volumes.
Table 2.
Microcosm experiments conducted for bioremediation treatability test of trichloroethene (TCE), Site K, former Twin Cities Army Ammunition Plant, Arden Hills, Minnesota, 2020–22.[All microcosms were constructed with 100 milliliters (mL) total liquid volume, including water added and liquid amendments of donor and WBC-2, and 10 mL solids in 160 mL serum bottles. TCE was amended to all treatments to a nominal aqueous-phase concentration of 5 milligrams per liter (mg/L) at the start of the experiment (day 0), but the soil used in the treatments could also contribute TCE and other chlorinated ethenes. Microcosm treatments were constructed with duplicate bottles for sampling at each time point for the passive microbial sampler (PMS) and electron donor experiments and with triplicate bottles for the amendment timing and commercial products experiments. All microcosms were incubated between 22 degrees Celsius and 23 degrees Celsius. DIW, deionized water; mmol/L, millimols per liter; %, percent; v/v, liquid to liquid by volume; ft bgs, feet below ground surface; CS, corn syrup; VO, soybean-based vegetable oil; g/L, grams per liter; 3D, 3-D Microemulsion (Regenesis, San Clemente, California); TS, Terra Systems (Claymont, Delaware); ms, soil mass]
TCE was amended to all treatments to a nominal aqueous-phase concentration of 5 mg/L at the start of experiments (day 0) to achieve comparable aqueous concentrations in all treatments. Site water was purged using nitrogen gas to remove VOCs before microcosm preparation; however, VOCs were also present in the site soil used in many treatments.
For the first experiment (PMS experiment), the potential for anaerobic TCE biodegradation by the native microbial community in the perched aquifer was evaluated. PMSs were deployed for 8 weeks in monitoring wells 01U611R, 01U603, and 01U615 to obtain the native microbial community that prefers attachment to surfaces (fig. 4; table 1). The PMSs, which were tested as part of a previous study (Allen-King and others, 2021), were constructed in the USGS MD-DE-DC WSC of a fine stainless-steel mesh filled with clean drillers sand that was sieved to remove fines and autoclaved. The mesh was cinched using stainless-steel wire, and the assembled microbial samplers were autoclaved before wrapping in aluminum foil for storage and transport to the site. Two microbial samplers were linked sequentially and suspended for 8 weeks within and directly above the screened interval in each well using nylon string, allowing colonization of the sand by in situ microbial populations before retrieval. Upon retrieval, intact PMSs were placed immediately in autoclaved wide-mouth glass mason jars that were filled with groundwater from the respective well, which would contain the suspended microbial community and provide representative site geochemistry for the experiments. Jars were filled until minimal headspace remained and shipped on ice overnight to the USGS MD-DE-DC WSC laboratory. Microcosm treatment sets were constructed with the sand from the incubated PMSs and the associated water for each well and included treatments bioaugmented with WBC-2 (10 percent by volume). A control was prepared with autoclaved sand and deionized water (table 2). All microcosms were amended with 5 millimoles per liter (mmol/L) lactate, added as sodium lactate, as an electron donor.
In the second experiment, different electron donors (also known as carbon donors or substrates) were compared (table 2). Fermentation of the carbon donors releases hydrogen, which is the electron donor ultimately utilized by dechlorinating bacteria. Carbon donors were amended to achieve comparable hydrogen production ratios (Henry, 2010). The electron donors are designated as either fast-releasing compounds, which require continuous application or multiple applications at a site, or as slow-releasing compounds, which require fewer injections. This study tested lactate and corn syrup as fast-releasing donors and whey, soy-based vegetable oil (VO), and 3-D Microemulsion3 (3D; Regenesis, San Clemente, California) as slow-releasing donors. Lactate is the primary donor used to maintain and grow WBC-2 and, thus, provides a good baseline for comparison of WBC-2 activity for the other donors. Microcosms were constructed with soil collected from the perched aquifer at site 01U611R and simulated groundwater. Simulated groundwater was used for this experiment to eliminate possible matrix interference effects while comparing the donors. Each electron donor was tested in microcosms with and without added WBC-2 (10 percent by volume) to evaluate the need for bioaugmentation.
3-D Microemulsion is composed of a molecular structure with oleic acids (oil component) and lactates and polylactates.
An additional microcosm experiment was conducted to evaluate if altering the timing of the addition of the electron donors and WBC-2 would increase degradation rates and decrease the accumulation of cisDCE. In these microcosms, the electron donor was added at day 0 and again at day 7 in some treatments (table 2). This amendment-timing experiment focused on lactate and VO in different combinations as the electron donors. The addition of WBC-2 was delayed until day 7 in all the bioaugmented treatments. Soil from the perched aquifer at site 01U611R was again used in this experiment, but one treatment included silty soil collected from the base of the aquifer at a depth of 12.5–14.5 ft bgs. Groundwater collected from 01U611R was used in this experiment, rather than simulated groundwater, to obtain biodegradation rates representative of site conditions.
The final set of microcosm experiments focused on the selection of commercial products for use in the pilot test (table 2). Many donor products that are commercially available are mixtures of fast- and slow-releasing compounds in which lactate is often used as an initial fast-release donor in the mixtures. Commercially available VO is in the form of emulsified vegetable oil (EVO) to increase distribution within the treatment zone for bioremediation. Two commercial EVO products that could be used in the field pilot test were selected for evaluation in the next experiment: SRS-SD from Terra Systems (Claymont, Delaware) and EOS Pro by EOS Remediation (Cary, North Carolina). Both products contain a fast-release donor: 5.5 percent sodium lactate in the SRS-SD and 4 percent of a glycol-based donor in EOS Pro. The slow-release components of both commercial mixtures consisted of 60-percent EVO. Both mixtures also contained vitamin B12 and micronutrients to enhance microbial activity. The EVO products were compared to two commercial fast-release lactate products (table 2).
All these microcosms were incubated in an anaerobic chamber at room temperature (22 °C to 23 °C). Microcosm treatments were prepared in duplicate or triplicate for repeated aqueous sampling from the bottles, until the last sampling time point when bottles were sacrificed. Duration of the experiments varied between 22 and 63 days with 5–7 sampling points (Mejia and others, 2025). For all experiments, aqueous samples were withdrawn at each time point for analysis of VOCs and hydrocarbon gases, including methane, ethene, ethane, and acetylene. VOC samples were collected in duplicate in 4 mL glass vials with Teflon-lined septa and preserved with one drop of 1-to-1 hydrochloric acid. Water samples (2 mL each) were collected in duplicate for hydrocarbon gas analysis by injecting them into 20 mL serum bottles with butyl rubber stoppers that were pre-prepared with preservative and purged with nitrogen gas as previously described (Majcher and others, 2007; Lorah and others, 2022). For select treatments, aqueous samples were also collected at some time points for analysis of nonvolatile dissolved organic carbon, volatile fatty acids (VFAs), and major ions (refer to the “Groundwater Sampling and Geochemical Analysis” section for more information).
Bioremediation Pilot Test Design and Implementation Methods
Pilot Test Design
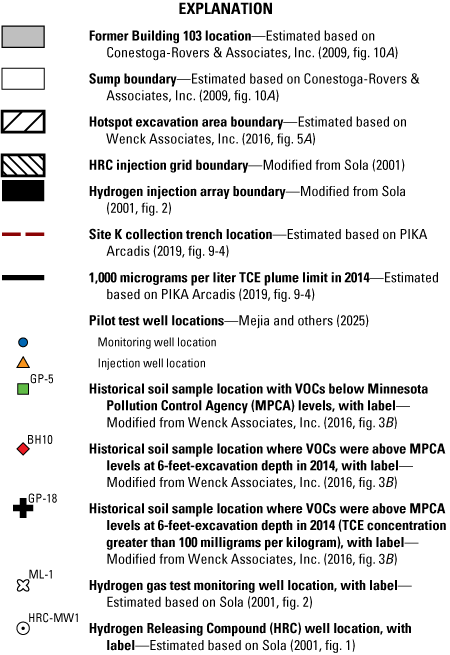
The limited hydrologic data available after the removal of the building infrastructure and the heterogeneous distribution of TCE in the shallow perched aquifer at Site K added complexity to designing a pilot test to evaluate bioremediation. To maximize site data, the selected pilot design utilized three separate areas of Site K for field tests and are referred to in this report as the GS1, GS2, and GS3 treatment areas or test plots (fig. 5). Field tests were conducted in each treatment area using one injection well surrounded by monitoring wells, a test design similar to a modified push-pull test (Solutions-IES, Inc., 2006). Monitoring locations were placed along presumed (and most likely downgradient and lateral) transects in each treatment area, providing more monitoring wells than typical for a push-pull test. The modified push-pull tests allowed the effects of variable field conditions, including variable groundwater flow directions and TCE distribution, to be captured and design gaps to be assessed without making the assumptions required for a larger-scale pilot test. Design parameters needed for a full-scale remedy, including the injection radius of influence (ROI), groundwater velocities, and distribution of electron donor and culture (Battelle Memorial Institute and others, 2002; Solutions-IES, Inc., 2006; Interstate Technology and Regulatory Council, 2020), were thus obtained in each treatment area.
Map showing locations of injection and monitoring wells used during the bioremediation pilot test at Site K, former Twin Cities Army Ammunition Plant, Arden Hills, Minnesota, October 2021–22.
Treatment areas include GS1 and GS2 in the plume source area near the former sump and GS3 in the downgradient, dissolved plume (fig. 5). A total of 42 wells were installed for the pilot test: one injection well and 13 monitoring wells (numbered MW1 through MW13) per treatment area (fig. 5; table 1). The name of each well indicates the treatment area in which it was installed. For example, GS1-I is the injection well of treatment area GS1.
Each area’s MW1 was installed upgradient from its respective injection well to provide a control for areas affected by amendment injections. The remaining monitoring locations could provide the distribution of amendments in three directions from the injection well. Each treatment area is approximately 30 ft wide by 60 ft long. These dimensions were calculated to enable 1 year of amendment monitoring based on the estimated ROI and groundwater velocity in the area determined from the pre-design characterization and include an adequate margin of safety, per guidance from Battelle Memorial Institute and others (2002), Solutions-IES, Inc. (2006), and standards of practice.
Injection and Monitoring Well Installation and Well Development
Stainless-steel drive-point wells were installed as injection and monitoring wells between September 23 and 27, 2021, for the pilot test (table 1). Well installation logs are provided in Mejia and others (2025). Soil cores were collected using a direct-push drilling rig prior to installation of the injection wells (GS1-I, GS2-I, and GS3-I) and at GS3-MW8 to verify the thickness of the saturated soil and the depth to the aquitard (Unit 2) beneath the perched aquifer. Wells were installed in the same boreholes used for soil core collection. VOC vapor concentrations were measured using an 11.7 eV photoionization detector, and lithologic descriptions were recorded for the collected soil. Soil cores were collected at select locations in acetate liners and sent overnight to the USGS MD-DE-DC WSC to obtain soil samples for VOC analyses, as collected during the initial site characterization.
Wells were then installed using a gas-powered jackhammer. Injection wells consist of 2-in. diameter stainless-steel casing and stainless-steel wire-wrapped mesh screens. Screen lengths were between 2 and 5 ft long (table 1), based on the minimum saturated thickness of the perched aquifer in the treatment plot, determined by the stratification between the sand aquifer and the underlying aquitard that was determined during core interpretation. The screened interval of the injection wells was set at the base of the aquifer. About 0.5 ft was advanced into silty and clayey layers at the base of the aquifer in GS1 and GS2 plots. Injection wells included a 40-mesh sand pack with a bentonite seal.
Two monitoring wells in each treatment area (numbered MW4 and MW8) were constructed with 2-in.-diameter stainless-steel casings and screens to accommodate pressure transducers for continuous monitoring of water levels and specific conductance. All other monitoring wells have 1.25-in.-diameter casings and screens (table 1). Monitoring wells have stainless-steel wire-wrapped screens that are 2–5-ft long, consistent with the screened interval of the injection well in each treatment area.
The monitoring wells were developed from September 28 through October 6, 2021, by mechanically surging by hand using 0.75-in. Waterra (Peshastin, Washington) tubing with foot valves to remove most of the sediment present in the well. The wells were then pumped from the bottom of the screen using the same tubing and a peristaltic pump until the water ran clear. Water-quality parameters, including temperature, pH, dissolved oxygen, and specific conductance, were measured using a water-quality meter during well development until the parameters stabilized.
Some wells required an additional well development technique because of extremely low water production. Tap water was added to the wells to bring the water level to the top of the screened interval, and the well was surged by hand using a well scrubber consisting of threaded metal rods with rubber washers to fit snugly inside the well casing. The well scrubber was plunged 20 times, then the water was hand-pumped from the well using the Waterra tubing and foot valve. This process was repeated at least five times at each well. Water levels were taken before surging and periodically after the final round of surging until the water level returned to the pre-surging static level. If the well recovery time was deemed inadequate, another set of five rounds of mechanical surging was performed. This technique was performed on the following wells: GS1-MW10, GS2-MW5, GS2-MW8, GS2-MW11, GS3-MW3, GS3-MW4, GS3-MW6, and GS3-MW7.
Amendment Injections
The EVO donor SRS-SD was selected from the laboratory microcosm experiments for biostimulation in the field test. The SRS-SD loading was based on calculations that included the soil contaminant mass and a target of no more than 1 percent of the total pore volume of the desired treatment zone. Effluent from the Site K air-stripping plant was used as clean site water for dilution and flushing of the donor mix. The amendment was diluted with clean site water at a total ratio of 1 to 10 (table 3) to prevent clogging and fouling of the injection well and surrounding matrix. A conservative bromide tracer (250 mg/L sodium bromide) and pH buffer (2 mg/L Nabicarb baking soda) were added to the donor-flush mixture before injection. KB-1 Primer was also added to ensure anaerobic and buffered conditions in the injection solution. Injection of the donor mixture was completed between October 19 and 21, 2021, as described in table 3. Water levels (continuous in MW4 and MW8 in each treatment area) and specific conductance were monitored in nearby wells during injection. To confirm initial donor concentrations, samples were collected from the injection wells within 2 days of donor injection to measure total organic carbon (TOC), using the method described for performance monitoring in the “Groundwater Sampling and Geochemical Analyses” section. The injection wells had TOC concentrations ranging from 686 mg/L (GS2-I) to 1,470 mg/L (GS3-I; Mejia and others, 2025), confirming the donor input concentration.
Table 3.
Biostimulation injection details and well responses measured in nearby monitoring wells, Site K, former Twin Cities Army Ammunition Plant, Arden Hills, Minnesota, 2021.[Dates are given in Month/Day/Year. Biostim, biostimulation; SRS-SD, Terra Systems enriched emulsified soybean-based vegetable oil; gal/min, gallons per minute; ft, foot; <, less than; NA, not applicable]
For bioaugmentation, WBC-2 was obtained under the name KB1+ from SiREM Lab (Guelph, Ontario, Canada). Bioaugmentation was done after monitoring indicated that reducing conditions and TOC concentrations in the monitoring points closest to the injection well were conducive for reductive dechlorination of TCE (Borden, 2017). The volume of WBC-2 needed to provide an 8-percent mix of culture in the aquifer was calculated using the saturated thickness and porosity. WBC-2 was diluted into an anaerobic solution prepared with added KB-1 Primer to ensure anaerobic and buffered conditions in the injection solution and then injected into each of the injection wells. WBC-2 injection was followed by injection of the clean site water, mixed with KB-1 Primer to ensure anaerobic conditions, to minimize fouling near the well screen. WBC-2 injection was completed between November 30 and December 2, 2021, 40 to 43 days after donor injections in the three treatment areas (tables 3, 4).
Table 4.
Bioaugmentation injection details and well responses measured in nearby monitoring wells, Site K, former Twin Cities Army Ammunition Plant, Arden Hills, Minnesota, 2021.[Dates are given in Month/Day/Year. Bioaug, bioaugmentation; kg, kilograms; gal/min, gallons per minute; ft, foot; NA, not applicable]
Performance Monitoring
Performance objectives were defined for the 1-year bioremediation pilot test at Site K to guide the monitoring approach, including the measurement of hydrologic characteristics, selection of geochemical and microbiological analyses, and sampling frequency. The performance objectives were as follows:
-
• induce and maintain reducing conditions in the shallow aquifer that are suitable for reductive dechlorination of TCE throughout a 1-year monitoring period;
-
• enhance the anaerobic degradation of TCE following injection of the dehalorespiring culture (WBC-2) so that the accumulation of chlorinated daughter products, primarily DCE and VC, is limited;
-
• evaluate distribution of amendments in the test area and their association with degradation of TCE and chlorinated daughter products over the 1-year monitoring period; and
-
• collect hydrologic and engineering data needed for the consideration of a full-scale bioremediation remedy, including defining the ROI, optimal pumping rate into the aquifer, hydraulic gradient, and fouling or clogging of aquifer pore space caused by donor addition in the three test areas.
Hydrologic measurements were made to evaluate groundwater flow directions and characterize temporal changes in water table elevations. Geochemical constituents measured to assess the efficacy of the bioremediation test included concentrations of TCE and associated degradation products, dissolved gases, cations, anions, redox constituents, organic acids, total and dissolved organic carbon, alkalinity, and compound specific isotope analysis (CSIA) for stable carbon isotopes (table 5). Samples were also collected for microbial community analyses to monitor the movement of the injected culture. Field parameters (specific conductance, pH, and temperature) were also measured to assist in evaluating the movement of the injected amendments and the conditions for microbial activity. Hydrologic, geochemical, and microbial analytical methods are given in the following sections.
Table 5.
Geochemical and microbial parameters analyzed and their relevance to performance monitoring for the bioremediation pilot test for trichloroethene, Site K, former Twin Cities Army Ammunition Plant, Arden Hills, Minnesota, 2021–22.[All geochemical methods refer to dissolved constituents in the groundwater. EPA, U.S. Environmental Protection Agency; VOC, volatile organic compound; GC/MS, gas chromatography/mass spectrometry; MD-DE-DC WSC, Maryland-Delaware-DC Water Science Center; TCE, trichloroethene; DCE, dichloroethene; VC, vinyl chloride; GC/FID, gas chromatography/flame ionization detector; TOC, total organic carbon; NVDOC, nonvolatile dissolved organic carbon; RBPGL, Reston Biogeochemical Processes in Groundwater Laboratory; LMWOA, low molecular weight organic acid; δ13C, stable carbon isotope ratio; DNAPL, dense non-aqueous phase liquid; RML, Reston Microbiology Laboratory]
| Parameter(s) | Analytical method | Location of analysis | Relevance |
|---|---|---|---|
| pH, temperature, and specific conductance | Water-quality meter | Field | pH and temperature affect microbial activity and degradation rates. Specific conductance can change with the distribution of the amended donor. |
| VOCs | Purge and trap GC/MS by modified EPA Method 524.2 (Majcher and others, 2007) | MD-DE-DC WSC | A decrease in TCE and an increase in DCE and VC indicate reductive dechlorination. |
| Dissolved gases (methane, acetylene, ethene, ethane) | Headspace analysis by GC-FID | MD-DE-DC WSC | An increase in ethene and (or) ethane indicates complete biotic reductive dechlorination. The presence of acetylene indicates abiotic reduction, and the presence of methane indicates highly reducing conditions suitable for complete dechlorination. |
| Manganese | Colorimetric; HACH Method MN-5 | Field or MD-DE-DC WSC | High reduced manganese (Mn2+) or total dissolved manganese indicates suitable reducing conditions for the initial steps of TCE reductive dechlorination. |
| Ferrous and ferric iron | Spectrophotometer; bipyridine method | MD-DE-DC WSC | High ferrous iron relative to ferric iron indicates suitable reducing conditions for the initial steps of TCE reductive dechlorination. |
| Sulfide | Spectrophotometer; methylene blue method | MD-DE-DC WSC | Indicates sulfate reduction and suitable reducing conditions for TCE reductive dechlorination. |
| Nitrate and ammonium | Spectrophotometer; HACH TNT methods | Field or MD-DE-DC WSC | High concentrations of ammonium and low or undetectable concentrations of nitrate indicate reducing conditions and distribution of amended donor. |
| TOC and NVDOC | Spectrophotometer Hach Method 10267 | MD-DE-DC WSC | An increase indicates the distribution of the amended donor to support TCE reductive dechlorination. |
| Shimadzu TOC-L Total Organic Carbon Analyzer | RBPGL | ||
| LMWOA | Dionex Ion Chromatograph | RBPGL | Indicates distribution and fermentation of the amended donor to support TCE reductive dechlorination. |
| Alkalinity | Titration | RBPGL | An increase in alkalinity can occur with microbial reactions. |
| Anions (chloride, sulfate, nitrate, phosphate, bromide, fluoride) | Ion Chromatograph | RBPGL | An increase in chloride by more than 2 times baseline indicates TCE reductive dechlorination. A decrease in sulfate indicates sulfate reduction. An increase in bromide can indicate movement of the tracer added to the donor. |
| Major cations and trace elements | Inductively Coupled Plasma-Optical Emission Spectroscopy | RBPGL | Changes can indicate distribution and effects of amendments and the presence of trace elements needed for microbial activity. |
| Inductively Coupled Plasma-Mass Spectrometer | |||
| Compound specific isotope analysis for δ13C | Gas-chromatography-isotope-ratio-mass-spectrometer with connected purge and trap | SiREM Lab1 | A δ13C increase of greater than 2 per mil between parent (TCE) and daughter compounds supports active biodegradation. Decreases in δ13C of TCE can indicate DNAPL dissolution or desorption. |
| Microbial community2 | Amplicon-based high throughput sequencing | RML | Spatial and temporal changes in microbial community composition and abundances can occur with donor and WBC-2 culture amendment. Increases in populations present in WBC-2 can show the distribution of bioaugmented culture. |
Hydrologic Methods
Continuous and synoptic water-level measurements were part of the 1-year monitoring period for the field pilot test to define head gradients and groundwater flow directions to fill this gap in the CSM. Static water levels were measured manually using an electronic sounding tape for the synoptic events, and continuous water levels were measured using pressure transducers using procedures in accordance with Sauer (2002). All water-level data are available via the U.S. Geological Survey (2025). Water table elevation was monitored by 52 wells (table 1), including 7 pre-existing wells at the site, the 3 replacement wells installed during the initial site characterization, and the 42 wells installed for the bioremediation pilot test. Nine of these wells, including all MW4 and MW8 wells and the 3 replacement wells, are monitored for continuous water levels. Ten of these wells were installed prior to the bioremediation study taking place. Forty-two of the wells were installed in three nests to inject the bioremediation materials and monitor their movement through the aquifer. Synoptic water-level measurements were obtained using an electric sounding tape before baseline sampling in October 2021 and then monthly beginning in January 2022. Water levels were also collected from the monitoring wells and the injection wells during water-quality sampling. Wells 01U607 and 01U618 were added to the synoptic water-level network to provide a larger spatial extent for interpolation of water table surfaces. In addition, tracer injected with the donor amendment was monitored to help determine groundwater flow directions and distribution of injected amendments.
Water-level data were analyzed using Surfer 26.1.216 (Golden Software, LLC, 2023). Groundwater-level data and well coordinates were imported into Surfer, and a water table surface was interpolated using the Kriging gridding method. Hydraulic conductivity was obtained through slug tests of the injection wells (Mejia and others, 2025) using USGS guidelines (Cunningham and Schalk, 2011). During the initial site characterization, slug tests were performed at 01U603, 01U615, 01U608R, 01U609R, and 01U611R between April and June 2021. Slug tests were also conducted in the injection well of each treatment area three times over the course of the 1-year pilot test to monitor potential decrease in aquifer permeability from donor amendment. Rising- and falling-head tests were done at each well. A pressure transducer was used to measure water-level change during each test, recording data at 0.25- to 60-second intervals depending on the water-level recovery rate. Manual water-level measurements collected with an electric sounding tape were used for transducer calibration.
Groundwater Sampling and Geochemical Analyses
Performance monitoring over the 1-year pilot test included sampling all the monitoring wells in the three treatment plots for all the geochemical and microbial constituents listed in table 5, excluding CSIA, during five sampling events: a baseline sampling event immediately prior to donor injection in October 2021 and additional “quarterly” sampling events after the completion of the donor injection until October 2022. These quarterly sampling events occurred in February 2022 (first quarter [Q1]), May 2022 (second quarter [Q2]), July 2022 (third quarter [Q3]), and October 2022 (fourth quarter [Q4]). Some monitoring wells could not be sampled during the quarterly sampling events because they were dry, especially in area GS2. CSIA was sampled only during the Q4 sampling event. The quarterly events started after injections of both the donor and the WBC-2 culture had been completed. In addition to these five sampling events, select wells in each treatment area were sampled for select constituents after the donor injection to verify initial donor movement and establishment of reducing conditions, referred to as the post-biostimulation sampling, and again after the WBC-2 injection, referred to as the post-bioaugmentation sampling. Between quarterly sampling events, select sampling was also done monthly beginning in June 2022 to provide additional temporal data.
Monitoring wells were purged using low-flow pumping and pre-washed dedicated tubing until water-quality parameters, including temperature, pH, and specific conductance, stabilized before collecting groundwater samples. VOCs, dissolved gases, and redox-sensitive constituents were sampled first. Unfiltered samples were collected for VOCs in triplicate 8-mL glass vials with Teflon-lined septa caps and acidified with one to three drops of 1-to-1 hydrochloric acid. Unfiltered water samples (2–5 mL) were collected in duplicate for dissolved gases (methane, acetylene, ethene, ethane) in 20-mL serum bottles with rubber stoppers, which had been prepared with the addition of sodium phosphate tribasic as a preservative and purged with nitrogen gas before sample collection. VOCs and dissolved gas samples were sent for analysis to the USGS MD-DE-DC WSC. VOCs were analyzed using a modified version (as described in Majcher and others, 2007) of EPA Method 542.2 on a purge and trap gas chromatograph with a mass spectrometer (GC-MS) and a headspace autosampler; dissolved gases were analyzed by gas chromatography with a flame ionization detector (Majcher and others, 2007; Lorah and others, 2022).
Samples for the redox constituents of nitrate, ammonium, and reduced manganese were filtered through a 0.2-micrometer (μm) filter and analyzed in the field using Hach test kits and a Hach DR 2800TM spectrophotometer (Hach, Loveland, Colorado; table 5). Samples for total dissolved iron and ferric iron (Fe3+) were filtered (0.2 μm), fixed with reagents in the field according to the colorimetric bipyridine method, and then refrigerated until analyzed on the spectrophotometer in the laboratory (Baedecker and Cozzarelli, 1992). Ferrous iron (Fe2+) is calculated as the difference in total dissolved iron and Fe3+ using this method. For each lot of test kit vials or reagents, the calibration of the spectrophotometer was confirmed using standards purchased from Hach. For sulfide, unfiltered samples were collected and analyzed in the field using the methylene blue method and a spectrophotometer. An exception to field measurements of these redox constituents occurred for the February sampling event when travel was restricted; for this event, samples for the redox constituents were collected in 40-mL VOC vials and sent on ice overnight to the MD-DE-DC WSC for processing within 24 hours.
Additional 0.2-μm filtered samples were collected for analyses of nonvolatile dissolved organic carbon (NVDOC), low molecular weight organic acids (LMWOA), major cations, anions, and trace elements and sent to the USGS Reston Biogeochemical Processes in Groundwater Laboratory (RBPGL). Major cation and trace element samples were preserved in the field with nitric acid to a pH less than 2 and analyzed by inductively coupled plasma-optical emission spectroscopy and inductively coupled plasma-mass spectrometer. NVDOC samples were preserved with hydrochloric acid to a pH less than 2 and analyzed using a combination high temperature combustion, nondispersive infrared detector method on a Shimadzu TOC-L Total Organic Carbon Analyzer. LMWOA samples were frozen and shipped on dry ice to RBPGL for analysis by ion chromatography. The other samples for geochemical analyses were shipped on wet ice.
Distribution of electron donor was assessed through the monitoring of TOC or NVDOC and specific conductance in groundwater in the post-biostimulation, post-bioaugmentation, monthly and quarterly sampling events. During the post-biostimulation and post-bioaugmentation sampling events, TOC samples were analyzed at the USGS MD-DE-DC WSC using Hach Test 'N Tube methods (Hach, Loveland, Colorado), whereas NVDOC samples were collected and analyzed at RBPGL for other sampling events as previously described. Select samples also were analyzed for VOCs, dissolved gases, and bromide (as part of the anion analysis) to verify donor movement and redox conditions in the post-biostimulation and post-bioaugmentation sampling events. NVDOC and LMWOA analyses in the baseline and quarterly sampling events were also used to assess changes resulting from the donor injection; however, only TOC was analyzed if the sample volume was limited for a monitoring well.
Samples for CSIA analysis were collected only from selected wells during the last sampling event. Unfiltered samples were collected in 500-mL amber glass bottles with Teflon-lined septa. CSIA samples were shipped on ice to the laboratory through SiREM Lab for analysis of the ratio of stable carbon isotopes 13C to 12C, expressed in the delta notation δ13C, in TCE, cisDCE, transDCE, and VC by isotope ratio mass spectrometry with connected purge and trap. The Vienna Peedee Belemnite (VPDB) was used as the standard for the carbon isotope analyses. Naturally occurring 13C and 12C are present in TCE and associated degradation products. Microorganisms will preferentially degrade TCE containing the lighter 12C isotopes before the 13C. Thus, an increase in δ13C above the natural abundance is an indication of microbial degradation (Hunkeler and others, 2008).
Quality Control and Assurance of Geochemical Analyses
Samples collected during the pilot test for quality control and assurance included field replicates, equipment blanks, field blanks, and trip blanks. Analytical and field sample results are reported in Mejia and others (2025). Field replicates were designated with an “R” in the sample identification (ID) number and were collected concurrently with their nonreplicate counterparts to achieve a 20-percent field replicate coverage relative to field samples. Replicate collected was in part directed by field and site conditions (for example, well production). Field sampling reproducibility was assessed using relative percent difference (RPD):
whereRPD
is the relative percent difference (in percent, %),
sample–replicate
are concentrations in paired replicate field samples, and
is the mean concentration of the paired samples.
Of 451 regular field samples (each representing multiple sample containers for analysis of different constituents), 67 field replicates were collected, representing a replicate coverage of approximately 15 percent. This resulted in approximately 6,200 discrete analytical results for field replicates relative to 38,200 total analytical results, or 16 percent. Of these, 1,239 results had detected concentrations that permitted RPD calculations. The RPD distribution for constituents grouped by analytical method is shown in table 6, and the RPD distribution for select aqueous constituents is presented in table 7.
Table 6.
Relative percent difference ranges for field replicate samples in select analyte groups, in percent.[n, number of replicate samples; VFAs, volatile fatty acids; VOCs, volatile organic compounds; n, number of replicate sample pairs]
Table 7.
Relative percent difference range for field replicate samples for key aqueous target analytes, in percent.[n, number of replicate sample pairs; NVDOC, nonvolatile dissolved organic carbon; TOC, total organic carbon]
Field replicate RPDs ranged from 0 to 181 percent. The study-wide mean was 13.3 percent, and the median was 4.5 percent across all analyses. The mean RPDs for each constituent group were below 20 percent except for aqueous VOCs, driven in part by inconsistent detections of 1,4-dichlorobenzene (0.5–8.8 µg/L, n=55, mean RPD 66.5 percent, median RPD 65.7 percent) in field replicates as well as field and trip blanks. Because 1,4-dichlorobenzene was not a target VOC for this study, the higher RPD for this VOC is not concerning.
Four equipment blanks were collected in the laboratory in preparation for the field sampling for the pilot test to evaluate possible contamination from the equipment. The equipment blanks consisted of ultrapure deionized water that was pumped through the equipment to be used in the field and filtered if required for the sample analyte. Bromide (17 µg/L, n=1), chloroform (0.6–1.6 µg/L, n=2), and toluene (1.3 µg/L, n=1) were the only detected compounds in the equipment blanks.
During field sampling, trip and field blanks were included in each event, resulting in a total of 40 trip blanks and 21 field blanks. Trip blanks were prepared in the laboratory each sampling day for VOCs exclusively using ultrapure deionized water to fill a 40-mL VOC vial without headspace. Trip blanks were then carried inside a cooler with field samples throughout the sampling day and during transport to the laboratory where both sample types were analyzed. Field blanks were collected for each sampling event from ultrapure deionized water that was pumped, filtered (if required for the sample analyte), and transferred into sample containers onsite in the same manner as field samples. Field blanks were collected for all analytes except CSIA.
For the chlorinated VOCs that are contaminants of concern at the site (TCE, DCE compounds, and VC), only TCE was detected in four trip blanks collected in 2021 on October 18 (7.8 µg/L), October 19 (77.4 µg/L), October 20 (4.7 µg/L), and December 15 (0.7 µg/L), respectively. Other VOCs detected in trip blanks were chloroform (0.5–3.4 µg/L, n=29); 1,4-dichlorobenzene (0.7–2.8 µg/L, n=18); toluene (0.5–9.4 µg/L, n=14); m+p-xylenes (0.5–0.6 µg/L, n=5); cis-1,3-dichloropropene (2.6 µg/L, n=1); and 1,1,2,2-tetrachloroethane (1.3 µg/L, n=1).
Field blanks showed no detections of the chlorinated VOCs that are contaminants of concern at the site. Chloroform (0.5–3.12 µg/L, n=16), toluene (3.7–9.2 µg/L, n=8), and 1,4-dichlorobenzene (0.7–3.9 µg/L, n=8) were commonly detected VOCs. Anions and metals were detected above method limits of quantification infrequently in the field blanks and at low concentrations, as summarized in table 8. Frequent detections of chloroform and toluene in equipment, trip, and field blanks are not unique to this study; in historical data collected by the USGS, chloroform was detected in 19.7 percent of field blank samples, and toluene appeared in 38 percent of field blank samples (Thiros and others, 2011). Although absent in data reported by Thiros and others (2011), the frequent presence of 1,4-dichlorobenzene in field samples and various blanks also indicates laboratory contamination as a possible cause in this study.
Table 8.
Range and distribution of concentrations of aqueous analytes detected in field blanks, in micrograms per liter.[n, number of blank samples in which the analyte was quantifiable; NA, not applicable]
Microbial Community Analysis
Microbial communities were analyzed on soil core samples that were collected before monitoring well installation, soil slurry samples collected from microcosms, and groundwater samples collected during performance monitoring for the pilot test. All soil samples collected in the field were placed on dry ice and shipped to the USGS MD-DE-DC for storage in a −80°C freezer; microcosm soil slurry samples were placed directly in the −80°C freezer at USGS MD-DE-DC. For analysis, soil and soil slurry samples were placed on dry ice and transferred to the USGS Reston Microbiology Laboratory (RML), where they were stored at −80°C until DNA extractions were performed. Groundwater samples were collected during the baseline and quarterly sampling events for microbial analyses. The same sterile 0.2 μm Sterivex capsule filters used for water sample collection were retained for microbial community analyses. Additional groundwater was filtered, if necessary, to reach a goal of 1 liter of sample or until the filter was clogged. The filters were capped in the field, sealed in plastic bags, and placed on dry ice for storage and shipping to the RML for storage at −80°C until analysis. Details on DNA extraction, sequencing, and sequence data analysis are provided in Mejia and others (2025). Briefly, raw sequence data were processed using MOTHUR version 1.48 using the MOTHUR MiSeq standard operating procedure (Kozich and others, 2013) as implemented in (Mumford and others, 2020). Processed data were analyzed in R using the phyloseq package and visualized using the ggplot2 package (McMurdie and Holmes, 2013; Wickham, 2016; R Core Team, 2024). Eighteen samples that returned fewer than 10,000 reads were considered as failing quality control and were excluded from analysis. Extraction blanks were prepared by the RML, and sequencing preparation blanks were prepared by the sequencing facility. Extraction blanks were prepared by the RML, and sequencing preparation blanks were prepared by the sequencing facility. Microbial sequence data are available via the National Center for Biotechnology Information database under accession PRJNA1188552 (U.S. Geological Survey, 2024).
Pre-Design Site Characterization
Before implementing the bioremediation pilot test, site characterization was completed to update the CSM at Site K after the soil excavation and site redevelopment activities. Groundwater flow conditions, response of the groundwater in the perched aquifer to precipitation, and soil and VOC concentrations in the aquifer in the suspected source area after the excavation were evaluated. The hydrogeology and soil and groundwater quality determined during the initial site characterization are compared to historical data to discuss the CSM.
Hydrogeology
The lithology at the replacement well sites (01U608R, 01U609R, and 01U611R) that were installed near the TCE source area at Site K differed from available descriptions of the original sites (01U608, 01U609, and 01U611) at a depth of 1 to 4 ft bgs (Mejia and others, 2025). Previous lithologic descriptions noted medium to coarse sand below 1-ft-thick concrete, whereas uniformly fine to medium sand was present at the replacement well sites because of backfilling with clean sand after soil excavation (fig. 4). Fine to medium sand was present at the replacement well sites below a 0.3-ft-thick soil zone to a depth of 6.4–9.0 ft, where the gray clay that marks the aquitard began at wells 01U608R, 01U609R, and 01U611R (Mejia and others, 2025). Soil cores collected later at GS1-I, a well installed for the pilot test near well 01U611R, showed a similar depth to the top of the lower aquitard of 7.8 ft (Mejia and others, 2025). Screens (2-ft long) in the replacement wells were placed at the bottom of the perched aquifer to obtain TCE concentrations that could be affected by residual DNAPL or sorbed TCE associated with the clay at the base of the aquifer. Downgradient from the source area close to the trench, the depth to the basal aquitard was about 20 ft in soil cores at well site GS3-I installed for the pilot test (Mejia and others, 2025), confirming that the perched aquifer thickens near the trench as previously reported (fig. 2).
Site redevelopment activities did not appear to alter the relatively low horizontal head gradients in the source area, as evidenced by the similar water-level elevations among the wells near the source area in 2003–5 compared to those in 2021 (fig. 6). The effect of the excavation trench is seen in the lower water-level elevations in 01U603 and 01U615 compared to the source area, historically and in 2021 (fig. 6). Water-level data collected in the source area during the pre-design characterization indicated substantial seasonal changes in water-level elevations, decreasing by more than 2 ft in July 2021 compared to May 2021 (fig. 6), and a rapid response to precipitation (fig. 7). As a result of removal of concrete foundations and stormwater drains, the water table could show a greater response to recharge events and potentially increase the horizontal flow gradient. Historical continuous water-level measurements, however, are not available to determine if site redevelopment has altered the hydrologic response. Removal of the stormwater piping in 2014 was hypothesized to have resulted in increased recharge to the aquifer, causing a rise in the water table that was observed from 2014 through 2018 (PIKA Arcadis, 2019). The maximum historical water-level elevations in 01U608, 01U609, and 01U611, which were measured in 2014, were similar to the water levels measured in May 2021 in the source area (fig. 6).
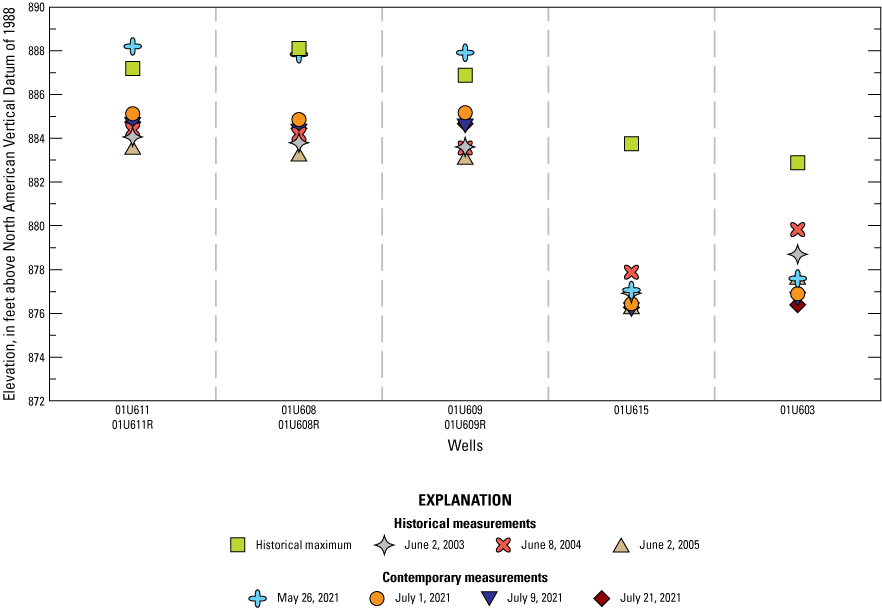
Plot showing water-level elevations measured in Unit 1, Site K, former Twin Cities Army Ammunition Plant, Arden Hills, Minnesota, in 2003–5 and in May (Shawn Horn, GHD Group Pt, Ltd., written commun., 2021) and July 2021 (U.S. Geological Survey, 2025). The historical maximum water levels occurred in fiscal year 2014, but the date is not reported (PIKA Arcadis, 2019).
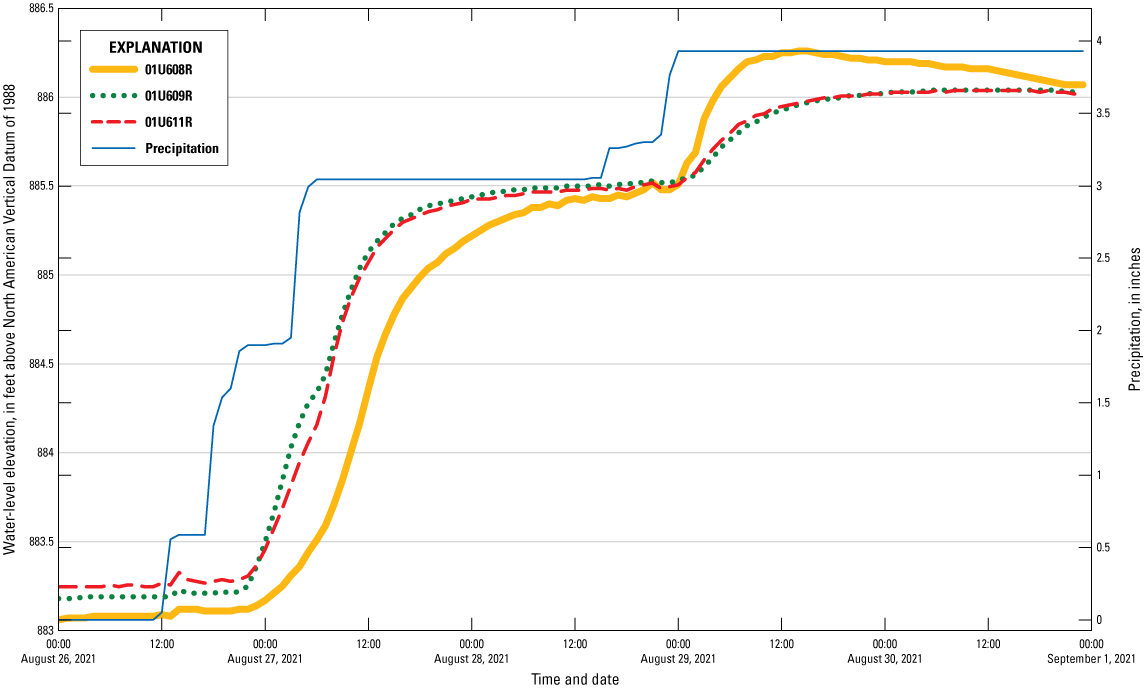
Line graph showing water-level elevations from pressure transducer measurements collected in wells 01U608R, 01U609R, and 01U611R, and precipitation measurements collected at Site K, former Twin Cities Army Ammunition Plant, Arden Hills, Minnesota, August 26–30, 2021. Data are from U.S. Geological Survey (2025).
The 2021 hydraulic head measurements and slug tests were used to calculate horizontal hydraulic conductivities (Kh) and flow velocities at the site to design the placement of injection and monitoring wells for the pilot test. Slug tests were conducted in the replacement wells 01U608R, 01U609R, and 01U611R and in the two existing wells near the trench, 01U603 and 01U615 (Mejia and others, 2025). The Kh determined from the two existing wells were substantially lower than those obtained from the replacement wells, possibly because of screen deterioration or another localized problem; thus, only slug test data from the replacement wells were used (table 9). The most probable calculated values of Kh for the perched aquifer at Site K ranged from about 5 to 9 feet per day (ft/d; table 9). Bulk density measurements of soil core samples (standard measurement of the weight of known volumes of dried soil) from the screened intervals of the replacement wells were used to obtain total porosity estimates of 47 percent. A range of effective porosity values of 0.2–0.4 was selected as indicative of heterogeneous unconsolidated material (Domenico and Schwartz, 1990) and used to calculate groundwater velocity. An effective porosity value of 0.3 was used in final design calculations.
Table 9.
Summary of horizontal hydraulic conductivity (Kh) values and solution methods from slug tests conducted in 2021 during the pre-design characterization of Site K, former Twin Cities Army Ammunition Plant, Arden Hills, Minnesota.[The Kansas Geological Survey (KGS) model is from Hyder and others (1994), and the Bouwer-Rice model with the correction for effective casing radius is from Bouwer and Rice (1976). ft/d, feet per day; n, number of tests; n.d., no data]
Because of the flat head gradients measured in the source area and Building 103 footprint (approximated to be 0.0008 ft/ft), flow velocities calculated using the full range in effective porosities were consistently estimated to be less than 0.5 ft/d. A reactive zone of 15–20 ft would be needed in the pilot test to establish a hydraulic residence time of 35 days, if the flow velocity is 0.5 ft/d. Thus, the pilot bioremediation test was designed with short lateral distances between injection and monitoring points in the source area to be able to observe transport effects within a year.
Following the installation of test plot injection and monitoring wells and immediately prior to the initial biostimulation injection, baseline hydrologic conditions were quantified and are summarized and compared to the pre-design investigation in this report. The groundwater elevation, as shown in contours at each plot location (fig. 8), indicates little change (less than 0.2 ft) in elevation across test plot GS1. The direction of groundwater flow seems to be along the centerline of the monitoring network (GS1-MW1 to GS1-MW9). Outside of the excavated area nearby the GS2 test plot, however, there is more change in groundwater elevation (up to 0.5 ft). The direction of groundwater flow in the GS2 plot is not aligned with the monitoring network but instead indicates southward flow from the excavated area during the baseline measurement (fig. 8). Hydraulic conductivity in the injection wells of the source area, GS1-I and GS2-I, were similar to estimates from the pre-characterization discussed previously and ranged from about 5–6 ft/d (Mejia and others, 2025). In the GS3 test plot, located near the trench, groundwater gradients were greater than in the source area (elevation change of greater than 2 ft across the test plot). Groundwater flow in the GS3 plot is likely influenced by the pumping toward the collection trench, skewing groundwater flow slightly northward of the centerline of the plot (fig. 8). Hydraulic conductivity determined for the injection well in test plot GS3 (GS3-I) was about an order of magnitude below that of the source area (about 0.5 ft/d), consistent with variable sand and clay lenses noted in the lithologic log (Mejia and others, 2025).
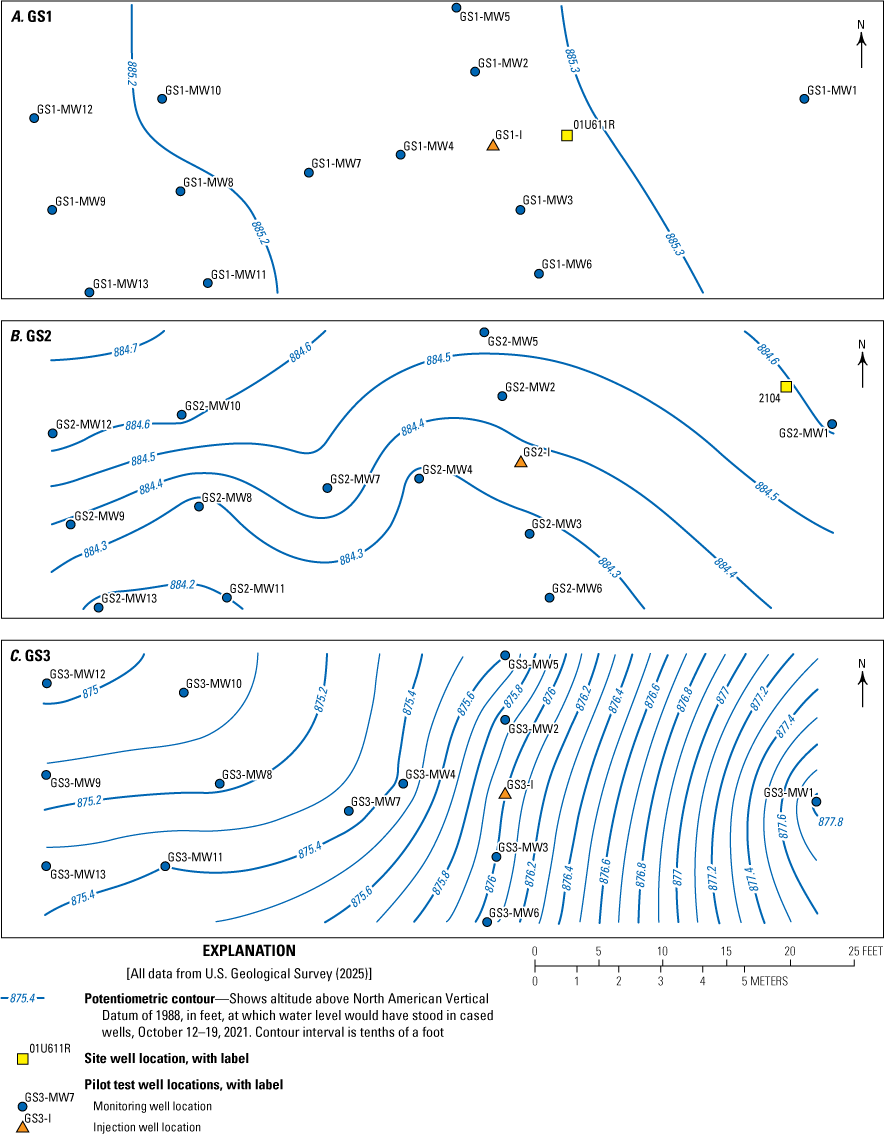
Groundwater altitude in aquifer sediments at pilot test plots A, GS1, B, GS2, and C, GS3 during baseline conditions at Site K, former Twin Cities Army Ammunition Plant, Arden Hills, Minnesota, October 12–19, 2021.
Volatile Organic Compounds in Soil
Previous investigations suggested that source materials persisted below the depth of excavation and backfilling at the site, as shown in figure 4 by the historical soil concentrations exceeding the Soil Reference Values at 6-ft depth (Wenck Associates, Inc., 2016). Soil core samples analyzed for VOCs in 2020–21 showed that the highest concentrations were near or in the clay at the base of the perched aquifer (fig. 9). The highest TCE concentration was nearly 200 mg/kg, measured at a depth of 12 ft in the soil core from 01U611R. A similarly high concentration of about 130 mg/kg TCE was measured at a depth of 7.3 ft in the soil core from 01U609R, within the clay layer that began at a depth of 6.4 ft. Historical data from soil core samples in the source area also showed the highest TCE concentrations in the clay at the base of the perched aquifer (fig. 4; table 10). The deepest soil sample was collected 13–14 ft below land surface (sample RI-1013-18; fig. 4) and had the maximum concentration of 804 mg/kg of TCE (table 10). Of the historical soil samples collected, the second highest TCE concentration was 140 mg/kg (sample GP18, table 10), measured in a sample from the clay at 11 ft depth and consistent with the USGS maximum concentration measured in the soil at 01U609R (fig. 9).
Table 10.
Volatile organic compound concentrations (VOCs) in historical soil samples, Site K, former Twin Cities Army Ammunition Plant, Arden Hills, Minnesota, 1983–2009.[Data are from Wenck Associates, Inc. (2016). Data are shown only for sites where VOCs were known to be left in place below 6-feet-excavation depth in 2014. Dates are given in Month/Day/Year. Soil sampling locations are given in figure 4. Replicate samples were collected on 03/01/2000. feet below ground surface, ft bgs; mg/kg, milligrams per kilogram; n.r., not reported; <, less than; NA, not applicable]
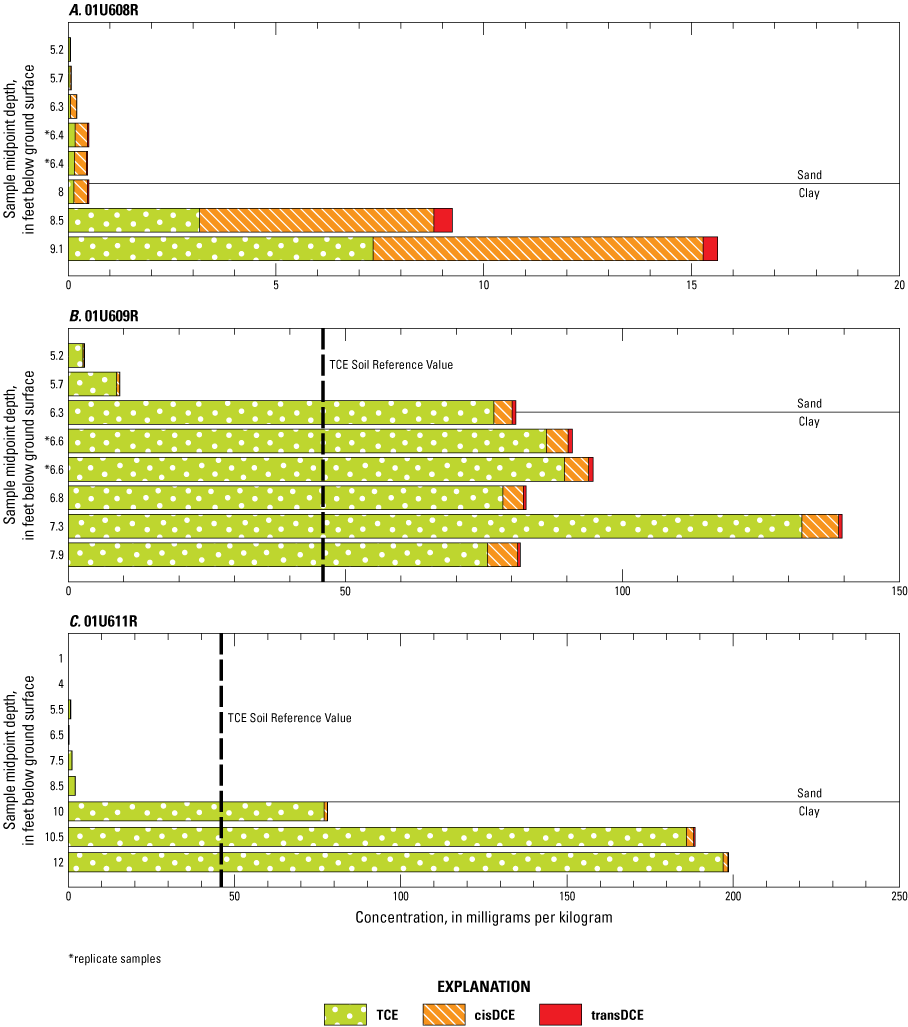
Bar graphs comparing the concentrations of trichloroethene (TCE), cis-1,2-dichloroethene (cisDCE), and trans-1,2-dichloroethene (transDCE) in soil core samples collected from well sites A, 01U608R and, B, 01U609R on June 1, 2021, and C, 01U611R on December 14, 2020, at Site K, former Twin Cities Army Ammunition Plant, Arden Hills, Minnesota. Data are from Mejia and others (2025). The TCE Soil Reference Value (SRV) was established by the Minnesota Pollution Control Agency (Conestoga-Rovers & Associates, Inc., 2009). All cisDCE concentrations were below the SRV of 22 milligrams per kilogram.
The soil cores collected by the USGS verified that soil containing a high concentration of VOCs was left in place in the source area in the 2014 soil excavation and needed to be considered in the design for the bioremediation pilot test. The historical and recent USGS soil analyses showed that TCE was the VOC that occurred in the highest concentrations (fig. 4; table 10). Although cisDCE was present in most soil samples, concentrations were generally more than an order of magnitude lower than TCE concentrations. Two exceptions were the soil samples collected at 8.5 ft bgs and 9.1 ft bgs at 01U608R, where concentrations of TCE and cisDCE were similar (fig. 9). The higher proportion of cisDCE in the saturated soil at 01U608R may indicate relatively high rates of anaerobic biodegradation of TCE by reductive dechlorination at this site. The high VOC concentrations present in soil samples collected in the current study indicate that the KMnO4 added after the sump excavation in 2009 did not effectively oxidize nor treat the soil in the entire source area, as was also indicated by the groundwater sampling following the KMnO4 addition (Wenck Associates, Inc., 2016).
Volatile Organic Compounds and Redox Conditions in Groundwater
Groundwater VOC concentrations measured during the pre-design characterization showed that 01U609R and 01U611R had the highest concentrations, with a maximum TCE concentration of 57,700 μg/L in 01U609R (fig. 10). TCE, cisDCE, and transDCE were the predominant VOCs detected in the groundwater. TCE comprised over 75 percent of total VOC concentrations detected in the groundwater at 01U609R and 01U611R, whereas cisDCE had the second-highest concentration of the VOCs measured. Of the wells sampled in the source area, only 01U608R had cisDCE concentrations that were greater than the TCE concentrations. Thus, the groundwater data were consistent with soil sample results that indicated substantial reductive dechlorination of TCE to cisDCE at 01U608R (figs. 8, 9). The low VC concentrations in the groundwater indicated that TCE reductive dechlorination was incomplete (fig. 10). Ethene and ethane, nonchlorinated end products of reductive dechlorination of TCE, were not detected in any of the wells sampled during the pre-design characterization (Mejia and others, 2025).
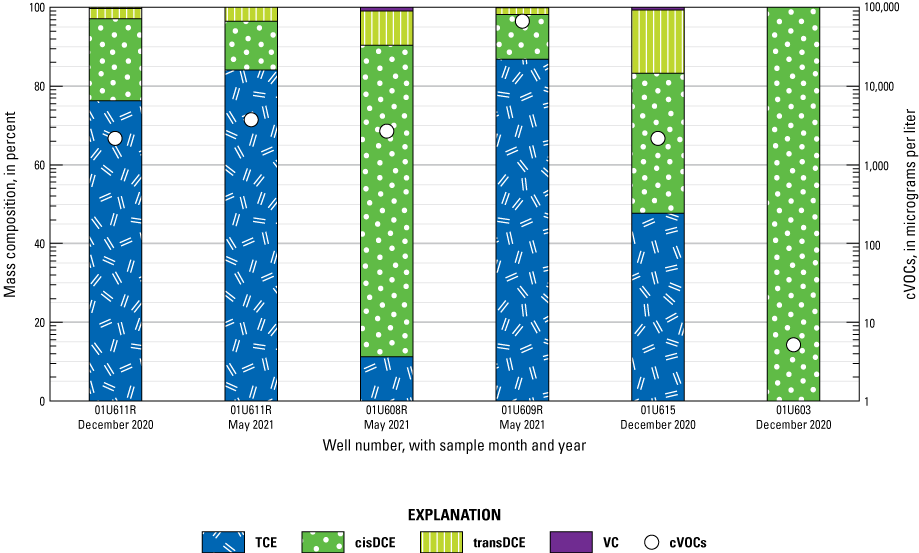
Plot showing the total concentration of chlorinated volatile organic compounds (cVOCs) and mass composition of trichloroethene (TCE), cis-1,2-dichloroethene (cisDCE), trans-1,2-dichloroethene (transDCE), and vinyl chloride (VC) in groundwater samples collected at Site K, former Twin Cities Army Ammunition Plant, Arden Hills, Minnesota, in December 2020 and May 2021. Data are from Mejia and others (2025).
Although fluctuations in concentrations have occurred, evaluation of historical data showed that groundwater VOC concentrations in the source area have remained consistently high. Groundwater from well 01U609, which was a control well during the HRC pilot test in 2000, had TCE concentrations ranging from 61,000 to 110,000 μg/L, and cisDCE concentrations ranged from 10,000 to 20,000 μg/L (Sola, 2001). The groundwater VOC concentrations in 01U609R in 2021 (57,700 μg/L TCE and 7,590 μg/L cisDCE) were consistent with these historical concentrations (fig. 10). The historical and pre-design VOC concentrations in groundwater from these two wells showed evidence of nearby residual DNAPL, based on the general rule of thumb of TCE concentrations exceeding 1 percent of the solubility (Kueper and Davies, 2009).
Concentrations measured in well 01U611R also were consistent with historical VOC concentrations measured in groundwater from well 01U611 (table 11). TCE concentrations ranged from 4,900 to 11,000 μg/L between 2009 and 2014, compared to concentrations of 3,090 and 11,700 μg/L, respectively, in 2020 and 2021 (table 11). Similar to the soil VOC results, the groundwater concentrations in the source area showed little effect from the KMnO4 addition in 2009, or little effect from the continual operation of the trench collection and treatment system.
Table 11.
Volatile organic compound concentrations in historical groundwater samples from well 01U611 compared to concentrations in replacement well 01U611R, Site K, former Twin Cities Army Ammunition Plant, Arden Hills, Minnesota.[Historical data were compiled from Wenck Associates, Inc. and others (2010, 2011, 2013, 2014, 2016). The availability of these sources is limited. For more information, contact U.S. Army Environmental Command, Midwest and Central America Division (Fort Sam Houston, Joint Base San Antonio, Texas). ft bgs, feet below ground surface; n.r., not reported; <, less than]
In addition to VOCs, groundwater samples collected by the USGS in 2020–21 were sampled for field parameters, redox-sensitive constituents, NVDOC, major ions, and trace metals (Mejia and others, 2025). Historical data for constituents other than VOCs, however, were generally limited to data collected in association with the previous bioremediation pilot tests (Sola, 2001). Recent and historical groundwater data showed near-neutral pH in the perched aquifer, which is advantageous for support of reductive dechlorination of TCE. Redox-sensitive constituents indicate that the contaminated groundwater in both the source area and downgradient was relatively reducing during the 2020–21 pre-design characterization with dissolved oxygen concentrations less than 0.5 mg/L (fig. 11), whereas oxic conditions with greater than about 3 mg/L dissolved oxygen were reported in 2000 (Sola, 2001). Methane was consistently detected in the groundwater samples collected in 2020–21, and concentrations greater than 0.40 mg/L in the source area particularly showed reducing conditions (fig. 11).
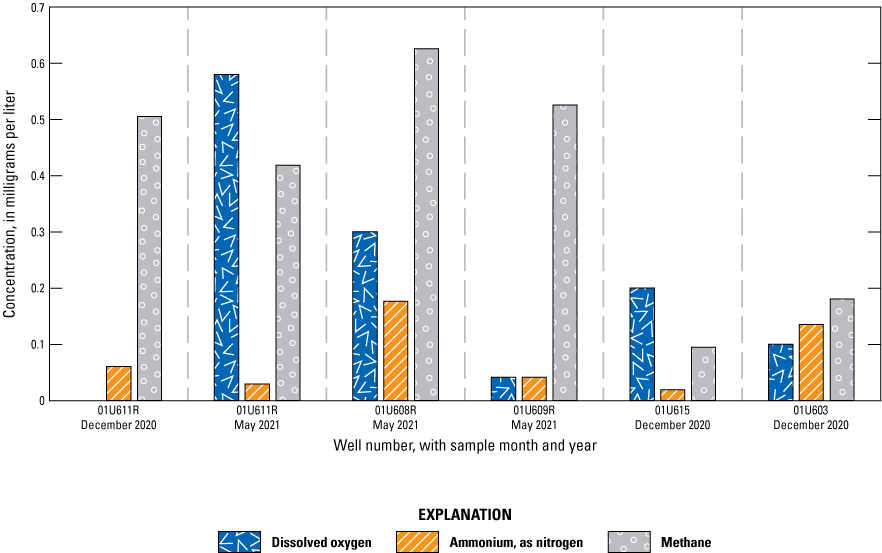
Bar graph showing the concentration of redox constituents (dissolved oxygen, ammonium [as nitrogen], and methane) in groundwater samples collected at Site K, former Twin Cities Army Ammunition Plant, Arden Hills, Minnesota, in December 2020 and May 2021. Data are from Mejia and others (2025). Dissolved oxygen was not detected where bar is not visible for 01U611R.
The reducing conditions in the groundwater in 2020–21 were consistent with cisDCE detected in the groundwater, which indicated at least partial reductive dechlorination of TCE occurred (fig. 10). NVDOC concentrations ranged from 2.43 to 9.22 mg/L in the six wells sampled during the pre-design characterization (Mejia and others, 2025), indicating that some natural organic carbon donor was available in the perched aquifer to support TCE reductive dechlorination. Thus, the VOC composition and concentrations of redox constituents and NVDOC during the pre-design characterization verified that an anaerobic bioremediation approach was feasible for Site K, despite the rapid response to precipitation events and subsequent potential for transport of dissolved oxygen to the shallow aquifer.
Laboratory Tests of Enhanced Biodegradation
To assess the efficacy of biostimulation and bioaugmentation and assist in designing the field pilot test, a series of laboratory microcosms was conducted. Experiments were designed to determine the native microbial population’s degradation potential, evaluate microbial kinetics with and without bioaugmentation, and investigate potential donors and timing of amendment injections for field application.
Natural Biodegradation and Effect of Bioaugmentation
Microcosm experiments were conducted with the native microbial communities obtained from monitoring wells 01U603, 01U611R, and 01U615 by combining sand from PMSs, deployed to obtain the native microbial community that prefers attachment, and water collected from the associated wells. The native microbial community was biostimulated with the addition of sodium lactate as an electron donor and compared to replicate treatments that were bioaugmented with WBC-2 (table 2). Rapid biodegradation of TCE was observed in all bioaugmented treatments, where complete degradation of TCE and all chlorinated daughter products occurred by day 7 (figs. 12, 13). In addition, the lower initial (day 0) TCE in the bioaugmented microcosms compared to those without added WBC-2 indicate that some TCE degradation occurred in the bioaugmented microcosms in the several hours between microcosm preparation and the day 0 sampling (fig. 12). The increase in TCE between day 0 and day 3 in the nonbioaugmented treatments was likely due to desorption, whereas biodegradation in the bioaugmented microcosms appeared to be more rapid than desorption of TCE from the sand matrix (fig. 12).
Production of ethene in the bioaugmented treatments verified complete reductive dechlorination of TCE (fig. 13). Because of the rapid biodegradation, little accumulation of chlorinated daughter products occurred in the bioaugmented treatments. In contrast, treatments that were not bioaugmented with WBC-2 showed removal of amended TCE only in the microcosms for well 01U611R (fig. 13). The nonbioaugmented treatments constructed with the 01U611R microbial community showed incomplete degradation of TCE, however, as evidenced by high DCE accumulation over the 21-day experiment (fig. 13). No measurable ethene was produced in the nonbioaugmented treatments.
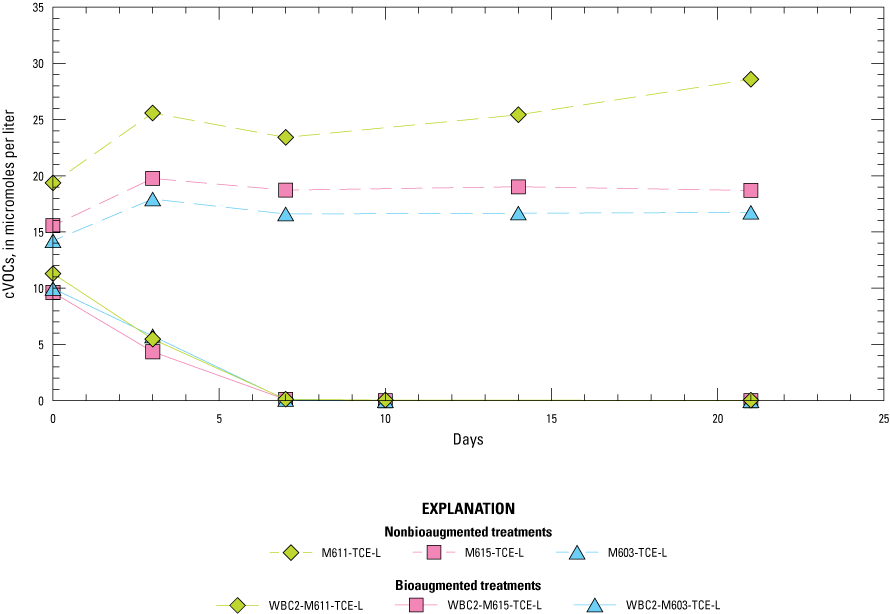
Line graph showing total concentrations of chlorinated volatile organic compounds (cVOCs) in three WBC-2 bioaugmented anaerobic microcosm treatments compared to three nonbioaugmented treatments using passive microbial sampler material and groundwater collected from wells, Site K, former Twin Cities Army Ammunition Plant, Arden Hills, Minnesota. cVOCs includes the sum of trichloroethene and daughter products cis-1,2-dichloroethene, trans-1,2-dichloroethene, 1,1-dichloroethene, and vinyl chloride. Microcosms were constructed using material from wells 01U611R (M611), 01U615 (M615), and 01U603 (M603). Mean concentrations from duplicate microcosm bottles are shown. Data are from Mejia and others (2025). More information about the microcosm treatments is available in table 2.
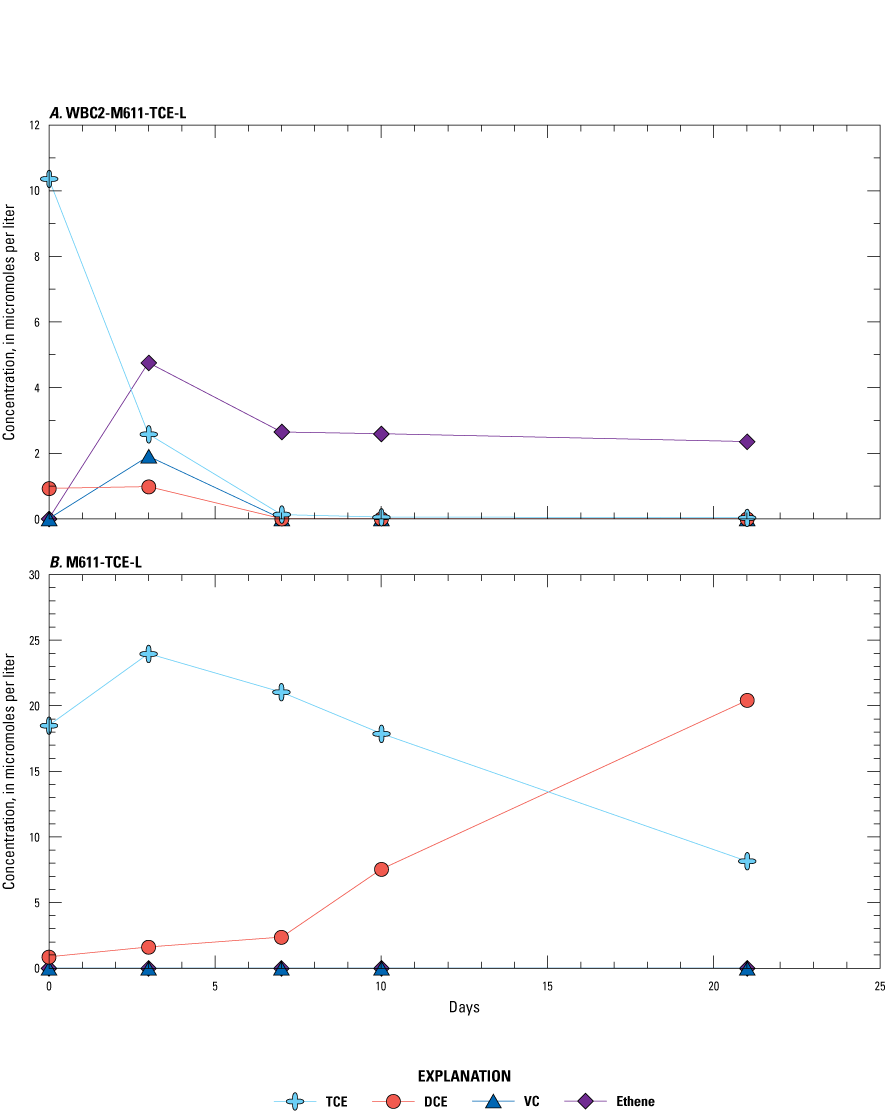
Line graphs showing the concentrations of trichloroethene (TCE) and daughter products dichloroethene (DCE), vinyl chloride (VC), and ethene in a WBC-2 bioaugmented anaerobic microcosm treatment compared to a nonbioaugmented treatment using passive microbial sampler material and groundwater collected from well 0U611R, Site K, former Twin Cities Army Ammunition Plant, Arden Hills, Minnesota: A, treatment WBC2-M611-TCE-L and B, treatment M611-TCE-L. DCE is the sum of cis-1,2-dichloroethene, trans-1,2-dichloroethene, and 1,1-dichloroethene. Mean concentrations from duplicate microcosm bottles are shown. Data are from Mejia and others (2025). More information about the microcosm treatments is available in table 2.
Rapid methane production occurred in the bioaugmented microcosm treatments, reaching concentrations greater than 200 µg/L by day 3, and showed that the donor addition was sufficient to achieve and sustain TCE degradation (Mejia and others, 2025). The lack of biodegradation in the microcosms without WBC-2 indicated that the microbial community is lacking sufficient populations of OHRB. The results of these microcosms demonstrated the need for bioaugmentation to ensure complete degradation of TCE and associated daughter products. In addition, the results showed that the activity of the bioaugmented WBC-2 culture was not inhibited by the groundwater chemistry or competition with the native microbial population in the perched aquifer.
Electron Donors and Bioaugmentation Timing
In microcosms constructed with aquifer soil collected from site 01U611R and simulated groundwater, electron donors to support reductive dechlorination were evaluated, including lactate and corn syrup as fast-release compounds and whey, soy-based VO, and 3D as slow-release compounds. Each of the electron donors requires a fermentation step or steps to release hydrogen, which is utilized as the electron donor by microbial dechlorinating bacteria. Many commercial products are mixtures of fast- and slow-release compounds in which lactate is often used as an initial fast-release donor in the mixtures. Lactate treatments also provide a reference for optimum WBC-2 activity because the culture is maintained using lactate as the primary donor. Electron donors were tested in microcosms with and without added WBC-2 to evaluate the need for bioaugmentation (table 2).
Overall biodegradation of TCE and its chlorinated daughter products in each of the microcosm treatments was calculated as the change in molar concentrations of total organic chlorine in the microcosms. The most total organic chlorine removal was observed in WBC-2 bioaugmented treatments with added lactate and VO as the electron donors (fig. 14). TCE degradation was observed in each bioaugmented microcosm to which an electron donor was added (Mejia and others, 2025). However, degradation of TCE stalled at cisDCE in microcosms with added whey, corn syrup, or 3D (Mejia and others, 2025) and resulted in an overall total organic chlorine removal of less than about 40 percent in the whey- and corn-syrup-added microcosms and an increase in total organic chlorine in the 3D-added microcosm (fig. 14). In the bioaugmented microcosm with added 3D, the production of cisDCE was greater than the amount of TCE initially added and measured in the microcosm on day 1, causing an increase in the total organic chlorine that peaked on day 18 (fig. 14). This initial increase in total organic chlorine in the 3D treatment was likely due to desorption or dissolution of TCE in the site soil used in the microcosms and subsequent biodegradation to DCE (predominantly cisDCE). Similar desorption and biodegradation of TCE in the soil likely occurred in the other bioaugmented donor treatments as well, but the degradation rate was rapid enough to result in a continual overall removal of total organic chlorine (fig. 14). It is also possible that the composition of the 3D enhanced desorption from the site soil, without enhancing the biodegradation rate, compared to the other donors.
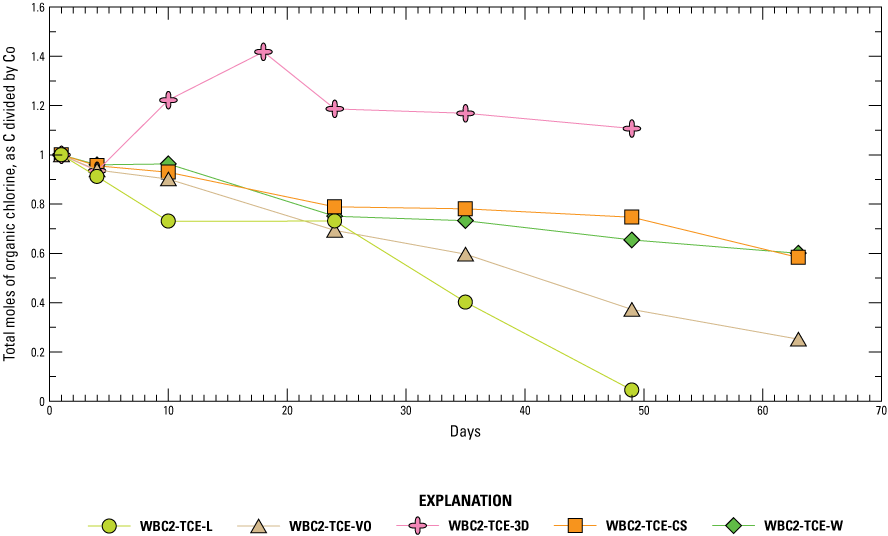
Line graph showing change in the fraction of total moles of organic chlorine, calculated as the concentration at a given sampling point (C) divided by the initial concentration (Co), in five WBC-2 bioaugmented anaerobic microcosm treatments conducted to evaluate electron donors using soil from well 01U611R, Site K, former Twin Cities Army Ammunition Plant, Arden Hills, Minnesota. Mean concentrations from duplicate microcosm bottles are shown. Data are from Mejia and others (2025). More information about the microcosm treatments is available in table 2.
Live control treatments without added WBC-2 were done for each donor tested (table 2), but biodegradation of TCE was minor and incomplete in the live controls. As an example, figure 15 compares the VO treatments with and without added WBC-2; data for all treatments are in Mejia and others (2025). In the bioaugmented VO treatment, TCE degraded to near detection levels by day 24, as simultaneous production of DCE and VC occurred (fig. 15A). A relatively small increase in total cVOCs by day 24 above the initial concentration indicated that desorption or dissolution of residual TCE in the soil did affect the overall removal rate. However, total concentrations of cVOCs decreased substantially by the end of the microcosm experiment in the bioaugmented VO treatment, indicating complete biodegradation to nonchlorinated daughter products occurred (fig. 15A). In contrast, the nonbioaugmented VO treatment had substantial TCE remaining at the end of the experiment and showed only DCE production (fig. 15B). Total concentrations of cVOCs were increasing at the end of the nonbioaugmented treatment, indicating that biodegradation was incomplete and slower than TCE desorption rates (fig. 15B). Methane production occurred early in all the treatments (Mejia and others, 2025), indicating that donor addition (biostimulation) created sufficiently reducing conditions to support reductive dechlorination with or without the addition of WBC-2 (bioaugmentation). However, biostimulation coupled with bioaugmentation resulted in faster dechlorination rates of the TCE.
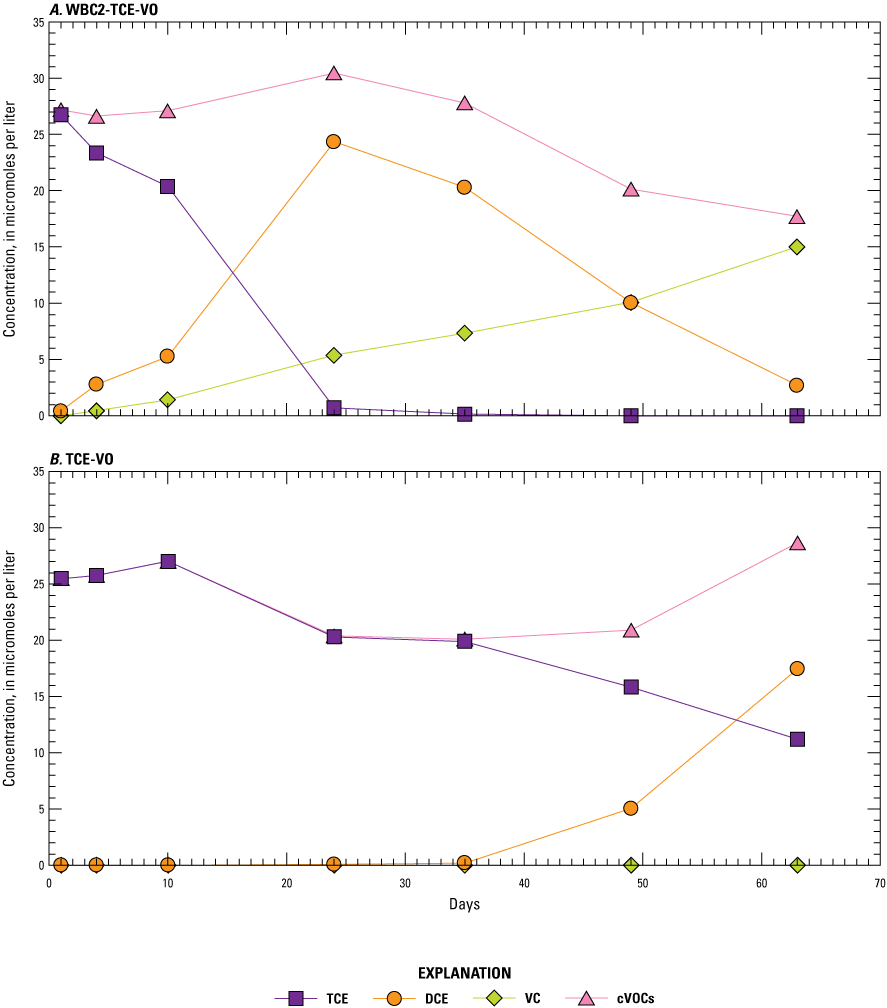
Line graphs showing the concentrations of trichloroethene (TCE), dichloroethene (DCE), vinyl chloride (VC), and the sum of chlorinated volatile organic compounds (cVOCs) in a WBC-2 bioaugmented anaerobic microcosm treatment compared to a nonbioaugmented treatment using soil from well 01U611R and a soybean-based vegetable oil as an electron donor: A, treatment WBC2-TCE-VO and B, treatment TCE-VO. DCE is the sum of cis-1,2-dichloroethene, trans-1,2-dichloroethene, and 1,1-dichloroethene. Mean concentrations and standard error from duplicate microcosm bottles are shown. Data are from Mejia and others (2025). More information about the microcosm treatments is available in table 2.
Although the bioaugmented microcosms with lactate or VO showed faster and more complete TCE degradation than the other electron donor treatments, degradation rates were slower than desired for the VO treatment (fig. 14). In addition, microcosms constructed with deeper soil from the bottom of the perched aquifer (mix of sand, silt, and clay) contained high sorbed/residual concentrations of TCE that resulted in accumulation of DCE concentrations greater than the initial amended TCE concentrations in the microcosms (Mejia and others, 2025, refer to treatment containing “DS” in name). An additional “amendment timing” experiment was conducted to evaluate if delaying the addition of WBC-2 after the electron donor reduced the accumulation of DCE and provided an overall faster degradation rate of the chlorinated ethenes, particularly for VO in combination with lactate to provide short- and long-term donors (fig. 16; table 2). In these microcosms, the electron donor was added on day 0 or days 0 and 7, and WBC-2 was added on day 7 (table 2). Delaying WBC-2 addition to the microcosms with lactate or lactate and VO as donors increased the degradation rate substantially compared to microcosms with WBC-2 added at day 0 (figs. 14, 16). The continual decrease in the total organic chlorine in the lactate and VO treatments in figure 16 showed that no stall of dechlorination occurred at the DCE production step. For the lactate treatment with WBC-2 added at day 0 (WBC2-TCE-L), the total organic chlorine removal stalled at apparent 25-percent removal between days 10 and 24 (fig. 14). In contrast, the lactate treatment with delayed addition of WBC-2 (DW-L-MS) showed a continual decrease in the total organic chlorine with more than 70-percent removal within 28 days (fig. 16). A similar rapid decrease in total organic chlorine was observed in treatments with either lactate alone (DW-L-MS) or lactate and VO as the donor (DW-L-VO-MS and DW-L-DVO-MS; fig. 16). First-order degradation rate constants for total organic chlorine were determined by an exponential fit to the total organic chlorine concentrations after WBC-2 addition at day 7; the degradation rate constant is the exponential constant (fig. 16). First-order rate constants for total organic chlorine removal in treatments with lactate or lactate and VO as the donor ranged between 0.061 and 0.047 per day, corresponding to half-lives of 11–15 days for the total organic chlorine (fig. 16). Based on the results of these experiments, lactate and VO were selected as suitable donors, combined with bioaugmentation with WBC-2, for the pilot bioremediation test.
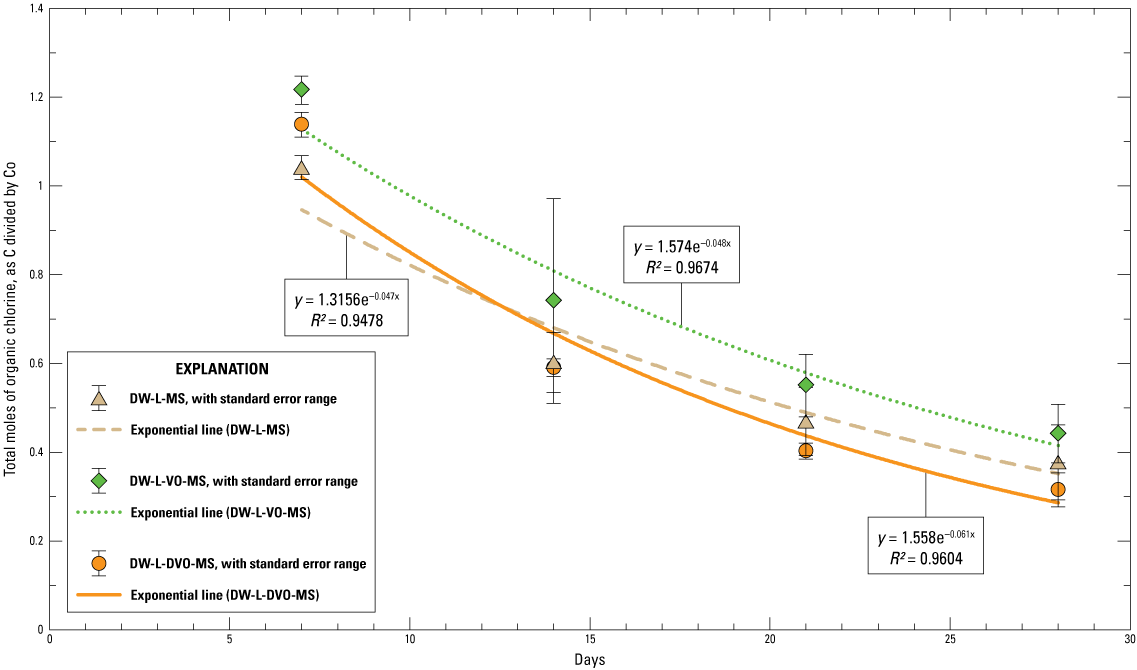
Line graph showing change in the fraction of total moles of organic chlorine, calculated as the concentration at a given sampling point (C) divided by the initial concentration (Co), in three WBC-2 bioaugmented anaerobic microcosm treatments conducted using soil from well 01U611R to evaluate donor and WBC-2 amendment timing. Data are from Mejia and others (2025). Mean concentrations and standard error from triplicate microcosm bottles are shown. More information about the microcosm treatments is available in table 2. [R2, coefficient of determination]
The next microcosm experiment focused on testing commercial products containing lactate and VO that could be used in the pilot test. VO is commonly applied in the form of emulsified vegetable oil (EVO) to increase distribution within the treatment zone. Two commercial mixtures that consist of 60-percent EVO, SRS-SD from Terra Systems, and EOS Pro by EOS, were selected for evaluation (fig. 17; table 2). In addition to the EVO as a slow-release donor, both products contain a fast-release donor: sodium lactate (5.5 percent) in the SRS-SD and a glycol-based donor (4 percent) in EOS Pro. Both products also contain vitamin B12 and micronutrients to enhance microbial activity. Comparable microcosm treatments were constructed with 0.2-percent EVO by mass of sediment. The SRS-SD treatment resulted in the most complete removal: more than 90 percent of the total organic chlorine was removed during the 43-day incubation (fig. 17). The Wilclear lactate treatment had a slightly faster removal than the SRS-SD but would not be expected to provide a donor source as long as the EVO. Thus, the EVO product SRS-SD was selected for use in the pilot test.
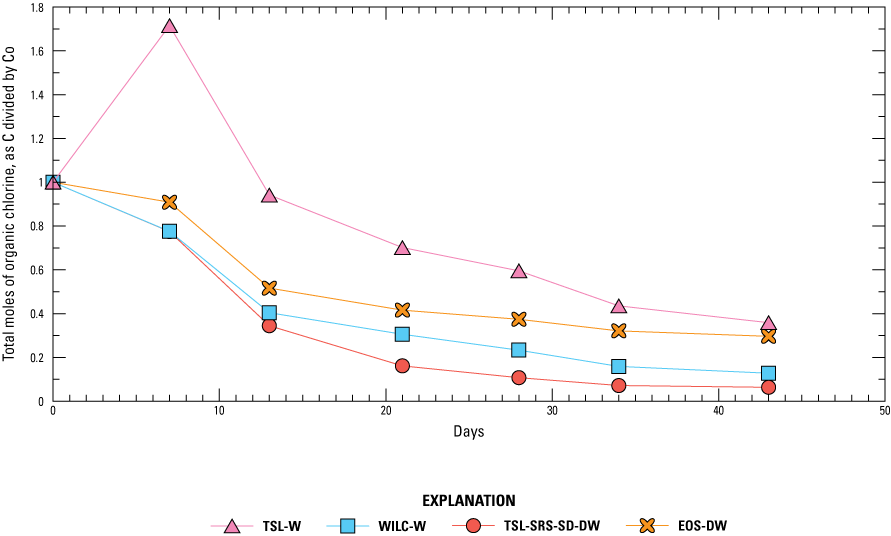
Line graph showing change in the fraction of total moles of organic chlorine, calculated as the concentration at a given sampling point (C) divided by the initial concentration (Co), in four anaerobic WBC-2 bioaugmented microcosm treatments conducted using soil from well 01U611R to evaluate commercial donor products. Data are from Mejia and others (2025). More information about the microcosm treatments is available in table 2.
Performance of Bioremediation Pilot Test
As expected from the pre-design characterization, the perched aquifer at Site K was highly dynamic, its water levels fluctuating greatly throughout the year of the bioremediation pilot test (figs. 18, 19). Groundwater sampling to establish baseline conditions for the pilot test was completed immediately prior to the injection of the donor in wells GS1-I, GS2-I, and GS3-I during October 18–20, 2021, when water-level elevations were relatively low (figs. 18, 19). Water-level elevations then increased by nearly 1.0 ft by November 30–December 2, 2021, when the WBC-2 injections were completed. However, water-level elevations declined again and remained low through the Q1 sampling event, which occurred in February 2022 to monitor the pilot test performance (figs. 18, 19). High water-level conditions were present at the site only during the Q2 sampling event in May 2022 and the first monthly sampling in June 2022.
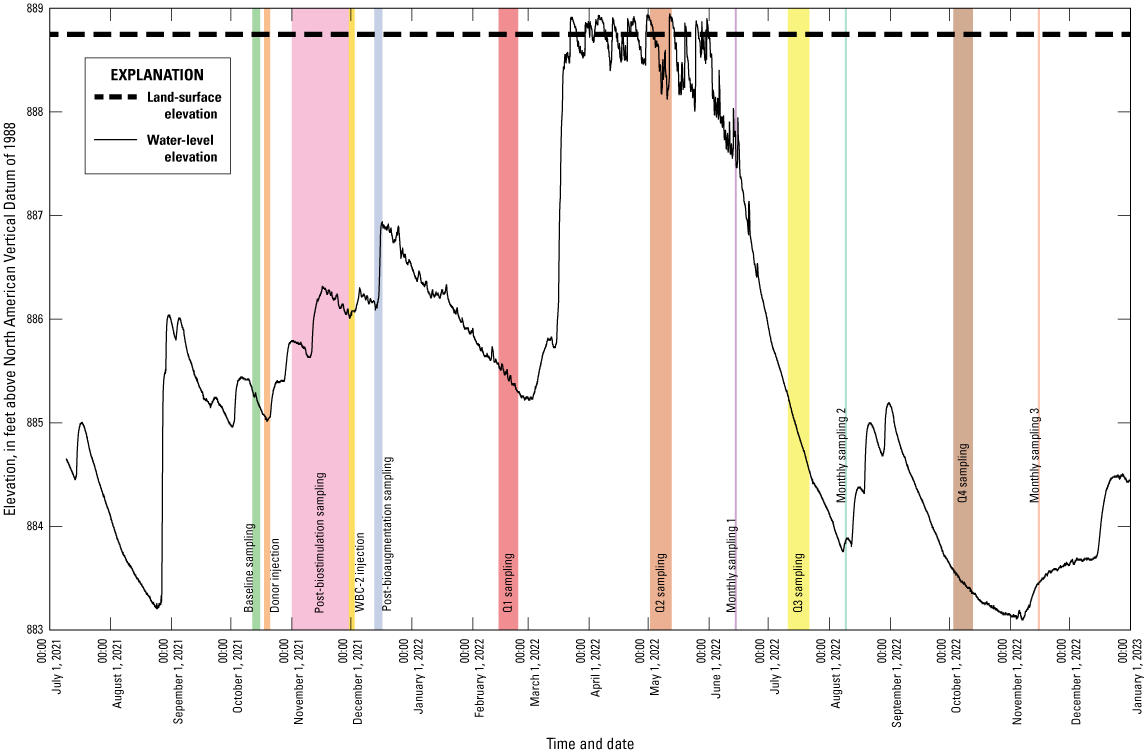
Hydrograph showing water table elevations in well 01U611R and injection and sampling events during the bioremediation pilot test at Site K, former Twin Cities Army Ammunition Plant, Arden Hills, Minnesota, July 2021–December 2022. Data are from U.S. Geological Survey (2025) and Mejia and others (2025). [Q1, first quarter; Q2, second quarter; Q3, third quarter; Q4, fourth quarter]
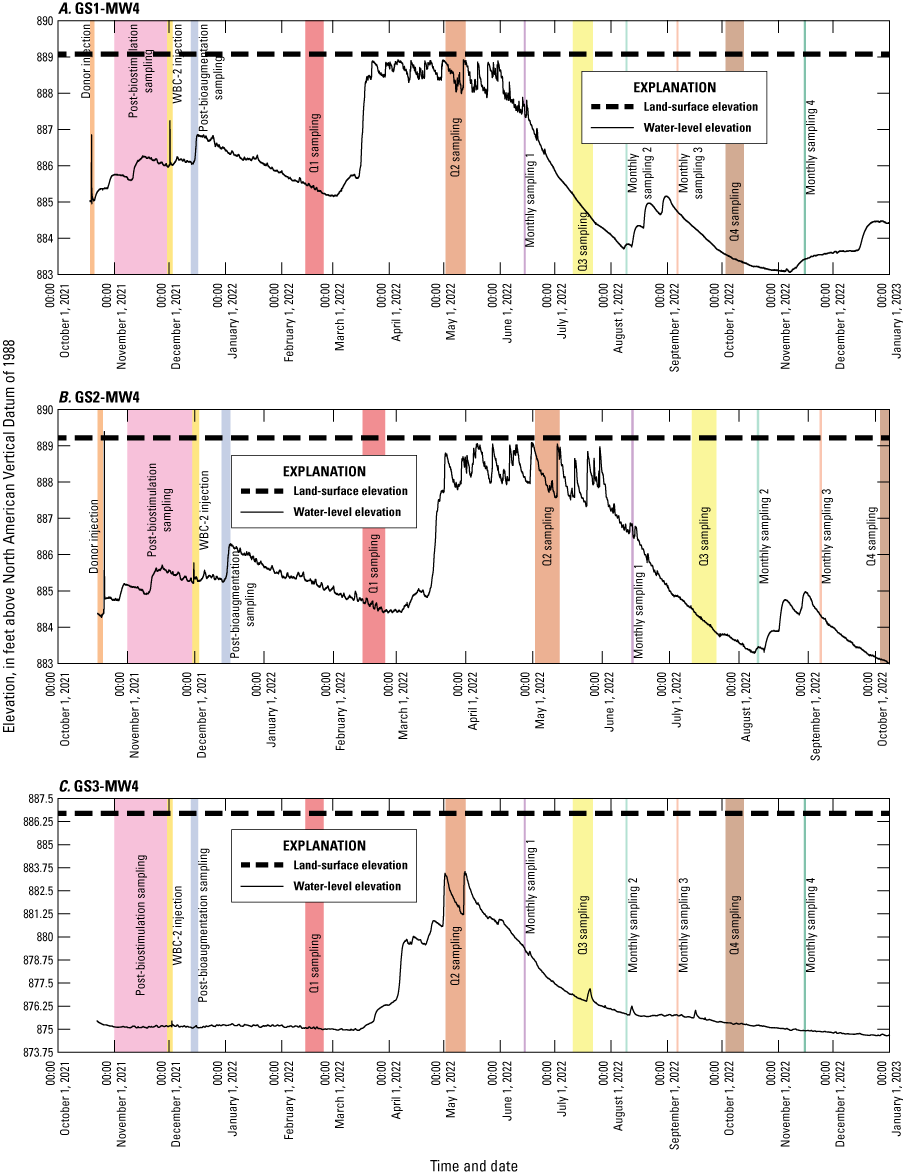
Hydrographs showing water table elevations in monitoring wells A, GS1-MW4, B, GS2-MW4, and C, GS3-MW4 at Site K, former Twin Cities Army Ammunition Plant, Arden Hills, Minnesota, October 2021–22. Data are from U.S. Geological Survey (2025). [Q1, first quarter; Q2, second quarter; Q3, third quarter; Q4, fourth quarter]
Because of the expected variable hydrogeologic conditions prior to the pilot test, three smaller-scale test plots were used to evaluate the amendment delivery and efficacy of enhanced reductive dechlorination in the unconfined aquifer at Site K. The seasonal and spatial changes in groundwater flow directions (figs. 20, 21, 22) and rates affected the distribution of the amendments and the biogeochemical changes observed during performance monitoring. Information gathered from each of the three test plots was used to inform implications for bioremediation for Site K as a whole. Thus, variation between the test plots was expected and useful, rather than indicative of success or failure.
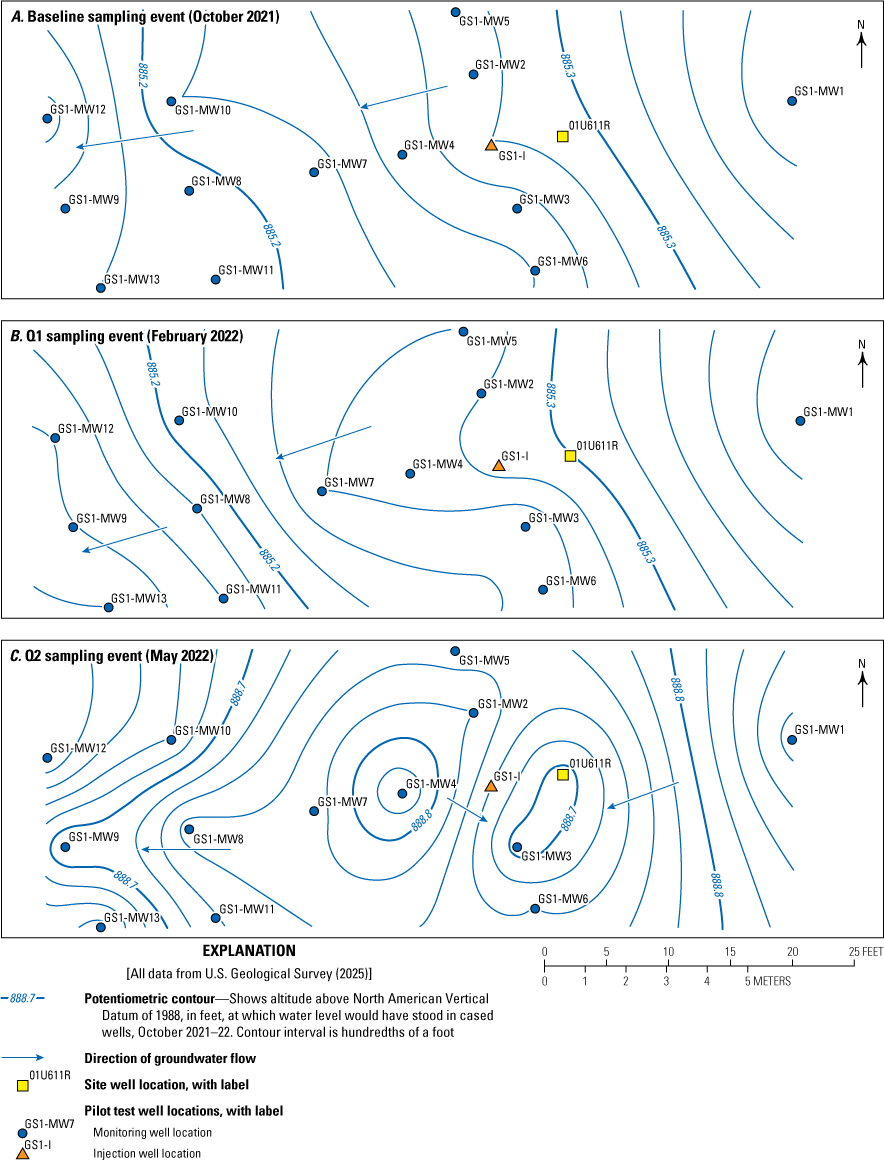
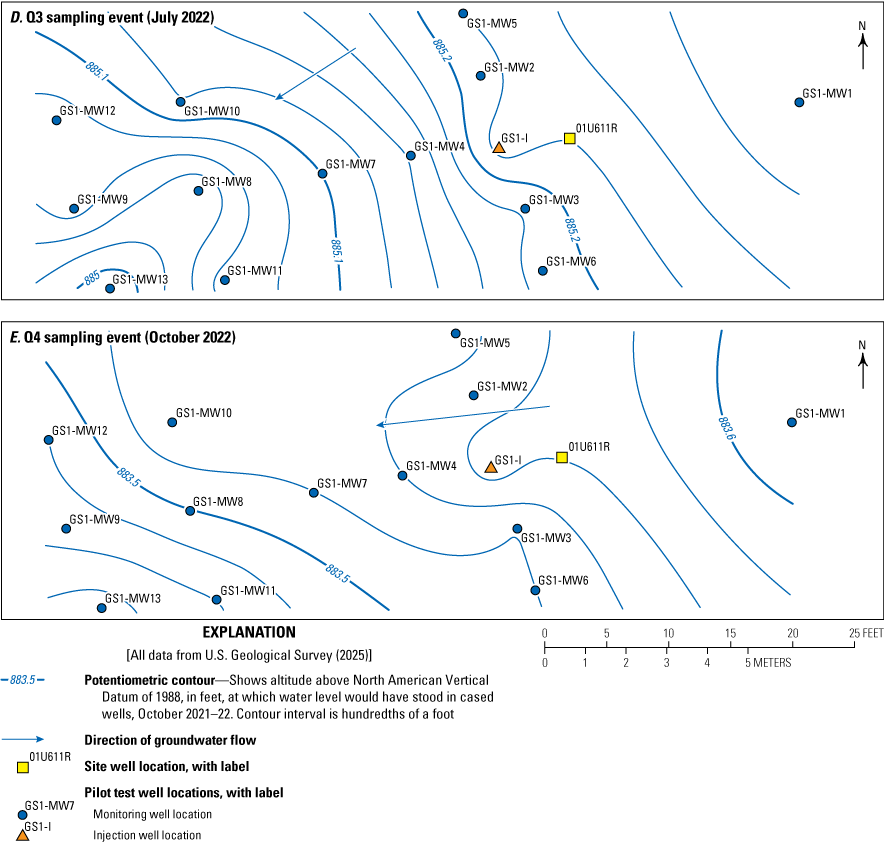
Plots showing the water table altitude and groundwater flow directions during the A, baseline, B, first quarter (Q1), C, second quarter (Q2), D, third quarter (Q3), and E, fourth quarter (Q4) sampling events at pilot test location GS1, Site K, former Twin Cities Army Ammunition Plant, Arden Hills, Minnesota, October 2021–22. Data are from U.S. Geological Survey (2025).
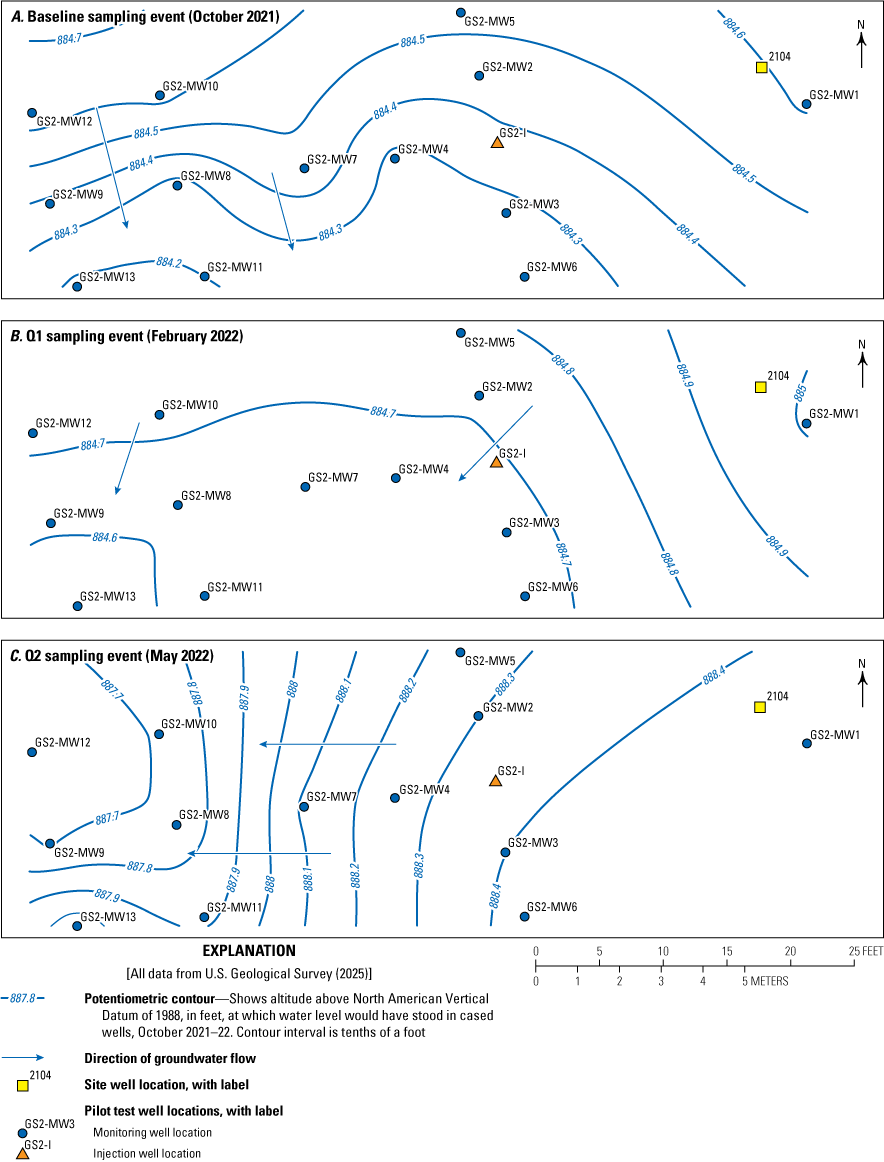
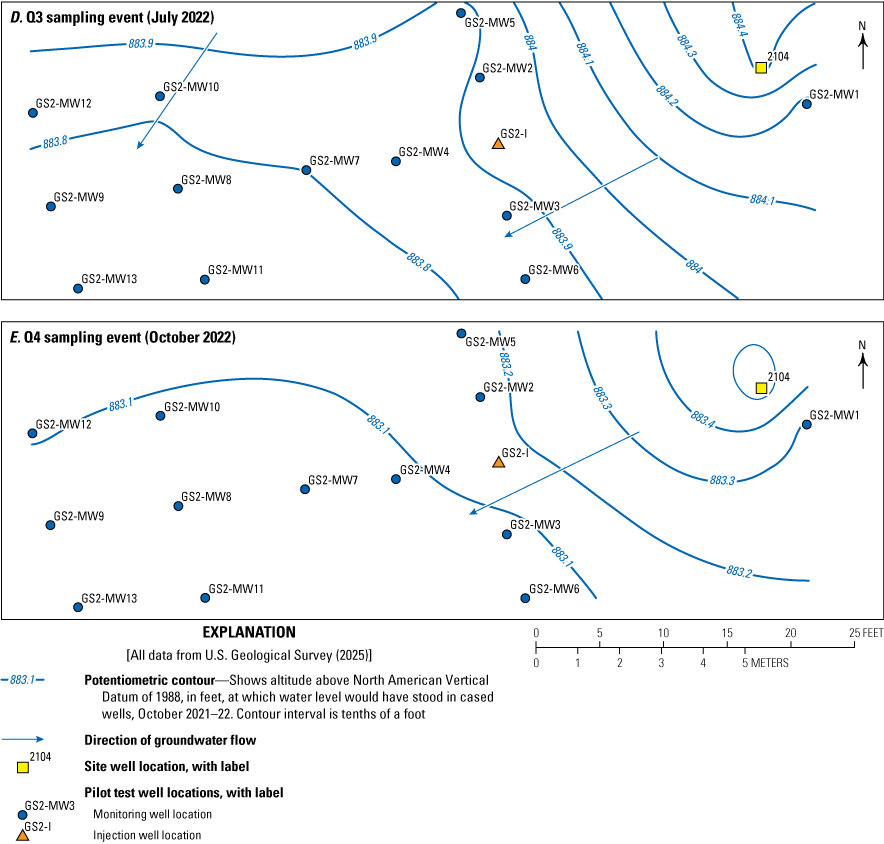
Plots showing water table altitude and groundwater flow directions during the A, baseline, B, first quarter (Q1), C, second quarter (Q2), D, third quarter (Q3), and E, fourth quarter (Q4) sampling events at pilot test location GS2, Site K, former Twin Cities Army Ammunition Plant, Arden Hills, Minnesota, October 2021–October 2022. Data are from U.S. Geological Survey (2025).
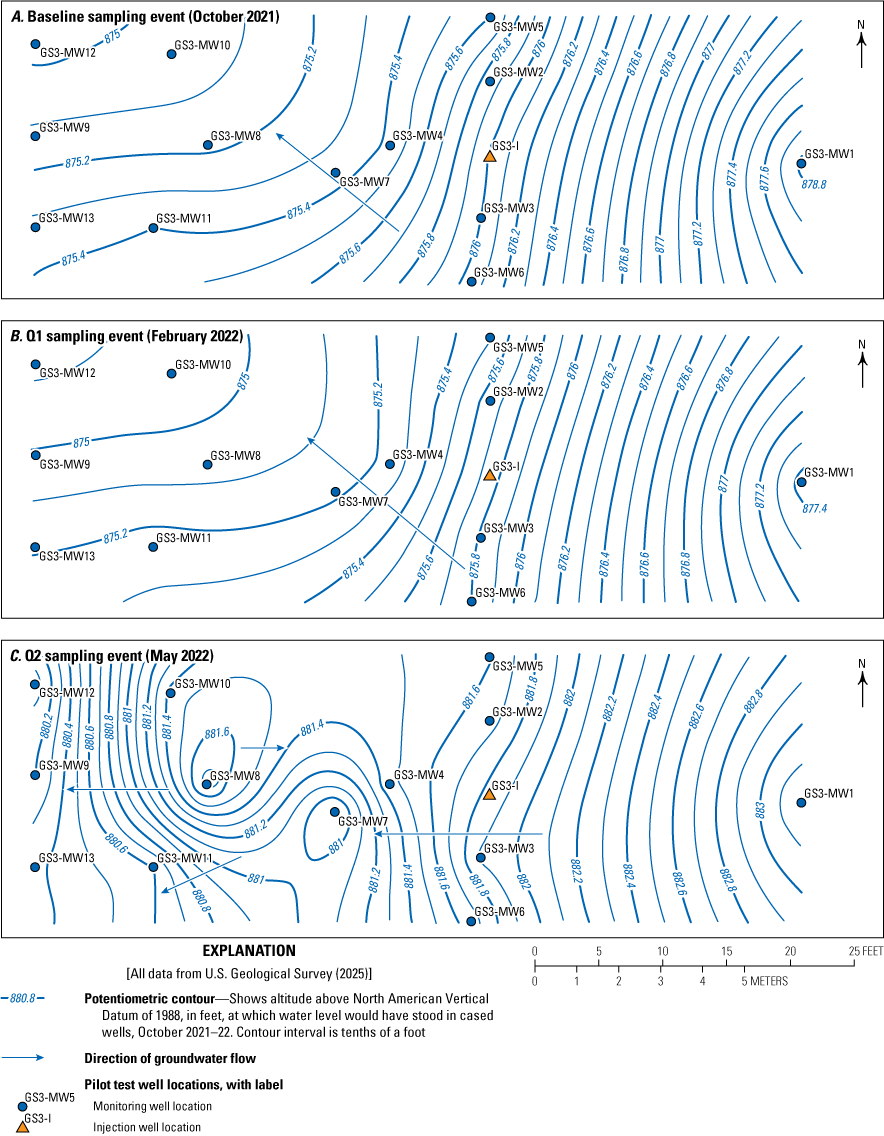
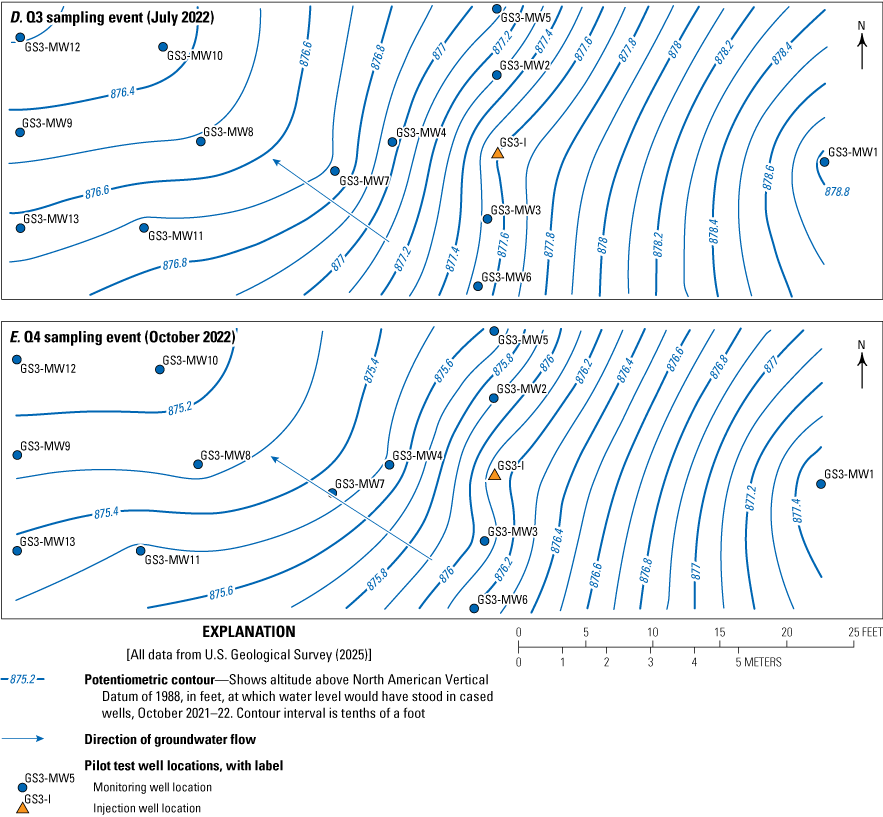
Plots showing water table altitude and groundwater flow directions during the A, baseline, B, first quarter (Q1), C, second quarter (Q2), D, third quarter (Q3), and E, fourth quarter (Q4) sampling events at pilot test location GS3, Site K, former Twin Cities Army Ammunition Plant, Arden Hills, Minnesota, October 2021–October 2022. Data are from U.S. Geological Survey (2025).
Amendment Delivery, Radius of Influence, and Groundwater Flow
Test plot GS1, nearby well 01U611R, is entirely within the previous excavation, making conditions the most lithologically homogeneous of the three test plots. The initial biostimulation injection at GS1 (October 19, 2021) took place during a time of low groundwater elevation (figs. 19A, 20). The effects and transport characteristics of the injection mixture were examined along the centerline of the test plot (tracking from GS1-MW1 to GS1-MW9; fig. 5), which was the intrinsic direction of groundwater flow. A response was measured in monitoring well 01U611R, 2.2 ft upgradient of the injection well, and in GS1-MW4, about 7 ft downgradient of the injection well (table 3) during the injection time (fig. 19A). The injection was completed entirely by gravity feed and averaged about 1.66 gallons per minute (gal/min) for a total of 300 gallons (gal; table 3). A corresponding response during the injection was not detected in continuous monitoring of GS1 (GS1-MW8 TCAAP Site K [USGS-450543093105407; U.S. Geological Survey, 2025]). This response is consistent with the concentrations of the added conservative tracer of bromide in plot GS1, which had a maximum in GS1-MW4 of 81.1 mg/L 20 days after the injection, indicating advective flow in the downgradient direction (GS1-MW4, 7 ft downgradient), but low concentrations in other wells (fig. 23). Examination of these breakthrough curves suggests a rapid peak, possibly missed at GS1-MW4, and then subsequent peaks within a reasonable distance from this well. The radius of influence along the flow path according to the time of bromide appearance and peak was 16.3 ft, relatively close to the design estimate of 15 ft (table 12; Nelson and Divine, 2005). Bioaugmentation injection followed biostimulation on December 1, 2021, using gravity feed at a calculated rate ranging from 1.76–2.00 gal/min (table 4). The lower total volume injected for bioaugmentation than biostimulation still triggered an elevated response in the GS1-MW4 well near the injection well (table 4).
Table 12.
Measured and calculated hydrologic properties for the bioremediation pilot test at Site K, former Twin Cities Army Ammunition Plant, Arden Hills, Minnesota, October 2021–October 2022.[ft, foot; ft/day, feet per day; ROI, radius of influence]
Average of measured values, Mejia and others (2025)
Groundwater flow direction in test plot GS1 was generally along the centerline from GS1-I to GS1-MW4, GS1-MW7, and GS1-MW9 and trended slightly to the south towards GS1-MW11, during the baseline and February (Q1) monitoring events (fig. 20). Following the spring peak water levels (and mounding in GS1-MW3 and GS1-MW4) in May 2022 (Q2), flow shifted in the direction of GS1-MW11 to GS1-MW13 in July and October 2022 (fig. 20). However, horizontal hydraulic gradients were nearly flat, ranging from only 0.0025–0.0047 ft/ft. Combined with the measured hydraulic conductivity in the injection well (7.27 ft/d), estimates of specific discharge ranged from 6.8 to 12.5 feet per year (ft/yr). This specific discharge rate suggests that some distribution within the aquifer occurred during the injection event itself; the overall changes in water-level elevation throughout the year-long test reached a maximum of 3.68 ft between the February and May sampling events (fig. 19A), indicating secondary advective distribution in the direction of groundwater flow. No apparent reduction in hydraulic conductivity was observed before (October 2021) and after amendment injection (table 12).
Table 13.
Range in groundwater elevation between different monitoring events for the bioremediation pilot test at Site K, former Twin Cities Army Ammunition Plant, Arden Hills, Minnesota, October 2021–22.[Elevation is referenced to the North American Vertical Datum of 1988. ft, foot; min, minimum; max., maximum]
Test plot GS2 straddles excavation and native materials and has the highest historical cVOC concentrations in the soil of the underlying aquitard (at well 01U609R), making it the most challenging location based on hydrogeology and chemistry. In addition, not much was known of this area prior to the pilot test, making the test design challenging. The initial biostimulation injection took place on October 21, 2021, using treated effluent from the site as described in table 3. Gravity feed resulted in a breakthrough of the injection mixture at the ground surface around the injection well. Therefore, pumping was conducted at a rate of 0.47–0.65 gal/min for a total of 200 gal. During the pumped injection timeframe, 1.8 ft of change in water table elevation was apparent in GS2-MW4 (about 7.5 ft away; fig. 19B) and 0.69 ft of change at GS2-MW8 (about 17 ft away; GS2-MW8 TCAAP Site K [USGS-450542093105508; U.S. Geological Survey, 2025]). Subsequent monitoring showed downgradient increases in bromide and multiple peaks over time. Using the method of Nelson and Divine (2005), the radius of influence estimated from these multiple peaks was about 60 ft, which is greater than the estimate for the design (table 12). Bioaugmentation injection followed biostimulation on November 30, 2021. Similar to GS1, an increase in water-level elevation was observed in nearby GS2-MW4 despite the smaller injection volume during bioaugmentation compared to biostimulation (tables 3, 4).
The predominant direction of groundwater flow in test plot GS2 was largely unknown at the site prior to the pilot test because there were few monitoring wells (figs. 1, 5). The general direction of groundwater flow during and immediately following pilot test injections was not along the centerline of the test plot, but instead followed a northeast to southwest general flow direction. An exception was during the period of high-water table conditions (May 2022), when the direction of groundwater flow appeared to follow the centerline of the plot (fig. 21) and changes in water-level elevations showed relatively high horizontal hydraulic gradients compared to October 2021 to April 2022 (table 13). Over 4 ft of elevation rise was observed between February and May 2022 sampling events. For the first 19 days following the injection, bromide concentrations increased in the downgradient well GS2-MW4 to a maximum concentration of 7.14 mg/L. Peak bromide concentrations were observed in GS2-MW7 during the May 2022 (Q2) sampling event, consistent with the water-level observations (figs. 21, 23). Horizontal hydraulic gradients between well pairs along the direction of flow ranged from 0.002 to 0.031 ft/ft in test plot GS2. The corresponding specific discharge ranged from 5.79 to 80.01 ft/yr (mean 29.7 ft/yr; table 12). No apparent reduction in hydraulic conductivity from the injected amendments was observed over the performance monitoring period (table 12).
Test plot GS3 is outside the source area and close to the collection trench, between the areas where two previous pilot tests (described in the “Previous Remedial Investigations and Activities” section) were attempted (fig. 4). The biostimulation injection was conducted on October 20, 2021. Similar to the other sites, the overall water level was low during injection; however, response at nearby wells with continuous monitoring was minimal (less than 0.25 ft). As in test plot GS1, the injection was completed entirely by gravity feed at an average rate of 1.16–1.35 gal/min for a total of 500 gal (table 3). Bromide breakthrough curves showed rapid time to peak concentration in surrounding wells, but unlike GS1 and GS2, concentration peaks were not observed along the expected flowline between the injection well and GS3-MW9. Rather, increases were noted in GS3-MW2 and GS3-MW3 in the first 19 days, but the bromide concentrations in GS3-MW4 did not peak until February (Q1), suggesting differing conditions or localized flow paths surrounding the injection well (fig. 23C). Bioaugmentation injection was conducted on December 2, 2021, and similar to the biostimulation injection, did not trigger an increase in groundwater elevation in GS3-MW4 (fig. 19C). The calculated radius of influence based on bromide was 12.74 ft (table 12), relatively consistent with the estimated design radius of influence of 15 ft.
Groundwater flow direction in GS3 trended from the injection well in a north-northwest direction, except during the May 2022 period of high water levels (fig. 22). Between February and May 2022, there was a maximum of more than 8 ft increase in groundwater elevation (fig. 19C; table 13). Under the high water-level conditions, some mounding was observed near wells GS3-MW7 and GS3-MW8, and groundwater flow directions were variable (fig. 22).
Indicators of Donor Movement and Redox Conditions
The lactate-EVO mixture used as a donor solution resulted in TOC concentrations of 1,190, 686.6, and 1,470 mg/L, respectively, in wells GS1-I, GS2-I, and GS3-I (Mejia and others, 2025). The injection solutions also contained about 200 mg/L of bromide, added as a conservative tracer. Thus, TOC-NVDOC and bromide concentrations were used as indicators of the movement of donor dissolved in the groundwater during the pilot test (fig. 23). Increases in specific conductance were often associated with increases in TOC-NVDOC and bromide (Mejia and others, 2025). Several redox-sensitive constituents, including Fe2+, sulfate, and methane (fig. 24), were used to evaluate whether the addition of the donor induced the anaerobic conditions required for reductive dechlorination of TCE.
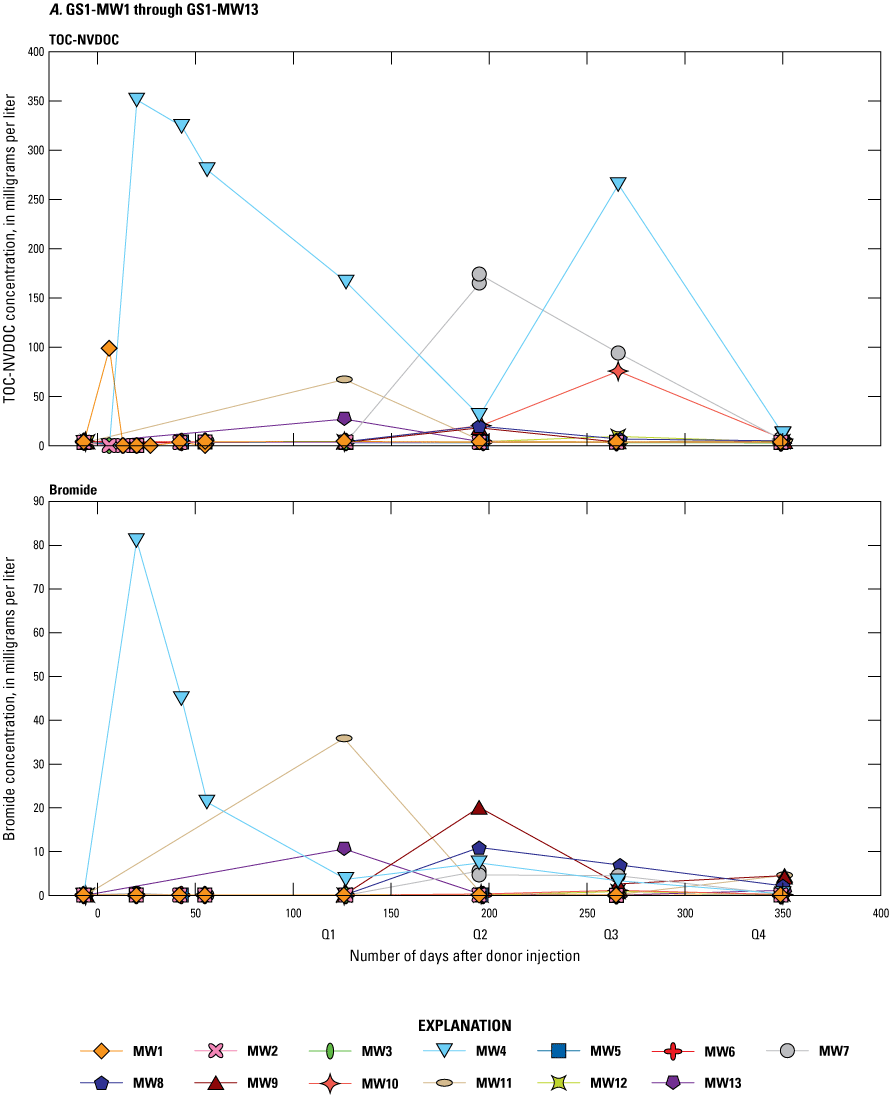
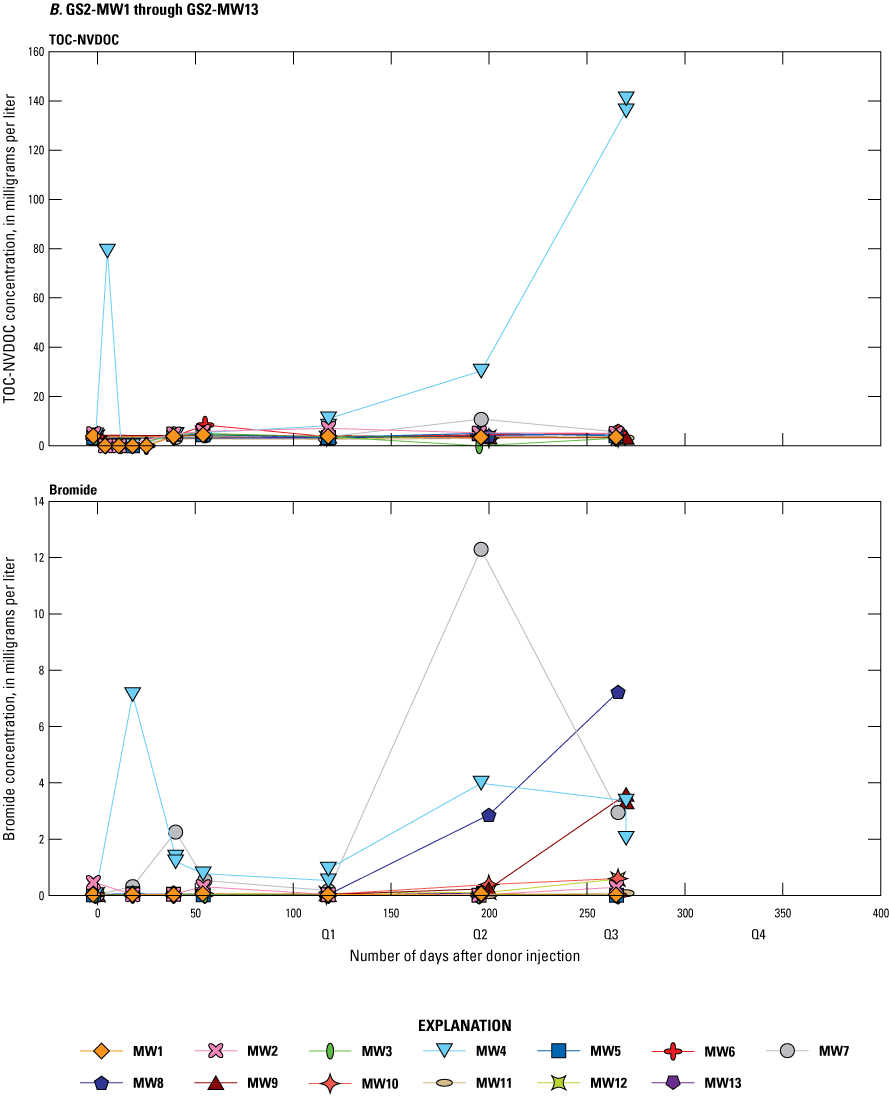
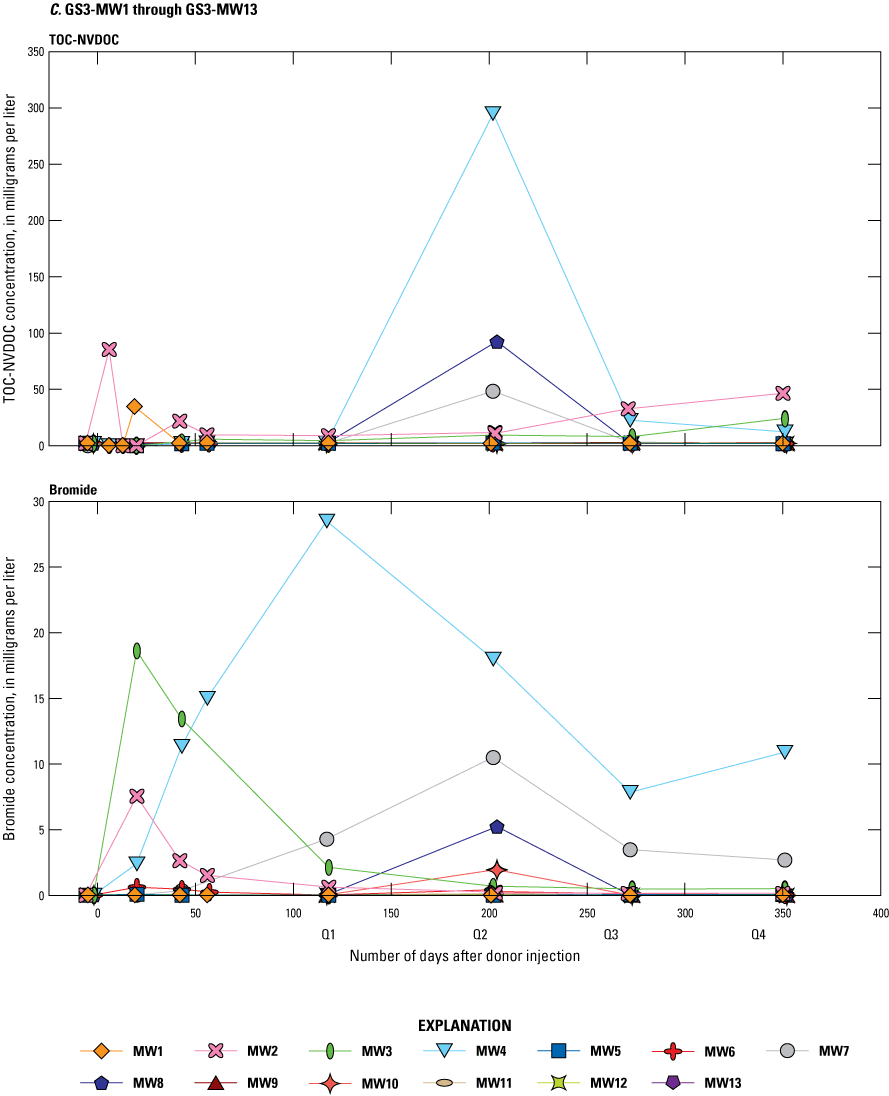
Line graphs showing concentrations of total organic carbon (TOC) or nonvolatile dissolved organic carbon (NVDOC) and bromide in wells A, GS1-MW1 through GS1-MW13, B, GS2-MW1 through GS2-MW13, and C, GS3-MW1 through GS3-MW13 during the bioremediation pilot test at Site K, former Twin Cities Army Ammunition Plant, Arden Hills, Minnesota, October 2021–22. Data are from Mejia and others (2025). [Q1, first quarter; Q2, second quarter; Q3, third quarter; Q4, fourth quarter]
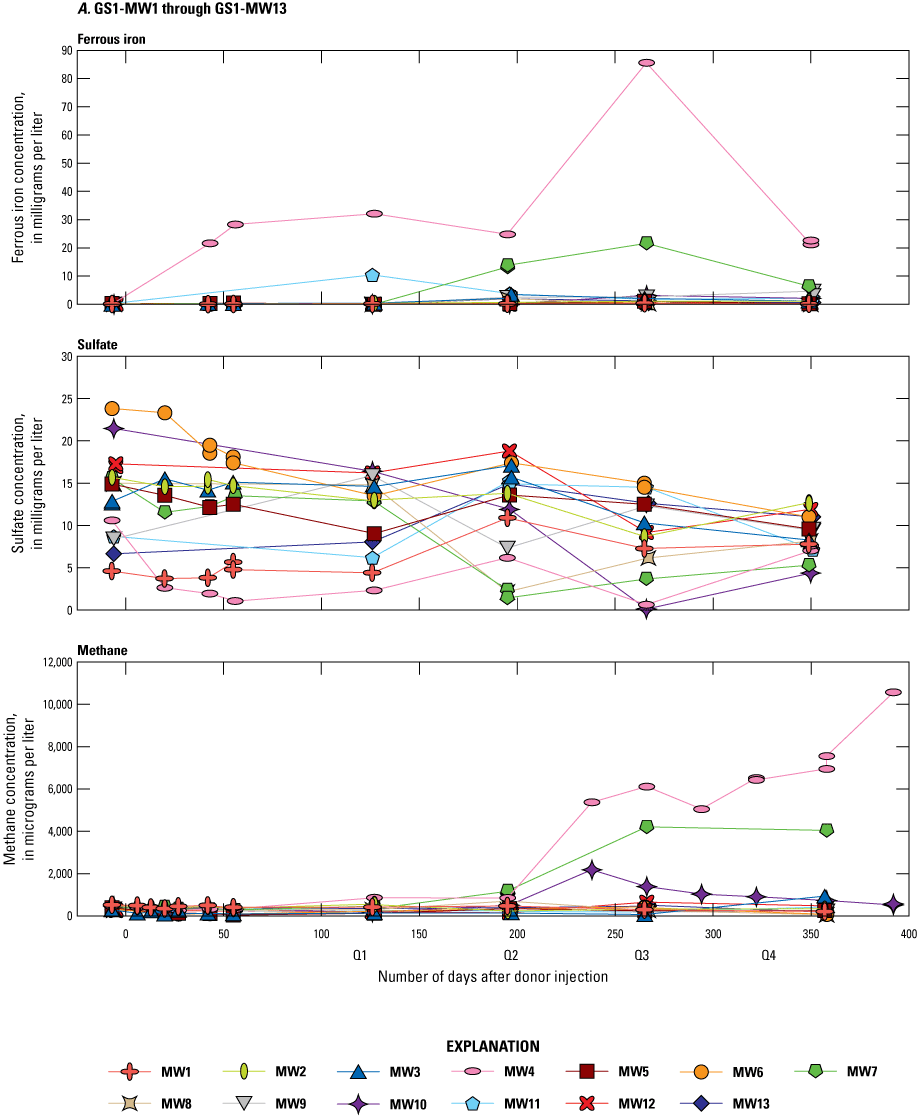
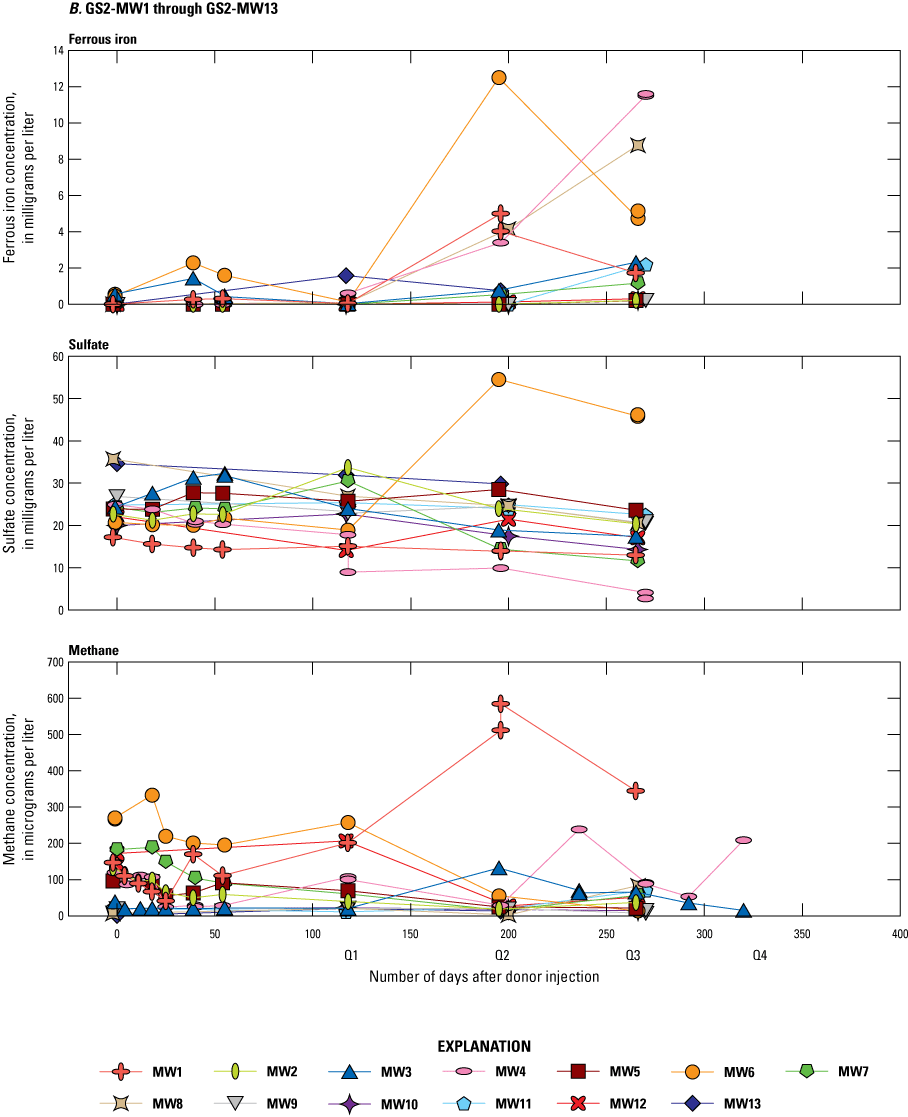
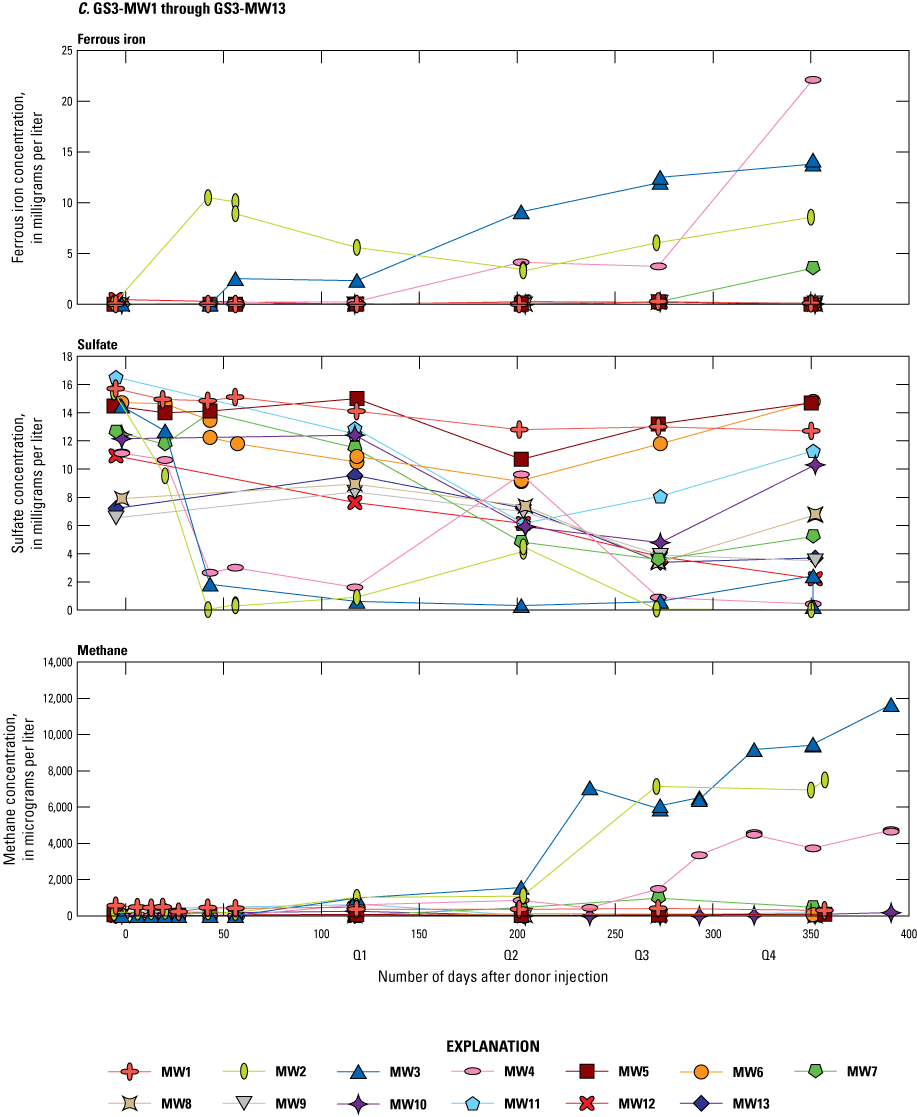
Line graphs showing concentrations of ferrous iron, sulfate, and methane in wells A, GS1-MW1 through GS1-MW13, B, GS2-MW1 through GS2-MW13, and C, GS3-MW1 through GS3-MW13 during the bioremediation pilot test at Site K, former Twin Cities Army Ammunition Plant, Arden Hills, Minnesota, October 2021–November 2022. Data are from Mejia and others (2025).[Q1, first quarter; Q2, second quarter; Q3, third quarter; Q4, fourth quarter]
High bromide concentrations (greater than 2 mg/L) compared to baseline concentrations (0.034 mg/L) were observed within 20 days after donor injection in at least one well in each of the three treatment plots. The highest bromide concentrations were observed in treatment areas GS1 and GS3, which had maximums of 81.1 and 28.5 mg/L, respectively, over the 1-year monitoring period (fig. 23). The number of wells with elevated bromide concentrations generally increased with time after injection in the three treatment areas, indicating a spread of the injected donor. The first elevated TOC-NVDOC concentrations also occurred within 20 days after donor injection in the three treatment areas. In each of the areas, elevated TOC-NVDOC concentrations between 80 and 100 mg/L were measured by day 6 following donor injection in one monitoring well (fig. 23). The maximum TOC-NVDOC concentrations, however, occurred after day 6 in the three treatment areas. The maximum TOC-NVDOC concentration was 351 mg/L in GS1-MW4 on day 20 and was followed by decreasing concentrations before a second peak of 265 mg/L on day 266 (Q3 event; fig. 23). In areas GS2 and GS3, the maximum TOC-NVDOC concentrations occurred around day 270 and day 200, respectively, and generally coincided with elevated bromide concentrations (fig. 23). However, elevated bromide concentrations sometimes preceded elevated TOC-NVDOC concentrations in a well, such as the maximum peaks of these constituents in GS3-MW4 (fig. 23). The bromide movement is likely representative of the fast-release lactate component of the donor mixture, whereas the increases in TOC-NVDOC are also due to dissolution and transport of the relatively slow-release EVO. Elevated NVDOC concentrations were measured in some wells up to 265–270 days after donor injection in GS1 and GS2 and through day 352 (Q4 event, October 2022) in GS3. Note that samples were not obtained in the GS2 area during the Q4 sampling event because of insufficient water (fig. 23).
Fe2+ concentrations increased after donor amendment in the three treatment areas, indicating that anaerobic iron-reducing conditions were enhanced (fig. 24). Baseline Fe2+ concentrations ranged between 0.069 and 0.560 mg/L in monitoring wells in the three treatment areas. Fe2+ concentrations in some monitoring wells downgradient from the injection wells increased to concentrations between 2 and 20 mg/L by 40 days after donor injection; concentrations then continued to increase through day 270 (Q3 event) in areas GS1 and GS2 and through day 350 (Q4 event) in area GS3 (fig. 24). Fe2+ concentrations were higher in areas GS1 and GS3 (maximum of 85.6 and 22.1 mg/L, respectively) than in area GS2 (maximum of 12.5 mg/L). The highest Fe2+ concentrations in area GS1 occurred in GS1-MW4 and GS1-MW7, which are sequentially downgradient from the injection well (fig. 24A). In area GS3, the highest Fe2+ concentrations occurred in GS3-MW2, GS3-MW3, and GS3-MW4, which surround the injection well (fig. 24C).
Sulfate concentrations showed a greater variability among the monitoring wells in each treatment area but were less than 35 mg/L in all wells throughout the monitoring period, except for a peak concentration of 54.5 mg/L in GS2-MW6 (fig. 24B). The sulfate variability is likely partially caused by variable increases in oxygenation of the shallow groundwater with recharge and rising water-level elevations. In area GS1, sulfate concentrations reached a maximum in many of the wells during the Q2 event, including in the upgradient well GS1-MW1 (fig. 24A). Sulfide also was commonly detected in the monitoring wells in all sampling events (Mejia and others, 2025), however, indicating that sulfate reduction occurred even during periods of oxygenation. In area GS1, sulfide concentrations were greatest in GS1-MW4, which also showed the lowest sulfate concentrations during most of the monitoring period (fig. 24A). Overall, sulfate concentrations were lowest in the groundwater in treatment area GS3, where the depth to the water table was greatest. Localized reductions in sulfate concentrations that were distinct from the concentration in the upgradient well in each test plot were most evident in area GS3. In wells GS3-MW2, GS3-MW3, and GS3-MW4 surrounding the injection well, sulfate concentrations decreased from about 11–15 mg/L to less than 3.0 mg/L following donor injection and indicate enhanced sulfate reduction (fig. 24C). The highest Fe2+ concentrations from iron reduction were also observed in wells GS3-MW2, GS3-MW3, and GS3-MW4.
The greatest increases in methane concentrations in the groundwater in the three treatment areas generally occurred later than the changes in Fe2+ or sulfate concentrations (fig. 24), consistent with increased development of reducing conditions. During baseline sampling, methane was present in relatively low concentrations that ranged from 62.5 to 570.5 µg/L in the three treatment areas. Substantial increases in methane concentrations that indicated enhancement of methanogenic conditions began more than 200 days following donor injection. Methane concentrations increased above 2,000 µg/L in some wells in the GS1 and GS3 treatment areas, reaching maximum concentrations above 10,000 µg/L by the end of the monitoring period (fig. 24). In contrast, methane concentrations did not change substantially in the groundwater in treatment area GS2, where concentrations were mostly below 350 µg/L throughout the monitoring period. Overall, the presence of methane indicated that conditions were conducive for reductive dechlorination in all three treatment areas, but the greater increases in methane in areas GS1 and GS3 likely reflect better distribution of the donor and WBC-2 culture amendments in these two treatment areas. Methane concentrations in GS1-MW1 and GS3-MW1, which are upgradient from their respective injection wells in treatment areas GS1 and GS3, did not increase substantially during the monitoring period (fig. 24), indicating that the enhanced methanogenic conditions were associated with the donor and WBC-2 amendments. The increase in methane concentrations in areas GS1 and GS3 after 200 days (Q2 event, May 2022) also coincided with an increase in groundwater temperature (fig. 25), which is known to increase microbial activity. WBC-2 was injected into the treatment areas between November 30 and December 2, 2021, 40–43 days after the donor amendment, when groundwater temperatures were low. Because bromide and NVDOC concentration increases indicated that the donor amendment was distributed to some wells before 200 days post-injection, the onset of increased methanogenic concentrations likely was dependent on the combination of WBC-2 distribution and increased water temperature. The WBC-2 culture does contain methanogens, and changes in the groundwater microbial communities will be discussed later in the section “Microbial Community Changes with Enhanced Biodegradation.”
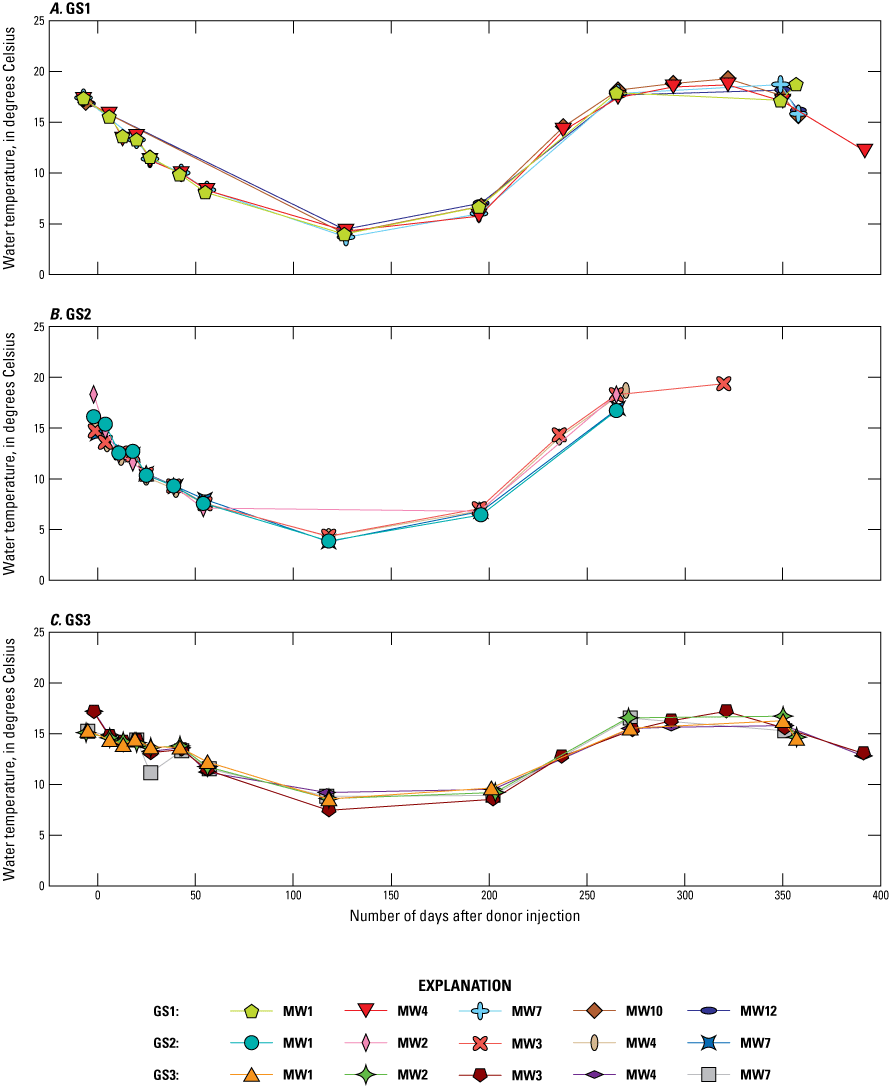
Plots showing temperature in select monitoring wells upgradient (MW1) and downgradient from injection wells in treatment plots A, GS1, B, GS2, and C, GS3 during the bioremediation pilot test, Site K, former Twin Cities Army Ammunition Plant, Arden Hills, Minnesota, October 2021–November 2022. Data are from Mejia and others (2025).
Post-injection performance conditions in each treatment area were also compared to engineering performance criteria detailed by Borden (2017) for establishing conditions conducive to complete reductive dechlorination by EVO. These criteria include a sustained concentration of TOC or NVDOC greater than 20 mg/L, depletion of sulfate concentrations to less than 10 mg/L, and a pH between 6 and 8 standard units.
In GS1, TOC-NVDOC followed a similar trend to bromide, showing a sustained initial spike compared to baseline concentrations in monitoring wells GS1-MW4 and GS1-MW7 in the direction of groundwater flow from the injection well, whereas the spikes were not sustained in other wells surrounding the injection well (fig. 23). On November 15 (27 days post-injection), the TOC concentration in GS1-MW4 was 751 mg/L and was sustained above 20 mg/L in this well throughout the pilot test monitoring period. By May 2022 (Q2 event), TOC in monitoring wells GS1-MW7 and GS1-MW10 was greater than 20 mg/L, despite the low estimate of specific discharge. Other monitoring wells had intermittent concentrations above 20 mg/L that were not sustained. Evidence of conditions conducive to reductive dechlorination along the flowline was also confirmed with elevated concentrations of VFAs in May and July 2022 (Q2 and Q3 events), although the concentrations declined near the end of the monitoring year, particularly at monitoring points farthest from the injection well. The decline indicated a limitation to continued conditions supportive of reductive dechlorination.
Sulfate concentrations were elevated above 10 mg/L across the GS1 treatment area and showed the greatest declines to below 10 mg/L in areas of high TOC (figs. 23, 24). This decline most frequently occurred along the centerline of the test plot. Monitoring wells farthest from the injection well did not show declines below 10 mg/L at the end of the test, indicating that the added donor may not have reached these wells.
The buffering constituents added to the donor injection mixture may have been inadequate to counteract the production of acetic acid in treatment area GS1, as noted by a drop in pH to below 6 after 200 days in GS1-MW4 (a reduction of 2 pH units; Mejia and others, 2025). Lesser declines in pH were observed downgradient in GS1-MW7 and GS-MW8 as well (maximum reduction of approximately 1 unit).
Despite the higher specific discharge at GS2 compared to GS1, the TOC-NVDOC concentrations in area GS2 did not increase substantially, except in GS2-MW4. A peak TOC was observed at GS2-MW4 only 5 days after the injection, and a sustained increase in TOC-NVDOC concentrations occurred again in GS2-MW4 after 100 days (Q1). TOC-NVDOC concentrations in GS2-MW4 were above the 20 mg/L threshold (fig. 23B). Elevated TOC-NVDOC concentrations were also observed in GS2-MW6 and GS2-MW7, but concentrations were below the 20 mg/L threshold (8.41 and 10.8 mg/L on day 55 and 200; fig. 23B). Sulfate remained elevated across the monitoring network in plot GS2, except for GS2-MW4 where sustained elevated TOC-NVDOC concentrations occurred after day 100 (fig. 24). The geochemical data indicate an irregular distribution of the donor matrix to the subsurface in the GS2 area and limited establishment of conditions supportive of anaerobic dechlorination at the site, likely because of the lithologic heterogeneity of the soil matrix. Limited variability in pH was observed and was not likely factor in limiting enhanced biodegradation in GS2.
In test plot GS3, GS3-MW2 in the north-northwest direction of groundwater flow had TOC-NVDOC concentrations greater than the 20 mg/L threshold except for the Q2 event (fig. 23C). The maximum concentration in TOC-NVDOC was observed at GS3-MW4 during the Q2 event, but TOC-NVDOC concentrations declined again before the Q3 and Q4 sampling events, when groundwater flow direction shifted back to the north (figs. 22, 23). TOC-NVDOC concentrations also reached concentrations greater than 20 mg/L in GS3-MW7 and GS3-MW8 during the Q2 event but declined by the time of the Q3 event. Sulfate concentrations were depleted in areas of higher TOC-NVDOC, including GS3-MW2, GS-MW3, and GS3-MW4. Overall, sulfate concentrations were lower in GS3 than those in the treatment areas GS1 and GS2 (fig. 24).
Geochemical Evidence of Biodegradation of Chlorinated Volatile Organic Compounds
Groundwater concentrations of TCE and its sequential daughter products, including DCE, VC, and the nonchlorinated product ethene, were monitored throughout the pilot test to evaluate changes in reductive dechlorination of TCE that occurred with distribution of the injected amendments. The distribution of cVOCs and ethene during the baseline and four quarterly sampling events is shown in a grid with the upgradient control well (MW1) and potential downgradient monitoring well locations (MW2 to MW13) in relation to the injection well, providing spatial and temporal distributions in each treatment area (figs. 26, 27, 28). The changes in the molar percentage of cVOCs and ethene in the samples best represent the occurrence and extent of degradation reactions (figs. 26, 27, 28). The total mass concentrations of the cVOCs are also given in figures 26, 27 and 28 to show the heterogeneity in contamination in the shallow aquifer, which likely reflects the heterogeneity in TCE sources remaining in the soil (fig. 4). In addition to the effects of biodegradation, changes in the mass concentrations of the cVOCs during the pilot test may have resulted from DNAPL desorption and dissolution and from fluctuations with mixing of variable concentrations in the groundwater with rising and falling water levels and mixing with recharge. Overall higher cVOC concentrations were present in the groundwater in treatment areas GS1 and GS2, which were expected to be in the proximity of remaining TCE source areas from historical data and our pre-pilot test investigations, compared to area GS3, which is downgradient from the expected source areas and in a thicker part of the aquifer. Figures 29 and 30 show indicators of donor presence and biodegradation and the cVOC and ethene concentrations in groundwater along approximate flow paths downgradient from the injection wells in treatment areas GS1 and GS3; these figures provide greater temporal detail with time after donor injection and include quarterly and monthly sampling events. Temporal changes of the same constituents in the upgradient control wells for treatment areas GS1 and GS3 are shown in figure 31.
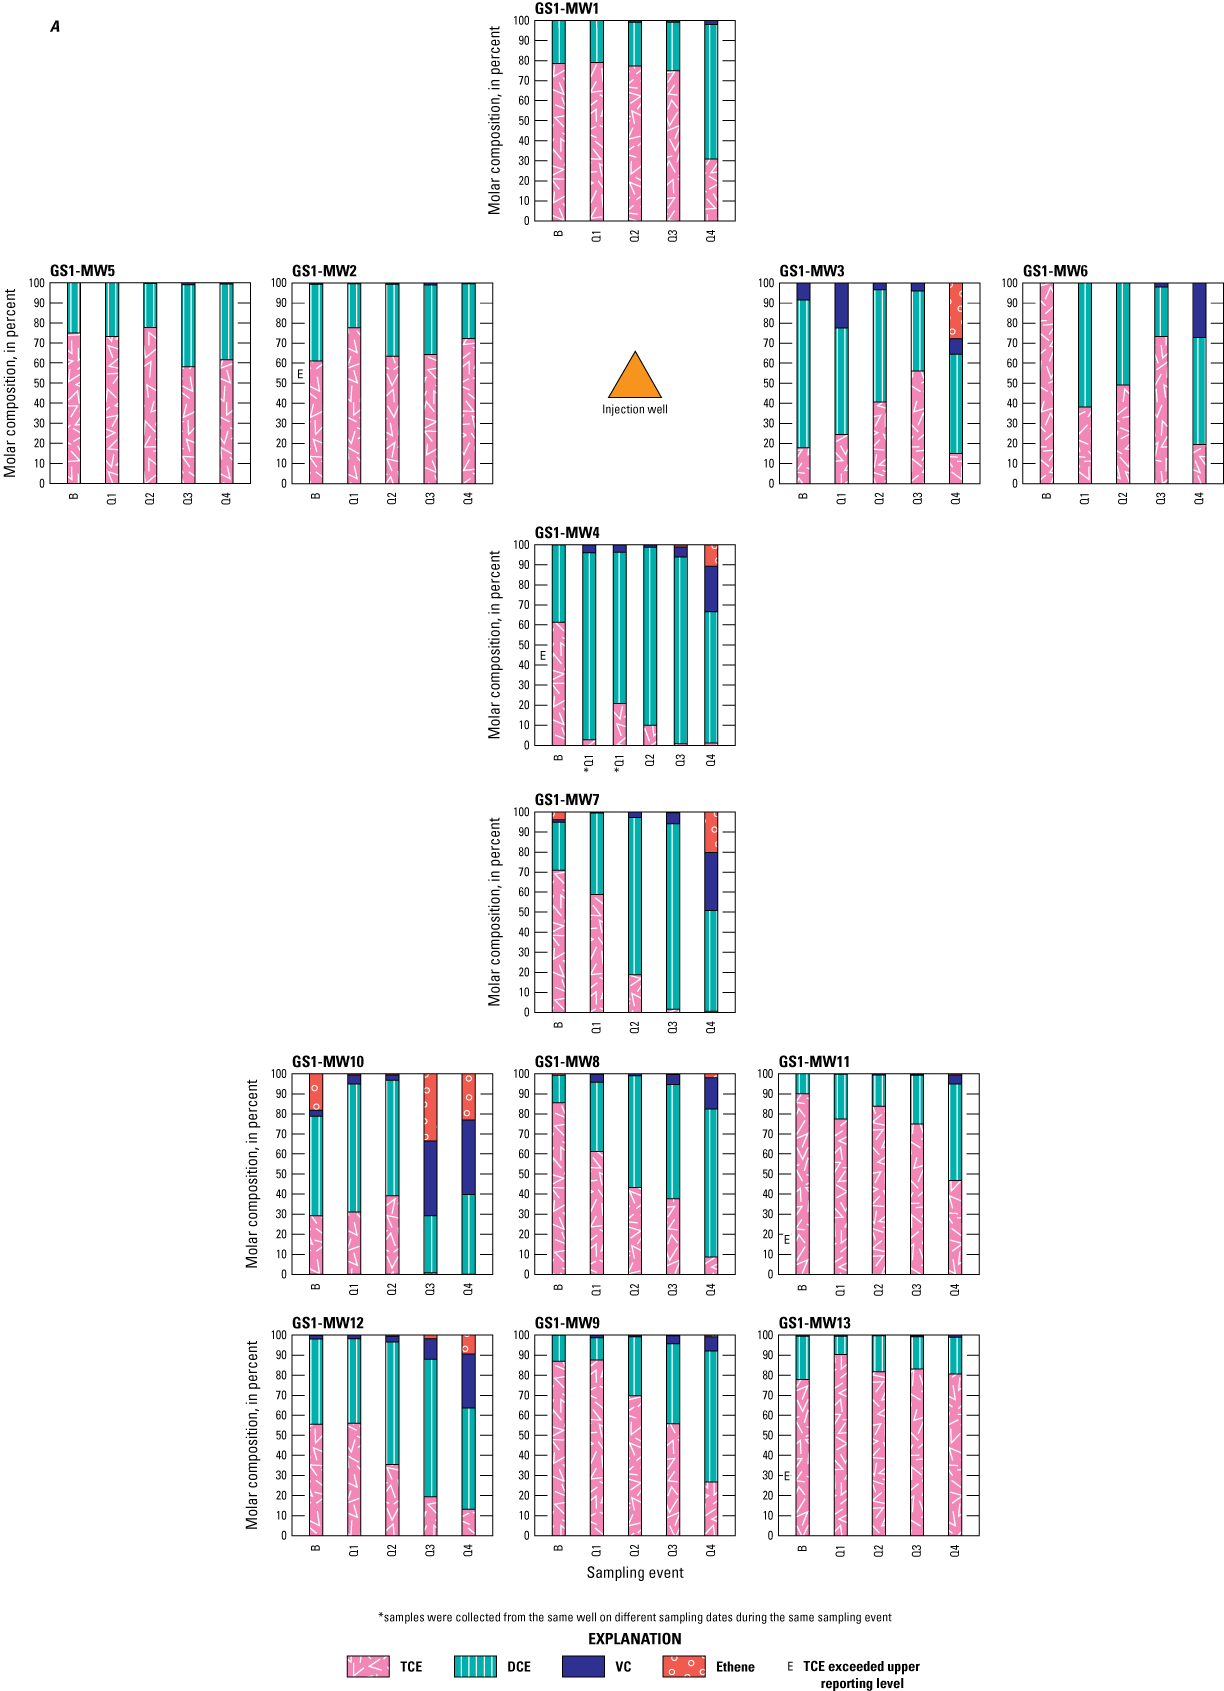
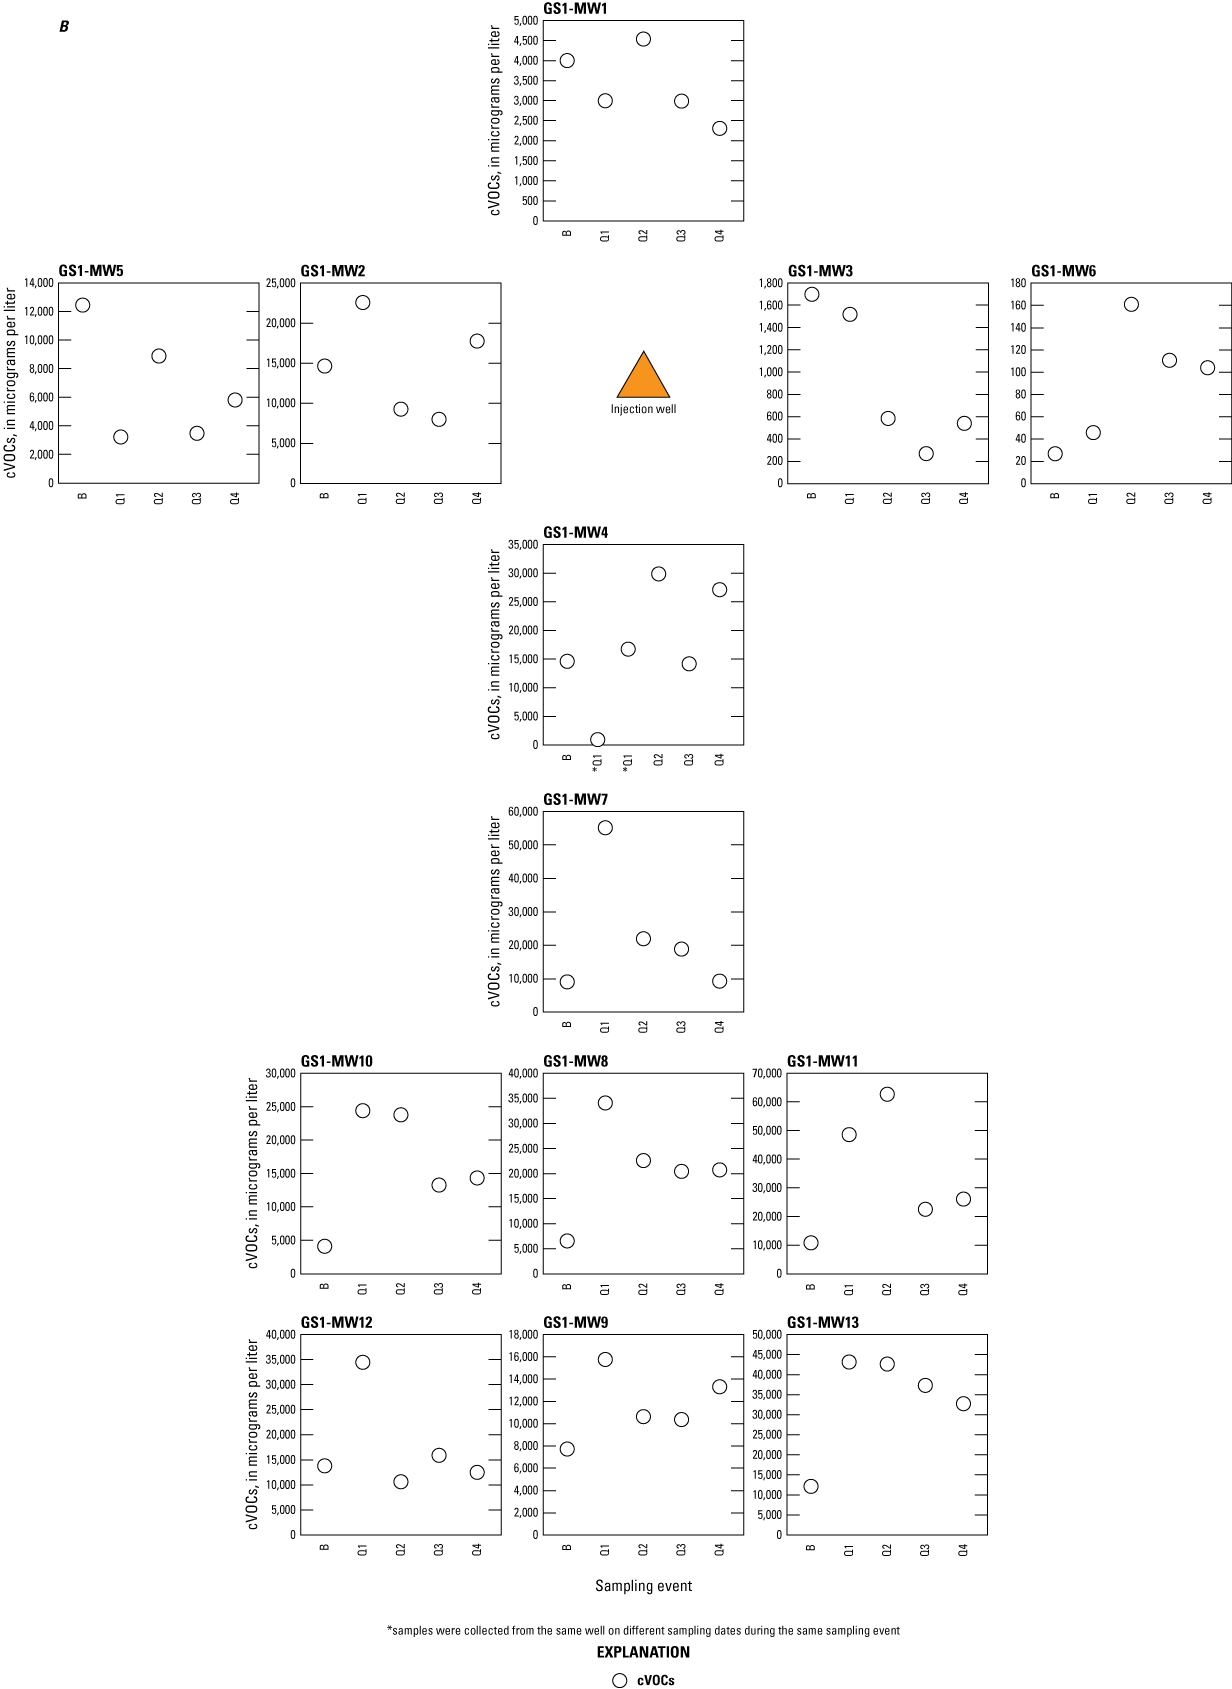
Graphs showing the distribution of chlorinated volatile organic compounds (cVOCs) and ethene in wells in treatment plot GS1, Site K, former Twin Cities Army Ammunition Plant, Arden Hills, Minnesota, during the baseline sampling event (B) and four subsequent quarterly sampling events, October 2021–22: A, molar composition of cVOCs and ethene, and B, total cVOCs. cVOCs include trichloroethene (TCE), dichloroethene (DCE; sum of cis-1,2-dichloroethene, trans-1,2-dichloroethene, and 1,1-dichloroethene), and vinyl chloride (VC). Data are from Mejia and others (2025). [Q1, first quarter (February 2022); Q2, second quarter (May 2022); Q3, third quarter (July 2022); Q4, fourth quarter (October 2022)].
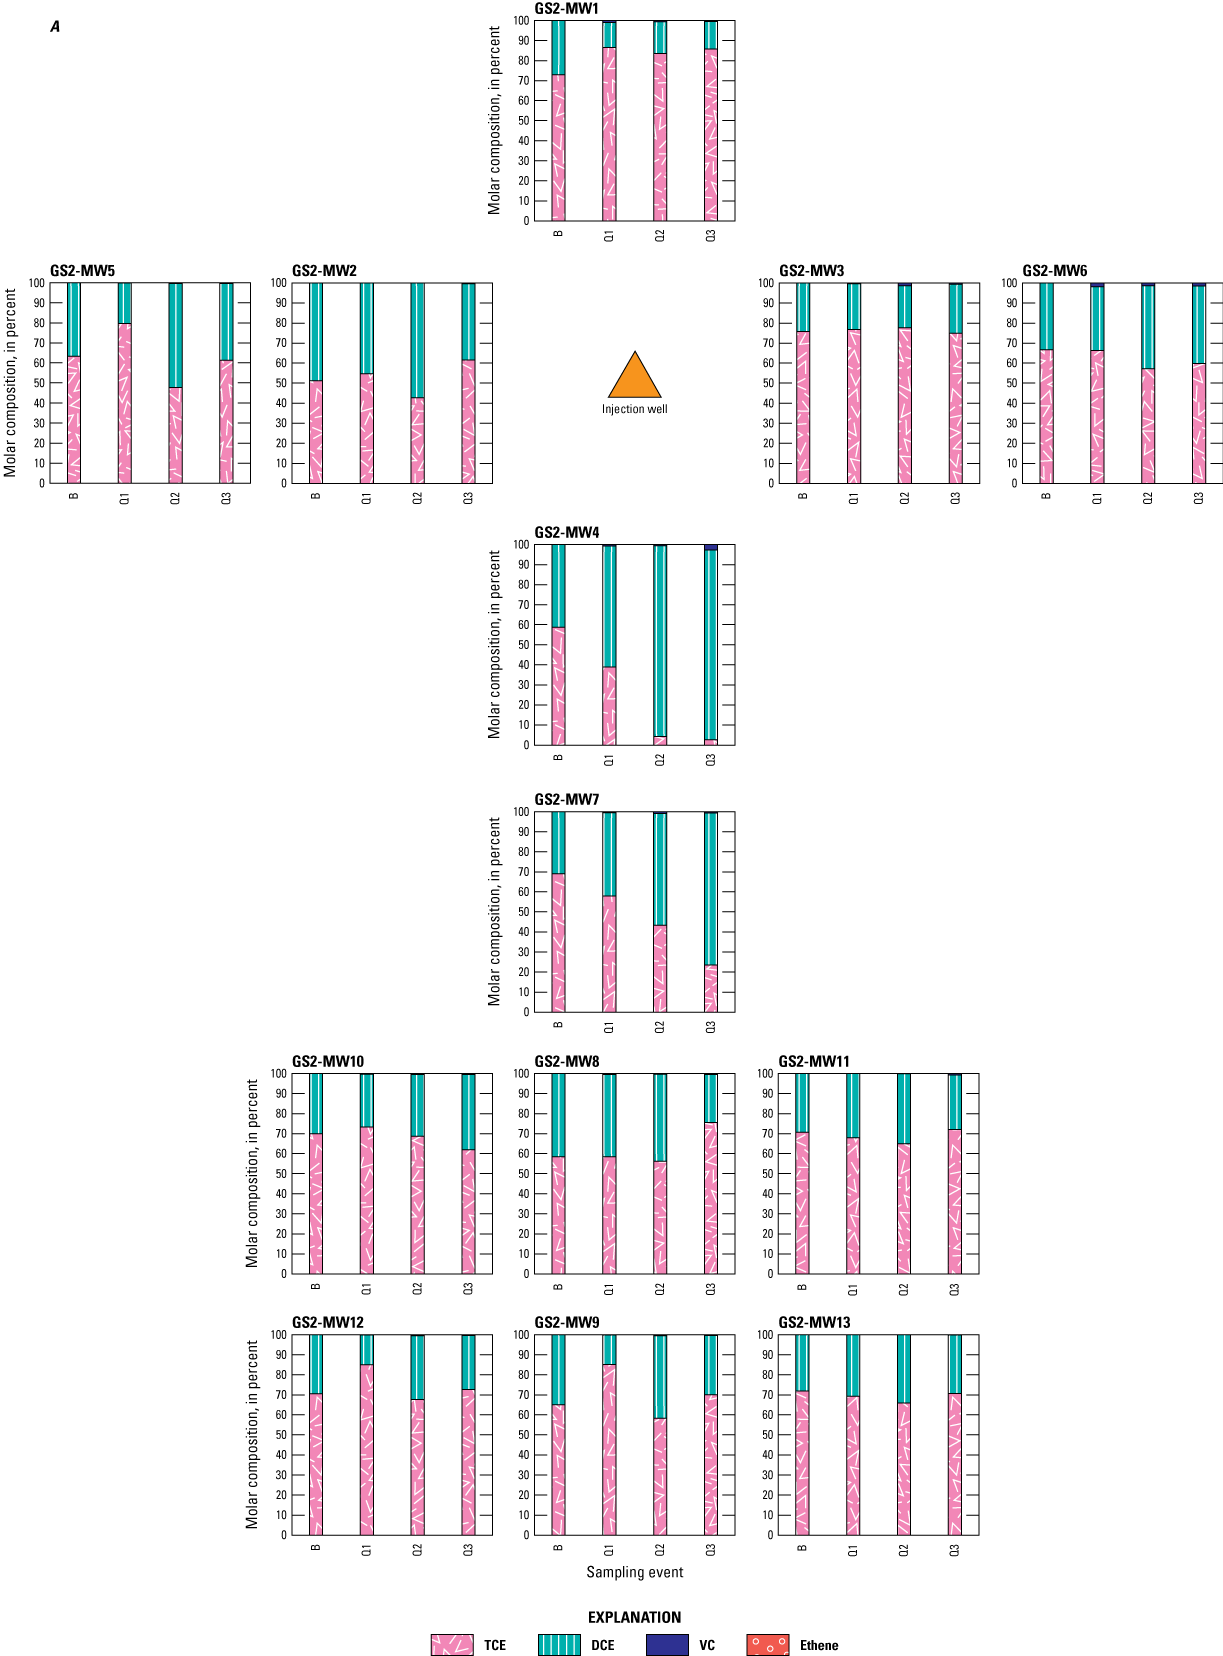
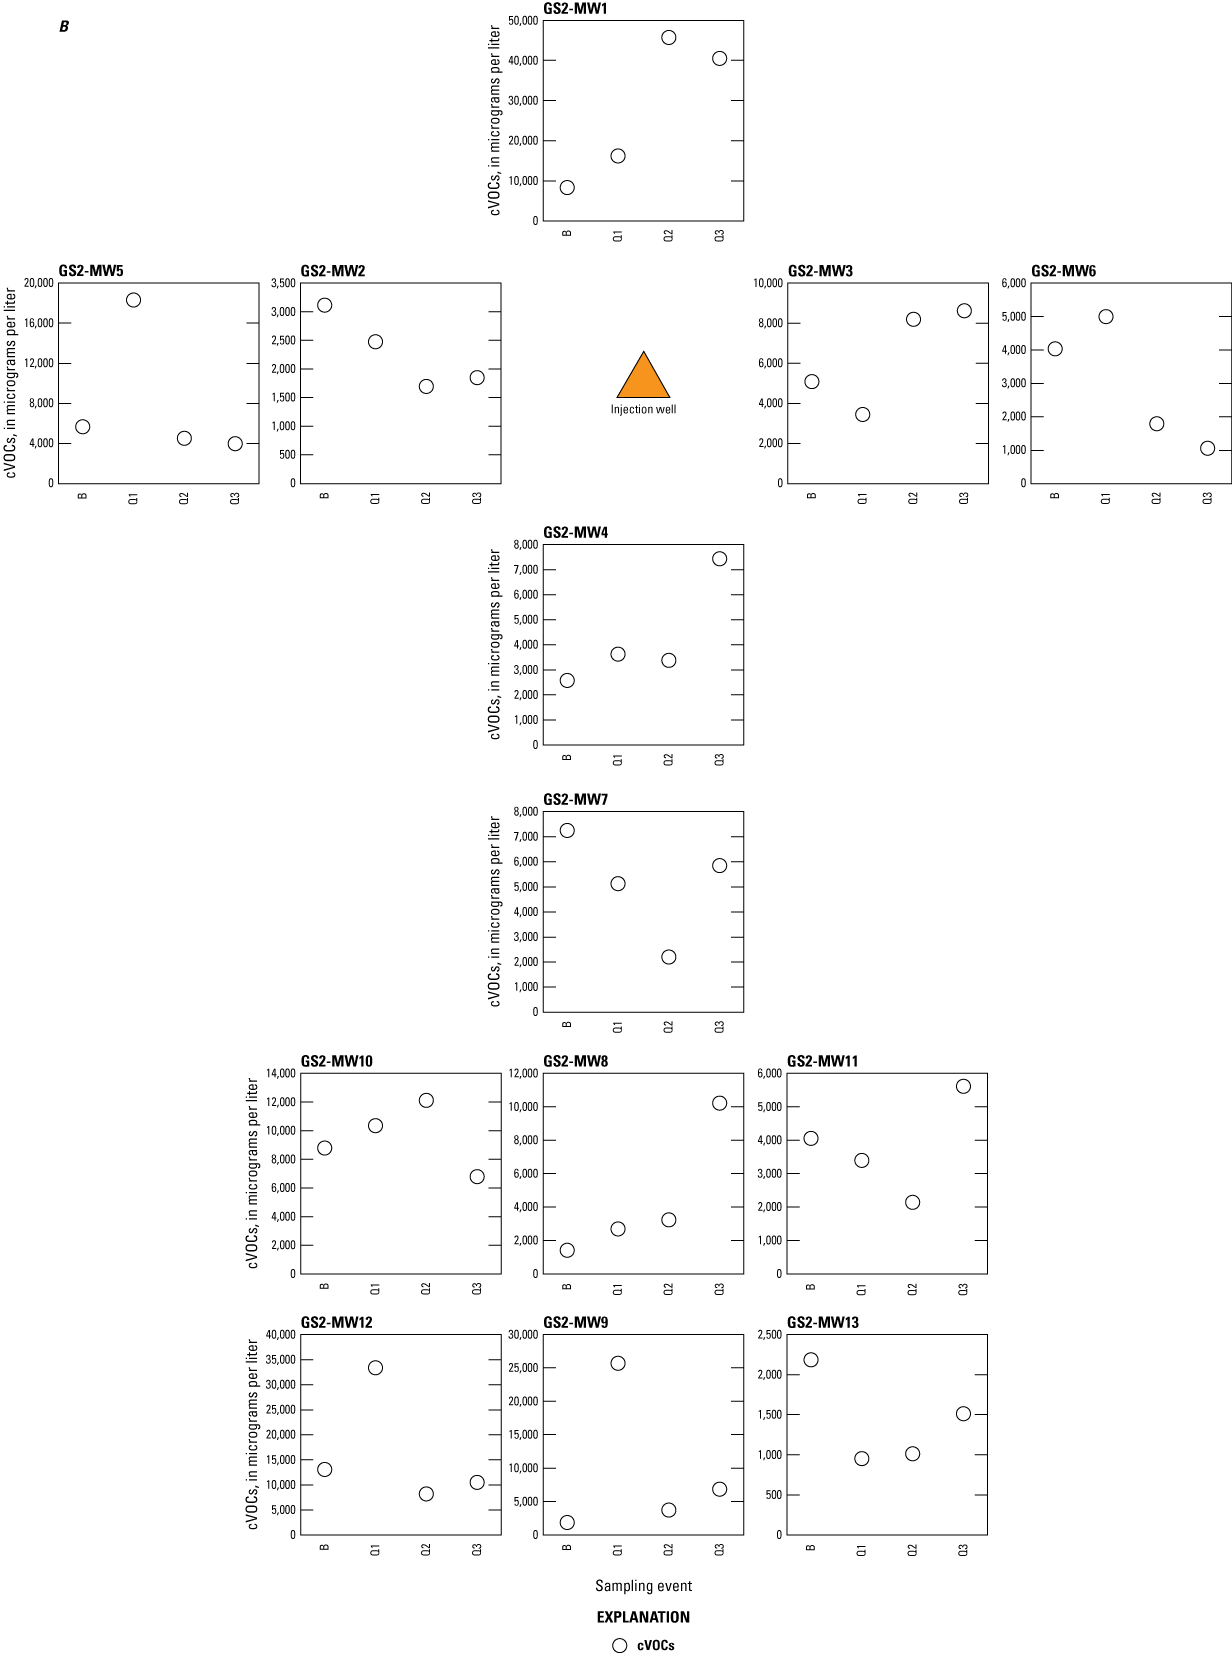
Graphs showing the distribution of chlorinated volatile organic compounds (cVOCs) and ethene in wells in treatment plot GS2, Site K, former Twin Cities Army Ammunition Plant, Arden Hills, Minnesota, during the baseline sampling event (B) and four subsequent quarterly sampling events, October 2021–22: A, molar composition of cVOCs and ethene, and B, total cVOCs. cVOCs include trichloroethene (TCE), dichloroethene (DCE; sum of cis-1,2-dichloroethene, trans-1,2-dichloroethene, and 1,1-dichloroethene), and vinyl chloride (VC). Data are from Mejia and others (2025). Note that GS2 wells were dry in Q4. [Q1, first quarter (February 2022); Q2, second quarter (May 2022); Q3, third quarter (July 2022); Q4, fourth quarter (October 2022)].
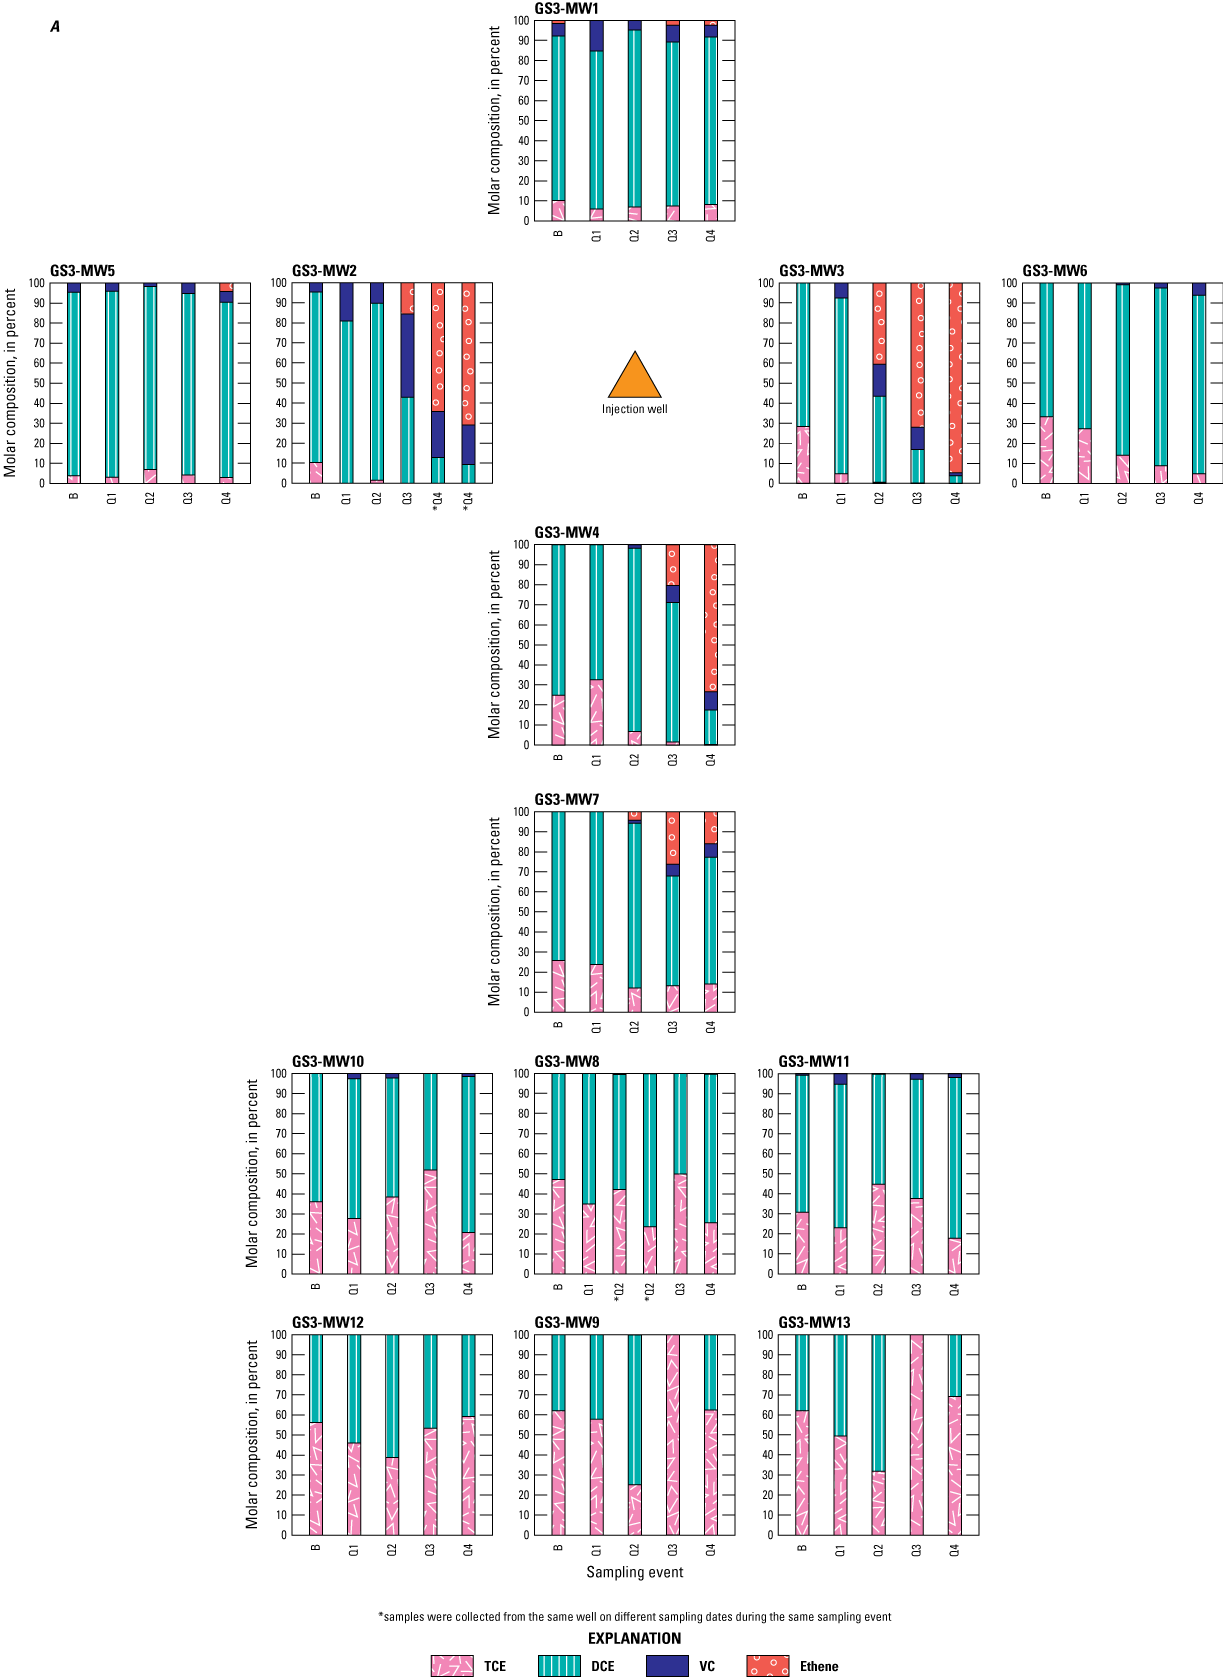
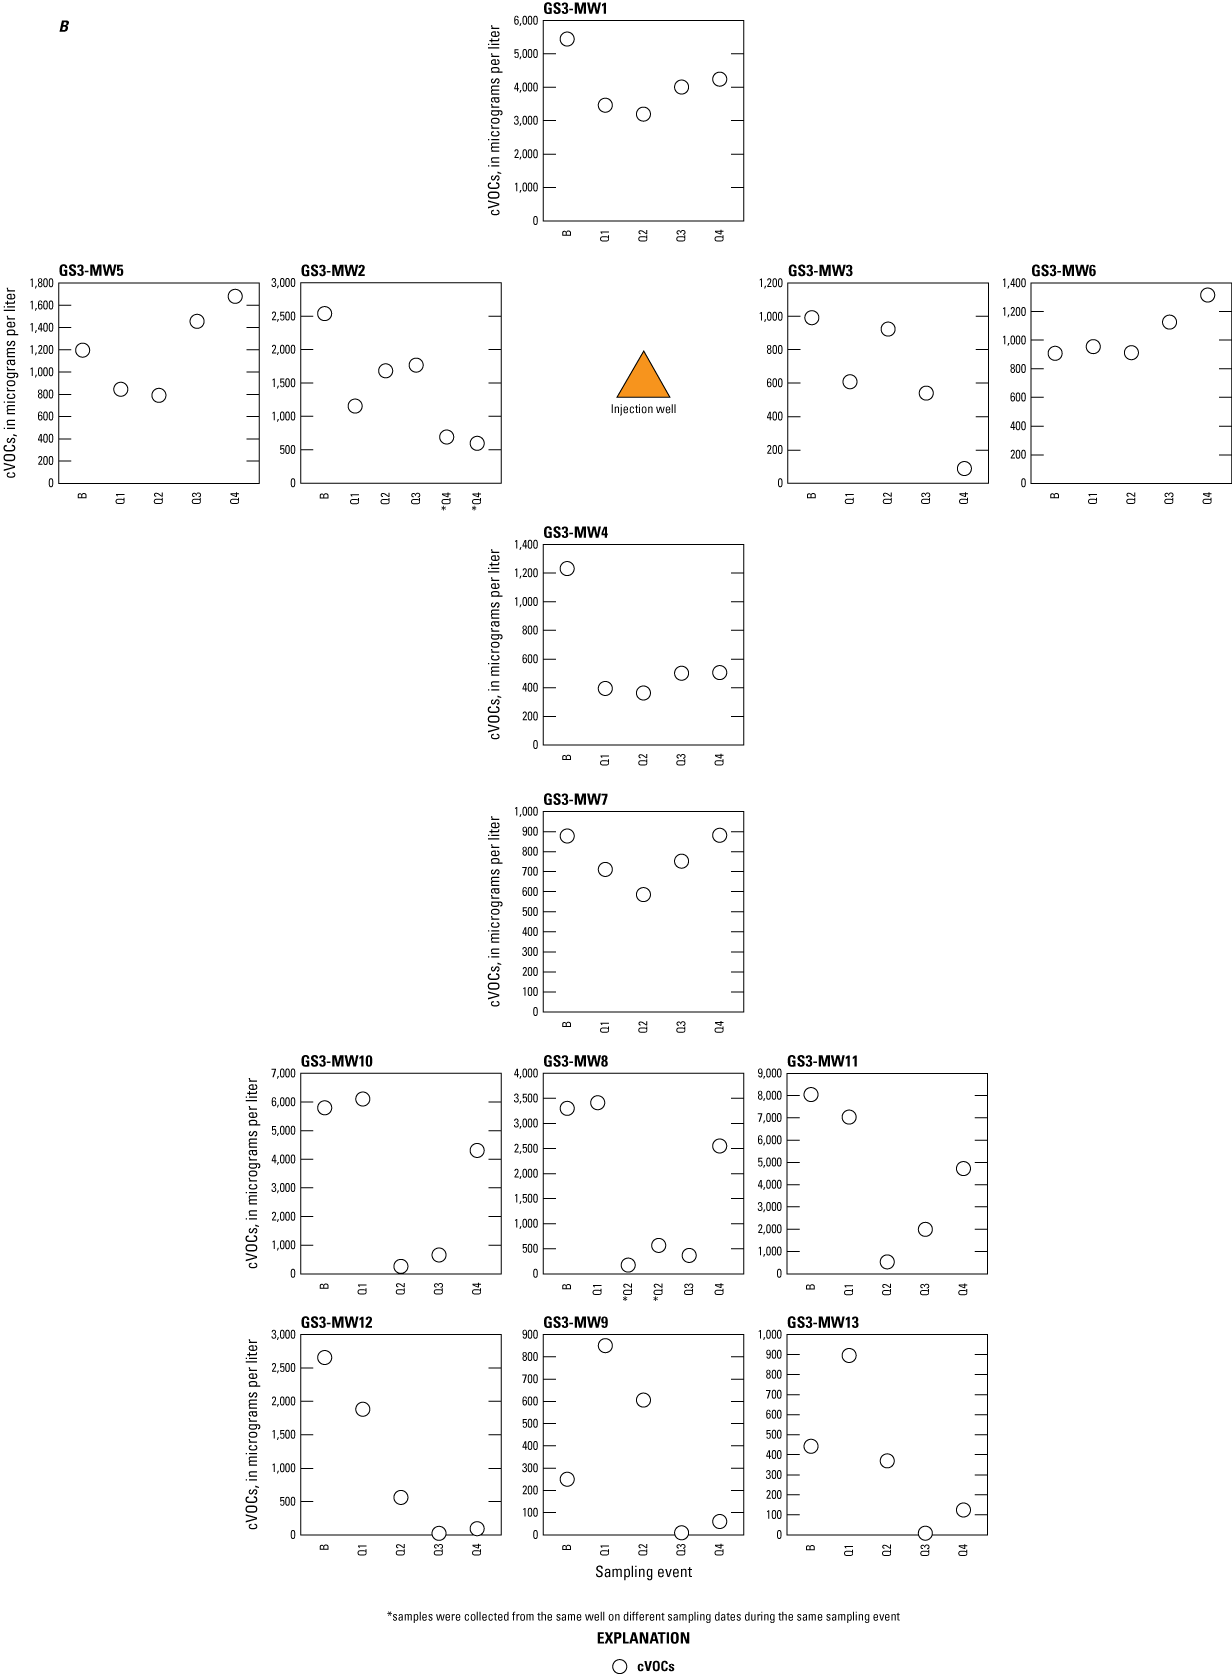
Graphs showing the distribution of chlorinated volatile organic compounds (cVOCs) and ethene in wells in treatment plot GS3, Site K, former Twin Cities Army Ammunition Plant, Arden Hills, Minnesota, during the baseline sampling event (B) and four subsequent quarterly sampling events, October 2021–22: A, molar composition of cVOCs and ethene, and B, total cVOCs. cVOCs include trichloroethene (TCE), dichloroethene (DCE; sum of cis-1,2-dichloroethene, trans-1,2-dichloroethene, and 1,1-dichloroethene), and vinyl chloride (VC). Data are from Mejia and others (2025). [Q1, first quarter (February 2022); Q2, second quarter (May 2022); Q3, third quarter (July 2022); Q4, fourth quarter (October 2022)].
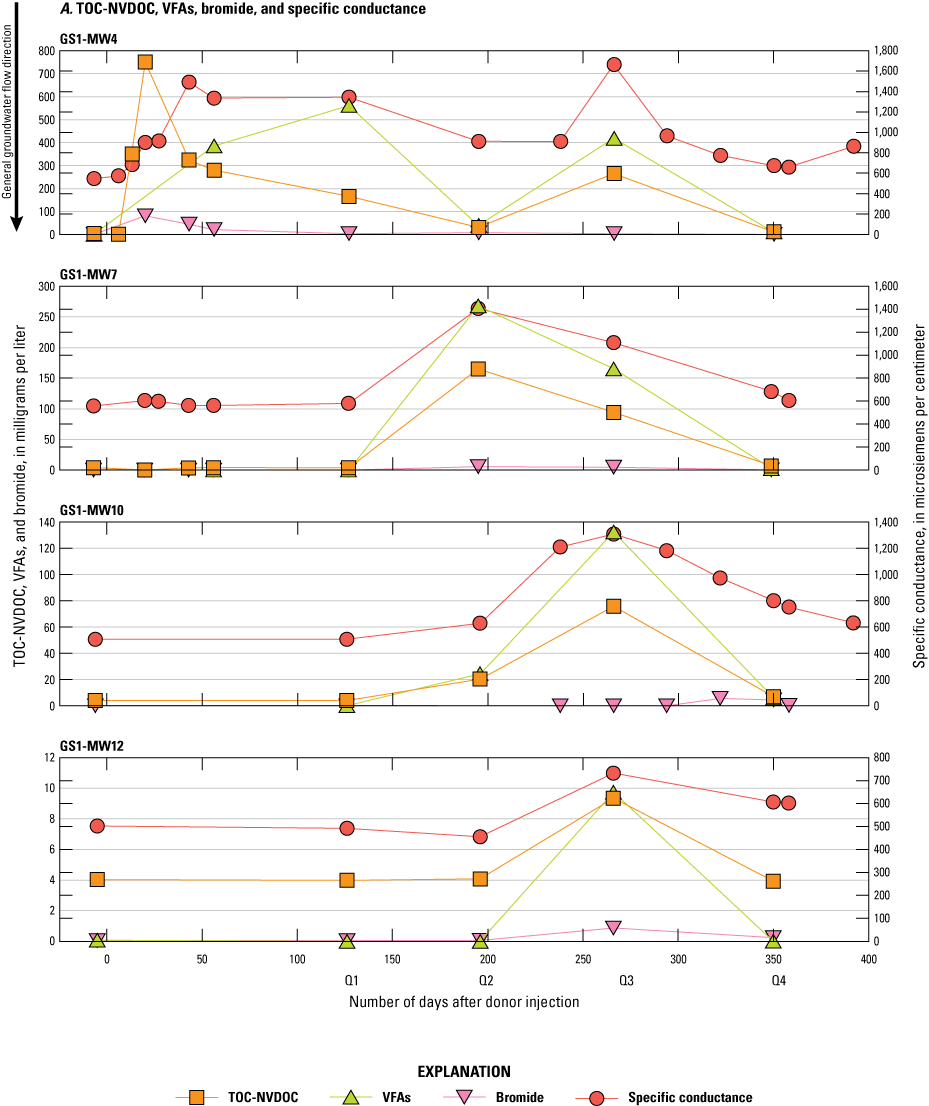
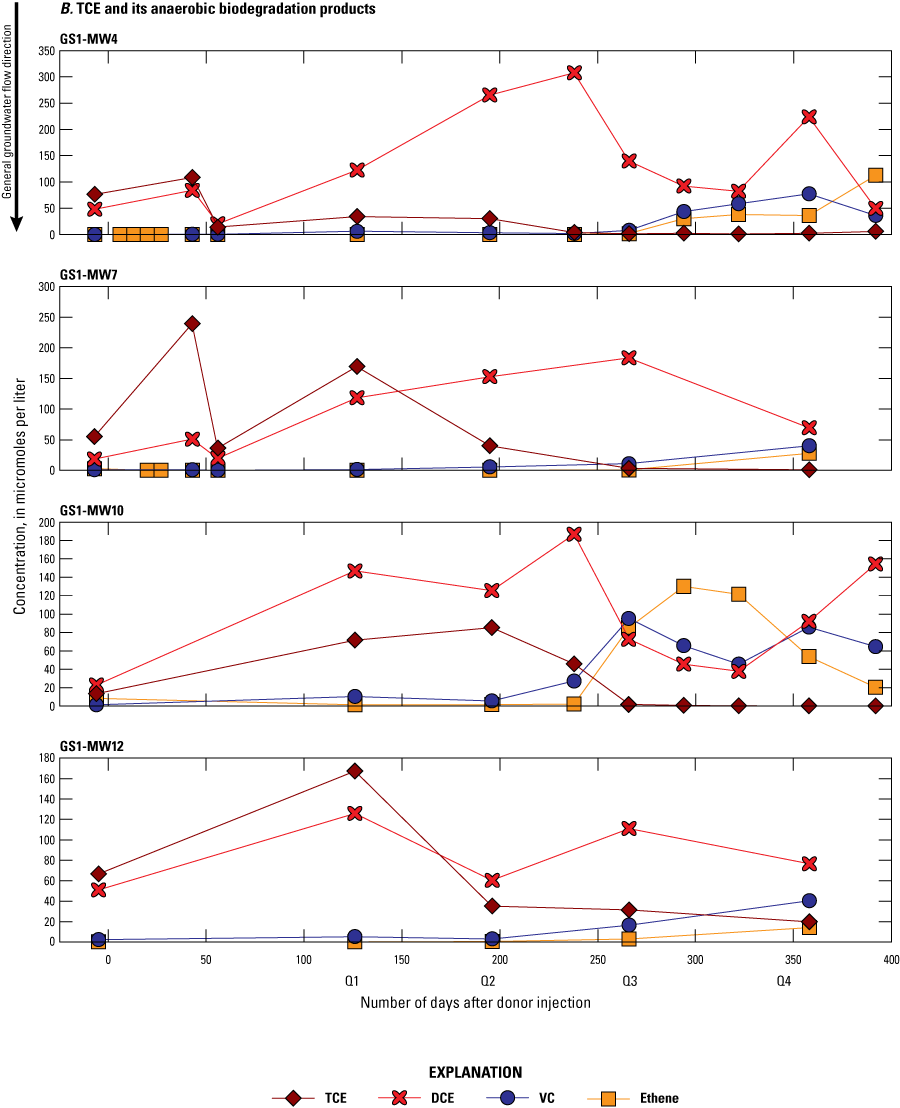
Line graphs comparing the concentrations of the following constituents indicative of presence of carbon donor amendment in monitoring wells along an approximate flow path in treatment plot GS1 at Site K, former Twin Cities Army Ammunition Plant, Arden Hills, Minnesota, October 2021–November 2022: A, total organic carbon (TOC) or nonvolatile dissolved organic carbon (NVDOC), volatile fatty acids (VFAs, sum of acetate and propionate), bromide, and specific conductance, and B, trichloroethylene (TCE) and its anaerobic biodegradation products, which include dichloroethene (DCE, sum of cis-1,2-dichloroethene, trans-1,2-dichloroethene, and 1,1-dichloroethene), vinyl chloride (VC), and ethene. Data are from Mejia and others (2025). [Q1, first quarter (February 2022); Q2, second quarter (May 2022); Q3, third quarter (July 2022); Q4, fourth quarter (October 2022)]
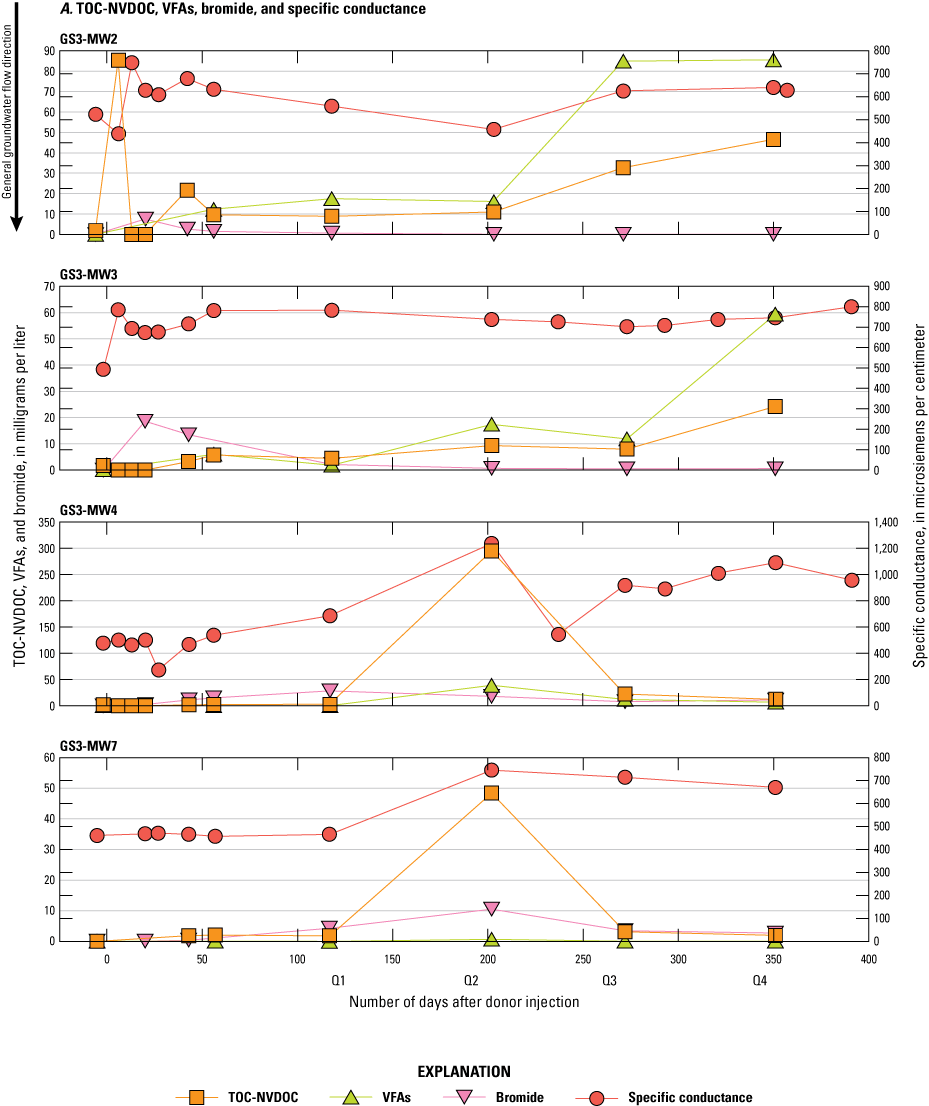
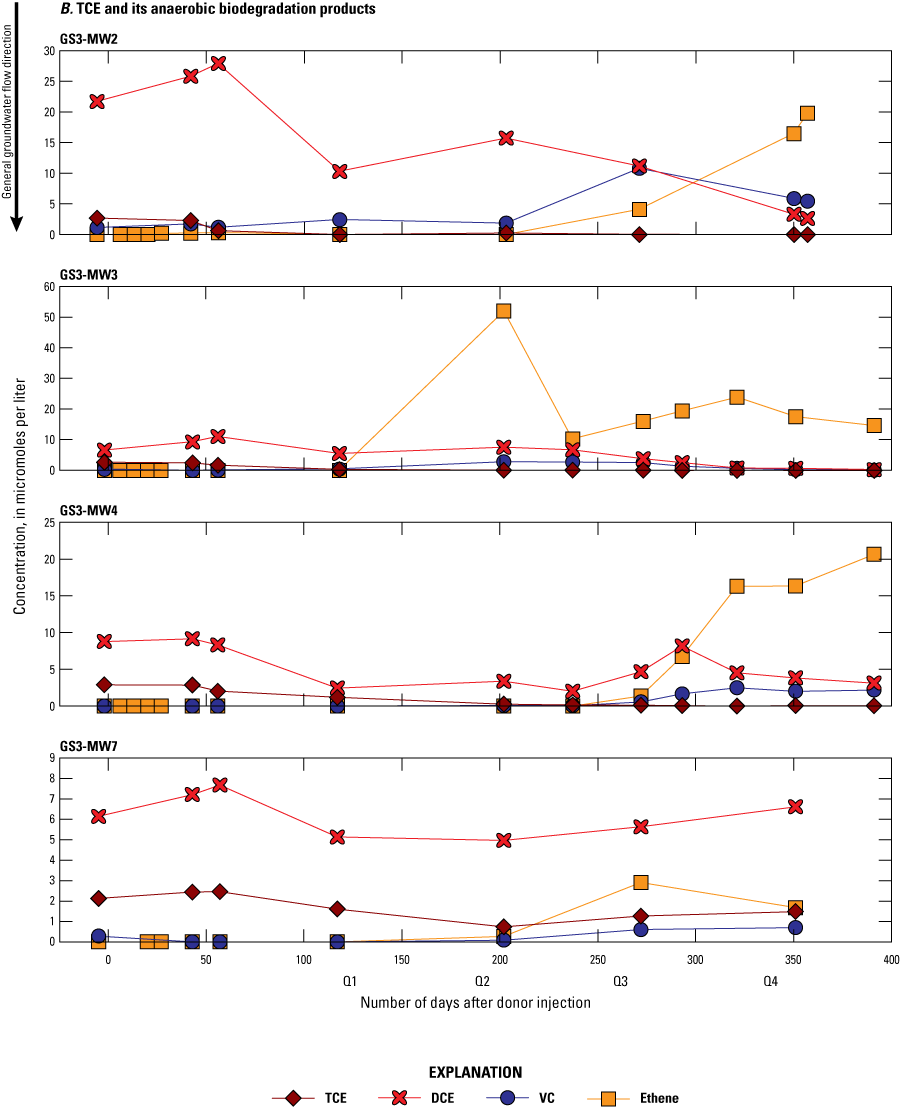
Line graphs comparing the concentrations of the following constituents indicative of presence of carbon donor amendment in monitoring wells along an approximate flow path in treatment plot GS3 at Site K, former Twin Cities Army Ammunition Plant, Arden Hills, Minnesota, October 2021–November 2022: A, total organic carbon (TOC) or nonvolatile dissolved organic carbon (NVDOC), volatile fatty acids (VFAs, sum of acetate and propionate), bromide, and specific conductance, and B, trichloroethylene (TCE) and its anaerobic biodegradation products, which include dichloroethene (DCE, sum of cis-1,2-dichloroethene, trans-1,2-dichloroethene, and 1,1-dichloroethene), vinyl chloride (VC), and ethene. Data are from Mejia and others (2025). [Q1, first quarter (February 2022); Q2, second quarter (May 2022); Q3, third quarter (July 2022); Q4, fourth quarter (October 2022)]
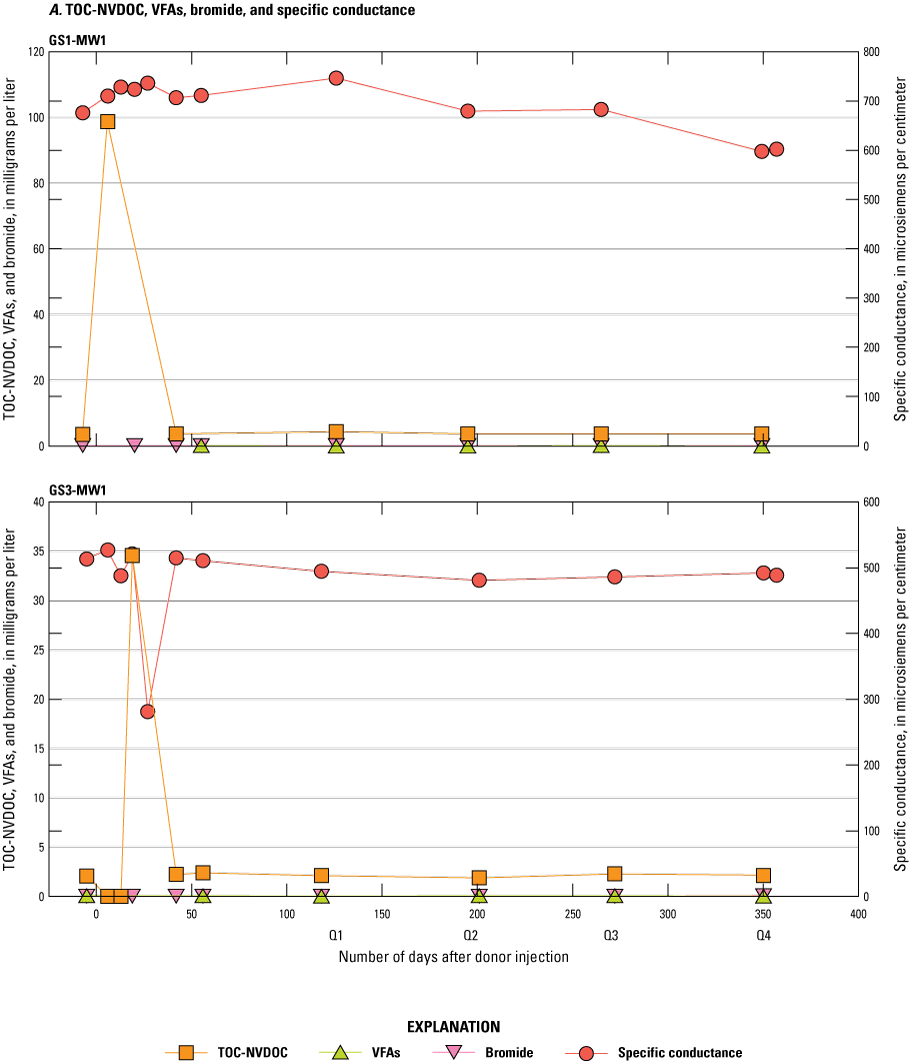

Line graphs comparing the concentrations of the following constituents indicative of presence of carbon donor amendment in monitoring wells upgradient from injection wells in treatment plots GS1 and GS3 (GS1-MW1 and GS3-MW1, respectively) at Site K, former Twin Cities Army Ammunition Plant, Arden Hills, Minnesota, October 2021–November 2022: A, total organic carbon (TOC) or nonvolatile dissolved organic carbon (NVDOC), volatile fatty acids (VFAs, sum of acetate and propionate), bromide, and specific conductance, and B, trichloroethylene (TCE) and its anaerobic biodegradation products, which include dichloroethene (DCE, sum of cis-1,2-dichloroethene, trans-1,2-dichloroethene, and 1,1-dichloroethene), vinyl chloride (VC), and ethene. Data are from Mejia and others (2025). [Q1, first quarter (February 2022); Q2, second quarter (May 2022); Q3, third quarter (July 2022); Q4, fourth quarter (October 2022)]
Not all the monitoring wells in each of the treatment areas showed evidence of enhanced biodegradation of TCE, which was expected because of the uncertainty in the distribution of the injected donor and WBC-2 amendments owing to uncertainty in groundwater flow directions and rates (figs. 26, 27, 28). Biodegradation of TCE was more evident in treatment areas GS1 and GS3 than in GS2 (figs. 26, 27, 28). In GS1, enhanced biodegradation of TCE to DCE was evident before the Q1 sampling event in wells adjacent to, or close to, the injection well, including GS1-MW3, GS1-MW4, and GS1-MW6, where the molar percentage of DCE or VC increased (fig. 26). The molar percentage of DCE continued to increase as TCE decreased to near or below the detection limit in GS1-MW4 and GS1-MW7 through the Q3 sampling event. By the Q3 event, enhanced TCE biodegradation was also evident in the next two rows of monitoring wells, where the molar percentage of TCE decreased and VC and ethene increased in GS1-MW10 and GS1-MW12. Complete reductive dechlorination of TCE to ethene appeared to be occurring in all these wells (GS1-MW3, GS1-MW4, GS1-MW7, GS1-MW10, and GS1-MW12) during the Q4 event (fig. 26). A lower extent of biodegradation was observed in GS1-MW8 and GS1-MW9 during the Q2, Q3, and Q4 events, where TCE degradation to predominantly DCE occurred. The cVOC and ethene data thus indicate movement of the amendments predominantly to the west and southwest in treatment area GS1, where relatively low head gradients made flow directions difficult to define (fig. 20).
In contrast to treatment area GS1, only two GS2 monitoring wells, GS2-MW4 and GS2-MW7, which are immediately downgradient from the injection well, showed consistent evidence of enhanced biodegradation of TCE with decreasing molar percentage of TCE and increasing DCE by the Q2 and Q3 events (fig. 27). Other TCE daughter products were largely undetected in the groundwater in GS2 by the Q3 event (fig. 27), and the wells could not be sampled in Q4 because of insufficient water. The cVOC results were consistent with the general lack of movement of the injected donor or increase in methane in GS2 (figs. 23, 24). The more heterogenous lithology and presence of clay layers in the perched aquifer, combined with the nearly flat hydraulic head gradients, likely limited the movement of water and distribution of the injections in GS2.
In treatment area GS3, enhanced biodegradation of TCE to DCE was evident in wells GS3-MW2 and GS3-MW4 (adjacent to the injection well) by the Q1 sampling event and in wells GS3-MW4 and GS3-MW7 (downgradient from the injection well) by the Q2 event (fig. 28). Ethene concentrations in these four wells showed that complete reductive dechlorination of the TCE and DCE was occurring before or during the Q3 sampling event. The groundwater at GS3-MW3 showed the earliest onset of ethene production, and ethene accounted for 40 percent of the cVOCs plus ethene by the Q2 sampling event. Ethene molar percentages continued to increase to more than 70 by the Q4 event in the three wells closest to the injection well (GS3-MW2, GS3-MW3, and GS3-MW4 in fig. 28). The lower initial TCE concentrations and absence of residual DNAPL, which could provide a continuing source of TCE and DCE, likely accounted for the greater percentage production of the nonchlorinated end product ethene in the groundwater in the GS3 treatment area. However, the areal extent of enhanced biodegradation appeared to be more limited in area GS3 than GS1. The groundwater in the two last rows of monitoring wells in area GS3 only showed minor reduction in total mass concentrations of cVOCs during the Q4 sampling event, but no consistent change in the molar compositions of the cVOCs and ethene was observed to indicate enhanced biodegradation (fig. 28). In test plot GS3, a depression in the water table elevations in Q2 indicated that flow from the injection wells toward the trench may have stalled or reversed directions in the area of the last two rows of monitoring wells, GS3-MW8 to GS3-MW13 (fig. 22).
Correlation between donor movement (peaks in NVDOC and VFA concentrations) and cVOC biodegradation with time after the donor injection were observed in treatment areas GS1 and GS3 (figs. 29, 30). Acetate and propionate, fermentation products of the lactate-EVO donor mixture, were the predominant VFAs detected, and their combined concentrations are shown as total VFAs in figures 29 and 30. In GS1, peaks in specific conductance values and NVDOC and VFAs concentrations downgradient from the injection well were generally concurrent (fig. 29). Peaks in NVDOC and VFA concentrations were also concurrent in GS3, but the relation with specific conductance was not consistent (fig. 30). The specific conductance values and NVDOC and VFAs concentrations in upgradient wells in treatment areas GS1 and GS3 remained fairly consistent with the baseline concentrations after the donor injection, verifying that the changes observed in the downgradient wells likely resulted from the donor and WBC-2 culture amendments (fig. 31). The predominance of acetate and propionate relative to lactate indicates rapid fermentation of the injected donor occurred. The maximum lactate concentration detected in GS1 and GS3 was 0.55 mg/L (Mejia and others, 2025), whereas the sum of acetate and propionate concentrations was greater than 500 mg/L and 80 mg/L, respectively, in GS1 and GS3 (figs. 29, 30). Continued fermentation of VFAs produces molecular hydrogen, the electron donor utilized by cVOC dehalorespirers (Löffler and others, 1999; Azizian and others, 2010). GS1-MW4, the monitoring well closest to the GS1 injection well, showed two peaks in concentrations of NVDOC and VFAs: one on day 127 and the second on day 266. The next two consecutive wells along the flow path, GS1-MW7 and GS1-MW10, showed consecutively later timing of maximum concentrations of NVDOC and VFAs compared to the first maximum in GS1-MW4 (fig. 29). Maximum concentrations of NVDOC and VFAs decreased in the wells downgradient from GS1-MW4, as would be expected from dispersion and degradation of the organic donor with distance from the injection well (fig. 29). In GS1, the maximum DCE concentrations and onset of ethene production occurred slightly after the peak NVDOC and VFA concentrations, possibly associated with the timing of hydrogen production from the VFAs (fig. 29) and achievement of methanogenic conditions (fig. 24A).
The onset of ethene production in the groundwater in plot GS3 generally occurred slightly after the peak NVDOC and VFA, as observed in groundwater at plot GS1, but the DCE concentrations were not as clearly correlated with the donor movement (fig. 30). The DCE concentrations in GS3 began to decrease by day 50, soon after the donor injection and immediately after the WBC-2 culture injection on day 40, whereas the maximum NVDOC and VFA concentrations were observed around day 200 or later (fig. 30). Because GS3 is not in the known TCE source area, the increase in TCE concentrations and the more extended period of increase in DCE concentrations that occurred post-injection in GS1 was not observed (figs. 29, 30).
Simultaneous production of TCE and DCE appeared to occur initially in area GS1 where movement of the injected donor was evident, and the molar concentrations of DCE produced were greater than the TCE concentrations in wells GS1-MW4 and GS1-MW10 (fig. 29). The relatively high DCE production likely indicates the simultaneous desorption or dissolution and biodegradation of residual TCE in the soil in this source area (fig. 29). In treatment area GS3, where the concentrations of TCE and DCE were substantially lower by comparison, the molar concentrations of ethene sometimes increased above the combined concentrations of TCE, DCE, and VC in the groundwater, indicating rapid degradation of the cVOCs. Although historical soil excavation data did not show residual TCE in or close to the soil in the GS3 treatment area (fig. 4), it is possible that desorption and degradation of TCE and DCE in clayey layers in the GS3 treatment area resulted in the high ethene. Ethene concentrations in the groundwater in GS3 were often greater than VC concentrations, indicating rapid degradation of VC (fig. 30). Ethene concentrations above 0.36 micromoles per liter (µmol/L; or 10 µg/L) has been noted as evidence that complete dechlorination of chlorinated organics occurred (U.S. Environmental Protection Agency, 1998), and the ethene concentrations produced in the groundwater in GS1 and GS3 treatment areas greatly exceeded this criterion (figs. 29, 30).
In all the monitoring wells, the predominant DCE daughter compound measured was cisDCE, followed by transDCE. The 11DCE occurred less frequently and at lower concentrations than cisDCE or transDCE (Mejia and others, 2025). The mean ratios of cisDCE to transDCE were typically greater than 10 in treatment areas GS1 and GS3 through the four quarterly sampling events, whereas the mean ratios of cisDCE to 11DCE were typically greater than 100. Ethane, another potential nonchlorinated daughter product of TCE, was detected in addition to ethene but infrequently, with only 6 detections that ranged in concentration from 7.19 to 20.9 µg/L during the pilot test (Mejia and others, 2025). Acetylene, a potential product of abiotic reduction of TCE (Ferrey and others, 2004), was not detected in any of the groundwater samples (less than 6 to less than 37 µg/L, Mejia and others, 2025).
Carbon Isotope Analyses as Evidence of Biodegradation of Chlorinated Volatile Organic Compounds
CSIA of TCE, cisDCE, transDCE and VC were measured to provide another line of evidence of the occurrence and extent of anaerobic biodegradation (fig. 32). Groundwater samples for CSIA were collected during the Q4 event where evidence for biodegradation of cVOC was observed (figs. 29, 30), as well as the upgradient wells in each treatment area (GS1-MW1 and GS3-MW1; fig. 31). Replicate samples analyzed for GS3-MW3 showed excellent agreement (fig. 32B). As microbes preferentially degrade TCE containing the lighter 12C isotopes before those containing 13C, the remaining dissolved TCE in groundwater will become isotopically heavier as biodegradation continues, resulting in more positive (and less negative) δ13C values (Hunkeler and others, 2008). Undegraded, pure-phase TCE has been reported to be isotopically light, having δ13C ranging from −34 to −22 per mil (‰) with a mean of −28‰ (Mundle and others, 2012). TCE carbon isotope ratios that are heavier than this range for pure-phase TCE would indicate that the TCE has been biodegraded. The TCE daughter compounds are initially lighter in 13C than the parent TCE because of the preferential incorporation of 12C into the daughter compounds. As the daughter compounds themselves are then biodegraded, however, each daughter compound can become isotopically heavier, causing their δ13C values to become greater than the initial TCE δ13C (Song and others, 2002; Mundle and others, 2012; Phillips and others, 2022). If the δ13C of daughter compounds increases by more than 2‰ compared to the parent compound (TCE), it is considered to indicate active biodegradation (Hunkeler and others, 2008). Where residual TCE source existed, continued dissolution of TCE, without biodegradation, would contribute isotopically lighter TCE into the groundwater and counteract the trend toward isotopically heavier TCE that would result from biodegradation. Despite this complicating factor, the δ13C of daughter compounds along the flow paths in GS1 and GS3 indicated that biodegradation was occurring in several of the wells downgradient from the injection wells (fig. 32).
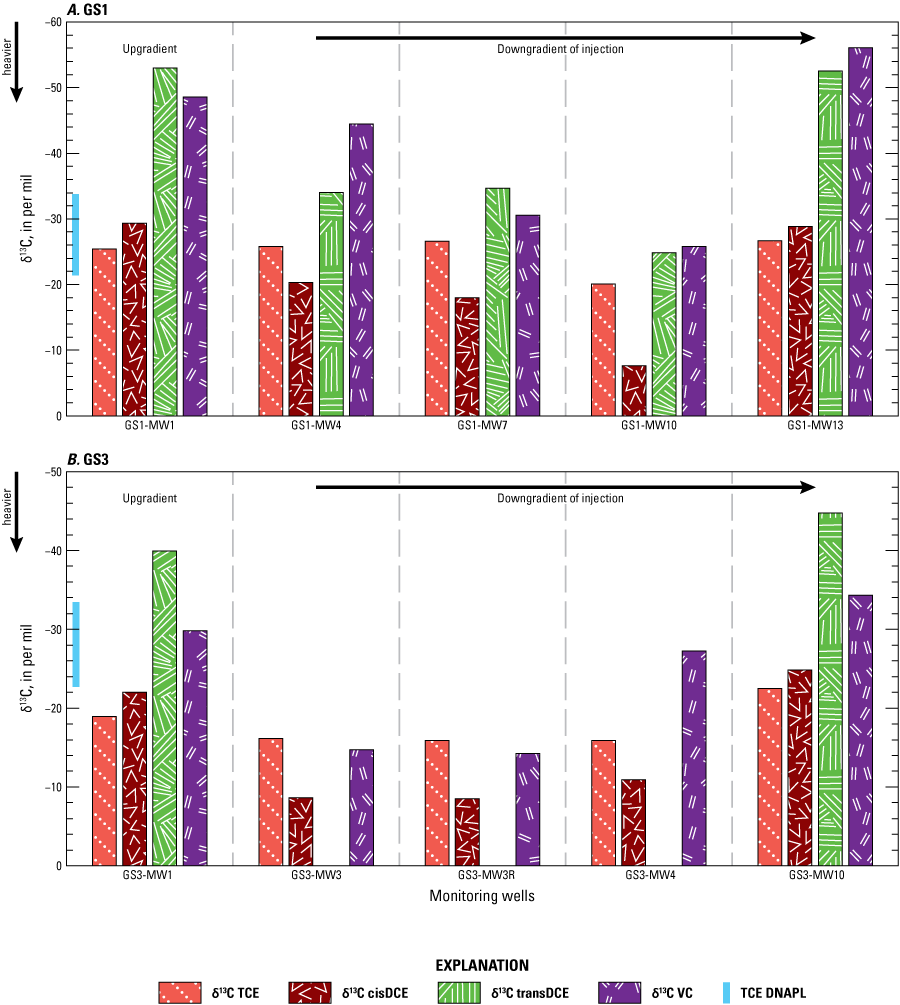
Bar graphs showing the results of compound specific isotope analysis for monitoring wells upgradient (MW1) and downgradient from injection wells in treatment plots A, GS1 and B, GS3 at Site K, former Twin Cities Army Ammunition Plant, Arden Hills, Minnesota, October 2022. The results for trichloroethene (TCE), cis-1,2-dichloroethene (cisDCE), trans-1,2-dichloroethene (transDCE), and vinyl chloride (VC) are expressed as ratios in the delta notation (δ13C) in per mil relative to the Vienna Peedee Belemnite international for carbon isotope analysis. Data are from Mejia and others (2025).
In treatment area GS1, the δ13C of TCE in the upgradient well was −25.5‰, which is within the range of pure-phase TCE and remained about the same in the next two wells downgradient from the injection well, GS1-MW4 and GS1-MW7 (fig. 32A). The δ13C of TCE increased to −20.1‰ in the next well along the flow path, GS1-MW10, indicating that biodegradation of TCE was outweighing the effect of residual TCE dissolution on the carbon isotope values. In addition, the δ13C of cisDCE, transDCE, and VC indicated that biodegradation was occurring, as each daughter compound was isotopically heavier in GS1-MW4, GS1-MW7, and GS1-MW10 compared to the upgradient well GS1-MW1 (fig. 32A). In contrast, the δ13C values of TCE and its daughter products in GS1-MW13 were similar to those in the upgradient well, supporting the conclusion reached from the cVOC and ethene composition that the injected amendments had not reached this well nor enhanced biodegradation (fig. 26). Trends in the δ13C values in the groundwater of the GS3 treatment area were similar to those in area GS1. The δ13C of TCE, cisDCE, and VC were higher (isotopically heavier) in the downgradient wells GS3-MW3 and GS3-MW4 than in the upgradient well GS3-MW1, showing that biodegradation occurred (fig. 32B). Further downgradient in GS3-MW10, the δ13C of TCE and its daughter products were similar as those in the upgradient well GS3-MW1, indicating that the enhanced biodegradation with the injected amendments did not reach this well as of the Q4 event.
Field Biodegradation Rates of Chlorinated Volatile Organic Compounds
First-order biodegradation rates were calculated using DCE concentrations over time in one well in treatment area GS1 and two wells in GS3, each downgradient from the injection well (table 14). In area GS1, the GS1-MW10 that was selected for rate calculations may have been affected by dissolution and degradation of residual TCE sources in the soil, causing the initial high production of DCE (fig. 29B). However, CSIA results indicated that TCE and DCE in GS1-MW10 were less affected by residual DNAPL sources than GS1-MW4 or GS1-MW7 along this flow path (fig. 32). Ongoing DCE production from residual source that could not be accounted for in the rate calculations would result in the DCE degradation rate to appear lower than the actual rate. Ethene production rates were also calculated to provide an estimate of the anaerobic VC degradation rate. Molar VC concentrations were often lower than ethene concentrations and did not always decrease as ethene increased. DCE degradation resulted in half-lives of 36.9–75.3 days in the three wells, showing fairly consistent degradation rates in treatment areas GS1 and GS3. Ethene production resulted in half-lives of 9.48–38.5 days, indicating that VC degradation was more rapid than DCE degradation. The ethene production rates provide the best measurement of the rate of complete biodegradation of the TCE and DCE, although ethene biodegradation and abiotic losses, such as volatilization, could result in underestimated rates. Notably, the ethene production rates calculated from the field tests in areas GS1 and GS3 (table 14) were similar to the first-order rates of total organic chlorine removal calculated from WBC-2-bioaugmented microcosms with site soil amended with either lactate or VO as donors—rate constants of 0.061 and 0.047 per day, corresponding to half-lives of 11–15 days (fig. 16). Ethene can biodegrade under anaerobic conditions to ethane, carbon dioxide, and methane. Ethane was detected infrequently in the groundwater during the pilot bioremediation test (Mejia and others, 2025). Although methane was commonly detected, it can be produced through multiple metabolic processes in addition to ethene biodegradation.
Table 14.
First-order degradation or production rate constants determined from the bioremediation pilot test at Site K, former Twin Cities Army Ammunition Plant, Arden Hills, Minnesota, October 2021–October 2022.[Degradation rates are shown for the sum of cis-1,2-dichloroethene, trans-1,2-dichloroethene, and 1,1-dichloroethene (Sum DCE), and production rates are shown for ethene to represent vinyl chloride degradation rates for the time periods indicated in days from donor injection. R2, coefficient of determination]
Microbial Community Changes with Enhanced Biodegradation
The relative abundances of potentially dechlorinating genera, along with those frequently occurring in reductively dehalogenating co-cultures, were examined in the microbial communities from groundwater samples collected during the bioremediation pilot test (figs. 33, 34, 35). These genera are defined as those previously reported as dechlorinating or being linked to the degradation of chlorinated organic compounds (table 15). It should be noted that only select wells close to the injection wells were sampled during the biostimulation and post-bioaugmentation sampling events; microbial data are lacking for other sampling events, either because of dry wells or difficulties obtaining the large sample volumes needed for filtering, or because fewer than 10,000 sequences were obtained, indicative of a quality control failure for that sample.
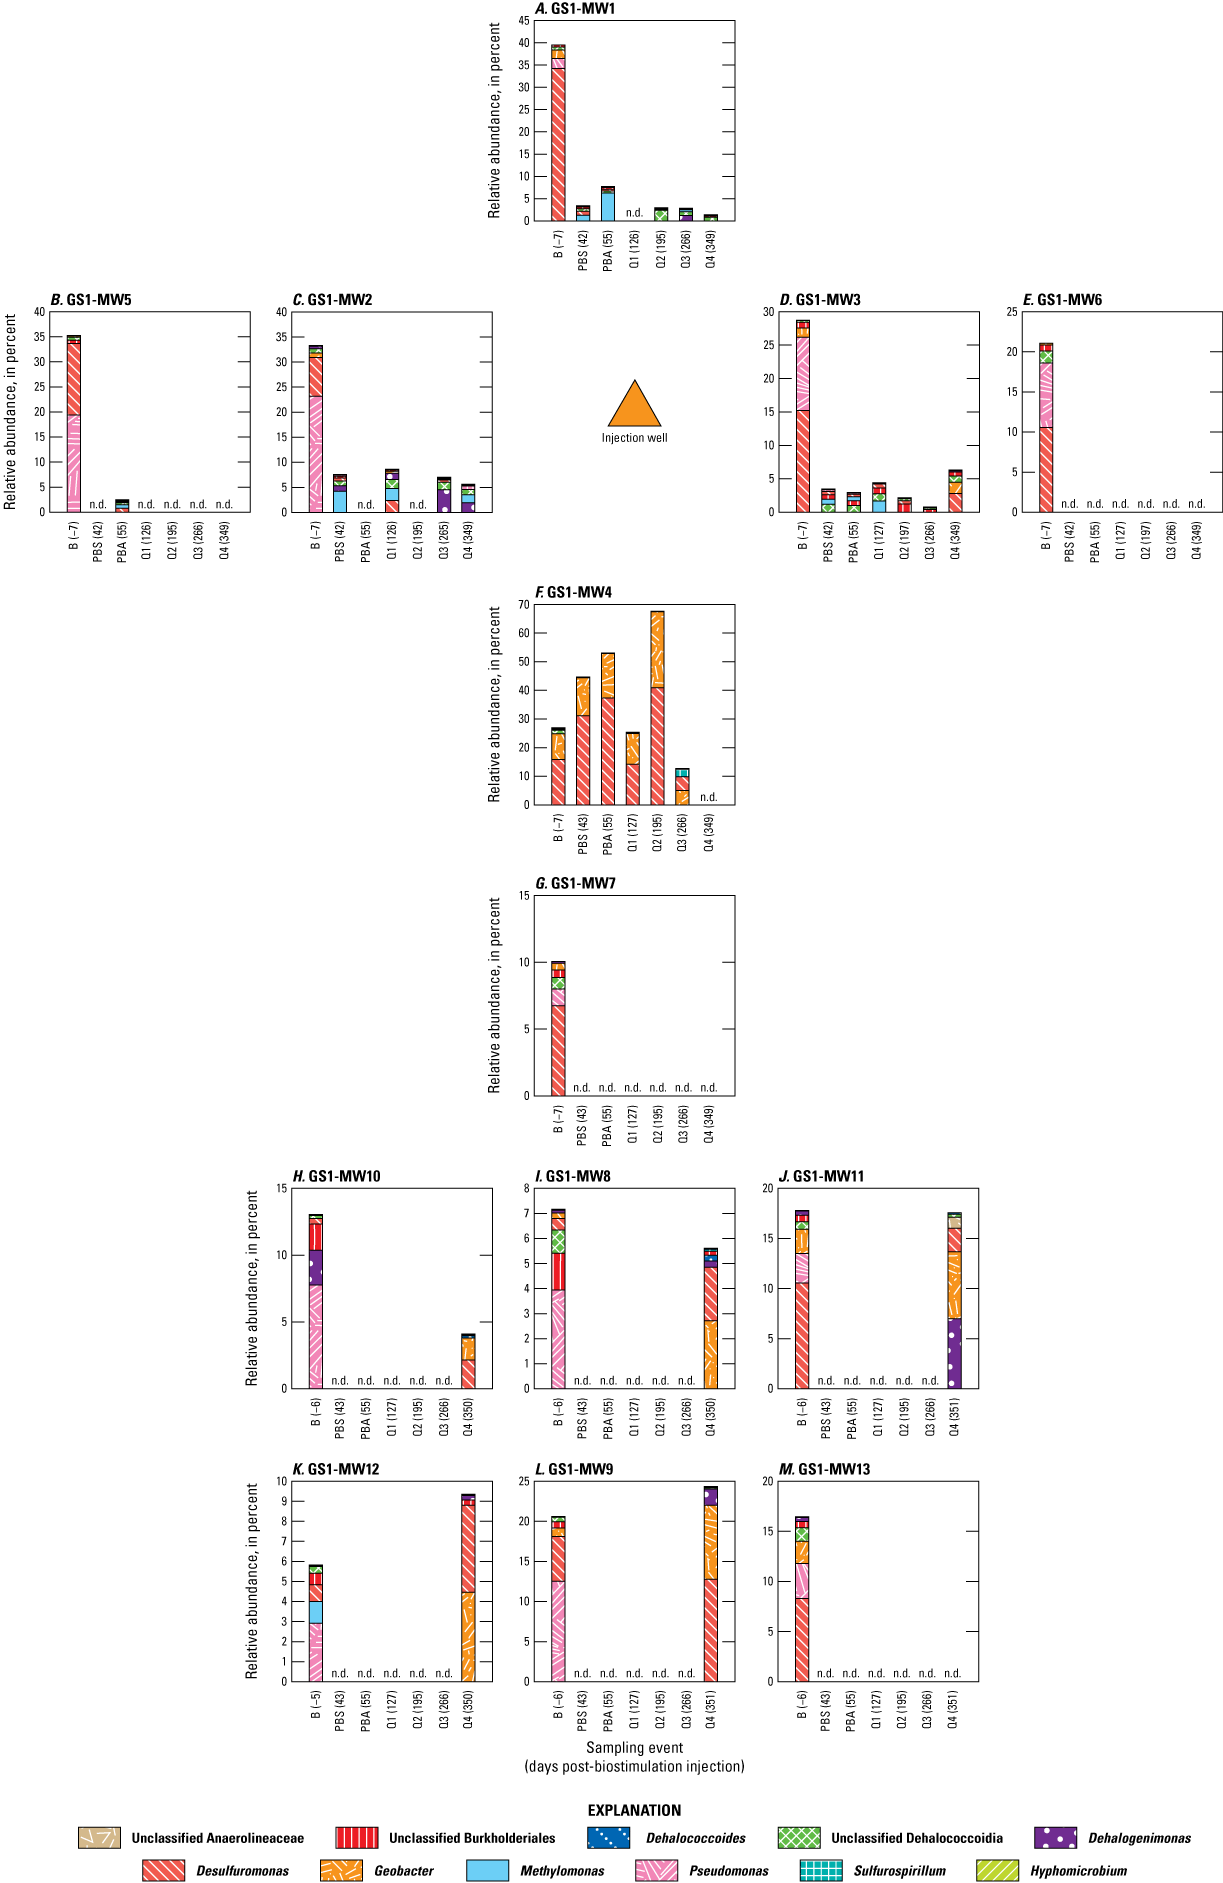
Bar graphs showing the relative abundances of potential dechlorinating genera in the GS1 test plot at Site K, former Twin Cities Amery Ammunition Plant, Arden Hills, Minnesota, October 2021–22. Data are from Mejia and others (2025). [B, baseline; n.d., no data; PBS, post-biostimulation; PBA, post-bioaugmentation; Q1, first quarter (February 2022); Q2, second quarter (May 2022); Q3, third quarter (July 2022); Q4, fourth quarter (October 2022)]
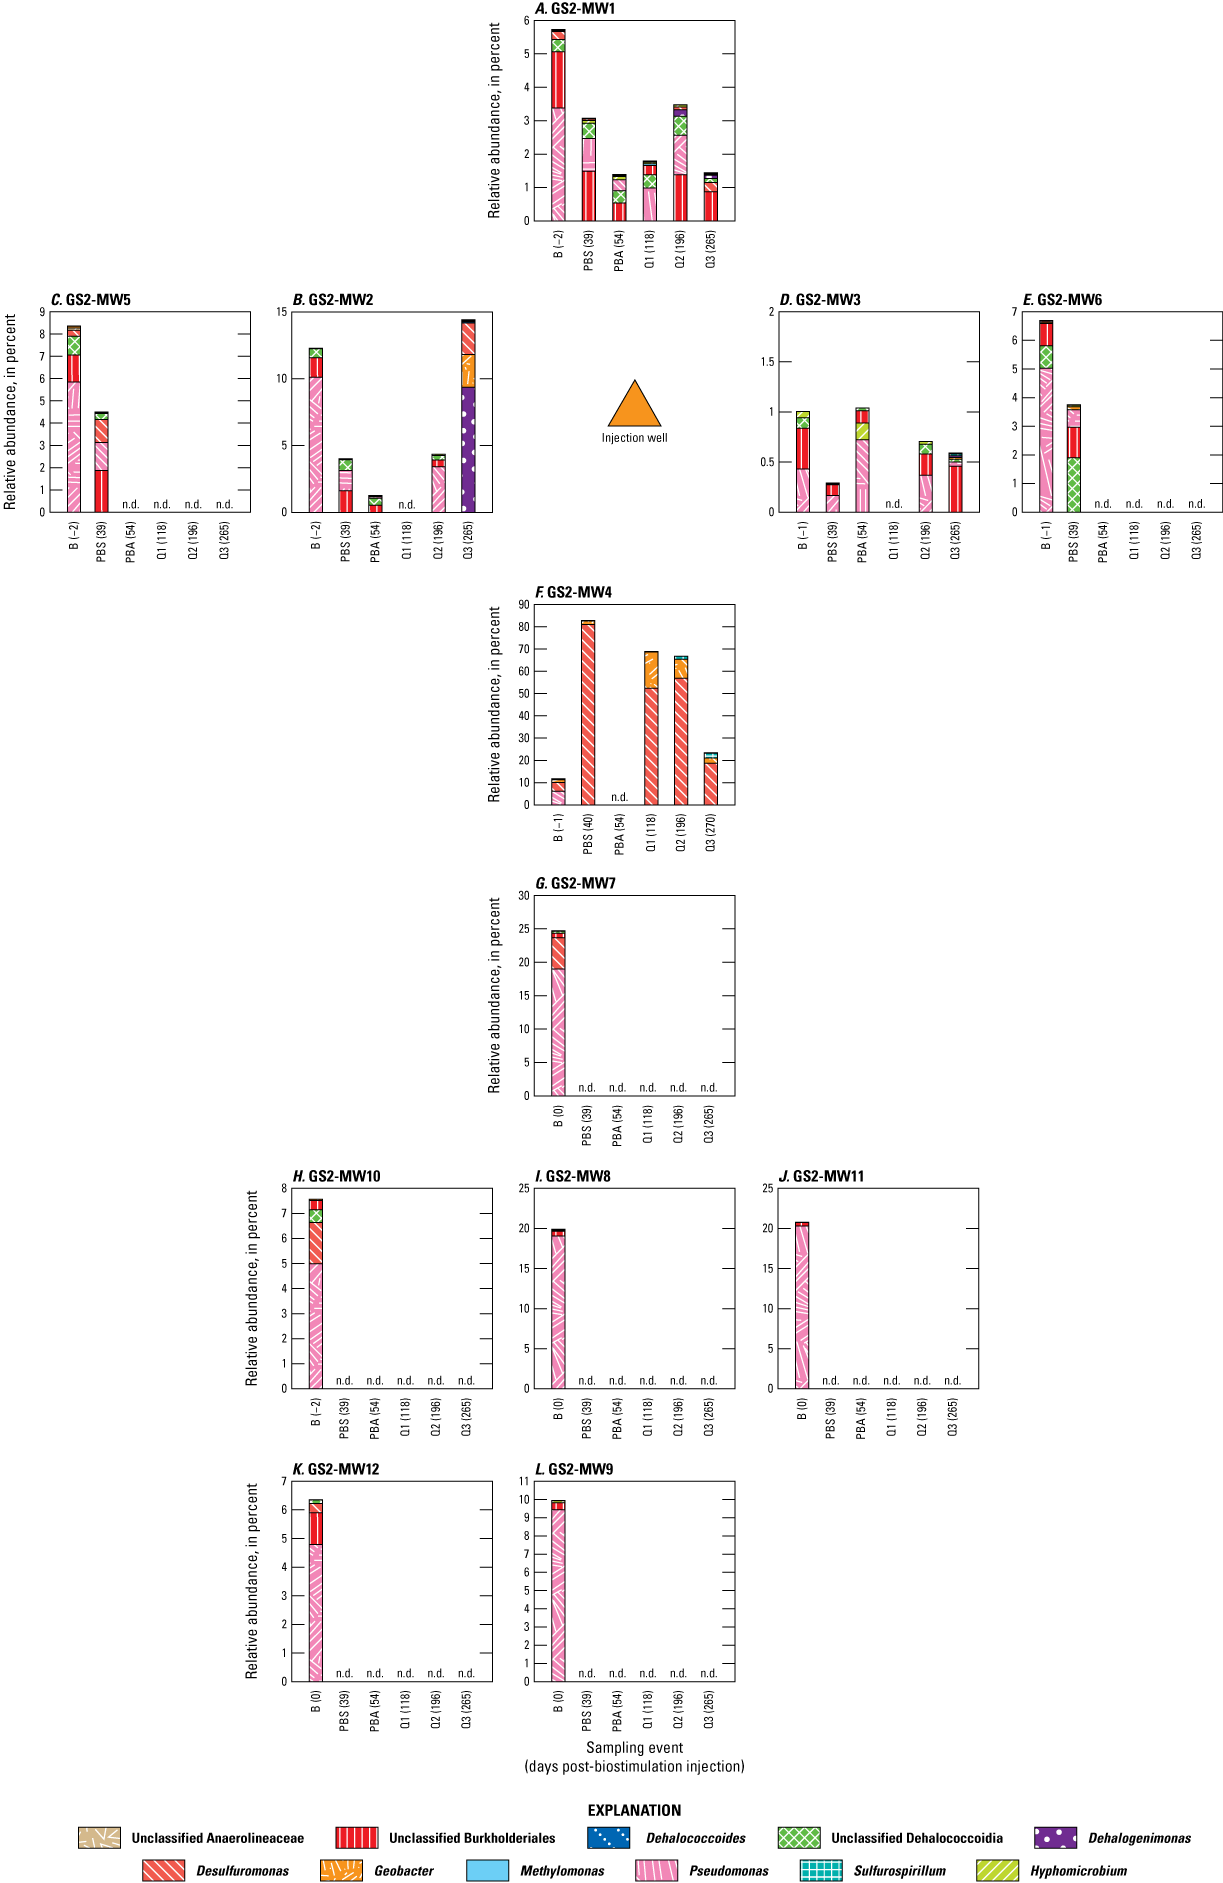
Bar graphs showing the relative abundances of potential dechlorinating genera in the GS2 test plot at Site K, former Twin Cities Amery Ammunition Plant, Arden Hills, Minnesota, October 2021–22. Data are from Mejia and others (2025). GS2-MW13 is intentionally excluded from the figure. [B, baseline; n.d., no data; PBS, post-biostimulation; PBA, post-bioaugmentation; Q1, first quarter (February 2022); Q2, second quarter (May 2022); Q3, third quarter (July 2022); Q4, fourth quarter (October 2022)]
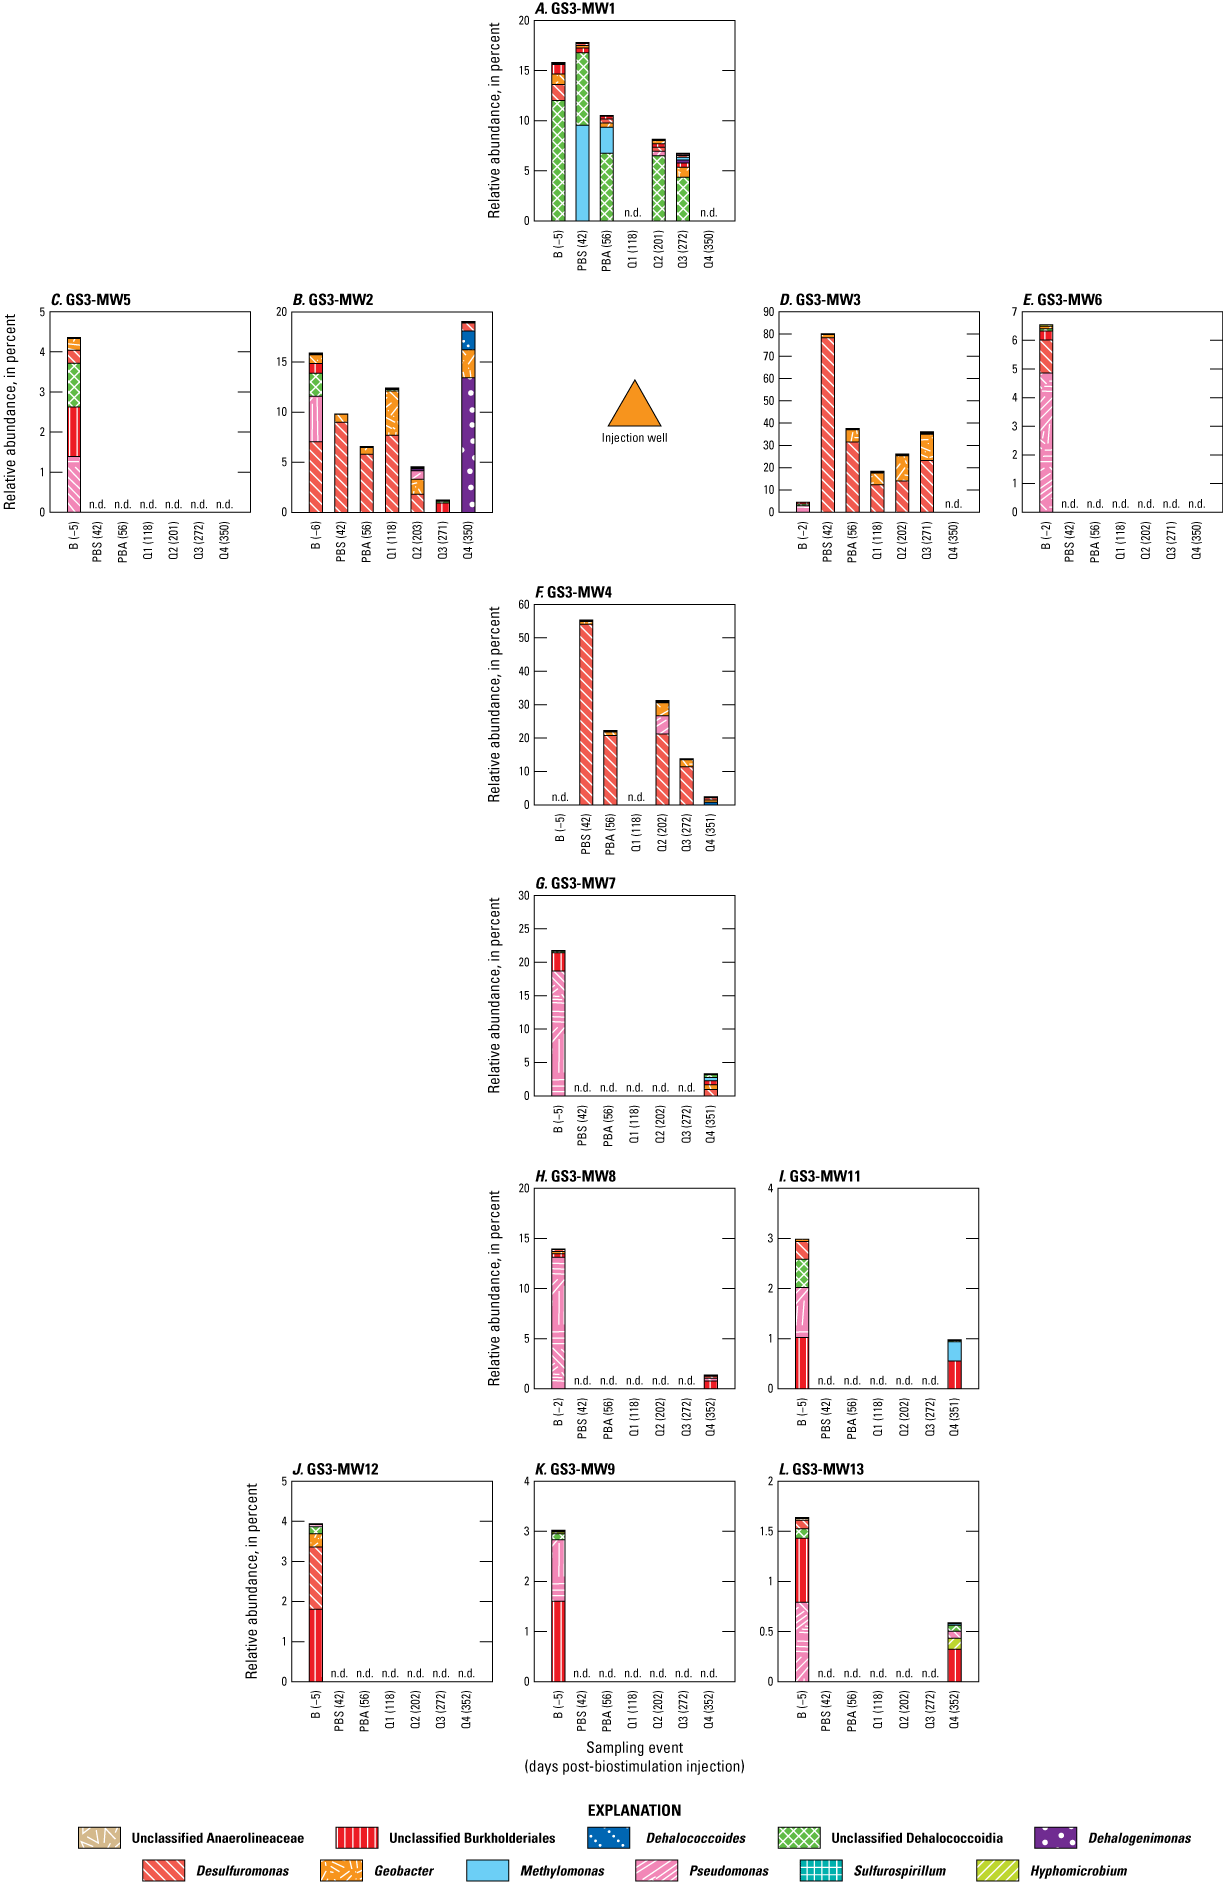
Bar graphs showing the relative abundances of potential dechlorinating genera in the GS3 test plot at Site K, former Twin Cities Amery Ammunition Plant, Arden Hills, Minnesota, October 2021–22. Data are from Mejia and others (2025). GS3-MW10 is intentionally excluded from the figure. [B, baseline; n.d., no data; PBS, post-biostimulation; PBA, post-bioaugmentation; Q1, first quarter (February 2022); Q2, second quarter (May 2022); Q3, third quarter (July 2022); Q4, fourth quarter (October 2022)]
Table 15.
Genera reported in the literature as dechlorinating or linked to the degradation of chlorinated organic compounds.Briefly, the potential dechlorinating genera varied among the treatment plots and the monitoring wells within the plots under the conditions present prior to biostimulation and bioaugmentation as well as after the injections. However, the composition of the potential dechlorinating genera in wells immediately downgradient from the injection wells (GS1-MW4, GS2-MW4, and GS3-MW4) consistently shifted to communities predominantly composed of Desulfuromonas and Geobacter after the donor amendment reached the wells. The effect of WBC-2 bioaugmentation was also apparent; increases in the relative abundances of Dehalogenimonas and Dehalococcoides were observed coincident with the onset of ethene production in some wells. Notably, the relative abundance of dechlorinating genera known to produce ethene remained low, demonstrating the importance of geochemical analyses along with microbial community analyses as indicators of bioremediation performance. The changes in microbial community structure over the course of the first year of the pilot study are detailed in the following paragraphs.
In the upgradient well GS1-MW1, potentially dechlorinating genera comprised 39.7 percent of the microbial community prior to biostimulation; of this, 34.4 percent of the sequences recovered were classified within the Desulfuromonas genus, 2.1 percent as Pseudomonas, and 1.9 percent as Geobacter (fig. 33). The electron donor arrived at GS1-MW1 within 6 days of the biostimulation injection, as evidenced by TOC measurements, but TOC levels decreased to background by day 42 and remained low throughout the monitoring year (fig. 31). The short-lived TOC increase, however, appeared to have a dramatic effect on community structure. Sampling of GS1-MW1 approximately 40 days after biostimulation indicated that potentially dechlorinating genera decreased to 3.5 percent of the sequences recovered. The methanotrophic genus Methylomonas (Findlay and others, 2016) comprised 1.2 percent of the recovered sequences, while Desulfuromonas and unclassified Dehalococcoidia comprised an additional 1.0 and 0.6 percent, respectively. The presence of an aerobic, potentially TCE-degrading methanotroph such as Methylomonas in the same sample as strict anaerobes (Desulfuromonas and Dehalococcoides) suggests the potential for redox zonation at the water table-vadose zone interface and the cooccurrence of aerobic and anaerobic cVOC degradation pathways. A generally similar profile was observed during the post-bioaugmentation sampling. Potentially dechlorinating genera comprised 7.7 percent of the sequences recovered; of these, Methylomonas comprised 6.2 percent of the total sequences recovered, and Desulfuromonas and unclassified Dehalococcoidia contributed an additional 0.5 and 0.4 percent. During the Q2 event, potential dechlorinating genera comprised 3 percent of the recovered sequence; of these, unclassified Dehalococcoidia comprised 2.4 percent of the recovered sequences. During the Q3 event, potential dechlorinating genera comprised 2.7 percent of the recovered sequences, of which 1.1 percent was classified as Dehalogenimonas and 0.7 percent was classified as unclassified members of the Dehalococcoidia. Potential dechlorinating genera comprised 1.4 percent of the recovered sequences during the Q4 event, of which unclassified members of the Dehalococcoidia comprised 0.8 percent. Sequencing results from the Q1 event for this well did not pass quality control. The effect of the early TOC peak on the microbial community in GS1-MW1 did not seem to enhance production of TCE daughter products (fig. 31) compared to wells downgradient from the injection well, where elevated TOC-NVDOC concentrations occurred later (after bioaugmentation) and were sustained longer than in GS1-MW1 (fig. 30).
Broadly similar results were observed elsewhere in test plot GS1 in the wells downgradient from the injection well and perpendicular to groundwater flow (GS1-MW5, GS1-MW2, GS1-MW3, and GS1-MW6; fig. 5). Wells GS1-MW2 and GS1-MW5 contained a similar proportion of potential dechlorinating genera (33.2 and 35.3 percent, respectively) during the baseline sampling, and Pseudomonas and Desulfuromonas were the predominant genera (fig. 33). Similar to the observations from upgradient well GS1-MW1, the relative abundance of sequences associated with potential dechlorinating genera dropped during the immediate post-bioaugmentation sampling. During the post-biostimulation sampling event in GS1-MW2, potential dechlorinating genera comprised 7.4 percent of the recovered sequences, of which Methylomonas comprised 3.8 percent, and Dechloromonas and unclassified Dehalococcoidia each comprised 1.1 percent. Potential dechlorinating genera comprised a slightly larger proportion of the recovered sequences (8.5 percent) during the Q1 event, during which the relative abundances of Desulfuromonas and unclassified Dehalococcoidia increased 2.4 percent each relative to the post-biostimulation sampling event. Although the overall proportion of potential dechlorinating genera in GS1-MW2 decreased slightly during the Q3 event to 6.9 percent, the distribution of the community shifted: Dehalogenimonas comprised 4.4 percent of the sequences, and unclassified Dehalococcoidia comprised 1.4 percent. Notably, Dehalogenimonas was not observed to have a relative abundance greater than 1 percent prior to this sampling event, suggesting the arrival of members of the WBC-2 consortium from the bioaugmentation injection. The increase in Dehalogenimonas in GS1-MW2 during the Q3 event coincides with decreasing cVOC concentrations and increasing production of ethene, indicating enhanced reductive dechlorination (fig. 30). The proportion of Dehalogenimonas in GS1-MW2 remained above 1 percent as ethene concentrations continued to increase by the Q4 sampling event (figs. 30, 33).
To the south of the GS1 injection well, the microbial community structure of GS1-MW3 followed similar trends to GS1-MW2. During the baseline sampling, potential dechlorinating genera comprised 28.9 percent of the recovered sequences, and Desulfuromonas and Pseudomonas were predominant (15.2 and 11 percent, respectively). As seen in the other GS1 wells, the relative abundance of potential dechlorinating genera decreased in GS1-MW3 during the post-biostimulation event, and such genera comprised 3.7 percent of the total sequences recovered. During the post-biostimulation event, only unclassified Dehalococcoidia comprised more than 1 percent of the sequences recovered (1.3 percent). Little change was observed between the pre- and post-bioaugmentation sampling. By the Q1 event, however, potential dechlorinating genera in GS1-MW3 comprised a larger proportion of the recovered sequences (4.3 percent): Methylomonas comprised 1.7 percent of the total sequences recovered, and unclassified Dehalococcoidia comprised 1 percent. The relative abundance of dechlorinating genera then decreased during the Q2 and Q3 sampling events before a notable shift in the community composition was observed during the Q4 event (fig. 33), coinciding with the first detections of ethene in this well (fig. 26). Potential dechlorinating genera comprised 6.3 percent of the recovered sequences during the Q4 event in GS1-MW3. The distribution of these sequences was notably different from that in the earlier time points: Desulfuromonas comprised 2.8 percent, Geobacter comprised 1.6 percent, and unclassified Dehalococcoidia comprised 0.9 percent of the recovered sequences. The decline in Desulfuromonas and Geobacter may be linked to the establishment of the highly reducing conditions required for the dechlorination of VC to ethene.
The well immediately downgradient from the injection well, GS1-MW4, had distinct shifts in microbial community composition following amendment injection. During the baseline sampling, potentially dechlorinating genera comprised 26.8 percent of the recovered sequences. Desulfurobacter and Geobacter comprised the majority of these sequences, 15.6 and 9 percent, respectively, and unclassified Dehalococcoidia accounted for an additional 1.3 percent. In contrast to the decrease in the relative abundance of dehalogenating genera observed in the other GS1 wells following the baseline sampling, the proportion of these genera increased following biostimulation to 48.5 percent of the total sequences recovered. The relative abundance of Desulfuromonas increased to 31 percent of the recovered sequences, Geobacter increased to 13 percent of the recovered sequences, and the proportion of unclassified Dehalococcoidia remained stable at 1.3 percent. The proportion of potential dechlorinating genera increased to 53.1 percent of the recovered sequences following bioaugmentation; Desulfuromonas accounted for 37 percent and Geobacter accounted for 15 percent of the recovered sequences, and unclassified Dehalococcoidia represented less than 0.5 percent of the recovered sequences. During the Q1 event, the relative abundance of potentially dechlorinating genera decreased to 25.9 percent of the recovered sequences with 14 percent of these belonging to Desulfuromonas and 11 percent to Geobacter. As shown in figure 24, VFA concentrations peaked and DCE production increased during the Q1 event, suggesting that microbial dechlorination was supported by fermentation of the injected carbon sources. The relative abundance of both Desulfuromonas and Geobacter increased dramatically by the Q2 event, to 41 and 26 percent of the recovered sequences, respectively. No other genera were observed to have a relative abundance above 0.5 percent. Desulfuromonas and Geobacter have been shown to couple acetate oxidation to the dechlorination of TCE to DCE (Sung and others, 2003, 2006), and the high concentration of DCE seen during the Q2 event suggests that this may have been the dominant process occurring at this point. The relative abundance of potential dechlorinating genera decreased sharply during the Q3 event, and Geobacter and Desulfuromonas also decreased, comprising 4.9 and 4.7 percent of the recovered sequences, respectively. The production of VC and ethene began between the Q2 and Q3 events, in tandem with the onset of methanogenesis and an increase in the relative proportion of sequences representing unclassified Dehalococcoidia to 0.1 percent of the recovered sequences. However, the sequencing results for the Q4 sampling event did not pass quality control. Microbial community data also were not available for GS1-MW7, immediately downgradient from GS1-MW4, after the baseline sampling.
In the last two rows of monitoring wells in test plot GS1, microbial community data are only available for the baseline and Q4 sampling events (fig. 33). Of the wells in these last rows, GS1-MW10 and GS1-MW12 showed the greatest evidence of enhanced biodegradation, beginning during the Q3 and Q4 sampling events (figs. 26, 29). Well GS1-MW8, which lies directly downgradient from GS1-MW7, also showed evidence of enhanced dechlorination by the Q4 event, when ethene was first detected at a low concentration compared to GS1-MW10 and GS1-MW12 (fig. 26). During the baseline sampling, potential dechlorinating genera comprised 7 percent of the sequences recovered in GS1-MW8, of which Pseudomonas, unclassified Burkholderiales, and unclassified Dehalococcoidia comprising 4.1, 1.2, and 0.8 percent, respectively. The potential dechlorinating genera in GS1-MW8 had shifted by the Q4 event, when enhanced reductive dechlorination of the cVOCs was evident; Geobacter and Desulfuromonas were predominant, accounting for 2.7 and 2.2 percent of the recovered sequences, respectively, and Dehalogenimonas and Dehalococcoides accounted for an additional 0.2 percent each (fig. 33).
Similarly, in GS1-MW10, the potentially dechlorinating community had shifted by the Q4 event to predominantly Geobacter and Desulfuromonas (2.2 and 1.5 percent of the recovered sequences, respectively) and relatively low abundance of Dehalococcoides and Dehalogenimonas (0.2 and 0.06 percent, respectively; fig. 33). Despite these relatively low abundances of potential dechlorinating genera, enhanced biodegradation of TCE to ethene was observed in GS1-MW10 by the Q4 event and indicated an important role for the relatively small proportion of dechlorinating genera. Further downgradient in GS1-MW12, potentially dechlorinating genera comprised 4.9 percent of the recovered sequences in the baseline sampling: Pseudomonas comprised 2.9 percent; Methylomonas, 1.1 percent; and Desulfuromonas, 0.9 percent. During the Q4 sampling of this well, the community shifted so that Geobacter and Desulfuromonas were predominant (4.5 and 4.3 percent of the recovered sequences, respectively) as observed in wells GS1-MW8 and GS1-MW10 (fig. 33). Despite the low relative abundance of Dehalococcoides (<0.1 percent) in GS1-MW12, dechlorination of cVOCs to ethene was first observed by the Q4 event, suggesting a role for other dehalogenating genera capable of the final dechlorination step. Dehalogenimonas species are known to be able to dechlorinate cVOCs to ethene (Moe and others, 2009) and were found at a relatively low abundance of 0.3 percent.
During the baseline sampling of the upgradient well GS2-MW1 in plot GS2, potential dechlorinating taxa comprised 5.9 percent of the sequences recovered, the majority of which were Pseudomonas and unclassified Burkholderiales (3.6 and 1.8 percent, respectively). Unclassified Dehalococcoidia comprised an additional 0.3 percent of the recovered sequences. The community structure was relatively stable throughout the pre- and post-bioaugmentation sampling and the Q3 sampling event. Potentially dechlorinating genera comprised an average of 2.8 percent of the recovered sequences. In contrast to the changes seen across the downgradient wells in plot GS1, microbial community changes in plot GS2 were greatest in GS2-MW4 (fig. 34), which was consistent with elevated TOC and dissolved organic carbon concentrations (fig. 23B) and changes in cVOCs also most evident in GS2-MW4 (fig. 27). During the baseline sampling, the most abundant potential dechlorinating genera in GS2-MW4 included Pseudomonas (6.2 percent), Desulfuromonas (3.7 percent), and Geobacter (1.3 percent). During the pre-bioaugmentation sampling, approximately 39 days after biostimulation, Desulfuromonas was observed to be the dominant genus in the microbial community, comprising 81 percent of the sequences recovered, and Geobacter comprised an additional 1.4 percent. The community structure shifted during the Q1 event; Desulfuromonas decreased to 52 percent of the recovered sequences, and Geobacter increased to 15 percent, concurrent with an increase in iron reduction (fig. 24B). The community was stable during the Q2 event: Desulfuromonas and Geobacter comprised 56 percent and 8.6 percent of the recovered sequences, respectively, and Sulfurospirillum comprised an additional 1.3 percent. During the Q3 event, the relative abundance of Desulfuromonas decreased to 19 percent, while that of Geobacter decreased to 2.3 percent, indicating a community response to the arrival of the amendment (fig. 23). The relative abundance of Sulfurospirillum remained stable at 1.8 percent of the recovered sequences.
Compared to GS2-MW4, potentially dechlorinating genera comprised a small portion of the microbial community in the wells parallel to the injection well in plot GS2, including GS2-MW5, GS2-MW2, GS2-MW3, and GS2-MW6 (fig. 34). Only baseline and pre-bioaugmentation samples were available for GS2-MW5 and GS2-MW6, and Pseudomonas was the predominant dechlorinating genus in both wells (5.8 and 4.8 percent of the total sequences recovered, respectively). During the post-biostimulation sampling, unclassified Dehalococcoidia represented 1.8 percent of the total sequences recovered in GS2-MW6; no other potentially dechlorinating genera were found to have a relative abundance greater than 1 percent of the recovered sequences.
Markedly different baseline communities were observed in wells GS2-MW2 and GS2-MW3, immediately adjacent to the injection well. Potentially dechlorinating genera comprised 12.3 percent of the recovered sequences from GS2-MW2 and 1.1 percent of those in GS2-MW3 during the baseline sampling. Potential dechlorinating genera never comprised more than 2 percent of the sequences recovered from GS2-MW3 throughout the Q1, Q2, and Q3 events. In contrast, the relative abundance of potential dechlorinating genera in GS2-MW2 remained below 5 percent of the total sequences recovered until the Q3 event, when the relative abundances of Dehalogenimonas reached 9.1 percent; Geobacter, 2.4 percent; and Desulfuromonas, 2.2 percent. The sudden increase in Dehalogenimonas in GS2-MW2 suggests the arrival of the WBC-2 culture from the bioaugmentation injection, although cVOC concentrations remained approximately the same during the Q2 and Q3 events (fig. 27).
Site GS3 is located further downgradient from test plots GS1 and GS2 (fig. 5) and has a distinct cVOC composition dominated by DCE during the baseline sampling (fig. 28). The microbial community composition at the upgradient well GS3-MW1 also was distinct in comparison to the other plots during the baseline sampling event (figs. 33, 34, 35). Unclassified Dehalococcoidia comprised 11.7 percent of the recovered sequences from GS3-MW1, but there were smaller contributions from Desulfuromonas and Geobacter, 1.6 and 1 percent, respectively. During the post-bioaugmentation sampling, unclassified Dehalococcoidia comprised 7 percent of the dechlorinating genera and remained the most abundant potential dechlorinating genus during the Q2 and Q3 sampling events (fig. 35).
Changes in cVOC composition and ethene production indicated enhanced reductive dechlorination in wells GS3-MW2 and GS3-MW3 adjacent to the injection well and wells GS3-MW4 and GS3-MW7 immediately downgradient from the injection well; these changes were evident by the Q2 sampling event in GS3-MW3 and Q3 in the other wells (figs. 28, 30). The effects of biostimulation on the microbial community were pronounced at GS3-MW3 (fig. 35). Potential dechlorinating genera were a small portion of the microbial community during the baseline sampling: Pseudomonas comprised 3.1 percent of the recovered sequences, but no other observed dechlorinating genera had a relative abundance exceeding 1 percent. Coinciding with the arrival of the donor amendment that was observed during the post-biostimulation sampling event (fig. 23C), the community composition in GS3-MW3 was dominated by Desulfuromonas, which had a relative abundance of 78.3 percent of the recovered sequences. A small additional contribution came from Geobacter, which had a relative abundance of 1.6 percent of the recovered sequences. The relative abundance of Geobacter increased to 11.2 percent by the Q2 sampling event, while that of Desulfuromonas decreased to 14.3 percent. The relative abundance of Dehalococcoides and Dehalogenimonas remained low (0.4 percent for each genus) in GS3-MW3 during the Q2 and Q3 sampling events, although dechlorination of DCE and VC to ethene and a decrease in total cVOC was observed by Q2 (figs. 28, 35).
In contrast to GS-MW3, the relative abundance of Dehalococcoides and Dehalogenimonas in GS3-MW2 showed a more prominent shift, although not until the Q4 event when data were not available for GS-MW3 (fig. 35). During the Q3 sampling event, no potential dehalogenators in GS3-MW2 exceeded a relative abundance of 1 percent. However, Dehalogenimonas, Geobacter, and Dehalococcoides comprised 13, 2.9, and 1.8 percent of the recovered sequences, respectively, in GS3-MW2 during the Q4 event. This shift in community structure, along with a shift to a VOC composition dominated by VC and ethene, indicates the arrival of organisms from the WBC-2 bioaugmentation.
In GS3-MW4 downgradient from the injection well, the composition of the potentially dehalogenating community immediately after bioaugmentation was generally similar to the community observed in GS3-MW3: Desulfuromonas represented 54 percent of the recovered sequences, and Geobacter comprised an additional 0.9 percent (fig. 35). By the Q3 event, the relative abundance of Desulfuromonas had decreased to 11.3 percent of the recovered sequences, and Geobacter had increased to 2 percent. The composition of the microbial community in GS3-MW4 was greatly different during the Q4 event, possibly because of electron donor depletion (fig. 30); no potentially dechlorinating genera had a relative abundance exceeding 1 percent, although Dehalococcoides comprised 0.7 percent of the recovered sequences, and Geobacter, 0.6 percent; and Desulfuromonas, 0.6 percent. Despite the low abundance of known dechlorinating genera, ethene concentrations continued to increase through the Q4 sampling event and the last monthly sampling event (fig. 30). Similarly, in GS3-MW7 downgradient from GS3-MW4, ethene was a substantial component of the VOC composition during the Q3 and Q4 sampling events (figs. 28, 30), and the proportion of the microbial community comprised of potential dehalogenating genera was relatively low (3.4 percent) by the Q4 sampling event (fig. 35). Dehalococcoidia and Dehalogenimonas comprised only a small portion of the community (0.5 and 0.05 percent, respectively) in GS3-MW7 by the Q4 event.
To summarize, the potential dechlorinating genera present in the aquifer under baseline conditions and in the upgradient monitoring wells varied among the three treatment plots (figs. 33, 34, 35). In contrast, the composition of the dechlorinating genera in wells immediately downgradient from the injection wells (GS1-MW4, GS2-MW4, and GS3-MW4) in each test plot consistently shifted to predominance of Desulfuromonas and Geobacter after the donor amendment had reached the wells. Distinct increases in the relative abundance of Dehalogenimonas and Dehalococcoides also were coincident with the onset of ethene production in some wells, indicating the WBC-2 bioaugmentation’s effect on the organisms. These patterns are supportive of the successful bioremediation performance at the site. The detected abundances of these dechlorinating genera that are known to enable ethene production were often relatively low; thus, the microbial community analyses did not indicate bioremediation performance at this site as strongly as the geochemical data, including the cVOCs, ethene, and stable carbon isotope data. Partly, the microbial community data were limited by missing data for some key points, spatially or temporally. The method of microbial sample collection by filtration of the well water samples may also have been a factor in the relatively low abundances of dechlorinating genera that were measured as the distribution of free-living versus soil-bound dechlorinators is not well understood. A passive method of sample collection in the wells or collection of soil cores could improve microbial community analysis. Furthermore, we anticipate that improvements in DNA extraction and sequencing technology will improve the rate of success for low-biomass samples.
Implications for Full-Scale Remedy
The biogeochemical data collected during the pilot tests in the three treatment plots showed that enhanced, complete reductive dechlorination of the cVOCs in the groundwater was achieved at monitoring wells where the injected amendments reached. The spread of the amendments over the 1-year monitoring period was greatest in treatment plots GS1 and GS3, and the molar concentration of VOCs was dominated by ethene in some wells in each of these plots by the end of the monitoring period (figs. 29, 30). In the GS3 plot, concentrations of all cVOCs decreased to below detection levels at one well (GS3-MW3) in the last several sampling events, and concentrations of TCE were below detection in several wells (fig. 30). Continued elevated ethene concentrations indicated sustained complete reductive dechlorination even as TOC and NVDOC concentrations declined below 20 mg/L, such as in GS3-MW4 (fig. 30). In the GS1 plot, which lies in the TCE source area, a similar decrease in TCE concentrations to near or below detection was observed as in the GS3 plot, even though baseline TCE concentrations were more than a factor of 10 higher in the groundwater in the GS1 plot than in GS3. As expected from the initial pre-design site data and the laboratory experiments, dissolution or desorption of residual TCE DNAPL occurred and was coupled with biodegradation where the injected amendments reached the GS1 area. Enhanced dissolution of residual DNAPL coupled to biodegradation was evident by the marked increase in DCE above the initial baseline or upgradient TCE and DCE concentrations. Where such elevated DCE concentrations occurred, DCE concentrations subsequently declined but were still high relative to cleanup goals at the end of the monitoring period. However, the period of decreasing DCE and VC concentrations and dominance of ethene production did indicate that overall biodegradation rates were stimulated to outpace the DNAPL dissolution/desorption and DCE production. Thus, the residual DNAPL mass in the aquifer and top of the lower aquitard could be reduced by biodegradation.
This success in complete degradation to predominantly ethene was achieved even in areas where the DCE concentrations reached a maximum concentration of about 300 µmol/L, or 30,000 µg/L (fig. 29). As determined from the field pilot test, DCE degradation and ethene production rates were faster in the GS1 area where initial cVOC concentrations were highest compared to the GS2 and GS3 treatment areas, indicating that the high concentrations in the source area did not inhibit reductive dechlorination (table 14). The rapid biodegradation shown by half-lives of 10–75 days is promising for a full-scale remedy (table 14). Ultimately, however, the mass of residual or sorbed TCE in the aquifer that remains accessible for dissolution and biodegradation would likely control the time required for a full-scale bioremediation effort to reduce dissolved cVOC concentrations below the 1997 Record of Decision’s performance goals. Placement of amendment injection points both in the source area and in the downgradient plume area close to the trench for a full-scale remedy could likely achieve mass reduction of the source TCE and lower cVOC concentrations below the performance goals at the downgradient edge of the Site K plume.
The field pilot tests showed that relatively flat hydraulic head gradients and temporal changes in groundwater flow directions in the shallow aquifer would add complexity to a full-scale bioremediation effort. The ROI determined for each test plot was relatively small, ranging from 20- to 30-ft centers in GS1 and GS2 in the source area and even lower in area GS3 near the trench. Results from test area GS2 were affected by greater soil heterogeneity, along with flat hydraulic head gradients. This test plot was partly in soil that had not been excavated, unlike test plot GS1, which was entirely in a previously excavated area and had fairly homogenous soil. Area GS2 wells went dry during periods of low recharge, limiting the movement of the injected amendments. The predicted predominant flow direction in GS2 from the pre-design site characterization also was not consistent with the actual flow directions during the pilot test and resulted in a configuration of the GS2 test plot that made it challenging to interpret the donor movement and determine the ROI. Thus, the calculation of ROI for the GS2 area has greater uncertainty, given the greater hydraulic variability. Additional focused hydrogeologic characterization in the nonexcavated portion of the site or addition injection points may be needed to provide a margin of safety with the flow directions in this area in a full-scale remedy.
Test plot GS3 also had relatively low hydraulic conductivity and more variable soil lithology compared to area GS1, resulting in a lower ROI and affecting the distribution of the injected amendments. The gravity feed used for amendment injection at GS3 may have promoted short-circuiting; using a lower pumping rate for injection in GS3 could be beneficial. For the design of a potential full-scale remedy in this downgradient plume area, an injection biobarrier near the trench spaced at 20-ft centers could be considered, given the relatively high soil heterogeneity and relatively low groundwater and soil cVOC concentrations.
The low temperatures following WBC-2 injection between November 30 and December 2, 2021 (fig. 25; table 4) in combination with the nearly flat hydraulic head gradients probably were major factors in the delay observed before onset of strongly reducing (methanogenic) conditions and ethene production showed that biodegradation was greatly enhanced (figs. 26, 27, 28, 29, 30). Additional test injections could be beneficial in optimizing the timing of donor and culture injections with the variable temperatures and hydraulic head in the shallow aquifer.
References Cited
Allen-King, R.M., Lorah, M., Goode, G., Imbrigiotta, T., Tiedeman, C., and Shapiro, A., 2021, Final report—A field method to quantify chlorinated solvent diffusion, sorption, abiotic and biotic degradation in low permeability zones: Strategic Environmental Research and Development Program Project ER-2533 Final Report, 95 p., accessed March 3, 2025, at https://serdp-estcp.mil/projects/details/6c9857ea-c201-465d-b2c0-cdbfaed6f4c6.
Azizian, M.F., Marshall, I.P., Behrens, S., Spormann, A.M., and Semprini, L., 2010, Comparison of lactate, formate, and propionate as hydrogen donors for the reductive dehalogenation of trichloroethene in a continuous-flow column: Journal of Contaminant Hydrology, v. 113, no. 1–4, p. 77–92, accessed March 3, 2025, at https://doi.org/10.1016/j.jconhyd.2010.02.004.
Battelle Memorial Institute, Cornell University, and Air Force Research Laboratory, 2002, Reductive anaerobic biological in situ treatment technology (RABITT) treatability testing: Environmental Security Technology Certification Program ER-199719, prepared by Battelle Memorial Institute, Cornell University, and Air Force Research Laboratory, 162 p. [Also available at https://sepub-prod-0001-124733793621-us-gov-west-1.s3.us-gov-west-1.amazonaws.com/s3fs-public/project_documents/CU-9719-FR-01.pdf?VersionId=tssSnNva.. AAI0SmsVnrrFrtLdkQOLJo.]
Borden, R.C., 2017, Post-remediation evaluation of EVO Treatment—How can we improve performance?: Environmental Security Technology Certification Program Final Report ER-201581, prepared by Solutions-IES, Inc., Raleigh, N.C., under contract no. W912Hq-15-C-0072, [variously paged, 157 p.]. [Also available at https://sepub-prod-0001-124733793621-us-gov-west-1.s3.us-gov-west-1.amazonaws.com/s3fs-public/project_documents/ER-201581_Final_Report.pdf.]
Bouwer, H. and Rice, R.C., 1976, A slug test method for determining hydraulic conductivity of unconfined aquifers with completely or partially penetrating wells: Water Resources Research, v. 12, no. 3, p. 423-428. [Also available at https://doi.org/10.1029/WR012i003p00423.]
Chen, G., Murdoch, F.K., Xie, Y., Murdoch, R.W., Cui, Y., Yang, Y., Yan, J., Key, T.A., and Löffler, F.E., 2022, Dehalogenation of chlorinated ethenes to ethene by a novel isolate, “Candidatus Dehalogenimonas etheniformans”: Applied and Environmental Microbiology, v. 88, no. 12, 14 p., accessed March 3, 2025, at https://doi.org/10.1128/aem.00443-22.
Chow, S.J., Lorah, M.M., Wadhawan, A.R., Durant, N.D., and Bouwer, E.J., 2020, Sequential biodegradation of 1,2,4-trichlorobenzene at oxic-anoxic groundwater interfaces in model laboratory columns: Journal of Contaminant Hydrology, v. 231, accessed March 3, 2025, at https://doi.org/10.1016/j.jconhyd.2020.103639.
Cunningham, W.L., and Schalk, C.W., 2011, Groundwater technical procedures of the U.S. Geological Survey: U.S. Geological Survey Techniques and Methods 1-A1, 151 p., accessed March 3, 2025, at https://doi.org/10.3133/tm1A1.
Drzyzga, O., and Gottschal, J.C., 2002, Tetrachloroethene dehalorespiration and growth of Desulfitobacterium frappieri TCE1 in strict dependence on the activity of Desulfovibrio fructosivorans: Applied and Environmental Microbiology, v. 68, no. 2, p. 642–649, accessed March 3, 2025, at https://doi.org/10.1128/AEM.68.2.642-649.2002.
Ferrey, M.L., Wilkin, R.T., Ford, R.C., and Wilson, J.T., 2004, Nonbiological removal of cis-dichloroethylene in aquifer sediment containing magnetite: Environmental Science & Technology, v. 38, no. 6, p. 1746–1752, accessed March 3, 2025, at https://doi.org/10.1021/es0305609.
Findlay, M., Smoler, D.F., Fogel, S., and Mattes, T.E., 2016, Aerobic vinyl chloride metabolism in groundwater microcosms by methanotrophic and etheneotrophic bacteria: Environmental Science & Technology, v. 50, no. 7, p. 3617–3625, accessed March 3, 2025, at https://doi.org/10.1021/acs.est.5b05798.
Golden Software, LLC, 2023, Surfer 26.1.216: Golden Software, LLC software release, accessed March 3, 2025, at https://support.goldensoftware.com/hc/en-us/categories/115000653807-Surfer.
Grostern, A., and Edwards, E., 2006, Growth of Dehalobacter and Dehalococcoides spp. during Degradation of Chlorinated Ethanes: Applied and Environmental Microbiology, v. 72, no. 1, p. 428–436, accessed March 3, 2025, at https://doi.org/10.1128/AEM.72.1.428-436.2006.
Hellal, J., Joulian, C., Urien, C., Ferreira, S., Denonfoux, J., Hermon, L., Vuilleumier, S., and Imfeld, G., 2021, Chlorinated ethene biodegradation and associated bacterial taxa in multi-polluted groundwater—Insights from biomolecular markers and stable isotope analysis: Science of the Total Environment, v. 763, accessed March 3, 2025, at https://doi.org/10.1016/j.scitotenv.2020.142950.
Henry, B., 2010, Loading rates and impacts of substrate delivery for enhanced anaerobic bioremediation: Environmental Security Technology Certification Program Project ER-0627, prepared by Parsons Infrastructure & Technology Group, Inc., Annapolis, Md., under contract no. W912HQ-06-C-044, [variously paged, 476 p.]. [Also available at https://cluin.org/download/contaminantfocus/dnapl/Treatment_Technologies/ER-0627-FR-1.pdf.]
Hunkeler, D., Meckenstock, R.U., Sherwood Lollar, B., Schmidt, T.C., Wilson, J.T., 2008, A guide for assessing biodegradation and source identification of organic ground water contaminants using compound specific isotope analysis (CSIA): U.S. Environmental Protection Agency EPA/600/R-08/148, 82 p., accessed November 4, 2024, at https://archive.epa.gov/ada/web/pdf/p1002vai.pdf.
Ismaeil, M., Yoshida, N., and Katayama, A., 2017, Identification of multiple dehalogenase genes involved in tetrachloroethene-to-ethene dechlorination in a Dehalococcoides-dominated enrichment culture: BioMed Research International, v. 2017, 12 p., accessed March 3, 2025, at https://doi.org/10.1155/2017/9191086.
Interstate Technology and Regulatory Council, 2020, Optimizing injection strategies and in situ remediation performance OIS-ISRP-1: Interstate Technology and Regulatory Council web page, accessed March 3, 2025, at http://ois-isrp-1.itrcweb.org.
Jones, E.J.P., Voytek, M.A., Lorah, M.M., and Kirshtein, J.D., 2006, Characterization of a microbial consortium capable of rapid and simultaneous dechlorination of 1,1,2,2-tetrachloroethane and chlorinated ethane and ethene intermediates: Bioremediation Journal, v. 10, no. 4, p. 153–168, accessed March 3, 2025, at https://doi.org/10.1080/10889860601021399.
Kozich, J.J., Westcott, S.L., Baxter, N.T., Highlander, S.K., and Schloss, P.D., 2013, Development of a dual-index sequencing strategy and curation pipeline for analyzing amplicon sequence data on the MiSeq Illumina sequencing platform: Applied and Environmental Microbiology, v. 79, no. 17, p. 5112–5120, accessed March 3, 2025, at https://doi.org/10.1128/AEM.01043-13.
Krzmarzick, M.J., Crary, B.B., Harding, J.J., Oyerinde, O.O., Leri, A.C., Myneni Satish, C.B., and Novak, P.J., 2012, Natural Niche for Organohalide-Respiring Chloroflexi: Applied and Environmental Microbiology, v. 78, no. 2, p. 393–401, accessed March 3, 2025, at https://doi.org/10.1128/AEM.06510-11.
Kueper, B., and Davies, K., 2009, Assessment and delineation of DNAPL source zones at hazardous waste sites: Cincinnati, Ohio, U.S. Environmental Protection Agency Ground Water Issue, EPA/600/R-09/119, 18 p. [Also available at https://nepis.epa.gov/Exe/ZyPURL.cgi?Dockey=P1006Y98.txt.]
Li, Z., Yoshida, N., Wang, A., Nan, J., Liang, B., Zhang, C., Zhang, D., Suzuki, D., Zhou, X., Xiao, Z., and Katayama, A., 2015, Anaerobic mineralization of 2,4,6-tribromophenol to CO2 by a synthetic microbial community comprising Clostridium, Dehalobacter, and Desulfatiglans: Bioresource Technology, v. 176, p. 225–232, accessed March 3, 2025, at https://doi.org/10.1016/j.biortech.2014.10.097.
Löffler, F.E., Tiedje, J.M., and Sanford, R.A., 1999, Fraction of electrons consumed in electron acceptor reduction and hydrogen thresholds as indicators of halorespiratory physiology: Applied and Environmental Microbiology, v. 65, no. 9, p. 4049–4056, accessed March 3, 2025, at https://doi.org/10.1128/AEM.65.9.4049-4056.1999.
Lorah, M.M., Majcher, E.H., Jones, E.J.P., and Voytek, M.A., 2008, Microbial consortia development and microcosm and column experiments for enhanced bioremediation of chlorinated volatile organic compounds, West Branch Canal Creek wetland area, Aberdeen Proving Ground, Maryland: U.S. Geological Survey Scientific Investigations Report 2007–5165, 79 p., accessed March 3, 2025, at https://doi.org/10.3133/sir20075165.
Lorah, M.M., Walker, C.W., Baker, A.C., Teunis, J.A., Majcher, E.H., Brayton, M.J., Raffensperger, J.P., and Cozzarelli, I.M., 2014, Hydrogeologic characterization and assessment of bioremediation of chlorinated benzenes and benzene in wetland areas, Standard Chlorine of Delaware, Inc. Superfund Site, New Castle County, Delaware, 2009–12: U.S. Geological Survey Scientific Investigations Report 2014–5140, 89 p. [https://doi.org/10.3133/sir20145140.]
Lorah, M.M., Walker, C., and Graves, D., 2015, Performance of an anaerobic, static bed, fixed film bioreactor for chlorinated solvent treatment: Biodegradation, v. 26, no. 5, p. 341–357, accessed March 3, 2025, at https://doi.org/10.1007/s10532-015-9738-1.
Lorah, M.M., Vogler, E., Gebhardt, F.E., Graves, D., and Grabowski, J.F., 2022, Enhanced bioremediation of RDX and co-contaminants perchlorate and nitrate using an anaerobic dehalogenating consortium in a fractured rock aquifer: Chemosphere, v. 294, accessed March 3, 2025, at https://doi.org/10.1016/j.chemosphere.2022.133674.
Luo, M., Zhang, X., Zhu, X., Long, T., Cao, S., and Yu, R., 2024, Bioremediation of chlorinated ethenes contaminated groundwater and the reactive transport modeling—A review: Environmental Research, v. 240, accessed March 3, 2025, at https://doi.org/10.1016/j.envres.2023.117389.
Majcher, E.H., Phelan, D.J., Lorah, M.M., and McGinty, A.L., 2007, Characterization of preferential ground-water seepage from a chlorinated hydrocarbon-contaminated aquifer to West Branch Canal Creek, Aberdeen Proving Ground, Maryland, 2002–04: U.S. Geological Survey Scientific Investigations Report 2006–5233, 191 p, accessed March 3, 2025, at https://doi.org/10.3133/sir20065233.
Majcher, E.H., Lorah, M.M., Phelan, D.J., and McGinty, A.L., 2009, Design and performance of an enhanced bioremediation pilot test in a tidal wetland seep, West Branch Canal Creek, Aberdeen Proving Ground, Maryland: U.S. Geological Survey Scientific Investigations Report 2009–5112, 70 p. plus appendixes. [https://doi.org/10.3133/sir20095112.]
Manchester, M.J., Hug, L.A., Zarek, M., Zila, A., and Edwards, E.A., 2012, Discovery of a trans-dichloroethene-respiring Dehalogenimonas species in the 1,1,2,2-tetrachloroethane-dechlorinating WBC-2 consortium: Applied and Environmental Microbiology, v. 78, no. 15, p. 5280–5287, accessed March 3, 2025, at https://doi.org/10.1128/AEM.00384-12.
Matturro, B., Ubaldi, C., and Rossetti, S., 2016, Microbiome dynamics of a polychlorobiphenyl (PCB) historically contaminated marine sediment under conditions promoting reductive dichlorination: Frontiers in Microbiology, v. 7, 14 p. [Also available at https://doi.org/10.3389/fmicb.2016.0150.]
May, H.D., and Sowers, K.R., 2016, “Dehalobium chlorocoercia” DF-1—from Discovery to Application, chap. 24 of Adrian, L. and Löffler, F.E., eds., Organohalide-Respiring Bacteria: Springer-Verlag Berlin Heidelberg, p. 563–586, accessed March 3, 2025, at https://doi.org/10.1007/978-3-662-49875-0_24.
McMurdie, P.J., and Holmes, S., 2013, phyloseq—An R package for reproducible interactive analysis and graphics of microbiome census data: PLoS One, v. 8, no. 4, accessed March 3, 2025, at https://doi.org/10.1371/journal.pone.0061217.
Mejia, S.M., Lorah, M.M., Foss, E.P., Livdahl, C.T., Mumford, A.C., Akob, D.M., Banks, B.D., Berg, A.M., Bowser, T.R., Cozzarelli, I.M., Jaeschke, J.B., Lee, G., Majcher, E.H., Needham, T.P., Polite, B.F., Psoras, A.W., and Trost, J.J., 2025, Former Twin Cities Army Ammunition Site K Treatability Test data including various field measurements, laboratory tests and degradation constituents in the bioremediation of trichloroethylene and dichloroethylene, Arden Hills, Minnesota 2020–2022: U.S. Geological Survey data release, https://doi.org/10.5066/P13QTBR7.
Moe, W.M., Yan, J., Fernanda Nobre, M., da Costa, M.S., and Rainey, F.A., 2009, Dehalogenimonas lykanthroporepellens gen. nov., sp. nov., a reductively dehalogenating bacterium isolated from chlorinated solvent-contaminated groundwater: International Journal of Systematic and Evolutionary Microbiology, v. 59, no. 11, p. 2692–2697, accessed March 3, 2025, at https://doi.org/10.1099/ijs.0.011502-0.
Moe, W.M., Rainey, F.A., and Yan, J., 2016, The Genus Dehalogenimonas, chap. 6 of Adrian, L., and Löffler, F.E., eds., Organohalide-Respiring Bacteria: Springer-Verlag Berlin Heidelberg, p. 137–151, accessed March 3, 2025, at https://doi.org/10.1007/978-3-662-49875-0_7.
Molenda, O., Tang, S., and Edwards, E.A., 2016a, Complete genome sequence of Dehalococcoides mccartyi strain WBC-2, capable of anaerobic reductive dechlorination of vinyl chloride: Genome Announcements, v. 4, no. 6, accessed March 3, 2025, at https://doi.org/10.1128/genomeA.01375-16.
Molenda, O., Quaile, A.T., and Edwards, E.A., 2016b, Dehalogenimonas sp. strain WBC-2 genome and identification of its trans-dichloroethene reductive dehalogenase, TdrA: Applied and Environmental Microbiology, v. 82, no. 1, p. 40–50, accessed March 3, 2025, at https://doi.org/10.1128/AEM.02017-15.
Mumford, A.C., Maloney, K.O., Akob, D.M., Nettemann, S., Proctor, A., Ditty, J., Ulsamer, L., Lookenbill, J., and Cozzarelli, I.M., 2020, Shale gas development has limited effects on stream biology and geochemistry in a gradient-based, multiparameter study in Pennsylvania: Proceedings of the National Academy of Sciences of the United States of America, v. 117, no. 7, p. 3670–3677, accessed March 3, 2025, at https://doi.org/10.1073/pnas.1911458117.
Mundle, S., Johnson, T., Lacrampe-Couloume, G., Perez-de-Mora, A., Duhamel, M., Edwards, E.A., McMaster, M.L., Cox, E., and Sherwood Lollar, B., 2012, Monitoring biodegradation of ethene and the bioremediation of chlorinated ethenes at a contaminated site using compound specific isotope analysis (CSIA): Environmental Science & Technology, v. 46, no. 3, p. 1731–1738, accessed March 3, 2025, at https://doi.org/10.1021/es202792x.
Nelson, D.K., and Divine, C.E., 2005, Tracers as tools for design and evaluation of injection-based in situ groundwater remediation systems: Environmental & Engineering Geoscience, v. 11, no. 4, p. 383–393, accessed March 3, 2025, at https://doi.org/10.2113/11.4.383.
Phillips, E., Bergquist, B.A., Chartrand, M.M.G., Chen, W., Edwards, E.A., Elsner, M., Gilevska, T., Hirschorn, S., Horst, A., Lacrampe-Couloume, G., Mancini, S.A., McKelvie, J., Morrill, P.L., Ojeda, A.S., Slater, G.F., Sleep, B.E., De Vera, J., Warr, O., and Passeport, E., 2022, Compound specific isotope analysis in hydrogeology: Journal of Hydrology, v. 615, accessed March 3, 2025, at https://doi.org/10.1016/j.jhydrol.2022.128588.
PIKA Arcadis, 2019, Twin Cities Army Ammunition Plant—Fiscal year 2018 annual performance report—New Brighton/Arden Hills Superfund Site: Arden Hills, Minn., Commander, Twin Cities Army Ammunition Plant, prepared by PIKA Arcadis, [variously paged, 201 p.], 9 app. [The availability of this source is limited. For more information, contact U.S. Army Environmental Command, Midwest and Central America Division (Fort Sam Houston, Joint Base San Antonio, Texas).]
R Core Team, 2024, R—A language and environment for statistical computing: R Foundation for Statistical Computing software release, 4.4.2, accessed February 12, 2025, at https://www.R-project.org/.
Rivett, M.O., Dearden, R.A., and Wealthall, G.P., 2014, Architecture, persistence and dissolution of a 20 to 45 year old trichloroethene DNAPL source zone: Journal of Contaminant Hydrology, v. 170, p. 95–115, accessed March 3, 2025, at https://doi.org/10.1016/j.jconhyd.2014.09.008.
Sauer, V.B., 2002, Standards for the analysis and processing of surface-water data and information using electronic methods: U.S. Geological Survey Water-Resources Investigations Report 01–4044, 91 p. [Also available at https://doi.org/10.3133/wri20014044.]
Schaefer, C.E., Lavorgna, G.M., Haluska, A.A., and Annable, M.D., 2018, Long-term impacts on groundwater and reductive dechlorination following bioremediation in a highly characterized trichloroethene DNAPL source area: Ground Water Monitoring and Remediation, v. 38, no. 3, p. 65–74, accessed March 3, 2025, at https://doi.org/10.1111/gwmr.12294.
Semrau, J., 2011, Bioremediation via methanotrophy—Overview of recent findings and suggestions for future research: Frontiers in Microbiology, v. 2, 7 p., accessed March 3, 2025, at https://doi.org/10.3389/fmicb.2011.00209.
Shapiro, A.M., Goode, D.J., Imbrigiotta, T., Lorah, M.M., and Tiedeman, C.R., 2019, The complex spatial distribution of trichloroethene and the probability of NAPL occurrence in the rock matrix of a mudstone aquifer: Journal of Contaminant Hydrology, v. 233, accessed March 3, 2025, at https://doi.org/10.1016/j.jconhyd.2019.04.001.
Sola, D.V. (comp.), 2001, RE—Progress report—Site K pilot tests of hydrogen release compound and direct hydrogen delivery using gas permeable membranes—SECOR International, Inc. Project No. 003.18506.500: Alliant Techsystems Inc., prepared by SECOR International, Inc., [variously paged, 48 p.] [Received by Alliant Techsystems Inc. as a letter with multiple attachments. The availability of this source is limited. For more information, contact U.S. Army Environmental Command, Midwest and Central America Division (Fort Sam Houston, Joint Base San Antonio, Texas).]
Solutions-IES, Inc., 2006, Protocol for enhanced in situ bioremediation using emulsified edible oil: Environmental Security Technology Certification Program ER-200221, prepared by Solutions-IES, Inc., Raleigh, N.C., 85 p. [Also available at https://sepub-prod-0001-124733793621-us-gov-west-1.s3.us-gov-west-1.amazonaws.com/s3fs-public/project_documents/ER-200221_Final_Protocol_V2.pdf.]
Song, D.L., Conrad, M.E., Sorenson, K.S., and Alvarez-Cohen, L., 2002, Stable carbon isotope fractionation during enhanced in situ bioremediation of trichloroethene: Environmental Science & Technology, v. 36, no. 10, p. 2262–2268, accessed March 3, 2025, at https://doi.org/10.1021/es011162d.
Sung, Y., Ritalahti, K.M., Sanford, R.A., Urbance, J.W., Flynn, S.J., Tiedje, J.M., and Löffler, F.E., 2003, Characterization of two tetrachloroethene-reducing, acetate-oxidizing anaerobic bacteria and their description as Desulfuromonas michiganensis sp. nov: Applied and Environmental Microbiology, v. 69, no. 5, p. 2964–2974, accessed March 3, 2025, at https://doi.org/10.1128/AEM.69.5.2964-2974.2003.
Sung, Y., Fletcher, K.E., Ritalahti, K.M., Apkarian, R.P., Ramos-Hernández, N., Sanford, R.A., Mesbah, N.M., and Löffler, F.E., 2006, Geobacter lovleyi sp. nov. strain SZ, a novel metal-reducing and tetrachloroethene-dechlorinating bacterium: Applied and Environmental Microbiology, v. 72, no. 4, p. 2775–2782, accessed March 3, 2025, at https://doi.org/10.1128/AEM.72.4.2775-2782.2006.
Thiros, S.A., Bender, D.A., Mueller, D.K., Rose, D.L., Olsen, L.D., Martin, J.D., Bernard, B., and Zogorski, J.S., 2011, Design and evaluation of a field study on the contamination of selected volatile organic compounds and wastewater-indicator compounds in blanks and groundwater samples: U.S. Geological Survey Scientific Investigations Report 2011–5027, 85 p., accessed March 3, 2025, at https://doi.org/10.3133/sir20115027.
Underwood, J.C., Akob, D.M., Lorah, M.M., Imbrigiotta, T.E., Harvey, R.W., and Tiedeman, C.R., 2022, Microbial community response to a bioaugmentation test to degrade trichloroethylene in a fractured rock aquifer, Trenton, N.J: FEMS Microbiology Ecology, v. 98, no. 7, accessed March 3, 2025, at https://doi.org/10.1093/femsec/fiac077.
U.S. Army, U.S. Environmental Protection Agency, and Minnesota Pollution Control Agency, 1997, Twin Cities Army Ammunition Plant, New Brighton/Arden Hills Superfund Site, Operable Unit 2 Record of Decision, December 1997: U.S. Army, U.S. Environmental Protection Agency, and Minnesota Pollution Control Agency. [The availability of this source is limited. For more information, contact U.S. Army Environmental Command, Midwest and Central America Division (Fort Sam Houston, Joint Base San Antonio, Texas).]
U.S. Army, U.S. Environmental Protection Agency, and Minnesota Pollution Control Agency, 2012, Record of Decision Amendment #4 for Operable Unit 2 (OU2), New Brighton/Arden Hills Superfund Site, Arden Hills, Minnesota, January 2012. [The availability of this source is limited. For more information, contact U.S. Army Environmental Command, Midwest and Central America Division (Fort Sam Houston, Joint Base San Antonio, Texas).]
U.S. Environmental Protection Agency, 1998, Technical protocol for evaluating natural attenuation of chlorinated solvents in ground water: U.S. Environmental Protection Agency EPA/600R-98/128, [variously paged, 248 p.], accessed February 5, 2025, at https://semspub.epa.gov/work/06/668746.pdf.
U.S. Geological Survey, 2024, Microbial Communities in groundwater and soil from Twin Cities Army Ammunition Plant, Arden Hills, Minnesota: National Library of Medicine National Center for Biotechnology Information database, accessed March 3, 2025, at https://www.ncbi.nlm.nih.gov/bioproject/PRJNA1188552.
U.S. Geological Survey, 2025, National water information system: U.S. Geological Survey database, accessed August 12, 2025, at https://waterdata.usgs.gov/nwis.
Wenck Associates, Inc., 2016, Final documentation report, Section 1013, TCAAP Redevelopment Site (VP22891/PB4302), Former Twin Cities Army Ammunition Plant, Part of the New Brighton/Arden Hills Superfund Site, EPA ID Number – MN721382090. WENCK File #0979-03, June 2016. [The availability of this source is limited. For more information, contact U.S. Army Environmental Command, Midwest and Central America Division (Fort Sam Houston, Joint Base San Antonio, Texas).]
Wenck Associates, Inc., Alliant TechSystems, Inc., Conestoga-Rovers & Associates, Inc., and Stantec Consulting Corporation, 2010, Fiscal year 2009 annual performance report—New Brighton/Arden Hills Superfund Site: Shoreview, Minn., Commander, Twin Cities Army Ammunition Plant, prepared by Wenck Associates, Inc., Alliant TechSystems, Inc., Conestoga-Rovers & Associates, Inc., and Stantec Consulting Corporation, [variously paged, 907 p.]. [The availability of this source is limited. For more information, contact U.S. Army Environmental Command, Midwest and Central America Division (Fort Sam Houston, Joint Base San Antonio, Texas).]
Wenck Associates, Inc., Alliant TechSystems, Inc., Conestoga-Rovers & Associates, Inc., and Stantec Consulting Corporation, 2011, Fiscal year 2010 annual performance report—New Brighton/Arden Hills Superfund Site: Shoreview, Minn., Commander, Twin Cities Army Ammunition Plant, prepared by Wenck Associates, Inc., Alliant TechSystems, Inc., Conestoga-Rovers & Associates, Inc., and Stantec Consulting Corporation, [variously paged, 383 p.]. [The availability of this source is limited. For more information, contact U.S. Army Environmental Command, Midwest and Central America Division (Fort Sam Houston, Joint Base San Antonio, Texas).]
Wenck Associates, Inc., Alliant TechSystems, Inc., Conestoga-Rovers & Associates, Inc., and Stantec Consulting Corporation, 2013, Fiscal year 2012 annual performance report—New Brighton/Arden Hills Superfund Site: Shoreview, Minn., Commander, Twin Cities Army Ammunition Plant, prepared by Wenck Associates, Inc., Alliant TechSystems, Inc., Conestoga-Rovers & Associates, Inc., and Stantec Consulting Corporation, [variously paged, 395 p.]. [The availability of this source is limited. For more information, contact U.S. Army Environmental Command, Midwest and Central America Division (Fort Sam Houston, Joint Base San Antonio, Texas).]
Wenck Associates, Inc., Alliant TechSystems, Inc., Conestoga-Rovers & Associates, Inc., and Stantec Consulting Corporation, 2014, Fiscal year 2013 annual performance report—New Brighton/Arden Hills Superfund Site: Shoreview, Minn., Commander, Twin Cities Army Ammunition Plant, prepared by Wenck Associates, Inc., Alliant TechSystems, Inc., Conestoga-Rovers & Associates, Inc., and Stantec Consulting Corporation, [variously paged, 508 p.]. [The availability of this source is limited. For more information, contact U.S. Army Environmental Command, Midwest and Central America Division (Fort Sam Houston, Joint Base San Antonio, Texas).]
Wenck Associates, Inc., Orbital ATK, and GHD Group Pty Ltd, 2016, Fiscal year 2014 annual performance report—New Brighton/Arden Hills Superfund Site: Shoreview, Minn., Commander, Twin Cities Army Ammunition Plant, prepared by Wenck Associates, Inc., Orbital ATK, and GHD Group Pty Ltd, [variously paged, 392 p.]. [The availability of this source is limited. For more information, contact U.S. Army Environmental Command, Midwest and Central America Division (Fort Sam Houston, Joint Base San Antonio, Texas).]
Yan, J., Şimşir, B., Farmer, A.T., Bi, M., Yang, Y., Campagna, S.R., and Löffler, F.E., 2016, The corrinoid cofactor of reductive dehalogenases affects dechlorination rates and extents in organohalide-respiring Dehalococcoides mccartyi: The ISME Journal, v. 10, p. 1092–1101, accessed March 3, 2025, at https://doi.org/10.1038/ismej.2015.197.
Yoshikawa, M., Zhang, M., Toyota, K., 2017, Biodegradation of volatile organic compounds and their effects on biodegradability under co-existing conditions: Microbes and Environments, v. 32, no. 3, p. 188–200, accessed March 3, 2025, at https://doi.org/10.1264/jsme2.ME16188.
Zalesak, M., Ruzicka, J., Vicha, R., and Dvorackova, M., 2021, Examining aerobic degradation of chloroethenes mixture in consortium composed of Comamonas testosteroni RF2 and Mycobacterium aurum L1: Chemosphere, v. 269, accessed March 3, 2025, at https://doi.org/10.1016/j.chemosphere.2020.128770.
Zhu, M., Zhang, L., Franks, A.E., Feng, X., Brookes, P.C., Xu, J., and He, Y., 2019, Improved synergistic dechlorination of PCP in flooded soil microcosms with supplementary electron donors, as revealed by strengthened connections of functional microbial interactome: Soil Biology & Biochemistry, v. 136, accessed March 3, 2025, at https://doi.org/10.1016/j.soilbio.2019.06.011.
Conversion Factors
U.S. customary units to International System of Units
International System of Units to U.S. customary units
Temperature in degrees Celsius (°C) may be converted to degrees Fahrenheit (°F) as follows:
°F = (1.8 × °C) + 32.
Temperature in degrees Fahrenheit (°F) may be converted to degrees Celsius (°C) as follows:
°C = (°F – 32) / 1.8.
Datums
Horizontal coordinate information is referenced to the North American Datum of 1983 (NAD 83).
Vertical coordinate information is referenced to the North American Vertical Datum of 1988 (NAVD 88).
Altitude, as used in this report, refers to distance above the North American Vertical Datum of 1988 (NAVD 88).
Supplemental Information
Specific conductance is given in microsiemens per centimeter at 25 degrees Celsius (µS/cm at 25 °C).
Concentrations of chemical constituents in water are given in either milligrams per liter (mg/L), micrograms per liter (µg/L), micromoles per liter (µmol/L), or millimoles per liter (mmol/L).
Concentrations of chemical constituents in soil are given in milligrams per kilogram (mg/kg) or micrograms per gram (µg/g).
Results for measurements of carbon (C) stable isotopes in water for dissolved constituents are expressed as ratios in the delta notation (δ13C) in per mil (‰) relative to the Vienna Peedee Belemnite (VPDB) international standard for carbon isotope analysis.
A fiscal year is the 12-month period from October 1 through September 30 of the following year and is designated by the calendar year in which it ends.
Abbreviations
11DCE
1,1-dichloroethene
3D
3-D Microemulsion (Regenesis, San Clemente, California)
cisDCE
cis-1,2-dichloroethene
CSIA
compound specific isotope analysis
CSM
conceptual site model
cVOCs
chlorinated volatile organic compounds
DCE
dichloroethene
DNAPL
dense nonaqueous phase liquid
DOD
U.S. Department of Defense
EPA
U.S. Environmental Protection Agency
EVO
emulsified vegetable oil
Fe2+
ferrous iron
ft bgs
feet below ground surface
GC-MS
gas chromatography with mass spectrometry
HRC
Hydrogen Release Compound
KMnO4
potassium permanganate
LMWOA
low molecular weight organic acids
LOQ
limits of quantification
MD-DE-DC WSC
Maryland-Delaware-DC Water Science Center
NVDOC
nonvolatile dissolved organic carbon
OHRB
organohalide-respiring bacteria
OU
operable Unit
PMS
passive microbial samplers
Q1
first quarter
Q2
second quarter
Q3
third quarter
Q4
fourth quarter
RBPGL
Reston Biogeochemical Processes in Groundwater Laboratory
RML
Reston Microbiology Laboratory
ROD
Record of Decision
ROI
radius of influence
TCAAP
former Twin Cities Army Ammunition Plant
TCE
trichloroethene
TOC
total organic carbon
transDCE
trans-1,2-dichloroethene
USGS
U.S. Geological Survey
VC
vinyl chloride
VFAs
volatile fatty acids
VO
vegetable oil
VOCs
volatile organic compounds
For additional information, contact:
Director, MD-DE-DC Water Science Center
5522 Research Park Drive
Catonsville, MD 21228
or visit our website at
https://www.usgs.gov/centers/md-de-dc-water
Publishing support provided by the U.S. Geological Survey, Science Publishing Network, Baltimore Publishing Service Center.
Disclaimers
Any use of trade, firm, or product names is for descriptive purposes only and does not imply endorsement by the U.S. Government.
Although this information product, for the most part, is in the public domain, it also may contain copyrighted materials as noted in the text. Permission to reproduce copyrighted items must be secured from the copyright owner.
Suggested Citation
Lorah, M.M., Majcher, E.H., Mumford, A.C., Foss, E.P., Needham, T.P., Psoras, A.W., Livdahl, C.T., Trost, J.J., Berg, A.M., Polite, B.F., Akob, D.M., and Cozzarelli, I.M., 2026, Treatability study to evaluate bioremediation of trichloroethene at Site K, former Twin Cities Army Ammunition Plant, Arden Hills, Minnesota, 2020–22: U.S. Geological Survey Scientific Investigations Report 2025–5113, 88 p., https://doi.org/10.3133/sir20255113.
ISSN: 2328-0328 (online)
Study Area
| Publication type | Report |
|---|---|
| Publication Subtype | USGS Numbered Series |
| Title | Treatability study to evaluate bioremediation of trichloroethene at Site K, former Twin Cities Army Ammunition Plant, Arden Hills, Minnesota, 2020–22 |
| Series title | Scientific Investigations Report |
| Series number | 2025-5113 |
| DOI | 10.3133/sir20255113 |
| Publication Date | February 18, 2026 |
| Year Published | 2026 |
| Language | English |
| Publisher | U.S. Geological Survey |
| Publisher location | Reston, VA |
| Contributing office(s) | Maryland-Delaware-District of Columbia Water Science Center |
| Description | Report: xii, 88 p.; Data Release |
| Country | United States |
| State | Minnesota |
| County | Ramsey County |
| City | Arden Hills |
| Other Geospatial | Site K, former Twin Cities Army Ammunition Plant |
| Online Only (Y/N) | Y |
| Additional Online Files (Y/N) | N |