

Historical Ice Jams and Associated Environmental Conditions on Osoyoos Lake
Links
- Document: Report (49.4 MB pdf) , HTML , XML
- NGMDB Index Page: National Geologic Map Database Index Page (html)
- Download citation as: RIS | Dublin Core
Acknowledgments
The authors thank the International Joint Commission and the International Osoyoos Lake Board of Control for initiating this study and for their support during the project.
Abstract
Ice jams occur regularly at the southern outlet of Osoyoos Lake, which spans the border between the State of Washington and British Columbia, Canada. In recent winters, ice jams caused (1) decreases in downstream discharge that may adversely affect salmon spawning habitat and (2) short-duration lake-level rise that can interfere with lake level management agreements. In response, water managers sought to understand the environmental conditions associated with the historical ice-jam occurrences on Osoyoos Lake. Researchers compiled datasets of discharge, lake level, and air temperature from four meteorological and three hydrologic stations near Oroville, Washington, to determine “ice-jam” or “non-ice-jam” days from 1942 to 2024.
After confirming known ice jams since 1994 using Landsat 8–9 and Sentinel–2 satellite imagery along with discharge, lake level, and air temperature data, researchers designated ice-jam days. They conducted statistical analyses to examine environmental conditions associated with ice-jam occurrences on Osoyoos Lake. Statistical tests indicated significant differences in wind speed, wind direction, and air temperature between ice-jam and non-ice-jam days. A linear discriminant-analysis model correctly predicted 12 of 13 historical ice-jam days since 1994 and determined that ice jams are more likely under westerly and northwesterly winds near or above 10 kilometers per hour (km/h) and minimum temperatures near or below –9.4 degrees Celsius (°C). An analysis of historical discharge suggests that ice jams have occurred since at least the 1940s, but 13 ice jam days occurred in the past decade (2014–2024), exceeding any previous decade. The daily minimum air temperature in the Osoyoos Lake region has increased at a rate of 0.021 °C per year since the 1940s, but ice jams usually occur in winters with colder average temperatures.
Introduction
Ice jams on rivers and lakes are a common phenomenon in cold regions and can cause sudden, unexpected flooding upstream and a reduction in flow downstream (Beltaos, 2000; Beltaos, 2008; Rokaya and others, 2018). Ice jams can occur during ice freeze-up in early to mid-winter when newly formed frazil ice particles are carried downstream or during ice break-ups when larger ice fragments pile up to form flow barriers (Beltaos and Prowse, 2001). In temperate regions with intermittent ice cover, freeze-up and break-up ice jams can occur throughout the cold season and are particularly challenging to predict and manage (White, 1996; Huokuna and others, 2022). In addition to air temperature, wind conditions may also affect ice-jam formation by transporting ice across the lake surface or preventing the formation of a stable ice sheet (Gilbert and Glew, 1986).
Osoyoos Lake is a run-of-the-river lake (a lake with through-flow that behaves hydrologically like a river reach) that spans the border between the United States and Canada in central Washington State and the southern part of British Columbia, respectively. In recent years, significant ice jams occurred at the southern outlet of the lake, near Oroville, Washington (Wash.), causing adverse effects. One such effect is elevated lake levels that can encroach on lakeside residences and interfere with lake level management agreements in Canada and the United States. Another concern of the International Osoyoos Lake Board of Control is sharp reductions in the downstream discharge of the Okanogan River that could dewater (drying of the channel) salmon spawning habitat and decrease water temperatures below tolerable thresholds, which has been observed on the Columbia River (Harnish and others, 2014).
Rapid reductions in streamflow caused by ice jams have adversely affected fish spawning and rearing habitat for fish species in other fluvial systems (Becker and others, 1983; Heggenes and others, 2018). Dewatering of the main channel or side channels can result in fish and egg mortality. While earlier stages of development in Chinook salmon (Oncorhynchus tshawytscha) eggs have shown tolerance for dewatering for several days, earlier stages of the alevin phases are highly susceptible to much shorter periods of dewatering. Chinook salmon eleutheroembryos and preemergent alevin experienced near total mortality after 48 hours and 6 hours of dewatering, respectively (Becker and others, 1983). However, other studies show that dewatering during winter months can cause the freezing of disconnected spawning habitat and fish mortality (Heggenes and others, 2018).
Substantial ice jams can block the outlet of Osoyoos Lake and reduce discharge in the Okanogan River, which is the most important criterion for Osoyoos Lake management (Josephy and others, 2011; International Joint Commission [IJC], 2013). These ice jams compromise the ability to abide by instream flow requirements for fisheries and the IJC Supplementary Order of Approval for the operation of Zosel Dam in Washington (IJC, 2013).
Local water managers and residents seek to understand the frequency and environmental causes of historical occurrences of ice jams on Osoyoos Lake to determine if occurrences are increasing. The goal of this study is to assess the occurrence and duration of historical ice jams on Osoyoos Lake and examine the environmental conditions under which they occur. Prior studies developed predictive approaches for the development of ice jams on rivers, including temperature thresholds and empirical methods that consider other environmental conditions (White, 2003). This report presents a compilation of hydrologic and meteorological data, along with satellite imagery, to identify historical ice jams and better understand conditions associated with their occurrence on Osoyoos Lake. These data were analyzed to identify dates of likely ice jams, environmental conditions during their formation and breakup, and long-term meteorological trends near Osoyoos Lake. This report does not address mitigation strategies, but its findings can inform lake management and support the development of mitigation strategies.
Geographic Setting
Osoyoos Lake is at an elevation of approximately 274 meters (m) (National Geodetic Vertical Datum of 1929 [NGVD 29]) in the southern Okanogan Valley (referred to as the Okanagan Valley in Canada), an elongated valley carved by Pleistocene glaciation (fig. 1). Retreating glaciers left behind a series of glacial-erosion lakes, including Osoyoos Lake. Regional bedrock underlying the lake consists primarily of gneissic granodiorite within a regional plutonic complex (Daly, 1912). The average water depth across central regions of the lake is 15 m, and the lake’s deepest point, called the North Basin, is 63 m. The total surface area of the lake is approximately 23.3 square kilometers. The lake is a popular recreation destination for swimming, boating, and fishing, and supports a broad ecosystem of fish species, including salmon, trout, and bass. Various species of Pacific salmon are of notable economic and cultural importance in the region, including Chinook salmon (Oncorhynchus tshawytscha) and sockeye salmon (Oncorhynchus nerka).
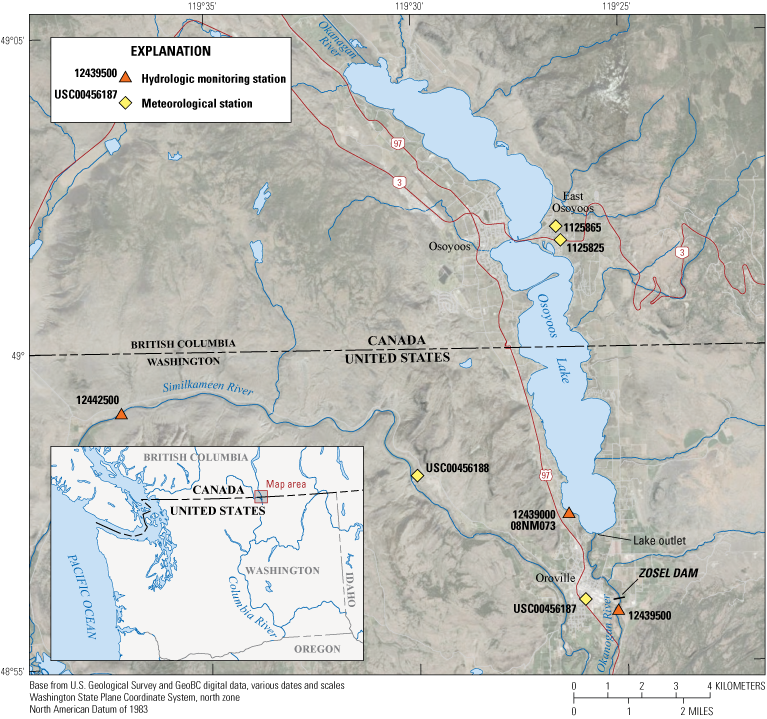
A map of the Osoyoos Lake region on the border of the United States and Canada showing the seven hydrologic monitoring stations and meteorological stations used in this report. Station identification numbers from the U.S. Geological Survey, the National Oceanic and Atmospheric Administration, and the Government of Canada are listed in table 1.
Streamflow enters Osoyoos Lake from the north in British Columbia via the Okanagan River and exits at the southern outlet into the Okanogan River in Washington State, eventually joining the Columbia River system. This flow-through dynamic gives the lake river-like characteristics, including susceptibility to ice jams. There are two engineered structures near the southern outlet where ice jams occur. The first structure is a set of concrete reinforcements designed to control erosion and channelize portions of the riverbank and lakeshore at the southern outlet (fig. 1). The second structure is Zosel Dam, a flood control dam on the Okanogan River (fig. 1), approximately 2.6 kilometers (km) downstream of the lake outlet (Washington State Department of Ecology, 2025). The Washington State Department of Ecology operates Zosel Dam to regulate the lake level and instream flows in accordance with the IJC 2013 Supplementary Order of Approval (IJC, 2013).
Methods
To better understand the environmental factors influencing ice jam formations on Osoyoos Lake, criteria for ice-jam occurrences were defined as follows. When an ice jam occurs, downstream discharge sharply decreases but does not necessarily drop to 0 cubic meters per second (m3/s), and persistent ice jams lasting more than 1 day cause the daily mean lake level to rise. An analysis of ice-jam occurrences involved identifying historically verified ice jams based on lake level rises, downstream discharge changes, and air temperature data from four weather stations. These criteria for observed historical ice jams were then verified using satellite imagery. Subsequent analysis included (1) examining patterns and trends in meteorological and hydrologic conditions associated with ice jams and (2) applying principal component analysis (PCA) (for example, Jolliffe and Cadima, 2016) and linear discriminant analysis (LDA) (for example, Zhao and others, 2024) to meteorological data from four weather stations to evaluate factors associated with ice-jam occurrences. Prior studies attempted to use similar statistical approaches to examine the hydrologic and meteorological conditions for predicting ice-jam occurrences (White, 1996, 2003).
Hydrologic and Meteorological Data Compilation
Collection of discharge data for the Okanogan River at Oroville, Wash., U.S. Geological Survey (USGS) gaging station (USGS 12439500) (USGS, 2024a) began in 1942 , and the station is herein referred to as ORO–WA. Approved discharge records have been available since 1942; additional paper records from before 1942 are archived at the USGS Upper Columbia Field Office. The gaging station is located 2.8 km downstream from the outlet of Osoyoos Lake and 0.3-km downstream from Zosel Dam (fig. 1). Discharge data from the USGS gaging station at Similkameen River near Nighthawk, Wash. (USGS 12442500) (USGS, 2024c), which flows into the Okanogan River approximately 4-km downstream of the Osoyoos Lake outlet, were used to examine potential effects on recorded discharge at the ORO–WA gaging station caused by high flows on the Similkameen River that can produce backwater effects at ORO–WA.
The Osoyoos Lake near Oroville, Wash., gaging station (USGS 12439000) (USGS, 2024b) is located approximately 1.1-km northwest (upstream) of the lake outlet. Data collection, approval, and publication at USGS 12439000, hereafter referred to as OLO–WA, began in 1965. However, the USGS began collecting Osoyoos Lake level (gage height) data at the site in 1928, but these early data were not approved or published. The Government of Canada published the 1928–1965 USGS-collected Osoyoos Lake level data, which are publicly accessible (Government of Canada, 2025). Those data were quality assured by comparison with the USGS archived working record. Researchers resolved discrepancies by removing all data prior to the start of the 1930 water year (October 1, 1929).
Air temperature data were compiled from four meteorological stations (table 1; fig. 1), extending the period of available data to 1942. Wind speed and direction data were not available until 1994, after Environment and Climate Change Canada (ECCC) started operating the Osoyoos CS meteorological station (Government of Canada, 2024a).1 The collection of water temperature data began on the Okanogan River in 2005 and on Osoyoos Lake in 2012. A graphical comparison of temporal coverage across all data sources is shown in figure 2. Data availability constrains the periods for identifying ice-jam occurrences to 1942–2024 and the period for investigating the environmental conditions that lead to ice jams to 1994–2024.
Data collected by Environment and Climate Change Canada are cited as sourced by the Government of Canada, as these data are not attributed at the organizational level.
Identification of Historical Ice Jams Using Satellite Imagery
All satellite imagery from Landsat 8–9 (USGS, 2024d) and Sentinel–2 (Sinergise Solutions d.o.o., 2024) for February 11, 2013–March 31, 2024, was examined for visual evidence of ice-jam occurrences and to view ice at various stages of formation and breakup. The nominal revisit times over Washington State for Landsat 8–9 and Sentinel–2 are approximately 8 days and 2–3 days, respectively, but winter cloud cover over Osoyoos Lake severely reduces the number of usable images. A collection of cloud-free available ice images (appendix 1) was compiled for February 11, 2013–March 31, 2024, after a thorough review of the online databases (Sinergise Solutions d.o.o., 2024; USGS, 2024d). An increase in the resolution of satellite imagery began in 2013 with the launch of Landsat 8–9, which enabled visual verification of the occurrence of ice jams and observation of the characteristics of ice. When possible, satellite imagery was used to examine ice morphology on the lake and verify potential ice jams delineated using changes in the discharge rate on the Okanogan River, the lake level of Osoyoos Lake, and the air temperature in the area.
Identification of Historical Ice Jams Using Hydrologic and Meteorological Data
Because the most prominent adverse effect of ice jams on Osoyoos Lake is a decreased discharge downstream, these data, along with air temperature and lake level, were used to identify days when ice jams occurred. We examined changes in the daily mean and in moving windows of 2-, 3-, and 4-day moving averages to identify periods indicative of persistent ice jams that could cause substantial changes to the lake level and streamflow. Ice-jam occurrences were identified through discharge data from ORO–WA, lake level data at OLO–WA, and air temperature data from four weather stations near Osoyoos Lake (table 1; fig. 2).
Additional factors to consider when identifying ice-jam occurrences on Osoyoos Lake include (1) operational changes in discharge and (2) the impact of a backwater effect that sometimes results in negative discharge at the ORO–WA gaging station caused by high flows on the Similkameen River. Air temperature data were used as a first check to filter out decreases in discharges associated with water operational changes because effects on discharges associated with ice jams would not occur when temperatures were above freezing. Because high flows on the Similkameen River are usually caused by rapid snow melt or heavy rainfall, backwater that may affect flow depth and discharge at ORO–WA is unlikely to occur when it is cold enough that precipitation falls as snow and ice jams form on Osoyoos Lake. However, discharge data from the Similkameen River near Nighthawk gaging station (USGS 12442500) were used to verify that the timing of high-flow conditions on the Similkameen River did not coincide with the timing of potential ice jams.
Although the USGS hydrologic stations ORO–WA and OLO–WA currently collect water temperature data, temperature data collection at ORO–WA began in 2005 and at OLO–WA in 2012. Because this limited period of record restricts the timeframe for analysis, the correlation between water and air temperature as a potential proxy for relative daily mean variations in water temperature was examined. Daily mean air temperature at the Osoyoos CS meteorological station shows a Spearman correlation (rs) and root mean square error (RMSE) with (1) the daily mean water temperature at OLO–WA of rs=0.93 (probability value [p] p < 0.0001) and RMSE=0.86 and (2) the daily mean water temperature at ORO–WA of rs=0.93 (p< 0.0001) and RMSE=0.92. Thus, observed relative changes in air temperature were used as a proxy for relative changes in water temperature at this study site.
Ice jams were identified for the period from October 1, 1942, to March 31, 2024, based on available discharge, lake level, and air temperature data. Daily minimum and daily mean air temperature data from the Osoyoos CS meteorological station, beginning August 1, 1990, when the record began, were used. Daily air temperature data from before August 1, 1990, were taken from Osoyoos West (Government of Canada, 2024b), Oroville (National Centers for Environmental Information [NCEI], 2024a), and Oroville 3 NW (NCEI, 2024b) stations, where only maximum and minimum daily air temperature is continuously provided (table 1; fig. 1). A continuous air temperature record for the full period of the discharge data record was assembled using the closest available stations to Oroville (table 1). At stations where daily mean values were unavailable—before August 1, 1990—the midrange daily value (mean of the daily maximum and minimum) was used.
Short-lived disruptions in discharge, those on the order of hours, do not tend to cause large changes in the lake level. Lake level changes are also difficult to detect on time spans shorter than a day because hourly variability can be greatly affected by wind and waves. High winds in the region result in high uncertainty in instantaneous 15-minute lake-level data that exceed the 0.01-ft (0.3-cm) accuracy of measurements. The 2-day averages smooth out daily variability and allow comparisons within the accuracy of the measurements. These criteria exclude ice accumulations that are short-lived or cause smaller discharge decreases, but they also minimize false positives and emphasize the ice jams that are most consequential. Finally, because dewatering for periods less than a day does not pose as large a risk to all fish life stages, unlike multiday periods (Becker and others, 1983), the use of daily values is adequate for the detection of consequential ice jams.
Table 1.
Datasets, date ranges, and sources used to identify ice jams and examine associated meteorological conditions for the period covered by the study.[Location provides latitude and longitude of the station. Data sources include the U.S. Geological Survey (USGS), the Government of Canada, and the National Oceanic and Atmospheric Administration (NOAA) National Centers for Environmental Information (NCEI). Dates are formatted as month/day/year. NAD 27, North American Datum of 1927; NAD 83, North American Datum of 1983; NW, northwest]
| Station name | Data source | Station ID | Variables | Latitude, longitude (datum) |
Start date |
End date |
|---|---|---|---|---|---|---|
| Okanogan River at Oroville | USGS, 2024a | USGS 12439500 | Discharge (daily mean, 15-minute) | 48.930833, –119.419167 (NAD 27) |
10/1/1942 | 3/31/2024 |
| Similkameen River near Nighthawk | USGS, 2024c | USGS 12442500 | Discharge (daily mean, 15-minute) | 48.984722, –119.617222 (NAD 27) |
10/1/1942 | 3/31/2024 |
| Osoyoos Lake near Oroville | USGS, 2024b | USGS 12439000 | Lake level (daily mean) | 48.956667, –119.438333 (NAD 27) |
10/1/1965 | 3/31/2024 |
| Osoyoos Lake near Oroville | Government of Canada, 2025 | 08NM073 | Lake level (daily mean) | 48.956667, –119.438333 (NAD 27) |
10/1/1942 | 9/30/1965 |
| Oroville 3 NW | NCEI, 2024b | USC00456188 | Air temperature (daily max, daily min) | 48.96669, –119.50000 (NAD 83) |
10/1/1942 | 5/3/1960 |
| Oroville | NCEI, 2024a | USC00456187 | Air temperature (daily max, daily min) | 48.93332, –119.43340 (NAD 83) |
5/4/1960 | 7/26/1968 |
| Osoyoos West | Government of Canada, 2024b | 1125865 | Air temperature (daily max, daily min) | 49.03194, –119.44277 (NAD 83) |
7/27/1968 | 7/31/1990 |
| Osoyoos CS1 | Government of Canada, 2024a | 1125825 | Air temperature (daily max, daily min, daily mean), wind speed (daily mean), wind direction (daily mean) | 49.02829, –119.44099 (NAD 83) |
8/1/1990 7/17/2012 |
1/1/2012 3/31/2024 |
Absolute change and percent change in daily, 2-, 3-, and 4-day averages of streamflow and lake level data were examined as indicators of ice-jam occurrences using observed ice-jam events verified with satellite imagery. In addition, various thresholds in maximum, mean, and minimum daily air temperature were examined, with the condition that 0 degrees Celsius (°C) or lower is a minimum requirement for ice-jam formation. The 2-day averages for (1) the absolute change in the average lake level at OLO–WA, (2) the percentage of change in streamflow data at ORO–WA, and (3) the minimum and mean air temperature threshold at Osoyoos CS or nearby weather stations from October to April each year were identified as the best indicators of verified ice-jam occurrences since 2019. The examination of daily, 2-, 3-, and 4-day moving averages indicated that averages longer than 2 days diluted the signal of changes in conditions associated with ice jams, whereas daily means produced false positives for ice-jam detection. Ice jams were identified on days when:
-
(1) the 2-day moving average daily discharge decreased by more than 15 percent from the previous 2-day average,
-
(2) the rate of change in the 2-day average lake level increased by at least 0.6 cm from the previous 2-day average, and
-
(3) the 2-day average minimum temperature was less than –9.4 °C, or the 2-day average mean temperature was less than –3.9 °C, or the 2-day average midrange temperature was less than –3.9 °C.
Using these criteria, historical ice-jam days were classified for October 1, 1942–March 31, 2024. The determination of potential ice-jam occurrences was restricted to periods when air temperature, river discharge, and lake level data were all available. Notable gaps in the records for when ice-jam occurrences were not assessed include—
-
• December 5, 1964–September 30, 1965,
-
• January 8, 1970–February 3, 1970,
-
• January 7, 1972–February 7, 1972,
-
• February 8, 1990–March 27, 1990, and
-
• October 11, 2001–October 16, 2001.
In addition to the above-mentioned criteria, once an ice jam was identified, the following day was considered to have an ice-jam occurrence if (1) the 2-day average percentage change in discharge was less than or equal to 0, and (2) the 2-day average percentage change in lake level was greater than or equal to 0. These thresholds were selected by identifying known ice jams since 2019 and eliminating the false identification of non-ice-jam days. This conservative approach was appropriate based on the limitations of these data and the effects of Osoyoos Lake ice jams.
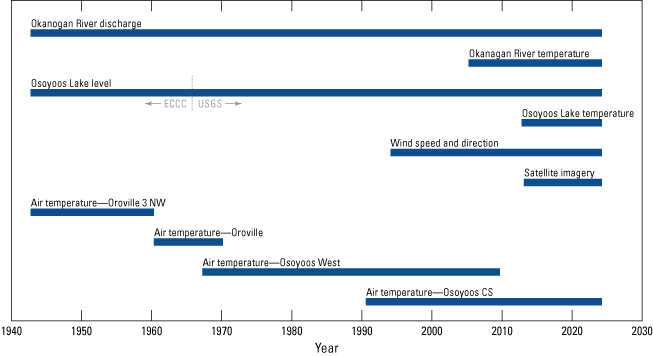
Range bar chart showing the length of station records for each environmental variable used in this study. The plot shows the following data ranges: Okanagan River discharge and Osoyoos Lake level data from before October 1, 1965 (provided by the Government of Canada through Environment and Climate Change Canada [ECCC]), and data from after October 1, 1965 (obtained from the U.S. Geological Survey National Water Information System). Dates of daily mean air-temperature data coincide with the start of the Osoyoos CS weather station record on August 1, 1990. Table 1 shows the start and end dates of the data used in the analysis of stations and additional details about the data, and appendix table 1.1 lists the start and end dates of records for each station.
Environmental Factors Influencing Ice-Jam Occurrences
To examine environmental factors associated with ice-jam occurrences on Osoyoos Lake, we relied primarily on data from the ECCC climate station, Osoyoos CS. Historical records for wind speed and direction were available for 1994 through 2024. Because reliable wind data were unavailable before 1994, the analysis was limited to March 1, 1994, through March 31, 2024, covering October–April of each water year (table 1). Wind data for January 1, 2012, through July 17, 2012, were considered erroneous because of missing values, and all other wind speed and direction values from that period were listed as 0. For this reason, and because no days during that period were classified as ice-jam days, those dates were removed from the analysis.
Daily averages and 2-, 3-, and 4-day moving averages for wind direction, wind speed, minimum air temperature, and mean (midrange was used when daily mean was unavailable) air temperature were calculated and examined for trends associated with ice jams on Osoyoos Lake to assess the potential for predicting ice-jam occurrence. Averages were not calculated for days with missing data or nonconsecutive dates, and observations for those days were removed prior to additional analyses.
Various statistical methods were used to examine differences in air temperature and
wind conditions associated with ice-jam and non-ice-jam days. A permutational multivariate
analysis of variance (PERMANOVA) with 999 permutations was used to test for significant
differences among multivariate predictors between ice-jam and non-ice-jam days using
the “adonis” function of the “vegan: Community Ecology Package” in R statistical software (Oksanen and others, 2022; R Core Team, 2024). PCA was used to visualize the variability in 2-day averages of meteorological conditions
associated with identified ice-jam days using the “PCA” function in the base package of R statistical software (R Core Team, 2024). The “lda” function in R was used for LDA (R Core Team, 2024) to examine the potential for predicting ice jams. The assumption of homoscedasticity
for LDA was met for all predictor variables after taking the square root of wind speed.
The highest Spearman rank correlation between all variables, including transformations,
was rs=0.58 (p-value< 0.0001) for wind speed and wind direction (fig. 3). The assumption of normality was relaxed and not formally tested because the dataset
exceeded 5,000 observations (beyond the practical limit for some tests), and the central
limit theorem suggests the data approach normality with large samples (Shapiro and Wilk, 1965). Histograms for each variable illustrate some skewness but otherwise approximate
normality upon visual inspection (fig. 3). Thus, results from the PCA and LDA should be interpreted with caution regarding
predictions, but these analyses provided usable information about environmental conditions
linked to ice jam occurrence on Osoyoos Lake.
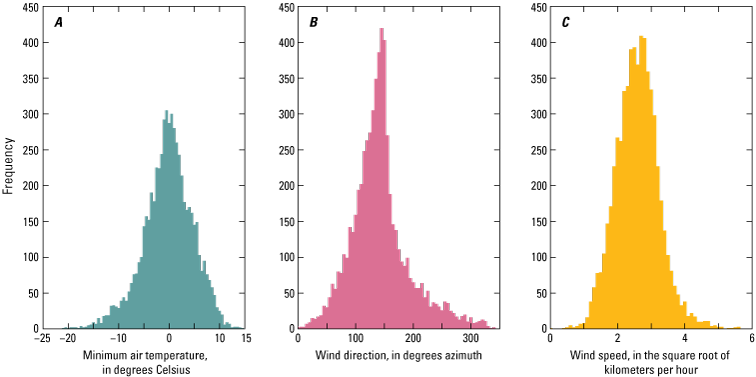
Three histograms (A–C) showing environmental factors used as predictors for ice jam occurrences for March 1, 1994–March 31, 2024. Frequency indicates the number of 2-day moving average values in the datasets of (A) minimum air temperature, in degrees Celsius; (B) wind direction, in degrees azimuth; and (C) wind speed in the square root of kilometers per hour. This figure depicts the square root transformation of wind speed used for statistical analysis.
Results
The analysis presented here identified potential ice jams that occurred between 1942 and 2024 using discharge, lake level, and air temperature data, and identifies air temperature and wind conditions associated with ice jams that have occurred since 1994. Identification of ice jams in the longer record is summarized below with comparisons to satellite imagery. The results are presented for the statistical analyses that compared ice-jam and non-ice-jam days, identified environmental conditions associated with ice-jams, and modeled the occurrence of ice jams using those environmental conditions between 1994 and 2024.
Identification of Historical Ice Jams
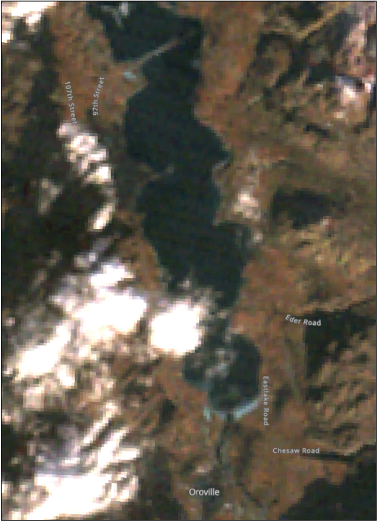
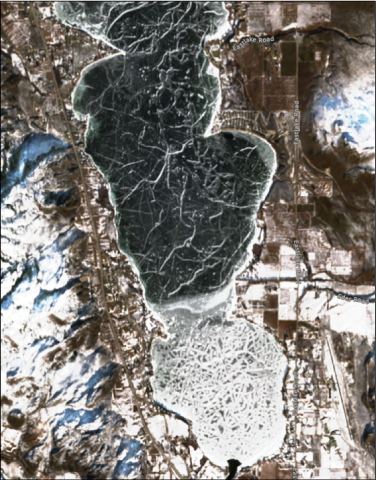
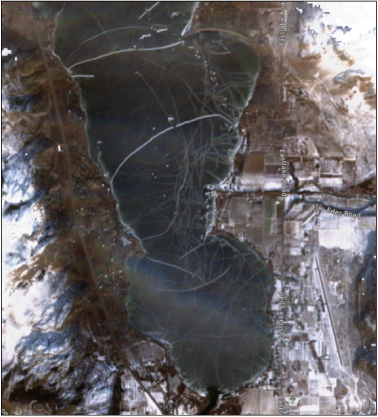
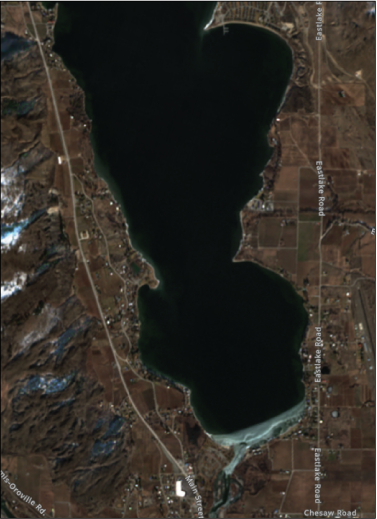
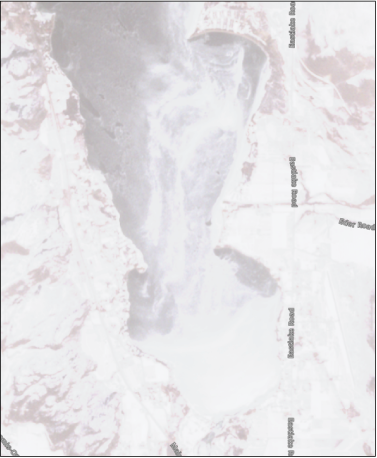
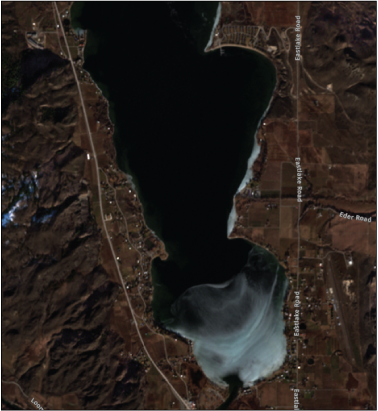
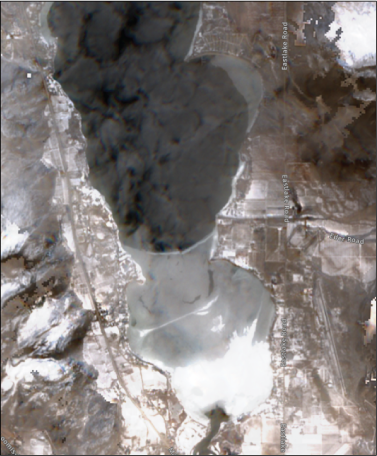
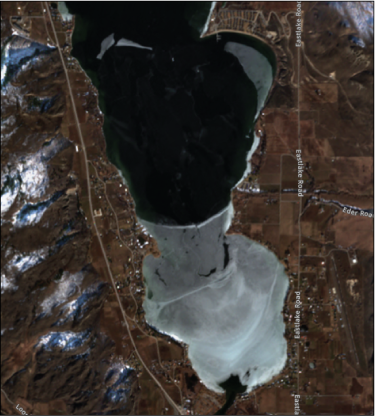
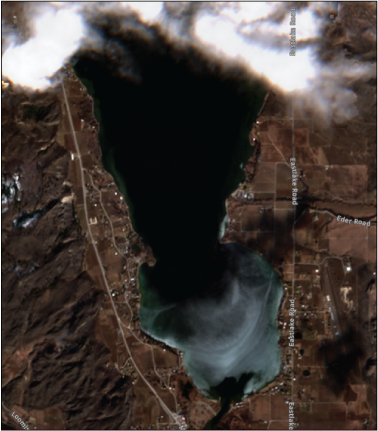
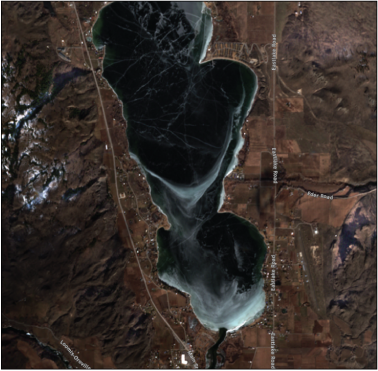
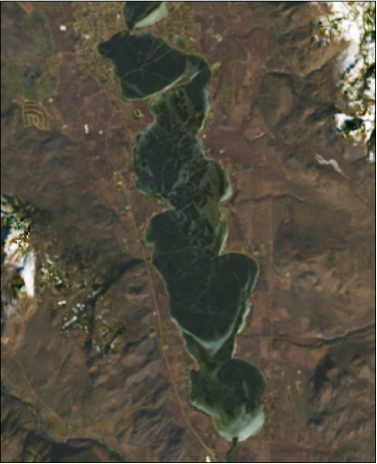
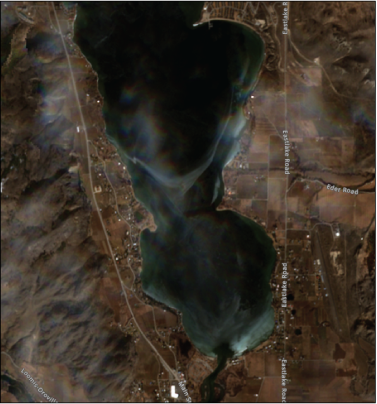
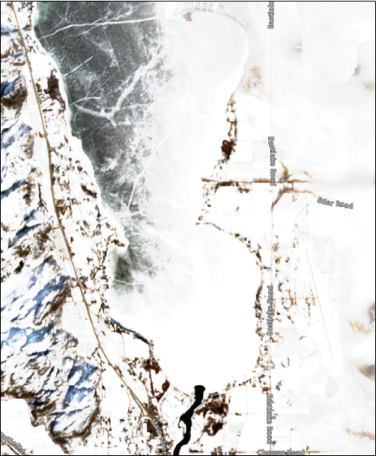
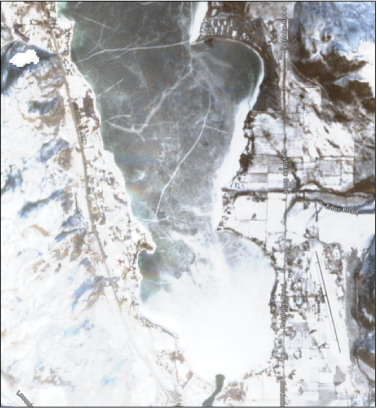
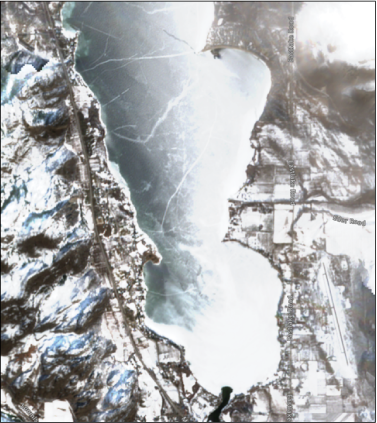
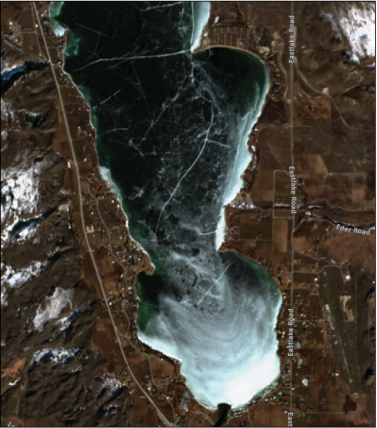
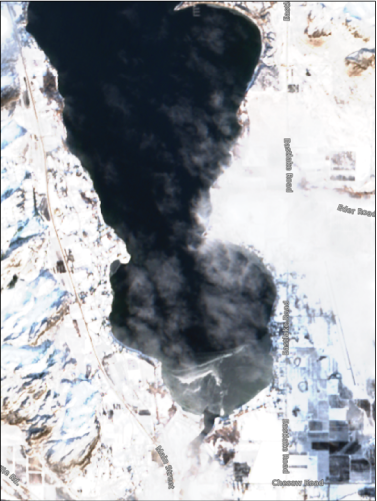
Available satellite images of ice on Osoyoos Lake (appendix 1) revealed apparent differences in lake ice conditions and showed potential differences in the mechanisms of ice movement that facilitate ice jams (fig. 4). Several images showed ice across most of the surface of the lake, with snow accumulated in potential cracks in the ice (figs. 4A, 4D, 4E). However, in these images, the outlet of Osoyoos Lake clearly showed a lack of ice, which supported the analysis because ice jams were not identified on those dates. Conversely, images that depicted ice at the constriction point of the lake outlet, extending a short distance down the channel from the southern banks of the lake, coincided with dates classified as ice-jam events (figs. 4C, 4F), except the image from February 12, 2018, in figure 4B.
Although ice was present at the outlet in figure 4B (February 12, 2018), this day was not identified as an ice-jam event because the 2-day average decrease in discharge of 10.9 percent did not exceed the threshold of 15 percent determined by calibration of known ice-jam events after 2019, as described in the “Methods” section. Mean daily discharge decreased to only 20.16 m3/s, with a minimum daily value of 9.43 m3/s. Although the 2-day average rise in the lake level of 0.6 cm met the threshold of 0.6 cm, the level started to decline, as did the effects on discharge the following day (February 13, 2018). This may have been a minor ice jam, but it did not persist long enough to affect the discharge or lake level substantially enough to meet the criteria of an ice-jam occurrence. In the calibration of the algorithm used to detect ice jams in the historical record, a threshold of a 10-percent decrease in 2-day average discharge falsely classified non-ice-jam days as ice-jam days. This instance provides an example of the justification used during the calibration of the algorithm.
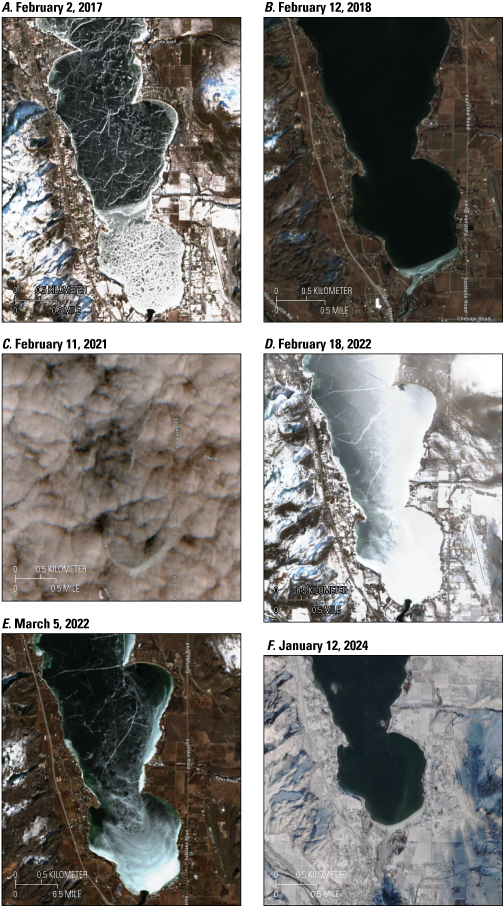
Sentinel–2 satellite imagery (Sinergise Solutions d.o.o., 2024) showing ice accumulations on Osoyoos Lake on (A) February 2, 2017, (B) February 12, 2018, (C) February 11, 2021, (D) February 18, 2022, (E) March 5, 2022, and (F) January 12, 2024. Additional satellite imagery showing ice accumulations is available in appendix 1 and accompanied by the dates and identification numbers for images used, which are listed in table 1.2.
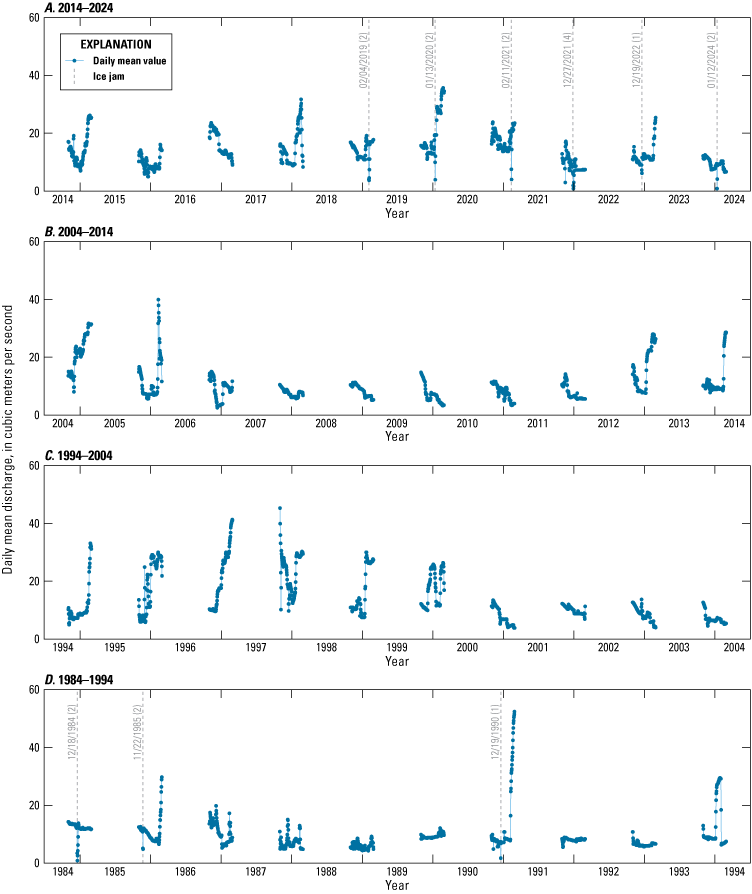
Graphs (A–H) showing decadal time-series plots of daily mean discharge (in cubic meters per second) at the U.S. Geological Survey gaging station Okanogan River near Oroville (USGS 12439500; U.S. Geological Survey, 2024a) during November–February. Graphs plot data across decadal ranges of (A) 2014–2024, (B) 2004–2014, (C) 1994–2004, and (D) 1984–1994, (E) 1974–1984, (F) 1964–1974, (G) 1954–1964, and (H) 1944–1954. Ice-jam events are indicated by vertical dashed lines that are labeled with the start date of the ice jam and the duration of the ice jam in days parenthetically.
Decadal discharge plots in figure 5 highlight the year-to-year variability of winter discharges at ORO–WA downstream of Osoyoos Lake. Ice jams occur sporadically throughout the entire study period (1942–2024), sometimes appearing in clusters. The largest cluster occurred during the 2019–2024 period and was preceded by a long period of no ice jams that began in 1990. Another cluster occurred during the 1983–1985 period.
In total, 31 days were identified by the algorithm as being affected by a total of 16 ice jams (durations ranging from 1 to 4 days). Identified ice jams are listed in table 2 with a minimum 2-day mean discharge, a maximum percent change in 2-day average discharge, and a maximum 2-day mean Osoyoos Lake level rise during the period of each identified ice jam. The 15-minute interval instantaneous discharge data, which began at ORO–WA in 1987, were used to determine the minimum discharge also presented in figure 2 for each identified ice jam since 1987. The maximum lake level is a conservative estimate because, in some cases, the lake level could have risen for some duration (fig. 6). However, the algorithm identified ice-jam days after the initial formation of an ice jam based on a continuous effect on both the discharge and the lake level. If the 2-day average discharge stopped declining by the defined threshold of 15 percent on a particular day, it is possible that a lag existed before the 2-day average lake level stopped rising by the defined threshold of 0.6 cm. This conservative approach emphasizes the effect of the downstream dewatering of the Okanogan River and reduces errors associated with lake-level rise before the formation of an ice jam.
Table 2.
Historical ice jams identified in this study from the discharge record.[Discharge data are from U.S. Geological Survey gaging station Okanogan River near Oroville (USGS 12439500; U.S. Geological Survey, 2024a), and lake level data are from USGS gaging station Osoyoos Lake near Oroville (USGS 12439000; U.S. Geological Survey, 2024b). Dates are formatted as month/day/year. m3/s, cubic meter per second; cm, centimeter; NA, not applicable]
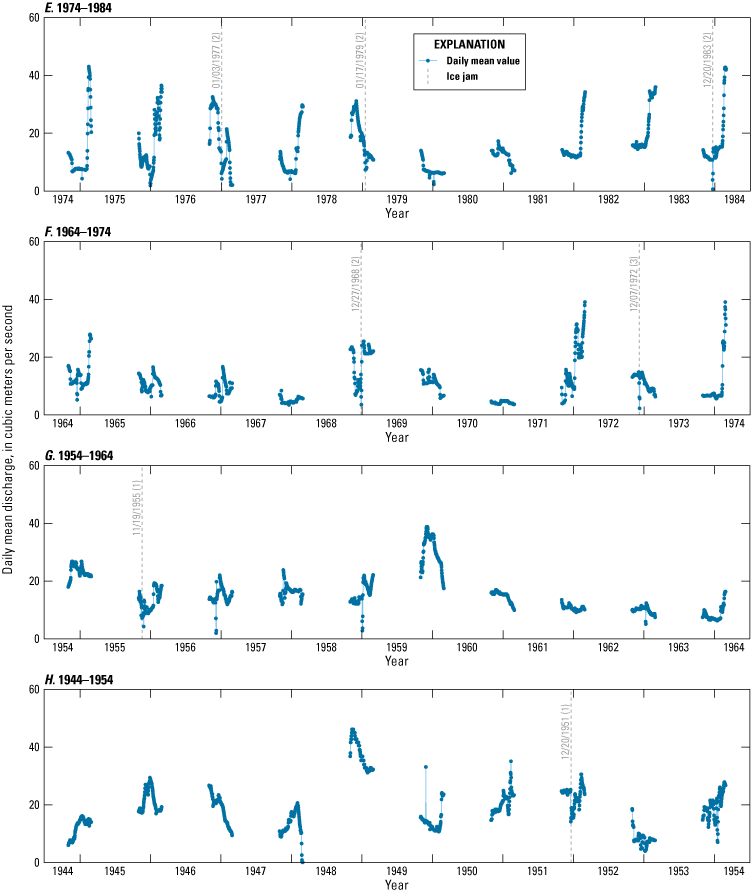
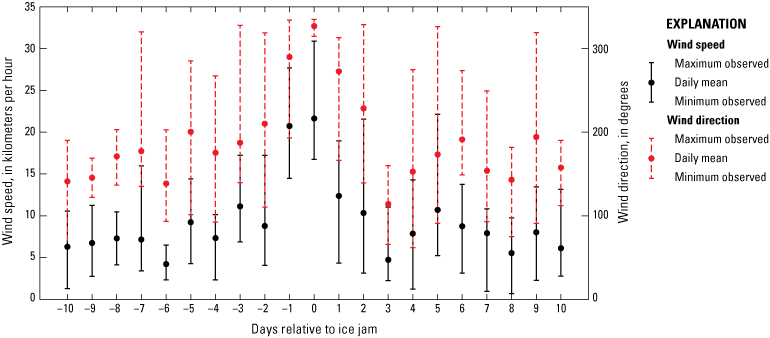
Graphs (A, B) showing daily mean discharge data and lake level data, for 2018–2024, along with the known ice jams (shown as dashed lines), used to calibrate the algorithm used for analysis in this report. (A) Daily mean discharge, in cubic meters per second, at U.S. Geological Survey (USGS) gaging station Okanogan River near Oroville (USGS 12439500; U.S. Geological Survey, 2024a); six ice jams are depicted, along with the duration of the ice jam, in days, shown in parentheses. (B) Lake level, in meters, at USGS gaging station Osoyoos Lake Near Oroville (USGS 12439000; U.S. Geological Survey, 2024b); six ice jams are depicted, along with the duration of the ice jam, in days, shown in parentheses.
Environmental Conditions Associated With Ice Jams
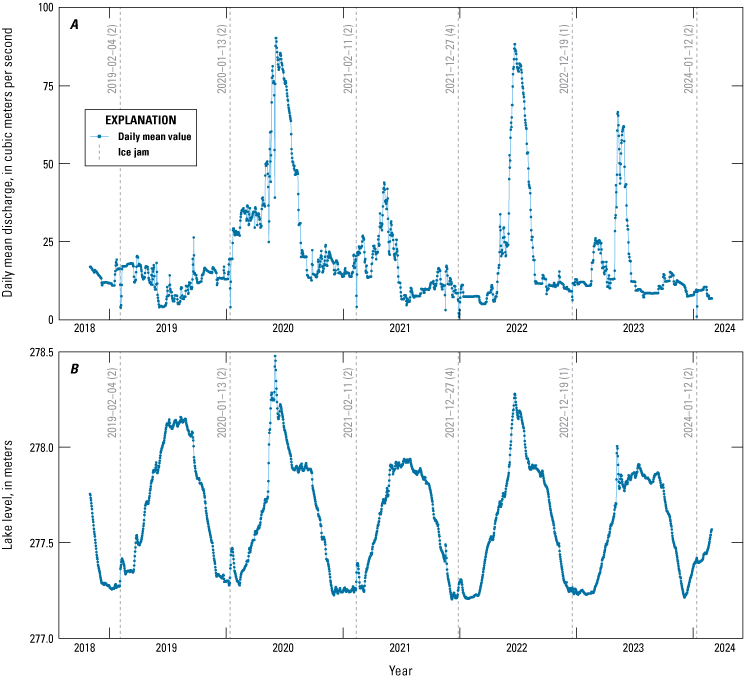
An analysis of wind conditions showed that daily mean wind speed increased by a factor of two to three over a 3–5 day period before ice jams occurred (fig. 7). Wind speed was highest on the day of the ice jam, reaching an average of 22 km/h, and then decreased to typical speeds of 5–10 km/h within 2–3 days after the ice jam. The increase in wind speed was accompanied by a change in wind direction from southeasterly (blowing from the southeast) at approximately 150 degrees azimuth to northwesterly at greater than 300 degrees on the day of the ice jam (fig. 7). Daily mean wind direction values that occurred on the day of all ice jams identified by the algorithm were always above 300 degrees azimuth (fig 7).
Mean range plot showing daily mean wind speed in kilometers per hour (black dot with solid black lines) and wind direction in 10s of degrees (in red dot with dashed red lines) during the 20 days surrounding the initial day of ice-jam events—values are plotted as days relative to the ice jam: from –10 days to 10 days. The upper and lower bars for each plotted value indicate the minimum and maximum observed daily mean values. The plot shows a substantial increase in wind speed approximately 1–2 days prior to an ice jam and the daily mean value peaking the day of the ice jam before decreasing back to a range like the days before the ice jam. Similarly, mean wind direction shifts from a range of 100–200 degrees azimuth to above 200 degrees 2 days before the ice jam and peaks above 300 degrees on the day of the ice jam before decreasing to the 100–200 degree range 3 days after the ice jam (Government of Canada, 2024a). Additional statistical analysis used a square root transformation of wind speed that is not shown in this figure.
Prior to the ice jam, changing wind conditions were accompanied by decreasing air temperature from near freezing to below freezing (≤ 3 degrees Celsius) the day before an ice jam (fig. 8). Water temperature at ORO–WA (fig. 9) and OLO–WA (fig. 9) also decreased substantially 2–3 days before an ice jam along with air temperature, potentially accelerated by wind-driven mixing. After an ice jam, air temperature (fig. 8) tended to increase after 2–3 days, and water temperature (fig. 9) remained near freezing for an extended period.
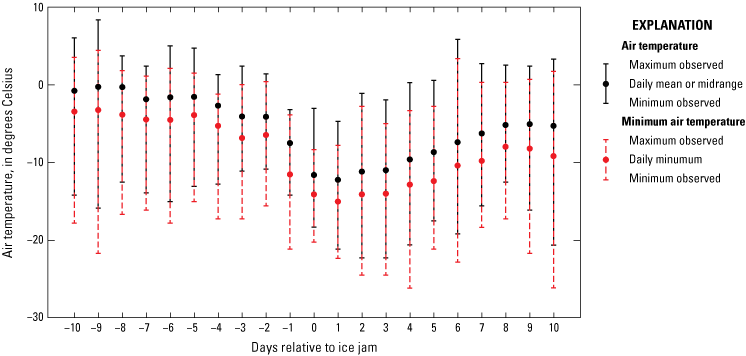
Mean and minimum range plot showing daily mean or midrange air temperature (in degrees Celsius) in black solid lines and daily minimum air temperature in red dashed lines during the 20 days surrounding the initial day of ice-jam events—values are plotted as days relative to the ice jam: from –10 days to 10 days. The upper and lower bars for each plotted value indicate maximum and minimum observed daily mean values. The plot shows a notable decrease in daily mean and daily minimum air temperature 1–2 days before an ice jam and a more gradual increase in air temperatures after an ice jam (National Centers for Environmental Information, 2024a, b; Government of Canada, 2024b).
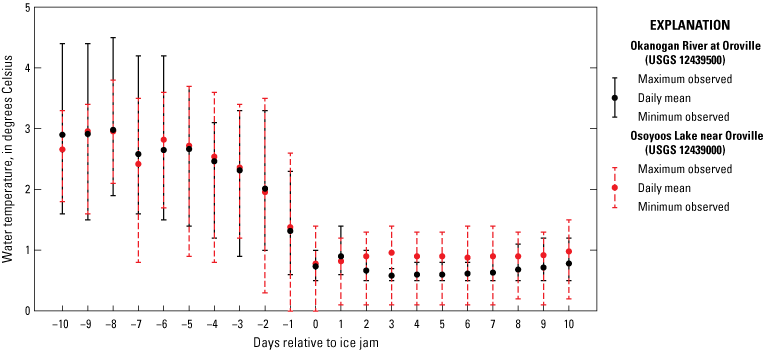
Mean range plot showing daily mean water temperature (in degrees Celsius) at U.S. Geological Survey (USGS) gaging station Okanogan River at Oroville (USGS 12439500; U.S. Geological Survey, 2024a) in solid black and Osoyoos Lake near Oroville (USGS 12439000; U.S. Geological Survey, 2024b) in red during the 20 days surrounding the initial day of ice-jam events—values are plotted as days relative to the ice jam: from –10 days to 10 days. The upper and lower bars for each plotted value indicate maximum and minimum observed values. The plot shows a notable decrease in daily mean water temperature in Osoyoos Lake and the Okanogan River 2–3 days before an ice jam, which is sustained for 10 days after an ice jam.
Statistical analyses of environmental conditions associated with ice-jam events on Osoyoos Lake indicated significant differences in environmental conditions associated with and without days affected by ice jams. Results from the PERMANOVA test indicated that the multivariate combination of minimum air temperature, wind direction, and wind speed was significantly different for ice-jam and non-ice-jam days at the 99 percent confidence level (p=0.001, pseudo-F-statistic=106.82). Pseudo-F is the test statistic derived from permutations in PERMANOVA. Figures 7, 8, and 9 illustrate a pattern of departure in air temperature, wind speed, and wind direction before the initial day of an ice jam. While this pattern appeared to start 1–3 days before an event, variability 2–3 days prior remained high for all three variables (figs. 7, 8, 9). Results from the nonparametric Wilcoxon rank-sum test indicated significant univariate differences between ice-jam and non-ice-jam days for wind speed (p<0.0001, W=37,622,545) and wind direction (p<0.0001, W=37,622,805; fig. 10). Differences in minimum air temperature, however, were not significantly different between ice-jam and non-ice-jam days (p=0.87, W=18,841,924). The results indicate that a shift toward westerly or northwesterly winds above approximately 200 degrees azimuth with a speed near or above 10 km/h during freezing conditions, particularly with daily minimum temperatures below –9.4 °C, are conditions under which ice jams are more likely to form (fig. 10).
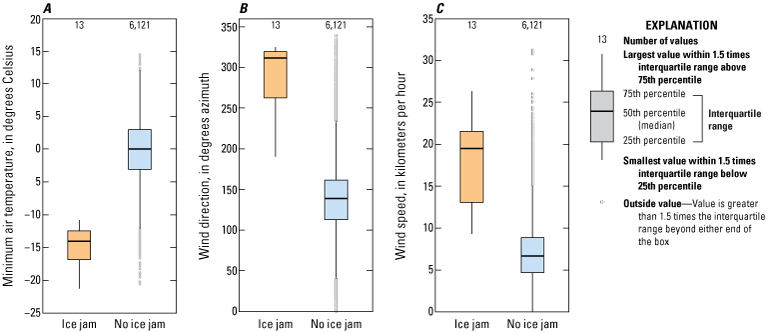
Boxplots of three prominent variables (A–C) associated with ice jam formation. Observations are based on data from March 1, 1994, to March 31, 2024, for 2-day averages of (A) minimum air temperature, in degrees Celsius (National Centers for Environmental Information, 2024a, b; Government of Canada, 2024a, b); (B) wind direction, in degrees azimuth (Government of Canada, 2024a); and (C) wind speed, in kilometers per hour (Government of Canada, 2024a). Boxplots are based on the Tukey method, where the whiskers extend to a maximum of 1.5 times the interquartile range from the first and third quartiles (the edges of the boxes). Wilcoxon rank-sum tests indicate significant differences between ice-jam and non-ice-jam days at the 99 percent confidence level (p<0.0001) for wind direction and wind speed, but not for minimum air temperature (p=0.87). Additional statistical analysis used a square root transformation of wind speed that is not shown in this figure.
PCA illustrated the separation of ice-jam days from non-ice-jam days in multidimensional space with 86 percent of the variability explained by the first two principal components (fig. 11; table 3). Vector arrows showing the variability in the data associated with wind speed and wind direction illustrated the relatively high correlation between the two variables. The 95-percent confidence-level ellipses for ice-jam and non-ice-jam days showed a separation based on air temperature and wind, where ice jams tended to form during low minimum air temperatures, high wind speeds, and northerly wind directions. In many cases, non-ice-jam events that fell within the 95-percent confidence-level ellipse for ice jams represented days immediately after ice-jam events, which was partially a result of using the rate of change in 2-day averages.
Table 3.
Results from principal component analysis (PCA).[%, percent]
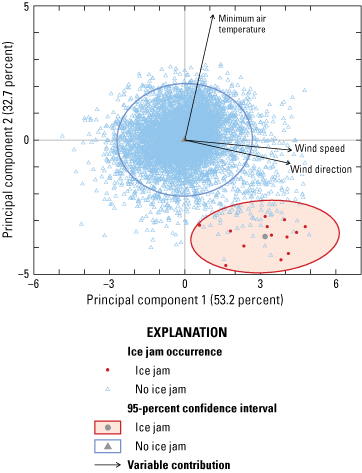
Principal component plot of meteorological variables colored by ice-jam and non-ice-jam days. The plot shows principal component 1 on the horizontal axis and principal component 2 on the vertical axis, which explain 53.2 and 32.7 percent of the variability in the data, respectively. Points represent days from March 1, 1994, to March 31, 2024, in multidimensional space accounting for 2-day averages of minimum air temperature, wind direction, and the square root of wind speed. Red and blue ellipses (fourth quadrant and center locations, respectively) represent the 95-percent confidence level for ice-jam and non-ice-jam days, respectively. Arrows represent variable contribution vectors to the two axes, principal components 1 and 2 (dimension 1 and dimension 2). The plot shows that non-ice-jam days are centered at the origin of the axes with a roughly equal spread that decreases in density moving away from the origin, and slightly more points in the lower and lower-right portion of the plot. The 13 ice-jam days are centered and contained within the lower portion of the lower right quadrant of the plot, with some overlap of non-ice-jam days outside of the 95-percent confidence ellipse.
LDA using the same three variables used in the PCA suggested a high potential for predicting ice-jam events based on 2-day averages of wind direction, wind speed, and minimum air temperature. LDA results indicated a prediction accuracy of 99 percent, but because the number (n) of non-ice-jam days (n=6,121) was much more abundant than ice-jam days (n=13), the confusion matrix and success rate for ice-jam and non-ice-jam days must be examined. Because the number of verified ice-jam days was only 13 out of 6,134 observation days, it was not statistically robust to split observations into a training dataset and a validation dataset. This means that only the success rate of the training dataset was reported; a verification on a separate dataset was not conducted. Of the 13 ice-jam days, 12 days were successfully identified by LDA using 2-day averages of the three variables, with the remaining event misclassified as a non-jam day, resulting in a 92-percent success rate for ice-jam events. Non-ice-jam days were correctly identified at a 99-percent success rate, with 6,087 non-ice-jam days correctly identified and 34 non-ice-jam days misclassified as potential ice-jam days. An examination of the PCA plot (fig. 11) illustrates the non-ice-jam days that overlapped the 95-percent confidence ellipse for ice-jam day for the first (dimension 1) and second (dimension 2) principal components. As noted above, these days were commonly those preceding or following ice-jam days when meteorological conditions favored ice jams, but one had not started to develop. The 2-day averages, however, could skew the signal of post-ice-jam conditions after an ice jam started to break up.
Discussion
The calibration of an algorithm to identify historical ice-jam events on Osoyoos Lake using reductions in discharge, rises in lake level, and temperature thresholds provided insight into the meteorological conditions associated with ice-jam formation. The results indicated that ice jams on Osoyoos Lake occurred under environmental conditions of high westerly to northerly winds during periods of colder temperatures. The results, knowledge of recent ice jams, and the validation of ice-jam and non-ice-jam events from satellite imagery provide information about ice formation and ice-jam occurrences.
Ice-Jam Formation
While the statistical analysis presented here should be interpreted with caution regarding the prediction of future events, it provides insight into the environmental conditions associated with the occurrence of ice jams on Osoyoos Lake. The sample size of occurrences of ice-jam days was relatively small (n=13), and prevented assessment of the performance of the LDA model on both a training and a validation dataset, but the combination of results from other statistical analyses reinforced conclusions about factors that affect ice-jam formation on Osoyoos Lake. Significant differences between the wind conditions during ice-jam and non-ice-jam days (p<0.0001) are visible in the boxplots (fig. 10). The PCA plot provides a visualization of differences between non-ice-jam and ice-jam days in multidimensional space (fig. 11). The PCA plot also illustrates the differences between groups associated with results from the LDA, which indicates that air temperature, wind speed, and wind direction explain differences in ice-jam and non-ice-jam days.
The results indicate that cold conditions are not the only meteorological factor responsible for the formation of ice jams on Osoyoos Lake. Satellite imagery that shows Osoyoos Lake covered entirely in ice does not coincide with related ice-jam events during that period, whereas imagery with ice-over conditions at the outlet—but a lake surface mostly clear of ice—corresponded to ice-jam events (fig. 4). It is possible that conditions that facilitate a complete freeze-over on Osoyoos Lake are not the same conditions that cause ice jams. Strong winds can inhibit continuous ice formation and promote breakup and accumulation on the leeward side of the lake.
A working hypothesis for the formation of ice jams provides an explanation for the patterns observed under the meteorological conditions examined in this study. Frazil ice is composed of small (<1mm–10mm), often elongate ice crystals suspended in super-cooled and turbulent water, which can accumulate or coalesce in a variety of ways to form ice cover on the water’s surface (Barrette, 2021). Westerly and northwesterly winds on Osoyoos Lake appear to cause turbulent flow and frazil ice formation that accumulates as a slow-moving mass at the southern lake outlet. This mass can then cause a partial blockage that reduces flow through the river channel, promoting the further consolidation and fusion of ice particles into the continuous ice masses observed in figures 4C and 4F.
While the results suggest that ice-jam breakups on Osoyoos Lake are likely to occur once the conditions that facilitate their formation are no longer present, the results presented here provide a limited ability to infer breakup conditions. While higher lake levels may help facilitate a mechanical breakup of ice jams, ice jams seem to persist until some combination of warmer air temperatures, lower wind speed, and an easterly or southerly shift in wind direction occurs. The only day on which an ice jam was identified that had a 2-day average wind direction less than 240 azimuth degrees (applicable only for the period of record with wind data starting in 1994), for example, was the last day of the longest ice jam detected in the analysis. During the 4-day ice jam that initiated on December 27, 2021, wind direction shifted from 340 degrees the day before the start of the ice jam to 117 degrees and a 2-day average wind direction of 190 azimuth degrees on the last day of the ice-jam event. The lack of ice-jam events with dominantly southerly and easterly components to average wind direction indicate that wind direction is a major factor for ice-jam formation on Osoyoos Lake.
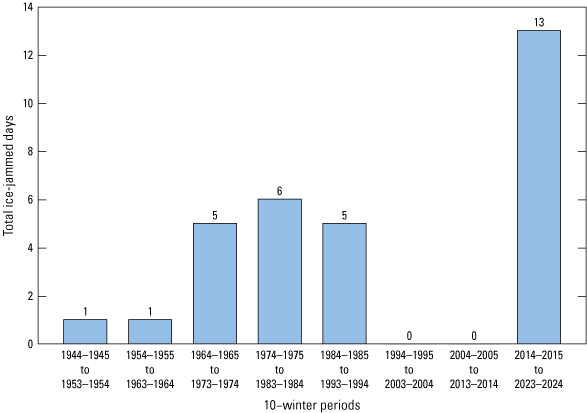
Bar graph showing the total number of ice-jam days in each of the 10-winter periods between 1944–1945 and 2023–2024. The first two decades show 1 ice-jam day, followed by three decades each with 5–6 ice-jam days, two decades with no ice-jam days between 1994 and 2014, and the most recent interval (2014–2024) has the largest number of ice-jammed days (13) by a factor of more than 2.
Potential Effects of Ice-Jam Events on Salmonids
Potential increases in ice jams on Osoyoos Lake in the last decade are of concern, but the ice jams identified in this study were not significant enough to substantially affect lake levels. Interpretations of the effects of changes in discharge that could adversely affect fish, however, are more complicated. Experiments that examined the effects of dewatering on the survival of the four developmental phases of Chinook salmon suggested that the timing of ice jams may be critical for the survival of specific fish species. Early stages of Chinook salmon development, including cleavage eggs and embryos, had only a 2-percent mortality rate during 12 consecutive dewatering days. In contrast, later stages experienced high mortality rates under much shorter dewatering periods (Becker and others, 1983).
Nearly 100-percent mortality of Chinook salmon eleutheroembryos and preemergent alevins occurred after 48 hours and 6 consecutive hours of dewatering, respectively (Becker and others, 1983). This means that earlier developmental stages of salmon can endure the typical length of ice jams on Osoyoos Lake (1–4 days), but ice jams with a duration of less than 1 day (which were not examined in this study) could be detrimental to the later stages of salmon development if salmon spawning habitat is dewatered. In the broader context, ice jams that substantially reduce flow during the earlier part of fall-run spawning periods (October–November) may not be detrimental, but those that occur after November may be more adverse to salmon in a more sensitive life stage; however, the dewatering of salmon redds is only one aspect of mortality, because ice formation in dewatered rivers can be lethal to fish at any life stage.
Predicting Ice-Jam Occurrences and Research Needs
The results presented here can inform land managers and dam operators about potential conditions under which ice-jam formation on Osoyoos Lake is more likely and prioritize future efforts to further understand ice jams and develop potential mitigation strategies to prevent them. Research that examines the physical characteristics of ice formation, breakup, and transport on Osoyoos Lake could provide additional insight into the mechanisms for ice-jam occurrence. Further research could involve deterministic or numerical modeling of ice formation, water temperature monitoring at various depths, examination of how warming winter temperatures might affect ice formation and ice-jam occurrences, or monitoring ice and ice-jam formation and movement using cameras.
Although Zosel Dam on the Okanogan River regulates lake levels on Osoyoos Lake, lake ice jams seem to share characteristics similar to those on rivers. Thus, additional research about the mechanistic causes of ice jams and the potential for predicting ice jams on Osoyoos Lake could incorporate methods used to study river ice jams. While the work presented here provides an upper temperature threshold above which ice jams are unlikely to occur on Osoyoos Lake, the LDA results presented also point to wind conditions as an important factor. White (2003) emphasizes the importance of considering additional environmental conditions and discusses the use of LDA, like the results presented here. In the summary of the numerous approaches to predictive modeling for the occurrence of river ice jams, White (2003) also discusses the potential for artificial intelligence and machine learning models to develop more sophisticated models that can provide various outputs for nuanced scenarios and conditions. Field methods such as additional temperature gaging at various depths and the measurement of ice formation may better inform such physically based and predictive models (Beltaos, 2008).
Long-Term Trends in Air Temperature and Wind Direction
Local and Indigenous knowledge of ice formation and ice jams on Osoyoos Lake indicate that ice jams occurred less frequently and that it was typical for the lake to freeze over as solid ice in the past (Arnie Marchand, Okanagan Indian and member of the Confederated Tribes of the Colville Reservation, oral commun., 2023). This report’s analysis indicates a record of likely ice-jam occurrences on Osoyoos Lake since the 1950s and indicates a possible increase in ice-jam occurrences in the last decade of the study period (2014–2024). Still, these results cannot be used to infer anything about ice behavior before the simultaneous monitoring of discharge and lake levels began in 1942. The recent cluster of ice jams (2019–2024) might give the impression of increased frequency, but this conclusion depends on the temporal range considered and the time interval used for binning data. Ice jams occurred more frequently over the past 10 winters than during any previously observed interval (fig. 12). However, the results summarized in figure 12 could be biased, because the data analysis for recent decades is informed by data of higher quantity and resolution.
The meteorological data compiled (Government of Canada, 2024a, b; NCEI 2024a, b) provided an opportunity to assess long-term trends in air temperatures that may affect the formation and breakup of ice jams. Figure 13 shows the trend components of time series decompositions of the air temperature records for daily maximum, mean or midrange, and minimum temperature from 1945 to 2024. The analysis excludes missing or erratic data in the first 2–3 years of the temperature records. The results show a warming rate of 0.015 °C per year since 1945 in mean or midrange temperature (or 0.15 °C per decade) (Government of Canada, 2024a, b; NCEI 2024a, b). The daily maximum air temperature has increased at a rate of 0.0092 °C per year, while the daily minimum air temperature has increased at a rate of 0.021 °C per year (Government of Canada, 2024a, b; NCEI 2024a, b). In contrast to air temperature, analysis of water temperature at both ORO–WA and OLO–WA hydrologic stations (USGS 2024a, b) showed no significant trends, but their records are much shorter.
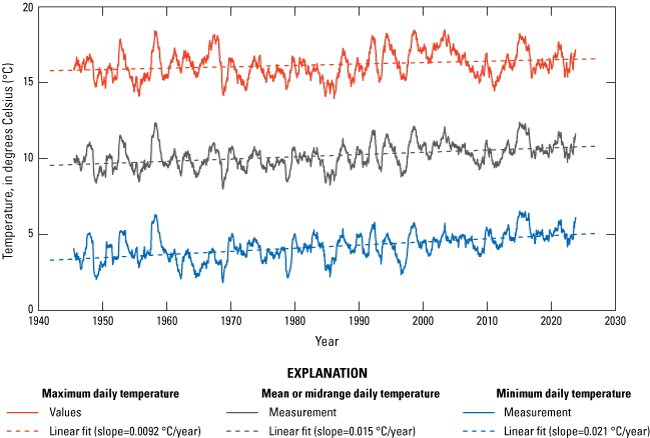
Graph showing the trend components of time series decompositions of the daily maximum, mean, or midrange, and minimum air temperature (National Centers for Environmental Information, 2024a, b; Government of Canada, 2024a, b). Records are shown in red, black, and blue, respectively, from January 1945 to March 2024. Linear fits (dashed lines) to all three show a warming trend, with minimum air temperature rising the fastest at 0.021 degrees Celsius (°C) per year. The plot shows that increasing trends in annual variability are similar for the minimum, mean, and maximum air temperature from 1945 to 2024, with the minimum temperature having the steepest gradient and the maximum air temperature having the lowest gradient in general increase over time.
A warming trend was present in the daily mean or midrange air temperature, demonstrating the shifting climatic conditions of the Osoyoos Lake region. A daily mean warming rate of 0.15 °C per decade and a faster warming rate for minimum air temperature are consistent with observations for the broader inland Pacific Northwest region (Berkeley Earth, 2024; EPA, 2025). The effect of increasing air temperatures, particularly minimum air temperature, on ice-jam processes is uncertain, but one plausible hypothesis is that warmer air temperatures delay the formation of a rigid ice layer before or during storms, and this promotes or prolongs the formation of the mobile ice particles that can jam the narrow outlet of Osoyoos Lake. A potential relationship between ice-jam occurrences and increases in daily mean temperatures is likely more complicated than overall average warming winter conditions. The algorithm indicates that the mean winter air temperature was lower on ice-jam days, although the difference was not statistically significant (p-value=0.1). This suggests that a higher variability in temperature conditions or winter storm characteristics, in combination with wind behavior and other environmental factors, may contribute to increased ice-jam occurrences.
Conclusions
Discharge records suggest that ice jams have occurred on Osoyoos Lake since at least the 1940s, and this report’s algorithm classifies 31 days affected by ice jams since 1942 and 13 days since 2019. Results indicate significant univariate and multivariate differences for minimum air temperature, wind direction, and wind speed between ice-jam and non-ice-jam days, and the range of values for these variables under which ice jams occur provides guidance on the ideal conditions for ice-jam formation. Principal component analysis illustrates differences between ice-jam and non-ice-jam days in multivariate space, and linear discriminant analysis demonstrated >90 percent accuracy for identifying ice jams.
The full discharge record shows evidence of ice jams becoming more frequent, but a recent cluster of ice jams during 2019–2024 was preceded by more than two decades of potentially ice-jam-free winters based on the algorithm. This report’s analysis suggests that ice jams on Osoyoos Lake are more likely to occur with a shift toward westerly or northwesterly winds with a speed near or above 10 kilometers per hour and daily minimum air temperatures below –9.4 degrees Celsius (°C). These conditions are typically associated with winter storms and may occur for only a short duration that deviates substantially from the mean winter temperature. Recent satellite imagery from Sentinel–2 and Landsat 8–9 over the Osoyoos Lake outlet captured instances of ice accumulation during ice jams. Daily minimum air temperatures have warmed at a rate of approximately 0.21 °C per decade since the 1940s.
In this report, the authors posit that ice jams occur on Osoyoos Lake under windy conditions because wind hinders the development of a continuous ice sheet and instead causes it to break up and accumulate at the leeward side of the lake near the outlet. Future studies that examine ice particle sizes and velocities prior to and during ice jams and the mechanistic processes of ice-jam formation could increase understanding of the effects of regional warming on Osoyoos Lake ice-jam occurrences.
References Cited
Barrette, P.D., 2021, Understanding frazil ice—The contribution of laboratory studies: Cold Regions Science and Technology, v. 189, article 103334, accessed September 25, 2025, at https://doi.org/10.1016/j.coldregions.2021.103334.
Becker, C.D., Neitzel, D.A., and Abernethy, C.S., 1983, Effects of dewatering on chinook salmon redds—Tolerance of four development phases to one-time dewatering: North American Journal of Fisheries Management, v. 3, no. 4, p. 373–382, accessed September 30, 2024, at https://doi.org/10.1577/1548-8659(1983)3<373:EODOCS>2.0.CO;2.
Beltaos, S., 2000, Advances in river ice hydrology: Hydrological Processes, v. 14, no. 9, p. 1613–1625, accessed September 25, 2025, at https://doi.org/10.1002/1099-1085(20000630)14:9<1613::AID-HYP73>3.0.CO;2-V.
Beltaos, S., 2008, Progress in the study and management of river ice jams: Cold Regions Science and Technology, v. 51, no. 1, p. 2–19, accessed September 28, 2024, at https://doi.org/10.1016/j.coldregions.2007.09.001.
Beltaos, S., and Prowse, T.D., 2001, Climate impacts on extreme ice-jam events in Canadian rivers: Hydrological Sciences Journal, v. 46, no. 1, p. 157–181, accessed September 25, 2025, at https://doi.org/10.1080/02626660109492807.
Berkeley Earth, 2024, Temperature State list: Berkeley Earth website, accessed September 24, 2025, at https://berkeleyearth.org/temperature-state-list/.
Daly, R.A., 1912, Geology of the North American Cordillera at the 49th parallel: Ottawa, [Ontario, Canada,] Government Printing Office, Canada Department of Mines, Geological Survey, 3 pts., variously paged, accessed September 28, 2024, at https://archive.org/details/geologyofnortham01daly/mode/2up.
Government of Canada, 2024a, Osoyoos CS—Historical data: Government of Canada—Environment and natural resources web page, accessed September 17, 2024, at https://climate.weather.gc.ca/historical_data/search_historic_data_stations_e.html?searchType=stnName&timeframe=1&txtStationName=Osoyoos+CS&searchMeth od=contains&optLimit=yearRange&StartYear=1840&EndYear=2024&Year=2024&Month=9&Day=30&selRowPerPage=25.
Government of Canada, 2024b. Osoyoos West—Historical Data: Government of Canada—Environment and natural resources web page, accessed September 17, 2024, at https://climate.weather.gc.ca/historical_data/search_historic_data_stations_e.html?searchType=stnName&timeframe=1&txtStationName=Osoyoos+West&searchMe thod=contains&optLimit=yearRange&StartYear=1840&EndYear=2024&Year=2024&Month=9&Day=29&selRowPerPage=25.
Government of Canada, 2025, Daily water level graph for Osoyoos Lake near Oroville (08NM073) [BC]: Government of Canada—Environment and natural resources web page, accessed June 3, 2025, at https://wateroffice.ec.gc.ca/report/historical_e.html?stn=08NM073&dataType=Daily¶meterType=Level&first_year=1928&last_year=2018&mode=Graph.
Gilbert, R., and Glew, J.R., 1986, A wind-driven ice-push event in eastern Lake Ontario: Journal of Great Lakes Research, v. 12, no. 4, p. 326–331, accessed September 25, 2025, at https://doi.org/10.1016/S0380-1330(86)71733-4.
Harnish, R.A., Sharma, R., McMichael, G.A., Langshaw, R.B., and Pearsons, T.N., 2014, Effect of hydroelectric dam operations on the freshwater productivity of a Columbia River fall Chinook salmon population: Canadian Journal of Fisheries and Aquatic Sciences, v. 71, no. 4, p. 602–615, accessed January 21, 2026, at https://doi.org/10.1139/cjfas-2013-0276.
Heggenes, J., Alfredsen, K., Bustos, A.A., Huusko, A., and Stickler, M., 2018, Be cool—A review of hydro-physical changes and fish responses in winter in hydropower-regulated northern streams: Environmental Biology of Fishes, v. 101, no. 1, p. 1–21, accessed September 30, 2024, at https://doi.org/10.1007/s10641-017-0677-z.
Huokuna, M., Morris, M., Beltaos, S., and Burrell, B.C., 2022, Ice in reservoirs and regulated rivers: International Journal of River Basin Management, v. 20, no. 1, p. 1–16, accessed September 9, 2024, at https://doi.org/10.1080/15715124.2020.1719120.
International Joint Commission [IJC], 2013, International Joint Commission—In the matter of the application of the State of Washington for approval to construct a control structure near the outlet of Osoyoos Lake—Supplementary order of approval—January 29, 2013: IJC supplementary order of approval, 8 p., accessed September 24, 2025, at https://ijc.org/sites/default/files/2018-08/Docket%20108%20Supplemental%20Order%202013-01-29.pdf.
Jolliffe, I.T. and Cadima, J., 2016, Principal component analysis—A review and recent developments: Philosophical transactions of the royal society A—Mathematical, Physical and Engineering Sciences, v. 374, no. 2065, article 20150202, accessed June 16, 2025, at https://doi.org/10.1098/rsta.2015.0202.
Josephy, A., Tran, L., Rajagopalan, K., Helander, W., Barber, M., Beutel, M., Orr, C. and Moore, B., 2011, Effects of Zosel Dam water regulation on Osoyoos Lake water quality (study 4)—Final: State of Washington Water Research Center, Washington State University report, 41 p., accessed September 25, 2025, at www.ijc.org/sites/default/files/Study%204_Zosel%20Dam%20ops%20and%20Osoyoos%20Lake%20water%20quality_Final%2020110506.pdf.
National Centers for Environmental Information [NCEI], 2024a, Daily summaries station details—Oroville, WA US (GHCND:USC00456187): National Oceanic and Atmospheric Administration website, accessed September 12, 2024, at https://www.ncei.noaa.gov/cdo-web/datasets/GHCND/stations/GHCND:USC00456187/detail.
National Centers for Environmental Information [NCEI], 2024b, Daily summaries station details—Oroville 3 NW, WA US (GHCND:USC00456188): National Oceanic and Atmospheric Administration website, accessed September 12, 2024, at https://www.ncei.noaa.gov/cdo-web/datasets/GHCND/stations/GHCND:USC00456188/detail.
Oksanen, J., Simpson, G.L., Blanchet, F.G., Kindt, R., Legendre, P., Minchin, P.R., O'Hara, R.B., Solymos, P., Stevens, M.H.H., Szoecs, E., Wagner, H., Barbour, M., Bedward, M., Bolker, B., Borcard, D., Carvalho, G., Chirico, M., De Caceres, M., Durand, S., Evangelista, H.B.A., FitzJohn, R., Friendly, M., Furneaux, B., Hannigan, G., Hill, M.O., Lahti, L., McGlinn, D., Ouellette, M.-H., Ribeiro Cunha, E., Smith, T., Stier, A., Ter Braak, C.J.F., Weedon, J., 2022, vegan—Community Ecology Package (version 2.6-4): Comprehensive R Archive Network website, accessed October 11, 2022, at https://CRAN.R-project.org/package=vegan.
R Core Team, 2024, R—A Language and Environment for Statistical Computing (version 4.4.1.): R Foundation for Statistical Computing, Vienna, Austria, accessed July 3, 2024, at https://www.R-project.org/.
Rokaya, P., Budhathoki, S., and Lindenschmidt, K.E., 2018, Trends in the timing and magnitude of ice-jam floods in Canada: Scientific Reports, v. 8, no. 1, article 5834, 9 p., accessed September 25, 2025, at https://doi.org/10.1038/s41598-018-24057-z.
Sinergise Solutions d.o.o., 2024, EO browser—Sentinel–2 satellite imagery: Sentinel Hub web application, accessed September 12, 2024, at https://apps.sentinel-hub.com/eo-browser.
Shapiro, S.S., and Wilk, M.B., 1965, An analysis of variance test for normality (complete samples): Biometrika, v. 52, no. 3-4, p. 591–611, accessed September 29, 2024, at https://doi.org/10.1093/biomet/52.3-4.591.
Washington State Department of Ecology, 2025, Zosel Dam history: Washington State Department of Ecology website, accessed June 13, 2025, at https://ecology.wa.gov/water-shorelines/water-supply/dams/info-for-the-public/dams-we-regulate/zosel-dam/zosel-dam-history.
U.S. Environmental Protection Agency [EPA], 2025, Climate change indicators in the United States (5th ed.): EPA report EPA 430–R–24–003, 91 p., accessed September 24, 2025, at https://www.epa.gov/climate-indicators/climate-change-indicators-united-states-fifth-edition.
U.S. Geological Survey [USGS], 2024a, USGS 12439500 Okanagan River at Oroville, WA: U.S. Geological Survey National Water Information System, accessed September 12, 2024, at https://waterdata.usgs.gov/nwis/uv?site_no=12439500&legacy=1.
U.S. Geological Survey [USGS], 2024b, USGS 12439000 Osoyoos Lake near Oroville, WA: U.S. Geological Survey National Water Information System, accessed September 12, 2024, at https://waterdata.usgs.gov/nwis/uv?site_no=12439000&legacy=1.
U.S. Geological Survey [USGS], 2024c, USGS 12442500 Similkameen River near Nighthawk: U.S. Geological Survey National Water Information System, accessed September 12, 2024, at https://waterdata.usgs.gov/nwis/uv?site_no=12442500&legacy=1.
U.S. Geological Survey [USGS], 2024d, Landsat 8/9 operational land imager/thermal infrared sensor level–1, collection 2 [dataset]: U.S. Geological Survey dataset, accessed September 12, 2024, from https://doi.org/10.5066/P975CC9B.
White, K.D., 1996, Predicting breakup ice jams using logistic regression: Journal of Cold Regions Engineering, v. 10, no. 4, p. 178–189, accessed June 30, 2025, at https://doi.org/10.1061/(ASCE)0887-381X(1996)10:4(178).
White, K.D., 2003, Review of prediction methods for breakup ice jams: Canadian Journal of Civil Engineering, v. 30, no. 1, p. 89–100, accessed June 30, 2025, at https://doi.org/10.1139/l02-047.
Zhao, S., Zhang, B., Yang, J., Zhou, J. and Xu, Y., 2024, Linear discriminant analysis: Nature Reviews Methods Primers, v. 4, no. 1, 51 p., accessed September 26, 2024, at https://www.nature.com/articles/s43586-024-00346-y.
Appendix 1. Data Source Information
Data Sources
This appendix contains a table of data sources used for the analysis presented (table 1.1), a table of identification numbers and dates for satellite imagery used for the analysis from Landsat 1 (U.S. Geological Survey [USGS], 2020), Landsat 8 (Sinergise Solutions d.o.o., 2024a), and Sentinel–2 (Sinergise Solutions d.o.o., 2024b) from February 11, 2013–March 31, 2024 (table 1.2), and satellite images cropped to the study area (figs. 1.1–1.19). These images were selected out of all available images because Osoyoos Lake was not completely concealed by cloud cover. The images were used to cross-reference known ice jams that occurred during the same period and were identified by the algorithm used in this report to detect ice jams from changes in discharge, lake level, and air temperature. An additional image with some ice-jam accumulation at the outlet of Osoyoos Lake, retrieved from Landsat 1 (U.S. Geological Survey [USGS], 2020), is also provided as an example of coarser-resolution imagery from before 2013. Images are presented in chronological order.
Table 1.1.
Eleven data sources used for the analysis, including discharge, water temperature, lake level, air temperature, wind speed, wind direction, and satellite imagery including the operating agency, identification number, and the available start and end date for each record shown in figure 2.[Actual date ranges for data used in this study from each source are included in table 1. USGS, U.S. Geological Survey; Wash., Washington; NW, northwest; NCEI, National Centers for Environmental Information]
| Source or station name | Parameter | Operating agency | Product or Station ID | Record start date | Record end date | Source Citation |
|---|---|---|---|---|---|---|
| Okanagan River at Oroville, Wash. | Discharge | USGS | USGS 12439500 | October 1, 1942 | March 31, 2024 | USGS, 2024a |
| Okanagan River at Oroville, Wash. | Water temperature | USGS | USGS 12439500 | March 30, 2005 | March 31, 2024 | USGS, 2024a |
| Osoyoos Lake near Oroville, Wash. | Water temperature | USGS | USGS 12439000 | October 17, 2012 | March 31, 2024 | USGS, 2024b |
| Osoyoos Lake near Oroville, Wash. | Lake level (gage height) | USGS | USGS 12439000 | October 1, 1942 | March 31, 2024 | USGS, 2024b |
| Osoyoos Lake near Oroville, Wash. | Lake level (gage height) | Government of Canada | 08NM073 | July 28, 1928 | September 30, 1942 | Government of Canada, 2025 |
| Osoyoos West | Air temperature | Government of Canada | 1125865 | April 1, 1967 | September 15, 2009 | Government of Canada, 2024b |
| Osoyoos CS | Air temperature | Government of Canada | 1125825 | August 1, 1990 | March 31, 2024 | Government of Canada, 2024a |
| Oroville 3 NW | Air temperature | National Centers for Environmental Information | USC00456188 | October 1, 1942 | May 3, 1960 | NCEI, 2024b |
| Oroville | Air temperature | National Centers for Environmental Information | USC00456187 | May 1, 1960 | February 28, 1970 | NCEI, 2024a |
| Osoyoos CS | Wind speed, wind direction | Government of Canada | 1125825 | February 1, 1994 | March 31, 2024 | Government of Canada, 2024a |
| Copernicus Sentinel | Satellite imagery | European Space Agency | Various (refer to table 1.2) | February 11, 2013 | March 31, 2024 | Refer to table 1.2 and figures 1.1–1.19. |
Table 1.2.
A list of 19 satellite images is provided in the appendix and in the report, including the appendix figure number, product identification name, sensing time, platform name, and instrument sensor name.[Figure 1.1 is from Landsat 1 (U.S. Geological Survey [USGS], 2020), figure 1.12 is from Landsat 8 (Sinergise Solutions d.o.o., 2024a), and figures 1.2–1.11–figures 1.13–1.19 are from Sentinel–2 (Sinergise Solutions d.o.o., 2024b). The acquisition date-time is presented as given with the data. NA, not applicable; MSI, multispectral instrument; OLI–TIRS, operational land imager–thermal infrared sensor]
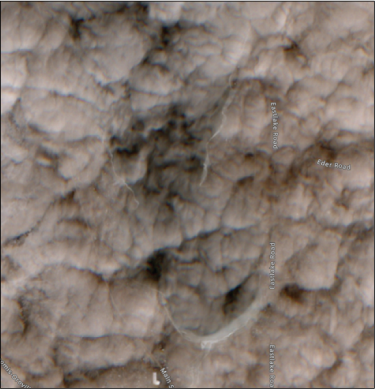
Landsat 1 satellite photograph from January 6, 1973. An example of coarser-resolution satellite imagery from Landsat 1 (U.S. Geological Survey, 2020) before the increased resolution that coincided with Landsat 8 in 2013. Some ice accumulation near the outlet of Lake Osoyoos can be seen in this image, but resolution is limited. The algorithm used in this report does not indicate that an ice jam occurred during this time.
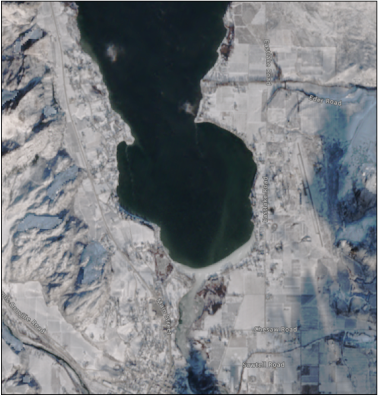
Sentinel–2 satellite photograph from February 2, 2017. An unusual ice formation is visible. Linear features may be wind-blown accumulations of snow on ice fractures (Sinergise Solutions d.o.o., 2024b).
Sentinel–2 satellite photograph from January 25, 2018. An ice sheet formed on the lake approximately 3 weeks prior to the ice jam depicted in figure 4B (Sinergise Solutions d.o.o., 2024b).
Sentinel–2 satellite photograph from February 12, 2018. Ice jam identified in the “Results” section (Sinergise Solutions d.o.o., 2024b).
Sentinel–2 satellite photograph from February 7, 2019. Ice formation associated with the ice jam identified in the discharge data on February 5, 2019 (Sinergise Solutions d.o.o., 2024b).
Sentinel–2 satellite photograph from February 2, 2020. This is the beginning of an ice formation and breakup sequence in February 2020 that did not cause an ice jam (Sinergise Solutions d.o.o., 2024b).
Sentinel–2 satellite photograph from February 12, 2020 (Sinergise Solutions d.o.o., 2024b).
Sentinel–2 satellite photograph from February 19, 2020 (Sinergise Solutions d.o.o., 2024b).
Sentinel–2 satellite photograph from February 29, 2020 (Sinergise Solutions d.o.o., 2024b).
Sentinel–2 satellite photograph from February 11, 2021. Ice in the lake outlet is causing the ice jam identified in the discharge data on February 12, 2021.Clouds partially block this view of the lake (Sinergise Solutions d.o.o., 2024b).
Sentinel–2 satellite photograph from February 23, 2021 (Sinergise Solutions d.o.o., 2024b).
Landsat 8 satellite photograph from February 24, 2021. Ice accumulation also occurs upstream of the Osoyoos Trestle Bridge, near the top of the figure (Sinergise Solutions d.o.o., 2024a).
Sentinel–2 satellite photograph from March 3, 2021 (Sinergise Solutions d.o.o., 2024b).
Sentinel–2 satellite photograph from February 8, 2022 (Sinergise Solutions d.o.o., 2024b).
Sentinel–2 satellite photograph from February 11, 2022 (Sinergise Solutions d.o.o., 2024b).
Sentinel–2 satellite photograph from February 18, 2022 (Sinergise Solutions d.o.o., 2024b).
Sentinel–2 satellite photograph from March 5, 2022 (Sinergise Solutions d.o.o., 2024b).
Sentinel–2 satellite photograph from December 15, 2022 (Sinergise Solutions d.o.o., 2024b).
Sentinel–2 satellite photograph from January 12, 2024. Ice jam identified by the algorithm and mentioned in the “Results” section (Sinergise Solutions d.o.o., 2024b).
References Cited
Government of Canada, 2024a, Osoyoos CS—Historical data: Government of Canada—Environment and natural resources web page, accessed September 17, 2024, at https://climate.weather.gc.ca/historical_data/search_historic_data_stations_e.html?searchType=stnName&timeframe=1&txtStationName=Osoyoos+CS&searchMeth od=contains&optLimit=yearRange&StartYear=1840&EndYear=2024&Year=2024&Month=9&Day=30&selRowPerPage=25.
Government of Canada, 2024b. Osoyoos West—Historical Data: Government of Canada—Environment and natural resources web page, accessed September 17, 2024, at https://climate.weather.gc.ca/historical_data/search_historic_data_stations_e.html?searchType=stnName&timeframe=1&txtStationName=Osoyoos+West&searchMe thod=contains&optLimit=yearRange&StartYear=1840&EndYear=2024&Year=2024&Month=9&Day=29&selRowPerPage=25.
Government of Canada, 2025, Daily water level graph for Osoyoos Lake near Oroville (08NM073) [BC]: Government of Canada—Environment and natural resources web page, accessed June 3, 2025, at https://wateroffice.ec.gc.ca/report/historical_e.html?stn=08NM073&dataType=Daily¶meterType=Level&first_year=1928&last_year=2018&mode=Graph.
National Centers for Environmental Information [NCEI], 2024a, Daily summaries station details—Oroville, WA US (GHCND:USC00456187): National Oceanic and Atmospheric Administration website, accessed September 12, 2024, at https://www.ncei.noaa.gov/cdo-web/datasets/GHCND/stations/GHCND:USC00456187/detail.
National Centers for Environmental Information [NCEI], 2024b, Daily summaries station details—Oroville 3 NW, WA US (GHCND:USC00456188): National Oceanic and Atmospheric Administration website, accessed September 12, 2024, at https://www.ncei.noaa.gov/cdo-web/datasets/GHCND/stations/GHCND:USC00456188/detail.
Sinergise Solutions d.o.o., 2024a, EO browser—Landsat 8–9 satellite imagery: Sentinel Hub web application, accessed September 12, 2024, at https://apps.sentinel-hub.com/eo-browser.
Sinergise Solutions d.o.o., 2024b, EO browser—Sentinel–2 satellite imagery: Sentinel Hub web application, accessed September 12, 2024, at https://apps.sentinel-hub.com/eo-browser.
U.S. Geological Survey [USGS], 2020, Landsat 1–5 multispectral scanner level–1, collection 2 [dataset]: U.S. Geological Survey dataset, accessed September 12, 2024, at https://doi.org/10.5066/P9AF14YV.
U.S. Geological Survey [USGS], 2024a, USGS 12439500 Okanagan River at Oroville, WA: U.S. Geological Survey National Water Information System, accessed September 12, 2024, at https://waterdata.usgs.gov/nwis/uv?site_no=12439500&legacy=1.
U.S. Geological Survey [USGS], 2024b, USGS 12439000 Osoyoos Lake near Oroville, WA: U.S. Geological Survey National Water Information System, accessed September 12, 2024, at https://waterdata.usgs.gov/nwis/uv?site_no=12439000&legacy=1.
Conversion Factors
Datums
Horizontal coordinate information is referenced to the North American Datum of 1983 (NAD 83).
Vertical coordinate information is referenced to the National Geodetic Vertical Datum of 1929 (NGVD 29).
Abbreviations
°C
degree Celsius
cm
centimeter
ECCC
Environment and Climate Change Canada
EPA
[U.S.] Environmental Protection Agency
IJC
International Joint Commission
km
kilometer
km/h
kilometer per hour
LDA
linear discriminant analysis
m
meter
m3/s
cubic meter per second
NAD 27
North American Datum of 1927
NAD 83
North American Datum of 1983
NCEI
National Centers for Environmental Information
NGVD 29
National Geodetic Vertical Datum of 1929
OLO–WA
Osoyoos Lake near Oroville, Washington, U.S. Geological Survey (USGS) gaging station (USGS 12439000)
ORO–WA
Okanogan River at Oroville, Washington, U.S. Geological Survey (USGS) gaging station (USGS 12439500)
p
probability value
PCA
principal component analysis
RMSE
root mean square error
rs
Spearman correlation
USGS
U.S. Geological Survey
Wash.
Washington
Publishing support provided by the Science Publishing Network,
Reston and Tacoma Publishing Service Centers
For more information about this publication, contact:
Director, Washington Water Science Center
934 Broadway
Suite 300
Tacoma, WA 98402
https://www.usgs.gov/centers/washington-water-science-center
Disclaimers
Any use of trade, firm, or product names is for descriptive purposes only and does not imply endorsement by the U.S. Government.
Although this information product, for the most part, is in the public domain, it also may contain copyrighted materials as noted in the text. Permission to reproduce copyrighted items must be secured from the copyright owner.
Suggested Citation
Sutfin, N.A., and Breen, S.J., 2026, Historical ice jams and associated environmental conditions on Osoyoos Lake: U.S. Geological Survey Scientific Investigations Report 2026–5003, 38 p., https://doi.org/10.3133/sir20265003.
ISSN: 2328-0328 (online)
Study Area
| Publication type | Report |
|---|---|
| Publication Subtype | USGS Numbered Series |
| Title | Historical ice jams and associated environmental conditions on Osoyoos Lake |
| Series title | Scientific Investigations Report |
| Series number | 2026-5003 |
| DOI | 10.3133/sir20265003 |
| Publication Date | April 16, 2026 |
| Year Published | 2026 |
| Language | English |
| Publisher | U.S. Geological Survey |
| Publisher location | Reston, VA |
| Contributing office(s) | Washington Water Science Center |
| Description | vii, 38 p. |
| Country | Canada, United States |
| State | British Columbia, Washington |
| Other Geospatial | Osoyoos Lake |
| Online Only (Y/N) | Y |
| Additional Online Files (Y/N) | N |