

Magnitude and Frequency of Peak and Low Flows in the Elkhorn River Basin, Nebraska, 1881–2022
Links
- Document: Report (6.3 MB pdf) , HTML , XML
- Table: Tables 1.1 and 1.2 (csv)
- Data Release: USGS data release - Data in support of flow frequency report—Magnitude and frequency of peak and low flows in the Elkhorn River Basin, Nebraska, 1881–2022
- NGMDB Index Page: National Geologic Map Database Index Page (html)
- Download citation as: RIS | Dublin Core
Abstract
Flood-frequency analysis is based on records of annual maximum instantaneous flows observed at long-term streamgages with 10 years or more of operation. Since the last flood-frequency analysis in Nebraska, an additional 30 years of annual peak-flow data have become available, and new flood-frequency analysis techniques have been developed. Moreover, the Elkhorn River Basin in north-central and eastern Nebraska has experienced two of the three highest magnitude floods on record in 2010 and 2019. The U.S. Geological Survey, in cooperation with the Nebraska Department of Transportation, analyzed flow frequency at streamgages in the Elkhorn River Basin in Nebraska.
Flow data from the U.S. Geological Survey and the Nebraska Department of Water, Energy, and Environment annual hydrographic reports were utilized to analyze peak flows. The Peak flow FreQuency (PeakFQ) software was used to perform a flood-frequency and nonstationarity analysis on the selected streamgages in the Elkhorn River Basin in Nebraska. Results of the peak-flow nonstationarity analysis indicate that, of the 23 streamgages analyzed for peak-flow frequency, 4 showed trends that were likely increasing for annual peak flows, whereas 3 indicated trends that were somewhat likely to be increasing. For 11 streamgages, the trend was categorized as about as likely as not, meaning there is less than a 70-percent chance of the trend being either upward or downward. Additionally, 2 streamgages exhibited trends that were somewhat likely to be decreasing, and 3 streamgages showed trends that were likely decreasing.
Low-flow streamflows and nonstationarity in the Elkhorn River Basin were analyzed for low flow periods representing the 1-day, 7-day, and 30-day flows at 21 streamgages using the Hydrologic Toolbox software. Spatially, the nonstationarity analysis results indicated likely increasing or somewhat increasing trend likelihoods for the 1-day, 7-day, and 30-day low flows for many of the Elkhorn streamgages downstream from the Elkhorn River at Ewing, Nebr., streamgage (U.S. Geological Survey station 06797500) and on eastern tributaries during the period of record.
Introduction
Reliable estimates of the magnitude and frequency of peak flows are essential for a variety of purposes. They are important for flood inundation studies, floodplain regulations, and the planning and design of infrastructure, including buildings, roads, bridges, and culverts. Additionally, these estimates are necessary for the design of flood-control structures like dams and levees. Flood-frequency analysis is based on records of the annual maximum instantaneous flows observed at long-term streamgages with 10 years or more of operation (England and others, 2018). Flood-frequency estimates are typically updated every 5 to 10 years by U.S. Geological Survey (USGS) Water Science Centers based on the needs of Federal, State, and local agencies, as well as stakeholders and funding availability. Flood-frequency estimates rely upon the long-term collection of streamflow data at streamgages. Estimates of the magnitude and frequency of floods for streamgages with longer periods of record have been shown to have lower standard errors, or uncertainties, than streamgages with shorter records (Griffis and Stedinger, 2007). A Nebraska statewide update to flood-frequency estimates was last completed in 1999 and included annual peaks through the 1993 water year, where a water year is defined as the 12-month period from October 1 through the following September 30 and is designated by the calendar year in which it ends (Soenksen and others, 1999). Since the last flood-frequency analysis update in Nebraska, an additional 30 years of annual peak-flow data have become available, and new flood-frequency analysis techniques have been developed. Moreover, the Elkhorn River Basin in north-central and eastern Nebraska has experienced two of the three highest magnitude floods on record in 2010 and 2019. Accordingly, the USGS, in cooperation with the Nebraska Department of Transportation, initiated a flow frequency study for the Elkhorn River Basin in 2022.
Purpose and Scope
The purpose of this report is to present the methods used to estimate the magnitudes and frequencies of floods and the magnitudes and frequencies of low-flow periods for streamgages in the Elkhorn River Basin in Nebraska. The techniques described in this report were applied to annual peak-flow data through 2022 on 23 streamgages operated by the Nebraska Department of Water, Energy, and Environment (NeDWEE) or the USGS. Estimates of the magnitudes of floods at the 50-, 20-, 10-, 4-, 2-, 1-, 0.5-, and 0.2-percent chance exceedance levels are presented in this report. In addition, the results for an analysis to estimate low flows for selected recurrence intervals at 21 streamgages in the Elkhorn River Basin are reported. Results of the analysis are available in a USGS data release (Strauch and Dietsch, 2026).
Previous Studies
Previous estimates of magnitudes and frequencies of floods in Nebraska were published by Furness (1955), Beckman and Hutchison (1962), and Beckman (1976). Beckman (1976) developed flood-frequency regionalized regression equations for five regions in Nebraska, and Cordes and Hotchkiss (1993) used methods described in Bulletin 17B of the Interagency Advisory Committee on Water Data (IACWD) (1982) to estimate the magnitudes and frequencies of floods through the 1991 water year and revised the regression relations developed by Beckman (1976). Soenksen and others (1999) estimated the magnitudes and frequencies of floods using peak flows through the 1993 water year and related peak flows for floods of selected recurrence intervals to basin characteristics derived from geographic information system (GIS) datasets. Strahm and Admiraal (2005) developed relations between peak-flow frequency estimates and basin characteristics derived from USGS digital elevation models and other GIS datasets.
Site Selection
This section of the report describes which streamgages within the Elkhorn River Basin were selected for inclusion in this peak-flow frequency analysis. In general, streamgages used for analysis were continuously operated, meaning stage readings are taken at regular intervals and regular discharge measurements are made to maintain the stage-discharge relations across the range of flows at the streamgage. The USGS has operated 13 of the streamgages included in this analysis for the complete duration of the period of record (table 1). For 7 of the streamgages, the USGS operated the streamgage until the NeDWEE took over operation of the streamgages at various years after the 1992 water year. The NeDWEE has operated the streamgage for the complete duration of the period of record at three streamgages.
In general, it is recommended that at least 10 years of streamflow records are used to estimate peak-flow frequency at streamgages and at least 10 years of record are used for estimation of low-flow frequencies (England and others, 2018). The period of record for streamgages selected for this study ranged from 1896 to 2023 (table 1).
Table 1.
Streamgages used for peak-flow and low-flow frequency analysis, Elkhorn River Basin, Nebraska (Nebraska Department of Water, Energy, and Environment, 2023; U.S. Geological Survey, 2023).[USGS, U.S. Geological Survey; NeDWEE, Nebraska Department of Water, Energy, and Environment]
Several modifications to the landscape have potential effects on surface water flows within the Elkhorn River Basin. Channel straightening followed by subsequent streambed adjustments (primarily degradation) have been found within the basin (Rus and others, 2003). Reservoir and small impoundments have been constructed within the basin since the early 1900s and have the potential to change the timing of flows by reducing peak flows and increasing low flows. Tile drains, commonly installed to increase subsurface drainage, also are present within the Elkhorn River Basin and often return flows to surface waters.
Approximately 123 reservoirs and small impoundments have been documented within the Elkhorn River Basin (Nebraska Department of Water, Energy, and Environment, 2020). Many small impoundments have been installed with the primary purpose of providing water for irrigation or livestock but nonetheless provide some reduction in peak flows. The primary purpose of about one-half of the reservoirs is flood control, stormwater management, or erosion. Despite the presence of these reservoirs and impoundments, peak flows at main-stem streamgages on the Elkhorn River have been largely treated as “unregulated” (Soenksen and others, 1999) because of the small relative drainage area upstream from the reservoirs compared to the overall drainage area at each streamgage. Likewise, for the purposes of this report, peak-flow frequency analyses for streamgages in the Elkhorn River Basin area were also treated as unregulated, and special consideration was not given to periods before or after the installation of reservoirs or impoundments. The one exception was for the Willow Creek near Pierce, Nebr., streamgage (NeDWEE station 00232500; table 1), which was located directly downstream from the outlet of a reservoir, and the period of record began after the completion of the reservoir.
Statistical Methods
An analysis of flood frequency usually begins with the compilation of annual peak flows. Annual peak flows from streamgages within the Elkhorn River Basin with 10 or more years of data were compiled from the USGS National Water Information System (NWIS; U.S. Geological Survey, 2023) and from annual hydrographic reports (AHRs) of the NeDWEE (Nebraska Department of Water, Energy, and Environment, 2023). At the time of the analysis (2023), annual peak flows through water year 2022 were published in the USGS NWIS database and in the NeDWEE AHRs.
The first step in compiling data from the USGS NWIS database was to identify streamgages with sufficient annual peak-flow data. A query of the USGS NWIS database and NeDWEE AHRs produced a list of 23 streamgages with 10 or more years of annual peak-flow data (fig. 1). The annual peak-flow data for each streamgage with 10 or more years of record were retrieved in a file format compatible with peak-flow frequency analysis software. Annual peak flows listed in the USGS NWIS database are often accompanied by codes that provide additional information about each peak. For example, an annual peak flow may be accompanied by a discharge code that indicates if the peak is an estimate, if the discharge was affected by regulation, or if the discharge was a historical peak occurring before the systematic record of annual peak flows. These codes can be used to aid in the interpretation of the peak-flow data and the treatment of the data in peak-flow frequency analysis. The annual peak flows and discharge codes were reviewed for quality assurance and quality control. A nonstationarity analysis was also performed, which verifies if there are significant changes in the statistical properties of the peak flows during the period of record.
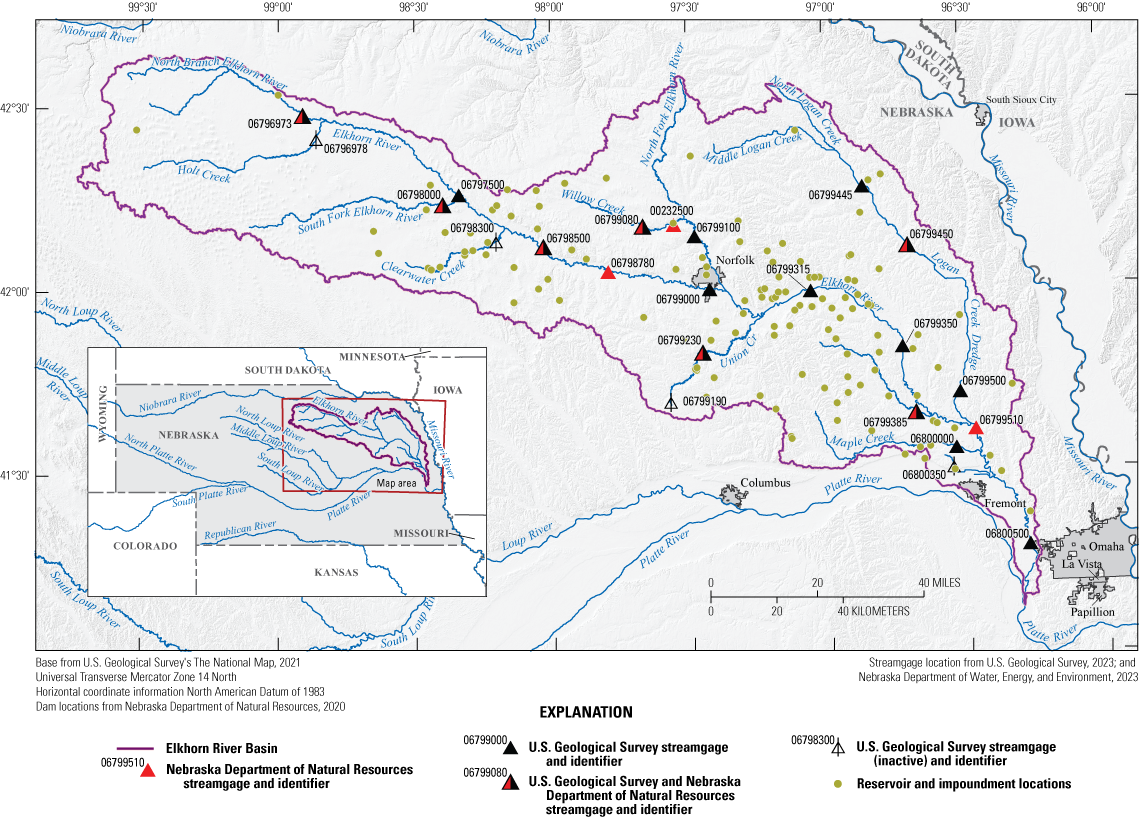
Map showing locations of 23 streamgages used in the flow frequency analysis in the Elkhorn River Basin, Nebraska.
Annual peak flows for streamgages operated by NeDWEE typically are available from the USGS NWIS database for water years through 1993 (U.S. Geological Survey, 2023), but few annual peak flows are available from the database for subsequent water years. To use the data from NeDWEE streamgages (Nebraska Department of Water, Energy, and Environment, 2023), the annual peak flows needed to be compiled from published sources and reformatted into a format compatible with annual peak-flow data from the USGS NWIS database. Annual peak flows after 1993 for NeDWEE streamgages were extracted from AHRs published from 1994 through 2022. The annual peak-flow data from the NeDWEE AHRs were aggregated by streamgage and reformatted to a fixed column format compatible with peak-flow frequency analysis software. Annual peak flows for NeDWEE streamgages were merged with data from the USGS NWIS database from 1993 or earlier to produce combined datasets. The combined datasets were reviewed, and the USGS discharge codes were associated with each peak from the NeDWEE streamgages when needed.
Annual peak flows can be used to estimate magnitudes and frequencies of floods at the specific location of the streamgage. In general, longer periods of annual peak-flow records yield better estimates of flood magnitudes and frequencies because they provide a larger sample to fit to statistical distributions. For this reason, only streamgages with 10 or more years of record were included in the analysis. Flood estimates are described in probabilistic terms, such as the 1-percent annual exceedance probability (AEP). A flood estimate for the 1-percent AEP (formerly called a “100-year flood”) describes a flood magnitude that has a 0.01 probability of occurring in any given year at the indicated station (that is, a 1-percent AEP has 1 in 100 chance of occurring or being exceeded in any given year). Percentage of annual exceedance probability terminology is preferred instead of descriptions such as the “100-year flood” because this reduces possible misconceptions about flood-frequency estimates (U.S. Geological Survey, 2025).
The methods used to estimate peak-flow frequencies at streamgages were based on the techniques described in Bulletin 17B (IACWD, 1982) and its successor document “Guidelines for determining flood flow frequency—Bulletin 17C” (hereafter referred to as “Bulletin 17C”; England and others, 2018). Bulletin 17C documents methods for improving skew estimates using regional skew values, tests for outliers, adjustments for low outliers and zero flows, and procedures for incorporating historical flood information. The following sections describe the methods to estimate the magnitudes and frequencies of floods in the Elkhorn River Basin.
Log-Pearson Type III Distribution
Flood frequencies for streamgages are computed by fitting annual peak-flow data to statistical distributions. A widely used method for computing flood frequencies in the United States involves fitting data to the log-Pearson type III (LP3) distribution. Bulletin 17B describes methods to fit annual peak flows to an LP3 distribution based on three parameters—mean, standard deviation, and a skew coefficient—derived from logarithms (base 10) of annual peak flows to estimate flood magnitudes (IACWD, 1982). The following equation shows the relation between the probability of floods and the three parameters:
whereQp
is the p-percent chance of exceedance flow, in cubic feet per second;
X
is the mean of the logarithm of the annual peak flows;
Kp
is a factor based on the weighted skew coefficient and the p-percent chance, which can be obtained from appendix 3 in Bulletin 17B (IACWD, 1982); and
S
is the standard deviation of the logarithms annual peak flows, which is a measure of the degree of variation in the annual peak-flow values about the mean.
The mean, standard deviation, and coefficient of skewness can be directly computed from the logarithms of annual peak-flow data. The coefficient of skewness for an annual peak-flow dataset is needed to determine the frequency factor Kp, which is obtained from appendix 3 of Bulletin 17B (IACWD, 1982).
Skew Coefficient
The skew coefficient describes the asymmetry of a probability distribution about its mean. Computations of the skew coefficient can be affected by sample size, and small sample sizes result in higher uncertainty in the skew. Bulletin 17C recommends the use of a weighted skew derived from at-site data (station skew) and a generalized skew value to compensate for the uncertain estimates of skew related to insufficient samples sizes (England and others, 2018). The weighted skew is computed with the following equation:
whereGW
is the weighted skew value,
MSEG
is the mean squared error of the generalized skew,
GS
is coefficient of skew derived from the station data,
MSEGS
is the mean squared error of the station skew, and
is a generalized skew coefficient.
The generalized or regional skew coefficient is determined from an analysis of long-term streamgages within a study area. A map of generalized skew coefficients originally published in 1976 for the United States is available in plate 1 of Bulletin 17B; however, this map was based on an analysis of relatively few streamgages with minimal treatment of low outliers and high outliers, no adjustments for historical data, and no detailed evaluation of individual frequency curves (IACWD, 1982; Stedinger and Griffis, 2008). A more recent statewide map of generalized skew coefficients has been developed for drainage basins with relatively low-permeability soil in Nebraska by Soenksen and others (1999). The map was based on analysis of 224 streamgages in Nebraska and surrounding States using the methodology of Bulletin 17B (IACWD, 1982). For streamgages in basins with high-permeability soils (defined as average soil permeability greater than 2.5 inches per hour), an equation is presented for computing a generalized skew value (Soenksen and others, 1999).
The station skew for streamgages on unregulated reaches was weighted with a generalized skew coefficient derived from the statewide skew-isoline map produced by Soenksen and others (1999). The generalized skew was not used to weight the skew at the Willow Creek near Pierce, Nebr., streamgage (NeDWEE station 00232500) because it is affected by regulation; rather, the station skew was used.
Multiple Grubbs-Beck Test
The Grubbs-Beck test (Grubbs and Beck, 1972) is recommended by Bulletin 17B for the detection of low outliers in flood-frequency analysis (IACWD, 1982). In most annual peak-flow datasets, multiple low annual peaks may have excessive influence on the flood-frequency analysis. Cohn and others (2013) describe a generalization of the Grubbs-Beck method known as the “Multiple Grubbs-Beck test,” which allows for the identification of multiple potentially influential low flows (PILFs) using a standard procedure. The PILFs are defined as annual peak flows that meet three criteria: their magnitude is much smaller than the flood quantile of interest, they are present below a statistically significant break in the flood-frequency data plot, and they have excessive influence on the estimated frequency of large floods (Cohn and others, 2013). All values in the annual peak-flow series that are smaller than the flood identified as a PILF are also categorized as PILFs using this procedure. Bulletin 17C recommends the replacement of the Grubbs-Beck test with the more robust Multiple Grubbs-Beck test (England and others, 2018). Thus, the Multiple Grubbs-Beck test was used in the flood-frequency analysis of streamgages in the Elkhorn River Basin.
Expected Moments Algorithm
The Expected Moments Algorithm (EMA) method was used for the flood-frequency analysis of Nebraska streamgages (Cohn and others, 1997). The EMA method uses a similar approach to the recommendations of Bulletin 17B to fit the LP3 distribution to the logarithms of the annual peak flows (IACWD, 1982). The Bulletin 17B and EMA procedures yield identical results when no historic data from before the initiation of the streamgage, missing periods, or low outliers are present (Cohn and others, 1997). The EMA method requires the computation of mean, standard deviation, and skew of the log-transformed annual peak discharges (Cohn and others, 1997). The EMA procedure differs from the Bulletin 17B in the treatment of uncertain data, historical data, low outliers, and missing periods (IACWD, 1982; Cohn and others, 1997). For historical and missing periods, the EMA method uses censoring to deal with unknown peaks above or below thresholds (Cohn and others, 1997). When using the EMA method, the analyst assigns perception thresholds that describe the upper and lower bounds of the unknown or missing peaks to the gaps in the systematic record and periods between historical floods (Veilleux and others, 2014). In many cases, it is assumed that the upper perception threshold in a gap in the historical period is equal to the previous historical flood; that is, the unrecorded peaks were assumed to be lower than prior flooding events, and if the flood was regarded as impactful, it would have prompted an action to document the flooding event. The EMA method also uses a different method than Bulletin 17B for computing uncertainty related to estimates of the magnitudes and frequencies of floods. Cohn and others (2001) describe analytic expression that can be used to compute the confidence intervals for EMA estimates. The use of the EMA method is included in the recommendations in Bulletin 17C (England and others, 2018).
PeakFQ
The Peak flow FreQuency (PeakFQ) analysis software (Veilleux and others, 2014; U.S. Geological Survey, 2022) can implement the procedures of Bulletin 17B or Bulletin 17C including EMA procedures for flood-frequency analysis of streamflow records (Veilleux and others, 2014; England and others, 2018). The Multiple Grubbs-Beck test has also been implemented in PeakFQ and can be used with the standard Bulletin 17B procedures or with the Bulletin 17C EMA analysis (Veilleux and others, 2014).
The PeakFQ software was used to analyze flood frequency on the selected streamgages in the Elkhorn River Basin in Nebraska. The Multiple Grubbs-Beck test was used in PeakFQ to detect low outliers, and historic peaks were used when available. The weighted skew option was used for streamgages with annual peak flows unaffected by regulation. For the Willow Creek near Pierce, Nebr., streamgage (NeDWEE station 00232500), the station skew option was selected because that streamgage is affected by regulation, regulated peaks were used, and the beginning year was changed to the year corresponding to the water year of the first annual peak flow affected by regulation.
Low-Flow Statistics
In addition to examining peak flows, low flows were estimated for selected recurrence intervals at 21 streamgages in the Elkhorn River Basin. In contrast to peak flows for which the maximum effects often transpire upon the occurrence of the peak instantaneous flow, the greatest effects of low-flow extremes usually occur over days or weeks. Consecutive periods of daily flow are averaged over n days to create n-day flow time series for each year of record for any given streamgage. For example, the 7-day flow time series represents an average of daily flows during each 7-day period in a given streamflow record; therefore, the minimum 7-day flow for a given year represents the driest 7-day period during that year.
Time series representing the 1-day, 7-day, and 30-day flows were created for each climate year and streamgage used in this study. The values of n for the n-day flows were selected to include short duration low-flow periods (1-day flows), long duration low-flow periods (30-day flows), and durations important to regulatory standards (7-day flows) (U.S. Environmental Protection Agency, 2023). Because low-flow periods can often span water years that end in September and begin in October, it is common practice to summarize n-day flows by climate year, which is defined as the period from April 1 to March 30 and is named for the calendar year in which it ends (Kiang and others, 2018). The year associated with a computed n-day annual value is the calendar year.
Similar to peak-flow frequency analysis, the n-day time series are fit to the LP3 distribution to determine annual exceedance probability of low-flow magnitudes (Kiang and others, 2018). When used for low flows, the n-day frequency analysis is used to estimate the probability that flow will not exceed different flow levels in any given year. For example, the 7Q10 is the 7-day minimum flow that on average is not exceeded only once every 10 years. Specific low-flow frequency statistics are denoted using the xQy nomenclature, where x is the number of days over which flows are averaged, and y is the recurrence interval in years. Daily streamflow values were obtained from the NWIS database (U.S. Geological Survey, 2023) and the NeDWEE streamflow database (Nebraska Department of Water, Energy, and Environment, 2023), and the Hydrologic Toolbox software was used to calculate the n-day time series and annual exceedance probability flows for the study (Barlow and others, 2022).
Nonstationarity Analysis
Bulletin 17C recommends testing peak-flow datasets for nonstationarity (temporal trends) (England and others, 2018). The PeakFQ computer program performs a Kendall’s Tau nonparametric trend test to evaluate the statistical significance of potential trends for annual peak flows. The Hydrologic Toolbox software was used to evaluate the statistical significance of potential trends in low flows. The PeakFQ and Hydrologic Toolbox software use the Kendall’s Tau non-parametric trend test.
When interpreting the statistical test for trends, a likelihood-based approach as proposed by Hirsch and others (2015) was used instead of reporting significant trends based on arbitrary cutoff values. The trend likelihood values are calculated using the probability values (p-values) from each test with the following formula: trend likelihood=1–(p-value/2). When the trend likelihood value is between 0.85 and 1.00, the trend is categorized as “likely increasing” or “likely decreasing” and indicates there is at least an 85-percent probability of the trend occurring in that direction. Alternatively, if the trend likelihood value is between 0.70 and 0.85, the trend is categorized as “somewhat likely increasing” or “somewhat likely decreasing” and indicates there is at least a 70- to 85-percent probability of the trend occurring in that direction. For likelihood values below 0.70, the trend is classified as “about as likely as not,” meaning there is less than a 70-percent chance of the trend being either upward or downward.
The likelihood method was used because relying exclusively on traditional hypothesis testing might create a misleading impression of no trend because the result of the hypothesis test is interpreted as lacking evidence for a trend, whereas the likelihood method provides further insight in indicating the plausible chance that a trend has occurred.
Tables presenting the nonstationarity results contain the p-value and slope for each test so that a more traditional interpretation of the trends can be made if desired. In previous studies a p-value of less than or equal to 0.05 was used to determine if a trend was significant (Dietsch and others, 2009; Dietsch and Strauch, 2020).
At-Station Flow Statistics in the Elkhorn River Basin
The results of the at-station flow statistics are described in this section of the report. The appendixes, tables, and input datasets are available in the associated USGS data release (Strauch and Dietsch, 2026).
Peak-Flow Frequency
Results of the peak-flow analysis using PeakFQ are shown (app. 1). The period of record, number of peaks used, and peak-flow magnitudes for each streamgage are listed in table 1.1. Generalized skew values and weighted skews are also shown. The 95-percent confidence limits for the EMA estimates also are presented. The estimates of flood magnitudes and frequencies in most cases were similar to those computed by Soenksen and others (1999).
The results of the flood-frequency analysis can be used to estimate the flood magnitudes and frequencies at streamgages in the study. Further analysis is needed at ungaged stations to provide estimates of magnitudes and frequencies of floods. Regression equations developed from basin characteristics derived from a GIS framework such as StreamStats (Ries and others, 2017) would aid in the estimation of magnitudes and frequencies of floods at ungaged stations.
Low-Flow Statistics Results
The recurrence interval and corresponding nonexceedance flow for the 1-day, 7-day, and 30-day low-flows are available for each station in table 1.2. The 95-percent confidence limits for each nonexceedance flow are also available in table 1.2. If input flow values contained “0” or censored flow values, a confidence interval could not be calculated, and that confidence limit is reported as “N/A” (Kiang and others, 2018). Estimates of the low flows ranged from 0 to 637.48 cubic feet per second (ft3/s), 0.016 to 747.6 ft3/s, and 0.212 to 924.47 ft3/s for the 1-, 7-, and 30-day low flows, respectively.
Nonstationarity Analysis Results
Results of the peak-flow nonstationarity analysis are shown in table 2 and figure 2. Of the 23 streamgages analyzed for peak-flow frequency, 4 showed trends that were likely increasing for annual peak flows, whereas 3 indicated trends that were somewhat likely increasing. For 11 streamgages, the trend was categorized as about as likely as not. Additionally, 2 streamgages exhibited trends that were somewhat likely decreasing, and 3 streamgages showed trends that were likely decreasing. Nonstationarity in peak flows may be caused by a single factor (flow regulation, land-use change, modifications to water infrastructure, or climate); however, nonstationarity is more likely the result of a combination of several anthropogenic influences (Vogel and others, 2011).
Table 2.
Peak-flow nonstationarity analysis for streamgages in the Elkhorn River Basin, Nebraska (Nebraska Department of Water, Energy, and Environment, 2023; U.S. Geological Survey, 2023; Strauch and Dietsch, 2026).[USGS, U.S. Geological Survey; NeDWEE, Nebraska Department of Water, Energy, and Environment; p-value, probability value; ft3/s/yr, cubic feet per second per year]
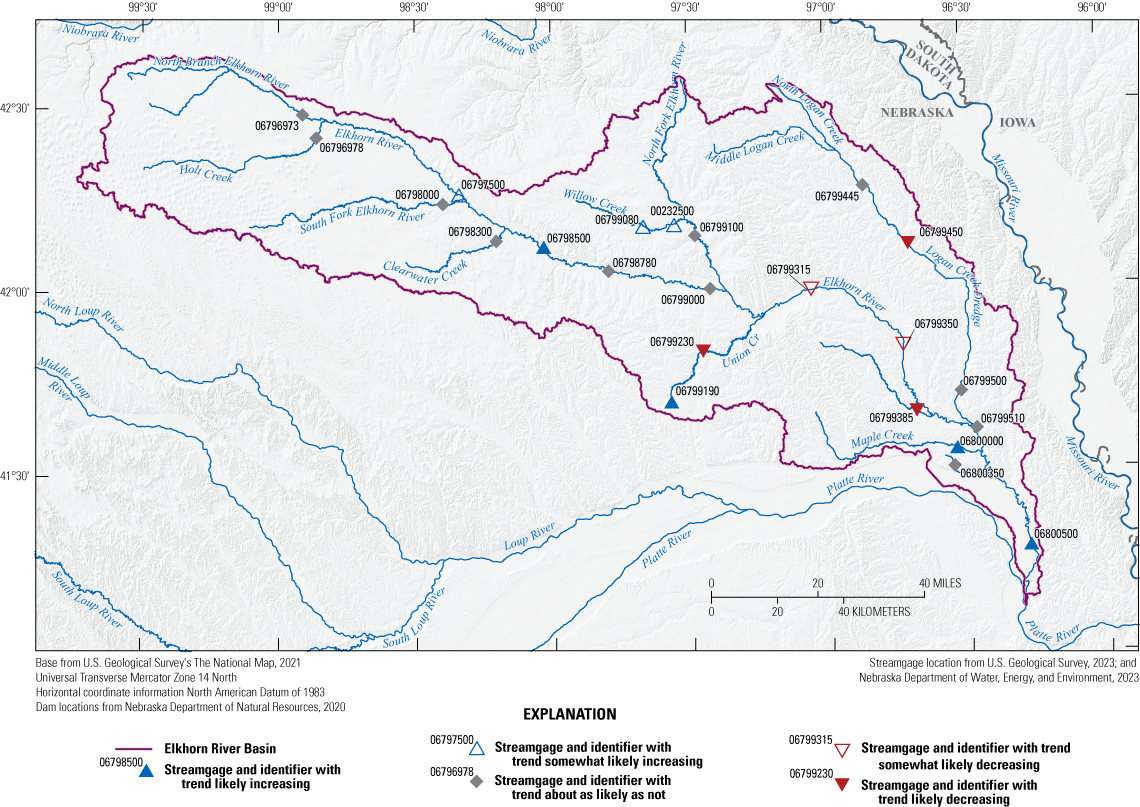
Location of streamgages and annual peak-flow trend likelihoods for period of records in the Elkhorn River Basin, Nebraska, 2022.
Results of the low-flow nonstationarity analysis for the 1-, 7-, and 30-day time series for 21 streamgages are shown in table 3 and figure 3. In the 1-day low-flow time series, 13 streamgages exhibited a trend likelihood categorized as likely increasing, 2 were identified as somewhat likely increasing, 5 were deemed about as likely as not, none showed trends that were somewhat likely decreasing, and 1 streamgage demonstrated a likely decreasing trend. In the 7-day low-flow time series, 13 streamgages exhibited a trend likelihood categorized as likely increasing, 4 were identified as somewhat likely increasing, 2 were deemed about as likely as not, 1 showed a somewhat likely decreasing trend, and 1 streamgage demonstrated a likely decreasing trend. Lastly, for the 30-day low-flow time series, 14 streamgages exhibited a trend likelihood categorized as likely increasing, 1 was identified as somewhat likely increasing, 4 were deemed about as likely as not, 1 showed a trend that was somewhat likely decreasing, and 1 streamgage demonstrated a likely decreasing trend. Spatially, the nonstationarity analysis results indicated likely increasing or somewhat increasing trend likelihoods for the 1-day, 7-day, and 30-day low-flows for many of the Elkhorn streamgages downstream from the Elkhorn River at Ewing, Nebr., streamgage (station number 06797500) and on eastern tributaries during the period of record (fig. 3). Although further analysis of the reasons for the increasing trends were outside the scope of the study, Dietsch and Strauch (2020) used streamflow data collected during 1961 through 2011 at Elkhorn River, Salt Creek, and Platte River Basin sites in Nebraska to determine that precipitation was not a significant factor in increasing streamflow trends and trends were more frequent in streamgages with a period of record that began before 1961. The only streamgage with a likelihood of likely decreasing for the 1-day, 7-day, and 30-day low flows was Willow Creek near Pierce, Nebr., streamgage (NeDWEE station 00232500), which is located immediately downstream from the outlet of a reservoir that was completed in 1984.
Table 3.
Low-flow nonstationarity analysis for streamgages in the Elkhorn River Basin, Nebraska (Nebraska Department of Water, Energy, and Environment, 2023; U.S. Geological Survey, 2023; Strauch and Dietsch, 2026).[Dates are in month/day/year format. ft3/s/yr, cubic foot per second per year; p-value, probability value; USGS, U.S. Geological Survey; NeDWEE, Nebraska Department of Water, Energy, and Environment]
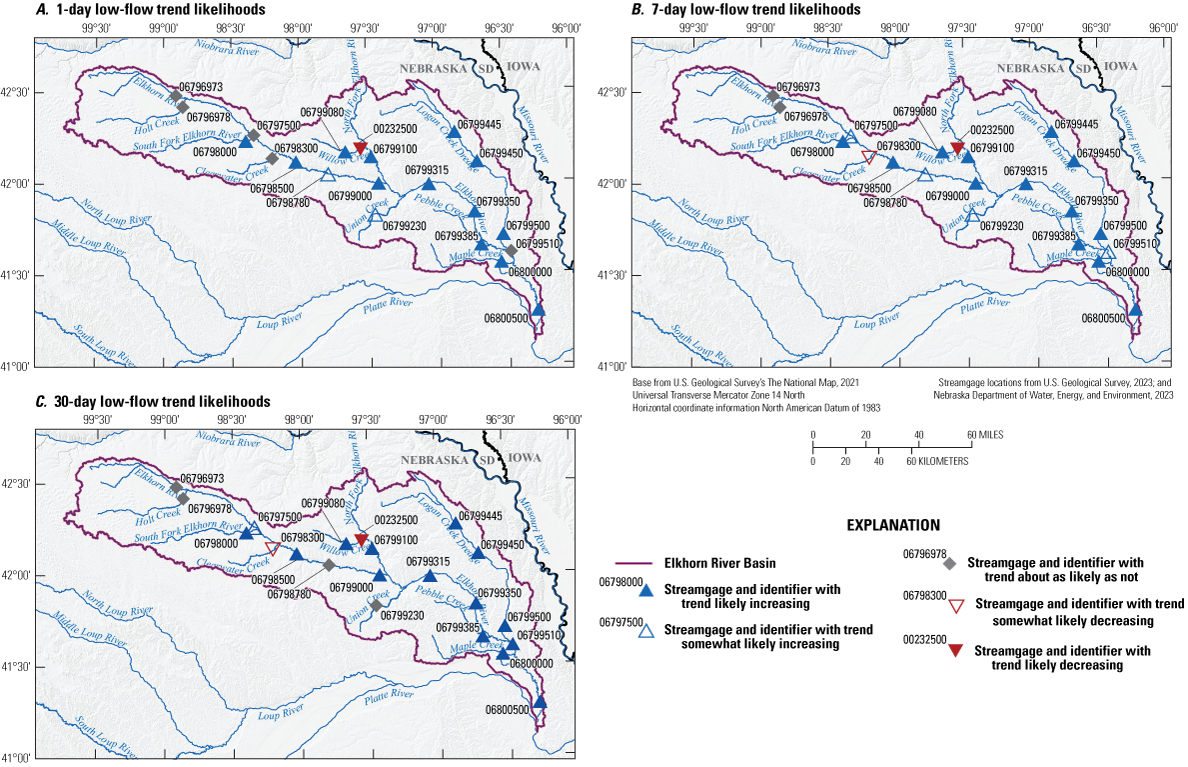
Location of streamgages and trend likelihoods for the streamgage period of record in the Elkhorn River Basin, Nebraska, 2022. A, 1-day low flows. B, 7-day low flows. C, 30-day low flows.
Summary
Flood-frequency analysis is based on records of the annual maximum instantaneous flows observed at long-term streamgages with 10 years or more of operation. Since the last flood-frequency analysis in Nebraska, an additional 30 years of annual peak-flow data have become available, and new flood-frequency analysis techniques have been developed. Moreover, the Elkhorn River Basin in north-central and eastern Nebraska has experienced two of the three highest magnitude floods on record in 2010 and 2019. Reliable estimates of the magnitude and frequency of peak flows are essential for a variety of purposes, including flood inundation studies; floodplain regulations; the planning and design of infrastructure such as buildings roads, bridges, and culverts; and for flood-control structures such as dams and levees. The U.S. Geological Survey, in cooperation with the Nebraska Department of Transportation, analyzed flow frequency at streamgages in the Elkhorn River Basin in Nebraska from 1881 to 2022. Annual peak flows from streamgages within the Elkhorn River Basin with 10 or more years of data were compiled from the U.S. Geological Survey National Water Information System and from annual hydrographic reports of the Nebraska Department of Water, Energy, and Environment. The Peak flow FreQuency (PeakFQ) analysis software was used to perform a flood-frequency analysis on the selected streamgages in the Elkhorn River Basin in Nebraska. The results of the flood-frequency analysis are useful for estimating the flood magnitudes and frequencies at streamgages in the study. Further analysis at ungaged stations could provide estimates of magnitudes and frequencies of floods.
In addition to examining peak flows, an analysis was done to estimate low flows for selected recurrence intervals at streamgages in the Elkhorn River Basin. Time series representing the 1-day, 7-day, and 30-day flows were created for each climate year and streamgage used in this study. Like peak-flow frequency analysis, statistical distributions are fit to n-day time series to determine the annual exceedance probability of low-flow magnitudes. The Hydrologic Toolbox software was used to calculate the n-day time series and annual exceedance probability flows for the study.
The PeakFQ analysis software performed a Kendall’s Tau nonparametric trend test to evaluate the statistical significance of potential nonstationarity or trends for annual peak flows. Results of the peak-flow nonstationarity analysis indicate that, of the 23 streamgages analyzed for peak-flow frequency, 4 showed trends that were likely increasing for annual peak flows, whereas 3 indicated trends that were somewhat likely increasing. For 11 streamgages, the trend was categorized as about as likely as not. Additionally, 2 streamgages exhibited trends that were somewhat likely decreasing, and 3 streamgages showed trends that were likely decreasing. The Hydrologic Toolbox software was used to evaluate the statistical significance of potential trends in low flows at 21 streamgages. Spatially the nonstationarity analysis results indicated likely increasing or somewhat increasing trend likelihoods for the 1-day, 7-day, and 30-day low flows for many of the Elkhorn River streamgages downstream from the Elkhorn River at Ewing, Nebraska, streamgage (U.S. Geological Survey station 06797500) and on eastern tributaries during the period of record.
References Cited
Barlow, P.M., McHugh, A.R., Kiang, J.E., Zhai, T., Hummel, P., Duda, P., and Hinz, S., 2022, U.S. Geological Survey Hydrologic Toolbox—A graphical and mapping interface for analysis of hydrologic data: U.S. Geological Survey Techniques and Methods, book 4, chap. D3, 23 p., accessed March 12, 2025, at https://doi.org/10.3133/tm4D3.
Beckman, E.W., 1976, Magnitude and frequency of floods in Nebraska: U.S. Geological Survey Water-Resources Investigations Report 76–109, 128 p. [Also available at https://doi.org/10.3133/wri76109.]
Beckman, E.W., and Hutchison, N.E., 1962, Floods in Nebraska on small drainage areas, magnitude and frequency: U.S. Geological Survey Circular 458, 33 p. [Also available at https://doi.org/10.3133/cir458.]
Cohn, T.A., Lane, W.L., and Stedinger, J.R., 2001, Confidence intervals for expected moments algorithm flood quantile estimates: Water Resources Research, v. 37, no. 6, p. 1695–1706, accessed March 12, 2025, at https://doi.org/10.1029/2001WR900016.
Cohn, T.A., England, J.F., Berenbrock, C.E., Mason, R.R., Stedinger, J.R., and Lamontagne, J.R., 2013, A generalized Grubbs-Beck test statistic for detecting multiple potentially influential low outliers in flood series: Water Resources Research, v. 49, no. 8, p. 5047–5058, accessed June 12, 2020, at https://doi.org/10.1002/wrcr.20392.
Cohn, T.A., Lane, W.L., and Baier, W.G., 1997, An algorithm for computing moments-based flood quantile estimates when historical flood information is available: Water Resources Research, v. 33, no. 9, p. 2089–2096, accessed June 12, 2020, at https://doi.org/10.1029/97WR01640.
Dietsch, B.J., Godberson, J.A., and Steele, G.V., 2009, Trends in streamflow characteristics of selected sites in the Elkhorn River, Salt Creek, and Lower Platte River basins, eastern Nebraska, 1928–2004, and evaluation of streamflows in relation to instream-flow criteria, 1953–2004: U.S. Geological Survey Scientific Investigations Report 2009–5011, 93 p., with appendixes. [Also available at https://doi.org/10.3133/sir20095011.]
Dietsch, B.J., and Strauch, K.R., 2020, Trends in streamflow and precipitation for selected sites in the Elkhorn River Basin and in streamflow in the Salt Creek and Platte River Basins, Nebraska, 1961–2011: U.S. Geological Survey Scientific Investigations Report 2020–5016, 20 p. [Also available at https://doi.org/10.3133/sir20205016.]
England, J.F., Jr., Cohn, T.A., Faber, B.A., Stedinger, J.R., Thomas, W.O., Jr., Veilleux, A.G., Kiang, J.E., and Mason, R.R., Jr., 2018, Guidelines for determining flood flow frequency—Bulletin 17C (ver. 1.1, May 2019): U.S. Geological Survey Techniques and Methods, book 4, chap. B5, 148 p., accessed June 13, 2020, at https://doi.org/10.3133/tm4B5.
Griffis, V.W., and Stedinger, J.R., 2007, Evolution of flood frequency analysis with Bulletin 17: Journal of Hydrologic Engineering, v. 12, no. 3, p. 283–297, accessed March 10, 2025 at https://doi.org/10.1061/(ASCE)1084-0699(2007)12:3(283).
Grubbs, F.E., and Beck, G., 1972, Extension of sample sizes and percentage points for significance tests of outlying observations: Technometrics, v. 14, no. 4, p. 847–854, accessed June 26, 2023, at https://doi.org/10.1080/00401706.1972.10488981.
Hirsch, R.M., Archfield, S.A., and De Cicco, L.A., 2015, A bootstrap method for estimating uncertainty of water quality trends: Environmental Modelling & Software, v. 73, p. 148–166 [Also available at https://doi.org/10.1016/j.envsoft.2015.07.017.]
Kiang, J.E., Flynn, K.M., Zhai, T., Hummel, P., and Granato, G., 2018, SWToolbox—A surface-water toolbox for statistical analysis of streamflow time series: U.S. Geological Survey Techniques and Methods, book 4, chap. A11, 33 p., accessed March 10, 2025, at https://doi.org/10.3133/tm4A11.
Nebraska Department of Water, Energy, and Environment, 2020, Nebraska dam inventory: accessed June 26, 2023, at https://www.nebraskamap.gov/datasets/06028e0343764fcb9370dc5a4bf53dc7_1/explore.
Nebraska Department of Water, Energy, and Environment, 2023, NeDWEE real time water database: accessed June 6, 2023, at https://nednr.aquaticinformatics.net/Data.
Ries, K.G., III, Newson J.K., Smith, M.J., Guthrie, J.D., Steeves, P.A., Haluska, T.L., Kolb, K.R., Thompson, R.F., Santoro, R.D., and Vraga, H.W., 2017, StreamStats, version 4: U.S. Geological Survey Fact 2017–3046, 4 p., accessed June 6, 2023, at https://doi.org/10.3133/fs20173046. [Supersedes U.S. Geological Survey Fact Sheet 2008–3067.]
Rus, D.L., Dietsch, B.J., and Simon, A., 2003, Streambed adjustment and channel widening in eastern Nebraska: U.S. Geological Survey Water-Resources Investigations Report 2003–4003, 63 p. [Also available at https://doi.org/10.3133/wri034003.]
Stedinger, J.R., and Griffis, V.W., 2008, Flood frequency analysis in the United States—Time to update: Journal of Hydrologic Engineering, v. 13, no. 4, p. 199–204, accessed June 6, 2023, at https://doi.org/10.1061/(ASCE)1084-0699(2008)13:4(199).
Strauch, K.R., and Dietsch, B.J., 2026, Data in support of flow frequency report—Magnitude and frequency of peak and low flows in the Elkhorn River Basin, Nebraska, 1881–2022: U.S. Geological Survey data release, https://doi.org/10.5066/P9SLKHD1.
U.S. Environmental Protection Agency, 2023, Low flow statistics tools—A how-to-handbook for NPDES permit writers (2d ed.): U.S. Environmental Protection Agency, accessed June 12, 2024, at https://www.epa.gov/system/files/documents/2023-01/low-flow-stats-tools-handbook-jan2023.pdf.
U.S. Geological Survey, 2022, PeakFQ flood frequency analysis version 7.4: accessed July 11, 2023, at https://www.usgs.gov/tools/peakfq.
U.S. Geological Survey, 2023, USGS water data for the Nation: U.S. Geological Survey National Water Information System database, accessed June 6, 2023, at https://doi.org/10.5066/F7P55KJN.
U.S. Geological Survey, 2025, Floods and recurrence intervals: U.S. Geological Survey webpage, accessed January 15, 2025, at https://www.usgs.gov/water-science-school/science/floods-and-recurrence-intervals.
Veilleux, A.G., Cohn, T.A., Flynn, K.M., Mason, R.R., Jr., and Hummel, P.R., 2014, Estimating magnitude and frequency of floods using the PeakFQ 7.0 program: U.S. Geological Survey Fact Sheet 2013–3108, 2 p., accessed July 17, 2023, at https://doi.org/10.3133/fs20133108.
Vogel, R.M., Yaindl, C., and Walter, M., 2011, Nonstationarity—Flood magnification and recurrence reduction factors in the United States: Journal of the American Water Resources Association, v. 47, no. 3, p. 464–474. [Available at https://doi.org/10.1111/j.1752-1688.2011.00541.x.
References Cited
Strauch, K.R., and Dietsch, B.J., 2026, Data in support of flow frequency report—Magnitude and frequency of peak and low flows in the Elkhorn River Basin, Nebraska, 1881–2022: U.S. Geological Survey data release, https://doi.org/10.5066/P9SLKHD1.
Appendix 1. Recurrence Interval and Corresponding Exceedance Floods, and Non-Exceedance Flow for the 1-Day, 7-Day, and 30-Day Low Flows for Streamgages in the Elkhorn River Basin
Supplemental Information
A water year is the 12-month period from October 1 through the following September 30 and is designated by the calendar year in which it ends. Thus, the water year beginning October 1, 2010, and ending September 30, 2011, is called the “2011 water year.”
A climatic year begins April 1 and ends March 31 of the following year and is named for the calendar year in which it ends. Thus, the climatic year beginning April 1, 2010, and ending March 31, 2011, is called the “2011 climatic year.”
Abbreviations
AEP
annual exceedance probability
AHR
annual hydrographic report
EMA
Expected Moments Algorithm
GIS
geographic information system
LP3
log-Pearson type III
NeDWEE
Nebraska Department of Water, Energy, and Environment
NWIS
National Water Information System
PeakFQ
Peak flow FreQuency
PILF
potentially influential low flow
p-value
probability value
USGS
U.S. Geological Survey
For more information about this publication, contact:
Director, USGS Nebraska Water Science Center
5231 South 19th Street
Lincoln, NE 68512
402–328–4100
For additional information, visit: https://www.usgs.gov/centers/ne-water
Publishing support provided by the
USGS Science Publishing Network,
Rolla Publishing Service Center
Disclaimers
Any use of trade, firm, or product names is for descriptive purposes only and does not imply endorsement by the U.S. Government.
Although this information product, for the most part, is in the public domain, it also may contain copyrighted materials as noted in the text. Permission to reproduce copyrighted items must be secured from the copyright owner.
Suggested Citation
Strauch, K.R., and Dietsch, B.J., 2026, Magnitude and frequency of peak and low flows in the Elkhorn River Basin, Nebraska, 1881–2022: U.S. Geological Survey Scientific Investigations Report 2026–5004, 17 p., https://doi.org/10.3133/sir20265004.
ISSN: 2328-0328 (online)
Study Area
| Publication type | Report |
|---|---|
| Publication Subtype | USGS Numbered Series |
| Title | Magnitude and frequency of peak and low flows in the Elkhorn River Basin, Nebraska, 1881–2022 |
| Series title | Scientific Investigations Report |
| Series number | 2026-5004 |
| DOI | 10.3133/sir20265004 |
| Publication Date | June 08, 2026 |
| Year Published | 2026 |
| Language | English |
| Publisher | U.S. Geological Survey |
| Publisher location | Reston, VA |
| Contributing office(s) | Central Plains Water Science Center |
| Description | Report: iv, 17 p.; 2 Appendix Tables; Data Release |
| Country | United States |
| State | Nebraska |
| Other Geospatial | Elkhorn River basin |
| Online Only (Y/N) | Y |
| Additional Online Files (Y/N) | Y |