

Regression Models for Estimating Suspended Sediment Concentrations and Loads and Comparison With Acoustic Surrogate Model on the Snake River, Weiser, Idaho, 1977–2022
Links
- Document: Report (4.25 MB) , HTML , XML
- Data Releases:
- USGS data release - Model Archive Summary for acoustic derived suspended- sediment concentration at 13269000 Snake River at Weiser, ID
- USGS data release - Suspended sediment dataset for development of regression models to estimate suspended sediment concentration and loads for the Snake River at Weiser, Idaho, 1977–2022
- NGMDB Index Page: National Geologic Map Database Index Page (html)
- Download citation as: RIS | Dublin Core
Abstract
The U.S. Geological Survey, in cooperation with Idaho Power, developed streamflow-based regression models to estimate suspended sediment concentration (SSC) and loads on the Snake River at Weiser, Idaho site (U.S. Geological Survey streamgage 13269000; hereafter referred to as “Snake at Weiser site”). This site sits upstream from the dams and reservoirs of the Hells Canyon Complex and the Hells Canyon National Recreation Area, where large sandbars along the Snake River that provide recreation and riparian habitat and host archaeological resources have declined since 1973. Analyses of samples from historical (1977-2003) and modern (2017-22) periods show that SSC has decreased over time, with median concentrations declining from 50 milligrams per liter (mg/L) to 28 mg/L. Mann-Kendall trend tests confirm statistically significant declines in total SSC and the fine and sand fractions of suspended sediment through the full period of record.
Regression models specific to each period outperformed models using the full dataset, suggesting changes in the sediment supply to this reach of the Snake River and highlighting the need for period-based approaches. Regression models for total SSC and fine sediment were more accurate than those for sand, which exhibited greater error and bias, likely reflecting a sand supply limited by upstream dams. The regression model for modern period total SSC and a previously developed acoustic surrogate model showed similar performance, indicating both methods are viable for estimating SSC and loads.
These findings help to better quantify suspended sediment concentrations and loads upstream of the Hells Canyon Complex and provide resource managers with tools to better quantify sediment loads affecting reservoir storage and the maintenance of sandbars in the Hells Canyon National Recreation Area.
Introduction
The Snake River, the largest tributary of the Columbia River, drains approximately 107,500 square miles across six states in the western United States (fig. 1; U.S. Geological Survey, 2018a, b, c). It begins as a high-elevation mountain stream at approximately 9,200 feet in western Wyoming, flowing south before turning west into Idaho. As it crosses southern Idaho, the Snake River cuts through the expansive lava flows and agriculturally dominated landscapes of the Snake River Plain. West of Boise, Idaho, the river turns north and forms the border between Idaho and Oregon, and subsequently Washington, for 216 miles. Ultimately, the Snake River turns westward again and joins the Columbia River in northeastern Washington.
Along the western border of Idaho, the three dams on the Snake River comprising the Hells Canyon Complex (HCC) produce about 70 percent of Idaho's hydroelectric power (Idaho Power, 2025a). These dams, managed by Idaho Power, play a critical role in the region's energy infrastructure. Downstream from Hells Canyon Dam, the last dam in the HCC, the Snake River flows through the Hells Canyon, which is part of the Hells Canyon National Recreation Area, a rugged and largely undeveloped landscape. This reach of the river supports recreation including hiking, whitewater rafting, and jet boat tours. Large sandbars that form within the canyon provide camping spaces in otherwise steep terrain, host archaeological resources, and provide diverse riparian habitats. However, the size of these sandbars has declined over time as dams upstream, including those in the HCC, trap sediment (Schmidt and others, 1995). Sediment retention at dams and the resulting decline in sandbar extent raises concerns among resource managers and recreationists about the continued ecological and recreational value the sandbars provide (Grams and Schmidt, 1999a, b7; Idaho Power, 2003).
Quantifying the sediment loads delivered by the Snake River to the HCC is critical information for reservoir managers to better estimate sediment volumes deposited in the reservoirs, particularly in Brownlee Reservoir, the most upstream impoundment. Over time, sediment accumulation can reduce reservoir storage capacity, affecting water management and hydroelectric generation (Schleiss and others, 2016; Whelan and Hotchkiss, 2024). Furthermore, estimating sediment loads, especially sand, may help resource managers determine if there are feasible mitigation strategies to address the decline of the large sandbars in Hells Canyon.
The U.S. Geological Survey (USGS) operates the Snake River at Weiser, Idaho site (USGS streamgage 13269000; hereafter referred to as “Snake at Weiser site”), which is the last streamgage upstream from the HCC. Since 1977, the USGS has collected samples for suspended sediment concentration (SSC) at this site. A multiyear gap in sample collection divides the SSC record into two periods: historical (1977–2003) and modern (2017–22). The modern period of sample collection supported the development of an acoustic surrogate model for estimating SSC and loads (Evetts, 2023). This study used the SSC record from the Snake at Weiser site to develop streamflow-based regression models using the rloadest package for R (Runkel and others 2004; Runkel and De Cicco, 2017; R Core Team, 2025). Trend tests were performed to determine if separate regression models for historical and modern periods or if a single regression model for the entire period of record could adequately estimate concentrations. Additionally, concentrations and load estimates derived from the regression models for total SSC were compared to those obtained from the acoustic surrogate model developed for this site (Evetts, 2023).
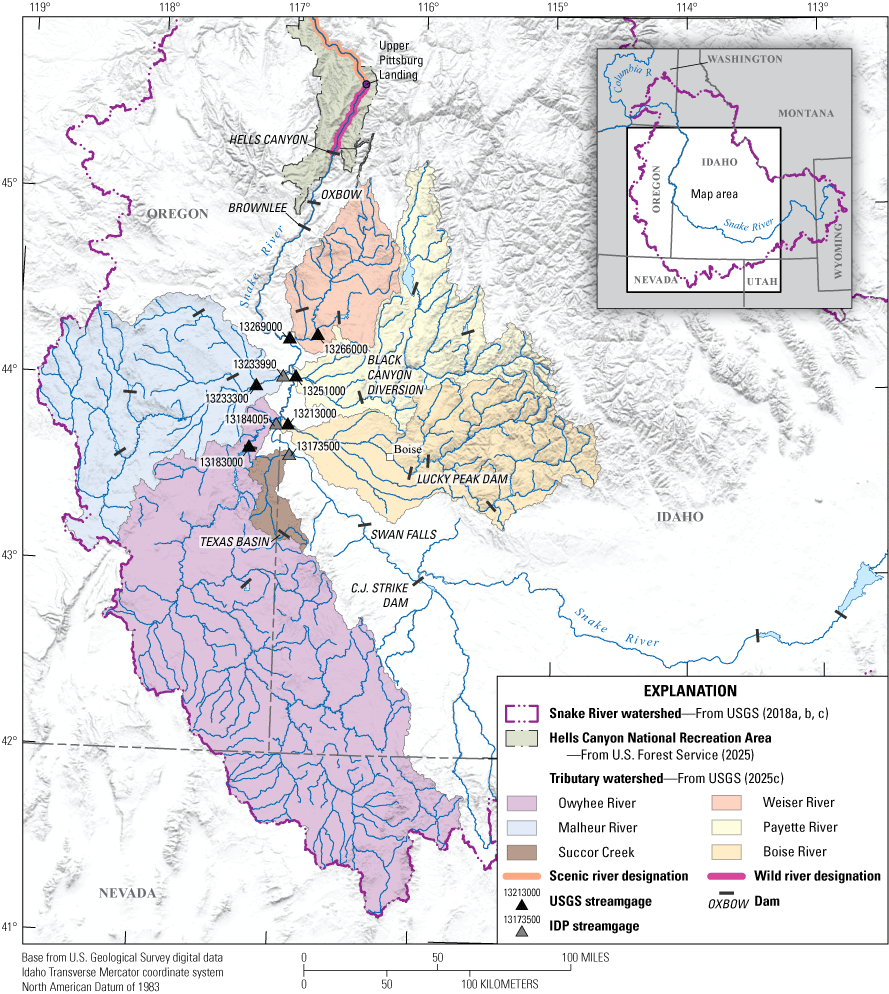
Map of the study area showing the Snake River at Weiser, Idaho site (U.S. Geological Survey [USGS] streamgage 13269000) and watersheds of major tributaries that deliver suspended sediment to the Snake River upstream from the Snake at Weiser site. [IDP, Idaho Power]
Purpose and Scope
This report analyzes and compares SSC from two periods—historical (1977–2003) and modern (2017–22)—at the Snake at Weiser site. It evaluates total SSC, as well as concentrations of fine sediment (less than 0.0625 millimeters [mm]) and sand (0.0625–2 mm) for available data. The analysis compares concentrations between the irrigation season (May–September) and the nonirrigation season (October–April). The report compares traditional streamflow-based regression models for the historical and modern periods and develops separate rating curves for the fine and sand fractions of suspended sediment. For the modern period, it compares estimated SSC and sediment loads from traditional rating curves with those obtained from an acoustic surrogate model (Evetts, 2023). Specifically, these analyses (1) develop streamflow-based regression models to estimate total SSC and concentrations of fine sediment (less than 0.0625 mm) and sand (0.0625–2 mm) at the Snake at Weiser site; (2) determine whether total SSC and concentrations of fine sediment and sand have changed through time, including during the irrigation season specifically; (3) determine if the historical and modern periods require different streamflow-based regression models for estimating total SSC and concentrations of fine sediment and sand; and (4) compare estimates of total SSC and loads from a streamflow-based regression model and an acoustic surrogate model for the modern period.
Study Area
The Snake at Weiser site sits on a reach of the Snake River that delineates the western border of Idaho with Oregon. Because of its strategic position as the last streamgage upstream from the Hells Canyon Complex (HCC) of dams, the Snake at Weiser site serves as a monitoring location for measuring suspended sediment loads reaching Brownlee Reservoir, the first of three reservoirs in the HCC. The HCC includes three major dams and associated reservoirs: Brownlee Dam and Brownlee Reservoir (completed in 1959, maximum storage capacity 1,426,700 acre-feet); Oxbow Dam, and Oxbow Reservoir (completed in 1961, maximum storage capacity 58,200 acre-feet); and Hells Canyon Dam and Hells Canyon Reservoir (completed in 1967, maximum storage capacity 188,000 acre-feet) (U.S. Army Corps of Engineers, n.d.). Together, these dams have a generating capacity of about 1,167 megawatts and produce about 70 percent of Idaho’s hydropower (Idaho Power, 2025a). The Hells Canyon National Recreation Area begins downstream from Hells Canyon Dam (fig. 1) and was established by Congress in 1975 through the Hells Canyon National Recreation Area Act (Public Law 94–199, 89 Stat. 1117) to protect the area's unique qualities, including its scenic beauty, recreational opportunities, geological features, biological diversity, and cultural resources. The Hells Canyon National Recreation Area Act (Public Law 94–199, 89 Stat. 1117) also added 67.5 miles of the Snake River to the National Wild and Scenic Rivers System, with a wild designation for the 31.5 miles from Hells Canyon Dam to Upper Pittsburg Landing and a scenic designation for an additional 36 miles downstream from Upper Pittsburg Landing (fig. 1).
The dams of the HCC play a large role in trapping sediment, reducing the delivery of coarser bedload and finer suspended sediment to Hells Canyon. Observations of large sediment deposits upstream from Brownlee Reservoir near Weiser, Idaho, indicate substantial sedimentation, supported by bathymetric data collected at transects within the reservoir (Welcker and others, 2018). This reduction in sediment delivery contributes to the well-documented decline of sandbars in Hells Canyon (Schmidt and others, 1995), as the sediment supply is inadequate to counterbalance the erosion of these features. In 1973, Hells Canyon contained approximately 98 sandbars, covering 20 acres; by 2007, only 30 sandbars encompassing 6 acres remained (U.S. Forest Service, 2007). The loss of sandbars in the steep canyon has reduced the space available for day-use and camping for recreational users. Additionally, sandbars provide habitat for juvenile Snake River fall Chinook salmon (Oncorhynchus tshawytscha) (U.S. Forest Service, 2007), and the terraces adjacent to these sandbars hold cultural and historical resources that are increasingly threatened by ongoing erosion (Grams and Schmidt, 1999a, b7).
The sediment supply for the reach of river where the Snake at Weiser site is located has been reduced by upstream dams and reservoirs such as Swan Falls Dam and C.J. Strike Dam (fig. 1) (Idaho Power, 2003). As a result, tributary streams and rivers between Brownlee Dam and Swan Falls Dam, now serve as the primary sources of sediment to this reach of the Snake River. However, many larger tributaries also contain dams and impoundments that reduce the volume of sediment they deliver to the Snake River (Idaho Power, 2003). Generally, the tributaries entering from the west drain more arid, lower-elevation lands, whereas those joining from the east originate in higher elevations (Palecki and others, 2021; U.S. Geological Survey, 2025a). Additionally, the watersheds to the east are primarily underlain by granitic lithologies, except the watershed of the Weiser River, which is predominantly characterized by basaltic rocks (Idaho Geological Survey, 2023). Tributaries draining the arid lands west of the Snake River are underlain by volcanic rocks such as basalt, tuff, and rhyolite (Oregon Department of Geology and Mineral Industries, 2021; Idaho Geological Survey, 2023).
Notable watersheds draining into the Snake River from the east include the Boise, Payette, and Weiser Rivers (fig. 1). The Boise River has several dams, with Lucky Peak Dam, completed in 1955 (U.S. Army Corps of Engineers, n.d.), being the last before its confluence with the Snake River. Similarly, the Payette River and its tributaries have many impoundments. Black Canyon Diversion Dam, completed in 1924 (U.S. Army Corps of Engineers, n.d.) is the final impoundment on the Payette River before the confluence with the Snake River. Although designed primarily to divert water into irrigation canals, the Black Canyon Diversion Dam effectively traps sediment, resulting in large upstream deposits (Kimbrel, 2016). The Weiser River is largely unregulated, and the sediment supply from this watershed is minimally affected by the smaller dams and impoundments on some tributaries. Additionally, the Weiser River joins the Snake River only 1 kilometer upstream from the Snake at Weiser site.
Major tributaries joining the Snake River from the west include Succor Creek, the Owyhee River, and the Malheur River (fig. 1). Succor Creek, is largely unregulated, but Texas Basin Dam, completed in 1979 (U.S. Army Corps of Engineers, n.d.) traps sediment from the upper portions of the watershed in Succor Creek Reservoir. On the Owyhee River, the Owyhee Dam, completed in 1932 (U.S. Army Corps of Engineers, n.d.), regulates streamflow and captures sediment from most of the watershed (U.S. Geological Survey, 2025b). The Malheur River lacks larger impoundments on its main stem but has several dams regulating flow on its tributaries.
Background
The USGS collected samples for SSC at the Snake at Weiser site during two distinct periods: historical (1977–2003) and modern (2017–22). During the historical period, the number of samples collected per year varied between 0 and 12, and the timing of sample collection within any given year varied as well. Sample collection in the modern period supported development of an acoustic surrogate model for SSC at the Snake at Weiser site, in collaboration with Idaho Power. Acoustic surrogate models relate backscatter measured by an acoustic Doppler velocimeter (ADVM) to measured SSC. This method has advantages over traditional streamflow-based rating curves because commonly, SSC is not driven solely by streamflow. Further, SSC in many stream channels does not peak synchronously with streamflow and exhibits hysteresis during high-flow events in which SSC can be higher or lower for a given streamflow on the rising limb of the event hydrograph compared to the same streamflow on the falling limb of the hydrograph (Wood and Teasdale, 2013; Landers and others, 2016). Instead, the ADVMs measure backscatter, which generally increases with SSC, regardless of other factors like streamflow. Two ADVMs with different frequencies (3,000 kilohertz [kHz] and 1,500 kHz) were deployed at the Snake at Weiser site to develop the acoustic surrogate model. Sample collection targeted a wide range of hydrologic and seasonal conditions throughout the modern period. The final model estimated SSC using corrected backscatter from only beam 2 of the 1,500 kHz ADVM and streamflow data from the Weiser River rather than streamflow from the Snake River (Evetts, 2023). The acoustic surrogate model is expressed as:
whereSSC
is suspended sediment concentration, in milligrams per liter,
WeiserQ-5hr
is instantaneous streamflow measured at Weiser River near Weiser, Idaho site (U.S. Geological Survey [USGS] 13266000), offset by 5 hours to account for travel time to Snake River at Weiser, Idaho site (USGS streamgage 13269000),
is mean sediment corrected backscatter of beam 2 of the 1,500 kilohertz [kHz] acoustic Doppler velocimeter (ADVM), and
BCF
is a nonparametric-smearing bias correction factor (Duan, 1983), equal to 1.06 for this model.
Because of equipment malfunction, many days in the modern period lack backscatter data and thus also lack estimates of SSC from the acoustic surrogate model.
Methods
The study began by finalizing the dataset of suspended sediment samples included in the historical and modern periods (Kenworthy, 2026), then proceeded to analyses that included developing streamflow-based regressions to estimate SSC and loads, comparing different models, and trend testing for changes in measured SSC over time at the Snake at Weiser site.
Sample Dataset
Measured SSC and associated metadata for 162 samples at the Snake at Weiser site were downloaded from the National Water Quality Monitoring Council’s Water Quality Portal (National Water Quality Monitoring Council, 2024). All samples from the modern period were collected using equal-width-increment (EWI) or equal-discharge-increment (EDI) methods (U.S. Geological Survey, 2006), ensuring width and depth integrated samples. The historical sample metadata lacked information about collection methods, and it was assumed that the historical period employed EWI or EDI methods as well. The dataset included 154 SSC samples collected between 1977 and 2022. The particle-size fraction less than 0.0625 millimeters (mm; categorized as fines), was available for 110 samples (fig. 2).
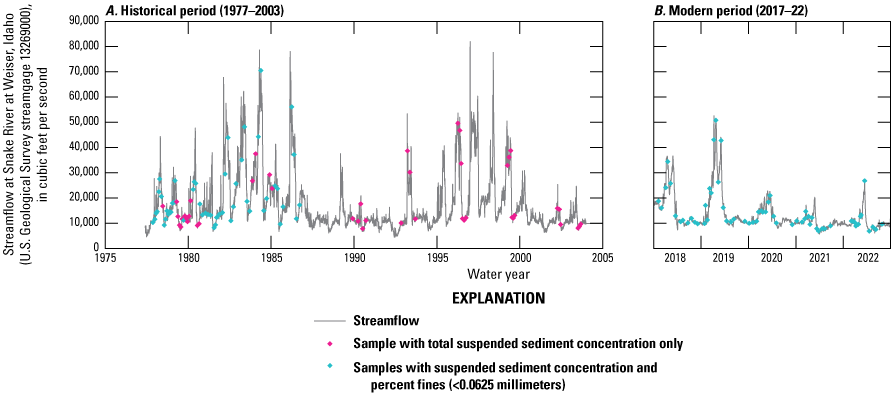
Time-series plots showing the suspended sediment concentration (SSC) samples and streamflow at the Snake River at Weiser, Idaho site (U.S. Geological Survey streamgage 13269000) for the historical period (1977–2003) and modern period (2017–22). Symbols indicate if samples were analyzed for total SSC only or for SSC and particle-size fraction less than (<) 0.0625 millimeters (categorized as fines). Streamflow data from the U.S. Geological Survey National Water Information System database (U.S. Geological Survey, 2025b). Suspended sediment concentration data from the Water Quality Portal (National Water Quality Monitoring Council, 2024).
The historical period included 97 samples collected between November 14, 1977, and September 3, 2003 (Kenworthy, 2026). Of these, 51 historical samples included percent fines results, all collected between 1977 and 1986 (fig. 2A). Two samples (January 28, 1983, and November 18, 1985), were excluded out of concern that low fine sediment fractions (25 and 31 percent) indicated that the sampler nozzle may have scooped sand from the riverbed during sampling. Further, the percent fines values of 25 and 31 percent were more than three standard deviations from the mean percent fines content of 78.5 percent for historical samples.
The modern period included 65 samples collected between October 19, 2017, and October 26, 2022 (Kenworthy, 2026). All samples from the modern period were analyzed for total SSC and fine particle-size fraction (fig. 2B). Six samples from the modern period were flagged and excluded from further analysis. Of these, two samples (March 4, 2020, and September 24, 2021) were excluded because the model archive summary for the acoustic surrogate model indicated potential problems with these samples (Evetts, 2023). Four samples (October 19, 2017, February 7, 2018, December 3, 2020, and October 26, 2022) were excluded because their percent fines values (ranging from 12 to 54 percent) fell two to three standard deviations from the modern period mean value (84.8 percent; standard deviation=15.2 percent). These unusually low values suggest that the sampler nozzle may have scooped sand from the riverbed during sample collection. Further, the high sand concentration of these samples is inconsistent with the near or below average streamflow of the Snake River and its tributaries at the time of sample collection.
Sample collection during the modern period included 30 quality assurance and control samples (Evetts, 2023). Of these, 26 were replicates collected using EWI or EDI methods, and 4 were grab or dip samples—single-point collections that may or may not be depth-integrated (U.S. Geological Survey, 2006). Grab or dip samples are generally used if conditions are unsafe for EWI or EDI methods. For 13 modern sampling events, results from quality control samples either replaced results from the regular sample or the mean value of the quality control and regular sample was used (Kenworthy, 2026). This approach was consistent with the acoustic surrogate model, in which results from quality control samples were used based on concerns about specific samples or quality control samples were more consistent with existing data at the Snake at Weiser site (Evetts, 2023). Of these 13 sampling events, 11 used replicate sample results and 2 used dip or grab sample results. The acoustic surrogate model dataset included 51 samples (Evetts, 2023), whereas the final modern period dataset for this analysis included 59 samples (Kenworthy, 2026). The difference is because additional samples were excluded from the acoustic surrogate model based on a lack of ADVM data during some sampling events.
After removing potentially problematic samples, the final dataset included 154 samples—95 from the historical period and 59 from the modern period. With the final dataset of samples, the minimum, maximum, median, mean, and standard deviation were calculated for different categories. Categories were defined by the grain size (total SSC, fine fraction, and sand fraction), period (historical, modern, or entire period of record), and season (irrigation or nonirrigation).
Development of Regression Models
The rloadest R package (Runkel and De Cicco, 2017) was used in the development of streamflow-based regression models for SSC. This package implements the functions of the original Fortran-based program LOAD ESTimator (LOADEST; Runkel and others, 2004) in the R programming language. This package assists users in developing linear regression models in which the logarithm-transformed constituent, such as suspended sediment concentration, is the function of one or more explanatory variables, including stream streamflow, time, and seasonality. Logarithm or other transformations can also be applied to explanatory variables, resulting in nonlinear models if transformed back into real-world units. The resulting regression models can then be used to estimate loads for different time intervals. This study developed regression models using the rloadest R package for total SSC and concentrations of fine sediment and sand for the historical and modern periods. For comparison to period-based models, period-of-record regression models were also developed that used all samples in the dataset from 1977 to 2022.
Streamflow data for the Snake at Weiser site were downloaded from the USGS National Water Information System database (U.S. Geological Survey, 2025b). If available, the nearest instantaneous (15-minute) streamflow value at the Snake at Weiser site was matched with SSC samples (fig. 3A). If instantaneous data were not available, primarily for dates earlier than October 10, 1986, daily mean streamflow values at the Snake at Weiser site were matched with SSC samples (fig. 3A, B).
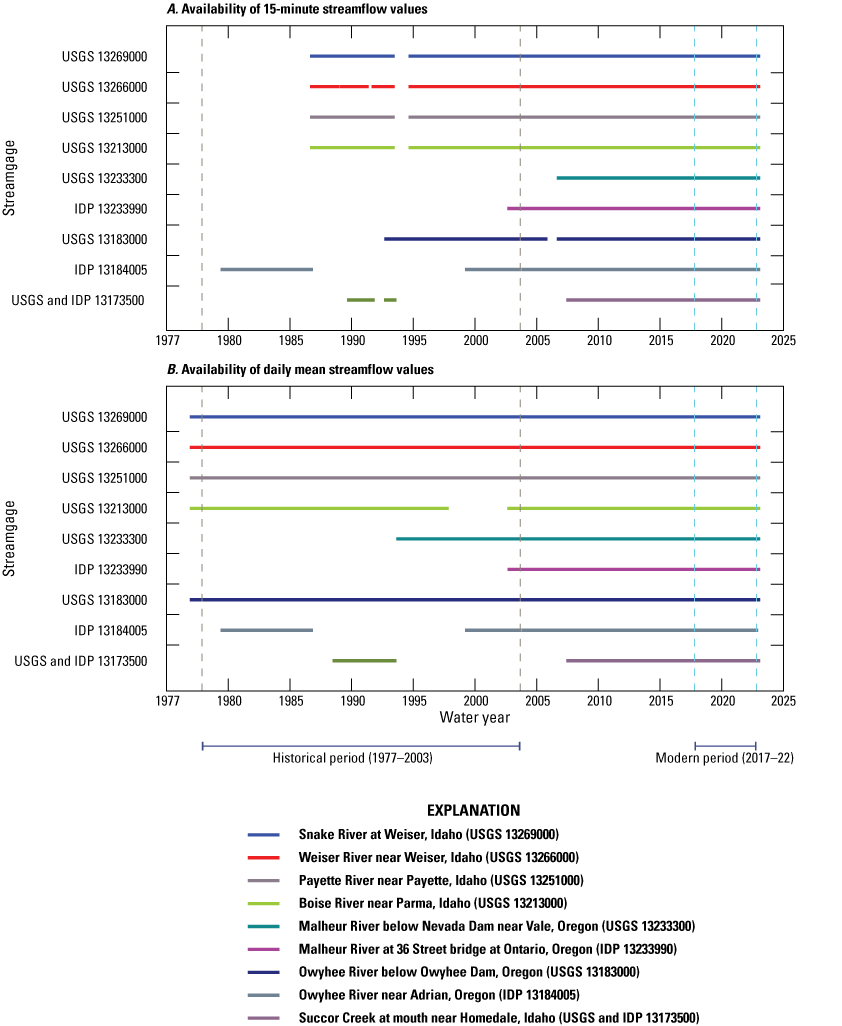
Plots showing the availability of A, instantaneous (15-minute) streamflow data and B, daily mean streamflow data at Snake River at Weiser, Idaho site (U.S. Geological Survey [USGS] streamgage 13269000) and six tributaries upstream from USGS streamgage 13269000. Streamflow data from the U.S. Geological Survey National Water Information System database (U.S. Geological Survey, 2025b) and Idaho Power web portal (Idaho Power, 2025b). [IDP, Idaho Power]
The study also evaluated streamflow from six tributaries as explanatory variables in regression models, recognizing that these tributaries serve as primary sediment sources to the Snake River—upstream from the Snake at Weiser site and downstream from Swan Falls Dam. The tributaries included the Weiser River, the Malheur River, the Payette River, the Owyhee River, the Boise River, and Succor Creek (figs. 1 and 3). The availability of instantaneous and daily mean streamflow data varied by site (fig. 3A), with considerably less instantaneous streamflow data available for the historical period. Streamflow data at streamgages operated by the USGS were downloaded from the USGS National Water Information System database (U.S. Geological Survey, 2025b). Streamflow data from streamgages operated by Idaho Power were obtained from Idaho Power web portal (Idaho Power, 2025b). Daily mean and instantaneous streamflow data for tributaries were matched with samples for SSC based on sample data.
Tributary streamflow was quantified in a variety of ways for inclusion in regression models. Most simply, tributary streamflow was represented by either the daily mean value or the instantaneous (15-minute) value closest in time to sample collection. To account for travel time between tributaries and the Snake at Weiser site, time offsets were applied to the instantaneous (15-minute) tributary streamflow in developing regressions for the modern period. A range of time offsets, from 1 to 72 hours, were tested for each tributary and the statistical significance of offset streamflow as an explanatory variable was assessed, as well as the most effective offset, if applicable. Time offsets were not evaluated for the historical period because of insufficient instantaneous streamflow data for the tributaries. In addition, individual tributary streamflow and total tributary streamflow were expressed as a percentage of the Snake River streamflow and tested for inclusion in the models.
Development of regression models also considered the effect of seasonality on SSC in two ways. First, more gradual seasonal changes in SSC could be incorporated into regression models using the sine and cosine terms with a period of 1 year. Second, the use of a categorical variable incorporated the more abrupt changes of irrigation season, with the categorical variable equal to 1 for irrigation season samples (May–September) and equal to 0 for nonirrigation season samples (October–April).
Potential outliers were flagged based on leverage, difference in fits (DFFITS), or Cook’s distance values that exceeded predefined thresholds for each metric (Belsley and others, 1980). Samples with z-scores more than two standard deviations from the dataset mean were also flagged. Flagged samples underwent further evaluation to determine whether to retain them in regression models. Model performance was evaluated and compared using statistical metrics: root mean square percent error (RMSPE), the coefficient of determination (R2), model bias (as a percentage, calculated as the sum of model residuals divided by the sum of measured concentrations),Nash-Sutcliffe Efficiency Index (Nash and Sutcliffe, 1970), the Akaike information criterion (Akaike, 1974), and residual plots to assess for homoscedasticity. These metrics, along with the statistical significance of the model (a p-value of less than 0.05; p<0.05), guided the selection of final models. Visual inspection of time-series plots comparing estimated and measured SSC supported evaluation of model performance in reproducing seasonal variability. Because the rloadest R package applies a natural logarithm transformation to the constituent, final models incorporated the Bradu-Mundlak bias correction factor (Bradu and Mundlak, 1970) to appropriately retransform estimated SSC into units of milligrams per liter (mg/L).
Final models were developed for total SSC and concentration of fine sediment and sand for the historical and modern periods. Additional models were developed using all data from the period of record at the Snake at Weiser site. These period-specific period-of-record models were then used to estimate daily mean SSC, as well as total monthly and water year loads. For the modern period, daily mean SSC was also estimated using the acoustic surrogate model. To enable direct comparison between loads estimated by the rloadest regression model and loads estimated by the acoustic surrogate model for the modern period, load estimates were limited to days with available SSC estimates from the acoustic surrogate model.
Two approaches were used to assess whether period-specific regression models improved or did not improve performance compared to models developed using data from the entire period of record. First, regression statistics were compared between period-based and period-of-record models. Second, Mann-Kendall trend tests (Helsel and others, 2020) were conducted using residuals from the final regression models to identify statistically significant trends in measured SSC during the historical period, modern period, and entire period of record. This method accounts for the effect of streamflow and other explanatory variables in the regression equations, improving the ability to detect statistically significant changes in measured SSC that are not driven by explanatory variables such as streamflow. P-values of less than 0.05 indicated rejection of the null hypothesis of no trend and suggested a statistically significant trend in the residuals, and therefore, in measured SSC.
Results
The basic statistics calculated for the different sample categories and grain-size categories are summarized in table 1. Measured total SSC and concentrations of fine sediment (less than 0.0625 mm) and sand (greater than 0.0625–2 mm) are displayed in boxplots by grain-size category, period, and season (fig. 4). Suspended sediment at the Snake at Weiser site consisted predominantly of fine sediment, with a mean percent fines of 84.4 percent and a minimum of 52 percent for the entire period of record. In both the historical and modern periods, most measured SSC values were less than 200 mg/L, with only two greater than 200 mg/L in the modern period and only one in the historical period (fig. 4A). The maximum measured SSC was 437 mg/L in the historical period and 489 mg/L in the modern period. Minimum measured SSC values were 4 mg/L in the historical period and 10 mg/L in the modern period. Although the range of measured concentrations was similar across periods, the median SSC was 50 mg/L in the historical period and 28 mg/L in the modern period, indicating generally higher concentrations in the historical period. Standard deviations of SSC suggest higher variability in the modern period compared to the historical period. For the fine sediment and sand concentrations, the range of measured concentrations was broader in the modern period (table 1; fig. 4B, C).
Table 1.
Descriptive statistics for different categories of suspended sediment concentrations at Snake River at Weiser, Idaho site (U.S. Geological Survey streamgage 13269000), during the historical period (1977–2003) and the modern period (2017–22).[Data are from U.S. Geological Survey (2025b). Irrigation season is May–September. Nonirrigation season is October–April. mg/L, milligrams per liter; <, less than; n, number of samples; mm, millimeter; >, greater than]
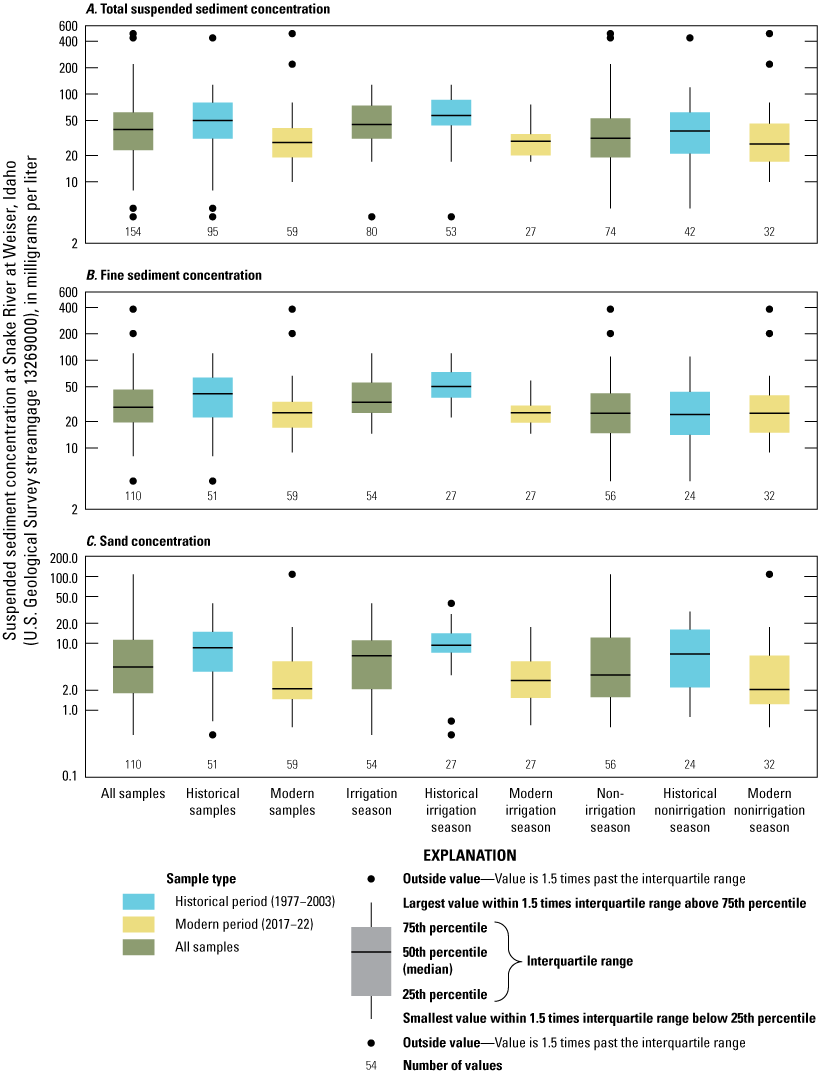
Boxplots for measured A, total suspended sediment concentrations (SSC), B, fine sediment concentration (less than 0.0625 millimeters), and C, sand concentration (greater than 0.0625 millimeters) at Snake River at Weiser, Idaho site (U.S. Geological Survey streamgage 132609000) collected from 1977 to 2022. Sample groups are categorized by period (historical [1977–2003] and modern [2017–22]) and season (irrigation [May–September] and nonirrigation [October– April]). Suspended sediment concentration data from the Water Quality Portal (National Water Quality Monitoring Council, 2024). Basic statistics for these sample and grain-size categories are listed in table 1.
Potential differences in streamflow between the historical and modern periods should be evaluated because streamflow strongly affects SSC in many systems. Differences in measured SSC between the historical and modern periods may primarily reflect differences in streamflow rather than changes in other factors like land use practices. Boxplots in figure 5A show that streamflow at the Snake at Weiser site skewed toward higher values during the historical period compared to the modern period. In contrast, Weiser River streamflow (the nearest tributary to the sampling location; fig. 1) covered a similar range during both periods, but median values indicated higher streamflows during the modern period than during the historical period (fig. 5B).
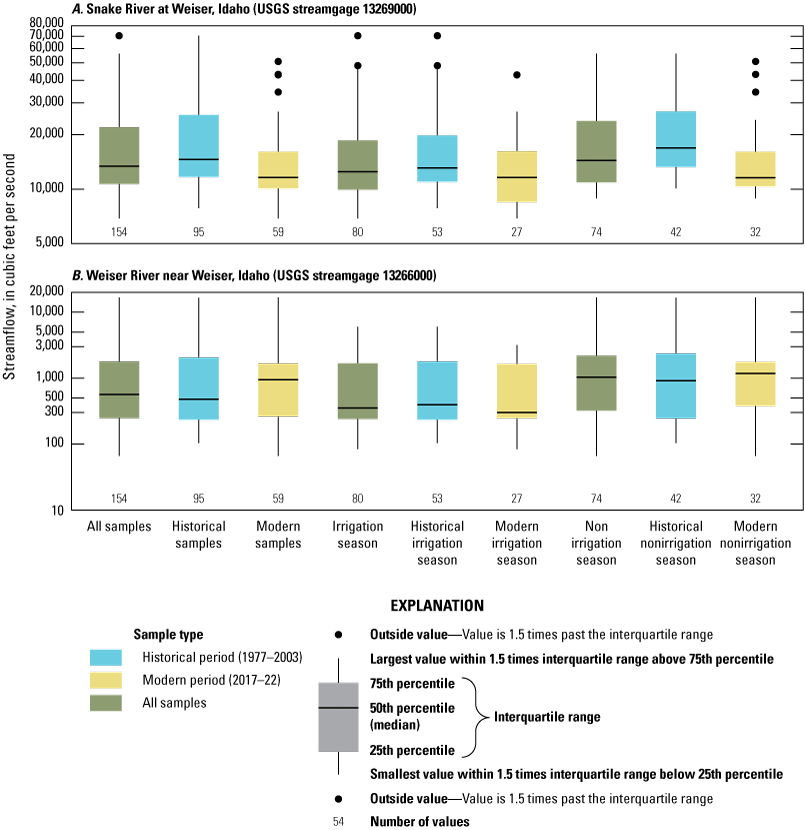
Boxplots showing the streamflow at A, Weiser River at Weiser, Idaho site (U.S. Geological Survey [USGS] streamgage 13266000) and B, Snake River near Weiser, Idaho site (USGS streamgage 13269000) during sample collection for suspended sediment concentration analysis. Data are shown for the historical period (1977–2003) and modern period (2017–22) of sample collection. Streamflow data from U.S. Geological Survey National Water Information System database (U.S. Geological Survey, 2025b).
Irrigation season had higher measured concentrations of total suspended sediment, fine sediment, and sand compared to the nonirrigation season (table 1; fig. 4), whereas streamflow on the Snake and Weiser Rivers showed the opposite pattern with higher flows during the nonirrigation season (fig. 5). This seasonal difference in measured concentrations was more pronounced during the historical period than the modern period. For example, the median SSC values during the historical period were 57.0 mg/L in the irrigation season and 38.0 mg/L in the nonirrigation season, respectively, whereas during the modern period, the median SSC values were 29.0 mg/L and 27.0 mg/L, respectively. During the irrigation season, the historical period produced higher concentrations for the total, fine, and sand fractions of suspended sediment compared to the modern period. This difference may be partially explained by streamflow, as historical median streamflows were slightly higher in the historical period than those in the modern period on the Snake and Weiser Rivers (fig. 5). Measured concentrations were generally higher during the historical nonirrigation season compared to the modern nonirrigation season, although the difference was less pronounced than when comparing the historical and modern irrigation seasons (table 1; fig. 4).
Three samples December 19, 1978, February 25, 1980, and June 18, 1996, were flagged as potential outliers and excluded from the regression models. These samples had the lowest measured SSC values in the dataset (4, 5, and 8 mg/L). Review showed that the Snake River streamflow exceeded the median period of record for all three samples, whereas the Weiser River streamflow exceeded the median for two samples. Given the combination of low SSC and relatively high streamflow, these flagged samples were excluded from the regression models. The dataset maintained a sufficient representation of low concentrations, with 9 mg/L as the next lowest measured value. Therefore, the removal of these samples did not limit the models’ ability to extrapolate to lower concentrations. The highest concentration samples were also flagged as potential outliers; however, because few high concentration samples were available and their correlation with relatively high streamflow, they were retained to extend the model’s applicability.
The final regression models developed using the rloadest R package (Runkel and De Cicco, 2017) and their associated regression statistics are summarized in table 2. Snake River streamflow, as measured at the Snake at Weiser site, was included in all models and was statistically significant (p<0.05), as determined by the t-test, in all models except the historical fine fraction model. Snake River streamflow was retained in the historical fine fraction model because it slightly improved model performance, as indicated by a reduction in bias (1.75 percent with streamflow versus 1.92 percent without streamflow) and RMSPE (0.17 percent versus 0.19 percent). Among the tributaries, only the Weiser and Payette Rivers were statistically significant explanatory variables, regardless of lag times applied to account for travel time from tributary streamgages to the Snake at Weiser site. Simple linear regressions between logarithm-transformed total SSC and daily mean tributary streamflow, along with their R2, indicated that the Owyhee River, Succor Creek, Malheur River, and Boise River (fig. 6C, D, E, and F) had a minor effect on SSC measured at the Snake at Weiser site (fig. 6C, D, E, and F). The Weiser and Payette Rivers (fig. 6B, G) had the highest R2 values, and the R2 for the Weiser River exceeded the R2 for Snake River streamflow (fig. 6A). As a result, tributaries other than the Weiser and Payette Rivers were excluded from the regression models.
Table 2.
Regression equations for suspended sediment concentration at Snake River at Weiser, Idaho site (U.S. Geological Survey [USGS] streamgage 13269000) during historical period (1977–2003) and modern period (2017–22).[Regression models were developed using the rloadest R package (Runkel and De Cicco, 2017). Period of record spans from 1977 to 2022. mg/L, milligrams per liter; n, number of samples used in regression; RMSPE, root mean square percent error; R2, coefficient of determination; NSE, Nash-Sutcliffe Efficiency Index; SSC, suspended sediment concentration in milligrams per liter; EXP, exponent; ln, natural log; , 15-minute streamflow at Snake River at Weiser Idaho site (U.S. Geological Survey [USGS] streamgage 13269000), in cubic feet per second; , daily mean streamflow at Weiser River near Weiser Idaho site (U.S. Geological Survey streamgage 13266000) as a percentage of Snake River streamflow at Snake River at Weiser Idaho site (U.S. Geological Survey streamgage 13269000); , daily mean streamflow at Payette River near Payette, Idaho (U.S. Geological Survey streamgage 13251000) as a percentage of Snake River streamflow at Snake River at Weiser Idaho site; sin, sine; cos, cosine; , decimal date, range from 0 to 1 in a single year; , Bradu-Mundlak bias correction factor; NA, not applicable; irrig, value of 1 for irrigation season (May–September) or zero for nonirrigation season (October–April)]
Indicates explanatory variable in regression is statistically significant at the p<0.05 significance level. Explanatory variables not statistically significant were retained because they improved model performance. In the case of the sine and cosine terms, both were retained if only one was statistically significant to provide the seasonal component of the model.
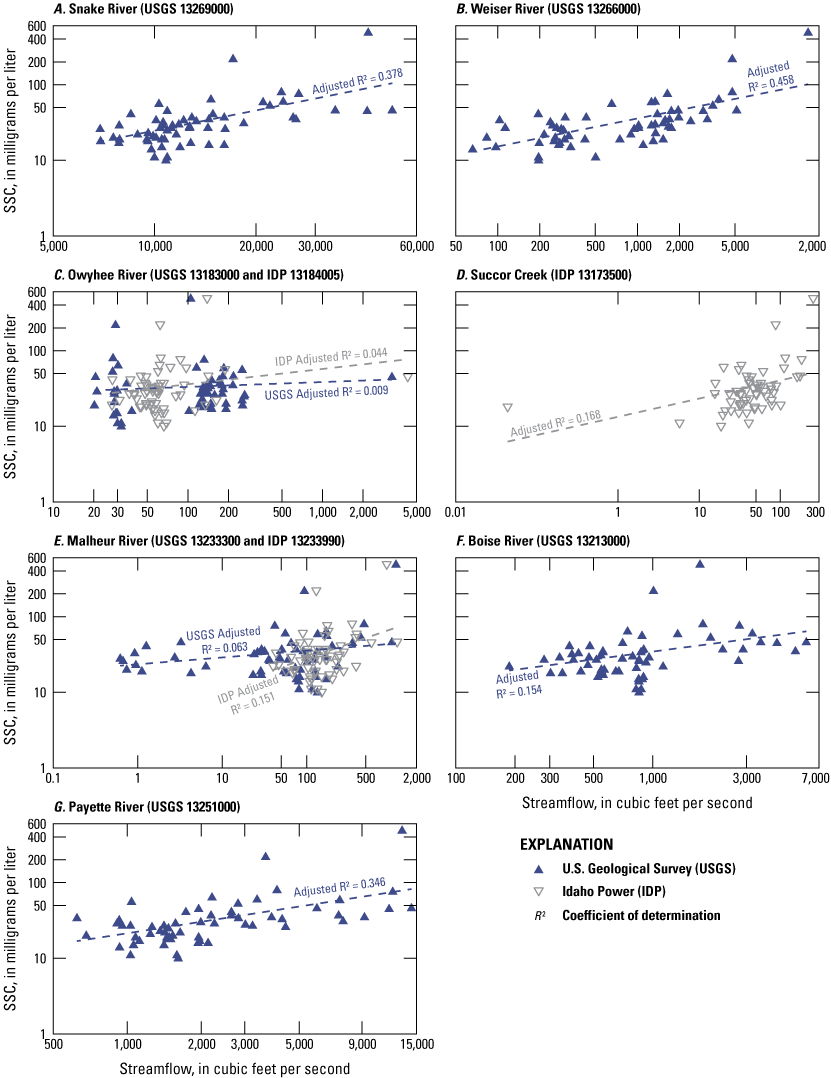
Plots of measured suspended sediment concentration (SSC) at the Snake River at Weiser, Idaho site (U.S. Geological Survey [USGS] streamgage 13269000) as a function of streamflow in the A, Snake River and tributaries to the Snake River upstream from the Snake River at Weiser, Idaho site B, Weiser River; C, Owyhee River; D, Succor Creek; E, Malheur River; F, Boise River and G, Payette River. Streamflow data from U.S. Geological Survey National Water Information System database (U.S. Geological Survey, 2025b) and Idaho Power web portal (Idaho Power, 2025b). Suspended sediment concentration data from the Water Quality Portal (National Water Quality Monitoring Council, 2024).
Payette River streamflow, measured at the Payette River near Payette, Idaho site (USGS streamgage 13251000) and expressed as a percentage of Snake River streamflow at the Snake at Weiser site, was a statistically significant explanatory variable (p<0.05) for total SSC during the historical period (table 2). The effect of the Weiser River was a statistically significant explanatory variable in most regression models, except for the historical sand concentration model (table 2). In most models, Weiser River streamflow was expressed as a percentage of Snake River streamflow at the Snake at Weiser site, Pweiser, using daily mean streamflow measured at the Weiser River near Weiser, Idaho site (USGS streamgage 13266000). For the historical fine concentration model, however, the natural logarithm transformation of the Weiser River streamflow yielded the highest predictive accuracy.
In the period-of-record fine sediment model, Weiser River streamflow, expressed as Pweiser, produced worse estimates for the two measured concentrations greater than 200 mg/L. To improve model performance, several transformations of Weiser River streamflow were tested, including the natural logarithm of Weiser River streamflow and power transformations of Pweiser. Quantifying Weiser River streamflow, expressed as Pweiser1.5, improved estimates for concentrations greater than 200 mg/L, whereas concentrations below 200 mg/L were less responsive to the method of quantification. The two high-concentration samples in the period of record data set have high leverage and may affect model performance. Additional measurements at elevated fine sediment concentrations could improve characterization at the upper range.
Incorporating explanatory variables for seasonal effect improved the model performance and the ability to reproduce annual variability in measured concentrations for all models, except for the model for sand concentration in the modern period (table 2). The historical, modern, and period of record models for total SSC and the model for the modern fine sediment concentration included seasonal effects by using sine and cosine functions with a 1-year period. In contrast, the historical and period-of-record models for fine sediment concentration, as well as the historical and modern models for sand concentration, incorporated seasonal effects by using a categorical variable for the irrigation season. This variable equaled 1 for irrigation season samples (May–September) and 0 for samples collected in all other months. For the historical fine concentration model, regression statistics indicated that models using sine and cosine functions, along with Weiser River streamflow, expressed as Pweiser, performed better statistically. However, these models failed to reproduce the annual seasonal patterns observed in the measured fine sediment concentrations. The final model selected for the historical fine fraction better captured the observed seasonal patterns in measured concentrations.
The few high concentrations within the dataset exerted considerable leverage on regression models. For example, the highest measured SSC during the historical period was 437 mg/L, whereas all other samples were less than 130 mg/L (fig. 4A). Similarly, in the modern period, the highest SSC values were 489 and 219 mg/L, with all other samples 80 mg/L or lower (fig. 4A). Although these high values had considerable leverage on the final regression models, they were retained to extend the predictive range of models, rather than being removed as outliers.
Overall, regression statistics indicated better model performance for total SSC and fine concentration models compared to the sand concentration models (table 2). RMSPE for total SSC and fine concentration models ranged from 22.9 to 57 percent, whereas models for sand concentration had RMSPE values that ranged from 64.1 to 112.9 percent (table 2). Similarly, percent bias remained within plus or minus 5 percent for total SSC and fine concentration models but ranged from about 5.3 to 11.1 percent for sand concentration models. None of the models evaluated for sand concentration in the historical period exhibited normally distributed residuals in logarithm space, including the final model selected (table 2). The absence of normally distributed residuals may indicate limitations in model performance and should be considered in interpreting predictions for sand concentrations in the historical period.
Among the period-based models, the Mann-Kendall trend tests using residuals from the final regression models identified a statistically significant (p<0.05) temporal trend only for total SSC during the historical period (table 2). Because the modern period only includes 6 years, it is not surprising that statistically significant trends were not detected. Between 1977 and 2003, the Theil-Sen slope estimate indicates a decline of about −0.76 mg/L per year in the median measured SSC at the Snake at Weiser site. Although suspended sediment at this site consists primarily of fines, no statistically significant trend was detected in the fine sediment concentration for the historical period. This lack of significance is likely the result of the limited availability of percent fine values in the historical period, which were only provided for samples collected during 1977–86. For the period of record models that used all samples collected between 1977 and 2022, Mann-Kendall trend tests and Theil-Sen slope estimates indicated statistically significant declines in median measured total SSC (−0.40 mg/L per year), as well as the fine (−0.19 mg/L per year) and sand concentrations (−0.07 mg/L per year; table 2).
To assess whether separate models are needed for historical and modern periods, SSC estimates from period-based and period-of-record models were compared for each period. The RMSPE and percent bias for the period-of-record models were calculated using only samples from the relevant period and compared to samples from the period-based models (table 3). For the historical period, period-based models reduced RMSPE by about 1–35 percent, with the largest improvement for sand (from 99 to 64.1 percent, table 3). The historical models for total SSC and fines resulted in smaller magnitudes of bias compared to the period of record models. For example, the model for historical period total SSC resulted in bias of 1.8 percent, whereas the model for period of record total SSC resulted in bias of –9.5 percent (table 3). In contrast, the model for historical period sand concentration resulted in a larger magnitude bias of 11.1 percent compared to the model for period of record sand concentration which resulted in bias of –3.5 percent (table 3). Notably, period-of-record models consistently underestimated (negative bias) total SSC and concentrations of fine sediment and sand during the historical period.
Table 3.
Comparison of performance for models used to estimate suspended sediment concentrations (SSC) at Snake River at Weiser, Idaho site (U.S. Geological Survey streamgage 13269000) for the historical period (1977–2003) and modern period (2017–22) of sample collection.[Fines are particles <0.0625 millimeters; sand is particles >0.0625 millimeters. SSC, suspended sediment concentration; n, number of samples used to compute statistics; RMSPE, root mean square percent error; NSE, Nash-Sutcliffe Efficiency Index. Acoustic surrogate model estimates are from Evetts (2023). Fines are particles <0.0625 millimeters; sand is particles >0.0625 millimeters]
For the modern period, total SSC estimates from modern models and period-of-record models were compared to the acoustic surrogate model (no surrogate models were developed for fines or sand). RMSPE and bias for the acoustic surrogate model (table 3) are based on real-time (15-minute) estimates. To ensure comparability, statistics were calculated using the 50 samples common to the rloadest R package and the acoustic surrogate models (table 3). RMSPE values were similar for the period of record (72.4 percent) and acoustic surrogate (71.8 percent) models but improved for the modern model (58 percent). Bias was also lower for the modern (−3.7 percent) and acoustic (1.7 percent) models compared to the period-of-record model (22.2 percent). For fine sediment, the modern model improved RMSPE marginally compared to the period-of-record model from 58.2 to 57 percent. This difference was more substantial for sand, with RMSPE improving from 130.8 to 85.8 percent. Bias also improved for fines (from 16.7 percent to −4.2 percent) and sand (from 25.2 percent to 5.3 percent) with the use of the modern models. Notably, period-of-record models overpredicted (positive bias) for total SSC and fine and sand concentrations in the modern period, in contrast to the negative biases produced for the historical period.
Figure 7 shows the measured and estimated concentrations for the historical period. Water years 1978–82 were selected for the time-series plots because they include the highest number of samples with total SSC, fine sediment, and sand concentration data (fig. 2), providing a more detailed visual comparison between estimated and measured concentrations. Percent fines data are unavailable after 1986 in the historical period (fig. 2). Estimated concentrations of total suspended sediment, fines, and sand from the historical and period-of-record models are generally consistent, even though both models tend to overestimate low concentrations—particularly for sand—and underestimate high concentrations of fine sediment (fig. 7A, C, E). Seasonal patterns in measured concentrations (higher in spring and early summer and lower in fall and winter) are generally reproduced by both models (fig. 7B, D, F). However, differences in the magnitude of estimated concentrations are evident: the historical period model estimates higher concentrations than the period-of-record model, except during peak events, under which conditions the period-of-record model tends to estimate higher values (fig. 7B, D, F). This difference in magnitude is particularly pronounced for fine sediment and likely results from the inclusion of the Pweiser1.5 variable in the period-of-record model for fines (table 2).
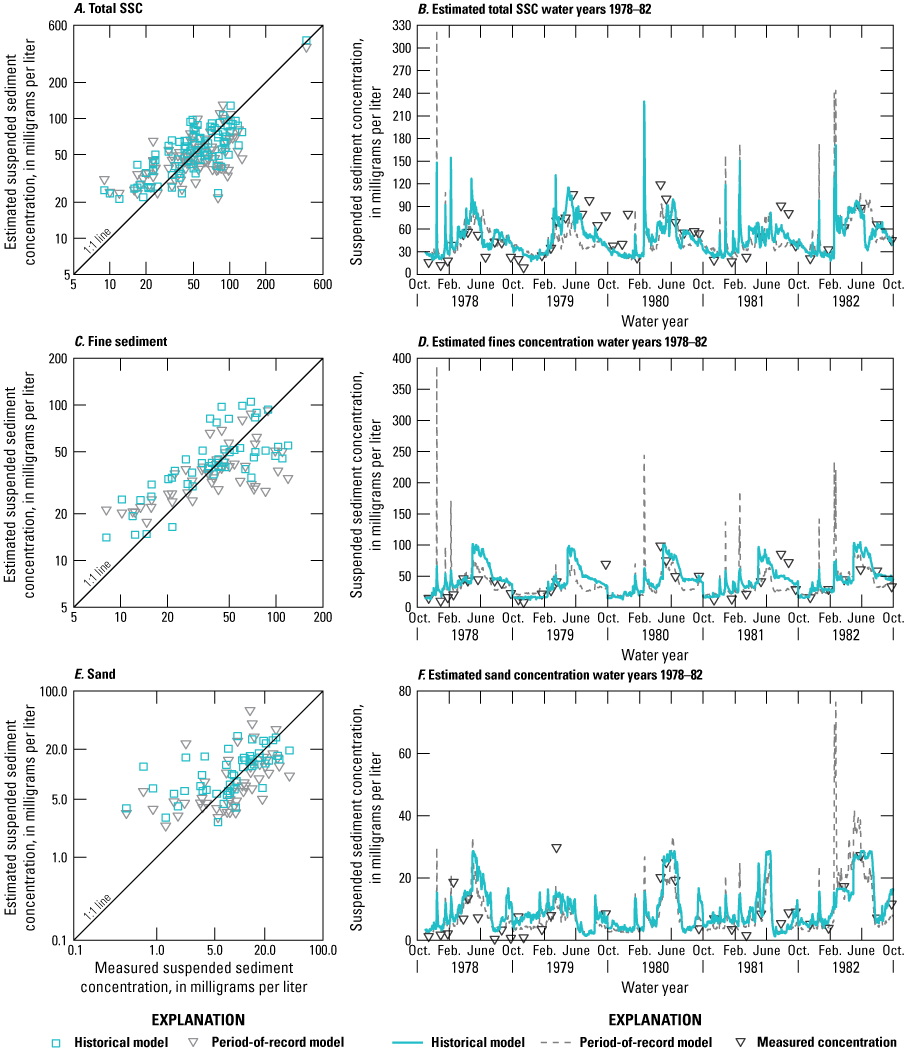
Comparisons of measured and estimated suspended sediment concentrations (SSC) at Snake River at Weiser, Idaho site (U.S. Geological Survey streamgage 13269000) for the historical period, 1977–2003. Concentrations were estimated with streamflow-based regression models developed for the historical period and period of record (1977–2022) and compared to measured values for A, total SSC; B, estimated total SSC water years 1978–82; C, fine sediment (less than 0.0625 millimeters); D, estimated fines concentrations water years 1978–82; E, sand (0.0625–2 millimeters); and F, estimated sand concentration water years 1978–82. B, D, and F, time-series plots illustrate examples from water years 1978–82 and do not represent the entire historical period (1977–2003). Suspended sediment concentration data from the Water Quality Portal (National Water Quality Monitoring Council, 2024). [Water year, the 12-month period from October 1 through September 30 of the following year and is designated by the calendar year in which it ends; Oct., October; Feb., February]
Measured and estimated SSC concentrations for the modern period are presented in figures 8A, B and 9. All three models tend to overpredict total SSC values below about 20 mg/L, with the period-of-record model showing a broader tendency to overpredict concentrations (figs. 8A, B and 9A, B, C). Time-series plots show that all three models reasonably reproduce the seasonal patterns observed in measured SSC (figs. 8A and 9). Although few high-concentration measurements are available for model evaluation, the acoustic surrogate model estimate of 644 mg/L for the highest measured SSC of 489 mg/L (figs. 8B and 9A) exceeds the recommended 20-percent extrapolation limit for model application (U.S. Geological Survey, 2016). There are slight differences in the timing of daily mean peak SSC estimates among the models for some, but not all, peak streamflow events. The peak estimates for the modern and period-of-record models tended to coincide with Snake River peak streamflow (fig. 9A, B, C). The peak estimates for the acoustic surrogate model occasionally coincided with Snake River peak streamflow, but at other times coincided more closely with Weiser River peak streamflow (fig. 9A, B, C). These timing differences are subtle and not easy to see at the scales shown in figures 8 and 9.
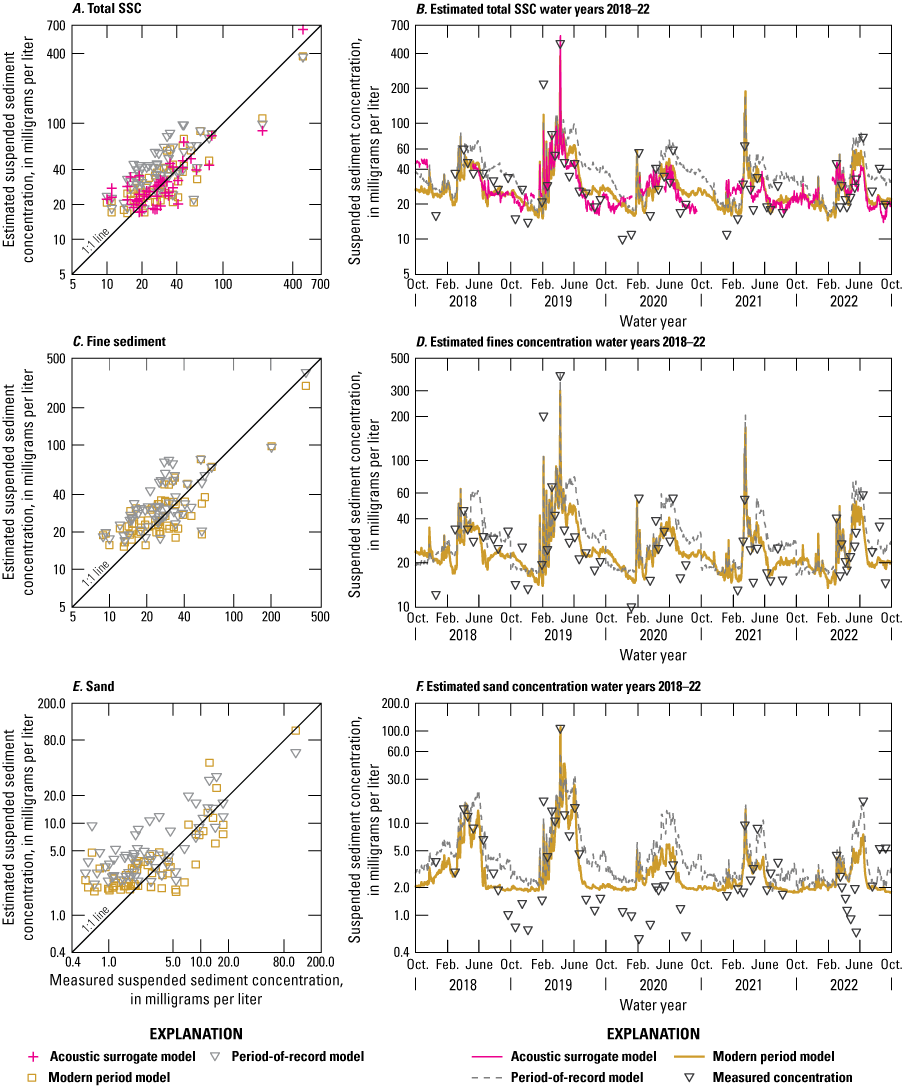
Comparisons of measured and estimated suspended sediment concentrations (SSC) at Snake River at Weiser, Idaho site (U.S. Geological Survey streamgage 13269000) for the modern period, 2017–22. A, total SSC and B, estimated total SSC water years 2018–19, were estimated with streamflow-based regression models developed for the modern period and period of record (1977-2022), and an acoustic surrogate model developed for the Snake River at Weiser site (Evetts, 2023). Gaps in the acoustic surrogate model estimates are the result of equipment malfunction. C, Fine sediment concentrations and D, sand concentrations were estimated with streamflow-based regression models. B, D, and F, time-series plots show estimated concentrations for water years 2018–22. Suspended sediment concentration data from the Water Quality Portal (National Water Quality Monitoring Council, 2024). [Water year, the 12-month period from October 1 through September 30 of the following year and is designated by the calendar year in which it ends; Oct., October; Feb., February]
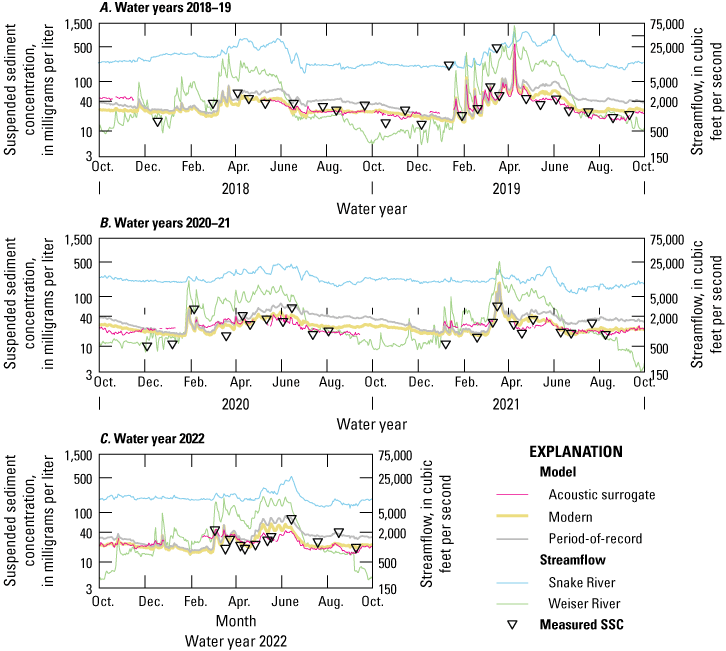
Time-series plots showing the estimated daily mean suspended sediment concentration (SSC) and streamflow at Snake River at Weiser, Idaho site (U.S. Geological Survey [USGS] streamgage 13269000) and streamflow at Weiser River near Weiser, Idaho site (USGS streamgage 13266000) for the modern period (2017–22). Streamflow at the Weiser River site is multiplied by a factor of four for visibility on plots. A, water years 2018–19; B, water years 2020–21; C, water year 2022. SSC was estimated by streamflow-based regression models developed for the modern period and period of record (1977–2022), and an acoustic surrogate model (Evetts, 2023). Streamflow data from U.S. Geological Survey National Water information System database (U.S. Geological Survey, 2025b). Suspended sediment concentration data from the Water Quality Portal (National Water Quality Monitoring Council, 2024. Dec., [Water year, the 12-month period from October 1 through September 30 of the following year and is designated by the calendar year in which it ends. Apr., April; Aug., August; Oct., October; Dec., December]
The modern model outperformed the period-of-record model for fine sediment concentrations during the modern period (table 3). Model bias was considerably lower for the modern model (–4.2 percent), compared to the period-of-record model (16.7 percent; table 3; fig. 8C). Both models captured the seasonal patterns in measured SSC, with higher values coinciding with increased streamflow in spring and early summer and lower values in summer through winter coinciding with decreased streamflow. The effect of the irrigation term in the period-of-record model can be seen in the step change in estimated daily mean concentrations at the start of October (fig. 8D). Again, few samples are available to assess model performance for higher concentrations, but the period-of-record model matched the highest fine sediment concentration well (385 mg/L estimated versus 381 mg/L measured), whereas the modern model underestimated this concentration (299 mg/L).
Model performance for sand concentrations in the modern period was generally worse compared to model performance for total SSC and fine concentration. The modern and period-of-record models tended to overpredict sand concentrations, especially at lower values (fig. 8E). The period-of-record model exhibited more overprediction, resulting in a bias of 25.2 percent (table 3). Time-series plots indicate that both models generally reproduced the seasonal patterns observed in the measured sand concentrations. However, during the nonirrigation season, as sand concentrations were lower, both models consistently overestimated these concentrations (fig. 8F).
Total monthly and water year loads for SSC were estimated using the modern model and the acoustic surrogate model (figs. 10 and 11), and total monthly and water year loads for fines and sand were estimated using the respective modern models (figs. 11 and 12). Period-of-record models were excluded from load estimation because of lower performance relative to modern models. For total SSC, monthly loads were calculated in two ways: first, by using only days with available estimates from the acoustic surrogate model to enable direct comparison; and second, by using all days of each month to support broader comparison across months and water years. If limited to days with acoustic surrogate estimates, both models generally produced similar monthly load estimates (fig. 10). The acoustic surrogate model tended to estimate higher loads during winter and early spring, whereas the modern model estimated higher loads in late spring and summer. By using all days of each month to estimate loads, the monthly estimates followed typical streamflow patterns, with higher monthly loads in spring and early summer and lower loads in other months (fig. 10). Estimated water year loads from the modern and acoustic surrogate models were also similar (fig. 11A), even though gaps in the acoustic surrogate model record limit year-to-year comparisons.
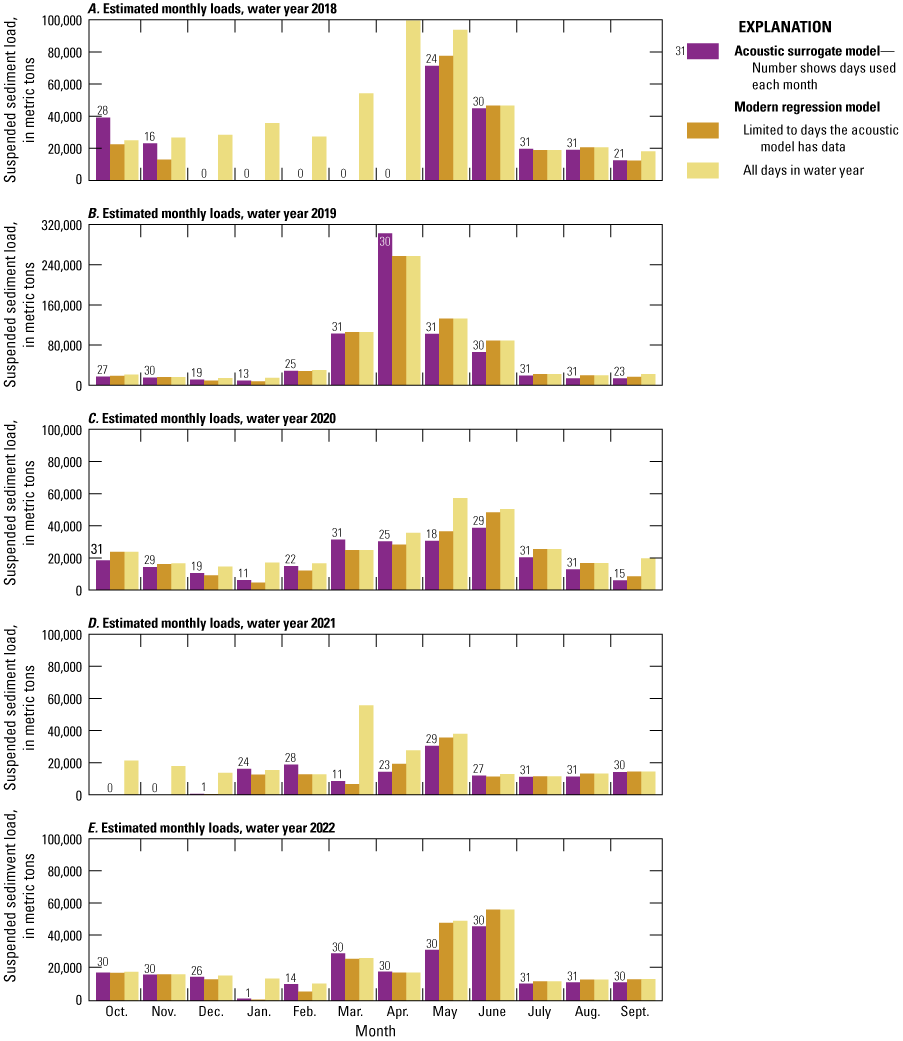
Estimates of total monthly suspended sediment loads for each water year of the modern period of sample collection (2017–22) using an acoustic surrogate model (Evetts, 2023) and the modern period streamflow-based regression model at the Snake River at Weiser, Idaho site (U.S. Geological Survey streamgage 13269000). A, estimated monthly loads, water year 2018; B, estimated monthly loads, water year 2019; C, estimated monthly loads, water year 2020; D, estimated monthly loads, water year 2021; E, estimated monthly loads, water year 2022. [Water year, the 12-month period from October 1 through September 30 of the following year and is designated by the calendar year in which it ends; Oct., October; Nov., November; Dec., December; Jan., January; Feb., February; Mar., March; Apr., April; Aug., August; Sept., September]
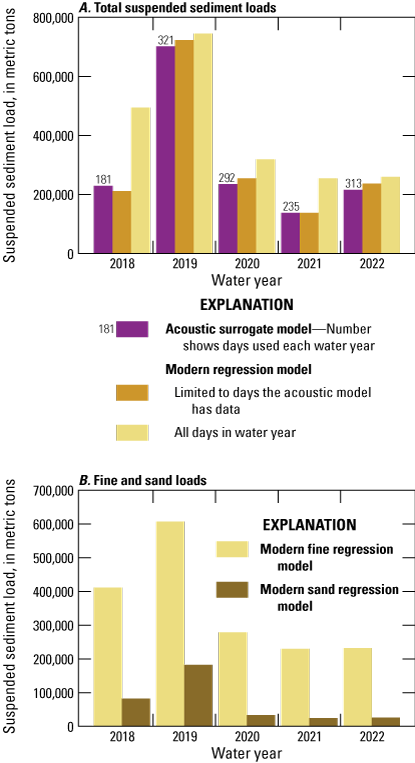
Estimates of suspended sediment loads for the Snake River at Weiser, Idaho site (U.S. Geological Survey streamgage 13269000) for water years in the modern period (2017–22). A, total suspended sediment loads were estimated using a modern period streamflow-based regression model and an acoustic surrogate model (Evetts, 2023). B, loads of fine sediment (less than 0.0625 millimeters) and sand (0.0625–2 millimeters) were estimated using respective modern period streamflow-based regressions models. [Water year, the 12-month period from October 1 through September 30 of the following year and is designated by the calendar year in which it ends]
Monthly load estimates of fine sediment and sand for the modern period are presented in figure 12. Total monthly loads vary among water years, but typically peak in spring and early summer months, coinciding with snowmelt runoff, and remain lower throughout the rest of the year. As expected, sand loads (fig. 12A) are considerably smaller than fine sediment loads (fig. 12B), reflecting the typical fine-sediment-dominated composition of suspended sediment at the Snake at Weiser site. However, during months with elevated Snake and Weiser River streamflow, such as water years 2018 and 2019 (streamflow shown on figure 9A), estimated sand loads increased considerably (fig. 12B). Water year load estimates show similar patterns (fig. 11B), with lower loads of sand relative to fine sediment, and higher loads (particularly for sand) in years with increased streamflow in the Snake and Weiser Rivers.
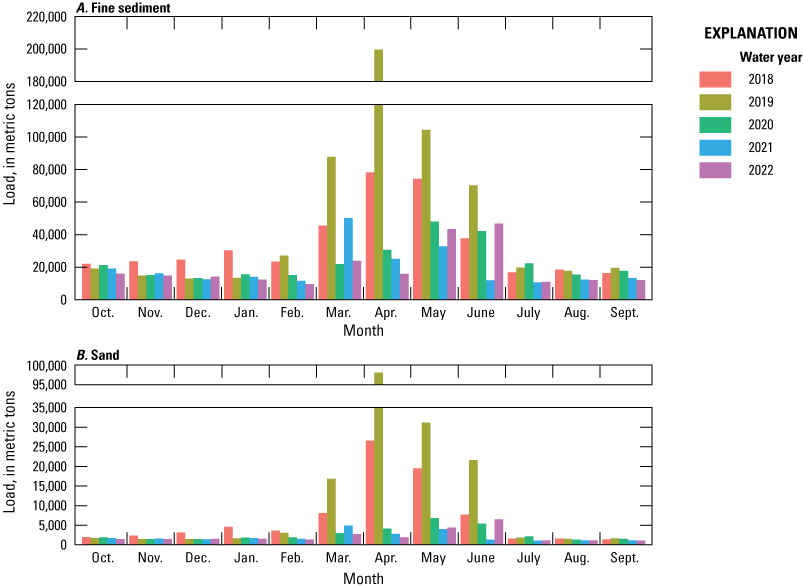
Estimates of total monthly loads of suspended A, fine sediment (less than 0.0625 millimeters) and B, sand (0.0625–2 millimeters) from streamflow-based regression models at Snake River at Weiser, Idaho (U.S. Geological Survey streamgage 13269000) for the modern period of sample collection, 2017–22. [Oct., October; Nov., November; Dec., December; Jan., January; Feb., February; Mar., March; Apr., April; Aug., August; Sept., September]
Discussion
Two findings indicate that period specific regression models are required to more accurately estimate concentrations of total, fine, and sand suspended sediment for the historical and modern periods at the Snake at Weiser site. First, trend testing using model residuals indicated a statistically significant decline of about 0.76 mg/L per year in the median measured SSC during the historical period, after accounting for the effect of streamflow and seasonal differences (table 2; columns showing Mann-Kendall trend test p-values and Theil-Sen slope). Similar trend testing with residuals from period-of-record models also detected statistically significant declines of about 0.40, 0.19, and 0.07 mg/L per year in the median measured concentrations for total suspended sediment, fines, and sand, respectively. The results of these trend tests suggest that suspended sediment inputs to the Snake River upstream from the Snake at Weiser site have changed over time, altering the relation between explanatory variables and SSC. Changes in the difference between irrigation and nonirrigation season concentrations suggest that altered land use or agricultural practices may have contributed to the measured declines in SSC. Median SSC for the irrigation and nonirrigation seasons in the historical period were 57 and 38.0 mg/L, respectively, and 29 and 27 mg/L for the irrigation and nonirrigation seasons in the modern period, respectively (table 1; fig. 5). Not only did SSC decline for both seasons, but the difference between seasons is considerably less in the modern period.
The second line of data indicating that different models are required to more accurately estimate concentrations of suspended sediment for historical and modern periods is that regression statistics generally indicated more accurate predictions by the period-specific models compared to the period-of-record models (table 3). This discrepancy was most noticeable in the bias metric. The period-of-record models not only resulted in greater magnitudes of bias but consistently underestimated concentrations for the historical period and overestimated concentrations for the modern period. For example, biases for estimates of total SSC from the period-of-record model for historical and modern periods were −9.5 and 22.2 percent, respectively (table 3). This consistency in the direction of bias for the period-of-record model for historical and modern concentrations points to a change in measured concentrations over time, further supporting the need for separate models for the historical and modern periods. If suspended sediment loading to the Snake River continues to change, the same concern for the modern models could arise in the future.
The one or two samples with concentrations significantly higher than the rest of the dataset strongly affected some of the final models. Retaining these high values expanded the range of conditions under which the models can be applied, but potentially at the cost of reduced model performance for lower concentrations. Collecting additional high-concentration samples could improve model robustness across the full range of conditions. Similarly, Snake River streamflow during the modern period was generally lower, limiting the range of streamflow for which the modern models can be used. Targeted sampling during higher flow conditions would extend the applicability of modern regression models and improve performance under peak-flow scenarios.
Although regression statistics only identified the Weiser and Payette Rivers as statistically significant explanatory tributaries for SSC at the Snake at Weiser site, the current dataset may be insufficient to detect the effects of other tributaries. For example, during all but one sampling event, corresponding streamflow at the Owyhee River streamgages was less than 500 cubic feet per second (ft3/s), even though this river often exceeds 5,000 ft3/s. Similarly, streamflow on the Malheur River is all less than 1,200 ft3/s during sampling events, even though in many years the Malheur River flows at rates greater than this value. Without more samples that coincide with higher streamflow from the tributaries, the current dataset may not adequately capture the potential effect of tributaries on SSC in this reach of the Snake River. If the tributaries not identified as statistically significant variables for SSC do contribute substantially to SSC in this reach of the Snake River, the current model estimates may underestimate SSC and total loads if tributary streamflow is high.
Regression statistics indicate that models for sand concentrations show weaker performance (table 2), suggesting a less consistent correlation between sand concentrations and streamflow in the Snake River and its tributaries. A previous study using only historical period data also reported a weak correlation between sand concentrations and streamflow (Wilcock and others, 2002). Plotting sand concentration as a function of Snake River streamflow shows an initial increase in sand concentrations with streamflow up to about 30,000 ft3/s, beyond which concentrations tend to plateau (fig. 13). This may indicate an insufficient sand supply in this reach of the Snake River, limiting further increases in concentration despite higher flows. The many upstream impoundments on the Snake River and its tributaries, all constructed before the historical period, have likely reduced sand availability over time. However, the timescale over which sand supply would continue to decline following dam closures is unclear. Mann-Kendall trend tests on the residuals from regression models identified a statistically significant decline in measured sand concentration from 1977 to 2022 but declines in total SSC and fine sediment concentrations suggest more general declines in SSC. Boxplots in figure 4 show reductions in total SSC and fine and sand concentrations during the irrigation season from the historical period to modern period. This may indicate that changes in irrigation and agricultural practices, such as the conversion from flood irrigation to sprinkler systems, are contributing to the declines in sand content from 1977 to 2022. Whether the changes are driven by impoundments, land use changes, or both, the data presented in figure 13 indicates that the Snake River is sand-limited.
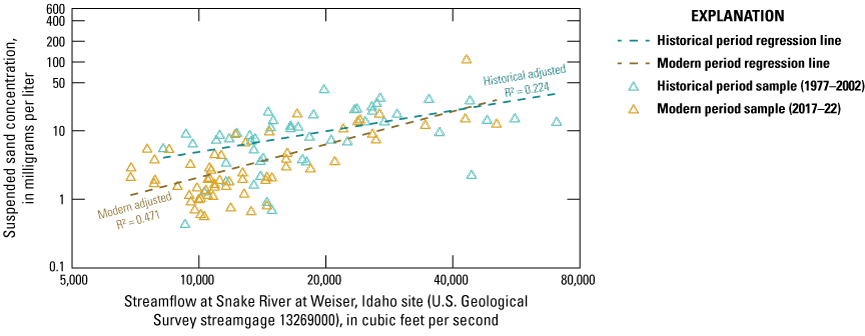
Plot showing measured suspended sand concentrations as a function of streamflow at the Snake River at Weiser, Idaho site (U.S. Geological Survey streamgage 13269000) and regression lines for the historical period (1977–2003) and the modern period (2017–22). Streamflow data from U.S. Geological Survey National Water Information System database (U.S. Geological Survey, 2025b). Suspended sediment concentration data from the Water Quality Portal (National Water Quality Monitoring Council, 2024). [R2, coefficient of determination]
Previous USGS studies have demonstrated that acoustic surrogate models outperform streamflow-based rating curves in predicting SSC on rivers such as the Kootenai, Clearwater, Snake, Colorado Rivers (Topping and others, 2006; Wood and Teasdale, 2013; Wood and others, 2015). At the Snake at Weiser site, however, the acoustic surrogate model produced results similar to those obtained from the streamflow-based regression model (figs. 10, 11, 13). One possible explanation for this similarity is that both models use Weiser River streamflow as an explanatory variable (table 2). The Weiser River enters the Snake River approximately 1 kilometer upstream from the Snake at Weiser site—a distance that may be insufficient for full mixing of the two rivers. As a result, if SSC is elevated in the Weiser River, concentrations may vary considerably across the measurement cross-section on the Snake River. Under these conditions, the backscatter measured by the ADVM may not adequately represent the mean SSC of the cross-section, introducing uncertainty into the relation between sediment corrected backscatter and measured SSC.
Summary
This study developed streamflow-based regression models to estimate total suspended sediment concentration (SSC), as well as fine sediment concentrations (less than 0.0625 millimeters), and sand concentrations (0.0625–2 millimeters), using data collected at the Snake River at Weiser, Idaho site (U.S. Geological Survey streamgage 13269000; hereafter referred to as “Snake at Weiser site”). Models were developed for each grain-size category for the entire period of record (1977–2022), as well as for the historical period (1977–2003) and modern period (2017–22). The Snake at Weiser site is upstream from Brownlee Dam, which is the first of the three dams and impoundments in the Hells Canyon Complex (HCC) operated by Idaho Power. Because of this location, SSC estimates from the Snake at Weiser site provide information for quantifying sediment reaching Brownlee Reservoir. In addition, suspended sediment, particularly the sand fraction, is critical to the formation and maintenance of sandbars in the Hells Canyon National Recreation Area downstream from Hells Canyon Dam (the last of the three dams in the HCC). The large sandbars in Hells Canyon National Recreation Area provide recreation opportunities, riparian habitats, and host archaeological resources, but their numbers and extent have declined since 2007.
The findings of this study indicate significant differences in sediment transport characteristics between the historical period (1977–2003) and the modern period (2017–22), highlighting the need for separate regression models to accurately estimate SSC for each period.
The results of the Mann-Kendall trend tests indicate a statistically significant decline in total SSC during the entire period of record, suggesting changes in sediment inputs to the Snake River over time. This decline is further supported by observed differences in SSC between irrigation and nonirrigation seasons, with irrigation season concentrations in the historical period notably higher than those in the modern period. The regression models developed for the historical and modern periods demonstrate that period-specific models provide better estimates of SSC than models using data from the entire period of record. The period-of-record models exhibited greater bias and less accurate predictions, particularly for the historical period, underscoring the importance of recognizing temporal changes in sediment dynamics in developing predictive models.
The analysis revealed that the Weiser and Payette Rivers were the only statistically significant tributaries for estimating SSC at the Snake at Weiser site; however, the limited dataset may have restricted detection of other tributary influences, such as the Owyhee and Malheur Rivers, which may contribute sediment under high streamflow conditions not captured in the sample dataset. The study found that suspended sediment at the Snake at Weiser site consists primarily of fine grains, with mean percent fines of 83.2 percent. The regression models for the sand fraction of suspended sediment performed less well, indicating that the relation between streamflow and sand concentration is less defined, likely because of the limited sand supply from upstream impoundments. Additionally, the acoustic surrogate model developed for estimating SSC performed comparably to traditional regression models, suggesting that both methods can be effectively used for monitoring sediment dynamics. The similarity in predictions between the acoustic surrogate model and the modern regression model may be attributed to their reliance on Weiser River streamflow as a key explanatory variable.
Overall, this study improves understanding of sediment transport dynamics in the Snake River upstream from the HCC and the Hells Canyon National Recreation Area. The findings can help resource managers better quantifying suspended sediment loads moving through this reach of the Snake River. This information has implications for managing storage in downstream impoundments and for maintaining the large sandbars on the Snake River in the Hells Canyon National Recreation Area.
References Cited
Akaike, H., 1974, A new look at the statistical model identification: Institute of Electrical and Electronics Engineering Transactions on Automatic Control, v. 19, no. 6, p 716–723, accessed January 30, 2025, at https://doi.org/10.1109/TAC.1974.1100705.
Belsley, D.A., Kuh, E., and Welsch, R.E., 1980, Regression diagnostics—Identifying influential data and sources of collinearity: New York, Wiley, 292 p., accessed February 15, 2025, at https://doi.org/10.1002/0471725153.
Bradu, D., and Mundlak, Y., 1970, Estimation in lognormal linear models: Journal of the American Statistical Association, v. 65, no. 329, p. 198–211, accessed February 15, 2025, at https://doi.org/10.1080/01621459.1970.10481074.
Duan, N., 1983, Smearing estimate—A nonparametric retransformation method: Journal of the American Statistical Association, v. 78, no. 383, p. 605–610, accessed January 25, 2025, at https://doi.org/10.1080/01621459.1983.10478017.
Evetts, D.M., 2023, Model Archive Summary for acoustic derived suspended-sediment concentration at 13269000 Snake River at Weiser, ID: U.S. Geological Survey data release, https://doi.org/10.5066/P9YT1GIC.
Helsel, D.R., Hirsch, R.M., Ryberg, K.R., Archfield, S.A., and Gilroy, E.J., 2020, Statistical methods in water resources: U.S. Geological Survey Techniques and Methods, book 4, chap. A3, 458 p. [Also available at https://doi.org/10.3133/tm4A3.] [Supersedes USGS Techniques of Water-Resources Investigations, book 4, chap. A3, version 1.1.]
Idaho Geological Survey, 2023, WebMap4—Interactive Geologic Map of Idaho: Idaho Geological Survey interactive web map, accessed August 2, 2025, at https://www.idahogeology.org/WebMap4/.
Idaho Power, 2003, Sediment transport, supply, and stability in the Hells Canyon Reach of the Snake River (technical report app. E.1–1): Idaho Power web page accessed January 28, 2026, at https://docs.idahopower.com/pdfs/relicensing/hellscanyon/hellspdfs/techappendices/Sediment/e01_01.pdf.
Idaho Power, 2025a, Relicensing the Hells Canyon Complex: Idaho Power, accessed January 21, 2025, at https://www.idahopower.com/energy-environment/energy/energy-sources/hydroelectric/relicensing/relicensing-hcc/.
Idaho Power, 2025b, WebPortal: Idaho Power, accessed September 15, 2024, at https://idastream.idahopower.com/.
Kenworthy, M.K., 2026, Suspended sediment dataset for development of regression models to estimate suspended sediment concentration and loads for the Snake River at Weiser, Idaho, 1977–2022: U.S. Geological Survey data release, https://doi.org/10.5066/P14KZNMK.
Landers, M.N., Straub, T.D., Wood, M.S., and Domanski, M.M., 2016, Sediment acoustic index method for computing continuous suspended-sediment concentrations: U.S. Geological Survey Techniques and Methods, book 3, chap. C5, 63 p., accessed January 24, 2025, at https://doi.org/10.3133/tm3C5.
National Water Quality Monitoring Council, 2024, Water quality portal: National Water Quality Monitoring Control database, accessed October 15, 2024, at https://www.waterqualitydata.us/data/Result/search?siteid=USGS-13269000&count=no&pCode=80154%3B70331&startDateLo=11-04-1977&startDateHi=09-03-2003&mim eType=csv.
Oregon Department of Geology and Mineral Industries, 2021, Oregon Geology (DOGAMI)—Statewide Geologic Units: Oregon Geospatial Enterprise Office GEOHub, accessed August 2, 2025, at https://geohub.oregon.gov/documents/2542ba1c493b4008be4c61e51f7a1177/about.
Palecki, M., Durre, I., Applequist, S., Arguez, A., and Lawrimore, J., 2021, U.S. Climate Normals 2020—U.S. Annual/Seasonal Climate Normals (1991–2020): NOAA National Centers for Environmental Information, accessed January 29, 2026, at https://www.ncei.noaa.gov/metadata/geoportal/rest/metadata/item/gov.noaa.ncdc%3AC01619/html#.
R Core Team, 2025, R—A language and environment for statistical computing: R Foundation for Statistical Computing software release, accessed January 10, 2025, at https://www.R-project.org.
Runkel, R.L., and De Cicco, L.A., 2017, Rloadest—River load estimation (version 0.4.5): Github software release, accessed September 10, 2024, at https://github.com/USGS-R/rloadest.
Schleiss, A.J., Franca, M.J., Juez, C., and De Cesare, G., 2016, Reservoir sedimentation: Journal of Hydraulic Research, v. 54, no. 6, p. 595-614, accessed March 25, 2025 at https://doi.org/10.1080/00221686.2016.1225320.
Schmidt, J.C., Grams, P.E., and Webb, R.H., 1995, Comparison of the magnitude of erosion along two large regulated rivers: Journal of the American Water Resources Association, v. 31, no. 4, p. 617–631, accessed January 16, 2025, at https://doi.org/10.1111/j.1752-1688.1995.tb03389.x.
Topping, D., Wright, S.A., Melis, T.S., and Rubin, D.M., 2006, High-resolution monitoring of suspended-sediment concentration and grain size in the Colorado River using laser-diffraction instruments and a three-frequency acoustic system—Proceedings of the 8th Federal Interagency Sedimentation Conference, April 2–6, 2006: Reno, Nevada, CD-ROM, ISBN 0-9779007-1-1.
U.S. Army Corps of Engineers, n.d., National inventory of dams: U.S. Army Corps of Engineers database, accessed January 28, 2026, athttp://https://nid.sec.usace.army.mil/nid/#/.
U.S. Forest Service, 2007, Final Section 7(a) determination and report, Wild and Scenic Rivers Act, Hells Canyon Complex Hydroelectric Project, Project: National Wild and Scenic Rivers System web page, accessed January 12, 2025, at https://www.rivers.gov/sites/rivers/files/2024-03/hellscanyon-section7-report.pdf.
U.S. Geological Survey, 2006, Collection of water samples (ver. 2.0): U.S. Geological Survey Techniques of Water-Resources Investigations, book 9, chap. A4, accessed May 3, 2024, at https://doi.org/10.3133/twri09A4.
U.S. Geological Survey, 2016, WQ2016.10 policy and guidance for approval of surrogate regression models for computation of time series suspended-sediment concentrations and loads: U.S. Geological Survey Office of Surface Water Technical Memorandum 2016.07, accessed January 16, 2025, at https://water.usgs.gov/water-resources/memos/memo.php?id=467.
U.S. Geological Survey, 2018a, USGS National Hydrography Dataset Plus High Resolution (NHDPlus HR) for 4-digit Hydrologic Unit - 1704 (published 20180827), accessed January 16, 2025, at https://www.usgs.gov/national-hydrography/access-national-hydrography-products.
U.S. Geological Survey, 2018b, USGS National Hydrography Dataset Plus High Resolution (NHDPlus HR) for 4-digit Hydrologic Unit - 1705 (published 20180827): U.S. Geological Survey, accessed January 16, 2025, at https://www.usgs.gov/national-hydrography/access-national-hydrography-products.
U.S. Geological Survey, 2018c, USGS National Hydrography Dataset Plus High Resolution (NHDPlus HR) for 4-digit Hydrologic Unit - 1706 (published 20180827): U.S. Geological Survey, accessed January 16, 2025, at https://www.usgs.gov/national-hydrography/access-national-hydrography-products.
U.S. Geological Survey, 2025a, USGS 3D Elevation Program Digital Elevation Model, accessed October 7, 2025, at https://elevation.nationalmap.gov/arcgis/rest/services/3DEPElevation/ImageServer.
U.S. Geological Survey, 2025b, USGS Water Data for the Nation: U.S. Geological Survey National Water Information System database, accessed January 5, 2025, at https://nwis.waterdata.usgs.gov/nwis.
U.S. Geological Survey, 2025c, Watershed Boundary Dataset, accessed August 10, 2025 at https://www.usgs.gov/national-hydrography/access-national-hydrography-products.
Welcker, C., Carson, G., and Anderson, K., 2018, Fifty years of sediment dynamics in a large reservoir in the western US—AGU 2018 Fall Meeting, Washington, D.C., December 10–14, 2018: American Geophysical Union, [presentation], accessed July 29, 2025, at https://www.researchgate.net/publication/329783270_Fifty_Years_of_Sediment_Dynamics_in_a_Large_Reservoir_in_the_Western_US.
Whelan, M., and Hotchkiss, R., 2024, Facing the Challenges of Reservoir Sedimentation: Civil Engineering Magazine, v. 94, no. 2, p. 66-73, accessed January 16, 2025, at https://doi.org/10.1061/ciegag.0001716.
Wilcock, P.R., Schmidt, J.C., Grams, P.E., 2002, Review of Idaho Power Company documents concerning sediment-related impacts of the Hells Canyon Complex Dams on the Snake River in Hells Canyon: Report submitted to the Wallowa-Whitman National Forest, accessed January 5, 2025, at https://docs.idahopower.com/pdfs/Relicensing/hellscanyon/hellspdfs/techappendices/consultation/VII_CommentsIPCResponses/Federal_Agencies/FWS_Enclosure _01.pdf.
Wood, M.S., Fosness, R.L., and Etheridge, A.B., 2015, Sediment transport and evaluation of sediment surrogate ratings in the Kootenai River near Bonners Ferry, Idaho, water years 2011–14: U.S. Geological Survey Scientific Investigations Report 2015–5169, 48 p., accessed February 10, 2025, at https://doi.org/10.3133/sir20155169.
Wood, M.S., and Teasdale, G.N., 2013, Use of surrogate technologies to estimate suspended sediment in the Clearwater River, Idaho, and Snake River, Washington, 2008–10: U.S. Geological Survey Scientific Investigations Report 2013–5052, 30 p., accessed February 10, 2025, at https://doi.org/10.3133/sir20135052.
Conversion Factors
International System of Units to U.S. customary units
Supplemental Information
Horizontal coordinate information is referenced to the North American Datum of 1983 (NAD 83).
Elevation, as used in this report, refers to distance above the vertical datum.
Concentrations of chemical constituents in water are in either milligrams per liter (mg/L) or micrograms per liter (µg/L).
A water year is the 12-month period from October 1 through September 30 of the following year and is designated by the calendar year in which it ends.
For information about the research in this report, contact
Director, Idaho Water Science Center
U.S. Geological Survey
230 Collins Rd., Boise, Idaho 83702-4520
https://www.usgs.gov/centers/id-water
Publishing support provided by the U.S. Geological Survey, Science Publishing Network, Tacoma and Baltimore Publishing Service Centers.
Disclaimers
Any use of trade, firm, or product names is for descriptive purposes only and does not imply endorsement by the U.S. Government.
Although this information product, for the most part, is in the public domain, it also may contain copyrighted materials as noted in the text. Permission to reproduce copyrighted items must be secured from the copyright owner.
Suggested Citation
Kenworthy, M.K., 2026, Regression models for estimating suspended sediment concentrations and loads and comparison with acoustic surrogate model on the Snake River, Weiser, Idaho, 1977–2022: U.S. Geological Survey Scientific Investigations Report 2026–5007, 27 p., https://doi.org/10.3133/sir20265007.
ISSN: 2328-0328 (online)
Study Area
| Publication type | Report |
|---|---|
| Publication Subtype | USGS Numbered Series |
| Title | Regression models for estimating suspended sediment concentrations and loads and comparison with acoustic surrogate model on the Snake River, Weiser, Idaho, 1977–2022 |
| Series title | Scientific Investigations Report |
| Series number | 2026-5007 |
| DOI | 10.3133/sir20265007 |
| Publication Date | May 07, 2026 |
| Year Published | 2026 |
| Language | English |
| Publisher | U.S. Geological Survey |
| Publisher location | Reston, VA |
| Contributing office(s) | Idaho Water Science Center |
| Description | Report: vi, 27 p.; 2 Data Releases |
| Country | United States |
| State | Idaho, Nevada, Oregon, Utah |
| Other Geospatial | Snake River |
| Online Only (Y/N) | Y |
| Additional Online Files (Y/N) | N |