

Simulation of Groundwater Flow To Evaluate Hydrogeologic Controls on a PFAS Plume, Coakley Landfill Superfund Site, Rockingham County, New Hampshire
Links
- Document: Report (12.27 MB pdf) , HTML , XML
- Related Works:
- Scientific Investigations Report 2008–5222 - Assessment of ground-water resources in the Seacoast region of New Hampshire
- USGS data release - MODFLOW-NWT upgrade and preliminary-assessment of a groundwater-flow model of the seacoast bedrock aquifer, New Hampshire
- Data Release: USGS data release - MODFLOW-NWT and MODPATH6 files used for groundwater-flow simulation and pathline analyses in the vicinity of the Coakley Landfill Superfund site, Rockingham County, New Hampshire
- NGMDB Index Page: National Geologic Map Database Index Page (html)
- Superseded Publications:
- Download citation as: RIS | Dublin Core
Acknowledgments
The collaborative effort of this study involved Federal, State, and local government agencies, and private companies and individuals. The authors wish to thank Richard Hull, site remedial project manager, and William Brandon, hydrogeologist, both from the U.S. Environmental Protection Agency, for their leadership in managing site characterization efforts and in providing technical assistance with data access and processing. The authors also thank Andrew Hoffman of the New Hampshire Department of Environmental Services for help with several important datasets including well monitoring locations.
Abstract
Per- and polyfluoroalkyl substances (PFAS), including perfluorooctanoic acid (PFOA) and perfluorooctanesulfonic acid (PFOS), have been detected at combined concentrations above 2,000 nanograms per liter (ng/L) at groundwater seep locations near the Coakley Landfill Superfund site, in North Hampton, New Hampshire. The landfill was active from 1972 to 1985. An impermeable cap was placed on the landfill in 1998. The adjacent area to the Coakley Landfill has many water supply wells, and transport of PFAS compounds to the wells is a concern. Fracture anisotropy in the underlying bedrock aquifer complicates the understanding of PFAS transport because groundwater preferentially travels along fractures that may not align with the prevailing groundwater flow direction.
In 2018, the U.S. Environmental Protection Agency and the U.S. Geological Survey began an investigation of the groundwater flow from the Coakley Landfill site. This report describes the modification of a numerical groundwater-flow model for the local area around the Coakley Landfill and summarizes findings of the investigation. In addition, this report includes a brief description of PFOA and PFOS occurrence, a discussion of model construction, evaluation of model performance through calibration, and discussion of simulation results for two periods (before and after capping). Limitations are also discussed.
Results show that simulated groundwater flow moves from the Coakley Landfill to the west and north. Advective transport modeling using particle tracking shows that groundwater from the landfill discharges primarily to streams to the west and north, and a small amount is transported to distal wells. Dilution of contaminants through advection and dispersion likely plays a role in whether PFAS compounds from the landfill will be detected above laboratory reporting levels at distal wells.
Plain Language Summary
A class of chemicals called per- and polyfluoroalkyl substances (PFAS) has been seeping from the Coakley Landfill in southeastern New Hampshire to the local groundwater. The movement of the groundwater is complex because of the local geology, and more information is needed about where PFAS goes after it comes out of the landfill. The U.S. Geological Survey worked with the U.S. Environmental Protection Agency to understand more about how PFAS move from the landfill through the local groundwater and why concentrations are higher in some places than in others. A computer groundwater model of the Coakley Landfill area was developed based on an older groundwater model for southeast New Hampshire, and the new model was used to explore how soil, bedrock, rain or snowmelt infiltration, and bedrock fractures affect the speed and direction of groundwater flow. The new model was refined using recently collected data from the bedrock aquifer, where the greatest contamination from the Coakley Landfill has been detected. A modeling technique called particle tracking was used to estimate where groundwater travels from the landfill. The model shows that groundwater flows primarily to the west, north, and northeast from the landfill, likely following bedrock fractures. Some groundwater flow paths originating at the landfill eventually come to the surface in streams, up to about 3 miles away from the landfill. These flow paths predicted by the model may explain why there have been PFAS detections in wells relatively far from the landfill. However, predicted groundwater flow paths do not account for some factors that could reduce the total travel distance of contaminants, like dilution, mixing, and adsorption. Model results show that an impermeable cap placed on the landfill in 1998 reduces the amount of rain and snowmelt that flow into the landfill.
Introduction
From 1972 to 1985, the Coakley Landfill received waste from various sources, including Pease Air Force Base (now Pease Air National Guard Base) and the City of Portsmouth, New Hampshire incineration facility (U.S. Environmental Protection Agency [EPA], 2016). The inactive landfill covers about 27 acres in the town of North Hampton, New Hampshire (fig. 1). In 1985, the State of New Hampshire and the EPA initiated an investigation of contaminants in groundwater beneath the landfill and outside its boundaries, leading to the EPA's declaration of the landfill as a Superfund program site in 1986. The initial and subsequent investigations identified benzene, chlorobenzene, arsenic, manganese, and 1,4-dioxane in groundwater at and near the site (EPA, 2016). Notably, 1,4-dioxane was also detected in exceedance of the New Hampshire Department of Environmental Services (NHDES) ambient groundwater quality standards at two offsite bedrock wells (wells R-3 and 339BHR, shown on fig. 2B; CES, Inc., 2019), indicating deep penetration of contaminants into the bedrock aquifer. Capping of the landfill was completed in 1998 as part of remedial efforts at the site. A 92-acre groundwater management zone was designated around the landfill (extending north into the towns of Greenland and Rye) in 2014 (fig. 2B; EPA, 2016). More recently, two per- and polyfluoroalkyl substances (PFAS), perfluorooctanoic acid (PFOA) and perfluorooctanesulfonic acid (PFOS), have been detected at concentrations above the New Hampshire ambient groundwater quality standards levels for PFOA and PFOS (12 and 15 nanograms per liter [ng/L], respectively [NHDES, 2023], though EPA has instituted a national public drinking water regulation of 4 ng/L for each [EPA, 2024]) at wells both within (“onsite”) and outside (“offsite”) the groundwater management zone (fig. 2A; EPA, 2021; NHDES, [undated]). Contaminant concentrations immediately north and west of the site that are higher than concentrations east of the site (fig. 3A, B) indicate a local groundwater divide on the east flank of the landfill between the Berrys Brook and Bailey Brook watersheds (fig. 3).
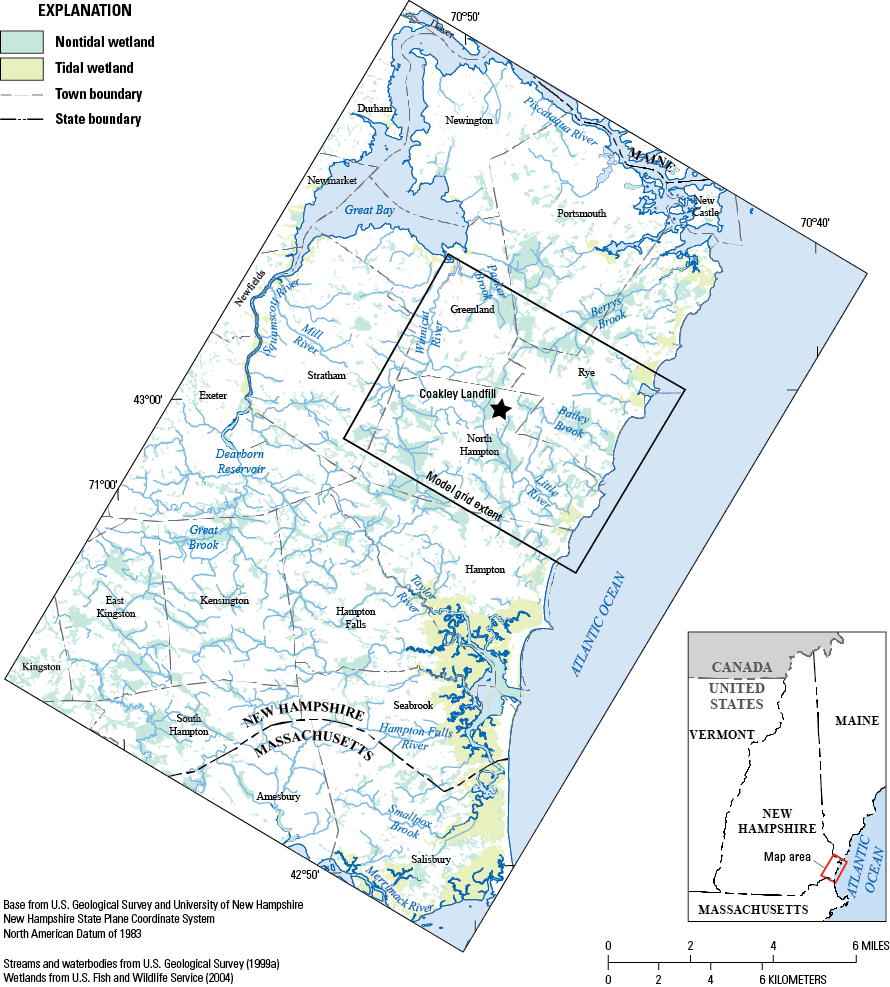
Location map of the model grid, Coakley Landfill Superfund site, New Hampshire. Figure modified from Mack (2009), figure 1.
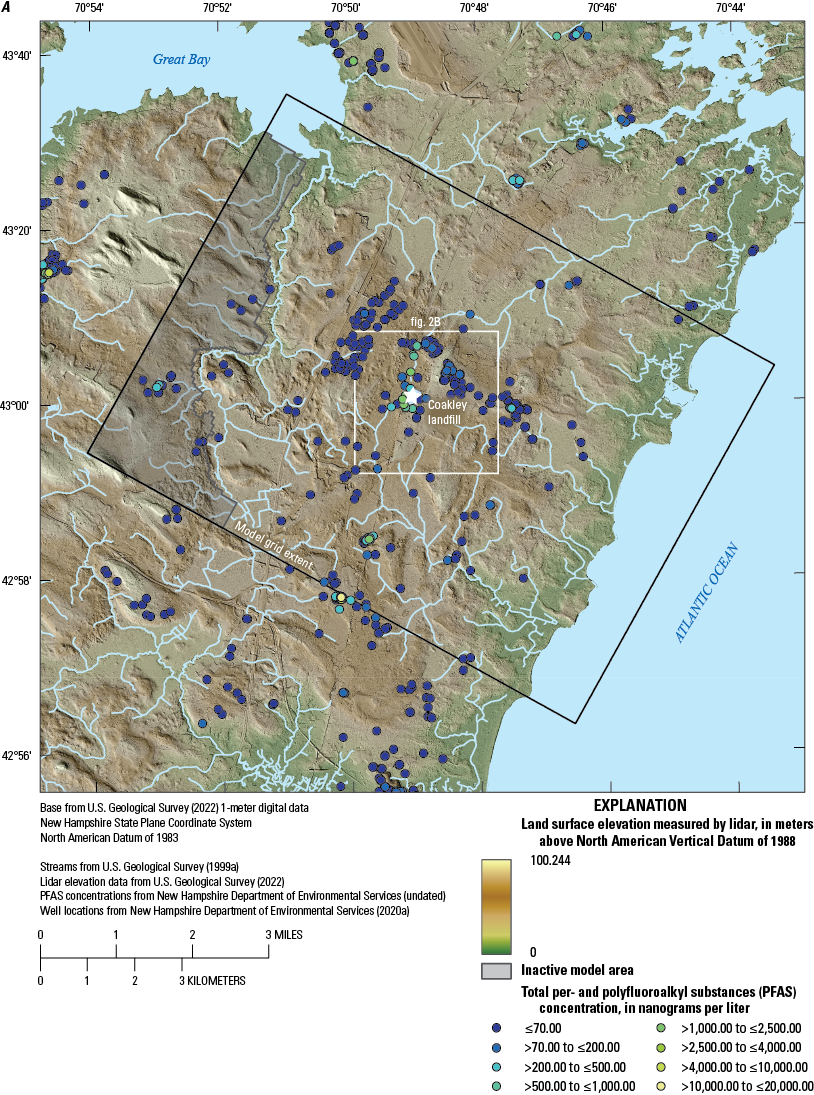
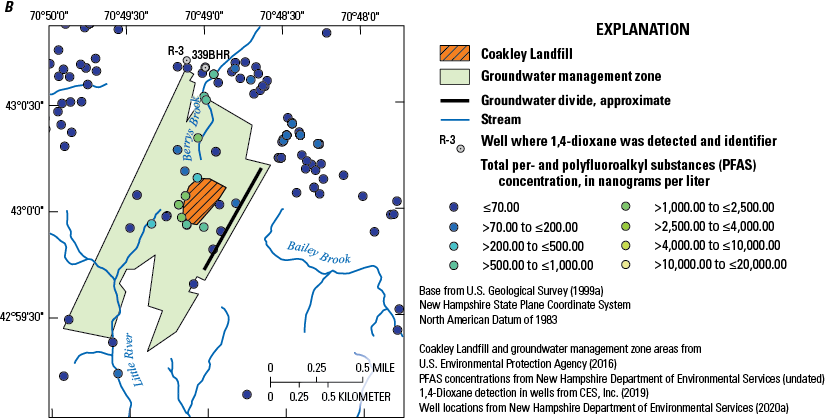
Location maps of Coakley Landfill Superfund site and wells sampled for per- and polyfluoroalkyl substances (PFAS). A, Lidar topography, and total concentration of PFAS from groundwater wells. B, Inset showing PFAS concentrations from groundwater wells near the landfill and the site groundwater management zone.
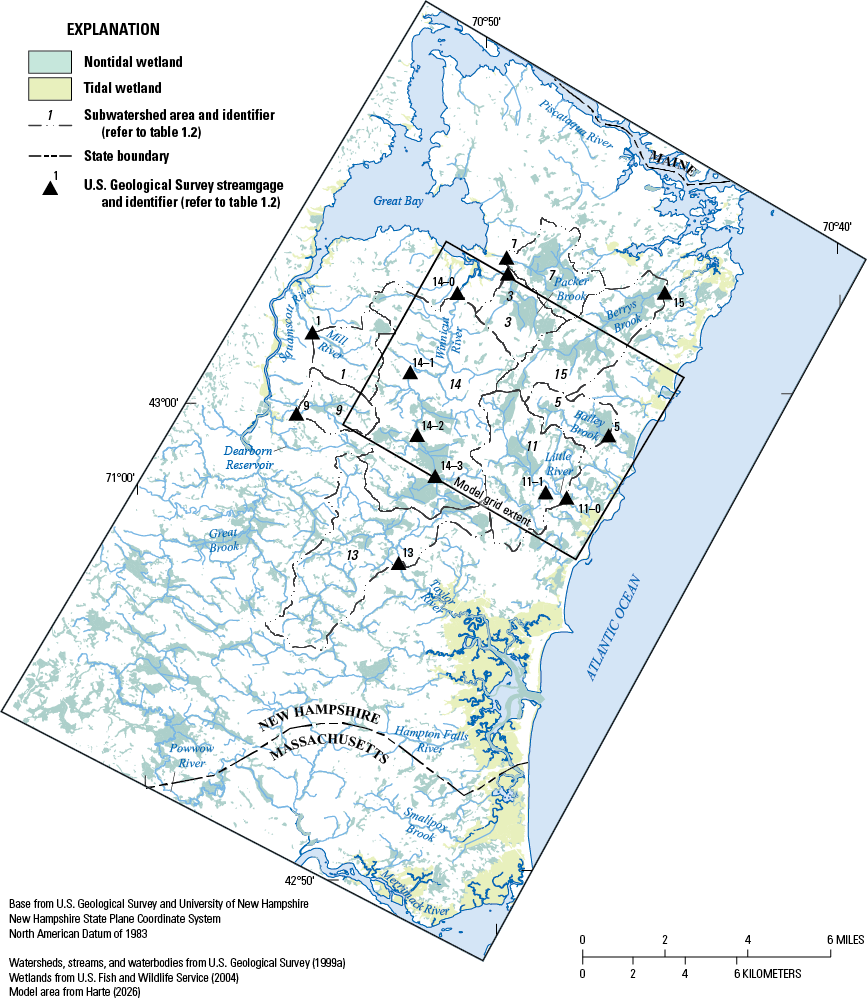
Map of watershed drainage areas and selected streamgages used in the development and calibration of the Coakley Landfill model, New Hampshire. Modified from Mack (2009), figure 2. Basin names are provided in table 1. Detailed streamgage information is provided in appendix 1, table 1.1.
Table 1.
Observed October streamflows for basins simulated in the Coakley Landfill model as measured by Mack (2009).[Basin numbers are provided in figure 2. Detailed streamgage information is provided in appendix 1, table 1.1. ft3/d, cubic feet per day]
| Basin number (fig. 3) | Basin name | Streamflow, in ft3/d |
|---|---|---|
| 14 | Winnicut River | 630,720 |
| 11 | Little River | 216,000 |
| 15 | Berrys Brook | 267,840 |
| 5 | Bailey Brook | 94,176 |
| 7 | Pickering Brook | 52,704 |
| 3 | Packer Brook | 48,384 |
The bedrock aquifer in southeast New Hampshire has local and regional patterns of groundwater flow (Mack, 2009). Unlike surficial aquifers in the region that are constrained by drainage basins, the bedrock aquifer is regionally contiguous. Whereas the spatially limited surficial flow system is characterized by flow paths that may extend several hundred to a few thousand feet, the regional flow system has flow paths that extend for miles. The boundary between local and regional flow systems is controlled by topography, recharge patterns, and bedrock hydraulic conductivity (Harte and Winter, 1995). Further, the interaction between local and regional-flow systems can be dynamic and may change because of time-varying hydrologic conditions, including variations in recharge, groundwater withdrawals from wells, and return flow of nonconsumptive water that acts as artificial recharge.
Population also affects groundwater flow paths. As the population of southeast New Hampshire increases, water demand and groundwater withdrawals are also expected to increase (Horn and others, 2008; Mack, 2009). Groundwater withdrawals affect local and regional groundwater flow, so additional pumping to meet increased demand is expected to alter flow paths. Therefore, any assessment of groundwater flow paths for the bedrock aquifer underlying the Coakley Landfill would be strengthened by an assessment of regional flow paths.
The U.S. Geological Survey has developed a regional groundwater-flow model of southeast New Hampshire (Mack, 2009, 2017, 20232627). This model can be modified and scaled in conjunction with local site information to provide a comprehensive analysis of the local flow system within the framework of the regional flow system. The area surrounding the Coakley Landfill, particularly to the north and northwest, contains residential wells drilled into the bedrock aquifer and used for water consumption. Much of the area is also unsewered and instead uses septic fields, which return a part of the pumped water from the domestic wells or water supply lines to both the surficial aquifer and bedrock aquifer. Further development with the addition of new domestic or commercial wells will increase the water use from the bedrock aquifer, creating new flow patterns. The construction of a localized groundwater-flow model, informed by regional flow patterns, may help stakeholders assess the complex patterns of flow, changes in patterns of flow over time, and may identify important hydrogeologic features that control flow.
For this study, we scale the existing groundwater flow model (Mack, 2009, 2017, 2023) to show additional detail in the vicinity of the Coakley Landfill and account for new information to evaluate aquifer responses to pumping stresses, support decision making, and communicate to the public (Zhou and Li, 2011). The scaled model also supports the assessment of flow paths, which is important for water managers and environmental regulators in charge of remediation of contaminated sites. Groundwater flow in highly heterogeneous, fractured rock is particularly complex, and the flow is primarily through discrete pathways. The regional groundwater-flow model of southeast New Hampshire uses an equivalent porous medium to simulate groundwater flow. This technique has been used in previous studies to understand the distribution of bulk flow in bedrock aquifers similar to this study. In the regional groundwater-flow model, distributional flow in the bedrock is represented by anisotropy in the vertical and horizontal hydraulic conductivity field that attempts to mimic the distributional tendencies of water-bearing fractures (Harte, 2021).
In 2018, the U.S Environmental Protection Agency and the U.S. Geological Survey entered into an interagency agreement to investigate the groundwater flow from the Coakley Landfill site. This investigation was done by integrating local site-specific information into the regional parameters and conditions of the southeast New Hampshire model developed by Mack (2009, 2017, 2023). Some specific objectives of this work include (1) identifying hydrogeologic controls on local groundwater flow, (2) identifying the interaction of local flow and regional flow so as to determine the potential for distal flow paths emanating from the Coakley Landfill, and (3) assessing differences in flow before and after capping of the Coakley Landfill to help understand differences in historical flow paths.
Site Description
The 92-acre Coakley Landfill Superfund site is located in the towns of Greenland and North Hampton, New Hampshire. The Coakley Landfill covers about 27 acres in the southern part of the site and is entirely within the town of North Hampton (figs. 1, 2B; CES, Inc., 2018a). The town of North Hampton operated the landfill between 1972 and 1985 (EPA, 2021). It accepted municipal and industrial wastes from local municipalities and federal entities. Coincident with landfill operations, rock quarrying took place at the site from 1973 through 1977. Site operators placed some of the disposed wastes in open (some liquid-filled) trenches created by rock quarrying and sand and gravel mining. Site operators also accepted incinerator residue from nearby incineration plants that operated from 1982 to 1985. Disposal activities resulted in the contamination of soil, groundwater, and surface water with metals and organic contaminants. Prior to the introduction of public water supply to the area in the 1980s, these contaminants were found in the private water-supply wells in the vicinity of the Coakley Landfill (Hoffman, 2025).
The landfill forms a prominent raised plateau with moderately steep slopes except on the northern side, which has a gentler slope. As part of site remedial design and construction activities implemented in the mid- and late 1990s, stormwater runoff from the landfill surface is conveyed by a series of perimeter drainage ditches and other structures to two unlined stormwater retention basins, one near the northeast corner of the landfill and one near the northwest corner of the landfill. Stormwater retained in the basins is subsequently discharged to adjacent wetland areas and ultimately to Berrys Brook through infiltration and an outlet structure in each basin. Several discrete groundwater discharge zones, or seeps, are located where the steep northwestern landfill slopes intersect natural ground. The seeps likely have some combination of interflow (subsurface flow above the water table) and shallow groundwater flow.
The Coakley Landfill site borders undeveloped woodlands and wetlands to the west, and commercial and scattered residential properties to the north, east, and south. Some residential properties in the area use private wells for water supply. A nearby golf course to the north has several wells in both the surficial aquifer and the bedrock aquifer for irrigation and potable water, respectively. Much of the area is also unsewered; septic fields return a part of pumped water from the domestic wells to the underlying aquifers. The commercial development to the east is serviced by the town water supply.
Climate in the model area is characterized by wet continental conditions with cold winters and warm summers (Köppen, 1884). Average annual precipitation for southeast New Hampshire ranges from 35 to 53 inches per year (Flynn and Tasker, 2004). Based on analysis of streamflow regression characteristics, about 40 percent of the annual precipitation of the area recharges the underlying aquifers (Flynn and Tasker, 2004).
The landfill sits atop a local topographic high and is underlain by a complex geologic structure that includes surficial sediments (0–88 feet [ft] thick; fig. 4A) and the underlying Rye Complex, including metasedimentary schists and gneisses (Lyons and others, 1997) and the informal Breakfast Hill granite (figs. 4B; Hussey and others, 2016). Transmissivity of surficial sediments is indicated in figure 4A. Mapped transmissivity values are representative of permeable glaciofluvial stratified drift deposits, generally Quaternary in age (Stekl and Flanagan, 1992). Areas without mapped transmissivity values consist primarily of less permeable sediments: Quaternary glacial till (unsorted mixture of various sediment sizes), glaciomarine clays and silts, and Holocene wetland deposits.
The underlying rock of the Breakfast Hill granite and schists and gneisses of the Rye Complex have been mapped by Lyons and others (1997) and Hussey and others (2016). Multiple faults at the contact between the Breakfast Hill granite and other rocks of the Rye Complex have been identified. The fracture network in these rocks is strongly anisotropic. The predominant fracture orientation is northeast-southwest, roughly parallel to foliation, with a median fracture dip of 64 degrees west-northwest (Haley Ward, Inc., 2021).
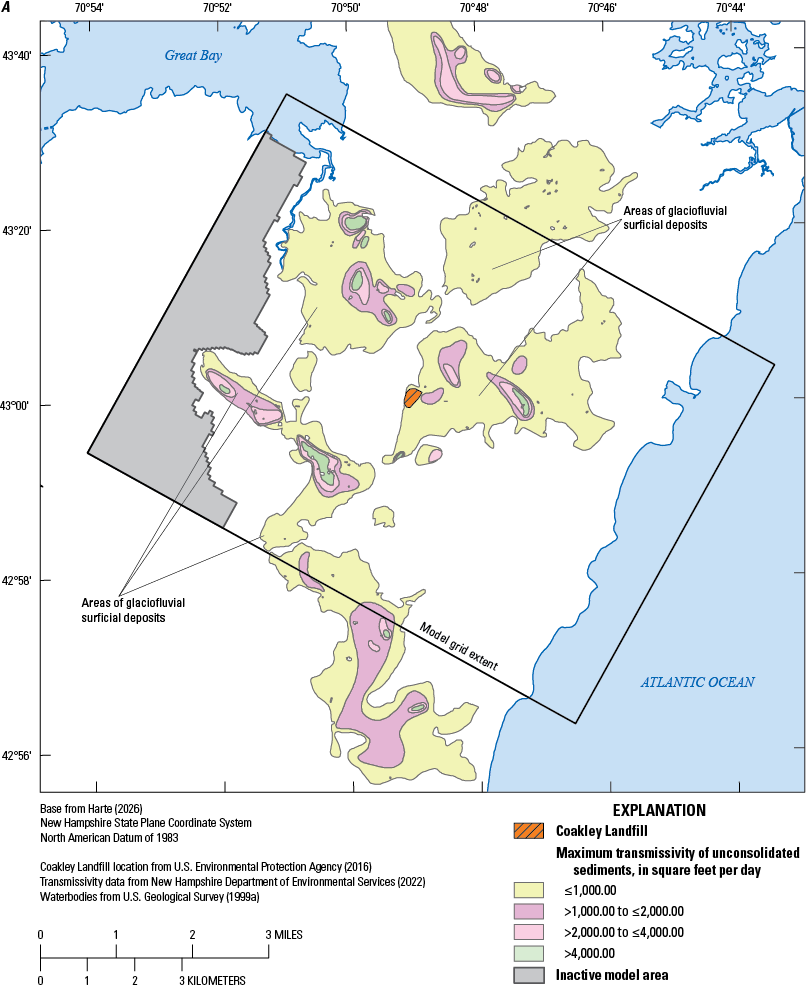
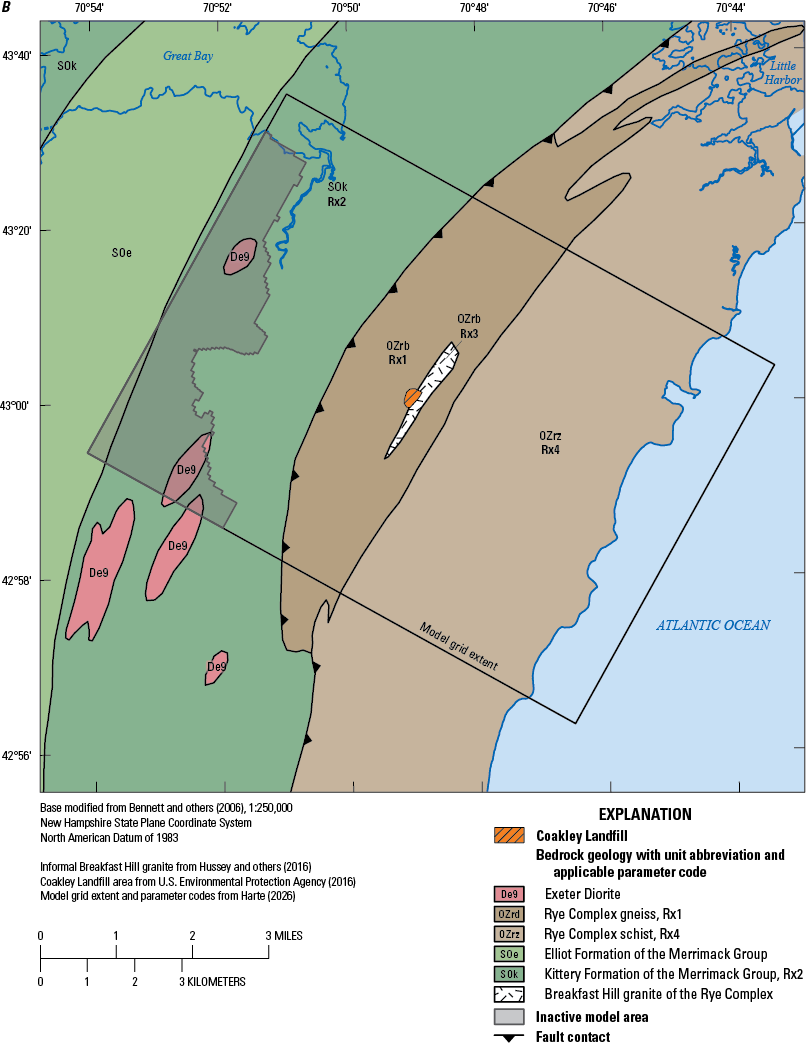
Maps of generalized surficial and bedrock geology near the Coakley Landfill Superfund site, New Hampshire. A, Unconsolidated sediments with transmissivity rates; and B, bedrock geology.
Coakley Landfill PFAS Plume Background
Water-quality monitoring of sediment, surface water, seeps, and groundwater including monitoring wells at the Coakley Landfill site and adjacent water supply wells have been ongoing since 1998 (CES, Inc., 2018a). PFAS contamination in soil and groundwater is a growing concern internationally (Simon and others, 2019); six PFAS were added to the list of contaminants of concern at the Coakley Landfill beginning in 2016 (EPA, 2016). Four of these are regulated compounds in New Hampshire; perfluorooctanesulfonic acid (PFOS), perfluorooctanoic acid (PFOA), perfluorononanoic acid (PFNA), and perfluorohexanesulfonic acid (PFHxS). The two unregulated compounds are perfluoroheptanesulfonic acid (PFHpS), and perfluorobutanesulfonic acid (PFBS).
At the Coakley Landfill site, PFOS and PFOA are the compounds most commonly found above the New Hampshire ambient groundwater quality standards in surface and groundwater (12 and 15 ng/L, respectively [NHDES, 2023]). Perfluorohexanesulfonic acid (PFHxS) and perfluorononanoic acid (PFNA) do not routinely exceed their respective state standards of 18 ng/L and 11 ng/L (CES, Inc., 2020b; NHDES, 2023).
Historically, the highest PFAS concentrations have been found in groundwater seeps at the embankments of the landfill and from surface runoff from the Coakley Landfill site. In 2019, a maximum combined PFOA and PFOS concentration of 516 ng/L was found in water from a seep on the western side of the landfill and a concentration of 1,525 ng/L was observed in samples of surface water near the Coakley Landfill (CES, Inc., 2020a). Further, in 2019, a maximum combined PFOA and PFOS concentration of PFAS compounds in sediment was found to be 0.02798 milligram per kilogram (CES, Inc., 2020a).
In 2019, PFOA and PFOS were found in samples of groundwater from monitoring wells near the landfill with maximum combined concentrations of 1,398 ng/L in the fall and 1,404 ng/L in the spring (CES, Inc., 2020a). Notably, combined concentrations of PFOA and PFOS exceeded 1,000 ng/L in multiple onsite bedrock monitoring wells, demonstrating penetration of contaminants from the overburden into the bedrock aquifer. Offsite, the maximum combined PFOA and PFOS concentration in samples of water-supply wells was 16.57 ng/L (CES, Inc., 2020a).
Based on 2019 sampling results (CES, Inc., 2020a) in surface water and soil near the landfill, concentrations of PFOS generally exceed concentrations of PFOA. Farther from the landfill, concentrations of PFOA are generally higher than concentrations of PFOS in surface water and soil. This is consistent with PFOS’s relatively lower solubility and mobility (EPA, 2017; Xing and others, 2021). Groundwater concentrations of PFOA exceed concentrations of PFOS at almost every sample location (CES, Inc., 2020a). The distribution of total dissolved PFOA concentrations in groundwater of the bedrock near the Coakley Landfill site is shown in figure 5. The PFOA plume initiates near the landfill and extends to the north, beneath the headwaters of Berrys Brook.
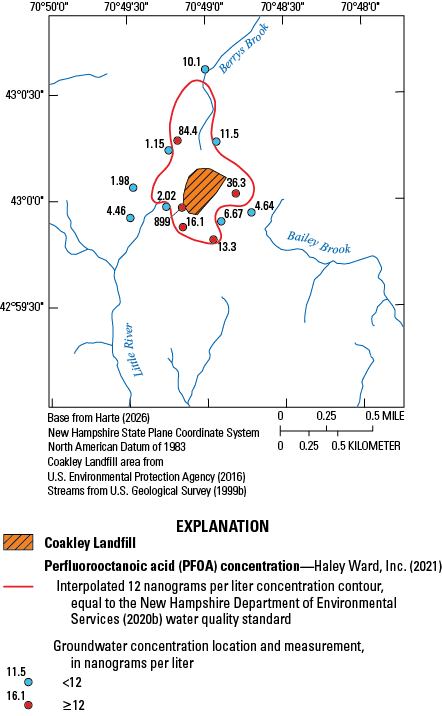
Map of the fall 2020 perfluorooctanoic acid (PFOA) plume extent in the bedrock aquifer (Haley Ward, Inc., 2021), Coakley Landfill superfund site, New Hampshire.
Design of Numerical Groundwater-Flow Model
The groundwater-flow model of the Coakley Landfill area developed for this study was derived from a finite-difference, groundwater-flow model of southeast New Hampshire (Mack, 2009, 2017, 2023). Both the regional and the Coakley Landfill models use MODFLOW-NWT, the standalone version of MODFLOW-2005 that applies the Newton method to improve solutions for nonlinear aquifer conditions (Niswonger and others, 2011). As with the regional model, the Coakley Landfill model was simulated under confined conditions. Under the confined solution, intercell uniform transmissivity options as governed by the Layer Flow Package (LFP) of MODFLOW-2005 (Harbaugh, 2005) are used. The model files described herein are accessible in Harte (2026).
Orientation and Extent
The model extent includes most of North Hampton, the majority of Greenland and Rye, and part of Portsmouth and Stratham, N.H. (fig. 1). The model is rotated 29 degrees from true north to align with the strike of the major rock contacts as reported by Lyons and others (1997). The model is about 7.4 miles (mi) wide in the X direction, and about 5.5 mi in the Y direction.
Boundary Conditions
The western boundary of the model is a no-flow boundary for the full thickness of the model and is located near the western bank of the Winnicut River (fig. 6). The Winnicut River and its tributaries primarily act as a discharge boundary within a low-lying valley (Mack, 2009). To accommodate groundwater discharge from the western bank of the Winnicut River to the river, a recharge rate equivalent to the area runoff of the upland areas on the western side of the Winnicut River was assigned to cells along the western boundary. The rate of recharge was checked against groundwater flow computed by the southeast regional model for the same area. The line recharge was assigned to the surficial aquifer (layers 1 and 2 of the model).
The eastern boundary of the model is the Atlantic Ocean and is simulated as a constant head boundary at 1.0-ft altitude to compensate for salinity and related density effects on an equivalent freshwater head. An approximate calculation of equivalent freshwater head is provided in Kuniansky (2018). The ocean acts as a discharge boundary and was assigned to layer 1 of the model.
The southern and northern boundaries are constant-head boundaries with heads assigned from a simulation of the southeast regional model (Mack, 2023) for that location to the full thickness of the model. The southern and northern boundary heads were adjusted to help match observed heads (Mack, 2009) near that boundary. The northwestern area of the model by Great Bay was assigned a constant head of 3.0-ft altitude based on marshland elevation data reported in Stevens and others (2022). The constant heads at Great Bay were assigned to layer 1 of the model.
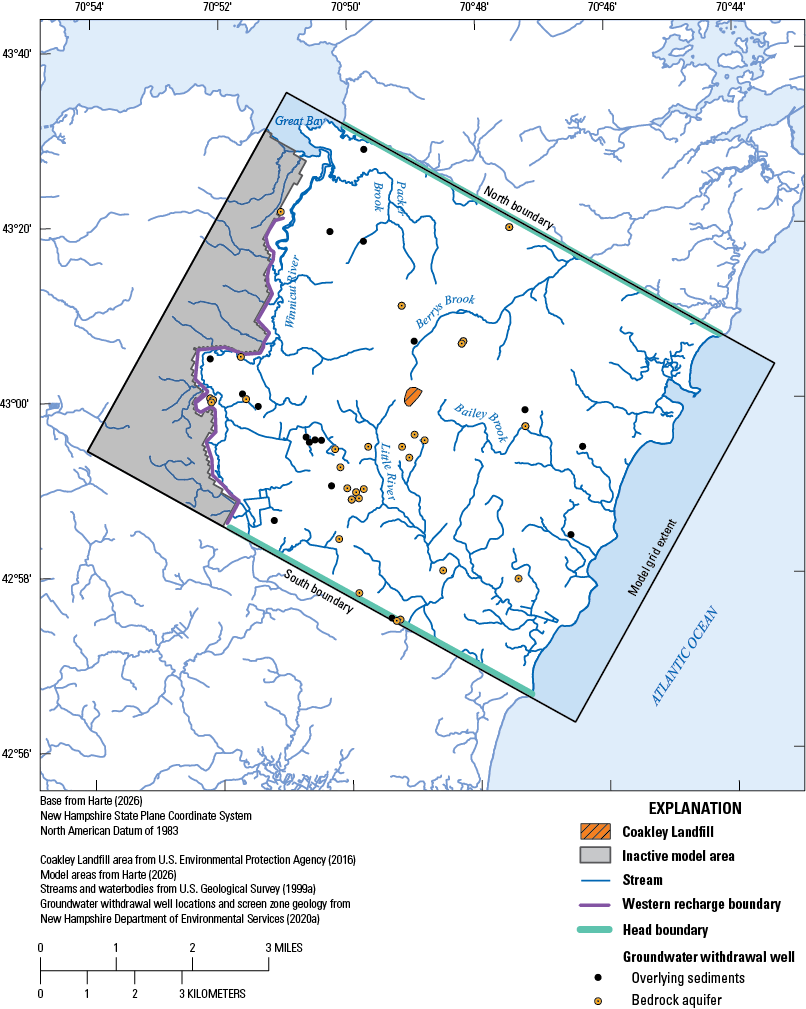
Map of the Coakley Landfill model area, inactive model area, model boundary conditions, and withdrawal wells. Refer to figure 1.2 and table 2 for well identification numbers.
Discretization and Layering
The model cell sizes range from 50 by 50 ft at the landfill area to 250 by 250 ft in distal parts of the model (app. 1, fig. 1.1). There are 334 rows by 347 columns or 115,898 cells per layer. The total model thickness ranges from 1,000 to 1,100 ft thick. Most wells in the area are less than 850 ft deep (NHDES, 2020a).
The model is subdivided vertically into six layers (fig. 7). Model grid-cell elevations were interpreted with respect to 30-meter digital elevation model (DEM) point elevations (Mack, 2009). The upper surface of the model (layer 1) corresponds to the nearest DEM 30-meter grid-cell elevation. The elevations of all other model layer surfaces were subtracted from the surface elevation. Layer thicknesses were chosen to incorporate both hydrogeologic characteristics and numerical simulation considerations. Layers 1 and 2 represent primarily surficial deposits (overburden) or water bodies. The thickness of layer 1 in marine areas (Great Bay and the Atlantic Ocean) is equal to the water depth indicated by bathymetric data (Mack, 2009). On land, the thickness of layer 1 (8–88 ft) was determined from contours representing thickness of the stratified-drift aquifer (Moore, 1990; Stekl and Flanagan, 1992), bedrock well casing lengths and boring data, and thicknesses inferred from surficial mapping. The thickness of model layer 2 was assigned at 6.6 ft to represent an average till thickness over the bedrock surface. Model layer 3 was assigned at 10 ft thick to represent the zone where bedrock water-supply wells are typically cased off during well installation. Model layers 4 and 5 were assigned thicknesses of 290 ft and 300 ft, respectively. Model layer 6 was assigned a thickness of 400 ft (fig. 7).
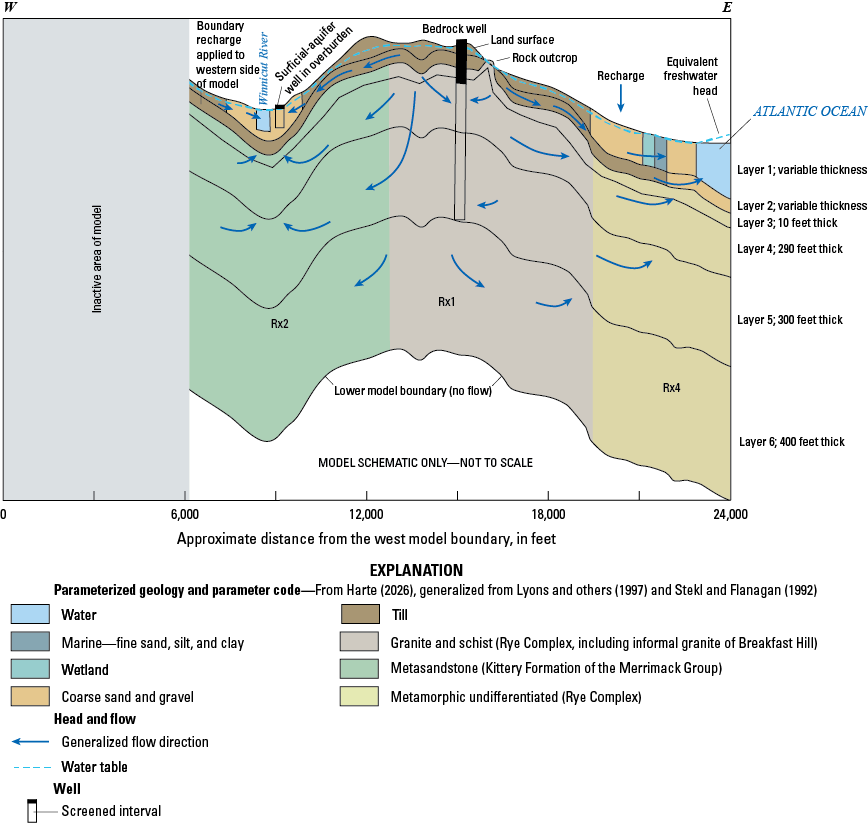
Generalized cross section of the Coakley Landfill model with the six model layers and parameterized geology. Modified from Mack (2009), figure 13. The informal Breakfast Hill granite, parameter code Rx3, is not shown because it is only present in a small area of the model.
Groundwater Withdrawals and Return Flows
Major groundwater withdrawals (generally greater than 19,300 cubic feet per day [ft3/d] or about 100 gal/min) representing municipal or commercial water usage and selected private (residential) usage of lesser withdrawal amounts (generally less than 19,300 ft3/d) were simulated with the Well package (WEL) of MODFLOW-2005 (Harbaugh, 2005). Figure 6 shows the location of withdrawal wells as specified with the Well package. Wells are assigned to the layer containing the interval at which each well is screened. Table 2 lists additional information on these wells including assigned withdrawal rates, model row and column location, and layer information. Appendix 1 contains a map with a cross-reference number based on the well number in table 2 (fig. 1.2).
Table 2.
List of groundwater well withdrawals specified in the Coakley Landfill model.[Data from Mack (2023) and New Hampshire Department of Environmental Services (2020a). ft3/d, cubic feet per day]
| Well number on fig. 1.2 | Model layer | Model row | Model column | Groundwater withdrawal rate, in ft3/d |
|---|---|---|---|---|
| 1 | 1 | 4 | 27 | 3,675.17 |
| 2 | 1 | 26 | 39 | 103,604.77 |
| 3 | 1 | 29 | 30 | 1,266.76 |
| 4 | 1 | 94 | 293 | 29,929.37 |
| 5 | 1 | 100 | 312 | 13,781.49 |
| 6 | 1 | 215 | 321 | 4,579.59 |
| 7 | 1 | 244 | 18 | 35,134.68 |
| 8 | 1 | 265 | 31 | 27,352.91 |
| 9 | 1 | 270 | 36 | 23,582.87 |
| 10 | 1 | 275 | 65 | 2,341.45 |
| 11 | 1 | 279 | 73 | 1,320.57 |
| 12 | 1 | 326 | 83 | 7,530.55 |
| 13 | 1 | 334 | 288 | 11,473.21 |
| 14 | 4 | 3 | 171 | 1,880.69 |
| 15 | 4 | 51 | 93 | 1,716.42 |
| 16 | 4 | 52 | 191 | 557.00 |
| 17 | 4 | 56 | 191 | 557.00 |
| 19 | 4 | 114 | 296 | 7,752.47 |
| 23 | 4 | 221 | 25 | 2,991.91 |
| 24 | 4 | 269 | 32 | 4,257.64 |
| 26 | 4 | 292 | 23 | 4,661.92 |
| 27 | 4 | 292 | 24 | 5,790.98 |
| 28 | 4 | 296 | 24 | 9,226.02 |
| 29 | 4 | 307 | 163 | 396.99 |
| 30 | 4 | 311 | 163 | 396.99 |
| 34 | 4 | 333 | 291 | 3,544.31 |
| 35 | 4 | 334 | 290 | 2,423.57 |
| 36 | 5 | 3 | 171 | 1,947.18 |
| 37 | 5 | 51 | 93 | 1,777.09 |
| 38 | 5 | 52 | 191 | 576.69 |
| 39 | 5 | 56 | 191 | 576.69 |
| 41 | 5 | 114 | 296 | 8,026.53 |
| 45 | 5 | 221 | 25 | 3,097.68 |
| 46 | 5 | 269 | 32 | 4,408.15 |
| 48 | 5 | 292 | 23 | 4,826.72 |
| 49 | 5 | 292 | 24 | 5,995.69 |
| 50 | 5 | 296 | 24 | 9,552.17 |
| 51 | 5 | 307 | 163 | 411.03 |
| 52 | 5 | 311 | 163 | 411.03 |
| 56 | 5 | 333 | 291 | 3,669.60 |
| 57 | 5 | 334 | 290 | 2,509.25 |
| 58 | 4 | 333 | 235 | 192.50 |
| 59 | 5 | 333 | 235 | 192.50 |
| 60 | 4 | 30 | 15 | 192.50 |
| 61 | 5 | 30 | 15 | 192.50 |
| 66 | 1 | 310 | 129 | 19,250.00 |
| 67 | 2 | 310 | 129 | 19,250.00 |
| 68 | 4 | 245 | 147 | 19.25 |
| 69 | 5 | 245 | 147 | 19.25 |
| 70 | 4 | 299 | 170 | 192.50 |
| 71 | 5 | 299 | 170 | 192.50 |
| 72 | 4 | 309 | 171 | 192.50 |
| 73 | 5 | 309 | 171 | 192.50 |
| 74 | 1 | 272 | 78 | 192.50 |
| 75 | 2 | 272 | 78 | 192.50 |
| 76 | 1 | 268 | 86 | 192.50 |
| 77 | 2 | 268 | 86 | 192.50 |
| 78 | 4 | 270 | 109 | 19.25 |
| 79 | 5 | 270 | 109 | 19.25 |
| 80 | 4 | 289 | 127 | 19.25 |
| 81 | 5 | 289 | 127 | 19.25 |
| 82 | 4 | 230 | 205 | 19.25 |
| 83 | 5 | 230 | 205 | 19.25 |
| 84 | 4 | 222 | 188 | 192.50 |
| 85 | 5 | 222 | 188 | 192.50 |
| 86 | 4 | 199 | 195 | 192.50 |
| 87 | 5 | 199 | 195 | 192.50 |
| 88 | 4 | 199 | 211 | 192.50 |
| 89 | 5 | 199 | 211 | 192.50 |
| 90 | 4 | 307 | 150 | 19.25 |
| 91 | 5 | 307 | 150 | 19.25 |
| 92 | 4 | 322 | 174 | 19.25 |
| 93 | 5 | 322 | 174 | 19.25 |
| 94 | 4 | 316 | 295 | 19.25 |
| 95 | 5 | 316 | 295 | 19.25 |
| 96 | 4 | 304 | 314 | 19.25 |
| 97 | 5 | 304 | 314 | 19.25 |
| 98 | 1 | 85 | 132 | 388.00 |
Only withdrawal wells where the location and well log could be identified were simulated with the Well package. Information on well logs and location were obtained from the New Hampshire Department of Environmental Service well inventory records (NHDES, 2020a).
To account for wells not simulated with the Well package, the Flow and Head Boundary (FHB) package (Leake and Lilly, 1997) was used to simulate distributed withdrawals (Mack, 2009). Distributed withdrawals were assigned to model layers 4 and 5. The location of distributed withdrawals is shown in appendix 1, fig. 1.3A.
Return flows from predominantly nonsewered areas of the Coakley Landfill model, including septic fields, were also simulated as distributed return flow with the Flow and Head Boundary package. Return flow was assigned to model layer 2 and occurred in coincident locations as distributed withdrawals (app. 1, fig. 1.3A; NHDES, 2025). A return rate of 85 percent of water consumption was used (Horn and others, 2008).
Recharge
The Recharge package (RCH) of MODFLOW-2005 (Harbaugh, 2005) was used to specify groundwater recharge to the Coakley Landfill model. Rates of recharge were informed by rates specified in Mack (2009, 2017, 2023) from baseflow separation techniques using continuous streamflow data (Flynn and Tasker, 2004). Three initial rates were used, based on surficial sediments: (1) 0.0025 foot per day (ft/d) in high infiltration areas associated with high permeability surficial sediments, (2) 0.0013 ft/d in low infiltration areas associated with low permeability surficial sediments, and (3) 0 ft/d over large surface-water bodies. Most of the areas of mapped transmissivity values on fig. 4A are coincident with high infiltration areas. Areas without mapped transmissivity values are primarily areas of low infiltration.
Stream-Aquifer Interactions
The Stream package (STR) was used to simulate stream-aquifer interactions within the groundwater-flow model (Prudic, 1989). The Stream package accounts for streamflows along designated reaches from groundwater discharge and recharge to the aquifer. Streamflow along reaches is instantaneously routed to downstream reaches. Altitude data for streambed and stream stage, and thicknesses for streambed, were assigned to each stream segment. The streambed conductance term, which is also assigned to each segment, is used to relate the rate of model-computed flow to the difference in head between the stream stage and model-computed heads. Streambed conductance was kept spatially uniform in the model.
Stream surface and stream bed altitude data were incorporated from Mack (2023). Elevations were checked to ensure streamflow was monotonic from upstream to downstream locations. Simulated streams and basin locations, which are used to assess measured and model-computed stream leakages, are shown in fig. 3.
Hydraulic Conductivity
The initial hydraulic conductivity values of hydrogeologic units were derived from the calibrated model by Mack (2009). Estimates of the horizontal hydraulic conductivity for the overburden hydrogeologic units, consisting of the stratified drift, till, and marsh, were 10 ft/d, 1 ft/d, and 0.1 ft/d, respectively. The vertical hydraulic conductivity was initially estimated by multiplying the horizontal conductivity by 0.1, 1, and 0.1, respectively.
Hydraulic conductivity of the rock units was estimated to be about 0.1 to 1.0 ft/d, with a regional horizontal anisotropy of 2.5:1 to 5:1 (Y direction:X direction) following the regional structural trend and predominant northeast-southwest fracture orientation (Mack, 2009). Model cells representing the Rye Complex (except the informal Breakfast Hill granite) and the Kittery Formation of the Merrimack Group were assigned higher estimated hydraulic conductivities (0.2 to 1 ft/d) than areas representing the Breakfast Hill granite (0.1 ft/d). The Rye Complex was further broken into two informal units—gneiss and schist—based on primary lithology (figs. 4B, 7), with the Rye Complex gneiss being assigned an initial hydraulic conductivity of 0.5 ft/d and the Rye Complex schist being assigned an initial hydraulic conductivity of 0.2 ft/d. Vertical hydraulic conductivity was set equal to horizontal hydraulic conductivity for the rock units. The model hydraulic conductivity field was further refined using data collected from purge records of low-flow sampling, drilling logs, and surface geophysical surveys (CES, Inc., 2017, 2018a, 2018b5, 2019, 2020b) and analyzed with the Purge Analyzer Tool (PAT) software (Harte and others, 2019; Harte and Huffman, 2020).
Mack (2009, 2017, 2023)2627 incorporated multiple lineament features set at 10 times the hydraulic conductivity of the respective rock unit in which each lineament was located. The number of lineament features was reduced during the calibration of the Coakley Landfill model. Three lineament type features that were incorporated in the Coakley Landfill model include the following: (1) a linear zone of low electrical resistivity on the west side of the Coakley Landfill mapped by CES, Inc. (2017); (2) a fault contact between the Kittery Formation and the Rye Complex (fig 4B; Mack, 2009), and (3) a northeast trending lineament just northeast of the Coakley Landfill (Mack, 2009).
Recent (2021) aquifer pump test results from bedrock wells show a range in hydraulic conductivity values of 0.75 ft/d to 178 ft/d. The upper end of the range was calculated from a shallow rock well that is likely influenced by rock weathering (Haley Ward, Inc., 2021). A previous pump test in 1994 estimated that hydraulic conductivity for the bedrock ranges from 0.99 to 3.69 ft/d (Haley Ward, Inc., 2021). Reported ranges of bedrock hydraulic conductivity imply that there are localized high hydraulic conductivity zones within low hydraulic conductivity zones. The high hydraulic conductivity values reported by Haley Ward, Inc. (2021) are more likely to occur along lineaments or other structural features.
Parameterization
Parameterization is used to define spatiotemporal properties of the model to facilitate representation of the aquifer and groundwater flow system and to assist in model calibration. The initial parameters were taken from Mack (2009, 2017, 2023). There are 21 parameters to represent spatial variability in horizontal and vertical hydraulic conductivity, 3 parameters to represent spatial variability in recharge, and 1 parameter to represent streambed conductance.
Simulation of Groundwater Flow
All simulations for this study represent steady-state conditions, which assumes negligible storage changes for the simulation period. Water-use conditions for 2015, as described in Mack (2017, 2023), were adapted for this study. Domestic withdrawals after 2015 in the vicinity of the Coakley Landfill were added to the model conditions, and recharge was modified to account for the impermeable Coakley Landfill cap by setting recharge over the cap equal to 0. Increased runoff from the impermeable cap area is accounted for in the model by increased recharge along the edges of the Coakley Landfill cap. A model scenario of the landfill before capping was also simulated, with water-use rates kept the same before and after capping to demonstrate the effect of the Coakley Landfill cap on groundwater flow.
Advective transport of particles from under the Coakley Landfill cap area was simulated in a forward tracking direction to final discharge locations with MODPATH-6 (Pollock, 2012); 323 particles were placed in layer 2 of the model (surficial sediments). Layers 3 and 4 of the model represent the shallow bedrock where most contamination at the Coakley Landfill site has been detected (Haley Ward, Inc., 2021); 656 particles were placed in layers 3 and 4.
Travel times are difficult to quantify in fractured-rock systems like the Coakley Landfill area because of differences in advective transport within fractures and equivalent porous medium. As such, particle travel times were not analyzed for this study and porosity was kept at a uniform value of 0.25 for all model layers.
Model Solution
MODFLOW-NWT requires use of the Upstream Weighting (UPW) package to specify properties controlling flow between cells (Niswonger and others, 2011). The Upstream Weighting package treats nonlinearities of cell drying and rewetting by use of a continuous function of groundwater head, rather than the discrete approach of drying and rewetting that is used by the other flow packages in MODFLOW-2005 (Harbaugh, 2005). This facilitates application of the Newton method for unconfined groundwater flow problems and complex nonlinear solutions (Niswonger and others, 2011).
The Coakley Landfill model features nonlinear stress packages and multiple unconfined layers representing complex hydrogeologic dynamics. Therefore, MODFLOW-NWT’s “complex” solver keyword was invoked to facilitate model convergence. Default solver parameters were retained (Niswonger and others, 2011, table 2), with the following exceptions: (1) a head closure criterion of 0.25 ft was used; (2) a flux tolerance criterion of 5,000 ft3/d was applied, and (3) a maximum of 5,000 outer iterations was permitted to achieve the closure criteria.
UCODE_2014 software (Poeter and others, 2014) was used for sensitivity analysis and parameter estimation. The software graphical interface ModelMate (Banta, 2011) was used to visualize UCODE_2014 input and output. The sensitivity analysis was used as a screening tool to identify the most sensitive parameters for calibration. Parameter estimation was done to bracket parameter values for further iterative model calibration. For parameter estimation, a maximum of 35 iterations was permitted, with a default parameter change of 0.1 and a sum of squares closure criterion of 0.01.
Numerical Model Calibration
As part of the calibration, boundary flows from the Coakley Landfill model were checked against the larger southeast regional model by Mack (2023). Flows from the calibrated Coakley Landfill model at boundary conditions (fig. 6) are similar to flows from the southeast regional model at the same locations (table 3). For the Coakley Landfill model, inflow predominantly occurs at the northern boundary and outflow or water loss occurs along the southern boundary. There is also inflow from the west boundary and outflow to the Atlantic Ocean.
Table 3.
Model-computed boundary flows for the Coakley Landfill model.[Regional model flows from Mack (2023). Calibrated Coakley Landfill model flows from Harte (2026). Negative values indicate outflow. Due to differences in spatial resolution of the Atlantic Ocean shoreline between the two models, the ocean boundary interfacial area is slightly smaller in the regional model than in the Coakley Landfill model. ft3/d, cubic feet per day]
In general, the model-computed leakage shows greater amounts of groundwater discharge to streams than measured leakage as reported by Mack (2009). The average relative percent difference is −28.8 percent for all basins (table 4). Basin locations are shown in fig. 3 and listed in table 1, and individual streamflow information is provided in appendix 1, table 1.1. The measured leakages represent groundwater discharges collected during a two-day synoptic measurement event in October 2004 by Mack (2009). These measured flows are lower than long-term averages (table 1.1); therefore, model-computed stream leakages for the Coakley Landfill model are likely more representative of average conditions than the reported measured streamflow from Mack (2009).
Table 4.
Comparison of measured and model-computed stream leakage from the Coakley Landfill model.[Measured leakage from Mack (2009) for the period 2002–4. Model-computed leakage from Harte (2026). ft3/d, cubic feet per day; basin locations shown in figure 3. Negative relative percent difference values mean that the model-computed leakage is greater than measured leakage]
Comparison of offsite measured water levels (Mack, 2009) and onsite measured water levels (Haley Ward, Inc., 2022) with model-computed heads (unweighted) shows an overall acceptable model fit (fig. 8). Scatter of head residuals about the 1:1 line is larger for offsite wells—indicating a larger mean absolute residual—than for onsite wells. For onsite wells, the simulated heads are, on average, slightly higher than measured heads. For offsite wells, the simulated heads are slightly lower than measured heads on average (table 5).
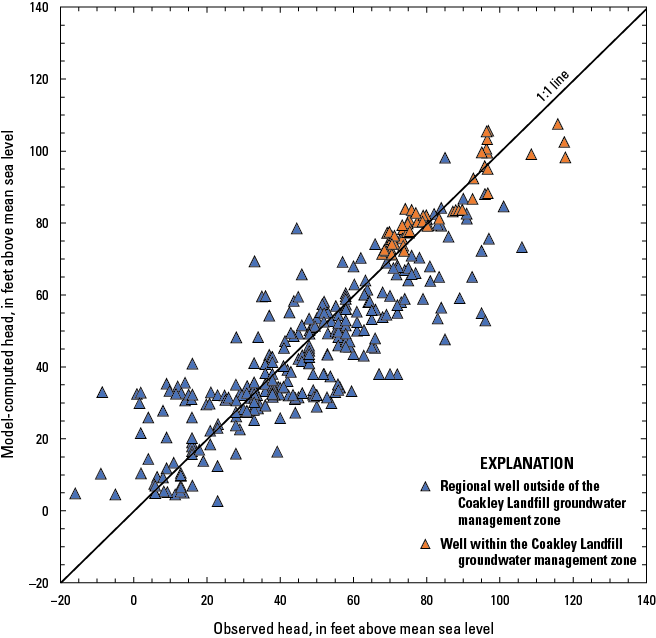
Graph of model-computed heads (Harte, 2026) compared to observed heads (Mack, 2009; Haley Ward, Inc., 2022) in the Coakley Landfill model.
Table 5.
Summary of residuals between measured heads and model-computed heads from the Coakley Landfill model.[Measured heads for offsite wells from Mack (2009). Measured heads for onsite wells from Haley Ward, Inc. (2022). Model-computed heads from Harte (2026). Negative numbers mean that the model-computed heads are greater than the measured heads. “Onsite” refers to locations within the groundwater management zone shown in figure 2B. “Offsite” refers to locations outside the groundwater management zone]
The spatial distribution of the head residuals shows a tendency for the model to underestimate heads in some areas to the west of the Coakley Landfill (darker purples in fig. 9). Several regional wells that are situated along the fault contact between the Rye Complex and the Kittery Formation show low model-computed heads. For these wells, there may be preferential flow along and across the contact that is not represented by the model.
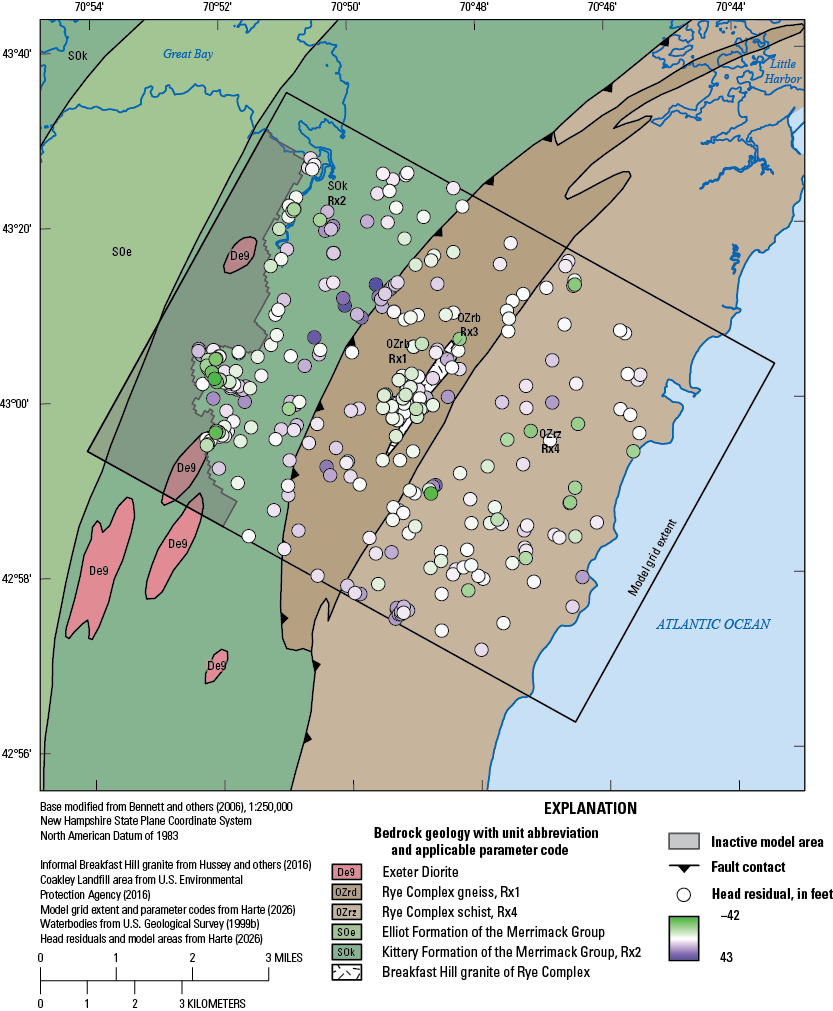
Map of regional bedrock geology and residuals between measured and model-computed heads in the Coakley Landfill model. The head residuals are from all model layers.
Several parameters were adjusted during the model calibration process. The largest change from initial parameter values to final calibrated parameter values is in the horizontal hydraulic conductivity of the stratified-drift material (parameter name Ksd), and the Breakfast Hill granite (Rx3; table 6). An increase in the horizontal hydraulic conductivity of the parameter Ksd from 10 to 60 ft/d was driven by dewatering of model cells in areas where large groundwater withdrawals are simulated. Increasing Ksd to 60 ft/d prevented dewatering of model cells and decreased head residuals. A decrease of horizontal hydraulic conductivity in the Breakfast Hill granite unit from 0.1 to 0.003 ft/d was primarily the result of rezoning the unit relative to its extent in Mack (2009) based on bedrock geologic mapping by Hussey and others (2016) and hydraulic conductivity estimates from wells that were positioned in the Breakfast Hill Granite zone. Changes to the parameter zonation and associated parameter values of the formation also led to a decrease in head residuals. The inclusion of several lineaments of preferred horizontal hydraulic conductivity in the Coakley Landfill model, which resulted in an upper value of horizontal hydraulic conductivity of 6 ft/d in the bedrock, also decreased residuals in a few wells near lineaments including the fault contact between the Rye Complex and the Kittery Formation.
Table 6.
Listing of initial and final parameter values from the Coakley Landfill model, New Hampshire.[Initial and calibrated parameter values and confidence intervals from Harte (2026). Geologic names follow Lyons and others (1997) and Hussey and others (2016); The Rye Complex (schist) and Rye Complex (gneiss) are informal units of the Rye Complex distinguished by lithology (figs. 4B, 7). ft/d, feet per day; —, no data]
Refer to figures 4B and 7 for model zone reference.
Sensitivity of Parameters
Composite scaled sensitivities for heads show that the groundwater recharge parameter associated with high infiltration areas of the model, Rech1, is the most sensitive model parameter (table 7). The horizontal hydraulic conductivity parameters of the three rock units with large extents in the model area, Rye Complex gneiss (Rxk1), Rye Complex schist (Rxk4), and Kittery Formation (Rxk2), are the next most sensitive parameters. The least sensitive parameters relate to surface waterbodies (hydraulic conductivity and recharge; Ksw and Rech0). Several of the hydraulic conductivity parameters for the surficial sediments are also insensitive because of the limited areal extent of those deposits.
The relatively large number of model parameters (table 7) precludes the ability to bracket all parameter values with computed confidence intervals. Therefore, selected parameter confidence intervals were computed for the horizontal hydraulic conductivity of the Rye Complex gneiss, Rye Complex schist, and Kittery Formation (table 6). Final parameter values from model calibration were within the range of model-computed parameter confidence intervals. The Rye Complex (gneiss and schist) computed maximum potential values of horizontal hydraulic conductivity were much larger than the values for the Kittery Formation.
Table 7.
Ranking of composite scaled sensitivities of the Coakley Landfill model parameters, New Hampshire.[Scaled sensitivity values from Harte (2026). Composite scaled sensitivities are dimensionless. Rankings 1 through 10 are bold and underlined for visibility]
Recharge and Flow Paths
Recharge to the aquifer accounts for 80 percent of total inflow in the Coakley Landfill model compared to 24 percent for the southeast regional model (table 8; Mack, 2023). A much smaller amount of inflow for the Coakley Landfill model comes from constant-head boundaries. The western boundary is the primary inflow boundary to the Coakley Landfill model with a smaller amount of flow coming from the north and south (table 3). This means that most flow in the Coakley Landfill model originates from the model area itself and not from the southeast New Hampshire region beyond the Coakley Landfill model area.
Table 8.
Model-computed groundwater budgets for model boundaries in the southeast New Hampshire regional model (Mack, 2023) area and the Coakley Landfill model (Harte, 2026), New Hampshire.[All references to the southeast New Hampshire regional model refer to the 2015 conditions scenario (Mack, 2017, 2023); ft3/d, cubic feet per day]
The Coakley Landfill is slightly northwest of a simulated groundwater high (fig. 10; 100-ft contour). This positioning next to an area with high groundwater heads induces groundwater flow to the northwest with negligible flow to the east. Maximum groundwater gradients from the landfill are to the north, facilitating contaminant transport in that direction.
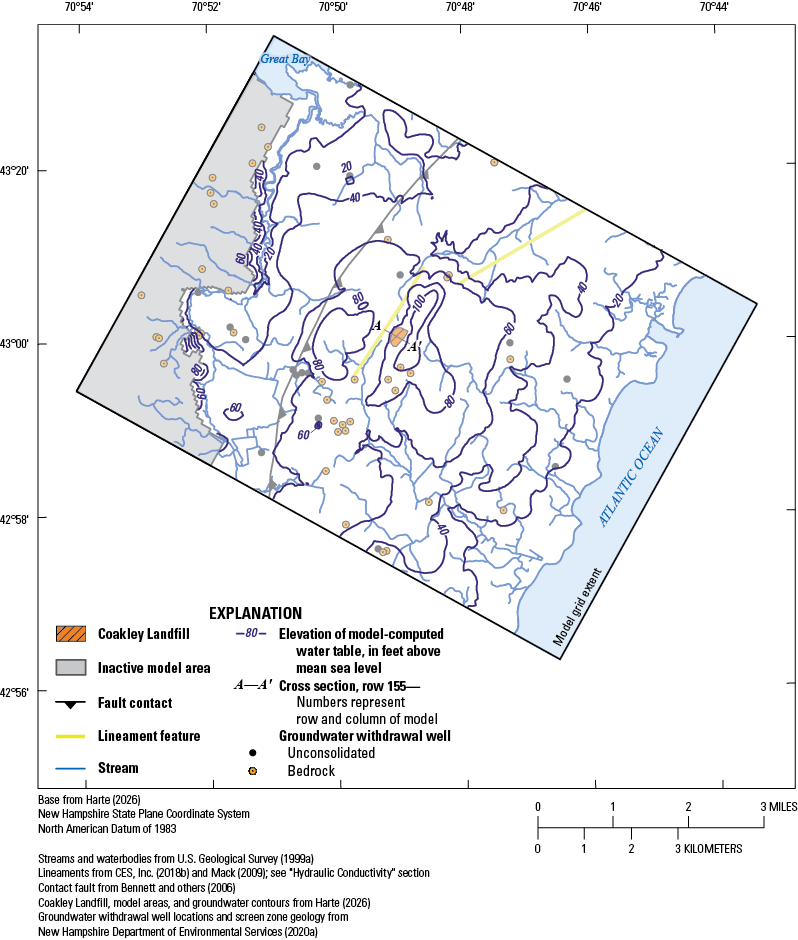
Map of contours representing the water-table surface based on model-computed heads for the Coakley Landfill model, New Hampshire, and the location of the cross section A–A′ for figures 11A and B through the landfill.
The Coakley Landfill cap affects localized groundwater flow near the Coakley Landfill. Different model scenarios calculated groundwater flow for current conditions with a cap and hypothetical conditions before the cap. Model results show that the Coakley Landfill cap reduces the amount of bedrock recharge under the cap by a small amount (figs. 11A–C). The Coakley Landfill cap reduces heads by about 0.75 ft.
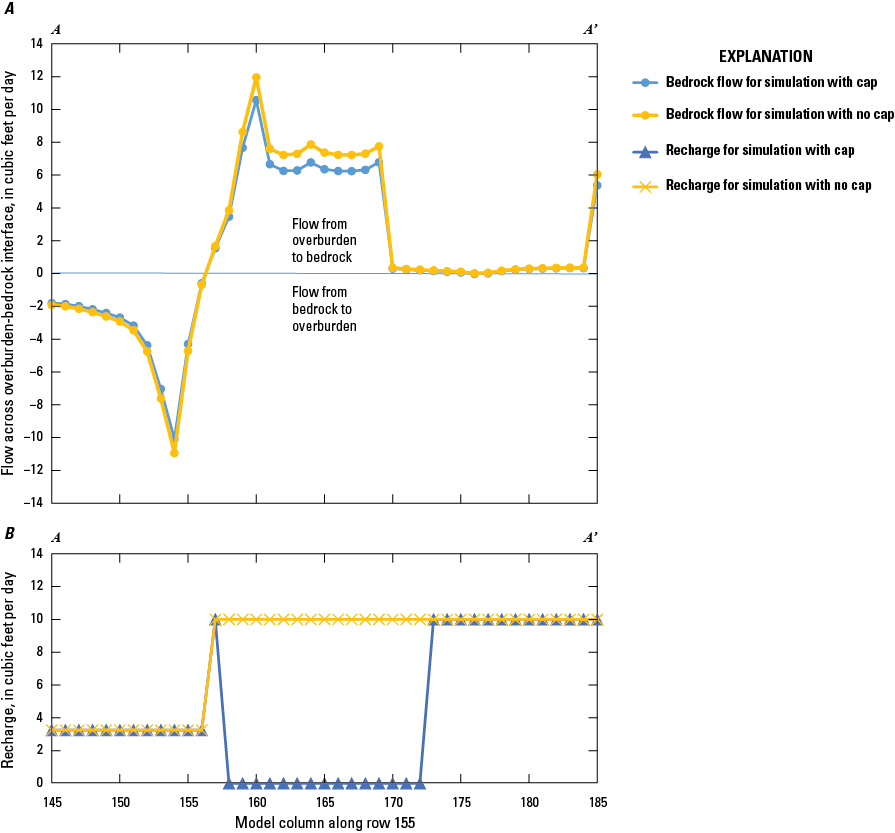
Graphs showing simulated groundwater-recharge exchanges along cross section A–A′ through the Coakley Landfill, with and without a landfill cap. A, Simulated groundwater flow into and out of the bedrock aquifer below the Coakley Landfill. A negative value indicates upward groundwater flow out of the bedrock aquifer. A positive value indicates downward flow into the bedrock. B, Simulated recharge rate to groundwater.
Simulations with advective transport of particles in groundwater from underneath the cap, and placed in the shallow bedrock (656 particles total in layers 3 and 4 of the model), show that most groundwater flow discharges to the adjacent streams (Berrys Brook and Little River) west of the Coakley Landfill under both current capped conditions (fig. 12A; zone 1) and historical conditions before capping (fig. 12B; zone 1). Some particles are transported to the north from the Coakley Landfill to Packer Brook and distal discharge points along Berrys Brook for both cap conditions (figs. 12A, B; zone 2). There are three factors that tend to induce preferential advective transport to the north of the landfill: (1) the bedrock aquifer's hydraulic anisotropy along strike favoring flow to the northeast, (2) the location of the lineament to the west of the landfill, and (3) the location of the maximum gradient from the Coakley Landfill to the north direction (fig. 10). Ten percent of the particles discharge and are captured by withdrawal wells to the southwest and west for both conditions (figs. 12A, B; zones 3 and 4). Under both capped and uncapped conditions, areas designated as zones 3 and 4 are considered less probable discharge areas than zones 1 and 2 given the length and likely travel time associated with groundwater flow to zones 3 and 4 from the Coakley Landfill.
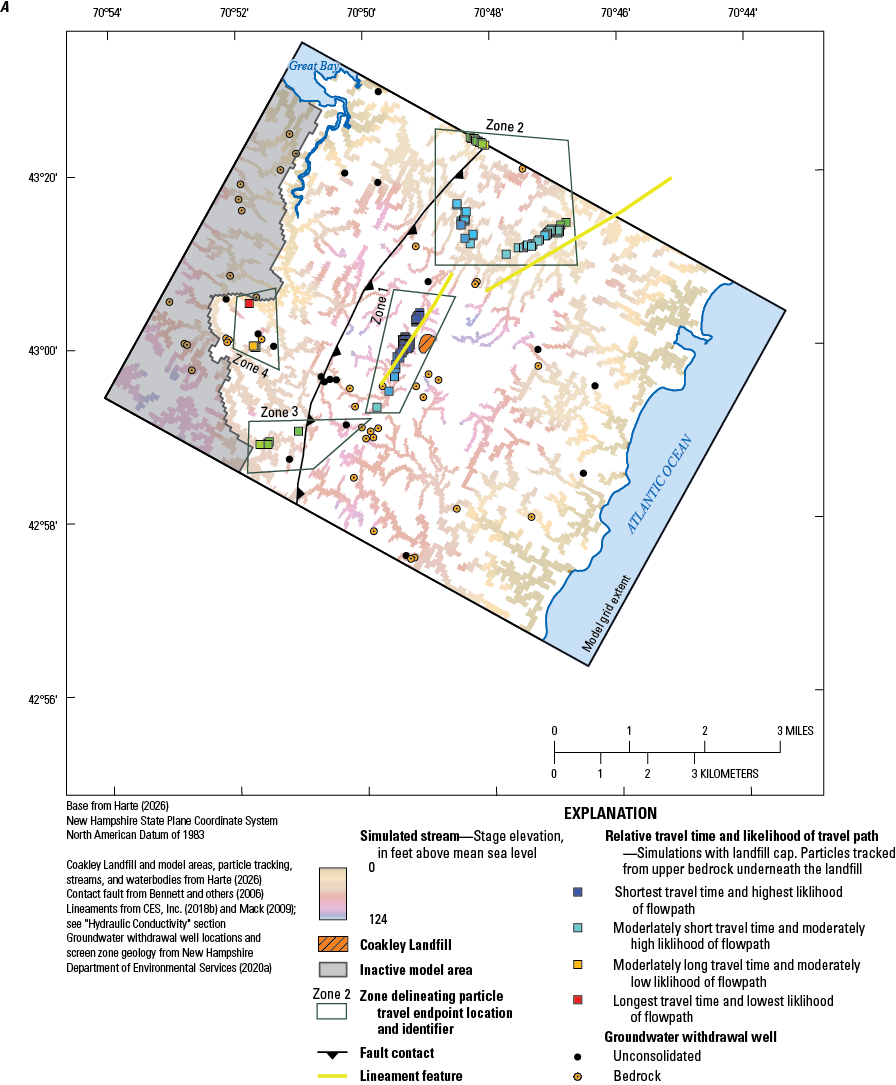

Maps of particle endpoint analysis from the Coakley Landfill model, as tracked from layers 3 and 4 (shallow bedrock), by (A) simulation with the landfill cap, and (B) simulation without the landfill cap. The particle start point is at the Coakley Landfill. Refer to figure 7 for a schematic of model layers.
There is a large range in potential travel distances of tracked particles from the Coakley Landfill to distal locations. Radial horizontal travel distances of pathlines tracked for the simulation with the landfill cap (fig. 12A) range from 0.08 to 2.87 mi (table 9). These distances do not account for the circuitous nature of the bedrock fracture network, so actual distances are likely to be longer. Nevertheless, they provide some approximate indication of potential contaminant travel distances from the Coakley Landfill. Contaminants traveling along distal pathlines of several thousand feet or greater are likely to undergo dilution, mixing, and adsorption that could potentially decrease contaminant concentrations in groundwater downgradient from the landfill. Concentration gradients for PFOA shown in figure 4 indicate a one-order magnitude decrease over a distance of several thousand feet.
Table 9.
Summary statistics of simulated pathline travel distances from particles placed in layer 3 (shallow bedrock) below the area of the landfill cap from the calibrated Coakley Landfill model (Harte, 2026).[Total number of tracked particles is 656. Distances are computed from the horizontal coordinate system]
The depth of the initial placement of particles affects forward-tracking results and the ultimate discharge area of model-computed groundwater flow for the capped and uncapped scenarios (figs. 12A, B, 13A, B). Similarly to particles originating in shallow bedrock, advective transport of particles (323 particles in total) from underneath the cap area in the deep overburden (model layer 2) also shows that most groundwater flow discharges to the adjacent streams west of the Coakley Landfill for the capped and uncapped conditions (fig. 13A, B; zone 1). Some particles from the deep overburden are transported to the north from the Coakley Landfill to Berrys Brook and Packer Brook under both capped and uncapped conditions (fig. 13A, B; zone 2). Unlike particles originating in shallow bedrock, however, no particles tracked from the deep overburden discharge to withdrawal wells directly west from the landfill for either cap condition (figs. 13A, B, fig. 12A, B; zone 4). Under capped conditions, no particles from the deep overburden discharge to a withdrawal well to the south (fig. 13A; zone 3), and under uncapped conditions, few particles discharge in the same area (fig. 13B; zone 3).

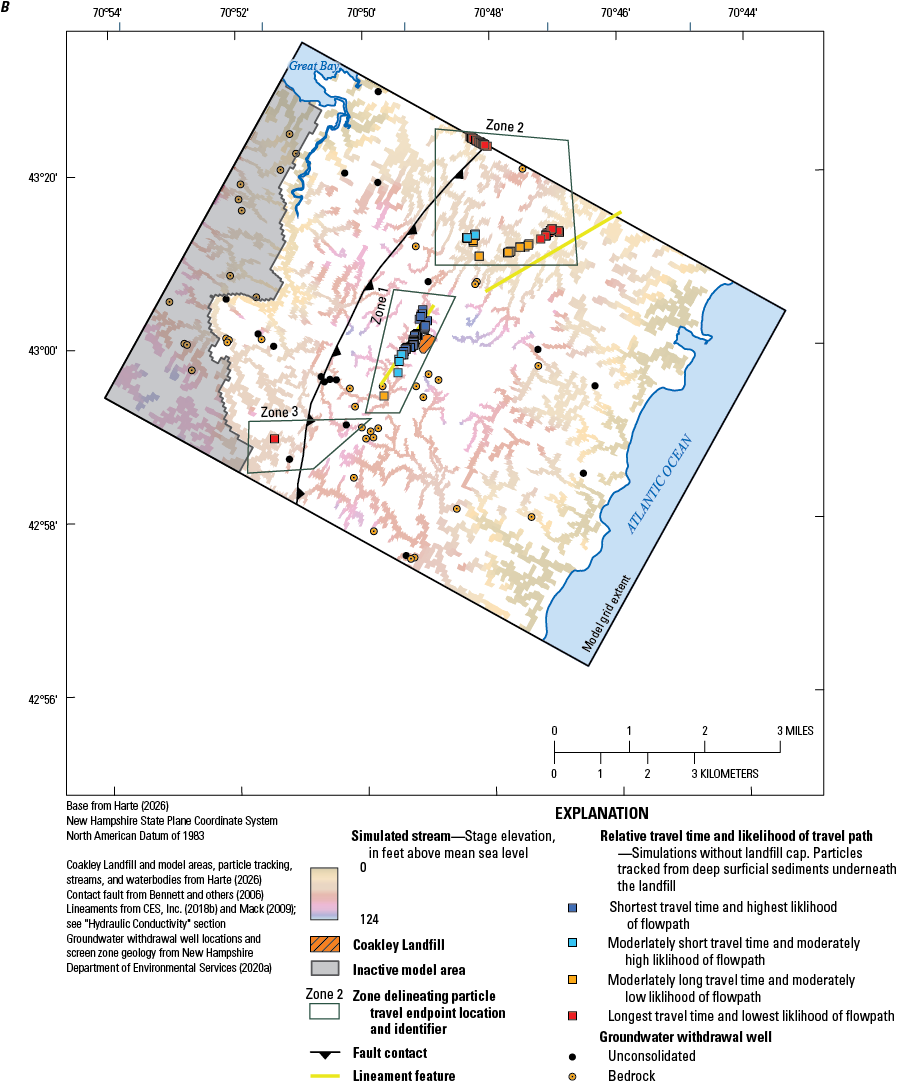
Maps of simulated particle tracking endpoint analysis from the Coakley Landfill model, as tracked from model layer 2 (deep overburden), by (A) simulation with the landfill cap, and (B) simulation without the landfill cap. The particle start point is at the Coakley Landfill. Refer to figure 7 for a schematic of model layers.
The anisotropy of the bedrock aquifer is an important factor that controls advective transport from the Coakley Landfill. Simulation without horizontal anisotropy shows that in addition to advective transport of particles discharging to Little River and Berrys Brook, and headwaters of Packer Brook (fig. 14; zones 1 and 2, respectively), a large fraction of particles discharges farther to the northwest near where Packer Brook meets Great Bay (fig. 14; zone 4) unlike in simulations with anisotropy as shown in figs. 12A, B–14. The change in the distribution of particle discharges illustrates the importance of incorporating horizontal anisotropy in models where preferential flow occurs along fractures, faults, and other features.
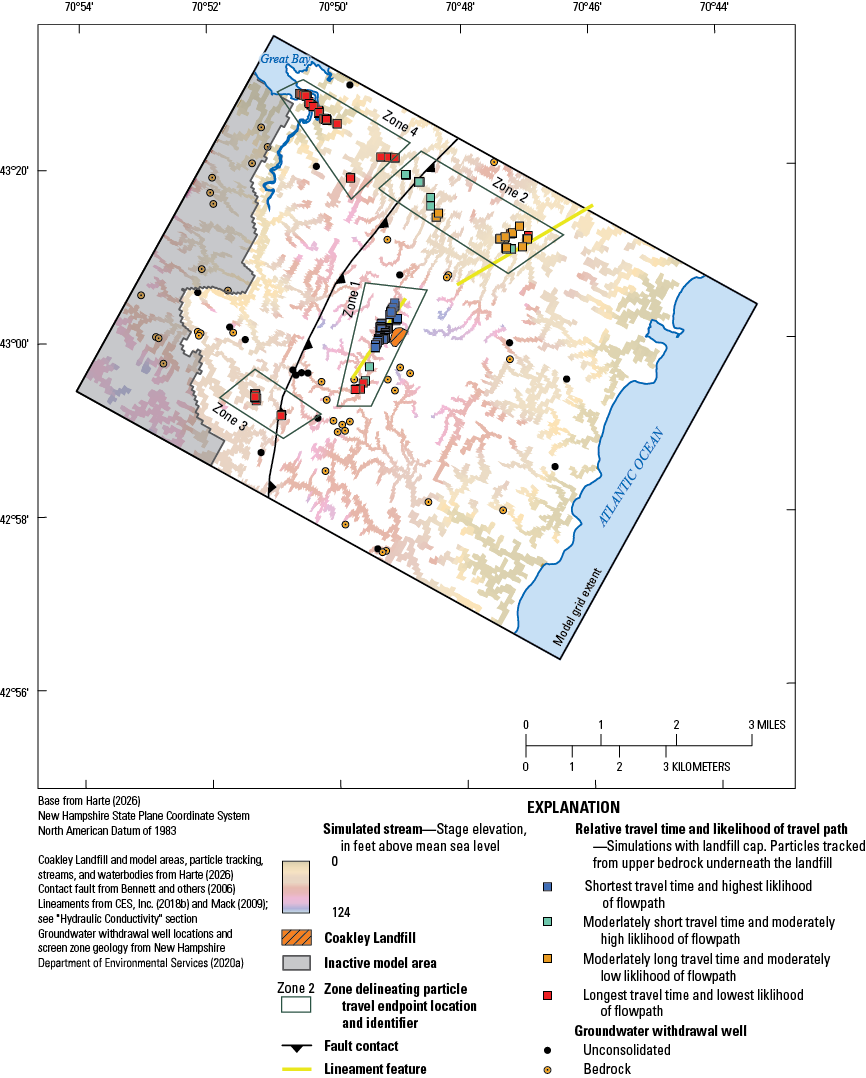
Map of simulated particle tracking endpoint analysis from the Coakley Landfill model, as tracked from model layers 3 and 4 (shallow bedrock), but without horizontal anisotropy in the bedrock. The particle start point is at the Coakley Landfill. Refer to figure 7 for a schematic of model layers.
Limitations of the Model
The model simulates the upper 1,000 ft of the bedrock as a vertically uniform aquifer. Given the model parameterization, the derived horizontal hydraulic conductivity values from the model calibration process will tend to vertically average hydraulic conductivity, omitting the ability to discern patterns of hydraulic conductivity with depth. Based on actual depth-dependent conductivity patterns in the bedrock aquifer, advective transport through deep flow paths to distal discharge locations may be overestimated. Notably, fewer transmissive fractures are observed with increasing depth, implying a bulk decrease in hydraulic conductivity (Harte, 2021).
Groundwater-flow models that do not directly incorporate solute-transport properties of chemical compounds such as PFOA and PFOS solve for bulk groundwater flow; the average advective transport of flow can be computed from the distribution of bulk flow. Particle paths approximate a simplified behavior of solute transport without the incorporation of important solute properties such as dilution, mixing, dispersion, retardation, and chemical reactions. Therefore, advective transport should only be used as an approximation of potential flow paths of solute transport within an aquifer.
Evaluation of Hydrogeologic Controls on PFAS Plume
Regional and local anisotropy of the bedrock aquifer (favoring flow in the northeast-southwest direction) is an important control on the potential transport of PFAS in groundwater from the Coakley Landfill. Highly heterogeneous conditions in the bedrock aquifer also affect the transport of PFAS in groundwater. Simulations showed that groundwater flow, with anisotropy specified in the bedrock aquifer, was primarily to the west and north with lesser amounts in other directions. A simulated decrease in anisotropy from a factor of 2 to a factor of 1 (no anisotropy) resulted in increased advective transport to the northwest and discharge of particles to streams near Great Bay.
Dilution from regional recharge is important to consider when evaluating transport of contaminants from the Coakley Landfill and any interpretation of model-computed advective transport. The maximum contaminant level for PFOA is 12 ng/L and for PFOS is 15 ng/L for well water (NHDES, 2020b). In 2019, the maximum seepage concentration of combined PFOA and PFOS from the Coakley Landfill was 516 ng/L. On the western side of the Coakley Landfill, where the seep is located, this would represent a maximum PFOA and PFOS load to groundwater of 11,369,028 nanograms per day [ng/d] based on a groundwater recharge rate along the western side of the Coakley Landfill of about 778 ft3/d(22,033 L/d). Simulated groundwater flow directions from the Coakley Landfill were primarily toward the west. Dilution of the contamination plume from recharge from the western half of the model (1,213,838 ft3/d, or 34,372,076 L/d) yields a potential average combined PFOA and PFOS concentration (assuming a uniform distribution) in groundwater of about 0.33 ng/L in the offsite bedrock aquifer. As the distance along a flow path increases, mixing and dilution increase. Therefore, in cases where simulations of advective transport identify potential transport to distal withdrawal wells, dilution is likely an important factor in whether any PFAS compounds will be detected in pumped water samples.
The mobility of the different PFAS compounds and their solubility also plays a role in transport. The relatively low solubility of PFOS will tend to constrain long travel paths from the Coakley Landfill. In other words, the PFOS compound may adsorb onto soils and weathered surfaces of bedrock fractures. Conversely, the higher solubility of PFOA will generally allow more distal transport.
Groundwater discharge to streams, as represented by particles tracked in groundwater from the Coakley Landfill, was identified in simulations. Once in the streams, PFAS can be transported long distances because of their low volatilization rates. Further, if the stream changes from a gaining reach (groundwater discharges to the stream) to a losing reach (stream recharges the aquifer), the aquifer can receive contaminated PFAS compounds and other areas of the aquifer may become contaminated. Results of advective transport of particles from the Coakley Landfill for the model showed discharge of particles to Berrys Brook to the north and Packer Brook to the west. Therefore, understanding transport in Berrys Brook and Packer Brook and mapping losing reaches in those streams is important for identifying areas of potential groundwater contaminant exposure to the aquifer.
Summary and Conclusions
Per- and polyfluoroalkyl substances (PFAS), including the two contaminants perfluorooctanoic acid (PFOA) and perfluorooctanesulfonic acid (PFOS), have been detected at high concentrations at seeps and in groundwater and surface water adjacent to the Coakley Landfill Superfund site, in North Hampton, New Hampshire. The inactive landfill received various waste from 1972 until 1985. An impermeable cap was placed on the landfill in 1998 to reduce the production of contaminated landfill leachate. The area adjacent to the Coakley Landfill has numerous domestic and commercial wells and the transport of PFAS compounds are of concern, particularly in the underlying bedrock aquifer. The bedrock aquifer consists of rock units with anisotropy of fractures favoring preferential flow along regional strike in the northeast-southwest direction.
In 2018, the U.S Environmental Protection Agency and the U.S. Geological Survey entered into an interagency agreement to investigate groundwater flow from the Coakley Landfill site. An existing, regional-scale numerical groundwater-flow model of southeast New Hampshire was modified to evaluate groundwater flow patterns and the advective transport of particles from the Coakley Landfill as a proxy to understand solute transport of PFAS compounds.
The model was simulated under steady-state conditions using groundwater withdrawals indicative of modified 2015 water-use conditions. Model calibration used water levels reported from the regional well network (distal from the Coakley Landfill) and a local well network (near the Coakley Landfill). Residuals between measured water levels and model-computed heads show that the model generally underpredicted heads from the regional wells and slightly overpredicted heads from the local wells. Model-computed stream leakage overpredicted discharge to streams in comparison to a measured stream leakage dataset collected during 2002–4; however, because this period generally had lower streamflows than the 2004–23 period, the model-computed stream leakage is interpreted to be closer to average streamflow leakage conditions than the 2002–4 dataset.
Simulated groundwater flow moves primarily to the west and north from the Coakley Landfill. The local groundwater divide for the area is to the east of the Coakley Landfill. The landfill cap serves to reduce exposure of infiltration recharge to contaminants in the unsaturated zone but the cap has little effect on water levels. Advective transport discharges particles tracked from the Coakley Landfill primarily to the west of the Coakley Landfill to two local streams, and to the north to several other streams. Groundwater flow to the north is coincident with the regional strike of the fracture network and there are PFAS detections in groundwater of adjacent wells in that direction. In the model simulations, a limited number of particles (less than 10 percent of total particles) are transported to several distal withdrawal wells. Dilution of contaminants from processes such as mixing with recharge water, dispersion, and diffusion likely plays a role in whether PFAS compounds will be detected above laboratory reporting levels from pumped waters of distal withdrawal wells. For example, PFOS is more likely to be detected at higher concentrations within short distances of the source due to its relatively low mobility. PFOA, on the other hand, may be detected at relatively higher concentrations farther from the source.
References Cited
Banta, E.R., 2011, ModelMate—A graphical user interface for model analysis: U.S. Geological Survey Techniques and Methods book 6, chap. E4, 31 p., accessed December 14, 2012, at https://doi.org/10.3133/tm6E4.
Bennett, D.S., Lyons, J.B., Wittkop, C.A., and Dicken, C.L., 2006, Bedrock geologic map of New Hampshire, a digital representation of Lyons and others 1997 map and ancillary files: U.S. Geological Survey Data Series 215, 1 CD-ROM. [Also available at https://pubs.usgs.gov/ds/215/.]
CES, Inc., 2017, May 2018—Memo—Summary of previously performed geophysical investigation on western portion of the GMZ for the Coakley Landfill and proposed surface geophysical investigation for deep bedrock well siting—Coakley Landfill Superfund site North Hampton and Greenland New Hampshire: New Hampshire Department of Environmental Services, prepared by CES, Inc., [variously paged; 41p.], 1 app., accessed December 10, 2025, at http://www4.des.state.nh.us/DocViewer/?ContentId=4710957.
CES, Inc., 2018a, Draft 2017 annual summary report—Coakley Landfill Breakfast Hill Road North Hampton, NH: Coakley Landfill Group, prepared by CES, Inc., [variously paged; 217 p.], [7 apps. published separately], accessed January 16, 2026, at http://www4.des.state.nh.us/DocViewer/?ContentId=4717218.
CES, Inc., 2018b, Draft 2017 annual summary report appendix D—Coakley Landfill Breakfast Hill Road North Hampton, NH, in Draft 2017 annual summary report—Coakley Landfill Breakfast Hill North Hampton, NH: Coakley Landfill Group, prepared by CES, Inc., [variously paged; 171 p.], accessed January 16, 2026, at http://www4.des.state.nh.us/DocViewer/?ContentId=4717216.
CES, Inc., 2019, November 2019—Deep bedrock investigation interim report—Coakley Landfill Superfund site—North Hampton and Greenland New Hampshire: New Hampshire Department of Environmental Services, prepared by CES, Inc., [variously paged; 646 p.], accessed September 9, 2025, at http://www4.des.state.nh.us/DocViewer/?ContentId=4821262.
CES, Inc., 2020a, Draft 2019 annual summary report—Coakley Landfill Breakfast Hill Road North Hampton, NH: Coakley Landfill Group, prepared by CES, Inc., [variously paged; 586 p.], accessed December 10, 2025, at http://www4.des.state.nh.us/DocViewer/?ContentId=4885479.
CES, Inc., 2020b, October 2020—Surface geophysical results and MW-25 well locating memorandum Coakley Landfill Superfund site—North Hampton and Greenland New Hampshire: New Hampshire Department of Environmental Services, prepared by CES, Inc., [variously paged; 8 p.], accessed December 10, 2025, at http://www4.des.state.nh.us/DocViewer/?ContentId=4884516.
Flynn, R.E., and Tasker, G.D., 2004, Generalized estimates from streamflow data of annual and seasonal ground-water-recharge rates for drainage basins in New Hampshire: U.S. Geological Survey Scientific Investigations Report 2004-5019, 67 p., accessed September 9, 2025, at https://pubs.usgs.gov/sir/2004/5019/.
Haley Ward, Inc., 2021, Draft deep bedrock investigation final report Coakley Landfill North Hampton, New Hampshire: Coakley Landfill Group, prepared by Haley Ward, Inc., [variously paged; 947 p.], accessed September 9, 2025, at http://www4.des.state.nh.us/DocViewer/?ContentId=4969036.
Haley Ward, Inc., 2022, 2021 annual summary report—Coakley Landfill Breakfast Hill Road North Hampton, NH: Coakley Landfill Group, prepared by Haley Ward, Inc., [variously paged; 3,804 p.], accessed January 26, 2026, at https://www4.des.state.nh.us/DocViewer/?ContentId=5007785.
Harbaugh, A.W., 2005, MODFLOW-2005, the U.S. Geological Survey modular ground-water model—The ground-water flow process: U.S. Geological Survey Techniques and Methods book 6, chap. A16, [variously paged; 253 p.], accessed September 9, 2025, at https://pubs.usgs.gov/tm/2005/tm6A16/.
Harte, P.T., 2021, Numerical modeling of groundwater flow in the crystalline-rock aquifer in the vicinity of the Savage Municipal Water-Supply Well Superfund site, Milford, New Hampshire: U.S. Geological Survey Scientific Investigations Report 2020–5137, 47 p., accessed September 9, 2025, at https://doi.org/10.3133/sir20205137.
Harte, P.T., 2026, MODFLOW-NWT and MODPATH6 files used for groundwater-flow simulation, and pathline analyses in the vicinity of the Coakley Landfill Superfund site, seacoast region, New Hampshire: U.S. Geological Survey data release, https://doi.org/10.5066/P14LJKCX.
Harte, P.T., Huffman, B.J., Perina, T., Levine, H., and Rojas-Mickelson, D., 2019, Instructions for running the analytical code PAT (Purge Analyzer Tool) for computation of in-well time of travel of groundwater under pumping conditions: U.S. Geological Survey Open-File Report 2019–1104, 23 p., 3 app., accessed September 9, 2025, at https://doi.org/10.3133/ofr20191104.
Harte, P.T., and Huffman, B.J., 2020, PAT version 1.01 (October 30, 2020): GitHub software release, accessed September 9, 2025, at https://doi.org/10.5066/P93EF0GM.
Harte, P.T., and Winter, T.C., 1995, Simulations of flow in crystalline rock and recharge from overlying glacial deposits in a hypothetical New England setting: Groundwater, v. 33, no. 6, p. 953–964, accessed November 25, 2025, at https://doi.org/10.1111/j.1745-6584.1995.tb00041.x.
Hoffman, D., 2025, Coakley Landfill site—North Hampton and Greenland (rev. 1/2025): New Hampshire Department of Environmental Services summary report, 6 p., accessed November 25, 2025, at https://www.des.nh.gov/sites/g/files/ehbemt341/files/documents/superfund-coakley.pdf.
Horn, M.A., Moore, R.B., Hayes, L., and Flanagan, S.M., 2008, Methods for and estimates of 2003 and projected water use in the Seacoast Region, southeastern New Hampshire: U.S. Geological Survey Scientific Investigations Report 2007–5157, 87 p., 3 app., [app. 2 and 3 on CD-ROM], accessed September 9, 2025, at https://pubs.usgs.gov/publication/sir20075157.
Hussey, A.M., II, Bothner, W.A., and Thompson, P.J., 2016, Bedrock geology of the Kittery 1:100,000 quadrangle, Maine and New Hampshire: Maine Geological Survey, Geologic Map 16-6 2016 (Corrected 2019), 1 sheet, scale 1:100,000, accessed September 9, 2025, at https://digitalmaine.com/mgs_maps/517/. [Supersedes Maine Geological Survey Geologic Map 08-78. Associated report Maine Geological Survey Bulletin 45; Hussey and others (2016)].
Köppen, W., 1884, Die Wärmezonen der Erde, nach der Dauer der heissen, gemässigten und kalten Zeit und nach der Wirkung der Wärme auf die organische Welt betrachtet [The thermal zones of the Earth according to the duration of hot, moderate and cold periods and of the impact of heat on the organic world]: Meteorologische Zeitschrift, v. 1, p. 215–226. [English translation by Volken, E., and Brönnimann, S., 2011, in Meteorologische Zeitschrift, v. 20, no. 3, p. 351–360, accessed September 10, 2025, at https://doi.org/10.1127/0941-2948/2011/105].
Kuniansky, E.L., 2018, An open source spreadsheet for calculation of equivalent freshwater altitude in brackish water mixing zone of an aquifer with documentation on appropriate use: GitHub software release, accessed December 18, 2025, at https://doi.org/10.5066/F798869Q.
Leake, S.A., and Lilly, M.R., 1997, Documentation of a computer program (FHB1) for assignment of transient specified-flow and specified-head boundaries in applications of the modular finite-difference ground-water flow model (MODFLOW): U.S. Geological Survey Open-File Report 97—571, 50 p, accessed September 9, 2025, at https://doi.org/10.3133/ofr97571.
Lyons, J.B., Bothner, W.A., Moench, R.H., and Thompson, J.B., Jr., 1997, Bedrock geologic map of New Hampshire: U.S. Geological Survey map, 2 sheets, scale 1:250,000. [Also available at https://doi.org/10.3133/70211051.]
Mack, T.J., 2009, Assessment of ground-water resources in the Seacoast region of New Hampshire: U.S. Geological Survey Scientific Investigations Report 2008–5222, 188 p., accessed September 10, 2025, at https://doi.org/10.3133/sir20085222.
Mack, T.J., 2017, Preliminary-assessment and upgrade of a groundwater flow model of the seacoast bedrock aquifer, New Hampshire, in Proceedings of the MODFLOW and More 2017 Conference—Modeling for sustainability and adaptation, Golden, Colo., May 21–24, 2017: Modflow & More 2017 Organizing Committee, p. 40–44.
Mack, T.J., 2023, MODFLOW-NWT upgrade and preliminary-assessment of a groundwater-flow model of the seacoast bedrock aquifer, New Hampshire: U.S. Geological Survey data release, accessed September 10, 2025, at https://doi.org/10.5066/P909PUIP.
Moore, R.B., 1990, Geohydrology and water quality of stratified-drift aquifers in the Exeter, Lamprey, and Oyster River Basins, Southeastern New Hampshire: U.S. Geological Survey Water-Resources Investigations Report 88-4128, 60 p., 8 pls., accessed September 9, 2025, at https://doi.org/10.3133/wri884128.
New Hampshire Department of Environmental Services [NHDES], 2020a, OneStop [well inventory records]: New Hampshire Department of Environmental Services database, accessed 2020, at https://www4.des.state.nh.us/DESOnestop/BasicSearch.aspx.
New Hampshire Department of Environmental Services [NHDES], 2020b, Per- and polyfluoroalkyl substances (PFAS) in New Hampshire well water: New Hampshire Department of Environmental Services Environmental Fact Sheet, DWGB-3-25, 4 p., accessed January 19, 2022, at https://www.dhhs.nh.gov/sites/g/files/ehbemt341/files/documents/dwgb-3-25.pdf.
New Hampshire Department of Environmental Services [NHDES], 2022, Statewide aquifer transmissivity for New Hampshire (original version): University of New Hampshire NH GRANIT data release, accessed 2024? at https://new-hampshire-geodata-portal-1-nhgranit.hub.arcgis.com/datasets/NHGRANIT::statewide-aquifer-transmissivity-for-new-hampshire/about.
New Hampshire Department of Environmental Services [NHDES], 2023, New Hampshire PFAS response—Drinking water: New Hampshire Department of Environmental Services web page, accessed 2023, at https://www.pfas.des.nh.gov/drinking-water.
New Hampshire Department of Environmental Services [NHDES], 2025, Public water and sewer distribution areas (information and data updated April 3, 2025): New Hampshire Department of Environmental Services Geodata Portal dataset, accessed December 18, 2025, at https://nh-department-of-environmental-services-open-data-nhdes.hub.arcgis.com/datasets/NHDES::public-water-and-sewer-distribution-areas.
New Hampshire Department of Environmental Services [NHDES], [undated], [Spreadsheet of per- and polyfluoroalkyl substances total concentrations in groundwater samples from wells in New Hampshire]: New Hampshire Department of Environmental Services Environmental Monitoring Database web page [information page to request a data retrieval], accessed 2022, at https://www.des.nh.gov/resource-center/data-and-mapping/EMD.
New Hampshire Department of Transportation, 2018, NH DOT roads (updated 2022?): University of New Hampshire NH GRANIT data release, accessed 2022, at https://usgs.maps.arcgis.com/home/item.html?id=e8e2c844063f465ba284114cd08d0ecf.
Niswonger, R.G., Panday, S., and Ibaraki, M., 2011, MODFLOW-NWT, a Newton formulation for MODFLOW-2005: U.S. Geological Survey Techniques and Methods book 6 chap. A37, 44 p., accessed September 10, 2025, at https://doi.org/10.3133/tm6A37.
Poeter, E.P., Hill, M.C., Lu, D., Tiedeman, C.R., and Mehl, S., 2014, UCODE_2014, with new capabilities to define parameters unique to predictions, calculate weights using simulated values, estimate parameters with SVD, evaluate uncertainty with MCMC, and more—Constructed using the JUPITER API (ver. 2): Colorado School of Mines Integrated Groundwater Modeling Center Report GWMI 2014-02, 172 p., accessed September 10, 2025, at https://geology.mines.edu/igwmc/ucode/.
Pollock, D.W., 2012, User guide for MODPATH Version 6—A particle-tracking model for MODFLOW: U.S. Geological Survey Techniques and Methods book 6, chap. A41, 58 p., accessed September 10, 2025, at https://doi.org/10.3133/tm6A41.
Prudic, D.E., 1989, Documentation of a computer program to simulate stream-aquifer relations using a modular, finite-difference, ground-water flow model: U.S. Geological Survey Open-File Report 88–729, 113 p. [Also available at https://doi.org/10.3133/ofr88729.]
Simon, J.A., Abrams, S., Bradburne, T., Bryant, D., Burns, M., Cassidy, D., Cherry, J., Chiang, S.Y., Cox, D., Crimi, M., Denly, E., DiGuiseppi, B., Fenstermacher, J., Fiorenza, S., Guarnaccia, J., Hagelin, N., Hall, L., Hesemann, J., Houtz, E., Koenigsberg, S.S., Lauzon, F., Longsworth, J., Maher, T., McGrath, A., Naidu, R., Newell, C.J., Parker, B.L., Singh, T., Tomiczek, P., and Wice, R., 2019, PFAS experts symposium—Statements on regulatory policy, chemistry and analytics, toxicology, transport/fate, and remediation for per- and polyfluoroalkyl substances (PFAS) contamination issues: Remediation, v. 29, no. 4, p. 31–48, accessed September 10, 2025, at https://doi.org/10.1002/rem.21624.
Stekl, P.J., and Flanagan, S.M., 1992, Geohydrology and water quality of stratified-drift aquifers in the Lower Merrimack and Coastal River Basins, Southeastern New Hampshire: U.S. Geological Survey Water-Resources Investigations Report 91–4025, 24 p. [Also available at https://doi.org/10.3133/wri914025.]
Stevens, R., Carter, J., and Peter, C., 2022, An ecological approach to designing salt marshes—Tidal wetland vegetation elevation and ecotone boundaries in Great Bay, New Hampshire: New Hampshire Fish and Game Department, Great Bay National Estuarine Research Reserve Technical Report, 24 p., accessed July 31, 2025, at https://greatbay.org/wp-content/uploads/2022/03/Designing-Salt-Marshes-March-20221.pdf.
U.S. Environmental Protection Agency [EPA], 2016, Fourth five-year review for Coakley Landfill Superfund site Rockingham County, New Hampshire: U.S. Environmental Protection Agency report, [variously paged; 251 p.], attachments, accessed December 22, 2025, at http://www4.des.state.nh.us/DocViewer/?ContentId=4625368.
U.S. Environmental Protection Agency [EPA], 2017, Technical fact sheet—perfluorooctane sulfonate (PFOS) and perfluorooctanoic acid (PFOA): U.S. Environmental Protection Agency fact sheet EPA 505-F-17-001, 8 p., accessed September 10, 2025, at https://downloads.regulations.gov/EPA-HQ-TRI-2022-0270-0009/content.pdf.
U.S. Environmental Protection Agency [EPA], [2024], Per- and polyfluoroalkyl substances (PFAS)—Final PFAS national primary drinking water regulation (updated December 4, 2025): U.S. Environmental Protection Agency webpage, accessed December 19, 2025, at https://www.epa.gov/sdwa/and-polyfluoroalkyl-substances-pfas.
U.S. Fish and Wildlife Service, [2004], National wetlands inventory [New Hampshire]: U.S. Fish and Wildlife Service digital vector dataset, accessed 2005?, at http://wetlandswms.er.usgs.gov/imf/imf.jsp?site=extract_tool. [The most recent version of the dataset can be accessed at https://www.fws.gov/program/national-wetlands-inventory/data-download.]
U.S. Geological Survey, [1999a], National hydrography dataset (updated 2005): U.S. Geological Survey geospatial data release, scale 1:100,000, accessed January 1, 2006, at http://nhd.usgs.gov/. [The most recent version of the 1:100,000-scale “legacy NHD” can be accessed at https://www.usgs.gov/national-hydrography/national-hydrography-dataset.]
U.S. Geological Survey [1999b], National hydrography dataset [entire nation] (updated September 18, 2025): U.S. Geological Survey geospatial data release, scale 1:100,000, accessed January 21, 2026, at https://www.usgs.gov/national-hydrography/national-hydrography-dataset.
U.S. Geological Survey, 2022, 3D elevation program 1-meter resolution digital elevation model [also titled as NH coastal lidar work package 183374, work unit 183371; DEM] (ver. March 12, 2022): U.S. Geological Survey dataset, accessed January 21, 2026, at https://www.usgs.gov/the-national-map-data-delivery.
U.S. Geological Survey, [2025], Water data for the Nation—High-quality and discoverable water data for everyone [streamgage identification numbers]: U.S. Geological Survey website, accessed March 26, 2026, at https://waterdata.usgs.gov/.
Xing, Y., Li, Q., Chen, X., Fu, X., Ji, L., Wang, J., Li, T., and Zhang, Q., 2021, Different transport behaviors and mechanisms of perfluorooctanoate (PFOA) and perfluorooctane sulfonate (PFOS) in saturated porous media: Journal of Hazardous Materials, v. 402, 8 p., accessed December 19, 2025, at https://doi.org/10.1016/j.jhazmat.2020.123435.
Zhou, Y., and Li, W., 2011, A review of regional groundwater flow modeling: Geoscience Frontiers, volume 2, no. 2, p. 205–214, accessed September 11, 2025, at https://doi.org/10.1016/j.gsf.2011.03.003.
Appendix 1. Supplemental Model Construction Information
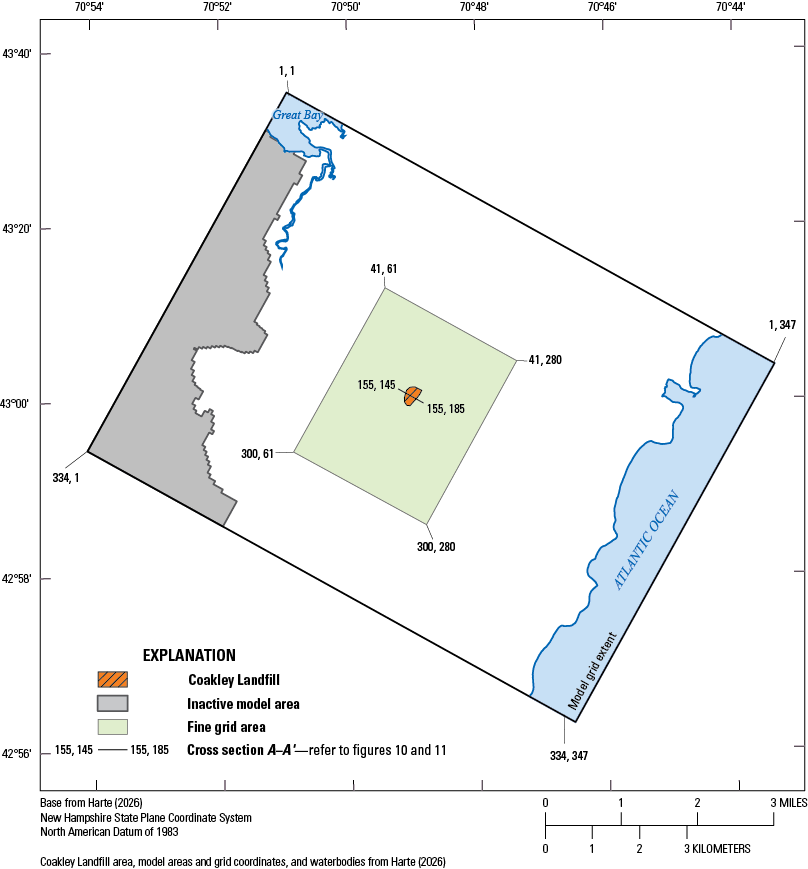
Map of the Coakley Landfill model area showing the row and column numbers as coordinates of the boundaries of the full model area, the fine grid area, and cross section A–A′ used in Harte (2026).
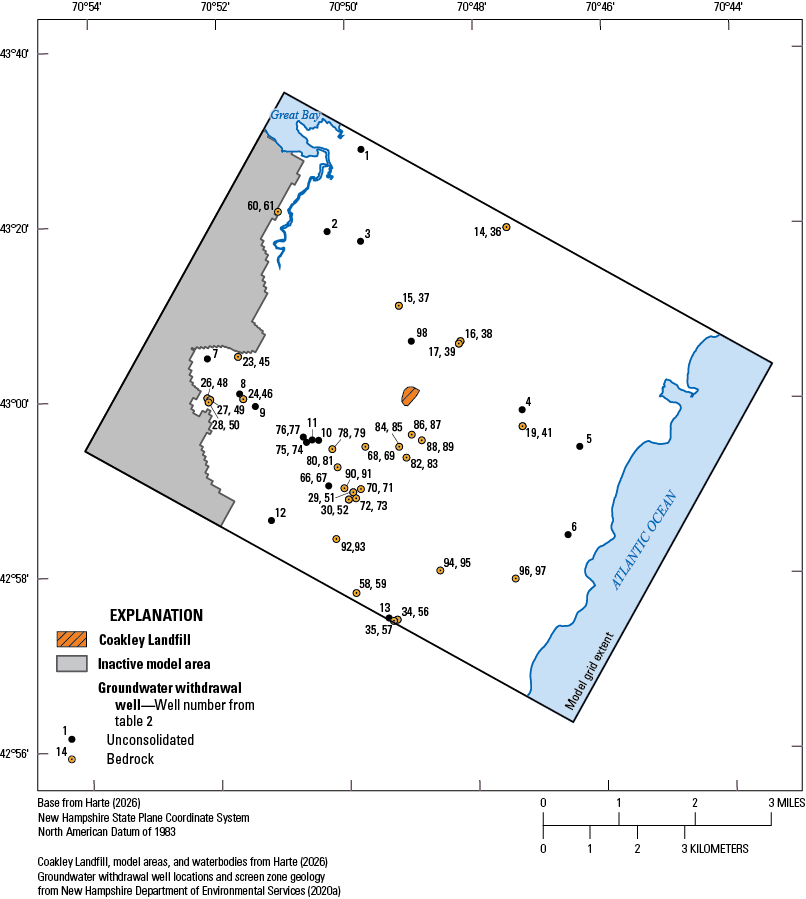
Map of simulated groundwater withdrawal wells in the Coakley Landfill model (Harte, 2026).
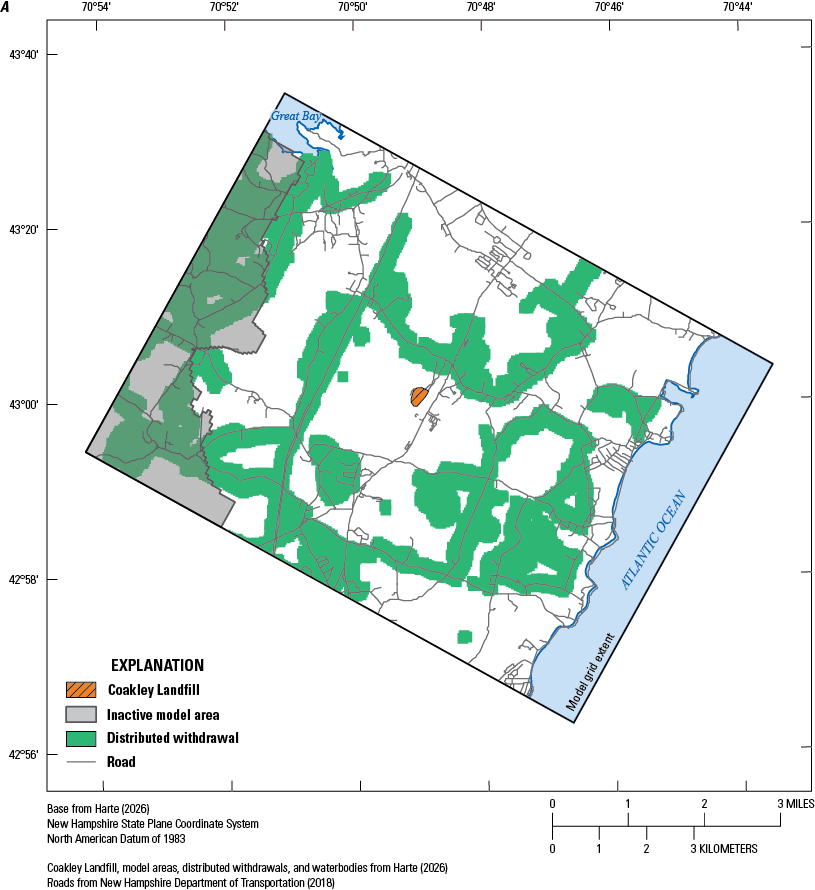
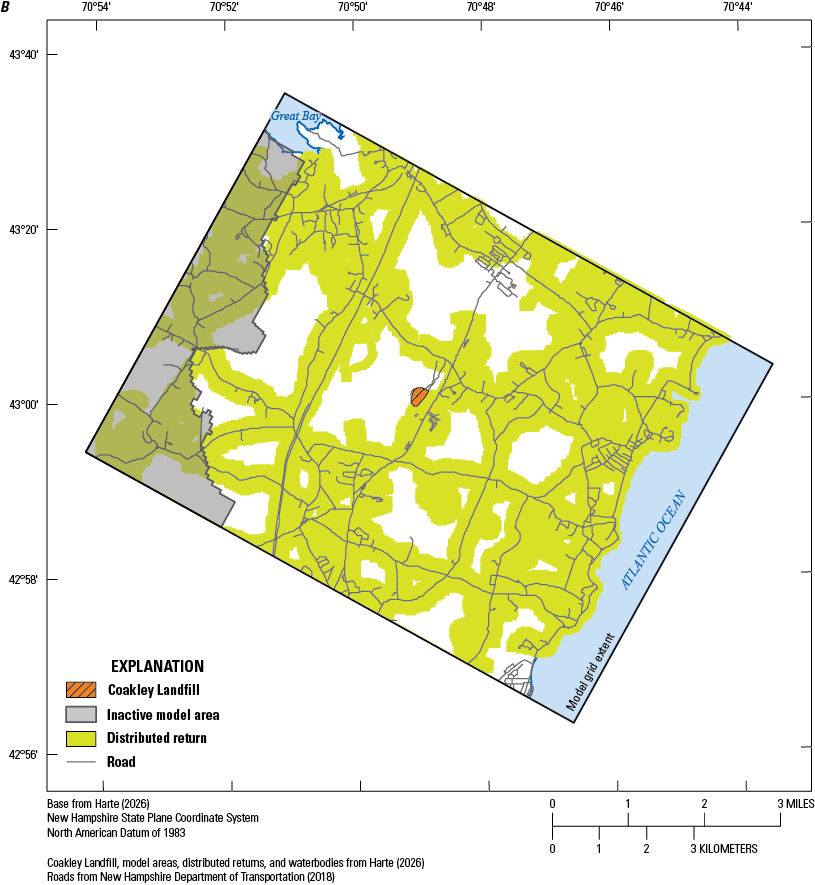
Map showing which areas of the Coakley Landfill model (Harte, 2026) have specified simulated fluxes. A, Areas with simulated distributed withdrawals of groundwater; and B, areas with simulated distributed returns.
Table 1.1.
Streamflow measurement data in the Coakley Landfill model area, Coakley Landfill Superfund site, Seacoast Region, New Hampshire.[U.S. Geological Survey (USGS) station numbers from U.S. Geological Survey (2025). Streamgage locations are shown in figure 3. Basin area, mean flow, calculated annual base flow, and measured streamflow data from Mack (2009). mi2, square mile; ft3/d, cubic foot per day; —, no data; P, partial-record streamgage; C, continuous-record streamgage]
References Cited
Harte, P.T., 2026, MODFLOW-NWT and MODPATH6 files used for groundwater-flow simulation, and pathline analyses in the vicinity of the Coakley Landfill Superfund site, seacoast region, New Hampshire: U.S. Geological Survey data release, https://doi.org/10.5066/P14LJKCX.
Mack, T.J., 2009, Assessment of ground-water resources in the Seacoast region of New Hampshire: U.S. Geological Survey Scientific Investigations Report 2008–5222, 188 p., accessed September 10, 2025, at https://doi.org/10.3133/sir20085222.
U.S. Geological Survey, [2025], Water data for the Nation—High-quality and discoverable water data for everyone [streamgage identification numbers]: U.S. Geological Survey website, accessed March 26, 2026, at https://waterdata.usgs.gov/.
Conversion Factors
Datums
Vertical coordinate information is referenced to the North American Vertical Datum of 1988 (NAVD 88).
Horizontal coordinate information is referenced to the World Geodetic System of 1984 (WGS 84).
Altitude, as used in this report, refers to distance above the vertical datum.
Supplemental Information
Concentrations of chemical constituents in water are given in nanograms per liter (ng/L).
Concentrations of chemical constituents in soil are given in milligrams per kilogram (mg/kg).
Loads of chemical constituents are given in nanograms per day (ng/d).
Abbreviations
DEM
digital elevation model
EPA
U.S. Environmental Protection Agency
NHDES
New Hampshire Department of Environmental Services
PFAS
per- and polyfluoroalkyl substances
PFOA
perfluorooctanoic acid
PFOS
perfluorooctanesulfonic acid
PFNA
perfluorononanoic acid
PFHxS
perfluorohexanesulfonic acid
PFHpS
perfluoroheptanesulfonic acid
PFBS
perfluorobutanesulfonic acid
For more information about this report, contact:
Director, New England Water Science Center
U.S. Geological Survey
10 Bearfoot Road
Northborough, MA 01532
dc_nweng@usgs.gov
or visit our website at
https://www.usgs.gov/centers/new-england-water
Publishing support provided by the U.S. Geological Survey, Science Publishing Network, Pembroke Publishing Service Center
Disclaimers
Any use of trade, firm, or product names is for descriptive purposes only and does not imply endorsement by the U.S. Government.
Although this information product, for the most part, is in the public domain, it also may contain copyrighted materials as noted in the text. Permission to reproduce copyrighted items must be secured from the copyright owner.
Suggested Citation
Harte, P.T., and Collins, A.L., 2026, Simulation of groundwater flow to evaluate hydrogeologic controls on a PFAS plume, Coakley Landfill Superfund site, Rockingham County, New Hampshire: U.S. Geological Survey Scientific Investigations Report 2026–5008, 41 p., https://doi.org/10.3133/sir20265008. [Supersedes preprint https://doi.org/10.31223/X53761.]
ISSN: 2328-0328 (online)
Study Area
| Publication type | Report |
|---|---|
| Publication Subtype | USGS Numbered Series |
| Title | Simulation of groundwater flow to evaluate hydrogeologic controls on a PFAS plume, Coakley Landfill Superfund site, Rockingham County, New Hampshire |
| Series title | Scientific Investigations Report |
| Series number | 2026-5008 |
| DOI | 10.3133/sir20265008 |
| Publication Date | May 11, 2026 |
| Year Published | 2026 |
| Language | English |
| Publisher | U.S. Geological Survey |
| Publisher location | Reston, VA |
| Contributing office(s) | New England Water Science Center |
| Description | Report: viii, 41 p.; Data Release |
| Country | United States |
| State | New Hampshire |
| Other Geospatial | Coakley Landfill Superfund Site |
| Online Only (Y/N) | Y |
| Additional Online Files (Y/N) | N |