

Hydrogeologic Framework and Conceptual Groundwater-Flow Model of the Panhandle and Northwest Parts of the High Plains (Ogallala) Aquifer in Oklahoma, 1998–2022
Links
- Document: Report (17.3 MB pdf) , HTML , XML
- Data Release: USGS Data Release - Soil-Water-Balance model and data used in the hydrogeologic framework and conceptual groundwater-flow model of the panhandle and northwest parts of the High Plains (Ogallala) aquifer in Oklahoma, 1998–2022
- NGMDB Index Page: National Geologic Map Database Index Page (html)
- Download citation as: RIS | Dublin Core
Acknowledgments
The authors appreciate the contributions made by the staff of the Oklahoma Water Resources Board (OWRB) that led to the completion of this report. Special thanks are extended to Christopher Neel (Division Chief, Water Rights Administration Division) and Derrick Wagner (Technical Studies Manager, Water Rights Administration Division), who provided hydrogeologic data and helped with defining study objectives and deliverables. The authors also thank OWRB employees Jacob Hernandez, Chris Adams, and Harold Robertson for organizing the synoptic efforts and Byron Waltman, Eric Fiorentino, Jason Shiever, Zachary Tomlinson, and Zachary McKinney for helping with the measurements. The authors also thank OWRB employees Anthony Huey and Jared Welch for their help with the nuclear magnetic resonance survey.
The authors express gratitude to the U.S. Geological Survey (USGS) employees Chris Thompson, who performed seepage measurements, and Jason Payne and Sam Wallace, who helped with the nuclear magnetic resonance survey. The authors also thank USGS employees Nicole Gammill, Cory Russell, and Evin Fetkovich, who performed detailed technical reviews on this report and the accompanying data release.
Abstract
This study was conducted by the U.S. Geological Survey, in cooperation with the Oklahoma Water Resources Board, to update the hydrogeologic framework and conceptual flow model for the panhandle and northwest parts of the High Plains (Ogallala) aquifer in Oklahoma, which together compose the Ogallala aquifer focus area. The study included the construction of a potentiometric surface, and available geologic and hydrologic data were used to evaluate saturated thickness of the aquifer. The water budget for the updated conceptual groundwater-flow model was based on estimated inflows and outflows for the 1998–2022 study period.
Saturated thickness of the Ogallala aquifer averaged 127 and 116 feet for the panhandle and northwest parts, respectively. Groundwater withdrawals from the Ogallala aquifer for 1998–2022 averaged 422,054 and 39,645 acre-feet per year (acre-ft/yr) for the panhandle and northwest parts, respectively. Recharge, the primary inflow, was estimated at 0.63 inch per year for the 1998–2022 study period, with the panhandle part of the Ogallala aquifer receiving 175,068 acre-ft/yr and the northwest part of the Ogallala aquifer receiving 49,376 acre-ft/yr. Additional inflows included irrigation return flows, estimated at 8,111 and 642 acre-ft/yr for the panhandle and northwest parts, respectively, of the Ogallala aquifer. Net lateral groundwater flows, considered to be aquifer outflows, were estimated to account for 31,908 acre-ft/yr for the Ogallala aquifer focus area. Streambed seepage, which was an outflow of 5,535 acre-ft/yr, was only present in the northwest part of the Ogallala aquifer. Vertical leakage and saturated-zone evapotranspiration were considered negligible outflows. These findings provide a revised conceptual groundwater-flow model water budget for the Ogallala aquifer focus area in Oklahoma.
Introduction
The 1973 Oklahoma Groundwater Law (Oklahoma Statute § 82-1020.5 [Oklahoma State Legislature, 2021a]) requires the Oklahoma Water Resources Board (OWRB) to conduct hydrologic investigations of the State’s aquifers (referred to as “groundwater basins” in the statutes) to support a determination of the maximum annual yield (MAY) for each aquifer. The MAY is defined as the amount of fresh groundwater that can be withdrawn annually while ensuring a minimum 20-year life of the aquifer (OWRB, 2012, 2024a). For bedrock aquifers, the groundwater-basin-life requirement is satisfied if, after 20 years of MAY withdrawals, 50 percent of the groundwater basin (hereinafter referred to as an “aquifer”) retains a saturated thickness of at least 15 feet (ft). Although 20 years is the minimum period required by law, the OWRB may consider multiple management scenarios. The MAY is divided by the total land area overlying the aquifer to determine the annual volume of groundwater allocated per acre of land, or the equal-proportionate-share (EPS) pumping rate. The annual volume of water allocated to a given groundwater permit applicant is therefore proportional to the land area overlying the aquifer that is owned or leased by a permit applicant.
The High Plains aquifer is a generally unconfined shallow bedrock aquifer in the central United States that underlies parts of eight states: Colorado, Kansas, Nebraska, New Mexico, Oklahoma, South Dakota, Texas, and Wyoming (fig. 1). Most of the High Plains aquifer in Oklahoma is part of a lobe of the aquifer that extends from the Arkansas River to the Canadian River and includes parts of southeastern Colorado, southwestern Kansas, northeastern New Mexico, northwestern Oklahoma, and northern panhandle of Texas (fig. 1). The OWRB (as well as water-regulating agencies in neighboring States) refers to most of the High Plains aquifer as the “Ogallala aquifer” (OWRB, 2024b; Kansas Geological Survey, 2026; Texas Water Development Board, 2026). Consequently, this report uses “Ogallala aquifer” when referring to the High Plains aquifer in Oklahoma. For purposes of permitting, the OWRB has divided the Ogallala aquifer into three parts: panhandle, northwest, and Roger Mills (OWRB, 2012). The panhandle part encompasses the Ogallala aquifer in Beaver, Cimarron, and Texas Counties, Okla. The northwest part encompasses the Ogallala aquifer in Dewey, Ellis, Harper, and Woodward Counties, Okla. The Roger Mills part encompasses only the Ogallala aquifer in Roger Mills County, Okla.
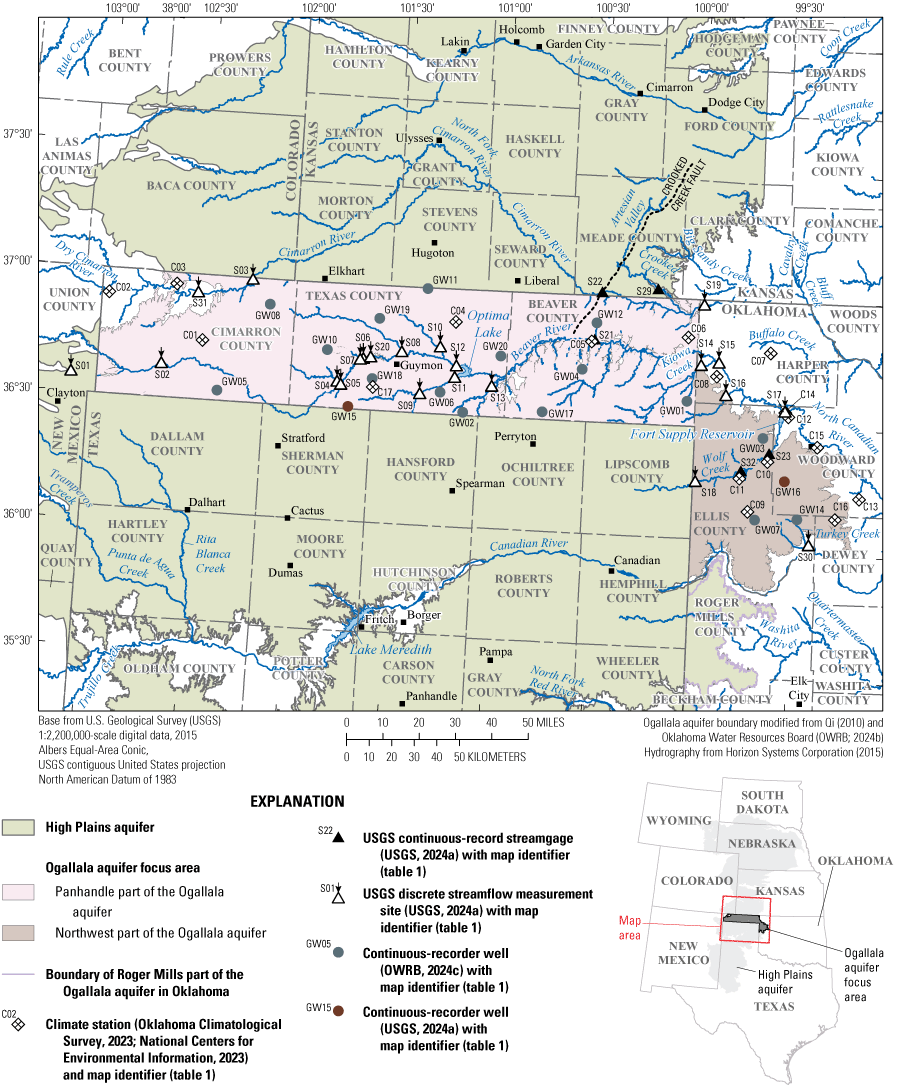
Map of the High Plains (Ogallala) aquifer study area showing selected data-collection stations and the panhandle and northwest parts of the Ogallala aquifer in Oklahoma, which together compose the Ogallala aquifer focus area.
The OWRB issued final orders on March 12, 2002, that established MAYs and EPS pumping rates for the panhandle part and the northwest part of the Ogallala aquifer. For the panhandle part of the Ogallala aquifer, the MAY was established at 6,773,760 acre-feet per year (acre-ft/yr), and the EPS pumping rate was determined to be 2.0 acre-feet per acre per year (acre-ft/acre/yr) (Grady Grandstaff, Oklahoma Water Resources Board, written commun., 2002). For the northwest part of the Ogallala aquifer, the MAY was established at 1,189,500 acre-ft/yr, and the EPS pumping rate was determined to be 1.4 acre-ft/acre/yr (Grady Grandstaff, Oklahoma Water Resources Board, written commun., 2002). These MAY and EPS values were based on a hydrologic investigation completed by Luckey and Becker (1999) who used a numerical groundwater-flow model to evaluate the effects of potential groundwater withdrawals on groundwater availability in the Ogallala aquifer. The OWRB completed a hydrologic investigation (Belden and Osborn, 2002) of the Roger Mills part of the Ogallala aquifer but has not yet established MAY and EPS values for that part of the Ogallala aquifer (Sanford, 2023). The OWRB is statutorily required to periodically update the hydrologic investigations on which the MAY determinations were based (OWRB, 2024a). Because more than 20 years have elapsed since the March 12, 2002, final orders, the U.S. Geological Survey (USGS), in cooperation with the OWRB, carried out a hydrologic investigation to update the hydrogeologic framework and conceptual flow model for the panhandle and northwest parts of the Ogallala aquifer. Data associated with this report are available in the associated data release (Codner and others, 2026).
Purpose and Scope
The purposes of this report are to (1) provide an updated summary of the hydrogeology and hydrogeologic framework of the panhandle and northwest parts of the Ogallala aquifer and (2) describe the development of a conceptual groundwater-flow model and water budget representing the study period 1998–2022. This report uses the terms “High Plains (Ogallala) aquifer study area” (hereinafter referred to as “study area”) and “Ogallala aquifer focus area” for specific purposes. The study area (fig. 1) includes most of the High Plains aquifer extent between the Arkansas and Canadian Rivers and contains some data-collection stations (table 1) that may be outside of the aquifer extent. The Ogallala aquifer focus area (fig. 1) is equivalent to the combined extents of the panhandle and northwest parts of the Ogallala aquifer and includes all or parts of Beaver, Cimarron, Dewey, Ellis, Harper, Texas, and Woodward Counties in Oklahoma. Although the analysis described in this report is primarily centered on the Ogallala aquifer focus area, data and influences from the wider High Plains aquifer in the study area were also included in the analysis. Likewise, although the analysis described in this report is primarily centered on the 1998–2022 study period, data collected outside of the study period also were used to inform the conceptual groundwater-flow model and water budget.
Table 1.
Selected data-collection stations in the High Plains (Ogallala) aquifer study area, southeastern Colorado, southwestern Kansas, northeastern New Mexico, northwestern Oklahoma, and northwestern Texas.[U.S. Geological Survey (USGS) data can be accessed by using the 8- or 15-digit station number or other identifier. Dates are in month/day/year format. NAVD 88, North American Vertical Datum of 1988; --, unknown or not applicable; OWRB, Oklahoma Water Resources Board]
| Station name | Map identifier (fig. 1) | Station number | Latitude (decimal degrees NAD 83) |
Longitude (decimal degrees NAD 83) |
County | Period of record (may contain gaps) or single measurement date | Land-surface altitude (feet above NAVD 88) | Well or hole depth (feet below land surface) | |||
|---|---|---|---|---|---|---|---|---|---|---|---|
| Begin | End | ||||||||||
| Seneca Creek at State Rd 18, near Clayton, N. Mex. | S01 | 363426103074610 | 36.5739 | −103.1299 | Union | 01/17/2023 | -- | -- | -- | ||
| Beaver River near Felt, Okla. | S02 | 07232250 | 36.6297 | −102.6815 | Cimarron | 01/17/2023 | -- | -- | -- | ||
| Cimarron River near Keyes, Okla. | S03 | 07155570 | 36.9835 | −102.2505 | Cimarron | 01/18/2023 | -- | -- | -- | ||
| Beaver (Sand) Creek near Texhoma, Okla. | S04 | 07232400 | 36.6022 | −101.7976 | Texas | 01/18/2023 | -- | -- | -- | ||
| Beaver River near Texhoma, Okla. | S05 | 07232405 | 36.5905 | −101.7786 | Texas | 01/18/2023 | -- | -- | -- | ||
| Beaver River near Eva, Okla. | S06 | 07232460 | 36.6978 | −101.6729 | Texas | 01/18/2023 | -- | -- | -- | ||
| Tepee Creek near Goodwell, Okla. | S07 | 07232455 | 36.6942 | −101.6884 | Texas | 01/18/2023 | -- | -- | -- | ||
| Goff Creek N. of Guymon, Okla. | S08 | 07232585 | 36.7334 | −101.4824 | Texas | 01/18/2023 | -- | -- | -- | ||
| Coldwater Creek near Guymon, Okla. | S09 | 07232900 | 36.572 | −101.3815 | Texas | 01/18/2023 | -- | -- | -- | ||
| Poney Creek near Optima, Okla. | S10 | 07232620 | 36.7609 | −101.2909 | Texas | 01/18/2023 | -- | -- | -- | ||
| Coldwater Creek near Hardesty, Okla. | S11 | 07233000 | 36.6439 | −101.2109 | Texas | 01/18/2023 | -- | -- | -- | ||
| Beaver River near Hooker, Okla. | S12 | 07232630 | 36.6895 | −101.2057 | Texas | 01/18/2023 | -- | -- | -- | ||
| Palo Duro Creek near Range, Okla. | S13 | 07233700 | 36.6167 | −101.0237 | Texas | 01/18/2023 | -- | -- | -- | ||
| Kiowa Creek near Laverne, Okla. | S14 | 07234255 | 36.7378 | −99.9797 | Harper | 01/18/2023 | -- | -- | -- | ||
| Beaver River near Laverne, Okla. | S15 | 07234260 | 36.7503 | −99.8912 | Harper | 01/18/2023 | -- | -- | -- | ||
| Clear Creek near May, Okla. | S16 | 07234300 | 36.6228 | −99.8504 | Harper | 01/18/2023 | -- | -- | -- | ||
| Wolf Creek near Fort Supply, Okla. | S17 | 07237000 | 36.5667 | −99.5518 | Woodward | 01/18/2023 | -- | -- | -- | ||
| Wolf Creek near State Line near Shattuck, Okla. | S18 | 07235490 | 36.278 | −99.9862 | Ellis | 01/18/2023 | -- | -- | -- | ||
| Cimarron River near Englewood, Kans. | S19 | 07157580 | 36.9773 | −99.9759 | Harper | 01/26/2023 | -- | -- | -- | ||
| Beaver River near Goodwell, Okla. | S20 | 07232470 | 36.7059 | −101.6368 | Texas | 01/23/2023 | -- | -- | -- | ||
| Turkey Creek near Camargo, Okla. | S30 | 07228220 | 36.0417 | −99.4087 | Ellis | 01/26/2023 | -- | -- | -- | ||
| Cimarron River near Boise City, Okla. | S31 | 07155500 | 36.9189 | −102.5196 | Cimarron | 01/17/2023 | -- | -- | -- | ||
| Beaver River at Beaver, Okla. | S21 | 07234000 | 36.8222 | −100.5193 | Beaver | 10/14/1937 | 2024 | -- | -- | ||
| Cimarron River near Forgan, Okla. | S22 | 07156900 | 37.0111 | −100.4918 | Meade | 10/01/1965 | 2024 | -- | -- | ||
| Wolf Creek near Fargo, Okla. | S23 | 07236000 | 36.3992 | −99.6232 | Ellis | 10/15/1942 | 05/26/1976 | -- | -- | ||
| Crooked Creek near Englewood, Kans. | S29 | 07157500 | 37.0325 | −100.2112 | Meade | 10/01/1942 | 2024 | -- | -- | ||
| Wolf Creek near Gage, Okla. | S32 | 07235600 | 36.3266 | −99.7611 | Ellis | 11/06/2009 | 2024 | -- | -- | ||
| OWRB-349 | GW01 | 349 | 36.5976 | −100.0443 | Beaver | 11/30/2022 | 2024 | 2,457.6 | 260 | ||
| OWRB-927 | GW02 | 927 | 36.5111 | −101.1616 | Texas | 11/29/2022 | 2024 | 1,938.7 | 240 | ||
| OWRB-3270 | GW03 | 3270 | 36.4627 | −99.6569 | Ellis | 11/29/2022 | 2024 | 2,188.1 | 260 | ||
| OWRB-9051 | GW04 | 9051 | 36.7056 | −100.5755 | Beaver | 11/29/2022 | 2024 | 2,757.2 | 180 | ||
| OWRB-24401 | GW05 | 24401 | 36.5398 | −102.3947 | Cimarron | 09/13/2022 | 2024 | 3,997.3 | 140 | ||
| OWRB-33768 | GW06 | 33768 | 36.5856 | −101.2803 | Texas | 09/12/2022 | 2024 | 2,928.3 | 280 | ||
| OWRB-42791 | GW07 | 42791 | 36.1386 | −99.6833 | Ellis | 09/13/2022 | 2024 | 2,465.8 | 280 | ||
| OWRB-129152 | GW08 | 129152 | 36.8932 | −102.1565 | Cimarron | 09/13/2022 | 2024 | 3,871.9 | 314 | ||
| OWRB-24408 | GW10 | 24408 | 36.72798 | −101.8561 | Texas | 08/30/2022 | 2024 | 3,481.4 | 140 | ||
| OWRB-1886 | GW11 | 1886 | 36.9925 | −101.3697 | Texas | 09/27/2022 | 2024 | 3,153.9 | 300 | ||
| OWRB-58046 | GW12 | 58046 | 36.8933 | −100.5129 | Beaver | 08/30/2022 | 2024 | 2,508.7 | 160 | ||
| OWRB-140808 | GW14 | 140808 | 36.14596 | −99.4732 | Ellis | 11/21/2013 | 2024 | 2,353.9 | 200 | ||
| 01N-12E-35 BDD 1 Texhoma GW Well | GW15 | 363033101440701 | 36.5092 | −101.7357 | Texas | 07/26/1956 | 2024 | 3,430.6 | 386 | ||
| 21N-22W-15 CAD Woodward 15 | GW16 | 361739099323301 | 36.2943 | −99.5426 | Woodward | 07/27/2012 | 2024 | 2,310.1 | 300 | ||
| OWRB-137270 | GW17 | 13270 | 36.5295 | −100.7653 | Beaver | 11/29/2022 | 2024 | 2,920.5 | 420 | ||
| OWRB-23628 | GW18 | 23628 | 36.6243 | −101.6233 | Texas | 08/22/2023 | 2024 | 3,293.9 | 370 | ||
| OWRB-110093 | GW19 | 110093 | 36.8640 | −101.6031 | Texas | 08/30/2022 | 2024 | 3,313.9 | 380 | ||
| OWRB-24822 | GW20 | 24822 | 36.7419 | −100.9859 | Texas | 09/14/2022 | 2024 | 3,153.9 | 300 | ||
| Boise City 2 E | C01 | 908 | 36.7340 | −102.4840 | Cimarron | 01/1908 | 02/2020 | -- | -- | ||
| Kenton | C02 | 4766 | 36.9001 | −102.9670 | Cimarron | 11/1900 | 04/2006 | -- | -- | ||
| Regnier | C03 | 7534 | 36.9500 | −102.6300 | Cimarron | 04/1890 | 03/2006 | -- | -- | ||
| Hooker | C04 | 4298 | 36.8670 | −101.2200 | Texas | 06/1906 | 01/2024 | -- | -- | ||
| Beaver | C05 | 593 | 36.8170 | −100.5340 | Beaver | 02/1896 | 08/2017 | -- | -- | ||
| Gate | C06 | 3489 | 36.8500 | −100.0500 | Beaver | 07/1959 | 01/2024 | -- | -- | ||
| Buffalo 2 SSW | C07 | 1243 | 36.8000 | −99.63400 | Harper | 02/1907 | 01/2013 | -- | -- | ||
| Laverne | C08 | 5045 | 36.7000 | −99.9000 | Harper | 02/1939 | 09/2010 | -- | -- | ||
| Arnett 3NE | C09 | 332 | 36.1700 | −99.7200 | Ellis | 03/1911 | 2024 | -- | -- | ||
| Fargo | C10 | 3070 | 36.3700 | −99.6300 | Ellis | 06/1942 | 2024 | -- | -- | ||
| Gage Airport | C11 | 3407 | 36.3000 | −99.7670 | Ellis | 05/1904 | 2024 | -- | -- | ||
| Fort Supply Dam | C12 | 3304 | 36.5500 | −99.5340 | Woodward | 07/1940 | 01/2013 | -- | -- | ||
| Mutual | C13 | 6139 | 36.2340 | −99.1670 | Woodward | 01/1915 | 11/2023 | -- | -- | ||
| Supply 1 E | C14 | 8627 | 36.5670 | −99.5500 | Woodward | 02/1893 | 11/1975 | -- | -- | ||
| Woodward | C15 | 9760 | 36.4340 | −99.3840 | Woodward | 10/1895 | 2024 | -- | -- | ||
| Vici | C16 | 9172 | 36.1500 | −99.2840 | Dewey | 05/1995 | 03/2024 | -- | -- | ||
| Goodwell Research Station | C17 | 3628 | 36.5913 | −101.618 | Texas | 02/15/1910 | 02/04/2024 | -- | -- | ||
Description of the Ogallala Aquifer Focus Area
The Ogallala aquifer focus area encompasses 4,275,122 acres in Oklahoma (OWRB, 2024b). The panhandle part of the Ogallala aquifer encompasses 3,334,636 acres (78.0 percent), and the northwest part of the Ogallala aquifer encompasses 940,486 acres (22.0 percent).
Groundwater levels in the Ogallala aquifer focus area (and the High Plains aquifer) have been declining since about 1950 when the development of the groundwater for irrigation began (Wahl and Tortorelli, 1997; McGuire and Strauch, 2024b); therefore, “predevelopment” in this report refers to the period prior to 1950. The recharge ages for groundwater in the Ogallala aquifer focus area range from decades to nearly 9,000 years (Andrews and others, 2000). Luckey and Becker (1998) estimated the predevelopment (pre-1950s) groundwater discharge from the High Plains aquifer to the streams of the study area by analyzing winter low flows at streamgages. Estimates of predevelopment groundwater discharges to major streams overlying the Ogallala aquifer focus area were 42 cubic feet per second (ft3/s) for the Cimarron River near Forgan, Okla. (07156900), 4.5 ft3/s for the Beaver River at Beaver, Okla. (07234000), and 28 ft3/s for the Wolf Creek near Fargo, Okla. (07236000) streamgages (Luckey and Becker, 1998; fig. 1; table 1). Since the predevelopment–1998 study period of Luckey and Becker (1998), most of these rivers are no longer perennial across the study area (Gutentag and others, 1980; Luckey and Becker, 1998). Optima Lake is on the Beaver River in the panhandle part of the Ogallala aquifer (fig. 1). According to Smith and others (2015, p. 2),
Optima Lake on the Beaver River (fig. 1) is a good illustration of the degree to which the surface-water hydrology has changed in the Oklahoma Panhandle. *** Optima Dam was designed and authorized using streamflow data from the predevelopment period and was constructed from 1966 to 1978. Because of decreased streamflows in the irrigated period from 1978 to present (2015), Optima Lake never filled to more than 6 percent of the conservation pool storage and never met expectations for municipal water supply and recreation in the Oklahoma Panhandle.
Land Cover
Land cover over the Ogallala aquifer focus area (fig. 2) was mostly grass/pasture and cropland (undifferentiated), which accounted for 48.4 and 29.8 percent of land cover, respectively, in 2022 (National Agricultural Statistics Service, 2023; fig. 3A). The most prominent cropland-cover types in the Ogallala aquifer focus area in 2022 were winter wheat (34.9 percent), fallow/idle cropland (23.4 percent), sorghum (22.7 percent), and corn (10.1 percent). These types together accounted for 91.1 percent of cropland cover in the Ogallala aquifer focus area in 2022. However, cropland-cover types and proportions may change annually with seasonal, economic, and hydrologic factors. The Ogallala aquifer focus area is almost entirely rural; only 3.6 percent of the land cover is developed. About 0.3 percent of the land cover is combined water, wetland, or barren areas.
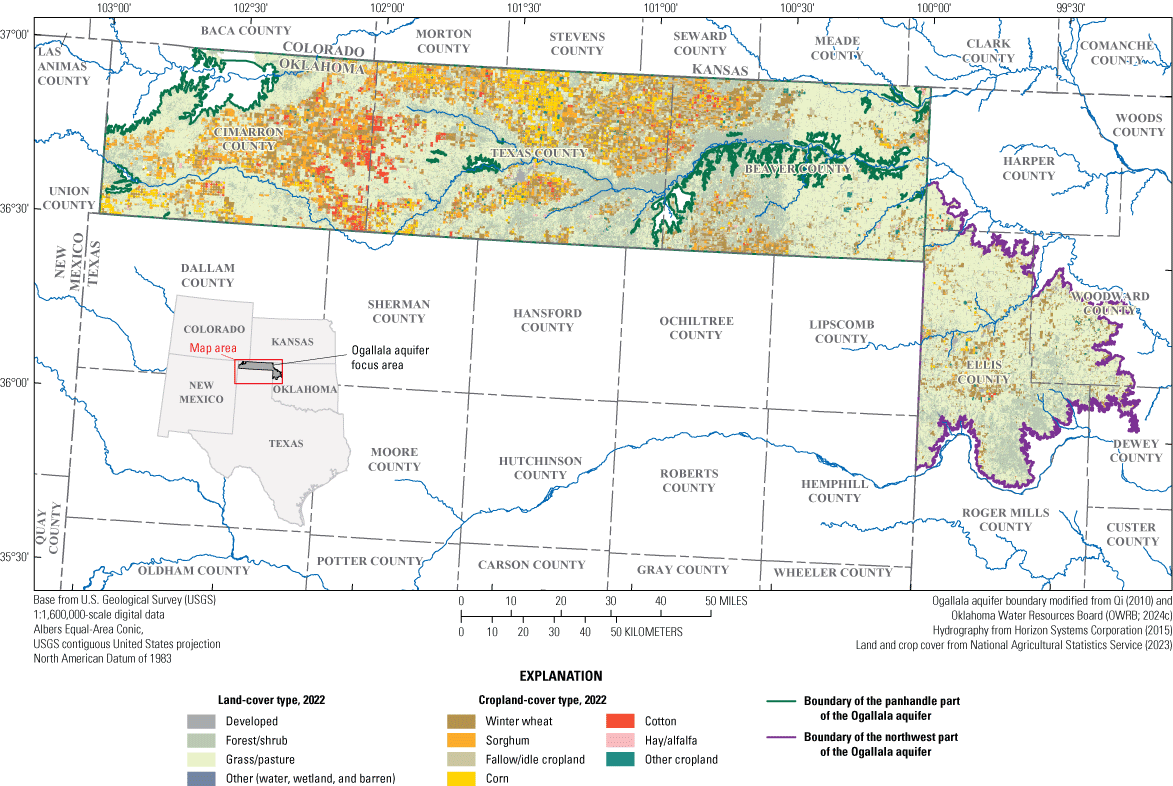
Land- and cropland-cover types over the panhandle and northwest parts of the Ogallala aquifer in Oklahoma, which together compose the Ogallala aquifer focus area, 2022.
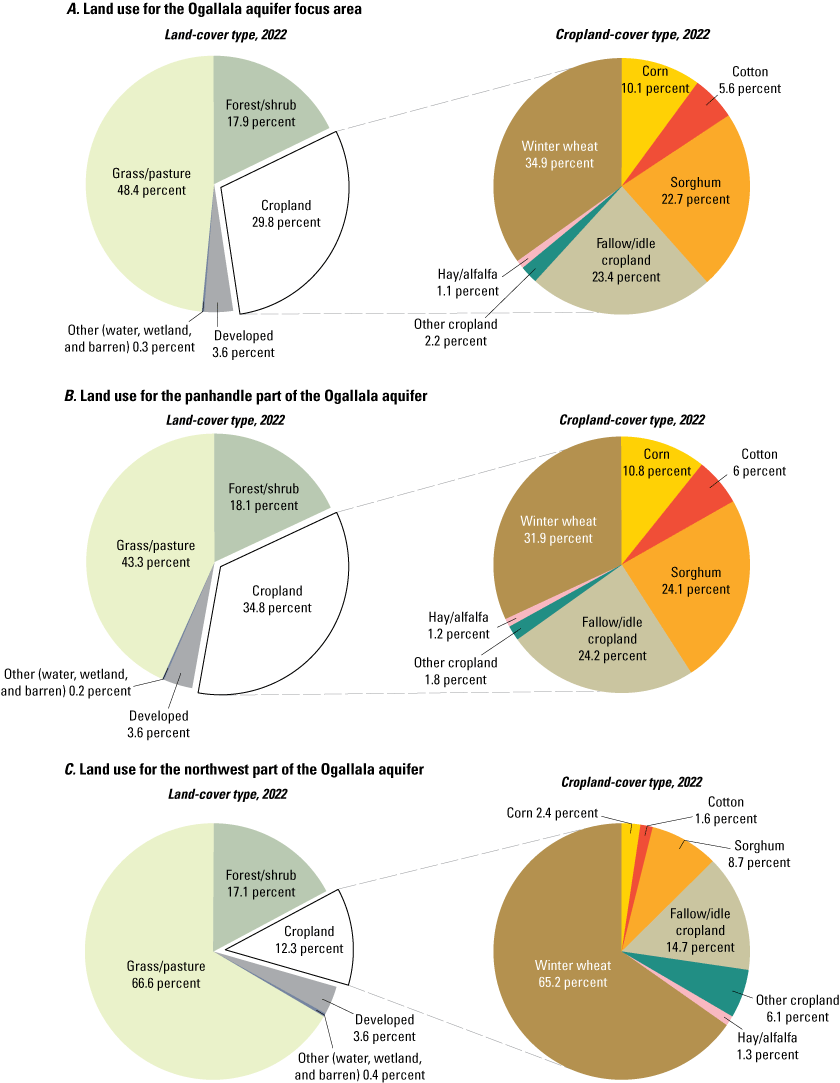
Distribution of land- and cropland-cover types in A, the Ogallala aquifer focus area and the B, panhandle and C, northwest parts of the Ogallala aquifer, Oklahoma, 2022 (National Agricultural Statistics Service, 2023).
Land cover over the panhandle part of the Ogallala aquifer was mostly grass/pasture and cropland (undifferentiated), which accounted for 43.3 and 34.8 percent of land cover, respectively, in 2022 (fig. 3B). Winter wheat (31.9 percent) was the most common cropland-cover type in the panhandle part of the Ogallala aquifer. The northwest part of the Ogallala aquifer had a greater proportion of grass/pasture (66.6 percent) and lesser proportion of cropland cover (12.3 percent) than the entire Ogallala aquifer focus area in 2022 (fig. 3C). Winter wheat (65.2 percent) was the most common cropland-cover type in the northwest part of the Ogallala aquifer.
Climate
The climate of the Ogallala aquifer focus area is classified as humid subtropical and cold semi-arid according to the Köppen-Geiger climate classification (Kottek and others, 2006). Historical daily precipitation data from 17 climate stations (fig. 1; table 1; National Centers for Environmental Information, 2023; Oklahoma Climatological Survey, 2023) in the Ogallala aquifer study area were summarized annually for the period 1915–2022. Precipitation data from climate stations in Cimarron, Texas, and Beaver Counties, Okla., were used to represent the panhandle part of the Ogallala aquifer (fig. 4A), and precipitation data from climate stations in Dewey, Ellis, Harper, and Woodward Counties, Okla., were used to represent the northwest part of the Ogallala aquifer (fig. 5A). Daily precipitation data from years with fewer than 10 months of recorded data and from months with fewer than 25 days of recorded data were omitted from the analysis. Stations with less than 54 years of precipitation and air temperature data also were excluded, resulting in 17 climate stations (fig. 1; table1). Historical annual air temperature data from 1915 to 2022 (Vose and others, 2023) for Cimarron, Texas, and Beaver Counties, Okla., were averaged and used to represent the panhandle part of the Ogalla aquifer (fig. 4B); historical annual air temperature data from 1915 to 2022 (Vose and others, 2023) for Ellis County, Okla., were used to represent the northwest part of the Ogallala aquifer (fig. 5B). A locally weighted scatterplot smoothing (LOWESS) curve (Cleveland, 1979) was applied to the annual data to determine periods of above-mean or below-mean precipitation and air temperature. Drought periods were selected based on methods from Shivers and Andrews (2013) and Tian and Quiring (2019) (figs. 4–5).
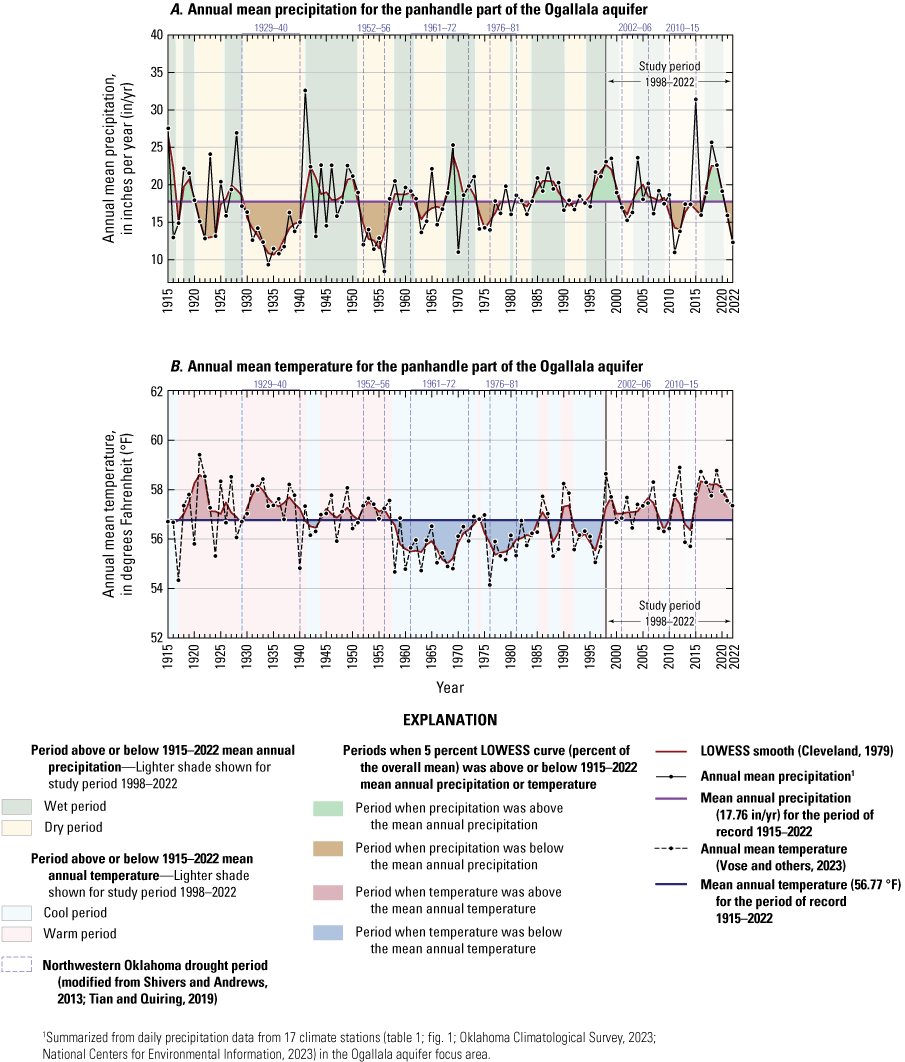
A, Annual mean precipitation (Oklahoma Climatological Survey, 2023) and B, annual mean air temperature (National Weather Service, 2023), panhandle part of the Ogallala aquifer, Oklahoma, 1915–2022.
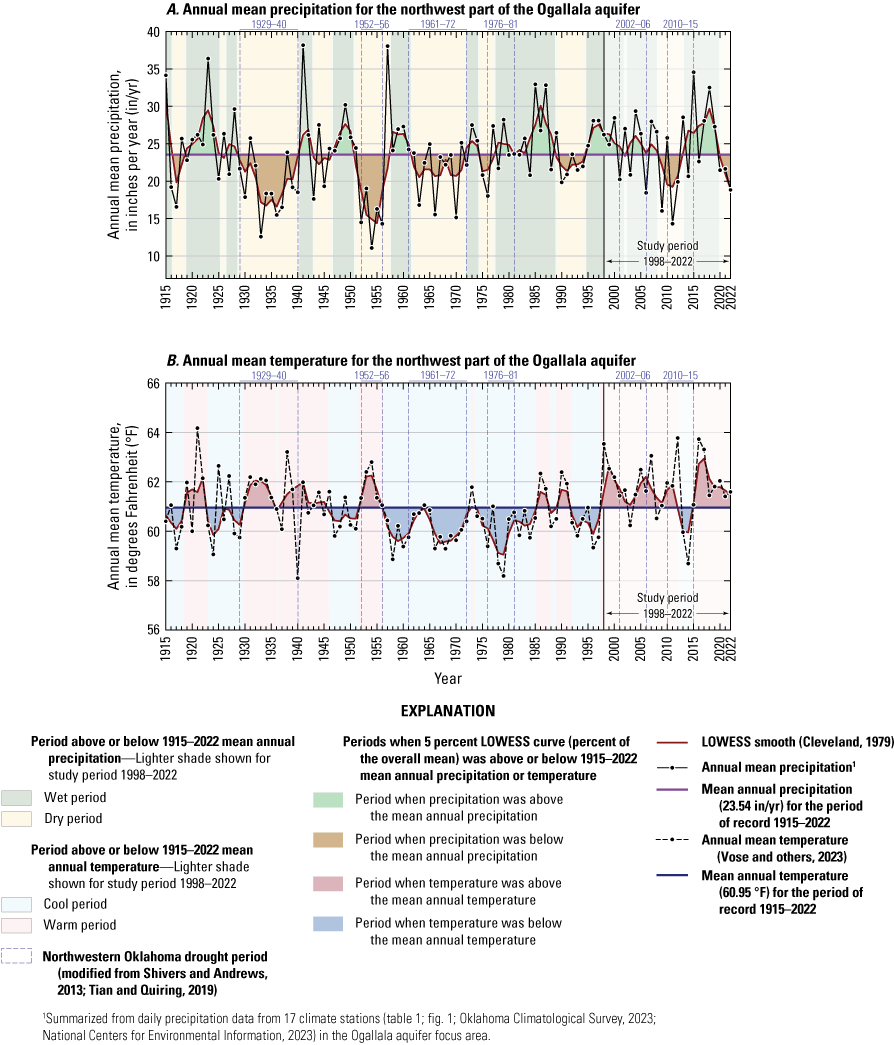
A, Annual mean precipitation (Oklahoma Climatological Survey, 2023) and B, annual mean air temperature (National Weather Service, 2023), northwest part of the Ogallala aquifer, Oklahoma, 1915–2022.
The mean annual precipitation and air temperature for the 1915–2022 period of record, were 21.11 inches (in.) and 58.86 degrees Fahrenheit (°F), respectively, in the Ogallala aquifer focus area (National Weather Service, 2023; Oklahoma Climatological Survey, 2023). The mean annual precipitation and air temperature for the 1915–2022 period of record were 17.76 in. and 56.77 °F, respectively, in the panhandle part of the Ogallala aquifer and 23.54 in. and 60.95 °F, respectively, in the northwest part of the Ogallala aquifer (figs. 4–5).
The mean annual precipitation and air temperature for the 1998–2022 study period were 22.09 in. and 59.61 °F, respectively, in the Ogallala aquifer focus area. The mean annual precipitation and air temperature for the 1998–2022 study period were 18.75 in. and 57.47 °F, respectively, in the panhandle part of the Ogallala aquifer and 24.34 in. and 61.78 °F, respectively, in the northwest part of the Ogallala aquifer. The panhandle and northwest parts of the Ogallala aquifer had warmer air temperatures over the 1998–2022 study period than over the 1915–2022 period of record.
Groundwater Use
The OWRB permits and regulates all nondomestic groundwater use and some domestic groundwater use (Oklahoma Statute § 82-1020.1[2] [Oklahoma State Legislature, 2021b]); domestic groundwater use of 5 acre-ft/yr or less is exempt from permitting (Oklahoma Statute § 82-1020.3 [Oklahoma State Legislature, 2021c]). OWRB (2025, p. 1) explains domestic use as follows:
Domestic use includes the use of water for household purposes, farm and domestic animals up to the normal grazing capacity of the land, and the irrigation of land not exceeding a total of three acres in area for the growing of gardens, orchards, and lawns. Domestic use also includes water used for agricultural purposes by natural individuals, use for fire protection, and use by non-household entities for drinking water, restrooms, and watering of lawns, provided such uses do not exceed five acre-feet per year.
Groundwater permits issued by the OWRB are divided into nine categories: irrigation; public supply; industrial; power; mining; commercial; recreation, fish, and wildlife; agriculture; and other (OWRB, 2024d). For the purposes of this report, the categories of industrial; power; mining; commercial; recreation, fish, and wildlife; and other were combined and are hereinafter referred to as “other.” Most of the groundwater permits in the Ogallala aquifer focus area were for irrigation in the panhandle part of the Ogallala aquifer (fig. 6); of the more than 4,100 irrigation permits in the Ogallala aquifer focus area, more than 3,800 are in the panhandle part of the Ogallala aquifer (OWRB, 2024d).
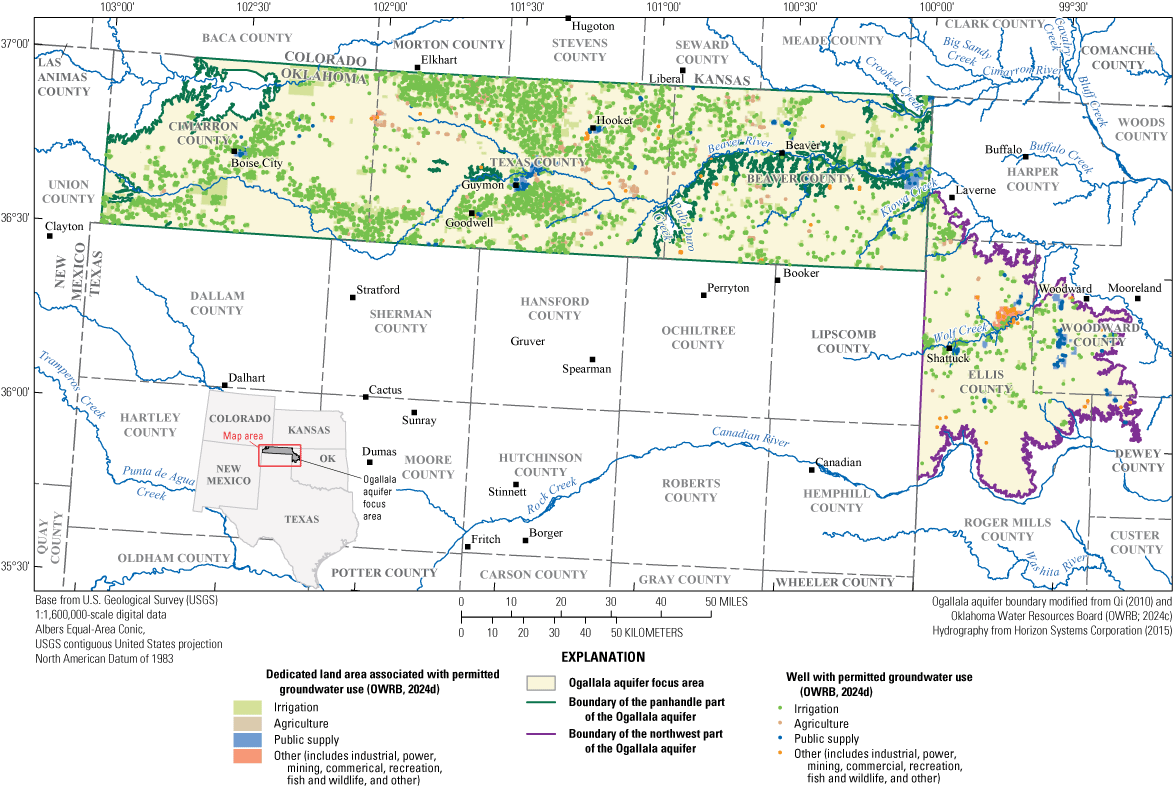
Dedicated land areas and wells with permitted groundwater use in the panhandle and northwest parts of the Ogallala aquifer in Oklahoma, which together compose the Ogallala aquifer focus area, 2024.
Permitted groundwater users have been required to submit annual groundwater-use reports to the OWRB since 1967 (Oklahoma Statute § 82-1020.12 [Oklahoma State Legislature, 2021d]). Reported annual groundwater-use data from the panhandle and northwest parts of the Ogallala aquifer were summarized for the period of record (1967–2022), the study period (1998–2022), and a recent drought period (2010–15; figs. 4–5 and 7–8; tables 2–3).
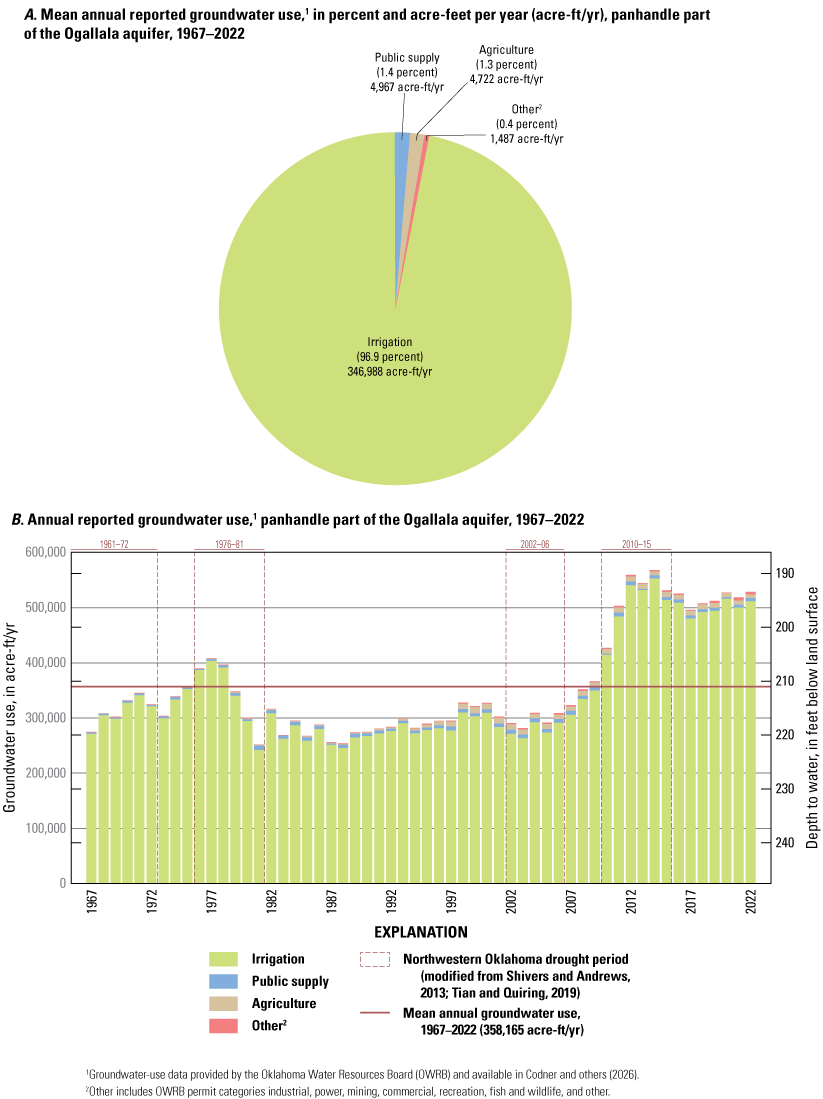
A, Mean annual reported groundwater use and B, annual reported groundwater use by category, panhandle part of the Ogallala aquifer, Oklahoma, 1967–2022.
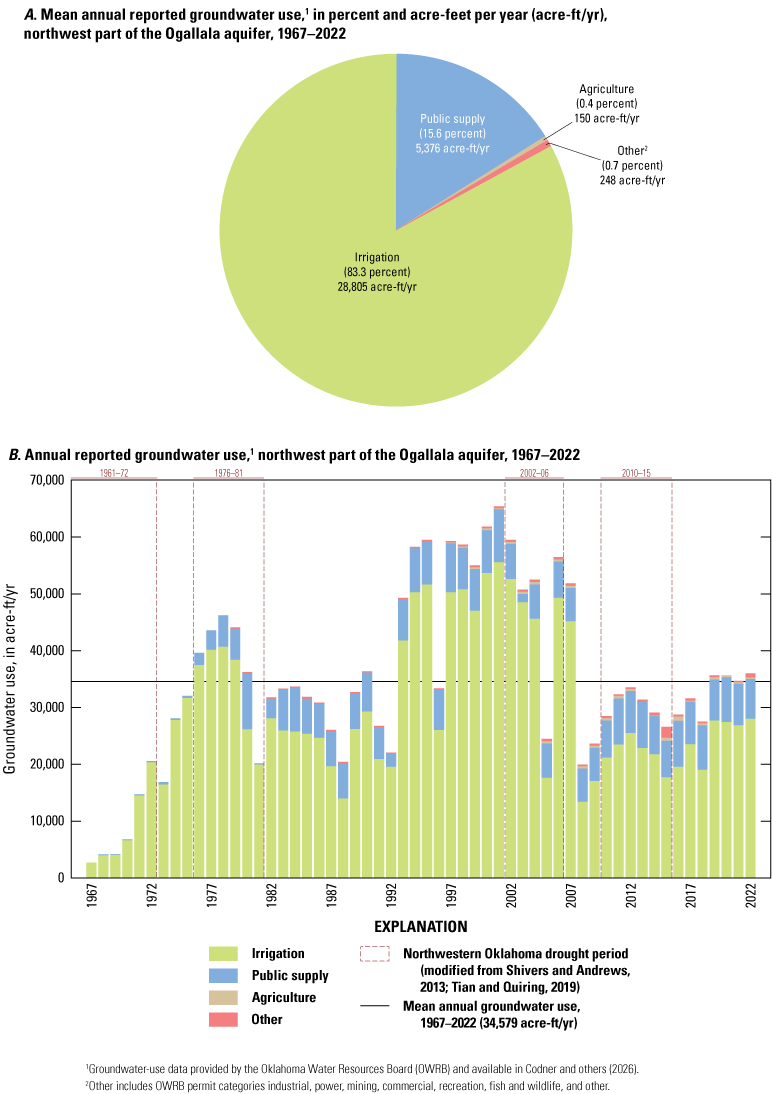
A, Mean annual reported groundwater use and B, annual reported groundwater use by category, northwest part of the Ogallala aquifer, Oklahoma, 1967–2022.
Table 2.
Summary statistics of reported annual groundwater use in the panhandle part of the Ogallala aquifer, Oklahoma, 1967–2022.[Groundwater-use data were provided by the Oklahoma Water Resources Board and are available in Codner and others (2026). Table excludes groundwater use of less than 5 acre-feet per year for domestic and agricultural purposes and groundwater use for irrigation of fewer than 3 acres of land for growing of gardens, orchards, or lawns (Oklahoma Statute § 82-1020.3; Oklahoma State Legislature, 2021c)]
Table 3.
Summary statistics of reported annual groundwater use in the northwest part of the Ogallala aquifer, Oklahoma, 1967–2022.[Groundwater-use data were provided by the Oklahoma Water Resources Board and are available in Codner and others (2026). Table excludes groundwater use of less than 5 acre-feet per year for domestic and agricultural purposes and groundwater use for irrigation of fewer than 3 acres of land for growing of gardens, orchards, or lawns (Oklahoma Statute § 82-1020.3; Oklahoma State Legislature, 2021c)]
Most of the reported groundwater use in the panhandle part of the Ogallala aquifer was for irrigation, which accounted for 346,988 acre-ft/yr or 96.9 percent of mean annual groundwater use during the 1967–2022 period of record (fig. 7A). During the same period, 4,967 acre-ft/yr or 1.4 percent of groundwater use was for public supply (fig. 7A), primarily for the towns of Beaver, Boise City, Goodwell, Guymon, and Hooker, Okla. (fig. 6). The remaining groundwater use was for agriculture (1.3 percent), and other (0.4 percent) uses (fig. 7A). Annual groundwater use during the 1967–2022 period of record in the panhandle part of the Ogallala aquifer ranged from a minimum of 251,781 acre-ft/yr in 1981 to a maximum of 568,066 acre-ft/yr in 2014 (table 2; fig. 7B). From 2010 to 2015, most of Oklahoma was in a period of drought (figs. 4A–5A), which coincided with an increase in annual groundwater use (National Integrated Drought Information System, 2024). Mean annual groundwater use in the panhandle part of the Ogallala aquifer for the 2010–15 drought period was 522,143 acre-ft/yr, or 163,978 acre-ft/yr greater than mean annual groundwater use in the panhandle part of the Ogallala aquifer during the 1967–2022 period of record (table 2). Precipitation events which occurred in the summer of 2015 ended the 2010–15 drought period, but groundwater use continued to be elevated compared to pre-2010 levels through 2022 (fig. 7B). During the 1998–2022 study period, mean annual groundwater use in the panhandle part of the Ogallala aquifer was 422,054 acre-ft/yr, which was 63,889 acre-ft/yr greater than mean annual groundwater use during the 1967–2022 period of record but less than the mean annual groundwater use during the 2010–2015 drought period (table 2; Codner and others, 2026).
Like in the panhandle part of the Ogallala aquifer, most of the reported groundwater use in the northwest part of the Ogallala aquifer was for irrigation, which accounted for 28,805 acre-ft/yr or 83.3 percent of mean annual groundwater use during the 1967–2022 period of record (fig. 8A). During the same period, 5,376 acre-ft/yr or 15.6 percent of groundwater use was for public supply (fig. 8A), primarily for the towns of Shattuck and Woodward, Okla. (fig. 6). The remaining groundwater use was classified as other (0.7 percent) and agriculture (0.4 percent). During the 1967–2022 period of record, annual groundwater use ranged from a minimum of 2,680 acre-ft/yr in 1967 to a maximum of 65,386 acre-ft/yr in 2001 in the northwest part of the Ogallala aquifer (table 3; fig. 8B); mean annual groundwater use was 34,579 acre-ft/yr. The pattern of increased groundwater use in the panhandle part of the Ogallala aquifer beginning in 2010 was repeated in the northwest part of the Ogallala aquifer where years with the highest groundwater use were all prior to 2010. The 2010–15 drought period was more severe in terms of the persistence of below average precipitation and above average temperature in the panhandle part than in the northwest part of the Ogallala aquifer, which could explain why groundwater use was not as elevated in this part of the aquifer when compared to the panhandle part of the Ogallala aquifer (figs. 4–5). Mean annual groundwater use in the northwest part of the Ogallala aquifer during the 2010–15 drought period was 30,231 acre-ft/yr, or 4,348 acre-ft/yr less than mean annual groundwater use for the 1967–2022 period of record (table 3). During the 1998–2022 study period, mean annual groundwater use in the northwest part of the Ogallala aquifer was 39,645 acre-ft/yr, or 5,066 acre-ft/yr greater than the mean annual groundwater use during the 1967–2022 period of record (table 3).
Groundwater use for irrigation was used to estimate irrigation return flows, further explained in the “Recharge” section of this report. Mean annual groundwater use for irrigation during the 1998–2022 study period in the panhandle part of the Ogallala aquifer was 405,541 acre-ft/yr (Codner and others, 2026). Mean annual groundwater use for irrigation during the 1998–2022 study period in the northwest part of the Ogallala aquifer was 32,075 acre-ft/yr (Codner and others, 2026).
Groundwater Levels in the Ogallala Aquifer Focus Area
The USGS installed two continuous groundwater-level recorders in wells in the Ogallala aquifer focus area: GW15 installed in 1956 and GW16 installed in 2012 (fig. 1; table 1; USGS, 2024a). The OWRB installed 18 continuous groundwater-level recorders in wells in the Ogallala aquifer focus area as part of their Groundwater Monitoring and Assessment Program starting in 2022 (fig. 1; table 1; OWRB, 2024c). Tomlinson and others (2024) provide a map showing groundwater-level changes in the panhandle during 1982–2022 which could be used as a reference for future tracking of groundwater levels in the aquifer. Groundwater-level data from the USGS continuous-recorder wells (GW15 and GW16) indicate seasonal patterns, with declines starting around June through September and increases in October through May (figs. 9, 10). Groundwater levels at GW15 have a decreasing pattern, and those at GW16 are relatively steady through time. These patterns are consistent with the groundwater-level change data presented in McGuire and Strauch (2024b).
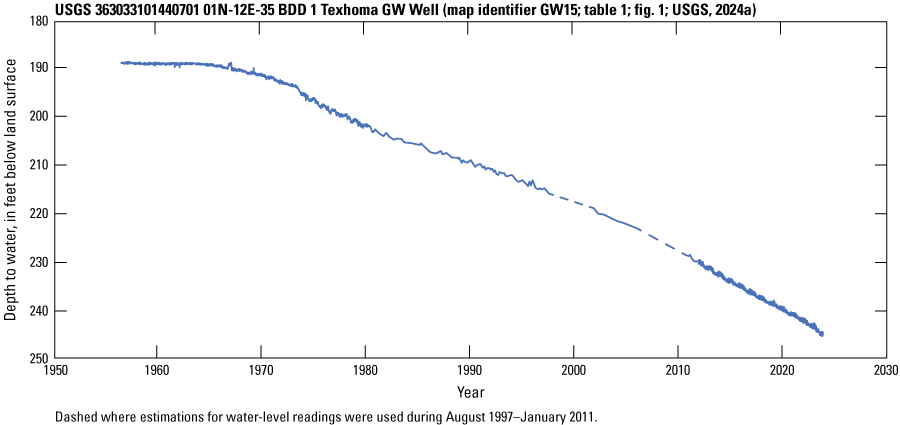
Groundwater-level data from U.S. Geological Survey (USGS) continuous groundwater-level recorder well USGS 363033101440701 01N-12E-35 BDD 1 Texhoma GW Well, Oklahoma.
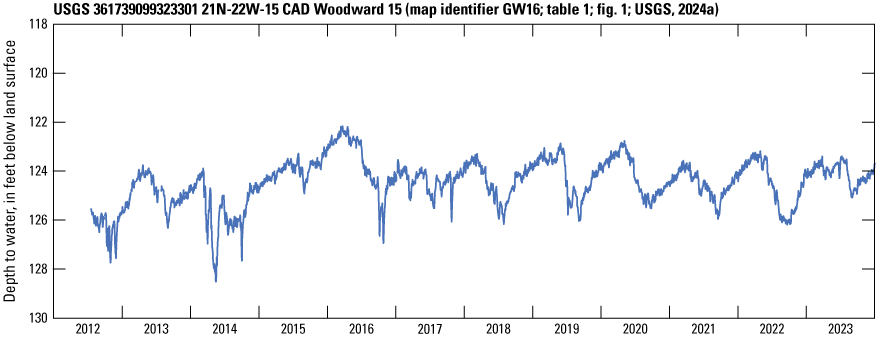
Groundwater-level data from U.S. Geological Survey (USGS) continuous groundwater-level recorder well USGS 361739099323301 21N-22W-15 CAD Woodward 15, Oklahoma.
Streamflow and Base-Flow Characteristics
Daily streamflows measured at USGS streamgages consist of two primary components: base flow and runoff. Base flow is the component of streamflow discharged by surrounding groundwater systems. Runoff is the component of streamflow supplied by overland flow and stormflow (interflow) of precipitation into a stream channel (Barlow and Leake, 2012).The Base-Flow Index code (Wahl and Wahl, 1995) in the USGS Groundwater Toolbox (Barlow and others, 2015) was used to separate daily streamflow data from the USGS National Water Information System (USGS, 2024a) into base-flow and runoff components. The Base-Flow Index code divided daily streamflow data into n-day-long windows (where n is the user-defined number of days) and identified the minimum streamflow within each window. Turning points were then identified by comparing the minimums of each window below a certain fraction (the user-defined f-statistic, in this case 0.9 or 90 percent) to immediately adjacent minimums. If 90 percent of a given minimum was less than the preceding and succeeding minimums, that minimum was considered a turning point. These turning points were then used to construct a base-flow hydrograph with semilogarithmic interpolation. By using the turning points, the base-flow index (BFI), or the ratio of base flow to total streamflow, was calculated. Multiple n-day windows were tested by plotting mean BFI against different n-day values (from 2 to 15 days), and a slope change was evident around 3 days in most daily streamflow data analyzed. For consistency, a 3-day window and an f-statistic of 0.9 were used for base-flow analysis in this study.
The Beaver River and Cimarron River are the two main drainage features in the panhandle part of the Ogallala aquifer (fig. 1; Luckey and Becker, 1999). USGS streamgage 07234000 Beaver River at Beaver, Okla. (map identifier S21, fig. 1), and USGS streamgage 07156900 Cimarron River near Forgan, Okla. (map identifier S22, fig. 1), were selected for base-flow analysis (table 4). Although S22 is outside of the Ogallala aquifer, it is 5 miles upstream of the aquifer and was therefore considered an important part of the historical streamflow analysis. S21 and S22 had a large gap in data during 2022, so a base-flow analysis could not be completed for that year. Therefore, the period 1998–2021 was used for the base-flow analysis.
Table 4.
Mean annual streamflow, base flow, and base-flow index values for selected U.S. Geological Survey streamgages during the streamgage periods of record and the study period (1998–2022) in the High Plains (Ogallala) aquifer study area, Oklahoma.[Data from U.S. Geological Survey (USGS), 2024a; POR, period of record; ft3/s, cubic foot per second; BFI, base-flow index; --, no data]
| Station name | USGS streamgage (table 1; USGS, 2024a) | Map identifier (fig. 1) | POR for base flow analysis | Mean annual streamflow (ft3/s) |
Mean annual base flow (ft3/s) | Mean annual BFI (percent) | |||
|---|---|---|---|---|---|---|---|---|---|
| Study period | POR | Study period | POR | Study period | POR | ||||
| Beaver River at Beaver, Okla. | 07234000 | S21 | 1938–2021 | 3.81 | 55.26 | 2.10 | 9.08 | 55.77 | 34.26 |
| Cimarron River near Forgan, Okla. | 07156900 | S22 | 1966–2021 | 26.95 | 44.52 | 24.20 | 35.39 | 90.70 | 84.80 |
| Wolf Creek near Fargo, Okla. | 07236000 | S23 | 1943–75 | -- | 65.96 | -- | 27.38 | -- | 53.53 |
| Wolf Creek near Gage, Okla.1 | 07235600 | S32 | 2010–22 | 10.71 | 10.71 | 7.64 | 7.64 | 82.69 | 82.69 |
For S21, the mean annual BFI for the period of record (1938–2021) was 34.26 percent, which was 21.51 percent less than the mean annual BFI for the study period (1998–2021) of 55.77 percent (table 4). For S22, the mean annual BFI for the period of record (1966–2021) was 84.80 percent, which was 5.90 percent less than the mean annual BFI for the study period (1998–2021) of 90.70 percent. S21 and S22 display a pattern of decreasing annual total streamflows and base flows throughout their respective periods of record (fig. 11). The annual BFI 5-year moving average displays an increasing pattern for most of the period of record for sites S21 and S22; however, the annual BFI shows less variation for S22 than for S21. The annual BFI 5-year moving average for S21 also shows a decreasing pattern starting in 2001 that is not present in the annual BFI 5-year moving average for S22. The decreasing pattern in annual streamflows and base flows and the increasing pattern in annual BFI for S21 and S22 coincide with the 1998–2022 climatic period during which the mean annual precipitation (18.75 in/yr) for the panhandle part of the Ogallala aquifer was greater than the historical (1915–2022) mean annual precipitation (17.76 in/yr) for the panhandle part of the Ogallala aquifer (fig. 4).
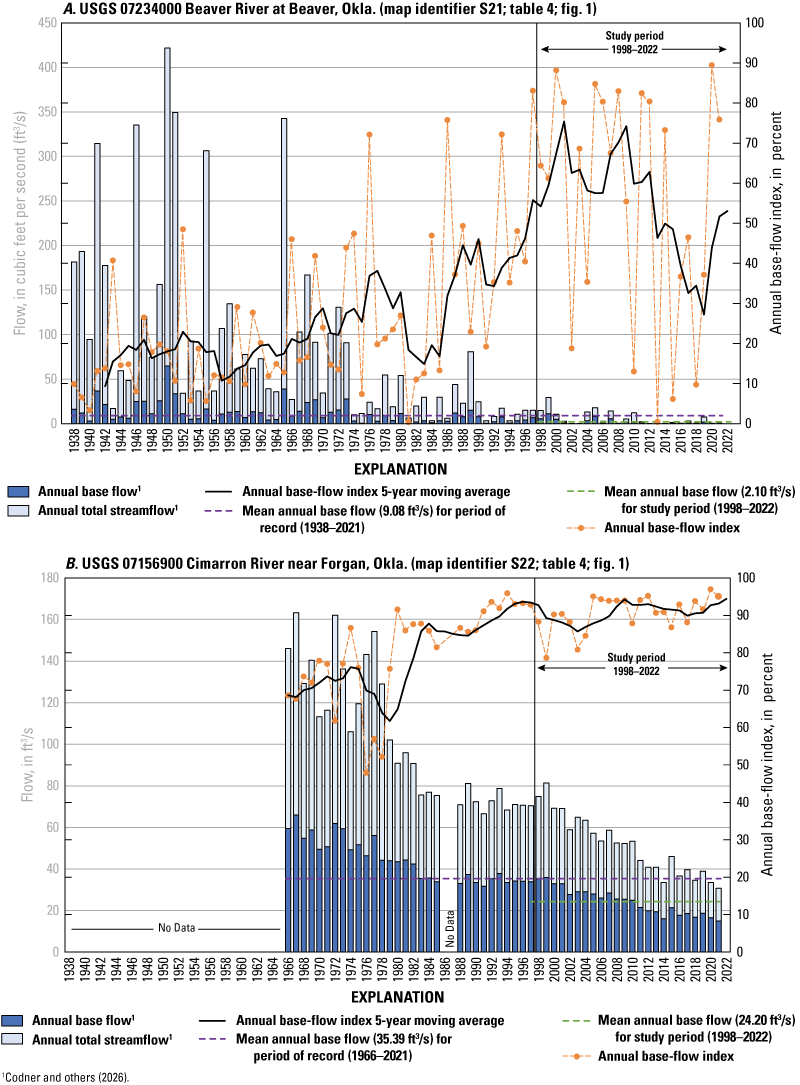
Annual streamflow, annual base flow, and annual base-flow index for A, U.S. Geological Survey (USGS) streamgage 07234000 Beaver River at Beaver, Oklahoma, and B, USGS streamgage 07156900 Cimarron River near Forgan, Oklahoma.
Wolf Creek is the main drainage feature in the northwest part of the Ogallala aquifer (fig. 1). USGS 07235600 Wolf Creek near Gage, Okla. (map identifier S32), and USGS 07236000 Wolf Creek near Fargo, Okla. (map identifier S23), have data that together cover most of the period between predevelopment and the study period (table 4; fig. 12). S23 covers the period 1943–75 and has a mean annual BFI of 53.53 percent (fig. 12A). Available data from S32 only partially cover the 1998–2022 study period (fig. 12B) but still were used to represent the study period (table 4). S32 had a mean annual BFI of 82.69 percent (fig. 12B). If data from S23 and S32 are viewed as one record representing Wolf Creek, the record shows an increasing pattern in annual BFI that is similar to those for annual BFI at S21 and S22.
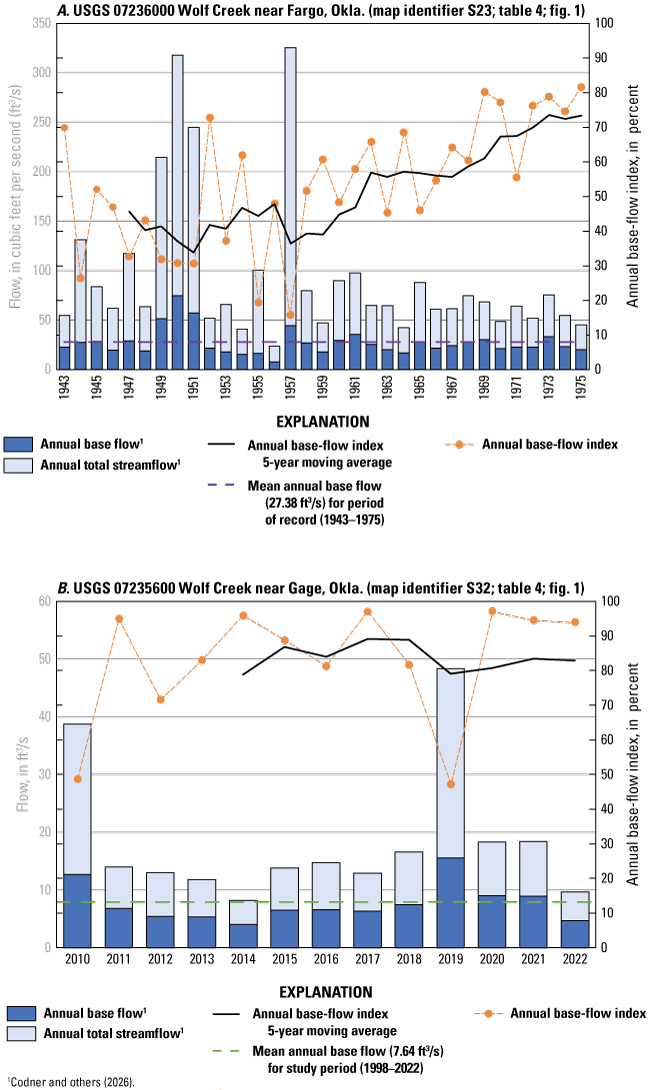
Annual streamflow, annual base flow, and annual base-flow index for A, U.S. Geological Survey (USGS) streamgage 07236000 Wolf Creek near Fargo, Oklahoma, and B, USGS streamgage 07235600 Wolf Creek near Gage, Oklahoma.
The increases in the annual BFI for Beaver River and Wolf Creek over the streamgage periods of record indicate that the proportion of annual total streamflow that comes from annual base flow is increasing relative to annual runoff. Annual base flows and runoff have both decreased, but annual runoff has decreased by a greater percentage than annual base flows (Wahl and Tortorelli, 1997; Esralew and Lewis, 2010).
Hydrogeology of the Ogallala Aquifer Focus Area
The Ogallala aquifer is contained in the Miocene to Pliocene Ogallala Formation, although overlying Quaternary alluvium, dune sand, and terrace deposits, for the purposes of this report, are also considered as part of the Ogallala aquifer where they directly overlie the Ogallala Formation. The Permian bedrock units are considered the base of the Ogallala aquifer throughout most of the focus area, although Triassic, Jurassic, and Cretaceous hydrogeologic units act as bases to the Ogallala aquifer in the western portion of the study area (figs. 13–14; Gutentag and others, 1984).
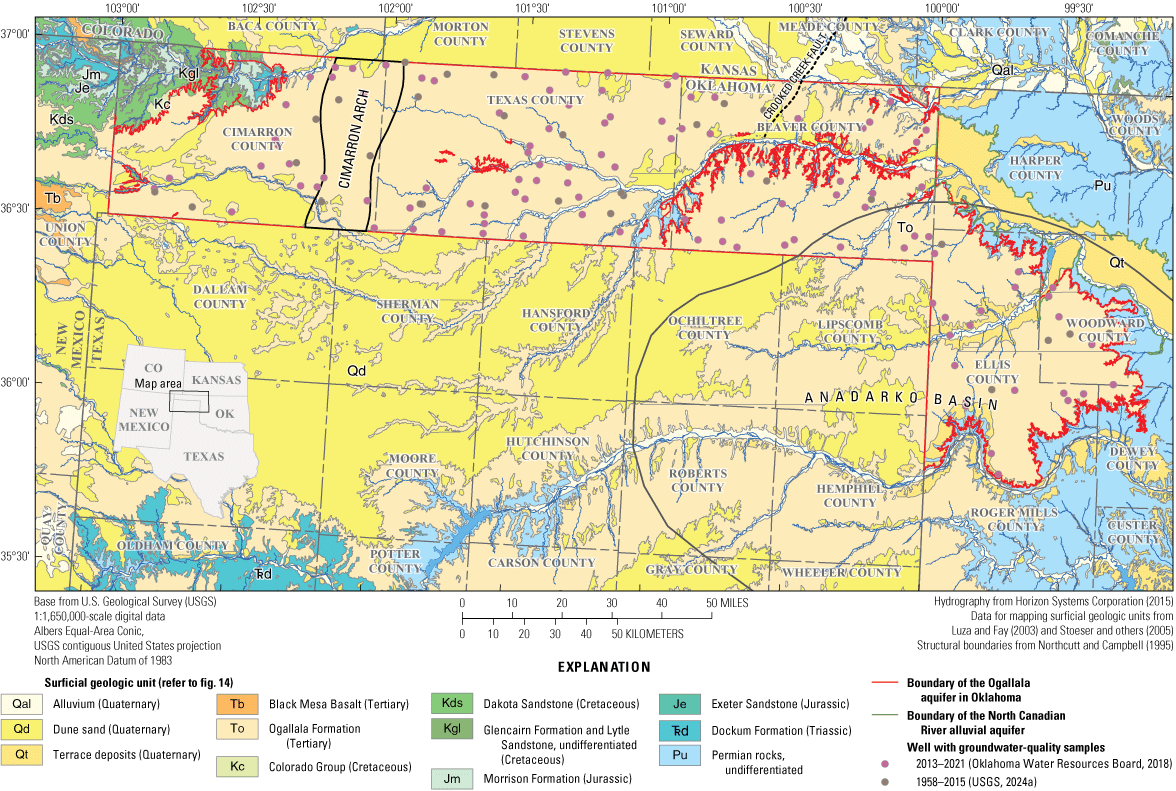
Surficial extent of geologic units in the High Plains (Ogallala) aquifer study area, southeastern Colorado, southwestern Kansas, northeastern New Mexico, northwestern Oklahoma, and northwestern Texas.
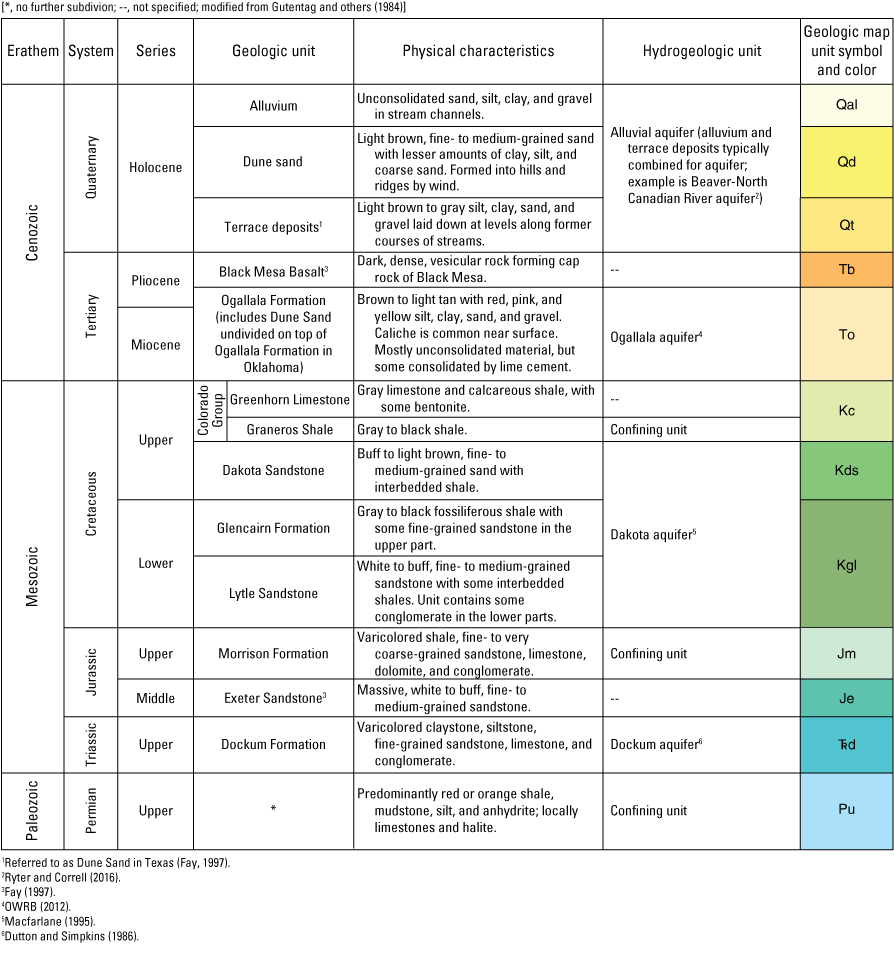
Surficial geologic and hydrogeologic units in the Ogallala aquifer study area, southeastern Colorado, southwestern Kansas, northeastern New Mexico, northwestern Oklahoma, and northwestern Texas.
Structural Features
In the eastern part of the study area in Kansas and Oklahoma, the Crooked Creek Fault displaced Permian through Tertiary sediments (fig. 13; Luckey and Becker, 1999). The Crooked Creek Fault creates an offset in the base of the Ogallala aquifer and causes abrupt changes in saturated thickness in northern Beaver County, Okla. The Cimarron Arch is a local feature mapped in Cimarron and Texas Counties, Okla. (Northcutt and Campbell, 1995). The northwest part of the Ogallala aquifer is predominantly in the Anadarko Basin, which is the primary basin of the Ogallala aquifer focus area where sediments were deposited (Luckey and Becker, 1999). Surficial geologic units in the Ogallala aquifer focus area dip to the southeast at an average rate of 1 degree or less (Hart and others, 1976). Additional structural features that affect the Ogallala aquifer focus area are described in Hart and others (1976) and Luckey and Becker (1999).
Cenozoic Geologic and Hydrogeologic Units
Quaternary alluvium, dune sand, and terrace deposits overlie the Ogallala Formation in some parts of the Ogallala aquifer focus area. Alluvium and terrace deposits overlie the Ogallala Formation along streams (figs. 13, 14) and consist of unconsolidated sand, gravel, clay, and silt (Hart and others, 1976). Dune sands are present on the northern side of the Beaver River and were deposited by prevailing southerly winds (fig. 13; Gutentag and others, 1984). The terrace deposits were formed when sediments from streambed erosion were carried downstream and eventually deposited onto terraces (Gutentag and others, 1984). Some of the high terrace deposits were derived from the erosion of the Ogallala Formation; however, most of the terrace deposits were formed later, during the Quaternary Period. Alluvium and terrace deposits east of Beaver County (but within the study area) contain the Beaver-North Canadian River alluvial aquifer in areas where these deposits do not directly overlie the Ogallala Formation (Ryter and Correll, 2016). Alluvium deposits and dune sands that overlie the Ogallala Formation are considered part of the Ogallala aquifer because they have similar appearance and hydraulic properties to the Ogallala Formation (Hart and others, 1976).
The Black Mesa Basalt in the northwest corner of Cimarron County, Okla., is an outcrop of Pliocene igneous rock that is composed of a dense, olivine basalt (figs. 13–14; Hart and others, 1976; chart D of Fay, 1997). Isolated areas of volcanic ash are present in the study area (Hart and others, 1976). The volcanic ash deposits are not distinguished from other geologic units in the Ogallala aquifer focus area (fig. 13), nor are they expected to have a substantial hydraulic contribution to the hydrogeology of the Ogallala aquifer focus area.
The surficial geology in the Ogallala aquifer focus area is dominated by the Miocene to Pliocene Ogallala Formation (fig. 13; Luza and Fay, 2003; Stoeser and others, 2005). The Ogallala Formation is a heterogeneous mixture of gravel, sand, silt, clay, and caliche, which can be difficult to differentiate from overlying unconsolidated materials (Hart and others, 1976). The Ogallala Formation consists of several hundred feet of coarse sand and fine gravel in certain areas and hundreds of feet of clay with lenses of very fine sand in others (Hart and others, 1976). Well yields from the Ogallala aquifer, except where it is very thin, are at least 500 gallons per minute and can be as much as 2,000 gallons per minute (Luckey and Becker, 1999).
Mesozoic Geologic and Hydrogeologic Units
In the western half of Cimarron County, Cretaceous bedrock units underlie the Ogallala Formation (Hart and others, 1976). In parts of Cimarron and Texas Counties, Triassic to Jurassic geologic units underlie the Ogallala Formation (Hart and others, 1976). Well yields from the hydrogeologic units contained in the Mesozoic geologic units that underlie the Ogallala aquifer are generally less than well yields from the Ogallala aquifer; well yields can be used to identify the base of the Ogallala aquifer (Hart and others, 1976).
The Cretaceous geologic units contain three different hydrogeologic units that are hydraulically connected to the Ogallala aquifer (fig. 14). The Upper Cretaceous Greenhorn Limestone of the Colorado Group contains an aquifer in areas outside the study area (fig. 14; Barkmann and others, 2021). The Greenhorn Limestone is a mix of gray limestone and calcareous shale with some bentonite (fig. 14; Hart and others, 1976). The Greenhorn Limestone is underlain by the Upper Cretaceous Graneros Shale of the Colorado Group, which is a confining unit and is a gray to black shale (fig. 14; Barkmann and others, 2021). The Dakota aquifer underlies the Graneros Shale and is contained in the Upper Cretaceous Dakota Sandstone and the Lower Cretaceous Glencairn Formation and Lytle Sandstone (Macfarlane, 1995). The Dakota Sandstone is mostly fine- to medium-grained sand, and is buff to light-brown (Hart and others, 1976). The Dakota Sandstone is present in the western part of Cimarron County but has been eroded away in the remainder of the Ogallala aquifer focus area (fig. 13; plate 1 of Hart and others, 1976). The Glencairn Formation and Lytle Sandstone directly underlie the Ogallala Formation in western Cimarron County where the Dakota Sandstone has been eroded away (plate 1 of Hart and others, 1976). The Glencairn Formation and Lytle Sandstone were previously grouped and called the Purgatoire Formation, but for this report they are mapped separately (Luza and Fay, 2003). The Glencairn Formation is a fossiliferous shale with interbedded sandstones (Luckey and Becker, 1999). The Lytle Sandstone is a fine- to medium-grained, white to buff sandstone (Luckey and Becker, 1999).
Two hydrogeologic units are contained in Jurassic geologic units in the study area. The Upper Jurassic Morrison Formation contains a confining unit identified outside of the study area, which is a varicolored shale, fine- to very coarse-grained sandstone, limestone, dolomite, and conglomerate, but variations in lithology are common (Luckey and Becker, 1999). The Morrison Formation is considered a lower confining unit for the Ogallala aquifer in Colorado and western Cimarron County, Okla. (Hart and others, 1976; Barkmann and others, 2021). The color is highly variable, with greenish gray being the dominant color (Hart and others, 1976). The Middle Jurassic Exeter Sandstone contains an aquifer located outside the study area (Robson and Banta, 1995). The Exeter Sandstone is disconformable with the overlying Morrison Formation (fig. 14; Hart and others, 1976) and is sometimes called the Entrada Sandstone (Fay, 1997). The Exeter Sandstone is a fine- to medium-grained sandstone, with some gravels found locally (Luckey and Becker, 1999).
The Dockum aquifer, which is recognized as a minor aquifer in Texas but not Oklahoma, is contained in the Upper Triassic Dockum Formation (Dutton and Simpkins, 1986), which underlies the Exeter Sandstone. The Dockum Formation is a sandstone that grades upward to a shaly sandstone (Luckey and Becker, 1999). The Dockum aquifer directly underlies the Ogallala aquifer in eastern Cimarron County and western Texas County, Okla., (Hart and others, 1976) but yields less groundwater than the Ogallala aquifer (Hart and others, 1976). The difference in geochemistry of the groundwater in the Ogallala and Dockum aquifers has been used to determine the base of the Ogallala aquifer (Dutton and Simpkins, 1986).
Paleozoic Geologic and Hydrogeologic Units
For most of the Ogallala aquifer focus area, undifferentiated Permian geologic units, which are commonly referred to as red beds, unconformably underlie the Ogallala Formation (fig. 14; Gutentag and others, 1984). The Permian geologic units consist of predominantly red or orange shale, silty mudstone, and anhydrite; limestone and halite are locally present (Luckey and Becker, 1999). These undifferentiated Permian geologic units generally function as a lower confining unit to the Ogallala aquifer (Luckey and Becker, 1999). The Permian units unconformably underlie Mesozoic units in the western part of the Ogallala aquifer.
Groundwater Quality
The types and concentrations of dissolved chemical constituents in groundwater vary based on the lithologic and hydrologic properties of the geologic material through which the water flows. Other factors that affect groundwater quality include recharge rates, residence times within the aquifer, variations in temperature and pressure, land use (particularly agriculture), and pumping which can induce upward migration of saline waters from deeper parts of the aquifer or underlying geologic units. The range of the age of the groundwater in the Ogallala aquifer focus area is from less than 1,000 years to 9,000 years (Andrews and others, 2000).
Groundwater-quality data of the Ogallala aquifer focus area presented in this report were measured by the USGS and the OWRB as part of their Groundwater Monitoring and Assessment Program (OWRB, 2018). The USGS sampled groundwater from 25 wells in the panhandle part of the Ogallala aquifer during the period of November 20, 1958, to April 20, 2021, and 5 groundwater wells in the northwest part of the Ogallala aquifer during the period of November 19, 1951, to May 11, 2015 (USGS, 2024a). The OWRB sampled groundwater from 93 wells in the panhandle part of the Ogallala aquifer in July–October 2016 and June 2021 and 24 wells in the northwest part of the Ogallala aquifer in August–September 2013 and July–August 2019 (OWRB, 2024e).
Descriptions of groundwater quality in this report focus on total dissolved solids (TDS) concentrations and specific conductance values as well as concentrations of major cations and anions. TDS and specific conductance values were similar between the panhandle and the northwest parts of the Ogallala aquifer. TDS concentrations in the panhandle part of the Ogallala aquifer ranged from 223.0 to 1,559.0 milligrams per liter (mg/L), with a mean of 454.5 mg/L (OWRB, 2024e). TDS concentrations in the northwest part of the Ogallala aquifer ranged from 265.0 to 724.0 mg/L, with a mean of 393.1 mg/L. The U.S. Environmental Protection Agency (2022) has established a secondary drinking water standard of 500 mg/L for TDS; however, the State of Oklahoma specifies a beneficial use designation for groundwater, with TDS concentrations less than 3,000 mg/L for all purposes, and a limited beneficial use designation for treated groundwater, with TDS concentrations between 3,000 and 5,000 mg/L (Legal Information Institute, 2022). Groundwater samples from 37 wells in the panhandle part of the Ogallala aquifer and from 1 well in the northwest part of the Ogallala aquifer exceeded the secondary drinking water standard for TDS (OWRB, 2024e; USGS, 2024a). However, no groundwater samples from the Ogallala aquifer focus area had TDS concentrations greater than 3,000 mg/L in Oklahoma. Specific conductance values for groundwater samples from the panhandle part of the Ogallala aquifer ranged from 334.5 to 2,078.0 microsiemens per centimeter at 25 degrees Celsius (µS/cm at 25 °C), with a mean of 648.9 µS/cm at 25 °C (OWRB, 2024e; USGS, 2024a). Specific conductance values for groundwater samples from the northwest part of the Ogallala aquifer ranged from 355.0 to 1,050.0 µS/cm at 25 °C, with a mean of 552.6 µS/cm at 25 °C.
Major cation and anion concentrations in groundwater samples were examined by using the Piper (1944) method (figs. 15, 16). For the use of the Piper (1944) method, samples were required to include calcium, magnesium, sodium, potassium, bicarbonate, carbonate, chloride, sulfate, and fluoride concentrations. Concentrations in milligrams per liter were converted to units of milliequivalents per liter, and samples were excluded from analysis if the difference in the cation-anion balance for the sample was greater than 10 percent. In total, 174 out of the 181 groundwater-quality samples met the aforementioned criteria; 141 samples were from the panhandle part of the Ogallala aquifer, and 33 samples were from the northwest part (OWRB, 2024e; USGS, 2024a). Most groundwater samples in both parts of the aquifer were bicarbonate type, with calcium having the highest relative cation concentration and then magnesium in most samples (figs. 15, 16). Groundwater samples collected from the northwest part of the Ogallala aquifer were less mixed than groundwater samples from the panhandle part and had a larger milliequivalent concentration of calcium bicarbonate. The calcium bicarbonate likely indicates high amounts of caliche, a calcium carbonate hardpan, that interacts with rainwater during recharge (Sanford, 2023).
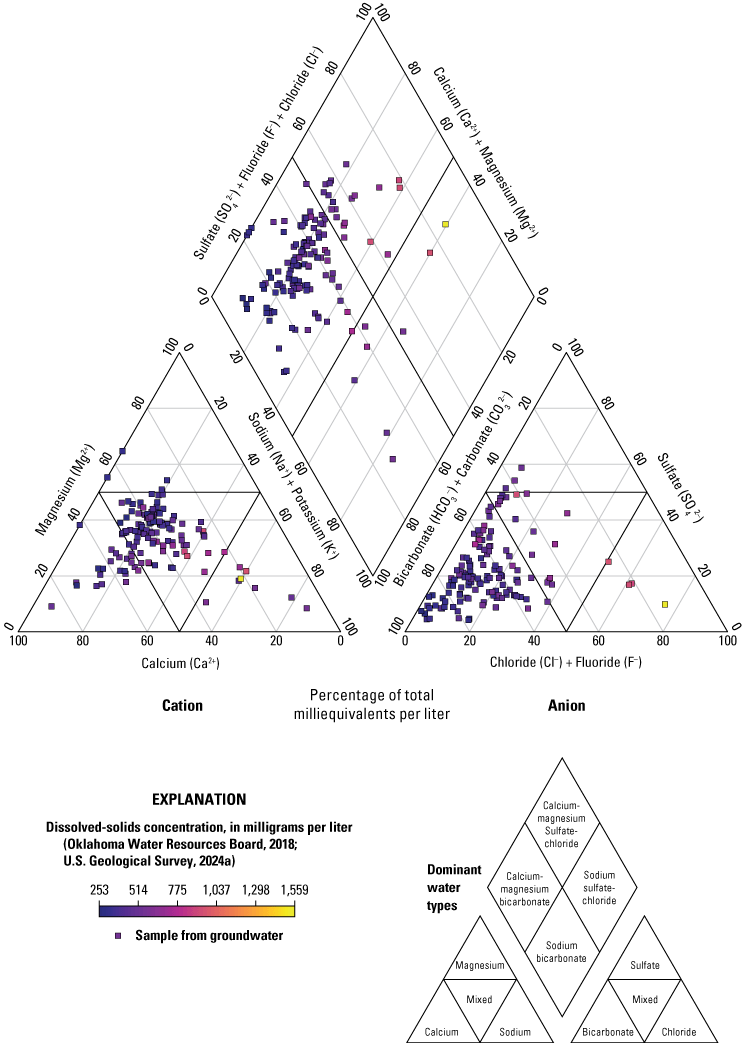
Major cation and anion concentrations in water produced from the panhandle part of the Ogallala aquifer, Oklahoma, 1958–2021.
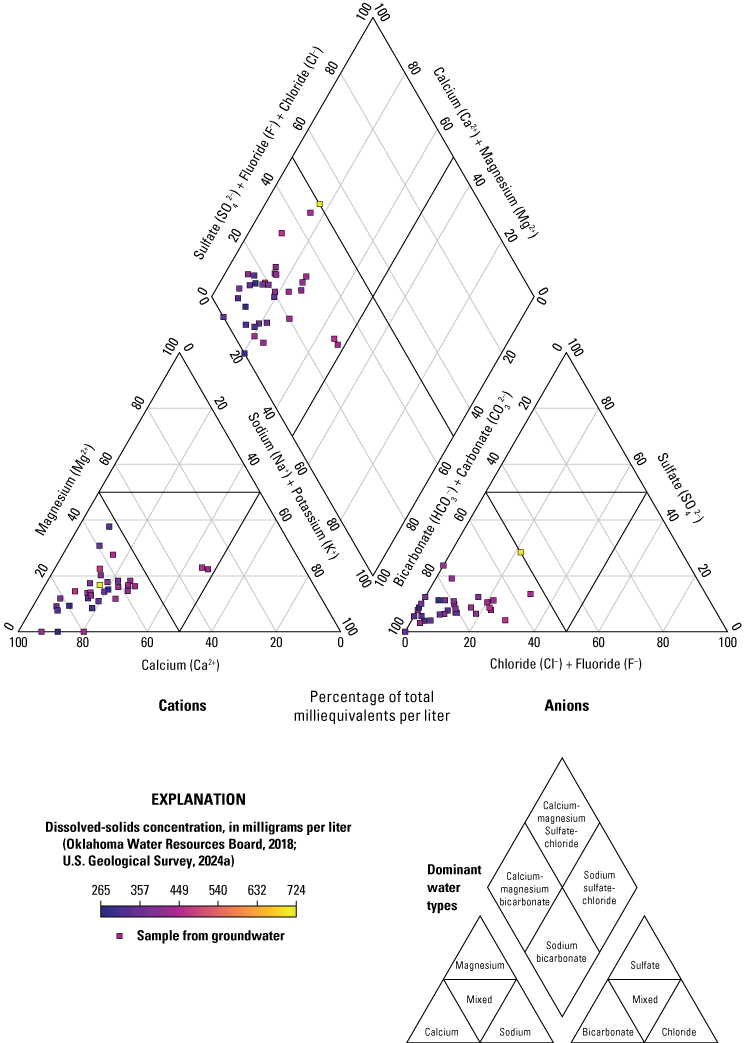
Major cation and anion concentrations in water produced from the northwest part of the Ogallala aquifer, Oklahoma, 1951–2019.
Hydrogeologic Framework of the Ogallala Aquifer Focus Area
A hydrogeologic framework is a three-dimensional representation of an aquifer that explains how it interfaces with surrounding geologic units at a scale that captures the regional controls on groundwater flow (Smith and others, 2021). An updated hydrogeologic framework was developed for the Ogallala aquifer focus area, including an updated definition of the potentiometric surface and a description of the textural and hydraulic properties of the aquifer materials. The hydrogeologic framework was used to inform the construction of the conceptual groundwater-flow model of the Ogallala aquifer focus area described in this report.
Ogallala Aquifer Focus Area Extent and Base
The geographic extent of the Ogallala aquifer focus area (fig. 1) was established by the OWRB (2024b). Because the Ogallala aquifer is an unconfined bedrock aquifer, the aquifer extent was generally defined by the surficial exposure of the Ogallala Formation as shown on 1:250,000-scale geologic maps from Stoeser and others (2005). The top of the Ogallala aquifer in the focus area was defined as the land-surface altitude obtained from a 10-meter (horizontal resolution) digital elevation model (DEM) (USGS, 2015). The altitude of the base of the Ogallala aquifer in the focus area (fig. 17) was generally considered to be the top of the underlying Permian or Cretaceous rocks. The altitude of the base of the aquifer was calculated by subtracting the depth to the top of these underlying bedrock units from the altitude of the top of the Ogallala aquifer.
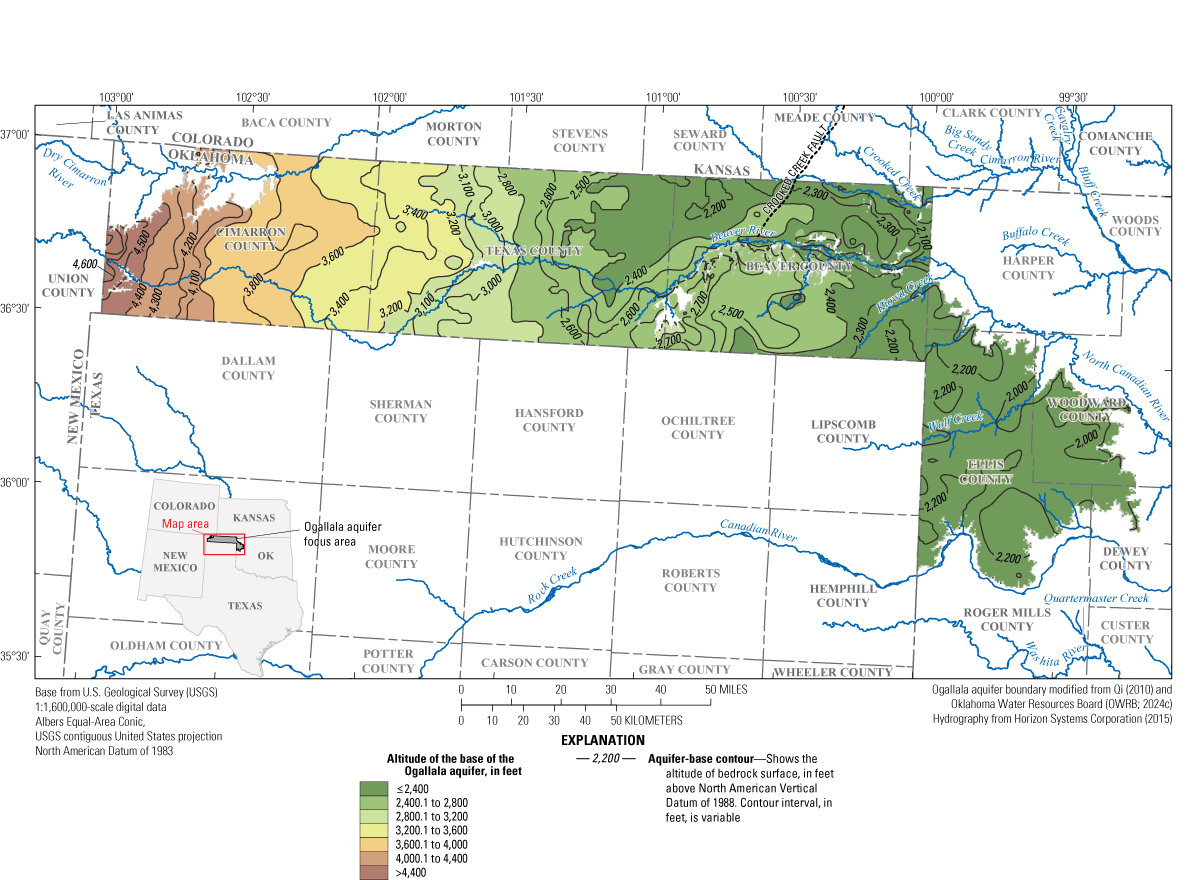
The altitude of the base of the Ogallala aquifer in the Ogallala aquifer focus area, Oklahoma.
Well completion reports containing drillers’ lithologic logs obtained from the OWRB (2024b) were used to modify the base of the Ogallala aquifer from Luckey and Becker (1999). Approximately 330 wells were considered fully penetrating; therefore, the depths of those wells were assumed to be depths to the base of the aquifer (top of the underlying Permian and Cretaceous units). The drillers’ lithologic logs were searched for terms representing the Permian and Cretaceous bedrock units (for example, redbed, blue clay, and yellow clay). The depth of the first occurrence of these terms was subtracted from the altitude of the top of the aquifer to calculate the altitude of the aquifer base. The altitudes of the aquifer base were then used to modify the aquifer-base contours from Luckey and Becker (1999), primarily in Texas, Beaver, and Ellis Counties, Okla., to incorporate data from the newer well logs.
Potentiometric Surface and Saturated Thickness
A potentiometric-surface map is a contour map of the altitudes of the water surface in tightly cased wells at a specified time (Fetter, 2001). The potentiometric surface is contoured from synoptic water-table altitude measurements in many groundwater wells across an aquifer extent. Potentiometric-surface maps can be used to show the general directions of groundwater flow in the aquifer. Groundwater flows perpendicularly to the contours towards decreasing contour altitudes.
In March 2021, the OWRB made synoptic water-table altitude measurements (Codner and others, 2026) at groundwater wells (fig. 18) throughout the Ogallala aquifer focus area. The depth to water below the land surface was measured at 311 wells (Codner and others, 2026) to determine the altitude of the water table referenced to the North American Vertical Datum of 1988. Five measurements were not used because there was evidence of pumping during or immediately before the levels were measured. For the purposes of the potentiometric-surface measurements, the OWRB combined the Dakota and Dockum aquifers and used them as a part of the Ogallala aquifer for this analysis (Codner and others, 2026). Because the Ogallala aquifer is an unconfined aquifer, the groundwater-level altitude measurements were calculated by subtracting the depth-to-water measurements from the land-surface altitude obtained from a 10-meter (m; horizontal resolution) DEM (USGS, 2015). The groundwater-level altitude measurements were gridded to make a potentiometric surface for the Ogallala aquifer focus area by using the inverse-distance-weighted interpolation method in the ArcGIS Topo to Raster tool (Esri, 2024d) and contoured by using the ArcGIS Contour tool (Esri, 2024a). The potentiometric-surface contours from Luckey and Becker (1999) were used as control points for areas with little to no groundwater-level altitude data. Additional control points were created along streamlines in the Ogallala aquifer focus area and were assigned groundwater-level altitudes from the 10-m DEM minus 15 ft to ensure that the potentiometric contours were below the land surface near streams. Based on the potentiometric surface, groundwater within the Ogallala aquifer focus area generally flows from west to east and begins flowing toward streams in eastern Texas County (fig. 18).
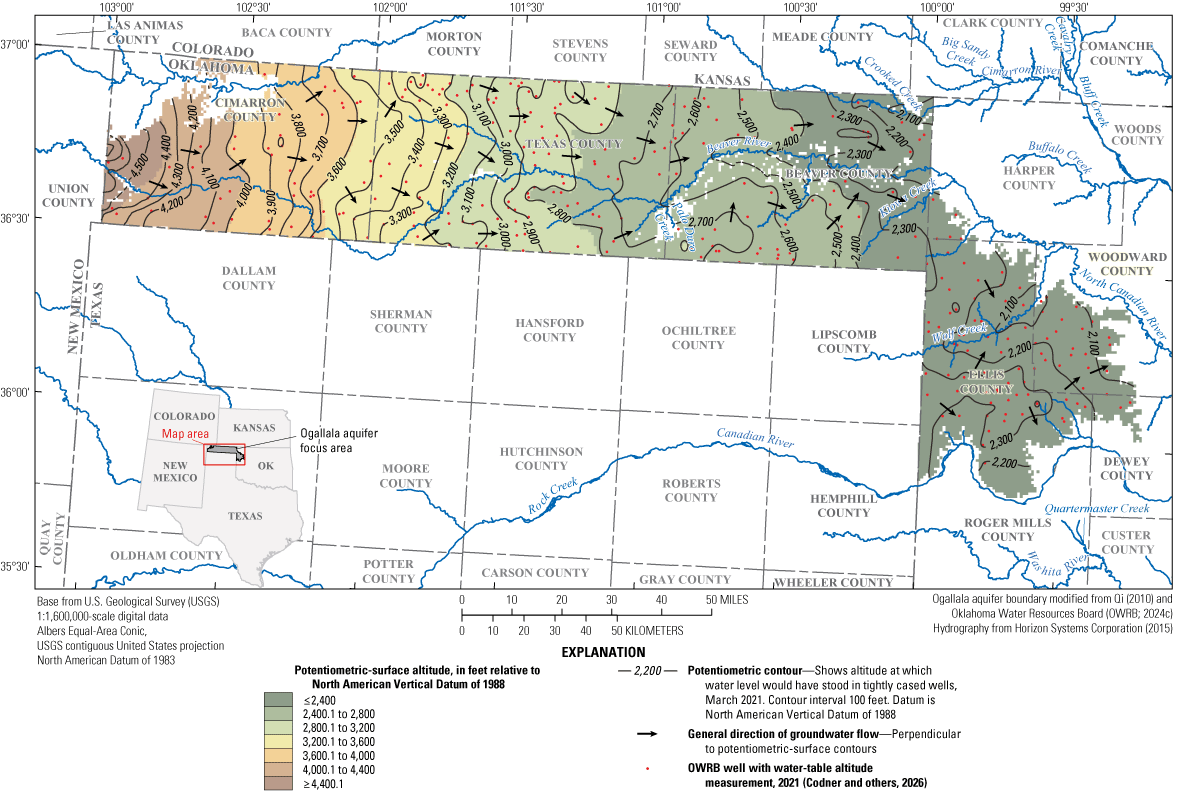
Potentiometric surface contours and general direction of groundwater flow within the Ogallala aquifer focus area, Oklahoma, March 2021.
The saturated thickness of the Ogallala aquifer within the Ogallala aquifer focus area (fig. 19) was determined by subtracting the gridded altitude of the aquifer base from the gridded potentiometric-surface altitude (figs. 17, 18). The saturated thickness ranged from less than 20 ft in some areas in western Cimarron County to 517 ft in the downthrown parts of Crooked Creek Fault in Beaver County (fig. 19). The mean saturated thickness of the Ogallala aquifer within the focus area was 125 ft in March 2021 (table 5).
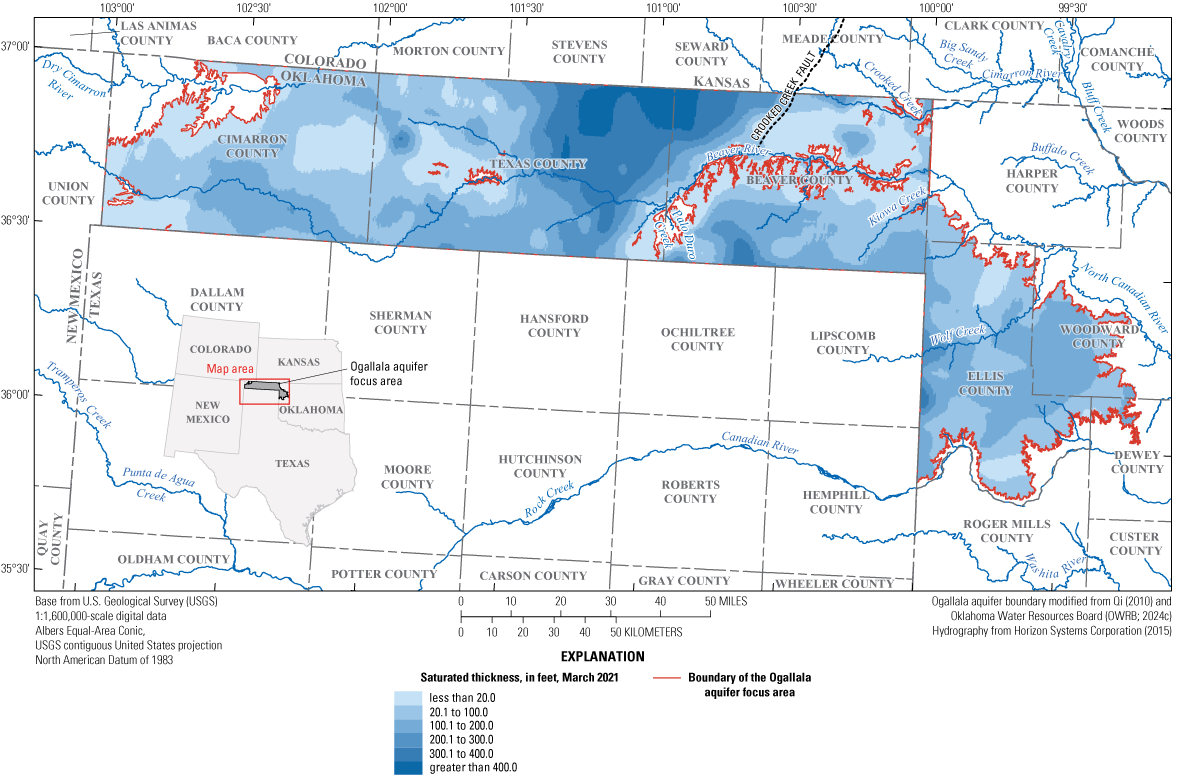
Estimated saturated thickness of the Ogallala aquifer in the Ogallala aquifer focus area, Oklahoma, March 2021.
Table 5.
Summary of saturated thickness and total groundwater storage for the panhandle and northwest parts of the Ogallala aquifer in Oklahoma, which together compose the Ogallala aquifer focus area, March 2021.| Region | Area (acres) | Mean saturated thickness (feet; fig. 19) | Mean estimated specific yield (table 6) | Total groundwater storage (acre-feet) |
|---|---|---|---|---|
| Panhandle part of the Ogallala aquifer | 3,334,636 | 127 | 0.09 | 38,114,889 |
| Northwest part of the Ogallala aquifer | 940,486 | 116 | 0.09 | 9,818,674 |
| Ogallala aquifer focus area | 4,275,122 | 125 | 0.09 | 147,933,563 |
Textural and Hydraulic Properties
The distribution and variability of textural and hydraulic properties of aquifer materials, especially the horizontal hydraulic conductivity, are the primary controls on groundwater flow in the Ogallala aquifer focus area. Hydraulic properties were previously studied throughout the Ogallala aquifer focus area, but this investigation focused on studies that were completed in Oklahoma and Texas. Hart and others (1976) performed 10 multiwell pumping tests in the panhandle part of the Ogallala aquifer to determine transmissivity, storage coefficient (which is roughly equivalent to specific yield in unconfined aquifers), and hydraulic conductivity values. The transmissivity values ranged from 500 to 11,800 feet squared per day (ft2/d), with a mean of 5,438 ft2/d; the storage coefficient values ranged from 0.002 to 0.11, with a mean of 0.05; and the hydraulic conductivity values ranged from 2.1 to 55 feet per day (ft/d), with a mean of 25.7 ft/d. Teeple and others (2021) estimated hydraulic conductivity and specific yield values in the Ogallala aquifer in Texas by using single-well aquifer tests, borehole electromagnetic flowmeter measurements, and borehole nuclear magnetic resonance (NMR) measurements. Those hydraulic conductivity values ranged from 0.55 to 350 ft/d, with a median of 5.7 ft/d, and specific yield values ranged from 0.03 to 0.13, with a median of 0.09.
Multiple methods were used in this study to estimate the range and central tendency of hydraulic conductivity values in the Ogallala aquifer focus area. These methods included borehole NMR measurements, slug tests, and analysis of lithologic descriptions from wells completed in the Ogallala aquifer. Even though these methods were consistently used across the Ogallala aquifer focus area, hydraulic properties between the panhandle and northwest parts of the Ogallala aquifer could not be differentiated because of limitations on the amount of testing that could be completed. Therefore, hydraulic properties are presented for the Ogallala aquifer focus area as a whole.
Hydraulic Properties Estimated From Nuclear Magnetic Resonance
NMR is a borehole geophysical technique that measures the aquifer water content directly in the subsurface by detecting how water molecules react to magnetic fields generated by the geophysical tool. The NMR method involves disturbing the magnetic moments of hydrogen atoms in water molecules and measuring the time it takes for those magnetic moments to recover to a previously established stable moment (Dunn and others, 2002). The amount of time it takes for the hydrogen atoms’ magnetic moment to relax from this stimulation is known as the transverse relaxation time T2, which conveys information about the pore space volume in the subsurface (Dlubac and others, 2013). A relatively longer T2 indicates a relatively larger pore space.
A wireline Javelin JPX-350 (Vista Clara Inc., 2024) was used to collect NMR data for this investigation (USGS, 2024b). The tool has a diameter of 3.5 inches and a length of approximately 15 ft. The diameter of sensitivity ranges from 10 to 15 inches through the center of the tool (Teeple and others, 2021). Groundwater-well construction was considered to ensure that hydraulic properties of the aquifer were measured rather than the well pack or screen properties. Therefore, only wells with an internal diameter of 4–9 inches were chosen for investigation to reduce the influence of the well pack or screen and thus maximize the influence of the aquifer materials on NMR measurements. To avoid magnetic interference, NMR measurements were restricted to wells that were free of metal in the well, casing, or well pack. The NMR data were processed by using Javelin Pro Plus software version 3.7 (Vista Clara Inc., 2024). Frequency measurements, produced after processing the NMR measurements, with greater than 15 percent residual noise were removed. The T2 decay data, which were determined from frequency measurements with less than 15 percent residual noise, were filtered by using an impulse noise filter and adjusted by removing the ambient noise; ambient noise data were collected with an external reference coil at the land surface. Depth-averaging across three measurements was applied to smooth the data and dampen the effects of any unfiltered noise. The four frequency measurements for each log were “noise-stacked,” meaning that they were combined in proportion to their relative noise (Teeple and others, 2021).
Total porosity is divided into mobile, capillary, and bound water percentages, and these porosity components were determined from T2 relaxation times (Morriss and others, 1997). Software defaults for capillary and bound water are 33 and 4 milliseconds, respectively, and are generally accepted as cutoff values (Timur, 1969; Walsh and others, 2013; Behroozmand and others, 2015; Teeple and others, 2021). The average mobile-water fraction of the total porosity for the saturated part of the aquifer, regardless of well opening or screened interval, was used to represent the specific yield of the aquifer at the well location (Teeple and others, 2021). Bound water for this study will be described separately as clay- and capillary-bound water. Hydraulic conductivity estimates were calculated with the Schlumberger-Doll equation (Kenyon and others, 1988).
Six groundwater wells (table 6) were used to conduct NMR tests in November 2023. For each well, naturally occurring gamma rays, conductivity, and resistivity were measured in addition to the NMR measurements. These data were used to estimate hydraulic conductivity and specific yield in the aquifer saturated zone intersected by the wells. The saturated zone is the portion of the aquifer in which mobile water content, capillary bound fluid content, and clay bound fluid content exceed 0 percent (USGS, 2024b). Mean estimated productive zone horizontal hydraulic conductivities from each well ranged from 5.9 to 144.8 ft/d (table 6). The estimated specific yield values from NMR measurements ranged from about 0.053 to 0.134 with a mean of about 0.09 (table 6).
Table 6.
Hydraulic properties for the saturated zone of the Ogallala aquifer derived from nuclear magnetic resonance (NMR) measurements from selected wells in the Ogallala aquifer focus area, Oklahoma, November 2023.[NMR data are available in the U.S. Geological Survey (USGS) GeoLog Locator database (USGS, 2024b); OWRB, Oklahoma Water Resources Board; ft/d, foot per day; --, not applicable]
| Map identifier (fig. 1; table 1) | USGS station number (USGS, 2024a, b) | OWRB station number | NMR-estimated depth to water (feet below land surface) | Estimated specific yield | Interpreted saturated zone (feet) | Range of NMR-estimated horizontal hydraulic conductivity (ft/d) | Mean NMR-estimated horizontal hydraulic conductivity (ft/d) |
|---|---|---|---|---|---|---|---|
| GW01 | 363536100024701 | 349 | 121.3 | 0.134 | 150.0–240.4 | 0.34–110.13 | 20.5 |
| GW02 | 363045101094201 | 927 | 148.6 | 0.063 | 190.0–205.0 | 0.18–55.12 | 17.7 |
| GW03 | 362750099392701 | 3270 | 69.6 | 0.105 | 152.0–243.3 | 0.02–36.94 | 11.8 |
| GW04 | 364228100341701 | 9051 | 83.1 | 0.071 | 100.0–120.0 | 2.4–15.25 | 7.5 |
| GW07 | 360819099406001 | 42791 | 124.9 | 0.053 | 170.0–182.6 | 2.07–9.12 | 5.9 |
| GW11 | 365933101221001 | 1886 | 111.3 | 0.127 | 111.3–130.3 | 0.03–275.93 | 144.8 |
| Mean | 109.8 | 0.092 | -- | -- | 34.7 |
Geophysical data collection followed the borehole geophysical standard procedures set by ASTM International (2017, 2018, 2019). Tabular data were archived as Log American Standard Code for Information Interchange Standard (LAS) files (Canadian Well Logging Society, 2024) and presented as chart logs in Portable Document Format (PDF) files. The LAS, PDF, original binary, and image files of the NMR data are available in the USGS GeoLog Locator database (USGS, 2024b).
Hydraulic Properties Estimated From Slug Tests
Slug tests were performed at nine groundwater wells (table 7) across the Ogallala aquifer focus area. Multiple slug tests were performed at each well to ensure repeatability and well integrity. The decision to use either mechanical or poured slugs depended on the depth to water in each well; a mechanical slug is a sand-filled polyvinyl chloride pipe that is lowered into and pulled out of the water column, whereas a poured slug is water poured down the well quickly to induce a nearly instantaneous change in the altitude of the water column in the well. A submersible pressure transducer was used to monitor groundwater-level changes every quarter-second for the duration of the slug tests. The slug test responses were analyzed by using the AQTESOLV 4.50 software package (HydroSOLVE, Inc., 2011) and were matched to an analytical solution dependent on the well construction and the observed response of each test using the methods explained in Butler (1998). The analytical solutions used for the slug tests included the Kansas Geological Survey solution (Hyder and others, 1994) for unconfined aquifers and the Bouwer and Rice (1976) solution for unconfined aquifers. More details on the analyses of the slug tests are included in the accompanying data release (Codner and others, 2026).
Table 7.
Hydraulic properties for the Ogallala aquifer derived from slug-test measurements from selected wells in the Ogallala aquifer focus area, Oklahoma, 2023.[Data available in Codner and others (2026); USGS, U.S. Geological Survey; OWRB, Oklahoma Water Resources Board]
| Map identifier (fig. 1; table 1) | USGS station number (USGS, 2024a) | OWRB station number | Depth to water (feet below land surface) | Horizontal hydraulic conductivity (feet per day) | Transmissivity values (feet squared per day) |
|---|---|---|---|---|---|
| GW01 | 363536100024701 | 349 | 116.0 | 12.5 | 1,312.2 |
| GW02 | 363045101094201 | 927 | 155.5 | 2.8–3.8 | 507.6–614.2 |
| GW03 | 362750099392701 | 3270 | 58.9 | 6.7–8.6 | 805.9–1,025.4 |
| GW04 | 364228100341701 | 9051 | 91.9 | 2.1–2.4 | 564.7–629.2 |
| GW05 | 363223102234101 | 24401 | 76.6 | 8.9–11.4 | 684.8–1,656.8 |
| GW06 | 363511101164201 | 33768 | 130.1 | 0.9–1.0 | 177.0–203.6 |
| GW07 | 360819099406001 | 42791 | 151.0 | 13.0–13.2 | 1,682.1–1,705.5 |
| GW08 | 365335102092301 | 129152 | 216.4 | 3.9–4.6 | 411.2–481.6 |
| GW17 | Not applicable | 137270 | 230.8 | 7.1–7.4 | 1,341.2–1,401.8 |
The horizontal hydraulic conductivity values determined from the analytical solutions ranged from 0.9 to 13.2 ft/d (table 7). Transmissivity values, which are the products of hydraulic conductivity and saturated thickness, ranged from 177.0 to 1,705.5 ft2/d (table 7).
Horizonal Hydraulic Conductivity Estimated From Lithologic Logs
The horizontal hydraulic conductivity distribution for the Ogallala aquifer focus area was estimated by using more than 8,000 lithologic logs associated with well-completion reports (OWRB, 2024b). The lithologies provided in the lithologic logs were standardized, categorized, and converted to percentage-coarse-material values by using the methods of Mashburn and others (2014).
The lithologic logs included terms such as “gravel,” “sand,” “silt,” and “clay” to describe drill cuttings from the geologic units of the Ogallala aquifer focus area; however, the terms varied among the drillers. The lithologic logs were simplified and standardized into five lithologic categories (clay/silt, fine sand, medium sand, coarse sand, and gravel) with corresponding percentage-coarse-material quantile ranges (0–19, 20–39, 40–59, 60–79, and 80–100 percent). The midpoint for each percentage-coarse-material quantile range (10, 30, 50, 70, and 90 percent) was assigned to each lithologic log depth interval. The percentage-coarse-material value for each lithologic depth interval was computed as the thickness-weighted mean percentage-coarse-material value assigned to the lithologic categories in each log. The gravel material was the maximum material size and was assigned a percentage-coarse-material value of 90 percent. The clay material was the minimum material size and was assigned a percentage-coarse-material value of 10 percent.
The horizontal hydraulic conductivity values estimated from lithologic logs ranged from 2.09 to 55 ft/d, using the previously published maximum and minimum estimated horizontal hydraulic conductivity values from the multiwell aquifer test (Hart and others, 1976). By using this range and methods from Ellis and others (2017), the following equation was developed by correlating the minimum and maximum horizontal hydraulic conductivity values to 10- and 90-percent coarse material, respectively, and performing a linear regression to characterize the relation between horizontal hydraulic conductivity and the percentage-coarse material for the Ogallala aquifer focus area:
whereKh
is the horizontal hydraulic conductivity, in feet per day; and
Ps
is the percentage-coarse-material value.
Equation 1 was used in this study to estimate horizontal hydraulic conductivity values from lithologic logs in the Ogallala aquifer focus area. The lithologic-log-estimated hydraulic conductivity values ranged from 2.09 to 55.00 ft/d, with a mean of about 16.11 ft/d (fig. 20). The mean lithologic-log-estimated hydraulic conductivity of 16.11 ft/d is within the range of values determined from NMR measurements.
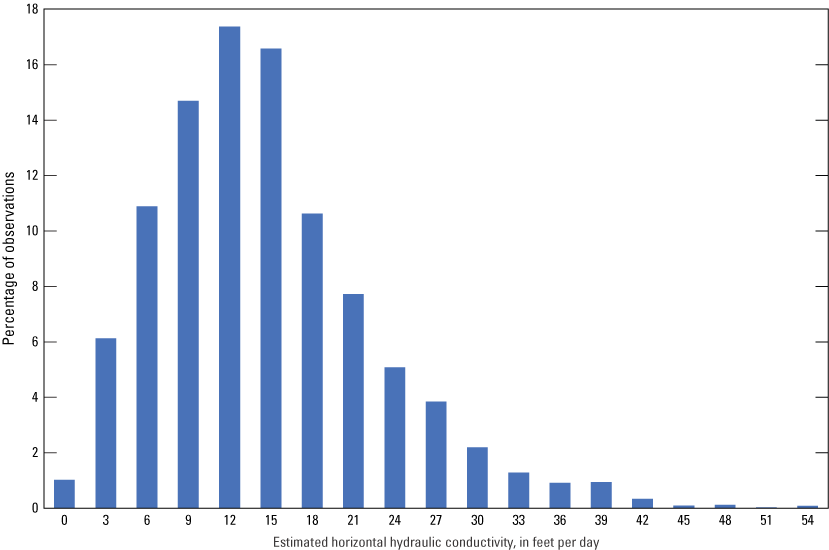
Distribution of estimated horizontal hydraulic conductivity values calculated from lithologic logs in the Ogallala aquifer focus area, Oklahoma.
Groundwater Storage
Groundwater storage, in acre-feet (table 5), was calculated for the Ogallala aquifer focus area for the year 2021 by using the following formula, which was modified from Fetter (2001) for an unconfined aquifer:
whereSy is the specific yield, dimensionless;
ba is the mean saturated thickness of the aquifer, in feet; and
A is the aquifer area, in acres.
A specific yield value of 0.09 was assigned to the Ogallala aquifer focus area based on the NMR measurements described in the “Hydraulic Properties Estimated from Nuclear Magnetic Resonance” section. This value is comparable to the specific yield of 0.10 determined from the aquifer tests of Hart and others (1976). Total groundwater storage for the panhandle and northwest parts of the Ogallala aquifer were calculated by multiplying the mean estimated specific yield of 0.09 by the aquifer area and the mean saturated thickness (fig. 19; table 5)
Conceptual Groundwater-Flow Model
A conceptual groundwater-flow model (hereinafter referred to as the “conceptual model”) is a simplified representation of the groundwater-flow system which accounts for the major inflow and outflow sources across hydrologic boundaries for a specified period. The conceptual model for the Ogallala aquifer focus area (table 8; fig. 21) was based on the hydrogeologic framework and climatic conditions to approximate the conceptual-model water budget for the 1998–2022 study period.
Table 8.
Conceptual groundwater-flow model water budget of estimated mean annual inflows and outflows for the hydrologic boundaries for the panhandle and northwest parts of the Ogallala aquifer in Oklahoma, which together compose the Ogallala aquifer focus area, 1998–2022.[acre-ft/yr, acre-foot per year; in/yr, inch per year; --, not quantified; ft, foot; ft3/s, cubic foot per second; USGS, U.S. Geological Survey; OWRB, Oklahoma Water Resources Board; NWI, National Wetlands Inventory]
| Hydrologic boundary | Panhandle part of the Ogallala aquifer1 (acre-ft/yr) | Northwest part of the Ogallala aquifer2 (acre-ft/yr) | Total (Ogallala aquifer focus area)3 (acre-ft/yr) | Percentage of water budget | Notes |
|---|---|---|---|---|---|
| Recharge | 175,068 | 49,376 | 224,444 | 44.97 | Estimated 0.63 in/yr using Whittemore and others (2015) method (fig. 22). |
| Irrigation return flow | 8,111 | 642 | 8,753 | 1.75 | Estimated from Luckey and Becker (1999) assumption that irrigation return flows were 2 percent of well withdrawals of 405,541 acre-ft/yr for panhandle and 32,075 acre-ft/yr for northwest part of the Ogallala aquifer (Codner and others, 2026). |
| Net change in groundwater storage | 260,102 | 5,844 | 265,946 | 53.28 | 14.5-ft decrease in groundwater level across the whole aquifer. |
| Total inflow | 443,281 | 55,862 | 499,143 | 100.00 | |
| Saturated-zone evapotranspiration | -- | -- | -- | -- | Assumed to be a negligible part of water budget. |
| Net lateral groundwater flow | 21,227 | 10,682 | 31,908 | 6.39 | Unknown; calculated as balance of water budget. |
| Net streambed seepage | -- | 5,535 | 5,535 | 1.11 | Estimated from mean annual base flow (2010–22) of 7.64 ft3/s at USGS 07235600 Wolf Creek near Gage, Okla. (table 4; fig. 12B). |
| Vertical leakage | -- | -- | -- | -- | Assumed to be a negligible part of water budget. |
| Well withdrawals | 422,054 | 39,645 | 461,700 | 92.50 | From OWRB-reported water-use data (tables 2, 3). |
| Total outflow | 443,281 | 55,862 | 499,143 | 100.00 |
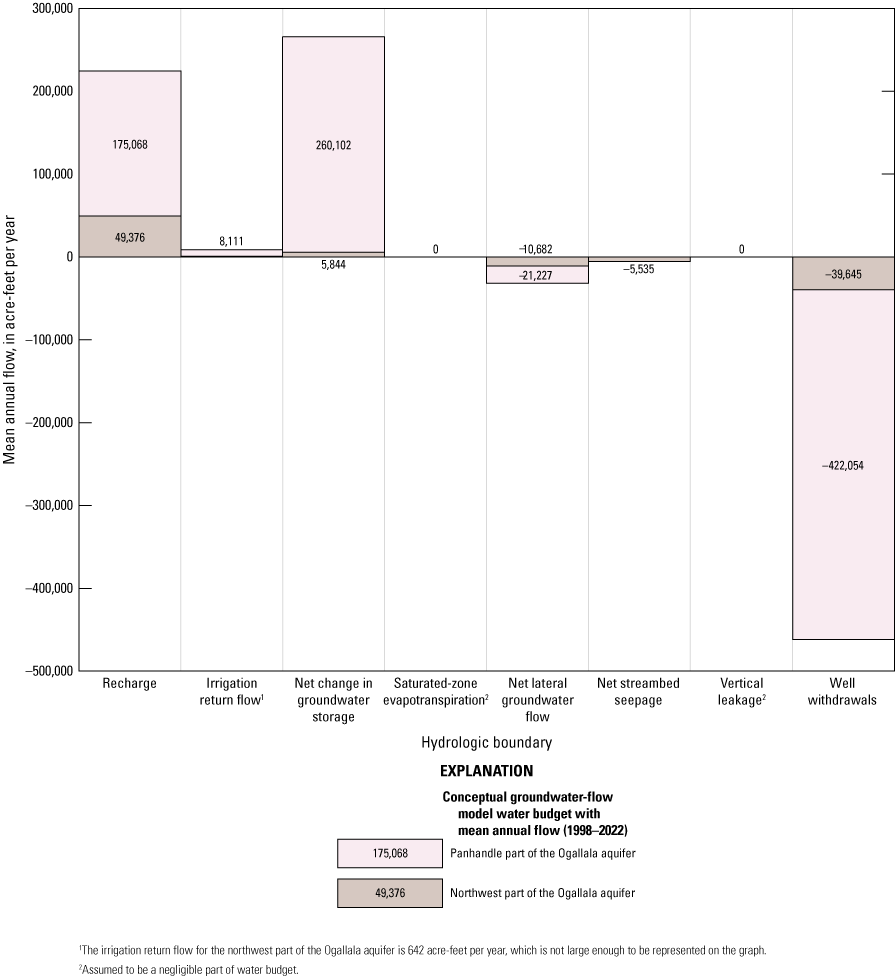
Estimated mean annual inflows and outflows by hydrologic boundary for the conceptual groundwater-flow model of the panhandle and northwest parts of the Ogallala aquifer, Oklahoma, 1998–2022.
Hydrologic Boundaries
Hydrologic boundaries in the conceptual model represent real-world sources (inflows) and sinks (outflows) of water to and from the aquifer. Boundaries that act as both inflows and outflows may be referred to as “net inflows” or “net outflows” depending on which flow component dominates. Hydrologic boundary flows considered in this report include recharge, irrigation return flows, well withdrawals, saturated zone evapotranspiration, streambed seepage, change in groundwater storage, lateral groundwater flows, and vertical leakage (fig. 21; table 8).
Recharge
Recharge, as defined in this report, is groundwater from infiltrating precipitation and snowmelt that has reached the water table of an unconfined aquifer. Recharge rates to the High Plains aquifer in the study area are highly variable; published recharge rates range from 0 to 7 in/yr, with a mean value of 0.915 in/yr in the study area (table 9; Stanton and others, 2011; OWRB, 2012; Wyatt and others, 2018). The mean value was calculated from the mean recharge values for specific locations which are listed in table 9. Recharge probably occurs more rapidly and in greater amounts in areas with sandy soils and pervious land cover than in areas with clay-rich soils and impervious land cover (Luckey and Becker, 1998). The distribution of playa lakes and caliche zones also likely affects the timing and distribution of recharge across the Ogallala aquifer focus area (Luckey and Becker, 1998). Precipitation and snowmelt may take years to infiltrate to the Ogallala aquifer’s saturated zone (Andrews and others, 2000), which lies more than 200 ft below land surface in some areas (USGS, 2024a). Long lag times between precipitation events and rises in groundwater levels violate an assumption of simple recharge estimation methods like the water-table fluctuation method (Healy and Cook, 2002), which assumes hours to days between a precipitation event and a subsequent rise in groundwater.
Table 9.
Summary of recharge rates for the High Plains (Ogallala) aquifer study area from previously published reports, modified from Stanton and others (2011).[P, precipitation; S, Streamflow seepage; I, irrigation return flow; U, unspecified; OWRB, Oklahoma Water Resources Board]
| Location | Method | Land cover | Recharge rate (inches per year) |
Water source |
Time period | Reference |
|---|---|---|---|---|---|---|
| Central High Plains | Groundwater-flow model | Undeveloped | 0.056–0.84 (mean=0.14) | P, S | Pre-1950 | Luckey and others (1986); Sophocleous (2004) |
| Between Arkansas and Canadian Rivers | Groundwater-flow model | Undeveloped | 0.068–0.69 (mean=0.155) | P | Pre-1946 | Luckey and others (1986); Sophocleous (2004) |
| Between Arkansas and Canadian Rivers | Groundwater-flow model | Rangeland, nonirrigated cropland, cropland | 0.41 | P, I | 1946–97 | Luckey and others (1986); Sophocleous (2004) |
| Southwestern Kansas | Groundwater-flow model | Undeveloped | 0.0–2.0 (mean=0.24) | P | Pre-1950 | Stullken and others (1985); Sophocleous (2004) |
| Southwestern Kansas | Groundwater-flow model | Undeveloped | 0.036–0.045 (median=0.040) | S | Pre-1950 | Stullken and others (1985); Sophocleous (2004) |
| Southwestern Kansas | Groundwater-flow model | Unspecified | 0.58 | U | 1982 | Watts (1989); Sophocleous (2004) |
| Northwestern Oklahoma and southwestern Kansas | Groundwater-flow model | Unspecified | 0.23–0.45 (mean=0.34) | P | Pre-1940, 1940–80 | Havens and Christenson (1984); Sophocleous (2004) |
| Kansas | Chloride mass balance | Rangeland | 0.2 | P | 2000–02 | McMahon and others (2006) |
| Kansas | Tritium | Irrigated cropland | 1.5–2.1 (mean=1.8) | P, I | 2000–02 | McMahon and others (2006) |
| Northern Texas | Zero-flux plane | Nonirrigated cropland and rangeland | 0.17 | P | 1978–79 | Klemt (1981) |
| Northern Texas | Zero-flux plane | Irrigated cropland | 1.9 | P | 1978–79 | Klemt (1981) |
| Southwestern Kansas | Unspecified | Irrigated cropland | 1.5 | P, S | 1975 | Gutentag and others (1980); Sophocleous (2004) |
| Southwestern Kansas | Unspecified | Nonirrigated land | 0.15 | P, S | 1975 | Gutentag and others (1980); Sophocleous (2004) |
| Southwestern Kansas | Unspecified | Irrigated and nonirrigated land | 0.6 | P, S | 1975 | Gutentag and others (1980); Sophocleous (2004) |
| Great Plains | Soil-water-balance model | Nonirrigated land | 0.25–5 (median=2.6) | P | 1951–80 | Dugan and Zelt (2000) |
| Great Plains | Soil-water-balance model | Irrigated cropland | 0.25–7 (median=3.6) | P | 1951–80 | Dugan and Zelt (2000) |
| Oklahoma | Unspecified | Unspecified | 0.5–0.9 (mean=0.7) | U | 2012 | OWRB (2012) |
| Oklahoma | Soil moisture | Unspecified | 0.7 | U | 2018 | Wyatt and others (2018) |
| Oklahoma | Groundwater-flow model | Unspecified | 0.06–0.9 (mean=0.18) | U | 1946–97 | Luckey and Becker (1999) |
| Oklahoma Panhandle | Observation well | Nonirrigated land | 0.25–0.5 (mean=0.38) | P | 1938–69 | Hart and others (1976) |
| Texas County, Oklahoma | Groundwater-flow model | Unspecified | 0.2–2.2 (mean=1.2) | P, I | 1966–72 | Morton (1980) |
| Central High Plains | Soil-water balance model | Unspecified | 1.3–1.7 (mean=1.5) | P, I | 2000–09 | Stanton and others (2011) |
| Central High Plains | Soil-water-balance model | Unspecified | 1.6 | P, I | 1940–49 | Stanton and others (2011) |
| Oklahoma | Soil-water-balance model | Unspecified | 0.18–1.0 (mean=0.59) | P, I | 2000–09 | Stanton and others (2011) |
| Oklahoma | Soil-water-balance model | Unspecified | 1.6 | P, I | 1940–49 | Stanton and others (2011) |
Two methods were used in this study to estimate recharge rates to the Ogallala aquifer for the 1998–2022 study period: (1) the groundwater-use regression method (Whittemore and others, 2015; Butler and others, 2016), which was used to estimate spatially distributed recharge rates and (2) the Soil-Water-Balance (SWB) code (Westenbroek and others, 2018).
Recharge estimates from previously published studies, focused within Oklahoma and the surrounding High Plains aquifer, were compiled to use as a composited-average recharge estimate for the Ogallala aquifer focus area and the surrounding High Plains aquifer (table 9).
Groundwater-Use Regression
Annual groundwater-use and groundwater-level change data can be used to estimate mean annual recharge when groundwater discharge to streams is negligible (Whittemore and others, 2015; Butler and others, 2016). Annual groundwater-use data (Codner and others, 2026) were plotted against annual mean groundwater-level change data (McGuire, 2024) for the shared period of record 1988–2019 (fig. 22). Data was not available for 2000 or 2001. A linear regression yielded a coefficient of determination (R2) of 0.1449, indicating a weak relation between the two datasets (fig. 22). The regression slope was negative, indicating that greater annual groundwater-use rates were correlated with greater annual groundwater-level declines. Years in which annual groundwater use was associated with rises in groundwater levels could be interpreted as years in which the annual recharge rate exceeded the annual groundwater-use rate. Thus, the least-squares-regression line (fig. 22) was used to project and estimate the annual groundwater-use rate that would be associated with no change in groundwater levels. Assuming negligible influences from other inflows or outflows to the aquifer, this groundwater-use value would be equivalent to the mean annual recharge to the aquifer for the analysis period.
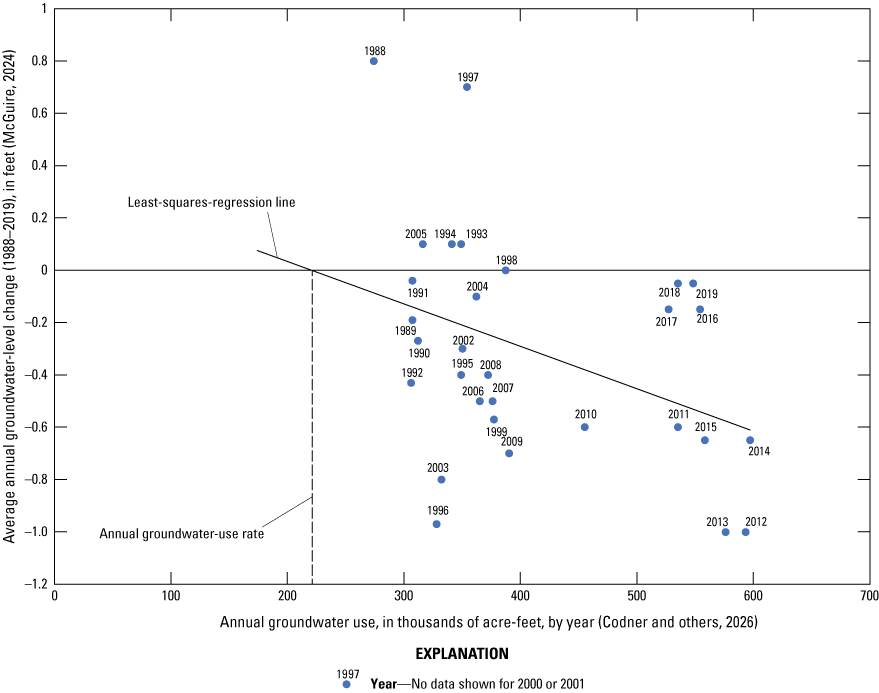
Relation between annual groundwater use and average annual groundwater-level change in the Ogallala aquifer focus area, Oklahoma, 1988–2019.
Soil-Water-Balance Code
Recharge in the Ogallala aquifer focus area was simulated for the study period 1998–2022 by using the SWB code, version 2.0 (Westenbroek and others, 2018). The input and output data files associated with the SWB-code simulation for the Ogallala aquifer focus area are included in the data release (Codner and others, 2026) that is associated with this report. The SWB code is based on a modified Thornthwaite and Mather (1957) soil-moisture accounting method that estimates recharge as the daily amount of infiltration that exceeds the storage capacity of the plant root zone. The SWB code uses the following equation (modified from Westenbroek and others [2010]):
whereR is recharge, in inches per day;
P is precipitation, in inches per day;
S is snowmelt, in inches per day;
Ri is surface runoff inflow, in inches per day;
Int is plant interception, in inches per day;
Ro is surface runoff outflow, in inches per day;
ET is evapotranspiration, in inches per day; and
ΔSm is the change in soil moisture, in inches per day.
The SWB code requires landscape-characteristic (land-cover type, soil-water storage capacity, land-surface flow direction, and hydrologic soil group) and climatological (daily temperature and precipitation) input data to estimate spatially distributed recharge over a user-defined grid. The grid used for the implementation of the SWB code described in this report consisted of 566 rows by 783 columns of cells which were each 1,500 by 1,500 ft. The Hargreaves and Samani (1985) method was used to compute reference evapotranspiration. Soil-water storage capacity and hydrologic soil group data were obtained from the Gridded Soil Survey Geographic database (U.S. Department of Agriculture, 2021). The D8 method (Greenlee, 1987) in the ArcGIS Flow Direction tool (Esri, 2024c) was used to calculate flow direction from land-surface altitudes from a 10-m-resolution DEM (USGS, 2015) with filled depressions; depressions in the DEM were filled by using the ArcGIS Fill tool (Esri, 2024b). Daily precipitation, minimum temperature, and maximum temperature grids for the 1998–2022 period were obtained from the Daymet database (version 4; Thornton and others, 2020). Land-cover types from 2021 (Multi-Resolution Land Characteristics Consortium, 2023) were used to assign runoff-curve numbers and plant root-zone depths. Default plant root-zone depths for the SWB code, which were appropriate for permeable glacial deposits in Wisconsin (Westenbroek and others, 2010), were scaled to approximately 60 percent to account for the regional differences in the soils of the study area; SWB-code implementations for nearby aquifers used root-zone depths that ranged from 30 to 80 percent (Ellis and others, 2017, 2020; Ellis, 2018).
SWB-estimated recharge rates were summarized annually in conjunction with precipitation data to calculate recharge efficiency, which is the ratio of recharge to precipitation. The SWB-estimated annual recharge rates for the panhandle part of the Ogallala aquifer ranged from 0.07 in/yr (2022) to 2.55 in/yr (2015) for the 1998–2022 study period (fig. 23A). The SWB-estimated annual recharge rates for the northwest part of the Ogallala aquifer ranged from 0.75 in/yr (2011) to 8.16 in/yr (2015) for the 1998–2022 study period (fig. 23B). The SWB-estimated annual recharge rates for the Ogallala aquifer focus area ranged from 0.24 in/yr (2022) to 3.78 in/yr (2015) for the 1998–2022 study period (fig. 23C). During the 1998–2022 study period, annual recharge efficiency was less than 15 percent for all for 25 years of the study period in the panhandle part of the Ogallala aquifer and was greater than 15 percent for 5 years in the northwest part of the Ogallala aquifer.
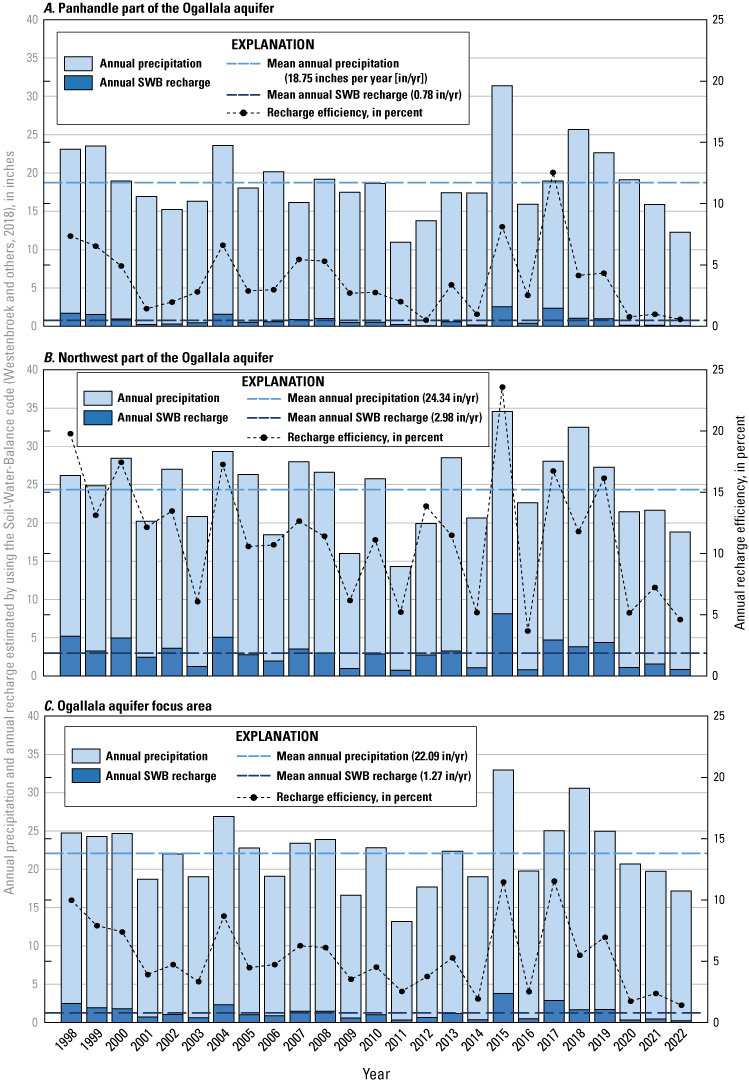
Annual precipitation and annual recharge estimated by using the Soil-Water-Balance (SWB) code (Westenbroek and others, 2018) in A, the panhandle part of the Ogallala aquifer, B, the northwest part of the Ogallala aquifer, and C, the Ogallala aquifer focus area, Oklahoma, 1998–2022.
The SWB-estimated mean annual recharge rates for the 1998–2022 study period in the panhandle and northwest parts of the Ogallala aquifer were 0.78 in/yr and 2.98 in/yr, respectively (table 10; fig. 23A, B). The SWB-estimated mean annual recharge rate for the 1998–2022 study period in the Ogallala aquifer focus area was 1.26 in/yr, or 6.36 percent of the mean annual precipitation of 19.80 in/yr as estimated by the SWB code for the same period (fig. 21). The SWB code uses gross precipitation data that are spatially interpolated across the model area and differ from the climate data summarized in the “Climate” section, where values represent the average of the 17 climate stations (fig. 1; table 1). Spatially, SWB-estimated recharge increases from west to east across the Ogallala aquifer focus area (fig. 24).
Table 10.
Summary of mean annual recharge estimated by using the Soil-Water-Balance code (Westenbroek and others, 2018) for the panhandle and northwest parts of the Ogallala aquifer in Oklahoma, which together compose the Ogallala aquifer focus area, 1998–2022.[in/yr, inch per year]
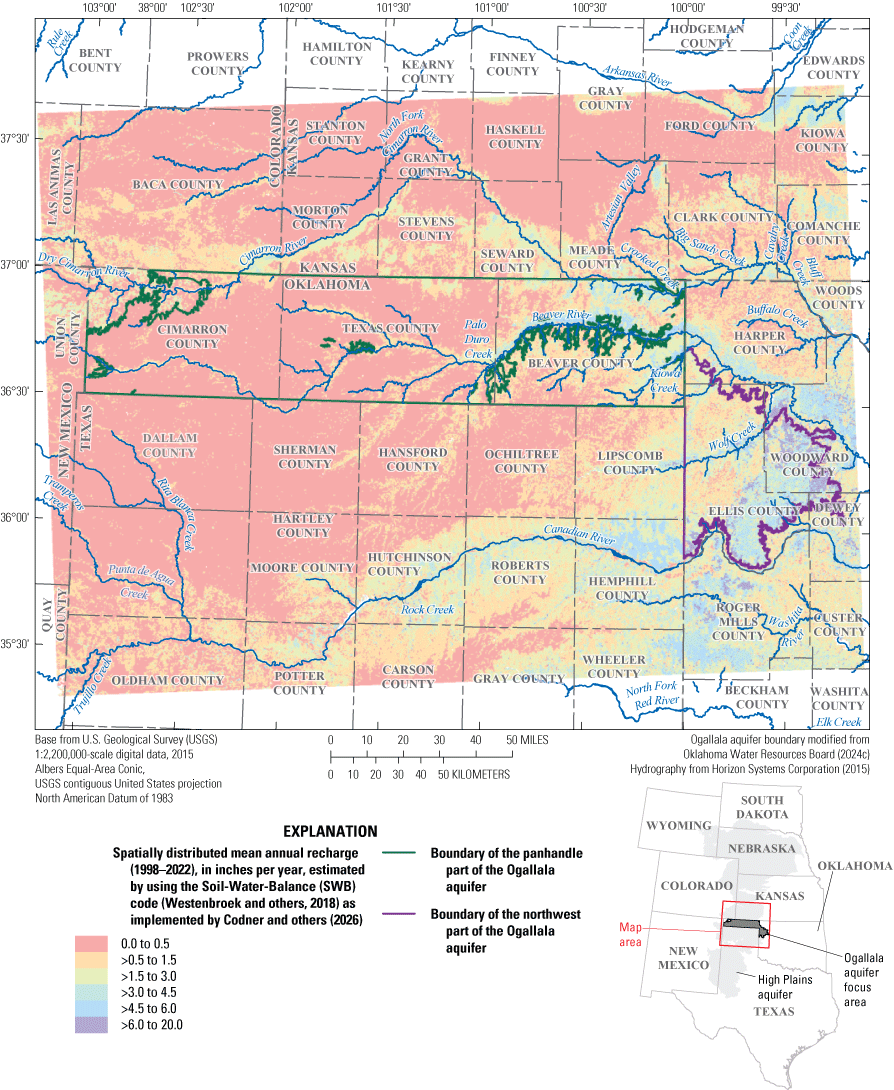
Spatially distributed mean annual recharge for the 1998–2022 study period estimated by using the Soil-Water-Balance (SWB) code (Westenbroek and others, 2018) for the High Plains (Ogallala) aquifer study area, southeastern Colorado, southwestern Kansas, northeastern New Mexico, northwestern Oklahoma, and northwestern Texas.
Potential recharge was estimated by using the regression method because measured values were available. The SWB-estimated recharge was not calibrated because of the long recharge rates. The estimated mean annual recharge for the Ogallala aquifer focus area was estimated as an inflow of 224,444 acre-ft/yr and accounted for 44.97 percent of the total inflows (fig. 21; table 8). This is equivalent to 0.63 in/yr of recharge for the entire Ogallala aquifer focus area (4,275,122 acres, table 8). Assuming recharge rates were proportional to area, the panhandle part of the Ogallala aquifer (3,334,636 acres) was assigned 175,068 acre-ft/yr of annual recharge, and the northwest part of the Ogallala aquifer (940,486 acres) was assigned 49,376 acre-ft/yr (table 8).
Irrigation Return Flows
The practice of irrigation increases soil moisture and thus can complement recharge through irrigation return flows to groundwater (McMahon and others, 2006) when applied irrigation water exceeds crop-water requirements. The magnitude of irrigation return flows is not well known, and estimates vary (Arnold, 2011). The length of time required for irrigation return flows to reach the saturated zone complicates irrigation-return-flow estimation; it may take years for percolating irrigation water to reach the water table in areas where the saturated zone is hundreds of feet below land surface (Scanlon and others, 2010).
Irrigation efficiency has increased since predevelopment as irrigation practices were gradually converted to center pivots and low energy, precision application systems due to fuel cost increases. In the 1990s, irrigation return flows were estimated to be about 2 percent of the groundwater pumped for irrigation use (Luckey and Becker, 1999), and that percentage was used to estimate irrigation return flows for the conceptual-model water budget in this report. The mean annual irrigation return flows for the panhandle and northwest parts of the Ogallala aquifer were 8,111 and 642 acre-ft/yr, respectively, and together accounted for 1.75 percent of the total inflows during the study period (fig. 21; table 8).
Well Withdrawals
Well withdrawals were assumed to be equivalent to the mean annual reported groundwater use during 1998–2022 for the panhandle part (422,054 acre-ft/yr; table 2) and the northwest part (39,645 acre-ft/yr; table 3) of the Ogallala aquifer. Together, these well withdrawals account for 461,700 acre-ft/yr or 92.50 percent of the total outflows for the Ogallala aquifer focus area (fig. 21; table 8).
Saturated-Zone Evapotranspiration
Evapotranspiration is the process by which water is transferred to the atmosphere by evaporation from the soil and reservoirs and by transpiration from plants. Most evapotranspiration occurs at the land surface where precipitation pools as surface water or where it infiltrates the soil unsaturated zone and becomes available to plant root zones (Lubczynski, 2008). The surface-water and unsaturated-zone components of evapotranspiration were not considered to be a part of the conceptual model for the Ogallala aquifer focus area because they occur before infiltrating precipitation has reached the saturated zone to become groundwater recharge. However, saturated-zone evapotranspiration, which occurs in lower lying areas or wetlands along streams (Lubczynski, 2008) where the aquifer saturated zone intersects the plant root zone, can be an important component of the conceptual models for some aquifers.
Saturated-zone evapotranspiration was not expected to be a major component of the conceptual-model water budget for the panhandle and northwest parts of the Ogallala aquifer because groundwater in the aquifer saturated zone is generally far below land surface and thus unavailable to plant roots. About 52,000 acres of the 4,275,122-acre Ogallala aquifer focus area were classified as wetlands (including riverine wetlands, freshwater emergent wetlands, and freshwater forested/shrub wetlands) by the National Wetlands Inventory (U.S. Fish and Wildlife Service, 2024). Many of the areas were classified as wetlands in the Ogallala aquifer focus area, however, were upland playa lakes that do not intersect the groundwater saturated zone. The wetland classification that could intersect the groundwater saturated zone is the riverine wetlands. Only 26,375 acres in the panhandle and 1,600 acres in the northwest part of the Ogallala aquifer were assumed to contribute to saturated-zone evapotranspiration. These areas account for less than 1 percent of the respective aquifer areas; therefore, the saturated-zone component of evapotranspiration was considered a negligible component of the conceptual-model water budget for the Ogallala aquifer focus area.
Streambed Seepage
Synoptic base-flow measurements (or seepage-run measurements) were collected at discrete and continuous streamflow measurement sites (table 1) by using the methods of Rantz and others (1982) during January 17–26, 2023, which was a period of minimal runoff (USGS, 2024a). This period of minimal runoff was chosen to isolate the base-flow component of streamflow while groundwater withdrawals for irrigation were minimal. Of the 27 base-flow measurement sites visited, 22 had no flow, and the remaining 5 sites (S19, S22, S29, S30, and S32) each had measured base flows less than 16 ft3/s (fig. 25). The synoptic base-flow measurements indicated that in January 2023 (1) the Beaver River had no flow at all sites measured, (2) the Cimarron River was a losing stream (decreasing base flow downstream) in northeastern Beaver County between sites S22 and S19, and (3) Wolf Creek was a gaining stream (increasing base flow downstream) between sites S18 and S32 and a losing stream between sites S32 and S23.
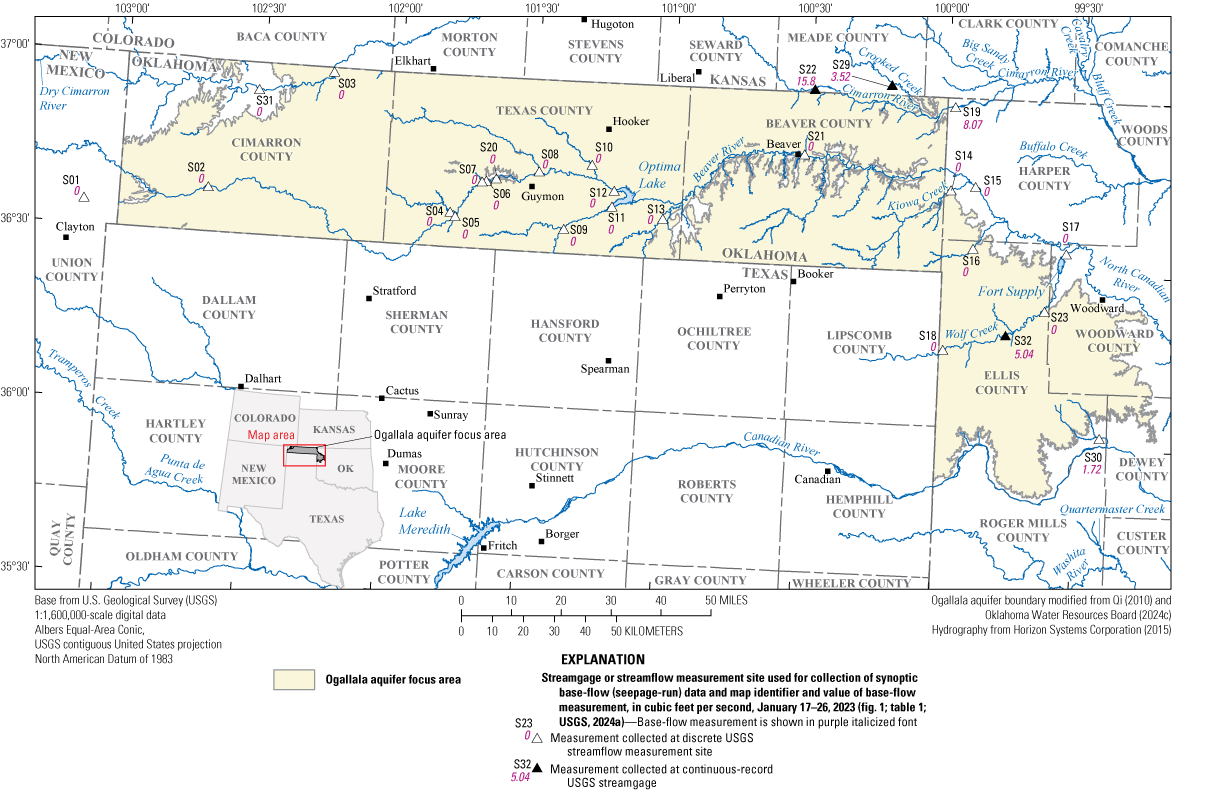
Seepage-run measurements for selected streams that overlie the Ogallala aquifer focus area, Oklahoma, January 17–26, 2023.
Continuous-record streamgages USGS 07234000 Beaver River at Beaver, Okla. (map identifier S21), and USGS 07235600 Wolf Creek near Gage, Okla. (map identifier S32; figs. 1 and 25; table 1), were used in an analysis of no-flow days, which were defined in this report as days with daily streamflow less than 1 ft3/s. The streamgage on Beaver River had a period of record covering the entire 1998–2022 study period (fig. 11A; table 1) and was used to represent groundwater discharge from the panhandle part of the Ogallala aquifer during the study period. The streamgage on Wolf Creek had a period of record covering 13 years (2010–22) of the 1998–2022 study period (fig. 12B; table 1) and was used to represent groundwater discharge from the northwest part of the Ogallala aquifer during the study period. USGS 07234000 Beaver River at Beaver, Okla. (map identifier S21, figs. 1 and 26), typically has no flow for much of the year. During the study period, 19 of 25 years had at least 180 no-flow days, and 6 of 25 years had at least 360 no-flow days. Only 1999 had fewer than 135 no-flow days, with 51 days with no flow (fig. 25). USGS 07235600 Wolf Creek near Gage, Okla. (map identifier S32, figs. 1 and 25), typically has 0 no-flow days, at least according to available records from 2010 to 2022. Only 3 of those 13 years had no-flow days, and only 2012 had more than 45 no-flow days.
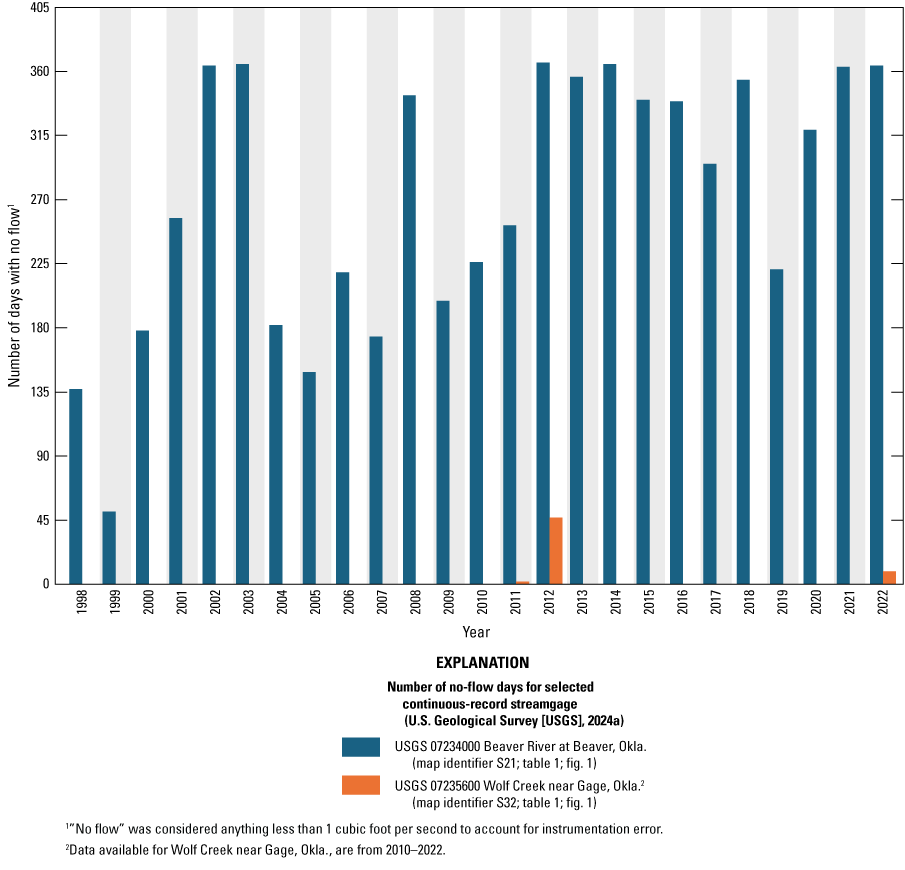
Observed number of no-flow days for selected continuous-record streamgages in the Ogallala aquifer focus area, Oklahoma, 1998–2022.
Based on synoptic base-flow measurements and analysis of continuous-record streamgage data (figs. 25–26), streambed seepage was assumed to be a negligible part of the conceptual-model water budget for the panhandle part of the Ogallala aquifer for the 1998–2022 study period. Streambed seepage was not considered a negligible part of the conceptual-model water budget for the northwest part of the Ogallala aquifer. The mean annual base flow for 2010–22 at USGS 07235600 Wolf Creek near Gage, Okla., was 7.64 ft3/s (fig. 12B). This base-flow discharge was assumed to be a net outflow for the northwest part of the Ogallala aquifer and converts to 5,535 acre-ft/yr. This outflow accounts for 1.11 percent of the total outflows for the Ogallala aquifer focus area (table 8).
Change in Groundwater Storage
Changes in groundwater storage were summarized for two periods: (1) predevelopment–2019 and (2) 1998–2019. The groundwater-level changes for the predevelopment–2019 period were determined by clipping the raster data of McGuire and Strauch (2024a, b) to the Ogallala aquifer focus area (fig. 27). The clipped groundwater-level change raster was used to calculate the change in groundwater storage for the predevelopment–2019 period by multiplying the area of the aquifer and the mean estimated specific yield (0.09) by the mean change in groundwater level (table 11). The groundwater-level changes for this period ranged from rises of more than 10 ft, mostly in Ellis County, Okla., to declines of more than 100 ft in parts of Texas County, Okla. (fig. 27).
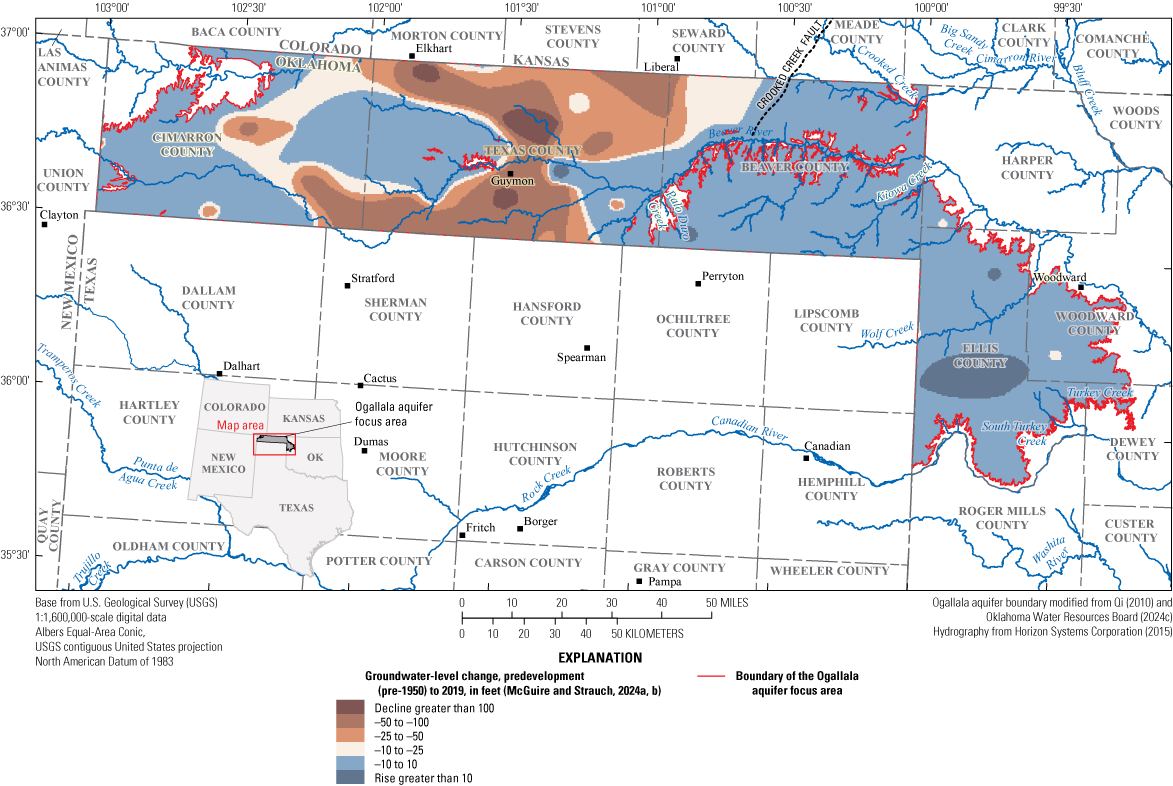
Groundwater-level changes in the Ogallala aquifer focus area, Oklahoma, predevelopment–2019. Modified from McGuire and Strauch (2024a).
A groundwater-level change map for the 1998–2019 period (fig. 28) was created by using groundwater-level measurements taken in 79 wells at approximately the same time each year (McGuire and Strauch, 2024b; USGS, 2024a). The 2017–2019 groundwater-level change raster from McGuire and Strauch (2024b) was contoured at a 10-ft interval by using the ArcGIS Contour tool (Esri, 2024a). Those 10-ft contours and points representing the 1998–2019 groundwater-level change for the 79 wells were used as inputs to the ArcGIS Topo to Raster tool (Esri, 2024d). The output groundwater-level change raster was used to calculate the change in groundwater storage for the 1998–2019 period by multiplying the area of the aquifer and the mean estimated specific yield (0.09) by the mean change in groundwater level (table 11). A decline in groundwater levels and net loss in storage occurred in both the panhandle and northwest parts of the Ogallala aquifer during the 1998–2019 period. The groundwater levels decreased by averages of 18.2 and 1.45 ft, respectively, across the panhandle and northwest parts of the Ogallala aquifer from 1998 to 2019 (McGuire and Strauch, 2024b). Groundwater storage decreased 260,102 acre-ft/yr in the panhandle part and 5,844 acre-ft/yr in the northwest part of the Ogallala aquifer. The assumption was made that the groundwater-storage change was about the same for the 1998–2019 period of record as for the 1998–2022 study period, and these values were applied to the conceptual-model water budget for 1998–2022. The resulting changes in storage were considered net inflows of 260,102 acre-ft/yr for the panhandle part of the Ogallala aquifer and 5,844 acre-ft/yr for the northwest part of the Ogallala aquifer. This net loss in groundwater storage was considered an inflow to the aquifer for mass balance purposes and accounted for 53.28 percent of the inflows for the Ogallala aquifer focus area for the 1998–2022 study period (fig. 21; table 8).
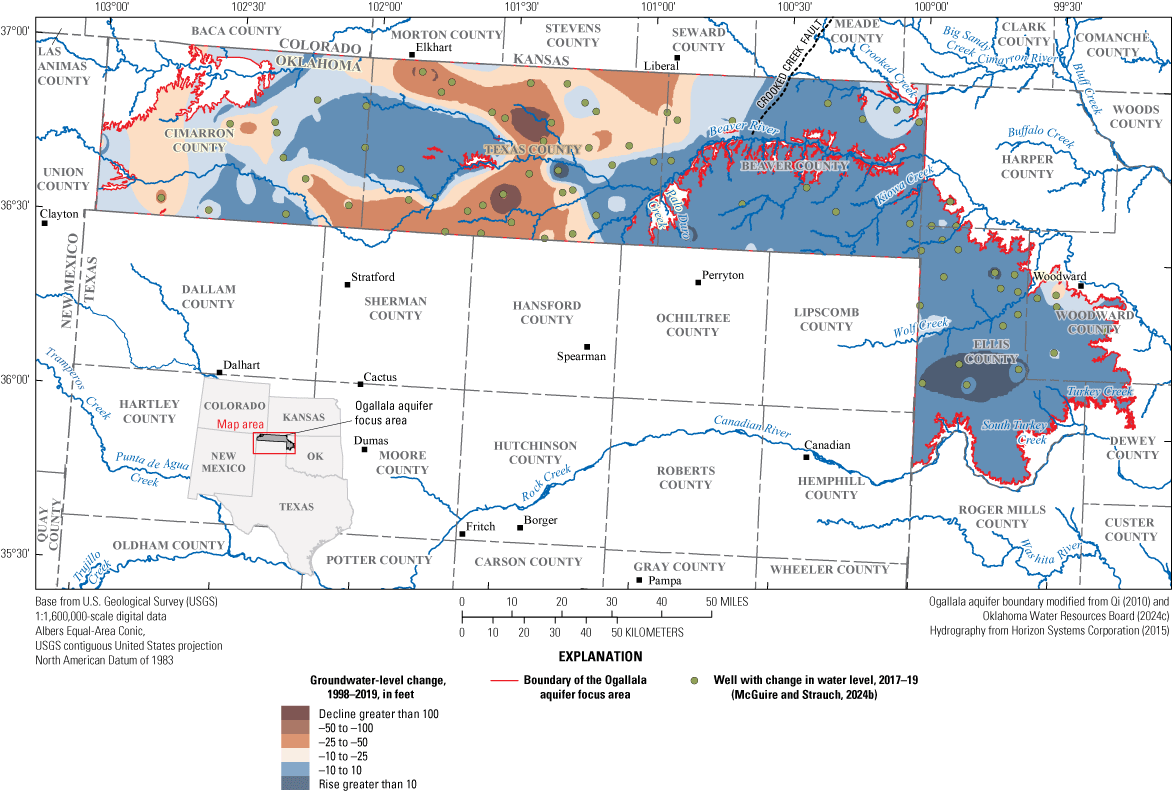
Groundwater-level changes in the Ogallala aquifer focus area, Oklahoma, 1998–2019.
Table 11.
Summary of change in groundwater storage for the panhandle and northwest parts of the Ogallala aquifer in Oklahoma, which together compose the Ogallala aquifer focus area, predevelopment–2019 and 1998–2019.[Mean estimated specific yield value of 0.09 (table 6) used for calculation of groundwater storage. Values may not sum to total because of independent rounding]
Lateral Groundwater Flows
Net lateral groundwater flows were calculated as the difference between the nonzero aquifer inflows (recharge, irrigation return flows, and net change in groundwater storage) and the aquifer outflows (well withdrawals) and were used to balance the conceptual-model water budget because no data were available to estimate lateral groundwater flows, which in this study were defined as flows across political boundaries of the Ogallala aquifer focus area to or from adjacent parts of the High Plains aquifer. Net lateral groundwater flows for the panhandle and northwest parts of the Ogallala aquifer were calculated to be net outflows of 21,227 and 10,682 acre-ft/yr, respectively, and together accounted for 6.39 percent of the total outflows for the Ogallala aquifer focus area (fig. 21; table 8).
Vertical Leakage
Vertical leakage, which is the exchange of groundwater between the Ogallala aquifer and the underlying hydrogeologic units, was assumed to be small compared to lateral groundwater flows across the political boundaries of the Ogallala aquifer focus area. Most of the Ogallala aquifer focus area overlies units which produce minimal amounts of water used for stock wells (Hart and others, 1976). Therefore, vertical leakage was assumed to be a negligible part of the conceptual-model water budget (fig. 21; table 8).
Conceptual-Model Water Budget
A conceptual-model water budget estimating mean annual inflows to and outflows from the panhandle and northwest parts of the Ogallala aquifer, together called the Ogallala aquifer focus area, for the 1998–2022 study period (fig. 21; table 8) was developed from the conceptual model. The balanced total inflows and outflows for the Ogallala aquifer focus area were estimated 499,143 acre-ft/yr for the 1998–2022 study period. The components of the conceptual-model water budget were estimated from analyses of available data; however, where data were unavailable or inadequate, assumptions were made from previous investigations as described in the “Hydrologic Boundaries” section. The inflow percentages for the Ogallala aquifer focus area are 44.97 percent for recharge, 1.75 percent for recharge due to irrigation return flow, and 53.28 percent for net change in groundwater storage. The outflow percentages for the Ogallala aquifer focus area are 6.39 percent for net lateral groundwater flow, 1.11 percent for net streambed seepage, and 92.50 percent for well withdrawals. Vertical leakage and saturated-zone evapotranspiration were assumed to be negligible outflow components of the conceptual-model water budget.
Summary
The 1973 Oklahoma Groundwater Law (Oklahoma Statute § 82-1020.5) requires the Oklahoma Water Resources Board (OWRB) to conduct hydrologic investigations of the State’s aquifers (referred to as “groundwater basins” in the statutes) to support a determination of the maximum annual yield (MAY) for each aquifer. The MAY is defined as the amount of fresh groundwater that can be withdrawn annually while ensuring a minimum 20-year life of the aquifer. For bedrock aquifers, the groundwater-basin-life requirement is satisfied if, after 20 years of MAY withdrawals, 50 percent of the groundwater basin (hereinafter referred to as an “aquifer”) retains a saturated thickness of at least 15 feet (ft). The MAY is divided by the total land area overlying the aquifer to determine the annual volume of groundwater allocated per acre of land, or the equal-proportionate-share (EPS) pumping rate. Most of the High Plains aquifer in Oklahoma is part of a lobe of the aquifer that extends from the Arkansas River to the Canadian River and includes parts of southeastern Colorado, southwestern Kansas, northeastern New Mexico, northwestern Oklahoma, and northwestern Texas. The OWRB (as well as water-regulating agencies in neighboring States) refers to the High Plains aquifer as the “Ogallala aquifer.” Consequently, this report uses “Ogallala aquifer” when referring to the High Plains aquifer in Oklahoma. For purposes of permitting, the OWRB has divided the Ogallala aquifer into three parts: panhandle, northwest, and Roger Mills. The OWRB issued final orders on March 12, 2002, that established MAYs and EPS pumping rates for the panhandle part and the northwest part of the Ogallala aquifer. For the panhandle part of the Ogallala aquifer, the MAY was established at 6,773,760 acre-feet per year (acre-ft/yr), and the EPS pumping rate was determined to be 2.0 acre-feet per acre per year. For the northwest part of the Ogallala aquifer, the MAY was established at 1,189,500 acre-ft/yr, and the EPS pumping rate was determined to be 1.4 acre-feet per acre per year. Because more than 20 years have elapsed since the March 12, 2002, final orders, the U.S. Geological Survey, in cooperation with the OWRB, carried out a hydrologic investigation to update the hydrogeologic framework and conceptual flow model and water budget for the panhandle and northwest parts of the Ogallala aquifer for the study period 1998–2022.
In the Ogallala aquifer focus area in 2022, the predominant land-cover type was grass/pasture (43.3 percent of land cover in the panhandle part of the Ogallala aquifer and 66.6 percent of land cover in the northwest part). The predominant crop type was winter wheat (31.9 percent of cropland in the panhandle part of the Ogallala aquifer and 65.2 percent for the northwest part).
For the period 1998–2022, the mean annual precipitation was 18.75 inches in the panhandle part of the Ogallala aquifer, and the mean annual temperature was 57.47 degrees Fahrenheit. The mean annual precipitation was 24.34 inches in the northwest part of the Ogallala aquifer, and the mean annual temperature was 61.78 degrees Fahrenheit. The mean annual reported groundwater use was 422,054 acre-ft/yr in the panhandle part of the Ogallala aquifer and 39,645 acre-ft/yr in the northwest part. The predominant category of groundwater use in the study area was irrigation.
The geographic aquifer extent of the Ogallala aquifer focus area was established by the OWRB. The area of the panhandle part of the Ogallala aquifer is 3,334,636 acres, and the area of the northwest part of the Ogallala aquifer is 940,486 acres. The altitude of the base of the Ogallala aquifer in the focus area was modified from a previous report to incorporate the altitude of the top of the underlying Permian and Cretaceous bedrock contacts interpreted from completed drillers’ lithologic log reports. The base of the aquifer dips from west to east from 4,800 ft to 2,000 ft in altitude relative to North American Vertical Datum of 1988. A potentiometric surface was constructed by using synoptic groundwater-level measurements. The saturated thickness of the Ogallala aquifer focus area was determined by subtracting the altitude of the base of the aquifer from the potentiometric surface. The mean saturated thickness of the Ogallala aquifer within the Ogallala aquifer focus area was 125 ft in March 2021.
Textural and hydraulic properties for the Ogallala aquifer focus area were estimated by using nuclear magnetic resonance (NMR) measurements, slug tests, and analyses of lithologic log descriptions. Mean estimated horizontal hydraulic conductivity values from NMR measurements were 5.9–144.8 feet per day. Specific yield values from NMR measurements were estimated to be 0.053–0.134, with a mean of about 0.092. Transmissivity values from slug tests were 177.0–1,705.5 feet square per day.
A conceptual model for the Ogallala aquifer focus area included a water budget for the panhandle and northwest parts of the Ogallala aquifer. The conceptual-model water budget was used to quantify net groundwater flows across each identified hydrologic boundary for the 1998–2022 study period. Recharge was a principal inflow to the panhandle part and the predominant inflow to the northwest part of the Ogallala aquifer. The mean annual recharge rates for the panhandle and northwest parts of the Ogallala aquifer were estimated, using the regression method, to be 175,068 and 49,376 acre-ft/yr, respectively. Recharge from irrigation return flows was estimated to be about 2 percent of the irrigation well withdrawals, or 8,111 and 642 acre-ft/yr, respectively, for the panhandle and northwest parts of the Ogallala aquifer. Groundwater levels decreased by averages of 18.2 and 1.45 ft, respectively, across the panhandle and northwest parts of the Ogallala aquifer from 1998 to 2019. The resulting changes in storage were considered net inflows of 260,102 acre-ft/yr for the panhandle part of the Ogallala aquifer and 5,844 acre-ft/yr for the northwest part. Well withdrawals from the Ogallala aquifer focus area were estimated from the average reported groundwater use of 422,054 acre-ft/yr for the panhandle part of the Ogallala aquifer and 39,645 acre-ft/yr for the northwest part during 1998–2022. Well withdrawals were the largest outflow component in both the panhandle and northwest parts of the Ogallala aquifer. Streambed seepage flows for the panhandle part of the Ogallala aquifer were assumed to be a negligible component of the conceptual-model water budget because most of the streams draining that part of the aquifer were dry during a large part of the study period. However, the northwest part of the Ogallala aquifer was assigned a net outflow of 5,535 acre-ft/yr based on base-flow estimates for Wolf Creek. Net lateral groundwater flows were used to balance the conceptual-model water budget and were considered net outflows of 21,227 acre-ft/yr for the panhandle part of the Ogallala aquifer and 10,682 acre-ft/yr for the northwest part. Vertical leakage was assumed to be a negligible component of the conceptual-model water budget based on the relatively low permeability materials that compose the geologic units underlying most of the Ogallala aquifer focus area.
References Cited
Andrews, W.J., Osborn, N.I., and Luckey, R.R., 2000, Rapid recharge of parts of the High Plains aquifer indicated by a reconnaissance study in Oklahoma, 1999: U.S. Geological Survey Fact Sheet 137–00, 4 p., accessed April 19, 2024, at https://doi.org/10.3133/fs13700.
Arnold, L.R., 2011, Estimates of deep-percolation return flow beneath a flood- and a sprinkler-irrigated site in Weld County, Colorado, 2008–2009: U.S. Geological Survey Scientific Investigations Report 2011–5001, 225 p., accessed February 28, 2025, at https://doi.org/10.3133/sir20115001.
ASTM International, 2017, Standard guide for conducting borehole geophysical logging—Electromagnetic induction: ASTM International D6726–01, 8 p., accessed April 30, 2024, at https://www.astm.org/d6726-01.html.
ASTM International, 2018, Standard guide for planning and conducting geotechnical borehole geophysical logging: ASTM International D5753-05, 9 p., accessed April 30, 2024, at https://www.astm.org/d5753-05.html.
ASTM International, 2019, Standard guide for conducting borehole geophysical logging—Mechanical caliper: ASTM International D 6197–19, 6 p., accessed April 30, 2024, at https://www.astm.org/d6167-19.html.
Barkmann, P.E., Sebol, L.A., Broes, L.D., and McGee, K.H., 2021, Geology and groundwater resources of Elbert County, Colorado: Colorado Geological Survey Open-File Report OF-18-12, 45 p., 18 pl., accessed July 11, 2025, at https://coloradogeologicalsurvey.org/publications/geology-groundwater-resources-elbert-colorado.
Barlow, P.M., Cunningham, W.L., Zhai, T., and Gray, M., 2015, U.S. Geological Survey Groundwater Toolbox, a graphical and mapping interface for analysis of hydrologic data (version 1.0)—User guide for estimation of base flow, runoff, and groundwater recharge from streamflow data: U.S. Geological Survey Techniques and Methods, book 3, chap. B10, 27 p., accessed June 2, 2023, at https://doi.org/10.3133/tm3B10.
Barlow, P.M., and Leake, S.A., 2012, Streamflow depletion by wells—Understanding and managing the effects of groundwater pumping on streamflow: U.S. Geological Survey Circular 1376, 84 p., accessed June 5, 2023, at https://doi.org/10.3133/cir1376.
Behroozmand, A.A., Keating, K., and Auken, E., 2015, A review of the principles and applications of the NMR technique for near-surface characterization: Surveys in Geophysics, v. 36, no. 1, p. 27–85, accessed April 11, 2024, at https://doi.org/10.1007/s10712-014-9304-0.
Belden, M., and Osborn, N.I., 2002, Hydrogeologic investigation of the Ogallala aquifer in Roger Mills and Beckham Counties, western Oklahoma: Oklahoma Water Resources Board Technical Report GW2002-2, 11 p., accessed August 21, 2025, at https://oklahoma.gov/content/dam/ok/en/owrb/documents/science-and-research/hydrologic-investigations/ogallala-roger-mills-and-beckham-counties-2002.pd f.
Bouwer, H., and Rice, R.C., 1976, A slug test for determining hydraulic conductivity of unconfined aquifers with completely or partially penetrating wells: Water Resources Research, v. 12, no. 3, p. 423–428, accessed March 3, 2024, at https://doi.org/10.1029/WR012i003p00423.
Butler, J.J., Jr., 1998. The design, performance, and analysis of slug tests: Boca Raton, Lewis Publishers, 252 p., accessed March 3, 2024, at https://doi.org/10.1201/9780367815509.
Butler, J.J., Jr., Whittemore, D.O., Wilson, B.B., and Bohling, G.C., 2016, A new approach for assessing the future of aquifers supporting irrigated agriculture: Geophysical Research Letters, v. 43, no. 5, p. 2004–2010, accessed November 6, 2024, at https://doi.org/10.1002/2016GL067879.
Canadian Well Logging Society, 2024, LAS—Log ASCII Standard (LAS): Canadian Well Logging Society, accessed March 27, 2024, at https://www.cwls.org/products/#products-las.
Cleveland, W., 1979, Robust locally weighted regression and smoothing scatterplots: Journal of the American Statistical Association, v. 74, no. 368, p. 829–836, accessed September 12, 2023, at https://doi.org/10.1080/01621459.1979.10481038.
Codner, C., Morris, A.S., Baciocco, C.A., Wagner, D.L., Fiorentino, E.G., and LePera, A., 2026, Soil-Water-Balance model and data used in the hydrogeologic framework and conceptual groundwater-flow model of the panhandle and northwest parts of the High Plains (Ogallala) aquifer in Oklahoma, 1998–2022: U.S. Geological Survey data release, https://doi.org/10.5066/P13S99PS.
Dlubac, K., Knight, R., Song, Y.-Q., Bachman, N., Grau, B., Cannia, J., and Williams, J., 2013, Use of NMR logging to obtain estimates of hydraulic conductivity in the High Plains aquifer, Nebraska, USA: Water Resources Research, v. 49, no. 4, p. 1871–1886, accessed April 20, 2024, at https://doi.org/10.1002/wrcr.20151.
Dugan, J.T., and Zelt, R.B., 2000, Simulation and analysis of soil-water conditions in the Great Plains and adjacent areas, central United States, 1951–80: U.S. Geological Survey Water-Supply Paper 2427, 81 p., accessed April 30, 2024, at https://doi.org/10.3133/wsp2427.
Dunn, K.-J., Bergman, D.J., and LaTorraca, G.A., eds., 2002, Nuclear magnetic resonance—Petrophysical and logging applications: Elsevier Science., 293 p., accessed April 30, 2024, at https://www.sciencedirect.com/handbook/handbook-of-geophysical-exploration-seismic-exploration/vol/32.
Dutton, A.R., and Simpkins, W.W., 1986, Hydrogeochemistry and water resources of the Triassic Lower Dockum Group in the Texas Panhandle and eastern New Mexico: Bureau of Economic Geology Report of Investigations No. 161, 51 p., accessed May 24, 2024, at https://www.nrc.gov/docs/ML0510/ML051030234.pdf.
Ellis, J.H., 2018, Simulation of groundwater flow and analysis of projected water use for the Rush Springs aquifer, western Oklahoma: U.S. Geological Survey Scientific Investigations Report 2018–5136, 156 p., accessed December 2, 2024, at https://doi.org/10.3133/sir20185136.
Ellis, J.H., Mashburn, S.L., Graves, G.M., Peterson, S.M., Smith, S.J., Fuhrig, L.T., Wagner, D.L., and Sanford, J.E., 2017, Hydrogeology and simulation of groundwater flow and analysis of projected water use for the Canadian River alluvial aquifer, western and central Oklahoma (ver. 1.1, March 2017): U.S. Geological Survey Scientific Investigations Report 2016–5180, 64 p., 7 pls., accessed April 11, 2023, at https://doi.org/10.3133/sir20165180.
Ellis, J.H., Ryter, D.W., Fuhrig, L.T., Spears, K.W., Mashburn, S.L., and Rogers, I.M.J., 2020, Hydrogeology, numerical simulation of groundwater flow, and effects of future water use and drought for reach 1 of the Washita River alluvial aquifer, Roger Mills and Custer Counties, western Oklahoma, 1980–2015: U.S. Geological Survey Scientific Investigations Report 2020–5118, 81 p., accessed December 2, 2024, at https://doi.org/10.3133/sir20205118.
Esralew, R.A., and Lewis, J.M., 2010, Trends in base flow, total flow, and base-flow index of selected streams in and near Oklahoma through 2008: U.S. Geological Survey Scientific Investigations Report 2010–5104, 143 p., accessed September 2, 2025, at https://doi.org/10.3133/sir20105104.
Esri, 2024a, ArcGIS for desktop help—Contour tool: Esri web page, accessed February 21, 2024, at https://desktop.arcgis.com/en/arcmap/10.7/tools/spatial-analyst-toolbox/contour.htm.
Esri, 2024b, ArcGIS for desktop help—Fill tool: Esri web page, accessed February 21, 2024, at https://desktop.arcgis.com/en/arcmap/10.7/tools/spatial-analyst-toolbox/fill.htm.
Esri, 2024c, ArcGIS for desktop help—Flow Direction tool: Esri web page, accessed February 21, 2024, at https://desktop.arcgis.com/en/arcmap/10.7/tools/spatial-analyst-toolbox/flow-direction.htm.
Esri, 2024d, ArcGIS for desktop help—Topo to Raster tool: Esri web page, accessed February 21, 2024, at https://desktop.arcgis.com/en/arcmap/10.7/tools/spatial-analyst-toolbox/topo-to-raster.htm.
Fay, R.O., 1997, Stratigraphic units in Oklahoma, Texas, Arkansas, and adjacent areas: Oklahoma Geological Survey Open-File Report 2–97, 229 p., accessed April 2, 2024, at https://ogs.ou.edu/docs/openfile/OF2-97.pdf and https://ogs.ou.edu/pubsscanned/openfile/OF297d.pdf.
Greenlee, D.D., 1987, Raster and vector processing for scanned linework: Photogrammetric Engineering and Remote Sensing, v. 53, no. 10, p. 1383–1387, accessed December 12, 2024, https://cartogis.org/docs/proceedings/archive/auto-carto-8/pdf/raster-and-vector-processing-for-scanned-linework.pdf.
Gutentag, E.D., Heimes, F.J., Krothe, N.C., Luckey, R.R., and Weeks, J.B., 1984, Geohydrology of the High Plains aquifer in parts of Colorado, Kansas, Nebraska, New Mexico, Oklahoma, South Dakota, Texas, and Wyoming: U.S. Geological Survey Professional Paper 1400–B, 63 p., accessed June 12, 2023, at https://doi.org/10.3133/pp1400B.
Gutentag, E.D., Lobmeyer, D.H., and Slagle, S.E., 1980, Geohydrology of southwestern Kansas: U.S. Geological Survey Open-File Report 80–218, 97 p., 11 pls., accessed April 30, 2024, at https://doi.org/10.3133/ofr80218.
Hargreaves, G.H., and Samani, Z.A., 1985, Reference crop evapotranspiration from temperature: Applied Engineering in Agriculture, v. 1, no. 2, p. 96–99, accessed April 29, 2024, at https://doi.org/10.13031/2013.26773.
Hart, D.L., Jr., Hoffman, G.L., and Goemaat, R.L., 1976, Geohydrology of the Oklahoma Panhandle, Beaver, Cimarron, and Texas Counties: U.S. Geological Survey Water-Resources Investigations Report 25–75, 62 p., 10 pls., accessed June 12, 2023, at https://doi.org/10.3133/wri7525.
Havens, J.S., and Christenson, S.C., 1984, Numerical simulation of the High Plains regional aquifer, northwestern Oklahoma: U.S. Geological Survey Water-Resources Investigations Report 83–4269, 27 p., 8 pls., accessed June 12, 2023, at https://doi.org/10.3133/wri834269.
Healy, R.W., and Cook, P.G., 2002, Using groundwater levels to estimate recharge: Hydrogeology Journal, v. 10, no. 1, p. 91–109, accessed August 3, 2022, at https://doi.org/10.1007/s10040-001-0178-0.
Horizon Systems Corporation, 2015, National Hydrography Dataset Plus (NHDPlus) version 1: Horizon Systems Corporation database, accessed June 6, 2023, at https://nhdplus.com/NHDPlus/.
Hyder, Z., Butler, J.J., Jr., McElwee, C.D., and Liu, W., 1994, Slug tests in partially penetrating wells: Water Resources Research, v. 30, no. 11, p. 2945–2957, accessed June 1, 2023, at https://doi.org/10.1029/94WR01670.
HydroSOLVE, Inc., 2011, AQTESOLV for windows: HydroSOLVE, Inc., accessed June 1, 2023, at https://www.aqtesolv.com.
Kansas Geological Survey, 2026, Kansas High Plains aquifer atlas, accessed March 20, 2026, at https://geokansas.ku.edu/kansas-high-plains-aquifer-atlas.
Kenyon, W.E., Day, P.I., Straley, C., and Willemsen, J.F., 1988, A three-part study of NMR longitudinal relaxation properties of water-saturated sandstones: SPE Formation Evaluation, v. 3, no. 3, p. 622–636, accessed April 30, 2024, at https://doi.org/10.2118/15643-PA.
Klemt, W.B., 1981, Evaluating the ground-water resources of the High Plains of Texas —Neutron probe measurement of deep soil moisture as an indication of aquifer recharge rates: Texas Department of Water Resources LP–142, 31 p., accessed April 30, 2024, at https://www.twdb.texas.gov/publications/reports/limited_printing/doc/LP-142/LP-142.pdf.
Kottek, M., Grieser, J., Beck, C., Rudolf, B., and Rubel, F., 2006, World map of the Köppen-Geiger climate classification updated: Meteorologische Zeitschrift (Berlin), v. 15, no. 3, p. 259–263, accessed September 12, 2022, at https://doi.org/10.1127/0941-2948/2006/0130.
Legal Information Institute, 2022, Oklahoma administrative code § 785:45-7-3—Groundwater classifications, beneficial uses and vulnerability levels: Legal Information Institute, accessed May 20, 2022, at https://www.law.cornell.edu/regulations/oklahoma/Okla-Admin-Code-SS-785-45-7-3.
Lubczynski, M.W., 2008, The hydrogeological role of trees in water-limited environments: Hydrogeology Journal, v. 17, no. 1, p. 247–259, accessed May 7, 2024, at https://doi.org/10.1007/s10040-008-0357-3.
Luckey, R.R., and Becker, M.F., 1998, Estimated predevelopment discharge to streams from the High Plains aquifer in northwestern Oklahoma, southwestern Kansas, and northwestern Texas: U.S. Geological Survey Water-Resources Investigations Report 97–4287, 28 p., accessed April 1, 2024, at https://doi.org/10.3133/wri974287.
Luckey, R.R., and Becker, M.F., 1999, Hydrogeology, water use, and simulation of flow in the High Plains aquifer in northwestern Oklahoma, southeastern Colorado, southwestern Kansas, northeastern New Mexico, and northwestern Texas: U.S. Geological Survey Water-Resources Investigations Report 99–4104, 68 p., accessed February 2, 2023, at https://doi.org/10.3133/wri994104.
Luckey, R.R., Gutentag, E.D., Heimes, F.J., and Weeks, J.B., 1986, Digital simulation of ground-water flow in the High Plains aquifer in parts of Colorado, Kansas, Nebraska, New Mexico, Oklahoma, South Dakota, Texas, and Wyoming: U.S. Geological Survey Professional Paper 1400–D, 57 p. [Also available at https://doi.org/10.3133/pp1400D.]
Luza, K.V., and Fay, R.O., comps., 2003, Geologic map of the Boise City 30′ X 60′ quadrangle, Cimarron and Texas Counties, Oklahoma, Oklahoma: Oklahoma Geological Survey Geologic Quadrangle OGQ–43, accessed April 2, 2024, at https://ogs.ou.edu/docs/OGQ/OGQ-43-color.pdf.
Macfarlane, P.A., 1995, The effect of river valleys and the Upper Cretaceous aquitard on regional flow in the Dakota aquifer in the central Great Plains of Kansas and southeastern Colorado: Current Research on Kansas Geology, Kansas Geological Survey, Bulletin 238, accessed July 11, 2025, at https://journals.ku.edu/cres/article/view/11814.
Mashburn, S.L., Ryter, D.W., Neel, C.R., Smith, S.J., and Correll, J.S., 2014, Hydrogeology and simulation of groundwater flow in the Central Oklahoma (Garber-Wellington) aquifer, Oklahoma, 1987 to 2009, and simulation of available water in storage, 2010–2059 (ver. 2.0, October 2019): U.S. Geological Survey Scientific Investigations Report 2013–5219, 92 p., accessed December 12, 2023, at https://doi.org/10.3133/sir20135219.
McGuire, V.L., 2024, High Plains Water-Level Monitoring Study: U.S. Geological Survey website, accessed April 30, 2024, at https://ne.water.usgs.gov/projects/HPA/index.html.
McGuire, V.L., and Strauch, K.R., 2024a, Data from maps of water-level changes in the High Plains aquifer in parts of Colorado, Kansas, Nebraska, New Mexico, Oklahoma, South Dakota, Texas, and Wyoming, predevelopment (about 1950) to 2019 and 2017 to 2019: U.S. Geological Survey data release, accessed April 30, 2024, at https://doi.org/10.5066/P9WPP01S.
McGuire, V.L., and Strauch, K.R., 2024b, Water-level and recoverable water in storage changes, High Plains aquifer, predevelopment to 2019 and 2017 to 2019: U.S. Geological Survey Scientific Investigations Report 2023–5143, 15 p., accessed April 30, 2024, at https://doi.org/10.3133/sir20235143.
McMahon, P.B., Dennehy, K.F., Bruce, B.W., Böhlke, J.K., Michel, R.L., Gurdak, J.J., and Hurlbut, D.B., 2006, Storage and transit time of chemicals in thick unsaturated zones under rangeland and irrigated cropland, High Plains, United States: Water Resources Research, v. 42, no. 3, 18 p., accessed April 30, 2024, at https://doi.org/10.1029/2005WR004417.
Morriss, C.E., Rossini, D., Straley, C., Tutunjian, P.N., and Vinegar, H.J., 1997, Core analysis by low-field NMR: The Log Analyst, v. 38, no. 2, p. 84–94, accessed April 30, 2024, https://onepetro.org/petrophysics/article-abstract/170927/Core-Analysis-By-Low-field-Nmr?redirectedFrom=fulltext.
Morton, R.B., 1980, Digital-model projection of saturated thickness and recoverable water in the Ogallala aquifer, Texas County, Oklahoma: U.S. Geological Survey Open-File Report 79–565, 34 p., accessed May 3, 2024, at https://doi.org/10.3133/ofr79565.
Multi-Resolution Land Characteristics Consortium, 2023, National Land Cover Database 2021 (NLCD 2020): U.S. Geological Survey, accessed April 29, 2024, at http://www.mrlc.gov/nlcd2006.php.
National Agricultural Statistics Service, 2023, CropScape, cropland data layers, 2022: U.S. Department of Agriculture online database, accessed June 30, 2023, at https://nassgeodata.gmu.edu/CropScape/.
National Centers for Environmental Information, 2023, Daily observational data—GHCN daily: National Oceanic and Atmospheric Administration database, accessed June 12, 2023, at https://ncei.noaa.gov/maps/daily/.
National Integrated Drought Information System, 2024, United States Drought Monitor (2000–present), accessed October 15, 2024, at https://www.drought.gov/historical-information?dataset=0&selectedDateUSDM=20250603&state=Oklahoma.
National Weather Service, 2023, NOWData - NOAA online weather data for the Tulsa, OK, Weather Forecast Office: National Weather Service database, accessed December 12, 2023, at https://www.weather.gov/wrh/Climate?wfo=tsa.
Northcutt, R.A., and Campbell, J.A., 1995, Geologic provinces of Oklahoma: Oklahoma Geological Survey Open-File Report 5–95, accessed May 20, 2025, at http://ogs.ou.edu/docs/openfile/OF5-95.pdf.
Oklahoma Climatological Survey, 2023, Daily time series using cooperative observer (COOP) data: Oklahoma Climatological Survey database, accessed June 12, 2023, at https://climate.ok.gov/cgi-bin/public/climate.timeseries.one.cgi.
Oklahoma State Legislature, 2021a, Determination of maximum annual yield, chap. 1020, section 5 of Waters and water rights: Oklahoma Statutes, title 82, accessed May 20, 2022, at https://oksenate.gov/sites/default/files/2019-12/os82.pdf.
Oklahoma State Legislature, 2021b, Definitions, chap. 1020, section 1 of Waters and water rights: Oklahoma Statutes, title 82, accessed May 20, 2022, at https://oksenate.gov/sites/default/files/2019-12/os82.pdf.
Oklahoma State Legislature, 2021c, Domestic use—Spacing of wells and waste, chap. 1020, section 3 of Waters and water rights: Oklahoma Statutes, title 82, accessed May 20, 2022, at https://oksenate.gov/sites/default/files/2019-12/os82.pdf.
Oklahoma State Legislature, 2021d, Report of water used, chap. 1020, section 12 of Waters and water rights: Oklahoma Statutes, title 82, accessed May 20, 2022, at https://oksenate.gov/sites/default/files/2019-12/os82.pdf.
Oklahoma Water Resources Board [OWRB], 2012, Oklahoma comprehensive water plan—Executive report (updated 2012): Oklahoma Water Resources Board, 151 p., accessed May 20, 2022, at https://oklahoma.gov/content/dam/ok/en/owrb/documents/water-planning/ocwp/OCWPExecutiveRpt.pdf.
Oklahoma Water Resources Board [OWRB], 2018, Oklahoma groundwater report—Beneficial Use Monitoring Program, accessed May 23, 2022, at https://oklahoma.gov/content/dam/ok/en/owrb/documents/maps-and-data/water-monitoring/oklahoma-groundwater-monitoring-report.pdf.
Oklahoma Water Resources Board [OWRB], 2024a, Maximum annual yield determinations: Oklahoma Water Resources Board Fact Sheet, 1 p., accessed February 21, 2024, at https://oklahoma.gov/content/dam/ok/en/owrb/documents/science-and-research/hydrologic-investigations/maximum-annual-yield-determinations-fact-sheet.pd f.
Oklahoma Water Resources Board [OWRB], 2024b, Interactive maps and GIS data: Oklahoma Water Resources Board database, accessed February 2024 at https://oklahoma.gov/owrb/data-and-maps/interactive-maps.html.
Oklahoma Water Resources Board [OWRB], 2024c, OWRB open data—Continuous groundwater data: Oklahoma Water Resources Board database, accessed April 17, 2024, at https://oklahoma.gov/owrb/data-and-maps/water-monitoring-and-data.html.
Oklahoma Water Resources Board [OWRB], 2024d, OWRB water use permits in Oklahoma: Oklahoma Water Resources Board database, accessed April 30, 2024, at https://www.owrb.ok.gov/maps/PMG/owrbdata_WR.html.
Oklahoma Water Resources Board [OWRB], 2024e, OWRB Ambient Water Quality Monitoring System, accessed March 13, 2024, at https://owrb.gselements.com/DataAnalysisIndex.aspx.
Oklahoma Water Resources Board [OWRB], 2025, Water permitting: Oklahoma Water Resources Board Fact Sheet, 1 p., accessed July 11, 2025, at https://oklahoma.gov/content/dam/ok/en/owrb/documents/water-permitting/water-permitting-fact-sheet.pdf.
Piper, A.M., 1944, A graphic procedure in the geochemical interpretation of water analyses: Transactions, American Geophysical Union, v. 25, no. 6, p. 914–923, accessed March 13, 2024, at https://doi.org/10.1029/TR025i006p00914.
Qi, S.L., 2010, Digital map of the aquifer boundary for the High Plains aquifer in parts of Colorado, Kansas, Nebraska, New Mexico, Oklahoma, South Dakota, Texas, and Wyoming: U.S. Geological Survey Data Series 543, accessed April 18, 2023, at https://doi.org/10.3133/ds543.
Rantz, S.E., and others, 1982, Measurement and computation of streamflow—Volume 1. Measurement of stage and discharge: U.S. Geological Survey Water-Supply Paper 2175, 284 p., accessed June 5, 2020, at https://doi.org/10.3133/wsp2175.
Robson, S.G., and Banta, E.R., 1995, Ground water atlas of the United States—Segment 2, Arizona, Colorado, New Mexico, Utah: U.S. Geological Survey Hydrologic Atlas 730–C, accessed July 11, 2025, at https://doi.org/10.3133/ha730C.
Ryter, D.W., and Correll, J.S., 2016, Hydrogeological framework, numerical simulation of groundwater flow, and effects of projected water use and drought for the Beaver-North Canadian River alluvial aquifer, northwestern Oklahoma (ver. 1.1, February 2016): U.S. Geological Survey Scientific Investigations Report 2015–5183, 63 p., accessed April 2, 2024, at https://doi.org/10.3133/sir20155183.
Sanford, J.E., 2023, Hydrologic investigation report of the Ogallala aquifer in Roger Mills County, Oklahoma, 2020: Oklahoma Water Resources Board Publication 2023-01, 44 p., accessed August 21, 2025, at https://www.owrb.ok.gov/studies/groundwater/pdf/2023-01-Hydrologic-Investigation-Report-of-the-Ogallala-Aquifer-in-Roger-Mills-County-Oklahoma-2020.pd f.
Scanlon, B.R., Reedy, R.C., and Gates, J.B., 2010, Effects of irrigated agroecosystems—1. Quantity of soil water and groundwater in the southern High Plains, Texas: Water Resources Research, v. 46, no. 9, accessed April 30, 2024, at https://doi.org/10.1029/2009WR008427.
Shivers, M.J., and Andrews, W.J., 2013, Hydrologic drought of water year 2011 compared to four major drought periods of the 20th century in Oklahoma: U.S. Geological Survey Scientific Investigations Report 2013–5018, 52 p., accessed September 12, 2023, at https://doi.org/10.3133/sir20135018.
Smith, S.J., Ellis, J.H., Paizis, N.C., Becker, C.J., Wagner, D.L., Correll, J.S., and Hernandez, R.J., 2021, Hydrogeology and model-simulated groundwater availability in the Salt Fork Red River aquifer, southwestern Oklahoma, 1980–2015: U.S. Geological Survey Scientific Investigations Report 2021–5003, 85 p., accessed July 5, 2024, at https://doi.org/10.3133/sir20215003.
Smith, S.J., Lewis, J.M., and Graves, G.M., 2015, Methods for estimating the magnitude and frequency of peak streamflows at ungaged sites in and near the Oklahoma Panhandle: U.S. Geological Survey Scientific Investigations Report 2015–5134, 35 p., accessed August 29, 2025, at https://doi.org/10.3133/sir20155134.
Sophocleous, M., 2004, Ground-water recharge and water budgets of the Kansas High Plains and related aquifers: Kansas Geological Survey Bulletin 249, 102 p., accessed April 30, 2024, at https://www.kgs.ku.edu/Publications/Books/2004/Recharge/index.html.
Stanton, J.S., Qi, S.L., Ryter, D.W., Falk, S.E., Houston, N.A., Peterson, S.M., Westenbroek, S.M., and Christenson, S.C., 2011, Selected approaches to estimate water-budget components of the High Plains, 1940 through 1949 and 2000 through 2009: U.S. Geological Survey Scientific Investigations Report 2011–5183, 79 p., accessed April 30, 2024, at https://doi.org/10.3133/sir20115183.
Stoeser, D.B., Green, G.N., Morath, L.C., Heran, W.D., Wilson, A.B., Moore, D.W., and Van Gosen, B.S., 2005, Preliminary integrated geologic map databases for the United States (ver. 1.2, December 2007): U.S. Geological Survey Open-File Report 2005–1351, accessed April 2, 2024, at https://doi.org/10.3133/ofr20051351.
Stullken, L.E., Watts, K.R., and Lindgren, R.J., 1985, Geohydrology of the High Plains aquifer, western Kansas: U.S. Geological Survey Water-Resources Investigations Report 85–4198, 86 p., 1 pl., accessed April 30, 2024, at https://doi.org/10.3133/wri854198.
Teeple, A.P., Ging, P.B., Thomas, J.V., Wallace, D.S., and Payne, J.D., 2021, Hydrogeologic framework, geochemistry, groundwater-flow system, and aquifer hydraulic properties used in the development of a conceptual model of the Ogallala, Edwards-Trinity (High Plains), and Dockum aquifers in and near Gaines, Terry, and Yoakum Counties, Texas: U.S. Geological Survey Scientific Investigations Report 2021–5009, 68 p., accessed April 10, 2024, at https://doi.org/10.3133/sir20215009.
Texas Water Development Board, 2026, Ogallala aquifer—Aquifer facts, accessed March 20, 2026, at https://www.twdb.texas.gov/groundwater/aquifer/majors/ogallala.asp.
Thornthwaite, C.W., and Mather, J.R., 1957, Instructions and tables for computing potential evapotranspiration and the water balance: Publications in Climatology, v. 10, no. 3, p. 185–311, accessed December 12, 2024, at https://udspace.udel.edu/handle/19716/35598.
Thornton, M.M., Shrestha, R., Wei, Y., Thornton, P.E., Kao, S., and Wilson, B.E., 2020, Daymet—Daily surface weather data on a 1-km grid for North America, version 4: Oak Ridge, Tenn., Oak Ridge National Laboratories Distributed Active Archive Center database, accessed December 12, 2024, at https://doi.org/10.3334/ORNLDAAC/1840.
Tian, L., and Quiring, S.M., 2019, Spatial and temporal patterns of drought in Oklahoma (1901–2014): International Journal of Climatology, v. 39, no. 7, p. 3365–3378, accessed December 11, 2023, at https://doi.org/10.1002/joc.6026.
Timur, A., 1969, Pulsed nuclear magnetic resonance studies of porosity, movable fluid, and permeability of sandstones: Journal of Petroleum Technology, v. 21, no. 6, p. 775–786, accessed March 28, 2024, at https://doi.org/10.2118/2045-PA.
Tomlinson, Z.D., Wagner, D.L., and Neel, C.R., 2024, Water-level changes in the Ogallala Panhandle aquifer (1982–2022): Oklahoma Water Resources Board Hydrologic Investigation Map 2024–01, p. 3, accessed June 26, 2024, at https://oklahoma.gov/content/dam/ok/en/owrb/documents/science-and-research/hydrologic-investigations/ogallala-panhandle-water-level-changes-1982-2022. pdf.
U.S. Department of Agriculture, 2021, Gridded Soil Survey Geographic (GSSURGO) database for the conterminous United States: Natural Resources Conservation Service database, accessed April 29, 2024, at https://gdg.sc.egov.usda.gov/.
U.S. Environmental Protection Agency, 2022, Drinking water regulations and contaminants: U.S. Environmental Protection Agency web page, accessed May 23, 2022, at https://www.epa.gov/dwregdev/drinking-water-regulations-and-contaminants.
U.S. Fish and Wildlife Service, 2024, National Wetlands Inventory—Download seamless wetlands data by State: U.S. Fish and Wildlife Service database, accessed May 6, 2024, at https://www.fws.gov/wetlands/Data/State-Downloads.html.
U.S. Geological Survey [USGS], 2015, National Elevation Dataset (NED) 1/3 arc-second DEM: U.S. Geological Survey database, accessed September 21, 2015, at https://apps.nationalmap.gov/downloader/#/10/34.77438352431586/-97.66967773437258/usgs_topo/elevation-products-three-dep/.
U.S. Geological Survey [USGS], 2024a, USGS water data for Oklahoma, in USGS water data for the Nation: U.S. Geological Survey National Water Information System database, accessed February 21, 2024, at https://doi.org/10.5066/F7P55KJN. [State water data directly accessible at https://waterdata.usgs.gov/ok/nwis.]
U.S. Geological Survey [USGS], 2024b, USGS GeoLog Locator: U.S. Geological Survey database, accessed February 16, 2024, at https://webapps.usgs.gov/GeoLogLocator/.
Vista Clara Inc., 2024, Dart, Javelin, and Javelin Wireline—Well logging: Vista Clara Inc., accessed April 11, 2024, at https://vista-clara.com/products/javelin-borehole-logging-tools/.
Vose, R.S., Applequist, S., Squires, M., Durre, I., Menne, M.J., Williams, C.N., Jr., Fenimore, C., Gleason, K., and Arndt, D., 2023, NOAA Monthly U.S. Climate Divisional Database (NClimDiv): National Oceanic and Atmospheric Administration National Climatic Data Center, accessed September 12, 2023, at https://www.ncei.noaa.gov/access/metadata/landing-page/bin/iso?id=gov.noaa.ncdc:C00005.
Wahl, K.L., and Tortorelli, R.L., 1997, Changes in flow in the Beaver–North Canadian River Basin upstream from Canton Lake, western Oklahoma: U.S. Geological Survey Water-Resources Investigations Report 96–4304, 56 p., accessed July 10, 2025, at https://doi.org/10.3133/wri964304.
Wahl, K.L., and Wahl, T.L., 1995, Determining the flow of Comal Springs at New Braunfels, Texas, in Proceedings of Texas Water '95, A Component Conference of the First International Conference on Water Resources Engineering, San Antonio, Texas, August 16–17, 1995: American Society of Civil Engineers, p. 77–86, accessed January 10, 2024, at https://www.usbr.gov/tsc/techreferences/hydraulics_lab/pubs/PAP/PAP-0708.pdf.
Walsh, D., Turner, P., Grunewald, E., Zhang, H., Butler, J.J., Jr., Reboulet, E., Knobbe, S., Christy, T., Lane, J.W., Jr., Johnson, C.D., Munday, T., and Fitzpatrick, A., 2013, A small-diameter NMR logging tool for groundwater investigations: Groundwater, v. 51, no. 6, p. 914–926, accessed April 30, 2024, at https://doi.org/10.1111/gwat.12024.
Watts, K.R., 1989, Potential hydrologic effects of ground-water withdrawals from the Dakota aquifer, southwestern Kansas: U.S. Geological Survey Water-Supply Paper 2304, 47 p., accessed May 24, 2024, at https://doi.org/10.3133/wsp2304.
Westenbroek, S.M., Engott, J.A., Kelson, V.A., and Hunt, R.J., 2018, SWB Version 2.0—A soil-water-balance code for estimating net infiltration and other water-budget components: U.S. Geological Survey Techniques and Methods, book 6, chap. A59, 118 p., accessed April 29, 2024, at https://doi.org/10.3133/tm6A59.
Westenbroek, S.M., Kelson, V.A., Dripps, W.R., Hunt, R.J., and Bradbury, K.R., 2010, SWB—A modified Thornthwaite-Mather Soil-Water-Balance code for estimating groundwater recharge: U.S. Geological Survey Techniques and Methods, book 6, chap. A31, 60 p., accessed June 5, 2020, at https://doi.org/10.3133/tm6A31.
Whittemore, D.O., Butler, J.J., Jr., and Wilson, B.B., 2015, Assessing the major drivers of water-level declines—New insights into the future of heavily stressed aquifers: Hydrological Sciences Journal, v. 61, no. 1, p. 134–145, accessed November 1, 2024, at https://doi.org/10.1080/02626667.2014.959958.
Wyatt, B., Taghvaeian, S., and Ochsner, T., 2018, Statewide estimates of potential groundwater recharge: Oklahoma State University Extension Service Fact Sheet BAE-1539, 4 p., accessed April 30, 2024, at https://extension.okstate.edu/fact-sheets/statewide-estimates-of-potential-groundwater-recharge.html.
Conversion Factors
U.S. customary units to International System of Units
Temperature in degrees Celsius (°C) may be converted to degrees Fahrenheit (°F) as follows: °F = (1.8 × °C) + 32.
Temperature in degrees Fahrenheit (°F) may be converted to degrees Celsius (°C) as follows: °C = (°F – 32) / 1.8.
Datums
Vertical coordinate information is referenced to the North American Vertical Datum of 1988 (NAVD 88).
Horizontal coordinate information is referenced to the North American Datum of 1983 (NAD 83).
Altitude, as used in this report, refers to distance above the vertical datum.
Supplemental Information
Specific conductance is in microsiemens per centimeter at 25 degrees Celsius (µS/cm at 25 °C).
Concentrations of chemical constituents in water are in milligrams per liter (mg/L).
For more information about this publication, contact
Director, Oklahoma-Texas Water Science Center
U.S. Geological Survey
1505 Ferguson Lane
Austin, TX 78754-4501
For additional information, visit
https://www.usgs.gov/centers/ot-water
Publishing support provided by
U.S. Geological Survey Science Publishing Network,
Lafayette Publishing Service Center
Disclaimers
Any use of trade, firm, or product names is for descriptive purposes only and does not imply endorsement by the U.S. Government.
Although this information product, for the most part, is in the public domain, it also may contain copyrighted materials as noted in the text. Permission to reproduce copyrighted items must be secured from the copyright owner.
Suggested Citation
Morris, A.S., Baciocco, C.A., Dale, I.A., Codner, C., Kirby, E.A., Graves, G.M., Wagner, D.L., Fiorentino, E.G., LePera, A., Sanford, J.E., and Joy, L., 2026, Hydrogeologic framework and conceptual groundwater-flow model of the panhandle and northwest parts of the High Plains (Ogallala) aquifer in Oklahoma, 1998–2022: U.S. Geological Survey Scientific Investigations Report 2026–5009, 59 p., https://doi.org/10.3133/sir20265009.
ISSN: 2328-0328 (online)
Study Area
| Publication type | Report |
|---|---|
| Publication Subtype | USGS Numbered Series |
| Title | Hydrogeologic framework and conceptual groundwater-flow model of the panhandle and northwest parts of the High Plains (Ogallala) aquifer in Oklahoma, 1998–2022 |
| Series title | Scientific Investigations Report |
| Series number | 2026-5009 |
| DOI | 10.3133/sir20265009 |
| Publication Date | May 11, 2026 |
| Year Published | 2026 |
| Language | English |
| Publisher | U.S. Geological Survey |
| Publisher location | Reston, VA |
| Contributing office(s) | Oklahoma-Texas Water Science Center |
| Description | Report: x, 59 p.; Data Release |
| Country | United States |
| State | Colorado, Kansas, Oklahoma, Texas |
| Online Only (Y/N) | Y |
| Additional Online Files (Y/N) | N |