

Assessment of Natural Gas Pipeline Construction on Stream Temperature and Turbidity in Southwestern Virginia, 2017–25
Links
- Document: Report (12.91 MB pdf) , HTML , XML
- NGMDB Index Page: National Geologic Map Database Index Page (html)
- Superseded Publications:
- Download citation as: RIS | Dublin Core
Abstract
Despite the extensive natural gas pipeline network in the United States that intersects streams and other sensitive habitats, few case studies use a comparative upstream-to-downstream approach to evaluate potential short- and long-term effects of pipeline stream crossings from pre-construction through post-restoration. In 2017, the U.S. Geological Survey, in cooperation with the Virginia Department of Environmental Quality, deployed real-time continuous stream monitoring stations upstream and downstream from six proposed Mountain Valley Pipeline stream crossings in southwestern Virginia. Water temperature and turbidity data collected at the upstream and downstream sites were compared across three periods—before stream crossing construction, during stream crossing construction, and after stream crossing construction—to determine potential influences from the pipeline stream crossing. Additionally, the monitoring network was used to notify regulators of potentially anomalous conditions throughout the entire monitoring period.
The results of this study indicate that pipeline stream crossing did not affect long-term or short-term upstream-to-downstream water temperature conditions or long-term upstream-to-downstream turbidity conditions in any of the six monitored streams. Some short-term anomalously elevated turbidity conditions were observed and attributable to pipeline stream crossing; however, the magnitudes and durations were not sufficient to alter the long-term turbidity regimes of the streams in which they were observed. The application of the monitoring network as a real-time alert system successfully alerted regulators to potentially anomalous conditions.
Introduction
The natural gas pipeline network in the United States extends across 3 million miles, serving 78.5 million people while providing electric power generation and supporting industrial applications, residential needs, commercial activities, and transportation requirements (U.S. Energy Information Administration, 2024). As of the beginning of 2024, a total of 122,552 miles of pipeline were either under construction or in the planning stages worldwide (Reed, 2024). During construction, pipeline operations can traverse sensitive aquatic habitats critical to wildlife and human activities, potentially jeopardizing the ecosystem and resources (Castro and others, 2015). Therefore, an in-depth understanding of the potential short- and long-term effects of pipeline stream crossing construction—such as changes in water temperature regimes or sedimentation—is needed, particularly for streams with sensitive habitats, ecosystems, and natural resources.
A few studies investigated the potential short- and long-term ramifications of pipeline construction on streams. Potential consequences include increases in turbidity and suspended sediment, modification of stream habitat, and pollutants entering the stream in the event of equipment failures or spills. Over longer timescales, these effects can lead to stream channel incision and lateral migration (Castro and others, 2015). Increased suspended sediment can affect biota directly by reducing light required for photosynthesis, burying habitat, and transporting particle-associated contaminates (Moyer and Hyer, 2009; Miller and others, 2023). During construction, suspended sediment could enter the stream through trench excavation and backfilling activities, erosion resulting from upland construction, and the release of discharge water from hydrostatic pipe testing or trench dewatering operations (Moyer and Hyer, 2009). A case study on the Jewell Ridge pipeline in the Appalachian Mountains of Virginia monitored turbidity as a proxy for suspended sediment concentrations and found small increases in turbidity during the construction (Moyer and Hyer, 2009). Although Virginia does not currently (2025) regulate turbidity, excess sediment is a common reason that water bodies can be listed as impaired (Miller and others, 2023).
Water temperature is a key state variable that directly and indirectly influences physical, chemical, and biological processes in streams (Bonacina and others, 2023; Leach and others, 2023; Johnson and others, 2024; van Hamel and Brunner, 2024). Some of these processes include the solubility of dissolved oxygen, toxicity of chemicals, pH, the density of water, organic matter degradation, microbial metabolic activity, and primary production (Bonacina and others, 2023). In Virginia, water temperature in surface water bodies is regulated (Virginia State Water Control Board, 2023). Although water temperature is a vital factor in stream health, few studies have examined potential changes in water temperature from pipeline construction. Of the pipeline crossing studies that have considered water temperature, all have indicated that water temperature was not affected by construction activities (Gowdy and others, 1994; Houser and Pruess, 2009).
A study spanning more than seven years, led by the U.S. Geological Survey (USGS) in cooperation with the Virginia Department of Environmental Quality (VDEQ), was designed to continuously monitor water-quality conditions at six Mountain Valley Pipeline (MVP) stream crossings before, during, and after construction. This report analyzed the high-frequency water temperature and turbidity time series and directly assessed the magnitude and duration of potential changes in water temperature and sediment conditions, and determined if they were directly attributable to pipeline stream crossing construction.
Description of Study Area
The MVP is a natural gas transmission pipeline which originates in northwestern West Virginia and ends in south-central Virginia (fig. 1). The purpose of the pipeline was to connect West Virginia’s Marcellus Shale region near Wetzel County, West Virginia to the existing Transcontinental Gas Pipe Line Company, LLC gas transmission pipeline in Pittsylvania County, Virginia (Parfomak and Vann, 2022). The 42-inch diameter pipeline spans approximately 303 miles and crosses the Appalachian Mountains. The pipeline was initially proposed in 2014, and construction began on January 1, 2018 (Parfomak and Vann, 2024); however, construction was suspended numerous times because of permitting issues in federal court. Construction was completed on June 10, 2024, and the MVP was approved to begin commercial service on June 11, 2024 (Parfomak and Vann, 2024).
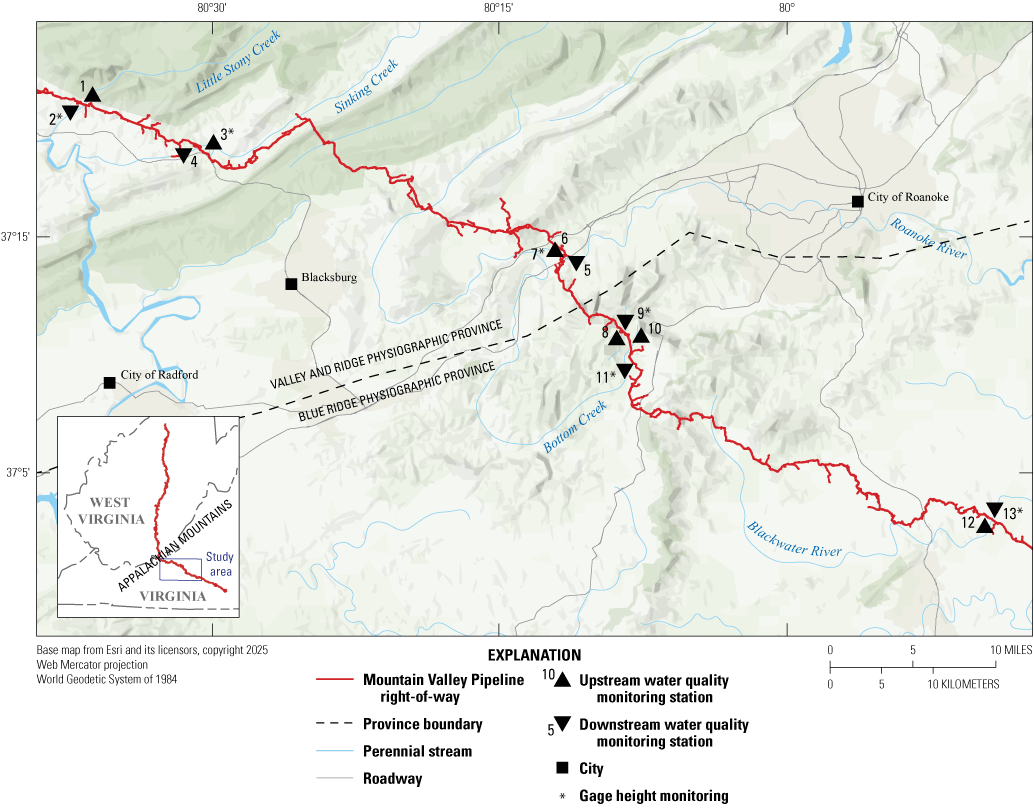
Map showing U.S. Geological Survey (USGS) water-quality and gage-height monitoring stations along the Mountain Valley Pipeline in southwestern Virginia, 2017–25. Site names and study site numbers are defined in table 1 and additional station information is available through the USGS National Water Information System (U.S. Geological Survey, 2025b).
The study sites are in the Appalachian Basin and the Valley and Ridge and Blue Ridge Physiographic Provinces, characterized by varying topography, including areas of high slope and highly erodible soils (Lévesque and Dubé, 2007; New River Geographics, LLC, 2017; Betcher and others, 2019; U.S. Geological Survey, 2025a). The karst topography in this region is characterized by vast caves and other subsurface water conduits and can pose an additional risk during construction activities (Lévesque and Dubé, 2007; Zerga, 2024).
The climate in this region is subtropical, with warm, humid summers and cold, often snowy winters, and an annual average temperature of 14.2 degrees Celsius (°C; H Brothers, Inc., 2025). The City of Roanoke, Virginia, (near the center of the study area) receives an average annual rainfall of 42.8 inches (in.) and an average snowfall of 14.7 in. (Coats and Jackson, 2020; H Brothers, Inc., 2025). The study area is predominantly forested, featuring deciduous, coniferous, and mixed stands composed of northern hardwood, cove hardwood, and various mixed deciduous species (Turner and others, 2003; Virginia Department of Conservation and Recreation, 2021). Mature trees in this area typically reach about 100 feet in height, creating a dense canopy over the mountain range. (Coats and Jackson, 2020).
Overview of Pipeline Construction
The MVP intersects approximately 139 streams and 61 wetlands across Virginia and West Virginia, primarily in rural and previously undisturbed areas (Betcher and others, 2019; Downstream Strategies and West Virginia Rivers, 2024). Various stream crossing methods were used during the construction, which are categorized in this report as either trenched or trenchless crossings. The MVP selected the stream crossing methods on the basis of the characteristics of the landscape, including stream width, the steepness of the adjacent slopes, local geology, available space for construction activities, and proximity to residential areas, roads, or environmental resources (Tetra Tech, 2021).
The trenched crossing method used was a conventional dry-ditch open-cut method (Tetra Tech, 2021). Trenched crossing methods isolate the construction site by diverting streamflow using a temporary coffer dam, allowing work to proceed in dry or nearly dry conditions (Castro and others, 2015; Reid and others, 2002). The workflow includes excavating the trench, installing the pipe in the trench, and backfilling the trench. Trenched methods can disrupt sediment during installation and after removal of the dam (Lévesque and Dubé, 2007; Reid and others, 2002).
Trenchless methods install the pipeline by drilling boreholes beneath the stream, completing the installation without disturbing the surface or streambed (Castro and others, 2015; Yan and others, 2018; New Jersey Department of Environmental Protection, 2021). The pipeline is typically installed as an arc several feet below the streambed, with suitable pipeline entry and exit locations potentially outside of the streambank margins (Castro and others, 2015). Entry and exit points are initially drilled as a pilot hole by a drill rig, then drilling fluids are used to transport drill cuttings to the surface, maintain the borehole stability, and cool the drill bit (Yan and others, 2018). Trenchless methods for stream crossings can avoid the aquatic risks by boring outside the streambanks and underneath the stream, which is particularly used in sensitive or urban areas (Castro and others, 2015). However, even trenchless methods have associated risks, including groundwater infiltration and disruption of underground stream networks.
The pipeline required a temporary and permanent right-of-way (ROW) to accommodate construction and maintenance vehicles, equipment, and material stockpiles (Tetra Tech, 2021). In the upland areas, a 125-foot-wide temporary ROW for construction and a 50-foot-wide permanent ROW for long-term maintenance were constructed (Tetra Tech, 2021). Within 50 feet of a stream crossing, the construction ROW narrows to 75 feet to preserve the riparian buffer (Tetra Tech, 2021).
After the sites were backfilled and hydrostatic tested, cleanup and restoration were completed. These activities include restoring the grade cuts to pre-construction topography and ground cover to regrow native plants, minimize erosion, and stabilize stream banks (Tetra Tech, 2021).
Monitoring Site Selection
The USGS monitored six perennial streams in cooperation with the VDEQ along the MVP. These sites were selected on the basis of the presence of threatened or endangered species, proximity to- or designation as- Virginia Tier III waters (Exceptional State Waters), high ecological integrity based on previous aquatic community, VDEQ habitat and water-quality surveys, public water supplies, upland construction areas, site access, and suitable waterflow (Virginia State Water Control Board, 2024). The monitoring sites varied in watershed area, elevation, and proximity to the pipeline crossing construction (fig. 2; table 1). Bottom Creek was crossed twice and monitored upstream and downstream at both crossing sites. In this report, upper Bottom Creek refers to the location in the headwaters near the top of the watershed, and lower Bottom Creek is located approximately 2.5 miles downstream.
The three smallest watersheds of the study area, Little Stony Creek, upper Bottom Creek, and lower Bottom Creek, all contain parts designated as Exceptional State Waters and are noted for wild trout populations, diverse benthic macroinvertebrate communities, and high-quality instream and riparian habitat conditions (Burton and Gerritsen, 2003; J. Hill, VDEQ—Blue Ridge Regional Office, oral commun., 2017; Virginia State Water Control Board, 2024). This designation identifies, maintains, and protects the waterbody from permanent or long-term degradation (Virginia State Water Control Board, 2024). Sinking Creek, the third largest watershed, is distinguished by high benthic macroinvertebrate diversity and karstic geology. Upper Bottom Creek was crossed using trenched methods, but Little Stony Creek, Sinking Creek, and lower Bottom Creek were crossed using trenchless methods.
The two largest watersheds, Blackwater River and Roanoke River, are prominent western Piedmont Physiographic Province streams and are the water sources for Smith Mountain Lake, a reservoir used for drinking water and recreation by thousands of residents and visitors each year. Although the Blackwater River has a smaller watershed, it includes two pipeline crossings within the study area: one on the tributary Maggodee Creek, upstream of the monitoring area, and another between the two monitoring stations on the Blackwater River. The Roanoke River is a vital public water supply for the City of Roanoke, Roanoke County, and the City of Salem in Virginia. Although the Roanoke River was crossed using trenchless methods and the Blackwater River was crossed using trenched methods, the pipeline at both locations was installed at a minimum depth of six feet below the streambed (Tetra Tech, 2021).
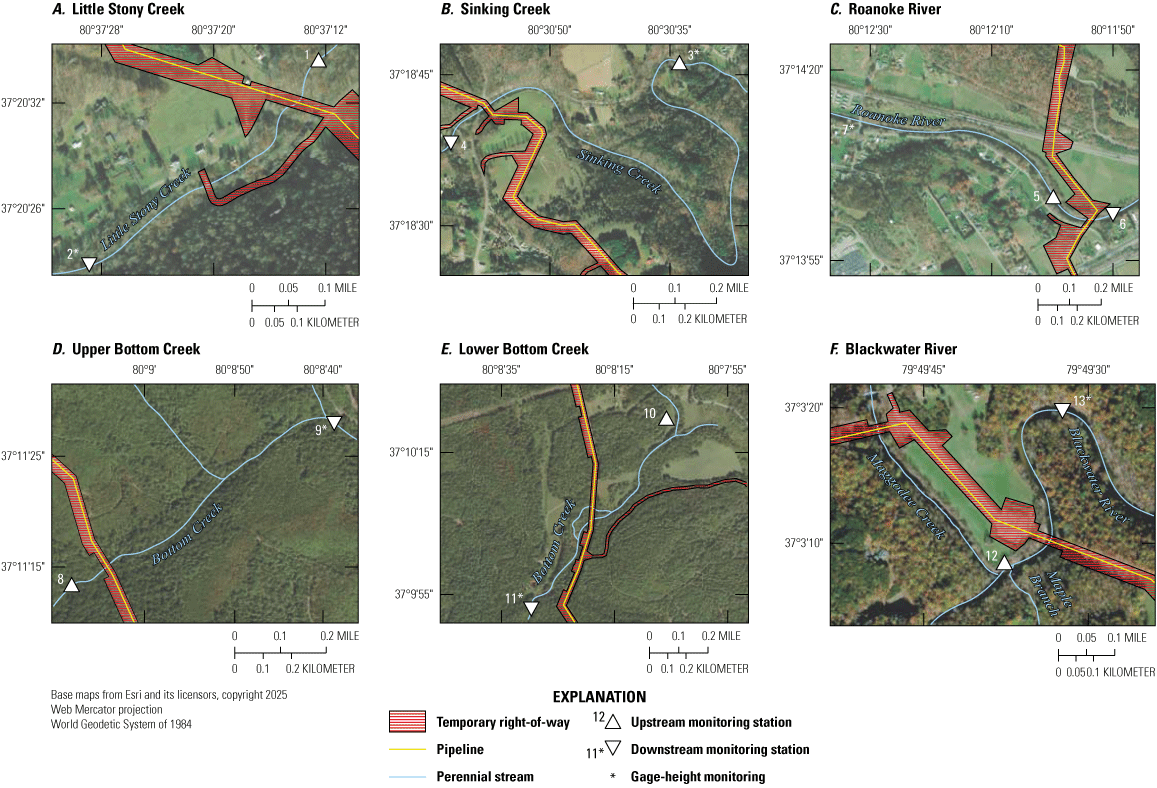
Maps showing aerial upstream and downstream monitoring locations compared to the stations along the Mountain Valley Pipeline construction in southwestern Virginia, 2017–25. A, Little Stony Creek; B, Sinking Creek; C, Roanoke River; D, Upper Bottom Creek; E, Lower Bottom Creek; F, Blackwater River. Station names and study site numbers are defined in table 1 and additional station information is available through the USGS National Water Information System (U.S. Geological Survey, 2025b).
Table 1.
Description of the 13 U.S. Geological Survey water-quality monitoring stations used to record data during the Mountain Valley Pipeline construction in southwestern Virginia, 2017–25.[Data are from U.S. Geological Survey, 2025b. Site numbers are shown on figure 1. no. number; VDEQ, Virginia Department of Environmental Quality; ID, identifier; USGS, U.S. Geological Survey; ft, foot; mi2, square mile; AB, above; NR, near; VA, Virginia; BL, below; LN, lane; Mtn, mountain; RD, road]
Purpose and Scope
The purpose of this study is to assess whether water temperature and turbidity regimes were affected by pipeline stream-crossing construction and to evaluate the utility of real-time stream monitoring alert networks during pipeline construction. These objectives were addressed through the following questions:
-
(1) Were there significant short-term or long-term anomalous water temperature or turbidity conditions in relation to pipeline stream crossing construction?
-
(2) Can stream monitoring networks be used to identify compliance issues and deliver real-time compliance alerts throughout pipeline construction?
The purpose of this report is to present the water temperature and turbidity data and anomalous conditions revealed during the study. The analysis herein is limited to answering those specific questions for the six monitored stream reaches. Potential construction-related anomalous conditions outside those specifically evaluated are possible but fall outside the scope of this report. Additionally, the study design and analysis address potential reach-specific effects only—potential overall or watershed-wide effects of pipeline construction are not evaluated from monitored data in this report.
Methods of Investigation
The interpretations presented in this report are derived from time-series data collected by continuous water-quality and water-level sensors placed upstream and downstream from natural gas pipeline stream crossings. These data were analyzed to evaluate short- and long-term water-temperature and turbidity conditions and the utility of this monitoring as a real-time compliance alert application.
Monitoring Design
The continuous water-quality and water-level monitoring network for the MVP was established at six pipeline stream crossings in 2017 (fig. 1). Each site had a paired monitoring design, with stations upstream and downstream from the pipeline stream crossing. Watershed areas ranged from less than 1 square mile (mi2) to 260 mi2 (table 1). Paired monitoring stations were used to assess downstream changes in water temperature and turbidity relative to the upstream conditions. Water levels were measured at one station per site, except for along the Roanoke River, where water level measurements were taken at upstream USGS site 02054500 (table 1). Data were reported in near real-time to support and inform the real-time compliance alert application.
Data were analyzed to assess water temperature and turbidity conditions before, during, and after pipeline stream crossing (table 2). The “before” period includes all dates from the establishment of the monitoring station to the day prior to stream crossing (2,123 to 2,289 days). Because of intermittent construction caused by permitting issues, activities not associated with the stream crossing construction, such as tree clearing and ROW construction, are included in the before period. The “during” period includes the pipeline stream crossing construction and the immediate post-crossing restoration work (12 to 208 days). The “after” period is at least one-year post-stream crossing construction (366 to 595 days).
Table 2.
Description of the Mountain Valley Pipeline stream crossing methods and construction timeline in southwestern Virginia, 2017–25.[The upstream and downstream distances from the right-of-way, in feet, were measured as the length along the stream. Dates given as year–month–day. ROW, right-of-way; ft, foot]
This report focuses solely on water temperature, turbidity, and water-level data for the entire period of record. All data were collected and quality assured in accordance with USGS Guidelines and standard procedures (Wagner and others, 2006; Sauer and Turnipseed, 2010). Continuous water-quality data were measured using YSI, Inc. (Yellow Springs, Ohio) 6-series Multiparameter Water Quality Sondes at 5-minute intervals for water temperature, specific conductance, pH, dissolved oxygen, and turbidity. Water temperature has a measurement precision of 0.01 °C and a measurement accuracy of plus or minus (±) 0.15 °C (YSI, 2012). The measurement precision for turbidity is 0.1 formazin nephelometric units (FNU) with an accuracy of ±2 percent of a measurement or 0.3 FNU, whichever is greater. Water levels were also measured at 5-minute intervals at the six monitored pipeline crossings using a TE Connectivity (Galway, Ireland) KSPI 500 transducer or OTT HydroMet (Kempten, Germany) PLS pressure transducer. Peak-stage verification was accomplished with additional water-level measurements with an Onset HOBO (Bourne, Massachusetts) water-level data logger. Turbidity measurements exceeding 1,000 FNU are outside the manufacturer’s stated measurement range and were therefore censored and treated as values greater than 1,000 FNU. This affected less than 0.15 percent of all measurements (app. 1, table 1.1). This small amount of right-censored turbidity data was inconsequential to the analytical methods used and described in the “Statistical Analysis of Water Temperature and Turbidity” subsection and did not affect the interpretation of potentially anomalously high upstream-to-downstream differences. All data in this report are publicly available on the USGS Water Data for the Nation database (WDFN; U.S. Geological Survey, 2025b).
Real-Time Alert Application
The monitoring network was used by VDEQ as a real-time alert tool for regulators of the pipeline construction. From January 2018 through April 2025, water temperature, pH, dissolved oxygen, turbidity, and specific conductance were evaluated in real-time using an automated script for potential anomalous conditions. An alert provided by the automated data review system happened when water-quality measurements were below the minimum values or above maximum values set by the thresholds defined in table 3.
A field visit could lead to one of the following four response categories by VDEQ (J. Hill and E. Jones, VDEQ—Blue Ridge Regional Office, oral commun., 2017):
-
(1) No action required by VDEQ,
-
(2) Field complaint reviewed, no additional VDEQ actions required,
-
(3) Issues were noticed during the follow-up investigation into a contamination complaint, but these were addressed in real time by the responsible party with no longer term actions needed, and
-
(4) Further action was required.
Table 3.
Description of the parameter thresholds used for the real-time alert application during the Mountain Valley Pipeline construction in southwestern Virginia, 2017–25.[Refer to table 1 for additional information about USGS sites. WT, water temperature; °C, degree Celsius; DO, dissolved oxygen; >, greater than value shown; mg/L, milligram per liter; USGS, U.S. Geological Survey; SC, specific conductance; VDEQ, Virginia Department of Environmental Quality; TB, turbidity; FNU, formazin nephelometric unit; ≤, less than or equal to; %, percentage]
Cited from Virginia State Water Control Board, 2023, Virginia Administrative Code 9VAC25–260–50.
Statistical Analysis of Water Temperature and Turbidity
Water temperature and turbidity were analyzed by graphical inspection, descriptive statistics, magnitude and duration analysis, and time-matched paired-difference testing. At each site and for each period, bootstrapped resampling and confidence intervals were computed to test if the observed median of all time-matched paired differences between upstream and downstream was significantly different from zero. Water temperature and turbidity were each further analyzed by methods suited for each specific parameter in the “Continued Statistical Analysis of Water Temperature and Continued Statistical Analysis of Turbidity” subsection.
The raw data were initially plotted over time for graphical inspection and used to calculate the minimum, first quartile (Q1), median, third quartile (Q3), and maximum for each site, station, and period. An hourly median was computed to account for lag time between the upstream and downstream stations. The downstream hourly median data were plotted against the upstream data for visual inspection. The hourly median data were used to analyze the magnitude and duration of the time-matched paired differences to identify potential short- and long-term anomalous conditions for both parameters. If there were not a complete concurrent pair, the difference was not calculated, and the given date time was removed from analysis. The hourly values were not calculated and removed from the analysis if there were less than 80 percent of the data in a given hour.
The instrument’s uncertainty for water temperature is ±0.15 °C, but turbidity measurements have an uncertainty of ±0.3 FNU or 2 percent, whichever is greater (YSI, 2012). Difference calculations required accounting for the combined uncertainty from the upstream and downstream instruments and were computed as averages for each site, station, and period as in Joint Committee for Guides in Metrology (2020; eq. 1):
wheren
is the number of observations,
i
is each instantaneous observation,
is each downstream station observation, and
is each upstream station observation.
A bootstrapping of median differences approach was used to determine if the difference between the hourly median time-matched paired observations between downstream and upstream stations differed significantly from zero. A nonparametric bootstrapping of medians approach is well-suited for large, nonnormal, and asymmetrical datasets (Mudelsee and Alkio, 2007; Johnston and Faulkner, 2021), which do not meet the assumptions of other statistical tests for dependent samples. Additionally, Johnston and Faulkner (2021) reported that bootstrapping differenced medians resulted in fewer Type I errors than the rank-based Mann-Whitney-Wilcoxon test, even though the analysis involved testing two independent samples.
The bootstrapping of median differences test used in this analysis was a one-sample test applied to the dependent sample of time-matched paired differences between the upstream and downstream stations. The median of the observed distribution of differences was computed and used as the test statistic and then compared to 10,000 bootstrapped resampled distributions with replacement. Recent studies emphasized that calculating p-values for classic null hypothesis statistical tests when testing large sample sizes is not useful or appropriate because the tests are heavily influenced by and dependent on sample size (Lin and others, 2013; Krawczyk, 2015; Gómez-de-Mariscal and others, 2021). Alternatively, recent studies suggest evaluating confidence intervals directly (Lin and others, 2013; Balkin and Lenz, 2021; Gómez-de-Mariscal and others, 2021). Upper and lower 99-percent confidence intervals were calculated for each station and period from 10,000 bootstrapped resampling, with replacement. The confidence intervals were evaluated for the hourly median differences of time-matched pairs between the downstream and upstream monitoring stations.
Results from the bootstrapping median differences tests were evaluated according to the following criteria:
-
(1) If the test’s confidence interval overlapped zero, or the observed median of the time-matched paired differences was less than or equal to the combined uncertainty from instrument accuracy, then the observed median of the time-matched paired differences was not considered significantly different from zero; and
-
(2) If the test’s confidence interval did not overlap zero and the observed median exceeded the combined uncertainty from instrument accuracy, then the observed median of the time-matched paired differences was considered significantly different from zero.
Continued Statistical Analysis of Water Temperature
The water temperature data were used to perform anomaly detection analysis on the hourly median differences between the upstream and the downstream gage sites. The magnitude and duration of the anomalies were calculated to assess potential short-term or long-term effects from pipeline stream crossing.
Water Temperature Anomaly Detection
Anomaly detection determines extreme data points that differ significantly from the dataset’s overall distribution. These anomalies are rare in the dataset (Jamshidi and others, 2022). In this study, anomaly detection was used to elucidate changes from the hourly median water temperature differences at each paired pipeline stream crossing site. The hourly median water temperature measurement at the upstream site was subtracted from the concurrent downstream water temperature.
Anomalies were detected by decomposing the hourly median difference time series to remove the seasonal patterns and the long-term, nonstationary trend. The differenced time series (downstream–upstream) was decomposed using the Seasonal and Trend Decomposition using Locally Estimated Scatterplot Smoothing (STL), which separates the time series into the following three components: seasonal, trend, and remainder (Shikwambana and Kganyago, 2023). The seasonal component represents the variation in the time series for a stated period, such as regular monthly intervals, to capture predictable patterns in the time series (Dancho and Vaughan, 2023; Shikwambana and Kganyago, 2023). The trend component reveals the long-term, low-frequency, nonstationary trends in the time series (Shikwambana and Kganyago, 2023). The remainder component represents the data remaining after removing the seasonal and the trend components (Shikwambana and Kganyago, 2023). The seasonal and trend decomposition method automatically calculated a frequency of 24 days and estimated the trend component over a window ranging from 716 to 735 days across all sites. The frequency indicates the total number of days in a cycle within the dataset, and the trend is the period that can be aggregated to visualize the data’s central tendency (Dancho and Vaughan, 2023).
Water temperature anomalies were detected using the Generalized Extreme Studentized Deviate (GESD), which uses a modified Student’s t-test to iteratively identify and remove statistically significant outliers (Dancho and Vaughan, 2023). The test statistic is compared against a critical value; when an outlier is identified and removed, the test statistic is recalculated and updated (Dancho and Vaughan, 2023). This process continues until the test statistic falls below the critical value, at which point no further outliers are removed (Dancho and Vaughan, 2023). A positive temperature anomaly indicates the downstream station is warmer than the upstream station, which is referred to as a “downstream-warmer” temperature anomaly. A negative temperature anomaly indicates that the upstream station is warmer than the downstream station, which is referred to as an “upstream-warmer” temperature anomaly. For each anomaly, the magnitude and duration were measured to characterize the event. The water temperature anomaly detection was performed in R (ver. 4.4.2; R Core Team, 2025), using the anomalize package 0.3.0 (Dancho and Vaughan, 2023).
Continued Statistical Analysis of Turbidity
Turbidity and gage height data were used to analyze storm hysteresis at each site, station, and period. Storm hysteresis analyzes the temporal dynamics of peaks and troughs between a storm’s hydrograph and a solute’s chemograph (Lloyd and others, 2016a; Liu and others, 2021). This dynamic interplay between the hydrograph and chemograph is used to create hysteresis loops, for which hysteresis metrics like a hysteresis index (HI) can be computed to gain insights into biogeochemical and watershed processes, land use, anthropogenic changes, and hydroclimatic conditions (Burns and others, 2019; Knapp and others, 2020).
Stormflow Hysteresis
Hysteresis loops are characterized by their direction and magnitude (Lloyd and others, 2016a). Clockwise loops indicate rapid delivery with the peak of the chemograph on the rising limb of the hydrograph (Baker and Showers, 2019), but counterclockwise loops indicate delayed delivery, with the peak of the chemograph on the falling limb of the hydrograph (Fovet and others, 2018).
A hysteresis index aids in the quantification of storm hysteresis by applying a consistent, representative metric to summarize a storm’s hysteresis and was computed as (Lloyd and others, 2016a) using the following equation (eq. 2):
whereis the normalized turbidity value on the rising limb of the hydrograph, and
is the normalized turbidity value on the falling limb of the hydrograph.
Slopes indicate whether a storm event was enriching (chemograph graph was becoming more positive) or diluting (chemograph was becoming more negative). A slope metric is often evaluated (Musolff and others, 2021; Millar and others, 2022; Waite and others, 2023) alongside the HIs, which characterizes the hysteresis loop as positive, negative, or no slope hysteresis (that is, slope=0). For this analysis, the slope was estimated as the line of best fit using an ordinary least squares linear regression between the natural logarithm of turbidity and the natural logarithm of gage height. The sign of the numerical value of the slope indicates whether the dominant condition of a storm event was enriching, diluting, or neither. The relation between HI and slope is compared to better characterize the types of hysteretic behaviors that emerge as the concentration of the parameter of interest is enriching or diluting. This comparison provides insights into source proximity and delivery dynamics.
High-frequency turbidity and gage height data were used to analyze hysteretic patterns at each site. Typically, discharge is used in hysteresis analysis instead of gage height; however, discharge data were not collected at most stations. Only the Roanoke River gage 02054500 had both gage height and discharge data available. When a preliminary hysteresis analysis was performed for the upstream and downstream stations of the Roanoke River using gage height and discharge, the results showed agreement.
Hysteresis analysis was performed on all storm events when gage height and turbidity data at upstream and downstream stations were available and contained 10 percent or fewer gaps in turbidity data. Prior to analysis, time-series gaps were filled with linear interpolation. Each individual storm’s hysteresis loop, hydrograph, and chemograph were inspected to evaluate if interpolated data resulting from data gaps affected the hysteresis index value. Any storm hysteresis loop in which interpolated data changed the prevailing shape and magnitude of the loop was removed from further analysis.
All analyses were performed in R (ver. 4.4.2; R Core Team, 2025). Base-flow separation, storm identification, peak identification, and rising and falling limb parsing were completed using the hydroEvents package (Wasko and Guo, 2022).
Short- and Long-Term Water Temperature Patterns
Quantifying the magnitude and duration of temperature anomalies in streams before, during, and after pipeline stream crossing is pertinent to contextualizing the potential outcomes construction may cause on the aquatic ecosystem and water quality. Short-duration thermal fluctuations can stress aquatic species, potentially resulting in sublethal impairments or mortality events under extreme conditions (Donaldson and others, 2008; Alfonso and others, 2021; Tassone and others, 2023; Johnson and others, 2024). Longer-duration warming temperatures could result in a variety of ecological consequences, such as a change to the physiology, behavior, and phenology in individual species, the migration of biota to new habitats, and potential trophic restructuring (Johnson and others, 2024). The toxicity of pollutants such as ammonia, pesticides, and polyaromatic hydrocarbons may also increase with increasing temperature (Erickson, 1985; Noyes and Lema, 2015; Berger and others, 2017; Verheyen and others, 2022). Here, the magnitude and duration of water temperature anomalies were investigated to assess the potential for short-term and long-term effects from the pipeline stream crossing on the overall thermal regime.
Comparative Analysis of Upstream and Downstream Water Temperature Conditions
The upstream and downstream temperatures showed similar seasonal variation throughout the study period, following typical East Coast seasonal temperature patterns (fig. 3A). Across all paired sites, the hourly median temperatures ranged from −2 to 30.4 °C (table 4). January consistently had the coldest median temperatures at upstream and downstream sites throughout the study. The warmest median temperatures occurred during July for all sites, except for upper Bottom Creek, where peak median temperatures were recorded in August.
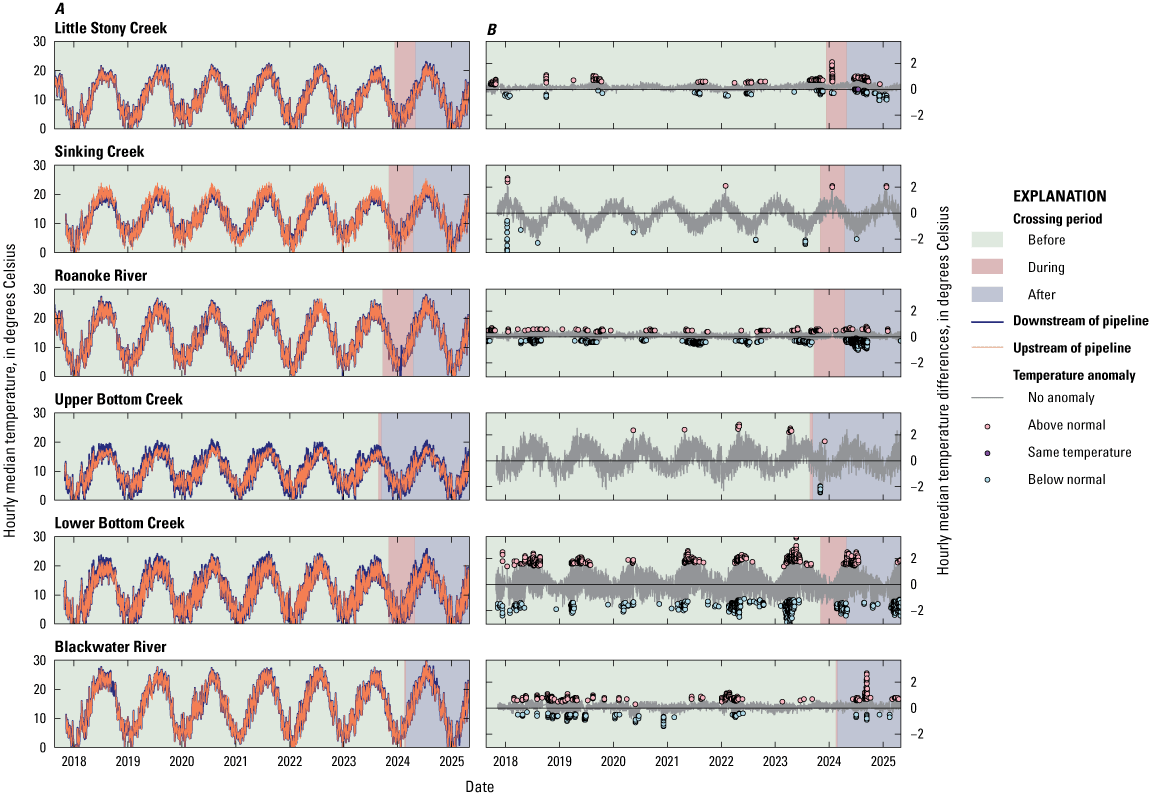
Graphs showing time series of the hourly median water temperature along the Mountain Valley Pipeline monitoring sites in southwestern Virginia, 2017–25. A, Time series of the upstream and downstream sites for each paired station; B, Time series of the downstream–upstream and the identified temperature anomalies when seasonality and long-term trends were removed.
The hourly median water temperature differences between the upstream and downstream stations were used to visually observe thermal variations on an interannual and seasonal timescale for each of the six sites (fig. 3B). A negative hourly median temperature difference indicated that the upstream station had a higher hourly median temperature than the downstream station. A positive hourly median temperature difference indicated that the downstream station had a higher hourly median temperature than the upstream station.
Sinking Creek, upper Bottom Creek, and lower Bottom Creek demonstrated the most pronounced seasonal variation throughout the monitoring period. However, upper and lower Bottom Creek showed a different pattern from Sinking Creek. At the Bottom Creek sites, the downstream station’s hourly median temperature had warmer temperatures than the upstream station during the summer (fig. 3B). In contrast, the Bottom Creek upstream station’s hourly median temperatures were higher than those at the downstream station during summer (fig. 3B). The hourly median temperature differences between upstream and downstream stations on Little Stony Creek, Roanoke River, and Blackwater River had less seasonal and interannual variation.
To further explore these patterns, temperature differences were evaluated at all sites before, during, and after construction of pipeline stream crossing. Within each site and each period, the upstream and downstream stations generally had similar temperatures (fig. 4; table 4), although there were site-specific differences. At Sinking Creek, there were higher temperatures at the upstream station compared to the downstream station at warmer overall temperatures in the before and after periods (fig. 4B). Upper and lower Bottom Creek showed warmer downstream temperatures as the temperature increased during all three periods (fig. 4D, E). In the during stream crossing period, upper Bottom Creek notably diverged from the 1-to-1 line (that is, the line that shows when downstream temperature equivalent is to upstream temperature) (fig. 4D), with a higher temperature at the downstream station compared to the upstream station.
Table 4.
Characterization of the distribution of the high-frequency (5-minute interval) data of water temperature at all sites throughout the before, during, and after stream crossing periods of the Mountain Valley Pipeline in southwestern Virginia, 2017–25.[n, number of observations; °C, degree Celsius; Min, minimum; Q1, quantile 1; Q3, quantile 3; Max, maximum]
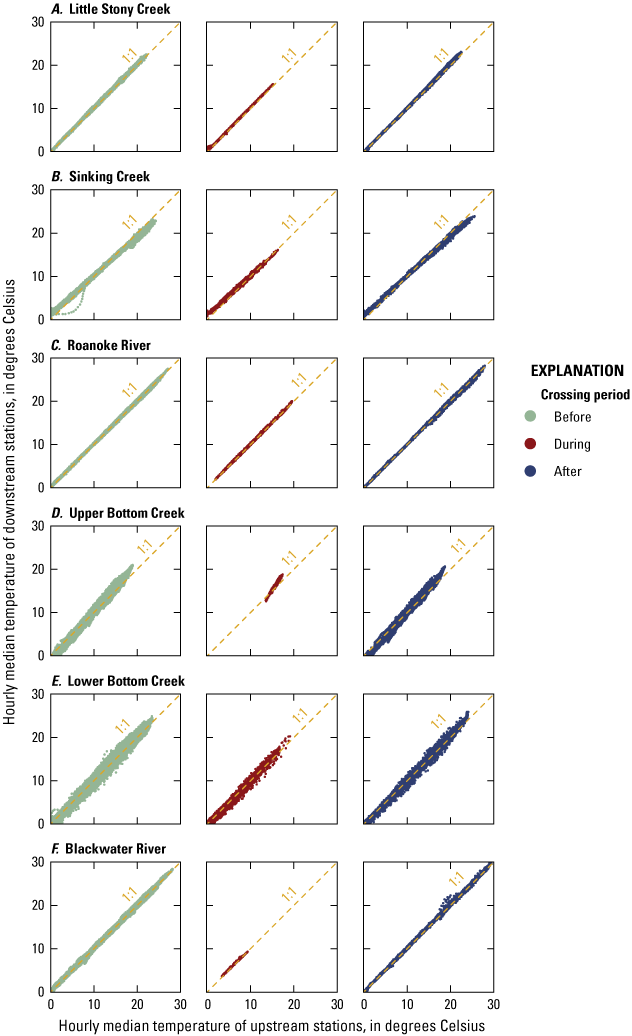
Scatterplots of each paired station along the Mountain Valley Pipeline in the before, during, and after pipeline stream crossing periods in southwestern Virginia, 2017–25. A, Little Stony Creek; B, Sinking Creek; C, Roanoke River; D, Upper Bottom Creek; E, Lower Bottom Creek, F, Blackwater River.
The finding that, in general, the upstream and downstream hourly water temperature differences were similar was supported by the bootstrapping of median differences analysis of the hourly median differences (table 5). The observed median differences ranged from the upstream warmer by 0.15 °C and the downstream warmer by 0.6 °C. Sixteen of the 18 tests had hourly median differences, less than the combined uncertainty from the instrumentation. Of these, three tests had confidence intervals that overlapped zero—lower Bottom Creek in the before and after period and upper Bottom Creek in the after period. Sinking Creek and upper Bottom Creek in the during period are the only two tests that have potential for a significant test result because the observed median of differences is greater than the combined instrument uncertainties and the confidence intervals do not overlap zero. For these two tests that yielded a significant result, the maximum median of differences is less than 1°C when uncertainty is accounted for, ranging from 0.24 to 0.66 °C at Sinking Creek and from 0.39 to 0.81 °C at upper Bottom Creek in the during period.
Table 5.
Results of the bootstrapped hourly median differences between the upstream and downstream time-matched paired water temperature differences in the before, during, and after stream crossing periods of the Mountain Valley Pipeline in southwestern Virginia, 2017–25.[A negative median temperature, lower 99-percent confidence interval, and upper 99-percent confidence interval indicate that the upstream site was warmer than the downstream site and a positive temperature value indicates that the downstream site was warmer than the upstream site. n, number of observations; °C, degree Celsius; %, percent; CI, confidence interval; ±, plus or minus]
Detection of Water Temperature Anomalies
Across the six sites, 7,284 hourly median water temperature anomalies were detected out of the 766,504 total hourly median differences, representing approximately 0.95 percent of the data. Roanoke River, lower Bottom Creek, and Blackwater River had the highest percentage of data that detected anomalies, at 1.72 percent (n [number of observations]=2,171 of 126,450), 1.55 percent (n=2,010 of 129322), and 1.45 percent (n=1,794 of 123682) of the data, respectively. Anomalies were detected at Little Stony Creek in 0.89 percent (n=1,152 of 129,656) of the data. Two sites contained fewer than 100 anomalies detected in the time series and consist of about 0.06 percent of the data—Sinking Creek (n=80 of 128,984) and upper Bottom Creek (n=76 of 128,410).
The following three types of anomalies were detected: downstream-warmer, which accounted for 3,218 anomalies (44.2 percent), upstream-warmer, which accounted for 4,030 anomalies (55.3 percent), and same-temperature anomalies, which accounted for 36 anomalies (0.9 percent). Throughout the study period, the median duration of all anomaly types was 2 hours, and the median temperature difference was 0.73 °C, with the downstream station being warmer. This report further investigates the magnitude and duration of downstream-warmer and upstream-warmer anomalies.
Downstream-Warmer Anomalies
Downstream-warmer anomalies accounted for 47 percent of all anomalies in the before period (n=1,219), 60 percent in the during period (n=68), and 34 percent in the after period (n=322). The highest number of downstream-warmer anomalies occurred in the before period, accounting for 76 percent of all downstream-warmer anomalies (n=1,219 of 1,609), likely a result of the longer duration of the period. A total of 68 and 322 downstream-warmer anomalies were observed in the during and after period, respectively. Downstream-warmer anomalies were detected at Little Stony Creek, Sinking Creek, the Roanoke River, and lower Bottom Creek in the during stream crossing period.
Downstream-warmer anomalies varied in their median magnitude for a given event from 0.3 to 3.0 °C (fig. 5). The highest temperature difference was recorded at lower Bottom Creek in the before period, when the downstream site was 3.0 °C warmer than the upstream site for six hours. The downstream-warmer anomalies had a duration of less than a day, ranging from 1 to 18 hours. Two of the longest duration events, both lasting 18 hours, were recorded at Little Stony Creek; one in the before period, with a median temperature difference of 0.60±0.21 °C, and the second in the during period, with a median temperature difference of 0.90±0.21 °C.
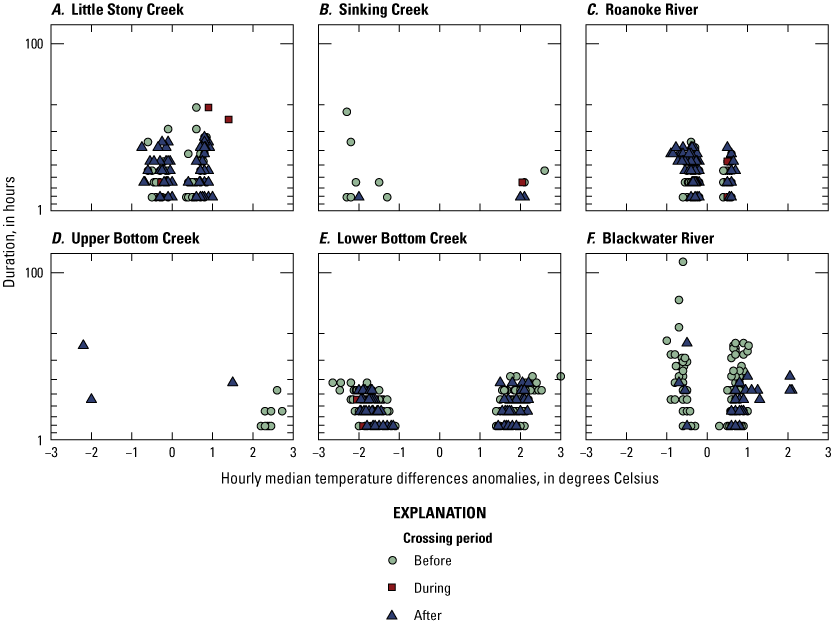
Scatterplots showing the hourly median temperature difference between the anomalies and the duration, in hours, of the anomalies in the before, during, and after stream crossing periods of the Mountain Valley Pipeline in southwestern Virginia, 2017–25. A, Little Stony Creek; B, Sinking Creek; C, Roanoke River; D, Upper Bottom Creek, E, Lower Bottom Creek, F, Blackwater River.
Upstream-Warmer Anomalies
Most upstream-warmer anomalies were detected in the before period (n=1,356 of the 2,575 or 52 percent), likely due to the longer duration of that period. In the during period, 46 upstream-warmer anomalies were detected out of the 114 total anomalies, representing 40 percent. In the after period, upstream-warmer anomalies accounted for 613 of the 953 total anomalies, or 64 percent. These anomalies were observed only at Little Stony Creek and lower Bottom Creek in the during pipeline stream crossing period. Upstream-warmer anomalies were most prevalent at Sinking Creek (n=62 of 80 anomalies, or 77.5 percent), followed by the Roanoke River (n=1,626 of 2,172, or 75 percent) and lower Bottom Creek (n=1,020 of 2,010, or 51 percent).
During the study period, the median duration of all anomaly types was 2 hours, and the median temperature difference was 0.42 °C, with the upstream station being warmer. The upstream-warmer anomalies varied in their magnitude from 0.050 to 2.65 °C (fig. 5). The highest temperature difference was recorded at lower Bottom Creek in the before period, when the upstream site was 2.65 °C warmer than the downstream site and persisted for 5 hours. The longest lasting upstream-warmer temperature anomaly persisted at Blackwater River for 134 hours, with a median temperature magnitude of 0.60±0.21 °C.
Discussion of Water Temperature Results
At all monitored locations, the upstream and downstream site exhibited a similar thermal behavior within each evaluated period. The differences between the paired sites were minimal, with the range between the lower and upper 99-percent confidence intervals from 0 to 0.1 °C. Twelve of 18 tests had a difference in the upper and lower 99-percent confidence intervals of 0 °C. The median of the hourly median differences was also small, from −0.15 to 0.6 °C for all sites and periods. Of the 18 tests performed, only Sinking Creek in the during period and upper Bottom Creek in the during period were significant. At both sites in the during period, the medians of hourly median differences exceeded the combined uncertainty of the instrumentation, and the confidence interval did not include 0. Although these tests are statistically significant, temperature differences at both sites are less than 1 °C: 0.24–0.66 °C at Sinking Creek and 0.39–0.81 °C at upper Bottom Creek.
To distinguish any potential differences between the upstream and downstream temperatures, water temperature anomaly detection was used to remove the effects of seasonality and long-term changes to detect potential anomalous events. There were downstream-warmer and upstream-warmer anomalies across all study sites; however, these anomalies constituted approximately 1 percent of the total data collected. Most of the downstream-warmer and upstream-warmer anomalies were identified in the before period because of the length of the before period in comparison to the during and after. Sites that used the trenchless construction stream crossing method detected downstream-warmer anomalies in the during period, whereas the two sites using trenched stream crossing methods did not detect any anomalies; however, this disparity is more closely linked to the duration of the stream crossing period than the crossing technique itself. The trenched construction period lasted 12 days at Blackwater River and 21 days at upper Bottom Creek; however, the trenchless stream crossing period had a duration ranging from 141 to 208 days. Additionally, some of the sites showed a notable seasonality that was captured in the during period. Specifically, at lower Bottom Creek and the Roanoke River, downstream-warmer and upstream-warmer anomalies occurred in the late-spring to early-summer months.
The magnitude and duration of the downstream-warmer and upstream-warmer anomalies were low in magnitude and short in duration. The median duration across all anomaly types was 2 hours, and the median magnitude of 0.73±0.21 °C, with the downstream station warmer than the upstream. Little Stony Creek, Roanoke River, lower Bottom Creek, and Blackwater River yielded comparable ranges for upstream- and downstream-warmer anomalies, demonstrating consistent patterns across different periods. The magnitudes and duration of the anomalies in the during stream crossing period aligned closely to those of the before and after stream crossing periods.
The median duration of upstream-warmer and downstream-warmer anomalies was 2 hours, indicating that, in general, temperature anomalies in the streams did not persist for long durations. The longest downstream-warmer anomaly lasted 18 hours, while the longest upstream-warmer anomaly persisted for 134 hours. Although longer duration anomalies exist, 61 percent of the upstream-warmer anomalies (n=380 of 610) and downstream-warmer anomalies (n=441 of 722) were less than or equal to 2 hours. About 89 percent of the anomalies lasted 4 hours or less, including 649 of 722 upstream-warmer anomalies (90 percent) and 539 of 610 downstream-warmer anomalies (88 percent), suggesting that most of the anomalies were short in duration.
The median magnitude of the downstream-warmer anomalies was 0.74 °C, and the median magnitude of the upstream-warmer anomalies was 0.43 °C. Some sites had a consistent typical range in the upstream-warmer and downstream-warmer anomalies, such as Little Stony Creek, Roanoke River, and lower Bottom Creek (fig. 5). All sites showed similar temperature magnitudes throughout the before, during, and after periods. Most temperature differences between the upstream and downstream sites were small, with about 63 percent of downstream-warmer anomalies (n=385 of 610) and 68 percent of upstream-warmer anomalies (n=493 of 722) measuring less than or equal to 1 °C. Ninety percent of the downstream-warmer anomalies were less than or equal to 2 °C difference between upstream and downstream, and an even higher percentage, 97 percent of the upstream-warmer anomalies (n=702 of 722). During the 7-year study period, the magnitude of the temperature anomalies remained low; most detected anomalies were within a 2 °C difference.
One criterion applied in the real-time alert application included flagging instances when the temperature differences between upstream and downstream exceeded the natural temperature variability threshold, defined as 1–3 °C depending on the stream class (Virginia Administrative Code 9VAC25–260–50; Virginia State Water Control Board, 2023). None of the study sites recorded hourly temperature differences exceeding 3 °C, indicating that the temperature anomalies generally remained within the expected range for Virginia. The single temperature anomaly difference had a median temperature difference of exactly 3 °C. This anomaly occurred during the before period at lower Bottom Creek from May 23, 2023, at 12:00 to May 23, 2023, at 17:00. However, the small number of hourly median temperature anomalies with respect to the entire dataset, combined with the low magnitude and brief duration of anomaly events, suggests that the pipeline stream crossing had minimal consequences on the thermal regime downstream.
The anomaly detection method used in the analysis removes the effect of long-term trends in the water temperature but does not remove the effect of short-term changes in temperature. Temperature is a highly variable metric that is largely influenced by air temperature and environmental conditions, including channel geometry, water depth, tributary confluences, groundwater seeps, stream discharge levels, and microhabitat characteristics (Caissie, 2006; Siegel and Volk, 2019; Mejia and others, 2020; Gendaszek and Appel, 2022). Although air temperature was not directly measured in this study, stream water temperature increases about 0.6–0.8 °C for every 1 °C increase in air temperature (Morrill and others, 2005). However, higher elevations or groundwater-dependent watersheds are less sensitive to temperature changes (Siegel and Volk, 2019). For example, direct field observations indicated that Sinking Creek receives groundwater input downstream from the upstream monitoring station. Others have also observed groundwater inputs throughout the Sinking Creek watershed (Christensen and others, 2022). Groundwater discharge cools surface water during the summer (Gendaszek and Appel, 2022), contributing to more upstream-warmer temperature anomalies. As a result, the upstream station was warmer during the summer months (fig. 3). The confluence of tributaries could affect temperature differences at the upstream or downstream site. At the Blackwater River, two tributary confluences are near the Blackwater River upstream station (fig. 2F), which could affect conditions observed at the upstream or downstream location. The confluence upstream from the Blackwater River upstream site, Maggodee Creek, was also crossed by the MVP. Maggodee Creek, which has a watershed area of 45.5 mi2 (U.S. Geological Survey, 2019) was crossed using trenched methods and overlapped construction on the Blackwater River for 10 days.
Short- and Long-Term Patterns of Turbidity
Increased turbidity can degrade water quality, adversely affect food webs in freshwater ecosystems, and disrupt ecosystem function. Short-term increases in turbidity have been associated with decreases in primary production, zooplankton abundance, benthic habitat diversity, hyporheic exchange, invertebrate abundance, and local fish populations (Henley and others, 2000; Huenemann and others, 2012; Honious and others, 2022). Longer duration turbidity increases have been shown to exacerbate and prolong the potential effects that have been associated with short-term turbidity increases (Henley and others, 2000). In this study, the magnitude and duration of potential anomalous turbidity conditions resulting from pipeline stream crossing were investigated and compared to each stream’s turbidity regime.
Turbidity Conditions and Comparison of Upstream Versus Downstream Stations
Upstream median turbidity ranged from 0.5 to 7.2 FNU across all sites and periods, and the downstream turbidity ranged from 0.6 to 8.3 FNU (table 6). Higher turbidity at upstream and downstream stations was typically associated with increased gage height throughout the study period and lower turbidity at low gage height, as expected (figs. 6, 1.1, 1.2, 1.3, 1.4, 1.5 and 1.6). The Blackwater River had the highest magnitude turbidity values across all summary statistics; upper Bottom Creek had the lowest (table 5). At all sites and during all periods, the minimum, Q1, median, and Q3 are close together in magnitude compared to their maximums.
Little Stony Creek, Roanoke River, upper Bottom Creek, and Blackwater River showed general agreement in the time-series data throughout the study period. Sinking Creek turbidity peaks during storms were consistently higher at the upstream stations before the stream crossing and in the during and after crossing periods were closer in magnitude. Lower Bottom Creek had consistently higher turbidity at the downstream station compared to the upstream station throughout the study period and anomalously high magnitude turbidity at the downstream station when compared to the upstream station in the during crossing period.
Table 6.
Descriptive statistics of turbidity for each site, station, and stream crossing period of the Mountain Valley Pipeline in southwestern Virginia, 2017–25.[Statistics were calculated using the raw 5-minute interval data. n, number of observations; FNU, formazin nephelometric units; Min, minimum; Q1, quantile 1; Q3, quantile 3; Max, maximum]
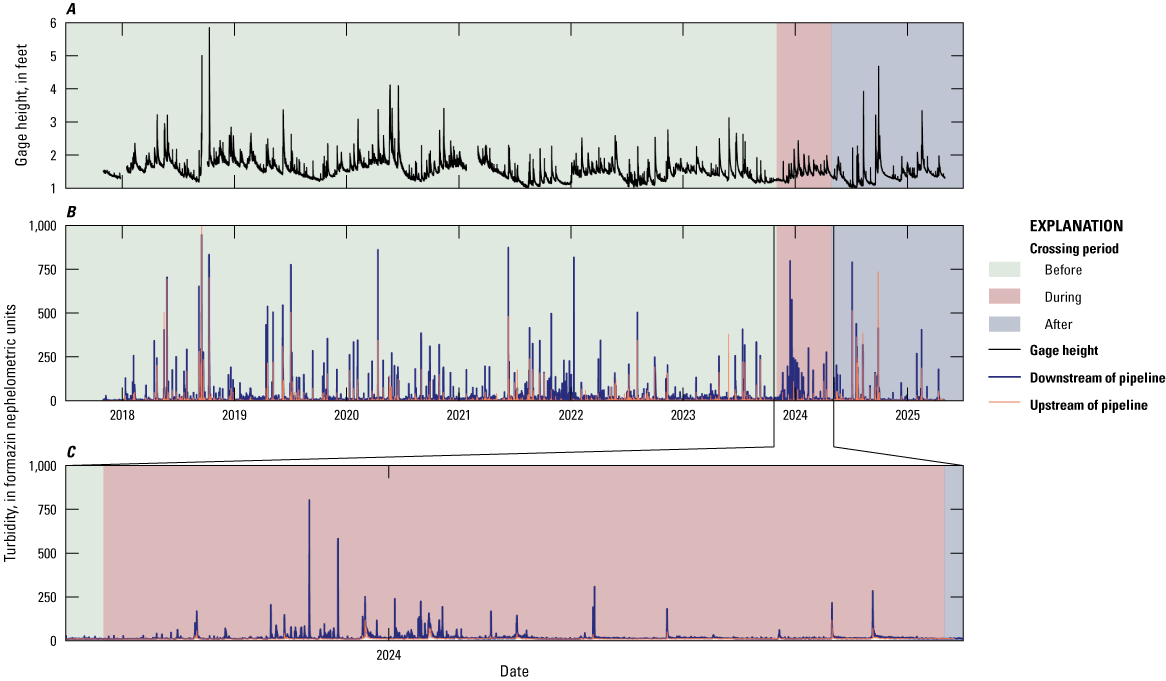
Graphs showing the high-frequency turbidity and gage height time series at lower Bottom Creek in the before, during, and after stream crossing periods of the Mountain Valley Pipeline in southwestern Virginia, 2017–25. A, Gage height at downstream lower Bottom Creek (0205373422); B, Turbidity upstream (0205373228) and downstream (0205373422) from lower Bottom Creek; C, Turbidity in the during stream crossing period. Refer to table 1 for additional information about USGS sites.
Differences in hourly median turbidity values between downstream and upstream stations show anomalous behavior in the during crossing period at lower Bottom Creek, as shown by the red points ascending the y-axis without a corresponding signal of similar magnitude on the x-axis (fig. 7). Most observations at lower Bottom Creek in the during stream crossing period plot to the left of the 1-to-1 line, suggesting that the downstream station frequently recorded higher turbidity values than the upstream station. The Blackwater River in the during stream crossing period had a pattern similar to the Roanoke River in the after stream crossing period with downstream turbidity exceeding upstream turbidity in the during stream crossing period as did the Roanoke River in the after crossing period. The other sites and periods generally are close to the 1-to-1 line or are evenly distributed about it.
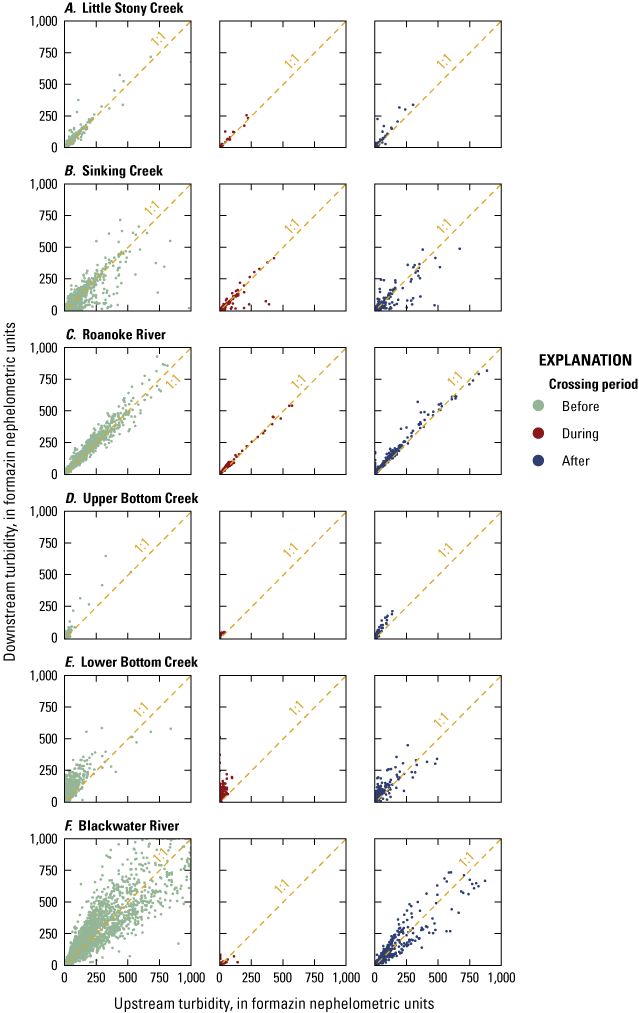
Hourly median turbidity at downstream station versus upstream station in the before, during, and after stream crossing periods of the Mountain Valley Pipeline in southwestern Virginia, 2017–25.
Of the 18 comparisons (6 matched sites×3 periods), 15 had time-matched differences of less than or equal to 5 FNU during 90 percent of the time series. The remaining three comparisons had differences less than or equal to 5 FNU for 80 to 89 percent of the time series (table 1.2). Differences between downstream and upstream stations that were greater than 100 FNU represented less than or equal to 0 to 0.8 percent of the time series across all matched sites (table 1.2).
Distributions of median hourly turbidity differences among stations show that most of the observations across all sites and periods were close to zero (fig. 8). At Sinking Creek, the largest magnitude differences occurred in the before crossing period, with more total observations showing higher turbidity at the upstream station. The Roanoke River had some larger magnitude differences in the after crossing period, when the downstream station exceeding upstream levels, likely attributable to the presence of the pipeline ROW. At upper Bottom Creek, a small number of observations showed larger differences in the before crossing period, when the downstream station recorded higher turbidity. In the after crossing period, a similarly small number of larger differences were observed when the upstream station recorded higher values. At lower Bottom Creek, the before and during crossing periods showed a consistent signal of higher turbidity at the downstream station, with slightly more and greater magnitude observations occurring in the during crossing period. Most differences at lower Bottom Creek were still close to zero. At Blackwater River, all periods showed most differences near zero, with a more normal distribution and roughly equal numbers of observations greater than and less than zero. At Little Stony Creek, turbidity differences were close to zero for all periods.
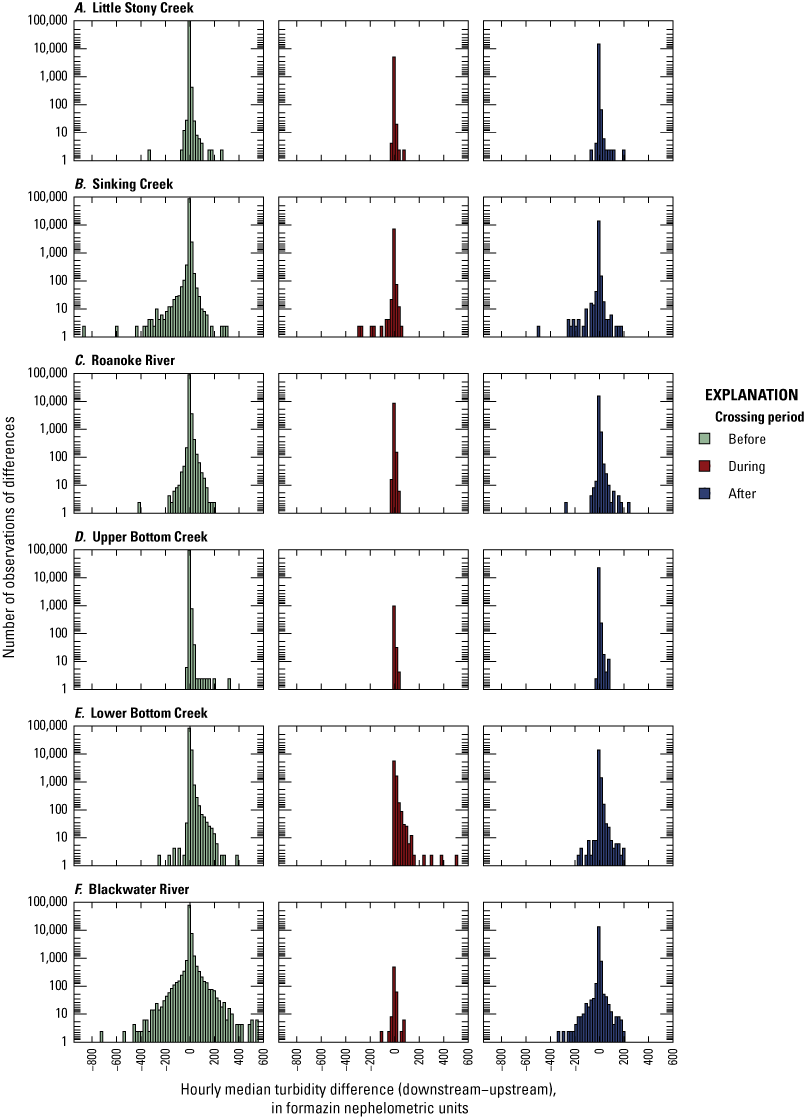
Histograms showing the turbidity differences between the upstream and the downstream sites in the before, during, and after stream crossing periods of the Mountain Valley Pipeline in southwestern Virginia, 2017–25, compared to the number of observations. A positive turbidity indicated the downstream turbidity was higher, and a negative turbidity indicated the upstream turbidity was higher.
The bootstrapped median differences confidence intervals tests resulted in 3 of the 18 tests confidence intervals overlapping zero, suggesting strong evidence that the median does not differ significantly from zero. Nine additional tests (12 total tests) yielded observed medians of the time-matched paired differences that were smaller than the uncertainty associated with instrument accuracy, suggesting that these tests did not differ significantly from zero (table 7). The six remaining tests overcame the uncertainty from instrument accuracy and had confidence intervals that did not overlap zero, included Little Stony Creek in the during stream crossing, upper Bottom Creek in the during stream crossing, lower Bottom Creek in the before, during, and after stream crossing periods, and Blackwater River in the during stream crossing period, suggesting that the median of the time-matched paired differences differed significantly from zero for these tests. When the uncertainty from instrument accuracy is accounted for in the six tests that yielded a significant difference, only two tests had a median of the differences that was reliably over 1 FNU, the before and during stream crossing periods at lower Bottom Creek, which ranged from 1.19 to 2.11 FNU and 1.42 to 2.38 FNU, respectively. These two tests at lower Bottom Creek represent the largest magnitude upstream-to-downstream differences; however, the differences were minor in practical terms, were present in the before stream crossing period, and had the smallest observed median of upstream-to-downstream differences in the after crossing period.
Table 7.
Results of the bootstrapped median of hourly median differences between the upstream and downstream time-matched paired turbidity observations in the before, during, and after stream crossing periods of the Mountain Valley Pipeline in southwestern Virginia, 2017–25.[n, number of observations; FNU, formazin nephelometric unit; %, percent; CI, confidence interval; ±, plus or minus]
Storm Hysteresis Patterns of Turbidity
At all stations and for all periods, the median hysteresis index (HI) and median slope were positive, indicating turbidity tended to increase during storm events, compared to ambient conditions, and peaked on the rising limb of the hydrograph (fig. 9). A similar pattern was observed for all individual storm events at each station and across all periods, which is consistent with other stream turbidity hysteresis studies (fig. 1.7; Lloyd and others 2016b; Waite and others, 2023). Throughout the study period, positive HI values were observed at upstream and downstream stations the following times: 182 times at Little Stony Creek, 137 times at Sinking Creek, 59 times at Roanoke River, 98 times at upper Bottom Creek, 193 times at lower Bottom Creek, and 109 times at Blackwater River. Negative HI values were observed 2 times at Little Stony Creek, 18 times at Sinking Creek, 37 times at Roanoke River, 0 times at upper Bottom Creek, 2 times at lower Bottom Creek, and 36 times at Blackwater River; however, many HI values were close to zero, indicating no hysteresis. A threshold of −0.05 to 0.05 HI was used following the guidance of Waite and others (2023) as a range of HI values within which hysteresis is not present. The lack of hysteresis was noted 12 times at Little Stony Creek, 25 times at Sinking Creek, 27 times at Roanoke River, 2 times at upper Bottom Creek, 13 times at lower Bottom Creek, and 47 times at Blackwater River.
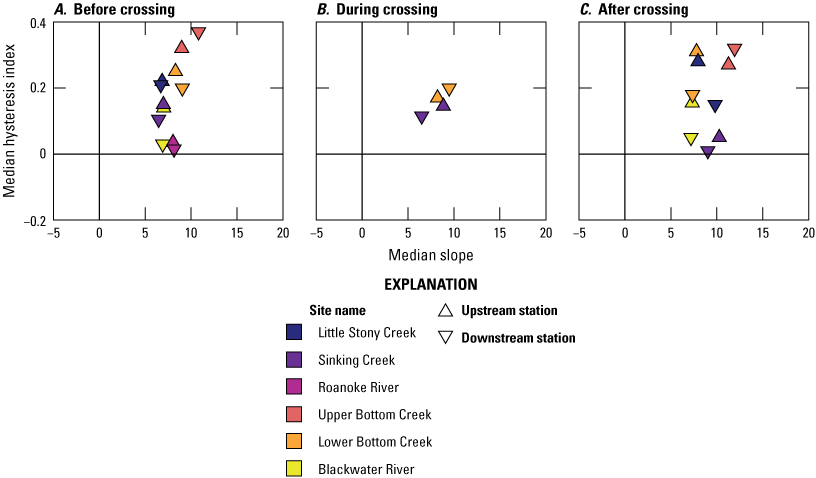
Graph showing the relations of median hysteresis index to median slope of the upstream and downstream site at all six monitored stream crossing locations of the Mountain Valley Pipeline (MVP) in southwestern Virginia, 2017–25. A, Before crossing; B, During crossing; C, After crossing.
Discussion of Turbidity Results
Turbidity analyses were used to evaluate whether pipeline stream crossing resulted in increased turbidity conditions in the during period relative to the turbidity regime measured using high-frequency data from sensors over the 7-year study period. Turbidity is a parameter of interest and importance because of its strong and well-established relation to suspended sediment concentration (Stubblefield and others, 2007; Rügner and others, 2013; Miller and others, 2023; Porter, 2025). Sedimentation in streams has been associated with pipeline stream crossings in previous studies (Lévesque and Dubé, 2007; Moyer and Hyer, 2009), and sedimentation has been shown to adversely affect instream biota and ecological functions (Henley and others, 2000; Wilber and Clarke, 2001). Measuring turbidity at a high frequency provided additional information about the short-term anomalous events observed. According to the EPA (2006), of the 29 States that had a threshold for turbidity, 10 FNU was the most common threshold. Fifteen States set thresholds based on comparison to background conditions, 12 have absolute turbidity thresholds, and 2 use a combination of both, with most States having stricter thresholds for streams that support colder water aquatic communities. All observed median upstream-to-downstream differences in this study were below established turbidity thresholds for all States that have a statute for turbidity, except for New Hampshire’s most protected streams that are classified as such whose threshold is 0 FNU above background conditions.
Results from the analysis of the high-frequency turbidity data at all six monitored stream crossing sites did not show evidence of long-term, persistent effects from pipeline stream crossing. Short-term, anomalously high turbidity conditions observed during stream crossing in this study were neither of sufficient magnitude nor duration to produce upstream-to-downstream median turbidity differences exceeding established States thresholds or levels known to alter ecological function. Across all sites, no significant turbidity difference was observed between the before and after stream crossing periods, which is consistent with similar studies in the region (Moyer and Hyer, 2009).
Storm turbidity hysteresis exhibited positive HI and positive slopes, indicating that most storms peak on the rising limb of hydrographs, which is consistent with similar studies (Lloyd and others, 2016a, b; Fovet and others, 2018; Waite and others, 2023). The positive HI indicates rapid flushing from a proximal source. The results of the hysteresis analysis; however, generally show consistency between upstream and downstream stations at all sites and periods. The storm hysteresis patterns add to the body of evidence that no persistent changes in turbidity were identified.
Previous studies of pipeline stream crossings have primarily focused on comparing crossing methods at a single downstream station and monitoring suspended sediment concentration and total suspended solids (Reid and others, 2002; Lévesque and Dubé, 2007). However, many of these studies are limited by low sample-collection frequency, short durations (less than 1 year), or a lack of monitoring across multiple stream crossings within the same study. However, Moyer and Hyer (2009) collected high-frequency turbidity data before, during, and after two pipeline stream crossings, which used two different crossing methods. Moyer and Hyer (2009) provided evidence that the trenchless crossing method had little effect on turbidity conditions; however, in this study, the largest magnitude anomalous turbidity observation occurred at lower Bottom Creek, which was crossed using the trenchless method. This might suggest that other factors might be driving these short-term anomalous turbidity conditions, such as ROW construction activities, failed sediment controls, high soil erosivity, or natural watershed processes like bank erosion. The median differences in Moyer and Hyer (2009) and in this report generally show low median turbidity differences between upstream and downstream stations across all streams and periods.
Utility of Real-Time Alert Application
Out of the total 44,256,853 measurements from the USGS monitoring stations, a total of 137,263 (0.3 percent) flags were identified using the USGS real-time data when the parameter values exceeded parameter-specific water-quality standards or thresholds (table 8).
Table 8.
Summary of the number of flags issued by the real-time alert application at all six monitored stream crossing locations of the Mountain Valley Pipeline in southwestern Virginia, from January 2018 to June 2025, by field parameter.Alerts could be caused by a flag from the real-time alert system, self-reported by MVP, or a reported field complaint. A total of 464 alerts were produced from the real-time alert application from January 2018 to June 2025 among all six crossing sites. Out of the 464 alert notices, 253 (55 percent) resulted in a compliance action, and 211 (45 percent) resulted in no compliance issues.
Application of the real-time alert system provided timely information about stream conditions to regulators, installers, and the public, which can contribute to minimizing potential short- and long-term effects and improving regulatory agencies’ responses (Storey and others, 2011). Most of the real-time alerts led to compliance issues being identified on site, issues that likely would not have been detected without the alert system. Overall, the real-time alert system helped address and resolve compliance issues in a timely manner.
Summary
Construction of the nationwide natural gas pipeline network in the United States requires crossing streams, rivers, and other waterbodies that serve as sources of drinking water and support sensitive aquatic biota and habitat. Stream crossings, whether using trenched or trenchless methods, have the potential to alter downstream water quality in the short and long term. Elevated levels of suspended sediments or increased water temperatures may reduce the water quality, degrade aesthetics, and alter the aquatic ecosystems. The U.S. Geological Survey began a continuous monitoring program in 2017 to study the water-quality changes from preconstruction background conditions through one-year postrestoration at six sites upstream and downstream. This report (1) presents the site-water temperature and turbidity data from all three monitored periods; (2) describes the potential short- and long-term effects of pipeline crossing construction on watersheds of varying sizes; and (3) summarizes the results from statistical testing of water temperature and turbidity; (4) identifies and explains water temperature anomaly testing; and (5) analyzes storm-related hysteretic behavior.
The water temperature at all sites ranged from −2 to 30.4 degrees Celsius (°C), with maximum temperatures in July and August and minimum temperatures in January. The bootstrapped statistical tests of the median between the differences in water temperature upstream and water temperature downstream of pipeline crossings indicated that only upstream versus downstream water temperatures in Sinking Creek and upper Bottom Creek in the during period were statistically significant. At all sites, the bootstrapped upper and lower 99-percent confidence intervals ranged from 0 to 0.1 °C, which is less than the combined uncertainty of the instruments. Hourly median difference water temperature anomalies were used to identify differences in the time series after the removal of seasonal and long-term trends. Anomalies were identified in 0.95 percent of the data across all the sites (n=7,284 of 766,504). All downstream-warmer anomalies were less than or equal to 18 hours, with most of the upstream- and downstream-warmer anomaly events lasting 2 hours or less (61 percent). Most of the upstream and downstream anomaly differences were small, with 68 percent of the upstream-warmer and 63 percent of the downstream-warmer less than or equal to 1 °C. In general, the thermal regime between upstream and downstream was characterized by low frequency, short duration, and low magnitude anomalies consistently throughout the monitoring period, suggesting that temperature changes could not be solely attributed to pipeline stream crossing.
The turbidity at all sites ranged from 0 to greater than 1,000 formazin nephelometric units and generally increased with higher water levels. Bootstrapped statistical tests of median differences in upstream and downstream turbidity of pipeline crossings showed no significant difference between the turbidities upstream and downstream of the crossing. An evaluation of the median hysteresis index compared to the median slope at each site suggests there was no change in the timing or rate of sediment delivery during storms between the before and after periods. All sites and periods examined showed a positive median hysteresis index and a positive median slope. All sites were analyzed for hysteresis in the before and after period; Sinking Creek and lower Bottom Creek were the only streams analyzed in the during period because storms were not captured at the other sites. A positive median slope indicates solute enrichment during a storm, which is limited by the connectivity or transport capacity of the flow. A positive hysteresis index indicates that most of the sediment was moved on the rising limb of the hydrograph and there was a rapid flush of a proximal source. If excess sediment were introduced during pipeline stream crossing, the median HI might have shifted, either more positive or negative, or shown higher magnitude slopes. Some of the sites' hysteresis index values were close to zero, which could mean there was no hysteresis.
The Virginia Department of Environmental Quality used the real-time alert system to identify potential compliance issues at all six crossings. The system monitored water temperature, specific conductance, pH, dissolved oxygen, and turbidity. The alert flags were configured to detect measurements, or differences between upstream and downstream measurements that fell below a minimum standard, exceeded a maximum standard, or exceeded a site-specific threshold. The alert system began in January of 2018. During the entire monitoring period, alerts were triggered just 0.3 percent of the time, resulting in 464 total alert notices. Of these, 81 percent (374 notices) led to site visits. Compliance issues were confirmed in 253 instances, representing 55 percent of all alerts. The real-time alert system quickly identified and resolved compliance issues during pipeline stream crossing. Its use demonstrates the potential to minimize short- and long-term effects of pipeline construction.
No relation was observed between crossing method (that is, trenched or trenchless) and instream turbidity or water temperature. Upper Bottom Creek and Blackwater River were crossed using trenched methods, and Little Stony Creek, Sinking Creek, the Roanoke River, and lower Bottom Creek were crossed using trenchless methods. No significant differences were observed in the median turbidity differences or in changes to the hysteretic behavior attributable to the crossing method. Anomalies detected in the during and after stream crossing periods were inconsistent and could not be clearly attributed to crossing methodology because they may have resulted from the short duration of these periods. The only discernable effect from any crossing method was that the trenched sites had a shorter crossing duration, which limited the capture of hydrologic variability compared to the before or after periods.
Findings from this multiyear study provide evidence that pipeline stream crossing did not strongly affect water temperature or turbidity. Although some short-term anomalous conditions were observed in the upstream–downstream comparative study, overall water temperature and turbidity regimes remained consistent throughout the entire monitoring period. The synthesis of data from six streams in mountainous southwestern Virginia did not indicate that pipeline stream crossing caused substantial changes to water temperature and turbidity regimes at the monitored locations. This study also highlights the abundant utility of deploying real-time continuous monitors during pipeline construction. Regulatory agencies or other stakeholders can use these real-time monitors to promptly identify potential compliance issues and work to investigate them and resolve any potential issues quickly. The real-time alert application for this study flagged 464 potential compliance issues, of which 253 (55 percent) were successfully investigated and led to an action by the Virginia Department of Environmental Quality.
Acknowledgments
The authors wish to thank the numerous U.S. Geological Survey (USGS) staff who have contributed to the design, maintenance, and operation of this study since 2017. Technical reviews by Samuel Miller and Spencer Tassone of the USGS strengthened the report, and their comments are greatly appreciated.
References Cited
Alfonso, S., Gesto, M., and Sadoul, B., 2021, Temperature increase and its effects on fish stress physiology in the context of global warming: Journal of Fish Biology, v. 98, no. 6, p. 1496–1508, accessed July 30, 2025, at https://doi.org/10.1111/jfb.14599.
Baker, E.B., and Showers, W.J., 2019, Hysteresis analysis of nitrate dynamics in the Neuse River, NC: Science of the Total Environment, v. 652, p. 889–899, accessed July 21, 2025, at https://doi.org/10.1016/j.scitotenv.2018.10.254.
Balkin, R.S., and Lenz, A.S., 2021, Contemporary issues in reporting statistical, practical, and clinical significance in counseling research: Journal of Counseling & Development, v. 99, no. 2, p. 227–237, accessed August 18, 2025, at https://doi.org/10.1002/jcad.12370.
Berger, E., Haase, P., Kuemmerlen, M., Leps, M., Schäfer, R.B., and Sundermann, A., 2017, Water quality variables and pollution sources shaping stream macroinvertebrate communities: Science of the Total Environment, v. 587–588, p. 1–10, accessed July 30, 2025, at https://doi.org/10.1016/j.scitotenv.2017.02.031.
Betcher, M., Hanna, A., Hansen, E., and Hirschman, D., 2019, Pipeline impacts to water quality, 35 p, accessed July 3, 2025, at https://www.tu.org/wp-content/uploads/2019/10/Pipeline-Water-Quality-Impacts-FINAL-8-21-2019.pdf.
Bonacina, L., Fasano, F., Mezzanotte, V., and Fornaroli, R., 2023, Effects of water temperature on freshwater macroinvertebrates—A systematic review: Biological Reviews of the Cambridge Philosophical Society, v. 98, no. 1, p. 191–221, accessed July 30, 2025, at https://doi.org/10.1111/brv.12903.
Burns, D.A., Pellerin, B.A., Miller, M.P., Capel, P.D., Tesoriero, A.J., and Duncan, J.M., 2019, Monitoring the riverine pulse—Applying high-frequency nitrate data to advance integrative understanding of biogeochemical and hydrological processes: WIREs. Water, v. 6, no. 4, article e1348, accessed August 4, 2025, at https://doi.org/10.1002/wat2.1348.
Burton, J., and Gerritsen, J., 2003, A stream condition index for Virginia non-coastal streams: USEPA Office of Science and Technology, Office of Water, Washington, DC; USEPA Region 3 Environmental Services Division, Wheeling, WV, and Virginia Department of Environmental Quality, Richmond, VA, prepared by Tetra Tech, Inc, 148 p., accessed August 13, 2025, at https://www.DEQ.virginia.gov/home/showpublisheddocument/4317/637461491373170000.
Caissie, D., 2006, The thermal regime of rivers—A review: Freshwater Biology, v. 51, no. 8, p. 1389–1406, accessed July 21, 2025, at https://doi.org/10.1111/j.1365-2427.2006.01597.x.
Castro, J.M., MacDonald, A., Lynch, E., and Thorne, C.R., 2015, Risk-based approach to designing and reviewing pipeline stream crossings to minimize impacts to aquatic habitats and species: River Research and Applications, v. 31, no. 6, p. 767–783, accessed June 27, 2025, at https://doi.org/10.1002/rra.2770.
Christensen, N. D., Czuba, J. A., Triantafillou, S., Copenheaver, C. A., Peterson, J. A., Hession, W. C., 2022, Establishment and persistence of trees growing in the channel of an intermittent stream in a temperate, karst environment: Water Resources Research, v. 58, no. 5, article e2021WR031528, 19 p., accessed August 23, 2025, at https://doi.org/10.1029/2021WR031528.
Coats, W.A., and Jackson, C.R., 2020, Riparian canopy openings on mountain streams—Landscape controls upon temperature increases within openings and cooling downstream: Hydrological Processes, v. 34, no. 8, p. 1966–1980, accessed July 3, 2025, at https://doi.org/10.1002/hyp.13706.
Dancho, M., and Vaughan, D., 2023, anomalize—Tidy anomaly detection—R package version 0.3.0: R Foundation for Statistical Computing software release, accessed July 8, 2025, https://CRAN.R-project.org/package=anomalize.
Donaldson, M.R., Cooke, S.J., Patterson, D.A., and Macdonald, J.S., 2008, Cold shock and fish: Journal of Fish Biology, v. 73, no. 7, p. 1491–1530, accessed July 30, 2025, at https://doi.org/10.1111/j.1095-8649.2008.02061.x.
Downstream Strategies and West Virginia Rivers, 2024, Mountain Valley Pipeline stream and wetland crossings—Review of inspection report, 14 p., accessed July 4, 2025, at https://wvrivers.org/wp-content/uploads/2024/11/MVP-November-2024-Audit-Report.pdf.
Erickson, R.J., 1985, An evaluation of mathematical models for the effects of pH and temperature on ammonia toxicity to aquatic organisms: Water Research, v. 19, no. 8, p. 1047–1058, accessed July 30, 2025, at https://doi.org/10.1016/0043-1354(85)90375-6.
Fovet, O., Humbert, G., Dupas, R., Gascuel-Odoux, C., Gruau, G., Jaffrezic, A., Thelusma, G., Faucheux, M., Gilliet, N., Hamon, Y., and Grimaldi, C., 2018, Seasonal variability of stream water quality response to storm events captured using high-frequency and multi-parameter data: Journal of Hydrology, v. 559, p. 282–293, accessed July 11, 2025, at https://doi.org/10.1016/j.jhydrol.2018.02.040.
Gendaszek, A.S., and Appel, M., 2022, Thermal heterogeneity and cold-water anomalies within the lower Yakima River, Yakima and Benton Counties, Washington: U.S. Geological Survey Scientific Investigations Report 2021–5140, accessed July 28, 2025, at https://doi.org/10.3133/sir20215140.
Gómez-de-Mariscal, E., Guerrero, V., Sneider, A, Jayatilaka, H., Phillip, J.M., Wirtz, D., Muñoz-Barrutia, A., 2021, Use of the p-values as a size-dependent function to address practical differences when analyzing large datasets: Scientific Reports, bioRxiv article posted January 11, 2021, v. 11, article 20942, 15 p., accessed August 15, 2025, at https://doi.org/10.1038/s41598-021-00199-5.
Gowdy, M.J., Smits, M.P., Wilkey, P.L., and Miller, S.F., 1994, Data summary report on short-term turbidity monitoring of pipeline river crossings in the Moyie River, Boundary County, Idaho—PGT-PG&E Pipeline Expansion Project: Bechtel Corporation, prepared by Argonne National Laboratory, Illinois, ANL/ESD/TM--67, 116 p., accessed July 29, 2025, at https://doi.org/10.2172/10161518.
H Brothers, Inc., 2025, Roanoke Weather Records: Extreme Weather Watch web page, accessed August 8, 2025, at https://www.extremeweatherwatch.com/cities/roanoke.
Henley, W.F., Patterson, M.A., Neves, R.J., and Lemly, A.D., 2000, Effects of sedimentation and turbidity on lotic food webs—A concise review for natural resource managers: Reviews in Fisheries Science, v. 8, no. 2, p. 125–139, accessed August 17, 2025, at https://doi.org/10.1080/10641260091129198.
Honious, S.A.S., Hale, R.L., Guilinger, J.J., Crosby, B.T., and Baxter, C.V., 2022, Turbidity structures the controls of ecosystem metabolism and associated metabolic process domains along a 75-km segment of a semiarid stream: Ecosystems, v. 25, no. 2, p. 422–440, accessed August 17, 2025, at https://doi.org/10.1007/s10021-021-00661-5.
Houser, D.L., and Pruess, H., 2009, The effects of construction on water quality—A case study of the culverting of Abram Creek: Environmental Monitoring and Assessment, v. 155, p. 431–442, accessed July 22, 2025, at https://doi.org/10.1007/s10661-008-0445-9.
Huenemann, T.W., Dibble, E.D., and Fleming, J.P., 2012, Influence of turbidity on the foraging of largemouth bass: Transactions of the American Fisheries Society, v. 141, no. 1, p. 107–111, accessed August 17, 2025, at https://doi.org/10.1080/00028487.2011.651554.
Jamshidi, E.J., Yusup, Y., Kayode, J.S., and Kamaruddin, M.A., 2022, Detecting outliers in a univariate time series dataset using unsupervised combined statistical methods—A case study on surface water temperature: Ecological Informatics, v. 69, article 101672, accessed July 17, 2025, at https://doi.org/10.1016/j.ecoinf.2022.101672.
Joint Committee for Guides in Metrology, 2020, Guide to the expression of uncertainty in measurement—Part 6: Developing and using measurement models: Bureau International des Poids et Mesures (BIPM), accessed August 17, 2025, at https://www.bipm.org/documents/20126/50065290/JCGM_GUM_6_2020.pdf/d4e77d99-3870-0908-ff37-c1b6a230a337.
Johnson, M.F., Albertson, L.K., Algar, A.C., Dugdale, S.J., Edwards, P., England, J., Gibbins, C., Kazama, S., Komori, D., MacColl, A.D.C., Scholl, E.A., Wilby, R.L., de Oliveira Roque, F., and Wood, P.J., 2024, Rising water temperature in rivers—Ecological impacts and future resilience: WIREs Water, v. 11, no. 4, p. e1724, accessed July 30, 2025, at https://doi.org/10.1002/wat2.1724.
Johnston, M.G., and Faulkner, C., 2021, A bootstrap approach is a superior statistical method for the comparison of non-normal data with differing variance: New Phytologist, bioRxiv article posted September 11, 2020, v. 230, no. 1, p. 23–26, accessed July 21, 2025, at https://doi.org/10.1111/nph.17159.
Knapp, J.L.A., von Freyberg, J., Studer, B., Kiewiet, L., and Kirchner, J.W., 2020, Concentration-discharge relationships vary among hydrological events, reflecting differences in event characteristics: Hydrology and Earth System Science, v. 24, no. 5, European Geoscience Union article posted January 7, 2020, 27 p., accessed August 1, 2025, at https://doi.org/10.5194/hess-24-2561-2020.
Krawczyk, M., 2015, The search for significance—A few peculiarities in the distribution of p values in experimental psychology literature: PLoS ONE, v. 10, no. 6, article e0127872, accessed August 14, 2025, at https://doi.org/10.1371/journal.pone.0127872.
Leach, J.A., Kelleher, C., Kurylyk, B.L., Moore, R.D., and Neilson, B.T., 2023, A primer on stream temperature processes: WIREs Water, v. 10, no. 4, article e1643, accessed July 30, 2025, at https://doi.org/10.1002/wat2.1643.
Lévesque, L.M., and Dubé, M.G., 2007, Review of the effects of in-stream pipeline crossing construction on aquatic ecosystems and examination of Canadian methodologies for impact assessment: Environmental Monitoring and Assessment, v. 132, p. 395–409, accessed July 27, 2025, at https://doi.org/10.1007/s10661-006-9542-9.
Lin, M., Lucas, H.C., Jr., and Shmueli, G., 2013, Research Commentary—Too big to fail—Large samples and the p-value problem: Information Systems Research, v. 24, no. 4, p. 906–917, accessed August 14, 2025, at https://doi.org/10.1287/isre.2013.0480.
Liu, W., Birgand, F., Tian, S., and Chen, C., 2021, Event-scale hysteresis metrics to reveal processes and mechanisms controlling constituent export from watersheds—A review: Water Research, v. 200, article 117254, 13 p., accessed June 11, 2025, at https://doi.org/10.1016/j.watres.2021.117254.
Lloyd, C.E.M., Freer, J.E., Johnes, P.J., and Collins, A.L., 2016a, Technical note—Testing an improved index for analyzing storm discharge—concentration hysteresis: Hydrology and Earth System Sciences, preprint article posted on August 13, 2015, v. 20, no. 2, p. 625–632, accessed June 10, 2025, at https://doi.org/10.5194/hess-20-625-2016.
Lloyd, C.E.M., Freer, J.E., Johnes, P.J., and Collins, A. L., 2016b, Using hysteresis analysis of high-resolution water quality monitoring data, including uncertainty, to infer controls on nutrient and sediment transfer in catchments: Science of the Total Environment, v. 543, part A, p. 388–404, accessed July 21, 2025, at https://doi.org/10.1016/j.scitotenv.2015.11.028.
Mejia, F.H., Torgersen, C.E., Berntsen, E.K., Maroney, J.R., Connor, J.M., Fullerton, A.H., Ebersole, J.L., and Lorang, M.S., 2020, Longitudinal, lateral, vertical, and temporal thermal heterogeneity in a large impounded river—Implications for cold-water refuges: Remote Sensing, v. 12, no. 9, article 1386, accessed July 31, 2025, at https://doi.org/10.3390/rs12091386.
Millar, D., Buda, A., Duncan, J., and Kennedy, C., 2022, An open-source automated workflow to delineate storm events and evaluate concentration-discharge relationships: Hydrological Processes, v. 36, article e14456, accessed June 10, 2025, at https://doi.org/10.1002/hyp.14456.
Miller, S.A., Webber, J.S., Jastram, J.D., and Aguilar, M.F., 2023, Using high-frequency monitoring data to quantify city-wide suspended-sediment load and evaluate TMDL goals: Environmental Monitoring and Assessment, v. 195, no. 11, article 1372, accessed August 3, 2025, at https://doi.org/10.1007/s10661-023-11905-3.
Morrill, J.C., Bales, R.C., and Conklin, M.H., 2005, Estimating stream temperature from air temperature—Implications for future water quality: Journal of Environmental Engineering, v. 131, no. 1, p. 139–146, accessed August 17, 2025, at https://doi.org/10.1061/(ASCE)0733-9372(2005)131:1(139).
Moyer, D.L., and Hyer, K.E., 2009, Continuous turbidity monitoring in the Indian Creek watershed, Tazewell County, Virginia, 2006–08: U.S. Geological Survey Scientific Investigations Report 2009–5085, 42 p. [Also available at https://doi.org/10.3133/sir20095085.]
Mudelsee, M., and Alkio, M., 2007, Quantifying effects in two-sample environmental experiments using bootstrap confidence intervals: Environmental Modelling & Software, v. 22, no. 1, p. 84–96, accessed August 1, 2025, at https://doi.org/10.1016/j.envsoft.2005.12.001.
Musolff, A., Zhan, Q., Dupas, R., Minaudo, C., Fleckenstein, J. H., Rode, M., Dehaspe, J., Rinke, K., 2021, Spatial and temporal variability in concentration-discharge relationships at the event scale: Water Resources Research, v. 57, no. 10, article e2020WR029442, accessed June 10, 2025, at https://doi.org/10.1029/2020WR029442.
New Jersey Department of Environmental Protection, 2021, Final report—Horizontal directional drilling: New Jersey Department of Environmental Protection, prepared by Water Quality & Quantity Standing Committee, 25 p., accessed June 27, 2025, at https://dep.nj.gov/wp-content/uploads/sab/sab-hdd.pdf.
New River Geographics, LLC, 2017, Mountain Valley Pipeline—A comprehensive story map: New River Geographics, LLC website, accessed August 8, 2025, at https://data-nrgeo.opendata.arcgis.com/apps/mountain-valley-pipeline-a-comprehensive-story-map/explore.
Noyes, P.D., and Lema, S.C., 2015, Forecasting the impacts of chemical pollution and climate change interactions on the health of wildlife: Current Zoology, v. 61, no. 4, p. 669–689, accessed July 30, 2025, at https://doi.org/10.1093/czoolo/61.4.669.
Parfomak, P.W., and Vann, A., 2022, Mountain Valley Pipeline—Permitting issues: U.S. Congress, prepared by Congressional Research Service, report IN12032, 3 p., accessed June 24, 2025, at https://www.congress.gov/crs_external_products/IN/PDF/IN12032/IN12032.1.pdf.
Parfomak, P.W., and Vann, A., 2024, Mountain Valley Pipeline—Past the finish line: U.S. Congress, prepared by Congressional Research Service, report IN12032, 3 p., accessed June 24, 2025, at https://www.congress.gov/crs_external_products/IN/PDF/IN12032/IN12032.14.pdf.
Porter, A.J., 2025, Spatiotemporal patterns in urban nutrient and suspended sediment loads and stream response to watershed management implementation: Environmental Monitoring and Assessment, v. 197, article 497, 26 p., accessed August 3, 2025, at https://doi.org/10.1007/s10661-025-13917-7.
R Core Team, 2025, R—A language and environment for statistical computing, version 4.4.2 (Pile of Leaves): R Foundation for Statistical Computing software release, accessed June 2, 2025, at https://www.R-project.org/.
Reed, M., 2024, North America 2024 pipeline construction outlook—New LNG terminals lead call for more pipelines: Underground Infrastructure, v. 79, no. 2, accessed August 14, 2025, at https://undergroundinfrastructure.com/magazine/2024/february-2024-vol-79-no-2/features/north-america-2024-pipeline-construction-outlook-new-lng-termin als-lead-call-for-more-pipelines.
Reid, S.M., Stoklosar, S., Metikosh, S., and Evans, J., 2002, Effectiveness of isolated pipeline crossing techniques to mitigate sediment impacts on brook trout streams: Water Quality Research Journal of Canada, v. 37, no. 2, p. 473–488, accessed June 27, 2025, at https://doi.org/10.2166/wqrj.2002.031.
Rügner, H., Schwientek, M., Beckingham, B., Kuch, B., and Grathwohl, P., 2013, Turbidity as a proxy for total suspended solids (TSS) and particle facilitated pollutant transport in catchments: Environmental Earth Sciences, v. 69, p. 373–380, accessed August 4, 2025, at https://doi.org/10.1007/s12665-013-2307-1.
Sauer, V.B., and Turnipseed, D.P., 2010, Stage measurement at gaging stations: U.S. Geological Survey Techniques and Methods book 3, chap. A7, 45 p. [Also available at https://doi.org/10.3133/tm3A7.]
Shikwambana, L., and Kganyago, M., 2023, Seasonal comparison of the wildfire emissions in Southern African Region during the strong ENSO events of 2010/11 and 2015/16 using trend analysis and anomaly detection: Remote Sensing, v. 15, no. 4, article 1073, accessed July 08, 2025, at https://doi.org/10.3390/rs15041073.
Siegel, J.E., and Volk, C.J., 2019, Accurate spatiotemporal predictions of daily stream temperature from statistical models accounting for interactions between climate and landscape: PeerJ, v. 7, article e7892, accessed August 17, 2025, at https://doi.org/10.7717/peerj.7892.
Storey, M.V., van der Gaag, B., and Burns, B.P., 2011, Advances in on-line drinking water quality monitoring and early warning systems: Water Research, v. 45, no. 2, p. 741–747, accessed August 02, 2025, at https://doi.org/10.1016/j.watres.2010.08.049.
Stubblefield, A.P., Reuter, J.E., Dahlgren, R.A., and Goldman, C.R., 2007, Use of turbidometry to characterize suspended sediment and phosphorus fluxes in the Lake Tahoe basin, California, USA: Hydrological Processes, preprint posted September 4, 2006, v. 21, no. 3, p. 281–291, accessed August 1, 2025, at https://doi.org/10.1002/hyp.6234.
Tassone, S.J., Besterman, A.F., Buelo, C.D., Ha, D.T., Walter, J.A., and Pace, M.L., 2023, Increasing heatwave frequency in streams and rivers of the United States: Limnology and Oceanography Letters, preprint posted October 3, 2022, v. 8, no. 2, p. 295–304, accessed August 17, 2025, at https://doi.org/10.1002/lol2.10284.
Tetra Tech, 2021, Mountain Valley Pipeline Project—Individual Permit Application: Mountain Valley Pipeline, LLC, prepared by Tetra Tech, 180 p., accessed June 24, 2025, at https://www.mountainvalleypipeline.info/wp-content/uploads/2021/03/aa_Individual-Permit-Application-Text-and-Tables_PUBLIC.pdf.
Turner, M.G., Pearson, S.M., Bolstad, P., and Wear, D.N., 2003, Effects of land-cover change on spatial pattern of forest communities in the Southern Appalachian Mountains (USA): Landscape Ecology, v. 18, p. 449–464, accessed July 3, 2025, at https://doi.org/10.1023/A:1026033116193.
U.S. Energy Information Administration, 2024, Natural gas explained—Natural gas pipelines: U.S. Energy Information Administration web page, accessed August 14, 2025, at https://www.eia.gov/energyexplained/natural-gas/natural-gas-pipelines.php.
U.S. Environmental Protection Agency [EPA], 2006 Framework for developing suspended and bedded sediments (SABS) water quality criteria, EPA/822-R-06-001: Washington, DC, U.S. Environmental Protection Agency, accessed August 18, 2025, at https://assessments.epa.gov/risk/document/&deid=164423#downloads.
U.S. Geological Survey, 2019, StreamStats: U.S. Geological Survey web-based map application, accessed June 10, 2025, at https://streamstats.usgs.gov/ss/.
U.S. Geological Survey, 2025a, National Geologic Map Database: U.S. Geological Survey database, accessed August 18, 2025, at https://ngmdb.usgs.gov/Geolex/stratres/provinces.
U.S. Geological Survey, 2025b, USGS water data for the Nation: U.S. Geological Survey National Water Information System database, accessed June 2025 at https://doi.org/10.5066/F7P55KJN.
van Hamel, A., and Brunner, M.I., 2024, Trends and drivers of water temperature extremes in mountain rivers: Water Resources Research, v. 60, no. 10, article e2024WR037518, accessed July 8, 2025, at https://doi.org/10.1029/2024WR037518.
Verheyen, J., Delnat, V., and Theys, C., 2022, Daily temperature fluctuations can magnify the toxicity of pesticides: Current Opinion in Insect Science, v. 51, article 100919, accessed July 30, 2025, at https://doi.org/10.1016/j.cois.2022.100919.
Virginia State Water Control Board, 2023, Virginia Administrative Code, 9VAC25–260–50—Numerical criteria for dissolved oxygen, pH, and maximum temperature, Title 9, Agency 25, chap. 250, sec. 50: Virginia General Assembly, Division of Legislative Automated Systems web page, accessed August 5, 2025, at https://law.lis.virginia.gov/admincode/title9/agency25/chapter260/section50/.
Virginia State Water Control Board, 2024, Virginia Administrative Code, 9VAC25–260–30—Antidegradation policy, Title 9, Agency 25, chap. 260, sec. 30: Virginia General Assembly, Division of Legislative Automated Systems web page, accessed August 13, 2025, at https://law.lis.virginia.gov/admincode/title9/agency25/chapter260/section30/.
Virginia Department of Conservation and Recreation, 2021, The natural communities of Virginia classification of ecological groups and community types (version 3.3): Commonwealth of Virginia website, accessed August 13, 2025, at /www.dcr.virginia.gov/natural-heritage/natural-communities/ncta1.
Wagner, R.J., Boulger, R.W., Jr., Oblinger, C.J., and Smith, B.A., 2006, Guidelines and standard procedures for continuous water-quality monitors—Station operation, record computation, and data reporting: U.S. Geological Survey Techniques and Methods 1–D3, 51 p., 8 attachments, accessed April 10, 2006, at https://doi.org/10.3133/tm1D3. [Supersedes U.S. Geological Survey Water-Resources Investigation Report 00–4252.]
Waite, T., Jankowski, K. J., Bruesewitz, D.A., Van Appledorn, M., Johnston, M., Houser, J.N., Baumann, D.A., Bennie, B., 2023, River geomorphology affects biogeochemical responses to hydrologic events in a large river ecosystem: Water Resources Research, v. 59, n. 7, article e2022WR033662, accessed July 1, 2025, at https://doi.org/10.1029/2022WR033662.
Wasko, C., and Guo, D., 2022, Understanding event runoff coefficient variability across Australia using the hydroEvents R package: Hydrological Processes, v. 36, no. 4, article e14563, accessed June 2, 2025, at https://doi.org/10.1002/hyp.14563.
Wilber, D.H., and Clarke, D.G., 2001, Biological effects of suspended sediments—A review of suspended sediment impacts on fish and shellfish with relation to dredging activities in estuaries: North American Journal of Fisheries Management, v. 21, no. 4, p. 855–875, accessed August 18, 2025, at https://doi.org/10.1577/1548-8675(2001)021<0855:BEOSSA>2.0.CO;2.
Yan, X., Ariaratnam, S.T., Dong, S., and Zeng, C., 2018, Horizontal directional drilling—State-of-the-art review of theory and applications: Tunnelling and Underground Space Technology, v. 72, p. 162–173, accessed July 30, 2025, at https://doi.org/10.1016/j.tust.2017.10.005.
YSI, 2012, 6-series multiparameter water quality sondes: Yellow Springs Incorporated, 379 p., accessed August 13, 2025, at https://ysi.com/file%20library/documents/manuals/069300-ysi-6-series-manual-revj.pdf.
Zerga, B., 2024, Karst topography—Formation, processes, characteristics, landforms, degradation and restoration—A systematic review: Watershed Ecology and the Environment, v. 6, p. 252–269, accessed July 3, 2025, at https://doi.org/10.1016/j.wsee.2024.10.003.
Appendix 1. Supporting Material for Turbidity Analysis
Table 1.1.
Number and percentage of values censored that were greater than 1,000 formazin nephelometric units during the Mountain Valley Pipeline stream crossings in southwestern Virginia, 2017–25 ( U.S. Geological Survey, 2025b).[U.S., United States, min, minute; FNU, formazin nephelometric units]
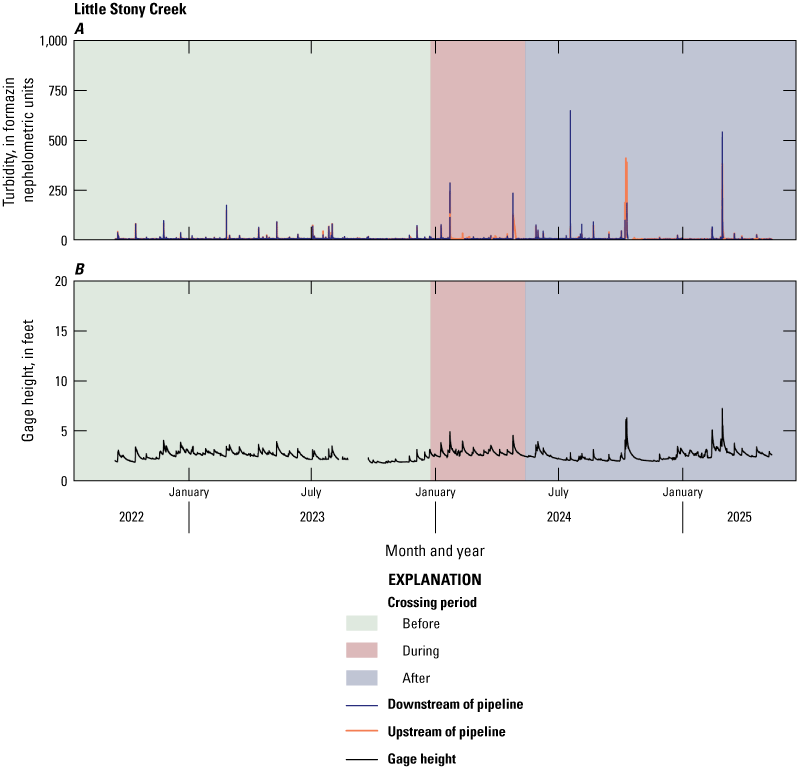
High-frequency time series of the before, during, and after stream crossing periods of the Mountain Valley Pipeline in southwestern Virginia, 2017–25. A, Little Stony Creek turbidity at the upstream and downstream sites; B, Gage height at Little Stony Creek downstream site.
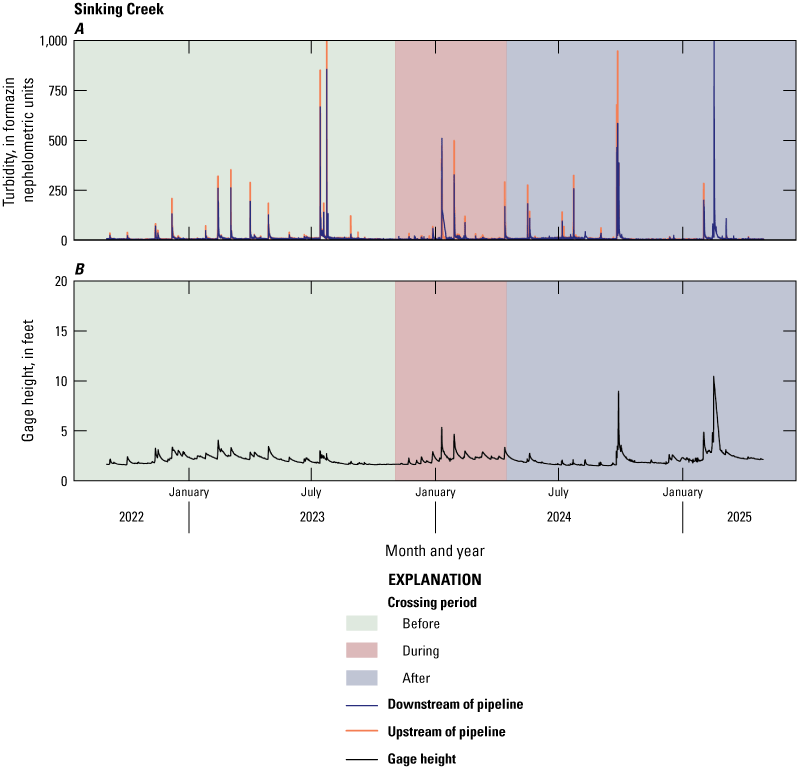
High-frequency time series of the before, during, and after stream crossing periods of the Mountain Valley Pipeline in southwestern Virginia, 2017–25. A, Sinking Creek turbidity at the upstream and downstream sites; B, Gage height at Sinking Creek upstream site.
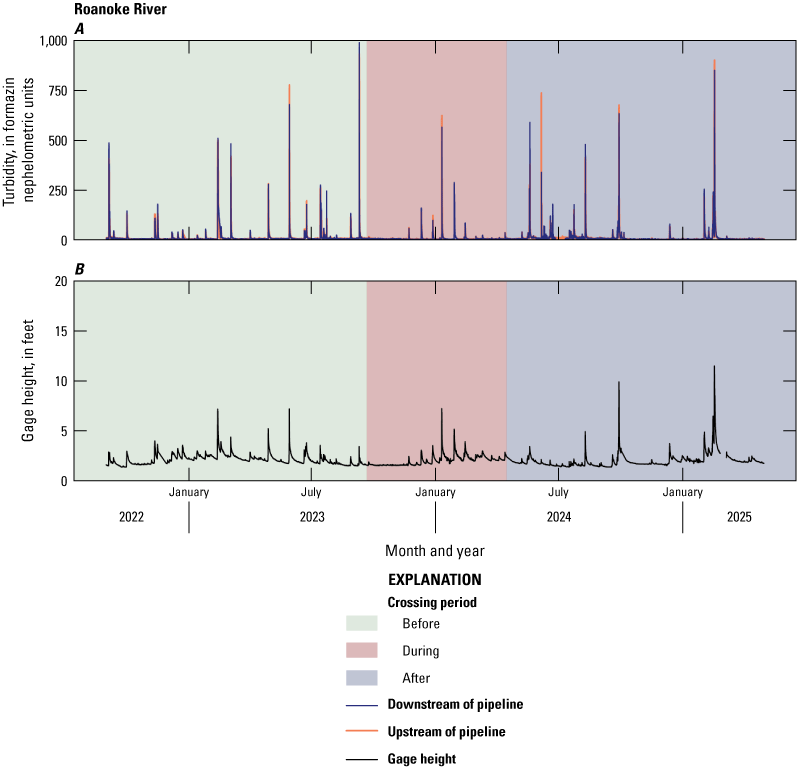
High-frequency time series of the before, during, and after stream crossing periods of the Mountain Valley Pipeline in southwestern Virginia, 2017–25. A, Roanoke River turbidity at the upstream and downstream sites; B, Gage height at Roanoke River Lafayette monitoring station upstream of upstream site.
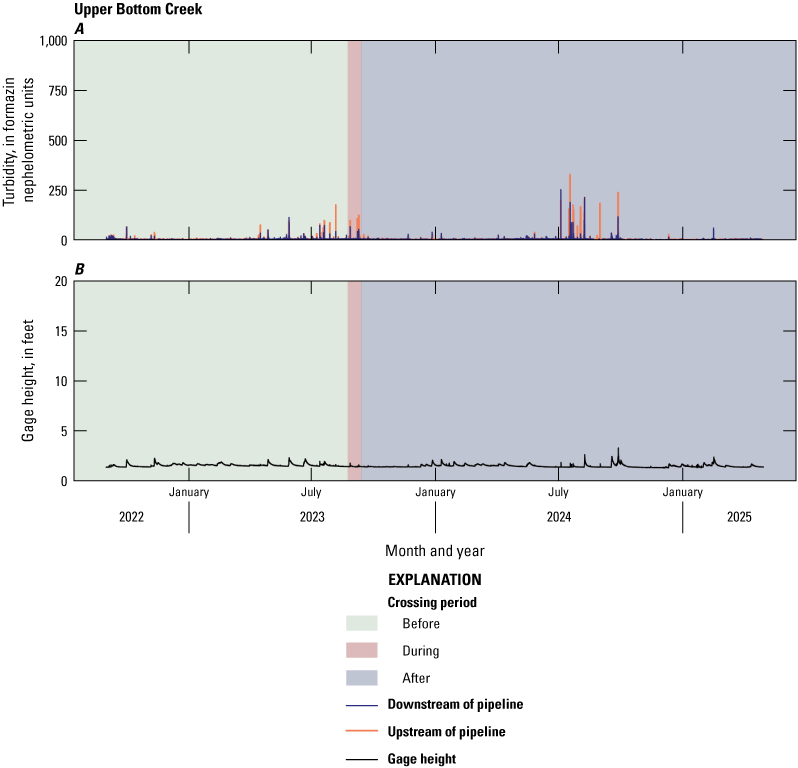
High-frequency time series of the before, during, and after stream crossing periods of the Mountain Valley Pipeline in southwestern Virginia, 2017–25. A, Upper Bottom Creek turbidity at the upstream and downstream sites; B, Gage height at the upper Bottom Creek downstream site.
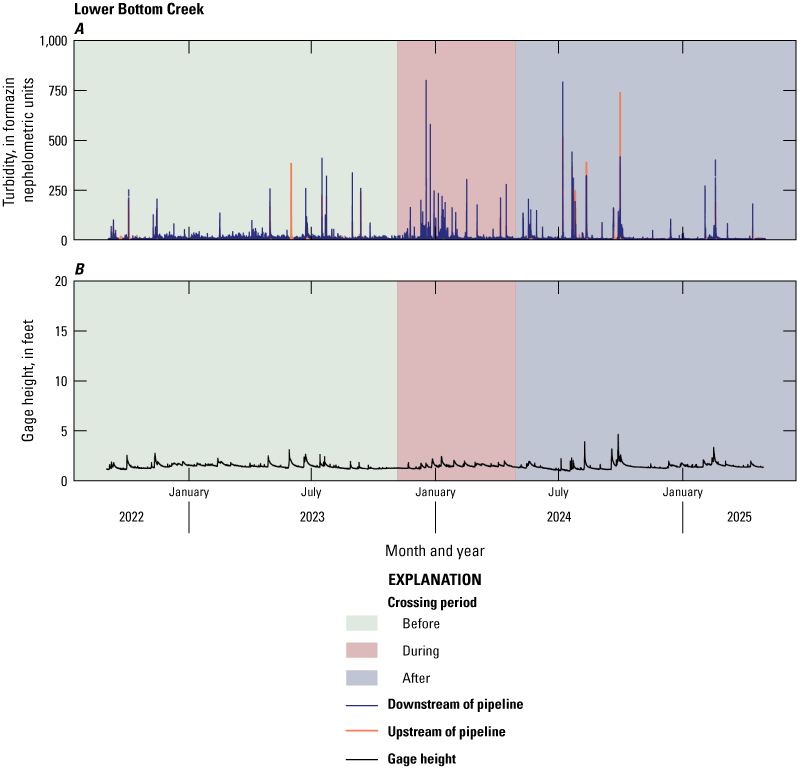
High-frequency time series of the before, during, and after stream crossing periods of the Mountain Valley Pipeline in southwestern Virginia, 2017–25. A, Lower Bottom Creek turbidity at the upstream and downstream sites; B, Gage height at the lower Bottom Creek downstream site.
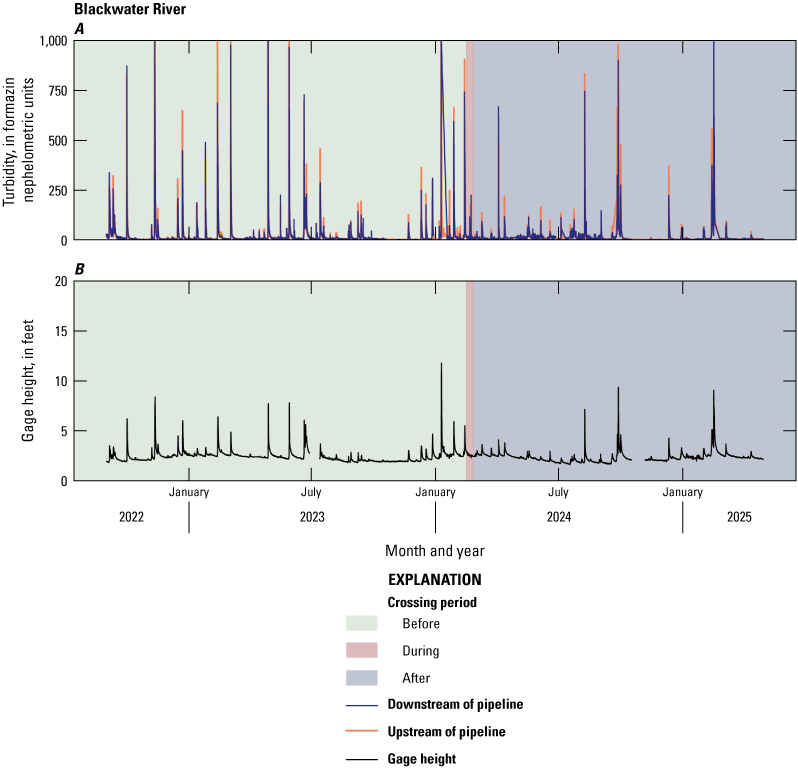
High-frequency time series of the before, during, and after stream crossing periods of the Mountain Valley Pipeline in southwestern Virginia, 2017–25. A, Blackwater River turbidity at the upstream and downstream sites; B, Gage height at the Blackwater River downstream site.
Table 1.2.
Results of the percentage of absolute differences for each time-matched paired hourly median turbidity measurements between the upstream and downstream for each site and stream crossing period of the Mountain Valley Pipeline in southwestern Virginia, 2017–25.[n, number of observations; FNU, formazin nephelometric unit]
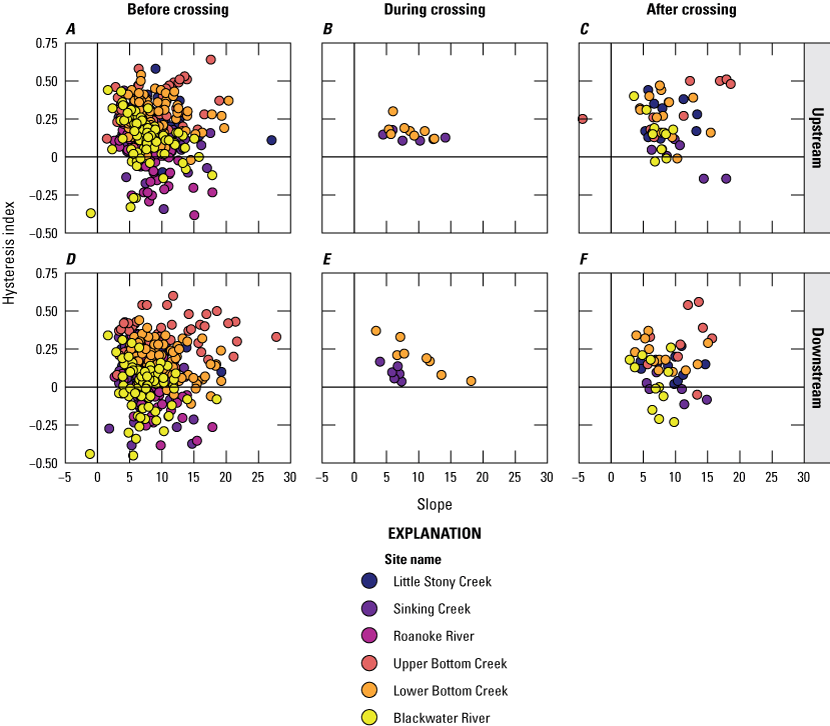
Graphs of the hysteresis index and slope data calculated for the before, during, and after stream crossing periods of the Mountain Valley Pipeline in southwestern Virginia, 2017–25. A, Before stream crossing at upstream sites; B, During stream crossing at upstream sites; C, After stream crossing at upstream sites; D, Before stream crossing at downstream sites; E, During stream crossing at downstream sites; F, After stream crossing at downstream sites.
Conversion Factors
Datums
Vertical coordinate information is referenced to the North American Vertical Datum of 1988 (NAVD 88).
Horizontal coordinate information is referenced to the North American Datum of 1983 (NAD 83).
Elevation, as used in this report, refers to distance above the vertical datum.
Supplemental Information
Specific conductance is in microsiemens per centimeter at 25 degrees Celsius (µS/cm at 25 °C).
Turbidity is in formazin nephelometric units (FNU).
Dissolved oxygen is in milligrams per liter (mg/L).
A water year is the 12-month period from October 1 through September 30 of the following year and is designated by the calendar year in which it ends.
For additional information contact:
Director, Virginia and West Virginia Water Science Center
U.S. Geological Survey
1730 East Parham Road
Richmond, Virginia 23228
or visit our website at
https://www.usgs.gov/centers/virginia-and-west-virginia-water-science-center
Publishing support provided by the U.S. Geological Survey, Science Publishing Network, Baltimore Publishing Service Center
Edited by Bree McCloskey
Illustration support and layout by Sarah Lighter
Disclaimers
Any use of trade, firm, or product names is for descriptive purposes only and does not imply endorsement by the U.S. Government.
Although this information product, for the most part, is in the public domain, it also may contain copyrighted materials as noted in the text. Permission to reproduce copyrighted items must be secured from the copyright owner.
Suggested Citation
Foster, B.M., Maas, C.M., and Flota, A.L., 2026, Assessment of natural gas pipeline construction on stream temperature and turbidity in southwestern Virginia, 2017–25: U.S. Geological Survey Scientific Investigations Report 2026–5011, 40 p., https://doi.org/10.3133/sir20265011. [Supersedes preprint https://doi.org/10.31223/X5XT9G.]
ISSN: 2328-0328 (online)
Study Area
| Publication type | Report |
|---|---|
| Publication Subtype | USGS Numbered Series |
| Title | Assessment of natural gas pipeline construction on stream temperature and turbidity in southwestern Virginia, 2017–25 |
| Series title | Scientific Investigations Report |
| Series number | 2026-5011 |
| DOI | 10.3133/sir20265011 |
| Publication Date | April 14, 2026 |
| Year Published | 2026 |
| Language | English |
| Publisher | U.S. Geological Survey |
| Publisher location | Reston, VA |
| Contributing office(s) | Virginia and West Virginia Water Science Center |
| Description | ix, 40 p. |
| Country | United States |
| State | Virginia |
| Online Only (Y/N) | Y |