

Status and Understanding of Groundwater Quality in the San Joaquin Valley Kern County Subbasin Domestic-Supply Aquifer Study Unit, 2022: California GAMA Priority Basin Project
Links
- Document: Report (37.5 MB pdf) , HTML , XML
- Data Releases:
- USGS data release - Groundwater-quality data in the Kern County Domestic-Supply Aquifer Study Unit, 2022—Results from the California GAMA Priority Basin Project
- USGS data release - Data for assessing the susceptibility of groundwater used for domestic-supply, California
- USGS data release - Potential explanatory variables for groundwater quality in the San Joaquin Valley Kern County subbasin domestic well study unit, 2022
- NGMDB Index Page: National Geologic Map Database Index Page (html)
- Download citation as: RIS | Dublin Core
Acknowledgments
We thank the site owners and water purveyors for granting site access and allowing the U.S. Geological Survey to collect samples from their wells. The California State Water Resources Control Board Groundwater Ambient Monitoring and Assessment Program provided most of the funding for this work, and additional funding was provided through the U.S. Geological Survey Cooperative Matching Funds. This report is a product of the California State Water Resources Control Board Groundwater Ambient Monitoring and Assessment Program Priority Basin Project.
Abstract
The quality of water accessed by domestic wells (here referred to as domestic groundwater resources) in the San Joaquin Valley Kern County subbasin (basin number 5-022.14) was assessed as part of the California Groundwater Ambient Monitoring and Assessment (GAMA) Program Priority Basin Project (GAMA-PBP), in cooperation with the California State Water Resources Control Board. Kern County is at the southern end of the San Joaquin Valley in California, and about 30,000 residents are estimated to use privately owned domestic wells for drinking water. Domestic wells typically draw from shallower parts of the aquifer system than public-supply wells and can be more vulnerable to effects from surface activities. Kern County is host to a highly productive agricultural industry, with Bakersfield as the main urban center. The Kern River runs through Bakersfield from the southern Sierra Nevada and intersects the Kern Water Bank, one of the largest groundwater banking operations in California, at the Kern River Intertie. The section of the Kern River running through the Kern Water Bank is dry most years. Kern County also encompasses some of the most productive oil and gas basins in California, with extensive underground and surface disposal of oil-field wastewater.
This study was based on data collected from 33 sites sampled by the U.S. Geological Survey for the GAMA-PBP in 2022. To provide context for the water quality assessment, measured concentrations were compared to regulatory and non-regulatory health-based and aesthetic benchmarks. A grid-based method was used to estimate the proportions of the groundwater resources used for domestic-supply wells that have water-quality constituents below (low relative concentration), approaching (moderate relative concentration), or above (high relative concentration) benchmark concentrations. At least one measured constituent with a regulatory benchmark was categorized as having a high relative concentration in 72 percent of the aquifer area used for domestic groundwater resources. Inorganic constituents were detected at high concentrations in 45 percent of the domestic groundwater resources, and the constituents detected above regulatory benchmarks were arsenic, nitrate, and uranium. At least one organic constituent was detected at high concentrations in 41 percent of the domestic groundwater resources, and the constituents exceeding regulatory benchmarks were the fumigants 1,2,3-trichloropropane (1,2,3-TCP), 1,2-dibromo-3-chloropropane (dibromochloropropane [DBCP]), 1,2-dibromoethane (EDB), and the per- and polyfluoroalkyl substance (PFAS) perfluorooctanesulfonate. The disinfection by-product chloroform, the fumigant 1,2-dichloropropane, the herbicides atrazine and hexazinone, and the herbicide degradates 2-chloro-6-ethylamino-4-amino-s-triazine, 2-chloro-4,6-diamino-s-triazine, 4-hydroxychlorothalonil, and metolachlor sulfonic acid were detected in more than 10 percent of domestic groundwater resources, but concentrations did not exceed regulatory benchmarks.
Land use, groundwater age (fraction of modern water and mean age), and geochemical environment (oxic or anoxic conditions, pH, alkalinity) were associated with the distribution of high relative concentrations of inorganic and organic constituents. Young, oxygenated water is recharged along the Kern River and adjacent recharge ponds, or as irrigation water in the agricultural areas. High concentrations of nitrate and volatile organic compounds occurred in the oxic water in urban and agricultural areas. The fumigants 1,2,3-TCP, DBCP, and EDB were reported throughout the agricultural areas, whereas chloroform, tetrachloroethene, and PFAS were associated with urban land use. High uranium concentrations were associated with young, modern groundwater in agricultural areas with low pH and high bicarbonate. Total dissolved solids increased with distance from the Kern River, as the contributions of fresh, oxic water decreased. High concentrations of arsenic were present in older anoxic or alkaline groundwater away from areas of recharge. Overall, groundwater age, redox conditions, and the source of recharge as a result of different land uses contribute to large aquifer-scale portions of domestic groundwater resources that exceed health-based benchmarks for nitrate, uranium, and fumigant concentrations.
Introduction
In California, 1.2 million people rely on domestic groundwater wells for supplying drinking water (Johnson and Belitz, 2015, 2019; Carle, 2016). The domestic supply (herein, “domestic groundwater resources”) is a large, but often understudied, source of drinking water for an estimated 23 million U.S. households, particularly in disadvantaged communities (Johnson and Belitz, 2019). Unlike public-supply wells, domestic wells are mostly unregulated in California and not systematically monitored for water quality, and there is limited information about the quality of domestic groundwater resources on a regional scale. Domestic wells in the Central Valley tend to be drilled to shallower depths than public-supply wells and have shorter perforated intervals, increasing their vulnerability to contamination by surface sources (Burow and others, 2008; Voss and others, 2019). Monitoring domestic wells can provide valuable information on groundwater quality in shallower parts of aquifer systems that respond more rapidly to changes at the land surface compared to deeper production wells. Many domestic wells tap younger water that has recharged in the last 50 years and therefore may capture recharge affected by point and nonpoint source contamination from modern agricultural and industrial activities and expansion of urbanization (Burow and others, 2013; Ransom and others, 2017; Faulkner and others, 2023). However, domestic wells are unregulated and can be challenging to sample, thereby limiting our capacity to monitor water quality in the domestic groundwater resource.
Intensive use and management of groundwater can lead to restructuring of the groundwater flow system and recharge regime, resulting in changes in water quantity and quality (Jurgens and others, 2010; Burow and others, 2017; Hansen and others, 2018; Harkness and others, 2023). Irrigation, resource extraction, and managed aquifer recharge (MAR) can all affect shallow groundwater quality by directly contributing pollutants to recharge water or altering recharge chemistry (Jurgens and others, 2010; Hartog and Stuyfzand, 2017; Hansen and others, 2018; McMahon and others, 2019; Fakhreddine and others, 2021; Karolytė and others, 2021; Harkness and Jurgens, 2022; Harkness and others, 2023). During managed recharge, oxygenated water is introduced into the aquifer, affecting oxidation-reduction reactions, which can be used to treat organic constituents by microbially mediated degradation, but also affects the mobility of inorganics such as nitrate and oxyanions (Cey and others, 2008). Evaluating the effect of different recharge sources on the quality of domestic groundwater resources supports ongoing efforts to manage critical drinking water sources and identify potential risks for public-groundwater supplies.
The California State Water Resources Control Board (SWRCB) created the Groundwater Ambient Monitoring and Assessment (GAMA) program in 2000 to understand the ambient quality of groundwater in aquifers used for drinking-water supply. The purpose of GAMA is to comprehensively assess groundwater quality throughout California and enhance public access to groundwater-quality information and analysis. The U.S. Geological Survey (USGS), in cooperation with the SWRCB, implements the Priority Basin Project of the GAMA program (GAMA-PBP), which provides assessments of groundwater resources used for drinking-water supply on a basin scale. The first phase of the GAMA-PBP focused on groundwater wells used for public-drinking water supply (Belitz and others, 2015), and the second phase is assessing the status of groundwater resources used for domestic drinking-water supply (Shelton and Tejeda, 2024). This GAMA-PBP domestic-supply aquifer study unit provides a status and understanding assessment of the quality of groundwater resources used for drinking-water supply in domestic wells in the California Department of Water Resources’ San Joaquin Valley Kern County subbasin (basin number 5-022.14), hereinafter referred to as the Kern County subbasin (California Department of Water Resources, 2020). Results for the public drinking water supply resources were reported in Burton and others (2012).
The Kern County subbasin supplies critical drinking water resources to Bakersfield and surrounding communities at the southern terminus of the Central Valley, California. This region is a nationally valuable agricultural area that relies on surface deliveries for irrigation, supplemented by groundwater (Faunt and others, 2024). An estimated 30,000 residents are served by domestic wells in the Kern County subbasin, mostly in rural and agricultural communities outside of urban centers (Johnson and Belitz, 2015). In addition to extensive farming, the Kern County subbasin hosts active oil and gas basins and managed aquifer recharge projects, including the largest groundwater banking project in California, the Kern Water Bank (Meillier and others, 2008; Davis and others, 2018).
The GAMA-PBP sampled domestic wells between February and April of 2022 in the Kern County subbasin (Faulkner and Dupuy, 2023). The part of the subbasin known to contain domestic wells was divided into 40 equal-area grid cells that were each about 85 square kilometers (km2), and a total of 33 domestic or small-system wells were sampled to represent 29 of the cells in the study unit (fig. 1; Faulkner and Dupuy, 2023). The equal-area grid cells were used to complete a spatially distributed assessment of groundwater quality over the total aquifer area used for domestic groundwater resources.
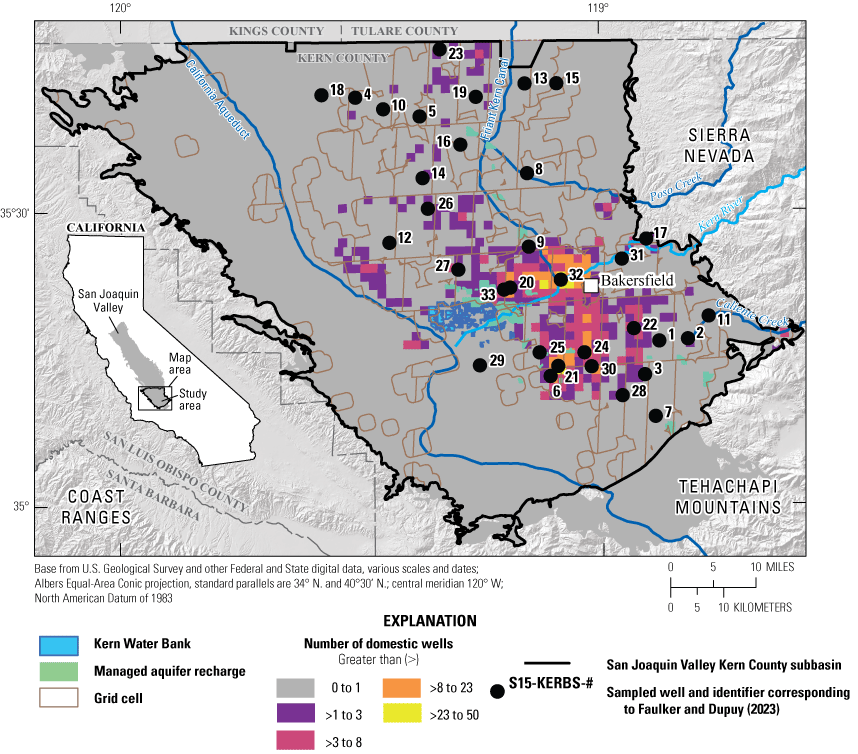
The San Joaquin Valley Kern County subbasin study unit showing the number of domestic wells per township section, sampling grid cells, location of wells sampled to characterize the quality of groundwater resources used for domestic supply, and selected geographic features (Johnson and Belitz, 2015; Kern River Bank Authority, 2021; Faulkner and Dupuy, 2023). The map inset shows the location of the San Joaquin Valley Kern County subbasin in the San Joaquin hydrogeologic province (Belitz and others, 2003; Johnson and Belitz, 2003). Sample numbers correspond to the numbers used in Faulkner and Dupuy (2023), with the prefix “S15-KERBS-“ removed.
Hydrogeologic Setting
The Kern County subbasin domestic-supply study unit covers the 7,770 km2 San Joaquin Valley Kern County subbasin in Kern County at the southern end of California’s Central Valley (fig. 1; Burton and others, 2012; California Department of Water Resources, 2020; Faulkner and Dupuy, 2023). It is bounded by Kings and Tulare Counties to the north, the granitic bedrock of the Sierra Nevada and Tehachapi Mountains to the east and southeast, and the marine sediments of the Coast Ranges to the west. The Kern River, which originates in the Sierra Nevada, is the primary river flowing through the study unit (fig. 1). Poso Creek and Caliente Creek flow from the Sierra Nevada to the north and south of the Kern River, respectively. The Friant-Kern Canal and Governor Edmund G Brown California Aqueduct flow from north to south through the center and western parts of Kern County, respectively. The study unit has a Mediterranean climate, with long, hot summer days and cool nights, and mild, damp winters with dense fog. Average annual precipitation is about 185 millimeters (mm; PRISM Climate Group, 2024).
Land use in the study unit is approximately 66 percent agricultural, 3 percent urban, and 31 percent natural (fig. 2; Falcone, 2015). The primary agricultural uses are for field crops (such as vegetables and hay), fruit and nut orchards, and livestock. Groundwater is often used to supplement surface water diversions for irrigation during the summer dry season and during extended regional droughts (Faunt, 2009). Bakersfield is the only large metropolitan area and extends from the base of the Sierra Nevada westward along the Kern River. Highly productive agricultural areas extend northward and southward from the Kern River to the county borders. Natural land cover includes large areas of predominantly low-use grasslands and natural resource extraction (oil and gas) that extend along the eastern foothills and west of the Governor Edmund G Brown California Aqueduct. Eight wells (24 percent) are within the boundary of an oil and gas field, and another 10 wells (30 percent) are within 3 kilometers (km) of an oil and gas field (Harkness, 2026).
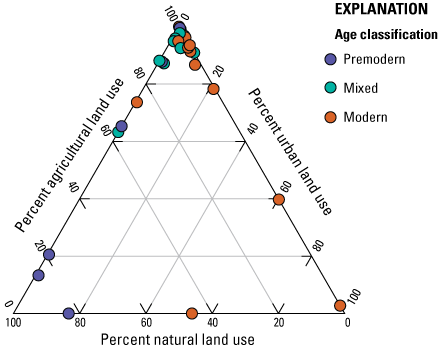
Percentages of urban, agricultural, and natural land use within the 500-meter buffers around domestic-supply wells used for assessment of groundwater quality and groundwater age classification in the San Joaquin Valley Kern County subbasin study unit, 2022, California Groundwater Ambient Monitoring and Assessment Program Priority Basin Project (Faulkner and Jurgens, 2025; Harkness, 2026).
The primary aquifers consist of alluvial sediments (mixtures of sand, silt, clay, cobbles, and boulders) and marine and continental deposits in the deeper part of the aquifers. Downward flow of groundwater is impeded by a subsurface clay layer, known as the Corcoran Clay, in the central part of Kern County. Groundwater recharge sources include the Kern River and intermittent streams along the edge of the subbasin, natural infiltration of precipitation that falls on the landscape and mountains in the winter months, and return flows from agricultural irrigation (Faunt, 2009; Visser and others, 2018). Managed recharge at groundwater banking facilities is predominantly along the Kern River but also in other parts of the study area (fig. 1). In addition to the Kern Water Bank, there are MAR projects managed by the Arvin-Edison Water Storage District, Berrenda Mesa Project, Buena Vista Water Storage District, Cawelo Water District, City of Bakersfield, Kern County Water Agency, Kern Delta Water District, North Kern Water District, Thomas N. Clark Recharge and Banking Project, Rosedale-Rio Bravo Water Storage District, Semitropic Groundwater Banking Project and West Kern Water District having a total storage capacity of 5.7 million acre feet (fig. 1; Faunt and others, 2024; Water Association of Kern County, 2026). The MAR projects receive water from the Kern River, State Water Project water sourced from the San Joaquin and Sacramento Rivers, and Central Valley Project water from the San Joaquin River (Warden and others, 2024a). The managed recharge is used to alleviate overdraft from pumping and store surface water during wet periods. The primary sources of groundwater discharge are water pumped for irrigation and municipal supply (California Department of Water Resources, 2020). Irrigation recharge in the basin primarily comes from surface water delivered via the canals but can include groundwater during drought years where surface deliveries are low.
In some parts of the Kern County subbasin, treated and blended oil and gas wastewater also is used for irrigation (Kondash and others, 2020). The Kern County subbasin contains 82 oil and gas fields covering approximately 1,618 km2 of the subbasin (21 percent). Of those 82 oil and gas fields, 36 were identified as high priority by the SWRCB’s Regional Groundwater Monitoring program for evaluation of potential effect of oil and gas development on the quality of groundwater resources that are or may be used for drinking water supplies (Davis and others, 2018).
Methods
This section describes the methods used for (1) defining groundwater quality using established regulatory and non-regulatory health-based and aesthetic-based benchmarks, (2) assigning grid cells and data used in the domestic-supply assessment, and (3) understanding the explanatory variables that may affect the distribution of groundwater quality. The methods used to collect and analyze groundwater samples and quality-control samples are described by Faulkner and Dupuy (2023). The methods used for compiling data for the explanatory variables are described in the two USGS data releases: Faulkner and Jurgens (2025) and Harkness (2026). The water quality data collected for the Kern County subbasin study unit by the GAMA-PBP are available in tabulated format in Faulkner and Dupuy (2023).
All published and quality-assured data collected for the GAMA-PBP are available through the USGS Water Data for the Nation (WDFN) web interface (https://waterdata.usgs.gov/ca/nwis/; U.S. Geological Survey, 2023), the USGS GAMA-PBP web tool (https://ca.water.usgs.gov/projects/gama/water-quality-results/; Jurgens and others, 2018), and the SWRCB’s GAMA groundwater information system (https://gamagroundwater.waterboards.ca.gov/gama/gamamap/public/; California State Water Resources Control Board, 2023).
Groundwater Quality Defined Relative to Water-Quality Benchmarks
The GAMA-PBP uses established benchmarks for public drinking water to contextualize groundwater quality from domestic wells, which are not regulated in California. Groundwater-quality data are reported here as relative concentrations (RCs), which are defined as the ratio between the concentration measured in a groundwater sample to the concentration of a constituent’s regulatory or non-regulatory benchmark, following approaches by previous studies to understand concentrations in a toxicological context (Toccalino and Norman, 2006; Rowe and others, 2007). This report focuses primarily on water-quality constituents with regulatory maximum contaminant level (MCL) benchmarks (Faulkner and Dupuy, 2023). Constituents with aesthetic-based, secondary maximum contaminant level (SMCL) benchmarks that affect groundwater color, taste, or odor are discussed to support the water quality assessment. Other constituents of interest with non-regulatory, health-based benchmarks (such as California State response levels or Federal health advisory levels) are discussed on a more limited basis. The comparison benchmarks for all constituents detected in samples collected from domestic wells are listed in Faulkner and Dupuy (2023). Regulatory and non-regulatory benchmarks used in the study are established by the U.S. Environmental Protection Agency (EPA), the SWRCB-Division of Drinking Water (SWRCB-DDW), and the USGS, and were selected in the following order of priority:
-
1. For constituents with regulatory, health-based benchmarks established by the SWRCB-DDW and the EPA: SWRCB-DDW maximum contaminant level (MCL-CA; California State Water Resources Control Board Division of Drinking Water, 2022a), the EPA maximum contaminant level (MCL-US; U.S. Environmental Protection Agency, 2018), and the EPA action levels (US-AL; U.S. Environmental Protection Agency, 2018). If the MCL-CA and MCL-US are the same value, the benchmark is called MCL-US. If the MCL-CA is lower than the MCL-US or no MCL-US exists, the benchmark is called MCL-CA. In 2024, the EPA set new MCLs for per- and polyfluoroalkyl substances (PFAS), which are applied for RC calculations in this report (U.S. Environmental Protection Agency, 2024).
-
2. For constituents lacking MCLs: aesthetic-based levels established as SMCLs by the SWRCB-DDW (SMCL-CA; California State Water Resources Control Board Division of Drinking Water, 2022b) or the EPA secondary maximum contaminant level (SMCL-US; U.S. Environmental Protection Agency, 2018). The salinity indicators chloride, sulfate, and total dissolved solids (TDS) have recommended upper SMCL-CA levels, and the values for the upper levels were used as water-quality benchmarks in this report. The only exception to the hierarchy described here is manganese. Manganese has an SMCL-CA of 50 micrograms per liter (µg/L), but also is compared to the EPA lifetime health advisory level (HAL-US) of 300 µg/L.
-
3. For constituents with neither MCL nor SMCL benchmarks: non-regulatory, health-based levels established as human health benchmarks for pesticides (HHBPs) by the EPA (U.S. Environmental Protection Agency, 2021), HAL-US by the EPA (U.S. Environmental Protection Agency, 2018), and the SWRCB-DDW notification and response levels (NL-CA and RL-CA; California State Water Resources Control Board Division of Drinking Water, 2022c). The HHBP benchmarks may have cancer and non-cancer levels; non-cancer levels were used. For constituents with RL-CA and HAL-US benchmarks, the benchmark with the lower concentration was used as the comparison benchmark. For constituents with RL-CA, the boundary between moderate and low concentrations is defined as the NL-CA, instead of either one-half or one-tenth the HAL-US or RL-CA benchmark used to define the boundary between high and moderate concentrations for other constituents (additional description of threshold boundaries is available below).
-
4. For constituents lacking EPA or SWRCB-DDW benchmarks: non-regulatory, health-based levels developed as health-based screening levels (HBSLs) by the USGS (Norman and others, 2018). The HBSL benchmarks may have cancer and non-cancer levels; non-cancer levels were used. The HBSL benchmarks based on toxicity data from EPA Provisional Peer-Reviewed Toxicity Values (Norman and others, 2018) were not used.
Concentrations of a given water-quality constituent exceeding its respective benchmark were considered “high.” Concentrations between the benchmark and one-half the benchmark (for inorganic constituents) or one-tenth the benchmark (for organic and PFAS constituents) were considered “moderate.” Concentrations smaller than the moderate threshold were considered “low.” The moderate classification indicates elevated concentrations below the benchmark and can help identify constituents of emerging concern in aquifer systems. The one-tenth threshold was set for organic constituents (such as pesticides, VOCs, and PFAS) because they are typically not naturally present in groundwater systems, and a lower threshold effectively highlights parts of the aquifer area vulnerable to anthropogenic contamination as opposed to inorganic constituents that are often present naturally at low levels in aquifer systems from water-rock interactions (Fram and Belitz, 2014).
Data Collected for Domestic-Supply Assessment
Groundwater-quality data used for the domestic-supply assessment came from sites sampled by the USGS for the GAMA-PBP Kern County subbasin study unit (fig. 1). The Kern County domestic-supply aquifer study unit was defined as the extent of the San Joaquin Valley Kern subbasin (basin number 5-022.14) delineated in the 2020 update of the California Department of Water Resources' Bulletin 118 used for domestic resources (California Department of Water Resources, 2020). The extent of the domestic groundwater resources was drawn using 1-km buffers around areas with at least 1 well determined from well density coverage calculated in Johnson and Belitz (2019). This method resulted in a discontinuous study area (fig. 1). The areal extent of the domestic groundwater resources was divided into 40 equal-area grid cells with a slight rotation, each having an area of about 85 km2 (fig. 1). From February to April 2022, one or two domestic groundwater wells were randomly selected for 29 of the grid cells to represent the groundwater resources used for domestic supply. No wells were available, or received permission to sample, in the remaining 11 grid cells. Sample sites for each grid cell were selected from lists of domestic-supply wells compiled using information obtained from the California Department of Water Resources well completion report database (Borkovich and others, 2019; California Department of Water Resources, 2024). Grid cells are non-continuous, and wells 9, 15, 16, 18, 29 fall outside the cell boundaries, but were assigned to the closest cell that did not contain a grid well as described in a USGS data release (Harkness, 2026). Additional information about the methods used to identify sites for sampling and assign site identifiers is provided in Faulkner and Dupuy (2023).
Groundwater samples were taken as close to the wellhead as possible to reflect the quality of ambient aquifer water before household plumbing or treatment systems. Sampling methods followed USGS protocols for groundwater quality sampling as described in the USGS National Field Manual (U.S. Geological Survey, variously dated) with modifications as described in Shelton and Fram (2017) and Burow and others (2024). The median and interquartile range of sampled well depths were 151 meters (m) and 105–197 m, respectively (Faulkner and Dupuy, 2023). Perforated or open intervals were mostly completed above the Corcoran Clay in locations where the clay was present, but seven wells were perforated through or below that confining layer.
The quality assurance and quality control protocols and results for the water-quality data collected for the Kern County subbasin domestic-supply study are described in Faulkner and Dupuy (2023) and are summarized here. Quality assurance evaluations were based on data from quality control samples collected for the Kern County subbasin study and on results from quality control samples collected for other GAMA-PBP study units or for the USGS National Water Quality Networks. Quality control samples collected for this study included three field replicate samples, three field blanks, and one source-solution blank (Faulkner and Dupuy, 2023). Blank detections include four VOCs (dimethoxymethane, benzene, carbon disulfide, and 1,1-difluoroethane) and five inorganic constituents (sulfate, copper, lead, zinc, and hexavalent chromium). Concentrations of trace elements below the study reporting levels (SRLs) defined by Bennett (2020) or below the concentrations detected in blanks collected for the Kern County subbasin study were reported as nondetections relative to a raised reporting level. Of the results originally reported by the laboratory as detections of low concentrations of inorganic constituents in groundwater samples, 46 were reclassified as nondetections, 15 with concentrations less than the highest blank detection, and 31 with concentrations less than SRLs defined by Bennett (2020) and Faulkner and Dupuy (2023). Results originally reported by the laboratory as detections of low concentrations of benzene and carbon disulfide were reclassified as nondetections based on detections of benzene in blanks (Faulkner and Dupuy, 2023) and an SRL established for carbon disulfide (Bexfield and others, 2022). A total of three replicate samples were collected, and all replicate pairs met the acceptance criteria with the following two exceptions: one replicate pair for enterococci consisted of a detection and a nondetection, and one replicate pair for diuron consisted of a detection at a concentration three times the method detection level and a nondetection. Faulkner and Dupuy (2023) also reported that replicate pairs for potassium and nickel did not meet acceptance criteria; however, in both cases, the replicate pair in question consisted of a detection with concentration at the method detection level and a nondetection.
The gridded sampling design used in GAMA-PBP studies allows results to be put in terms of the proportion of aquifer area with water quality in a defined range (for example, exceeding the MCL, or “high”). Wells sampled from individual grid cells represent a random sampling within a defined unit of the total aquifer area used for domestic groundwater resources (Belitz and others, 2010, 2015). The grid-based statistical approach was used to calculate the areal proportions of the domestic groundwater resources in the Kern County subbasin with high, moderate, and low RCs of constituents (eq. 1; Belitz and others, 2010):
wherePhigh
is the high-RC aquifer-scale proportion for the study unit,
is the number of wells in the cell represented having a high RC for the constituent in one or more wells,
Wc
is the number of wells in the cell, and
N
is the number of cells in the study unit having a site with data (including nondetections) for the constituent. This number varied because some sites did not have data for all constituents.
Moderate- and low-RC aquifer-scale proportions for the study unit were calculated in the same manner as high-RC aquifer-scale proportions. In addition to the aquifer-scale proportions of high, moderate, and low RCs, the detection frequencies for organic constituents were calculated as area-weighted detection frequencies. The detection frequency was calculated by using equation 1 with replaced by the number of samples with detections.
For ease of discussion, these proportions are referred to as “high,” “moderate,” and “low” aquifer-scale proportions. Aquifer-scale proportions were calculated for individual constituents, for groups of related individual constituents, referred to as “constituent classes,” and for “all constituents.” Aquifer-scale proportions for constituent classes were calculated using the maximum RC for any constituent in the class to represent the class for each site. For example, a site having a high RC for nitrate, moderate RC for 1,2,3-trichloropropane (1,2,3-TCP), and low RCs for other trace elements and organics would be counted as having a high RC when evaluated for the “all constituents” class.
Explanatory Variables
Characteristics of the aquifer system, geochemical conditions, and land cover are described using explanatory-variable data compiled for the 33 sites sampled for the study unit. Data generated during this study are available as a USGS data release (Harkness, 2026). The methods used for assigning values for each of the explanatory variables are described in the two USGS data releases: Faulkner and Jurgens (2025) and Harkness (2026). Summaries of statistical methods to evaluate the explanatory variables and modeling of noble gases and age tracers are described in this section.
Statistical Analyses
We used Spearman’s rho to determine if water-quality constituents were related to potential explanatory variables such as well depth, land use, groundwater age, and hydrologic conditions (table 1). Correlations measure the strength of an association between continuous variables and can support interpretations of processes affecting groundwater quality. The Kruskal-Wallis rank sum test was evaluated to test differences between water quality parameters and categorical variables, or groups of data, such as age class, redox class, land use or land cover class, and recharge source. Spearman’s rho and Kruskal-Wallis methods are nonparametric, rank-based statistical methods resistant to outliers and applicable in cases where water quality concentrations are not reported as numerical values (censored) because they are smaller than a reporting limit (Helsel and others, 2020). Spearman’s rho was calculated from the “rcorr” function in the “hmisc” package (Harrell and Dupont, 2023) of the R statistical program, and the Kruskal-Wallis ranks sum test was calculated from the “kruskal.test” in the base R package (R Core Team, 2024). We evaluated the significance of these statistical tests using a confidence level of 95 percent (p-value=0.05). Results of relations among explanatory variables and water quality constituents are reported in table 1.
Table 1.
Results of Spearman's rank correlation tests for relations between explanatory variables in the San Joaquin Valley Kern County subbasin study unit, 2022, California Groundwater Ambient Monitoring and Assessment Program Priority Basin Project (Faulkner and Dupuy, 2023; Harkness, 2026).[Spearman's rho (ρ) are shown for tests in which the variables were determined to be significantly correlated based on p-values (not shown) being less than the critical level (α) of 0.05. Negative numbers indicate a negative correlation. Abbreviations: δ2H, delta deuterium in water; δ18O, delta oxygen-18 in water; m, meters; VOC, volatile organic compound; —, Spearman’s test indicates no significant correlation between factors]
To better understand the interrelations between the explanatory variables land use and land cover, aridity, well depth, dissolved oxygen, mean groundwater age, percent modern water, oxygen stable isotopic composition of water (δ18O), recharge temperatures estimated from noble gases, and excess air, principal component analysis (PCA) was performed on data which had been centered to the mean and scaled to unit variance using the “prcomp” in the base R package (Helsel and others, 2020). Principal components are linear combinations of the original variables to form a new set of variables or axes, the first few of which often explain the primary patterns of the data in multivariate space. These new axes are uncorrelated with one another and have the property that the first principal component is the axis that explains more of the variance of the data than any other axis in the multidimensional space. A biplot shows variations in the data in multivariate space. Observations near each other on the biplot have similar characteristics in multivariate space. Variables whose vectors are close to each other are strongly correlated, and axes point in the direction of increasing value. Vectors heading at an angle of around 180 degrees from each other indicate a negative correlation.
Noble Gas and Residence Time Modeling
The distribution of groundwater age, or time traveled in the aquifer system since entering as recharge, in a sample can be used to assess the vulnerabilities of domestic groundwater resources. Modern water recharged post-1950 can contain anthropogenic contaminants (Shelton and others, 2001; Zogorski and others, 2006; Jurgens and others, 2010; Lindsey and others, 2017). Noble gases and age tracers, tritium, carbon-14, and sulfur hexafluoride, can be used to calibrate a groundwater age model (Jurgens and others, 2020). Noble gas modeling estimates excess air as excess neon concentrations (ΔNe), the temperature at the time of recharge, called the noble gas recharge temperature (NGRT), terrigenic helium-4 concentrations (4Heterr), tritogenic helium-3 (3He), and atmospheric helium isotopic ratio ([3He/4He]/[3He/4He]air or R/Ra). Terrigenic helium in groundwater is derived from radioactive decay of uranium and thorium in aquifer sediments, and higher terrigenic helium is associated with extensive water-rock interactions over hundreds to thousands of years. Tritogenic helium-3 is derived from radioactive decay of tritium in groundwater, and the atmosphere has a constant 3He/4He (Ra) ratio that can be identified in young, more recently recharged water. The R/Ra ratio changes due to increases in terrigenic helium with age and water-rock interactions (R/Ra<1) or rapid recharge that enriches tritogenic helium in groundwater (R/Ra>1). We used the program Dissolved Gas Modeling and Environmental Tracer Analysis (DGMETA; Jurgens and others, 2020) to model the recharge gas parameters as described in the USGS data release (Faulkner and Jurgens, 2025).
Groundwater age was estimated through calibration of environmental age tracers (sulfur hexafluoride, tritium, and carbon-14) to lumped parameter models (LPMs) using the computer program TracerLPM (Jurgens and others, 2012; Faulkner and Jurgens, 2025). The samples were calibrated to a dispersion model (DM) or a binary mixture of two DMs. The DM is an LPM that assumes that the age distribution in the well is due to dispersion in the aquifer. The DM has two free parameters (age and dispersion parameter), or five free parameters (age of the younger and older components, the dispersion parameters of the younger and older components, and the mixing fraction of the two components) in a binary mixture. The dispersion parameter can be adjusted to approximate other LPMs. Relative environmental tracer concentrations guided the calibration of LPMs to tracer concentrations; a DM was used to compute a best-fit mean age when environmental tracers indicated a single age, and a binary mixture of two DMs was used to simulate the mixing of modern and premodern groundwater (Jurgens and others, 2012). The mean age of the groundwater and the proportion of modern water determined from the resulting groundwater age distributions were used to examine correlations to groundwater quality. Groundwater age results and detailed processing steps are available as a USGS data release (Faulkner and Jurgens, 2025).
Status of Groundwater Quality
This report primarily focuses on water-quality constituents with regulatory benchmarks detected at high concentrations in the study area (fig. 3). Although domestic well water quality is not regulated, this report uses water quality health benchmarks for drinking water for comparison purposes to put groundwater quality in context of public health. Results are shown separately for inorganic and organic constituents. Inorganic constituents include trace elements and nutrients, which are often present naturally at low levels in groundwater due to chemical interactions with aquifer materials. Organic constituents include VOCs, pesticides, and PFAS, which tend to originate from human activities on the land surface, such as agriculture or industry. Inorganic and organic constituents were present at high concentrations exceeding an MCL benchmark in 45 percent and 41 percent of domestic groundwater resources, respectively (fig. 4). Another 24 and 3.4 percent, respectively, had moderate concentrations below MCL benchmarks (fig. 4).
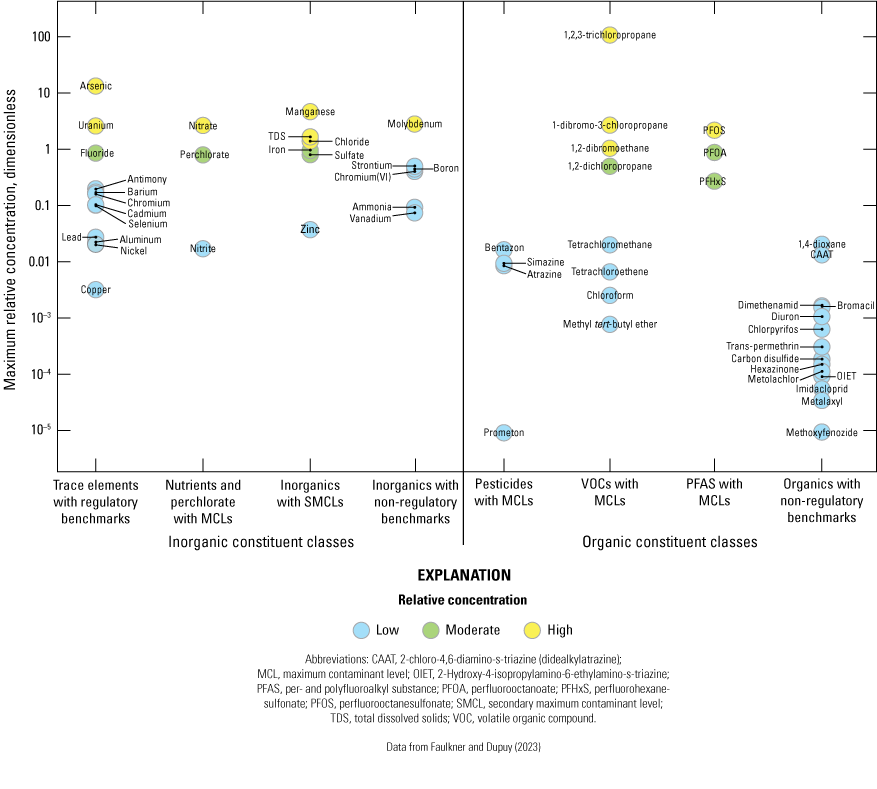
Maximum relative concentrations of constituents detected in domestic-supply wells sampled in the San Joaquin Valley Kern County subbasin study unit, 2022, California Groundwater Ambient Monitoring and Assessment Program Priority Basin Project (Faulkner and Dupuy, 2023). Relative concentration is the ratio of the sample concentration to regulatory benchmarks, including maximum contaminant levels (MCLs), secondary maximum contaminant levels (SMCLs), and non-regulatory health-based benchmarks.
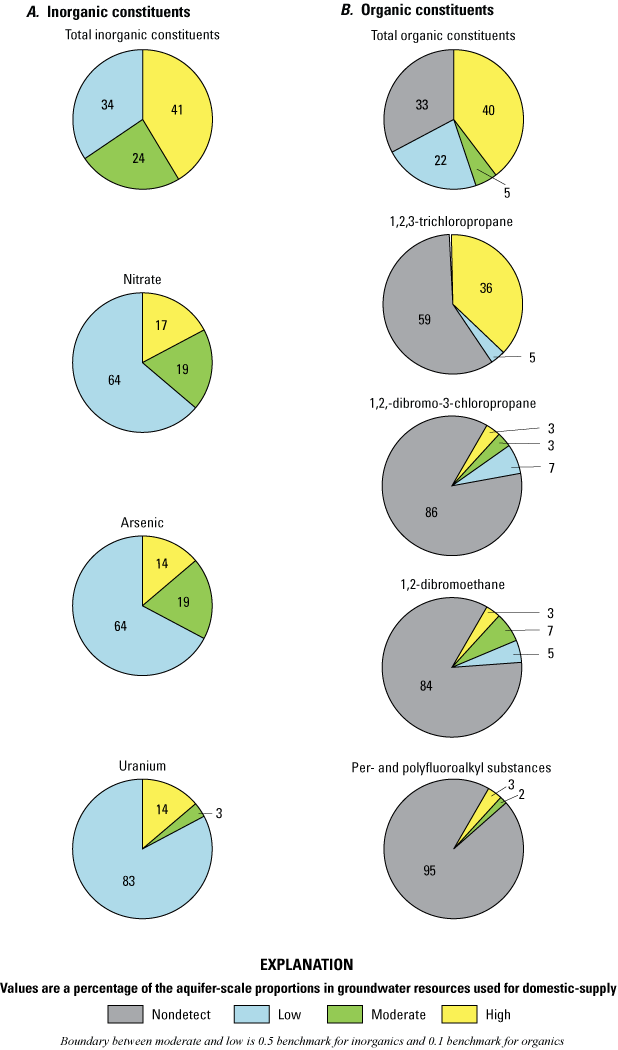
The proportion of the domestic groundwater resources having high, moderate, or low concentrations of A, inorganic constituents; or B, organic constituents with regulatory maximum contaminant level benchmarks in the San Joaquin Valley Kern County subbasin study unit, 2022, California Groundwater Ambient Monitoring and Assessment Program Priority Basin Project (Faulkner and Dupuy, 2023).
Domestic wells in the Kern County subbasin contained concentrations of trace elements, nutrients, and organic compounds that exceed a California or U.S. MCL (fig. 3). Nitrate, arsenic, and uranium were the inorganic constituents that exceeded MCLs (10 milligrams per liter [mg/L], 10 µg/L, and 30 µg/L, respectively) in 5 samples each (17, 14, and 14 percent of the domestic groundwater resource, respectively; figs. 4, 5A). Concentrations of major ions, trace metals, and organic compounds also exceeded non-regulatory, health-based, and aesthetic-based benchmarks (fig. 5B) but are not included in the areal proportion calculations in figure 3. Chloride, TDS, and manganese exceeded the secondary maximum contaminant level in 9, 12, and 9 percent of the domestic groundwater resource, respectively (fig. 5B). A non-regulatory health-based benchmark was exceeded by molybdenum in 3 percent of the resource (fig. 5B).
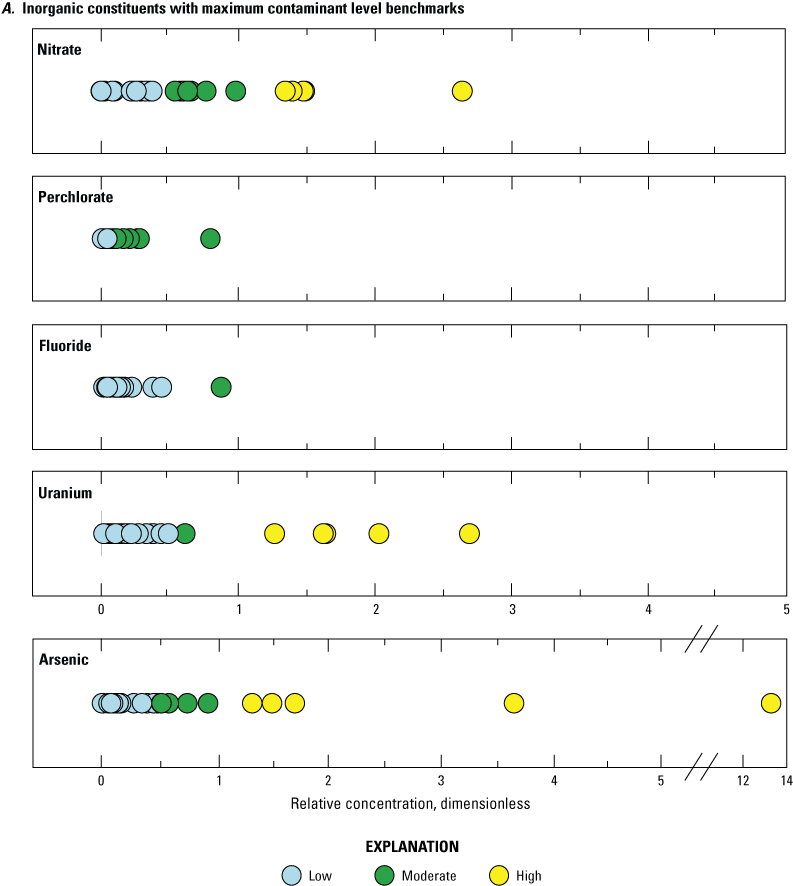
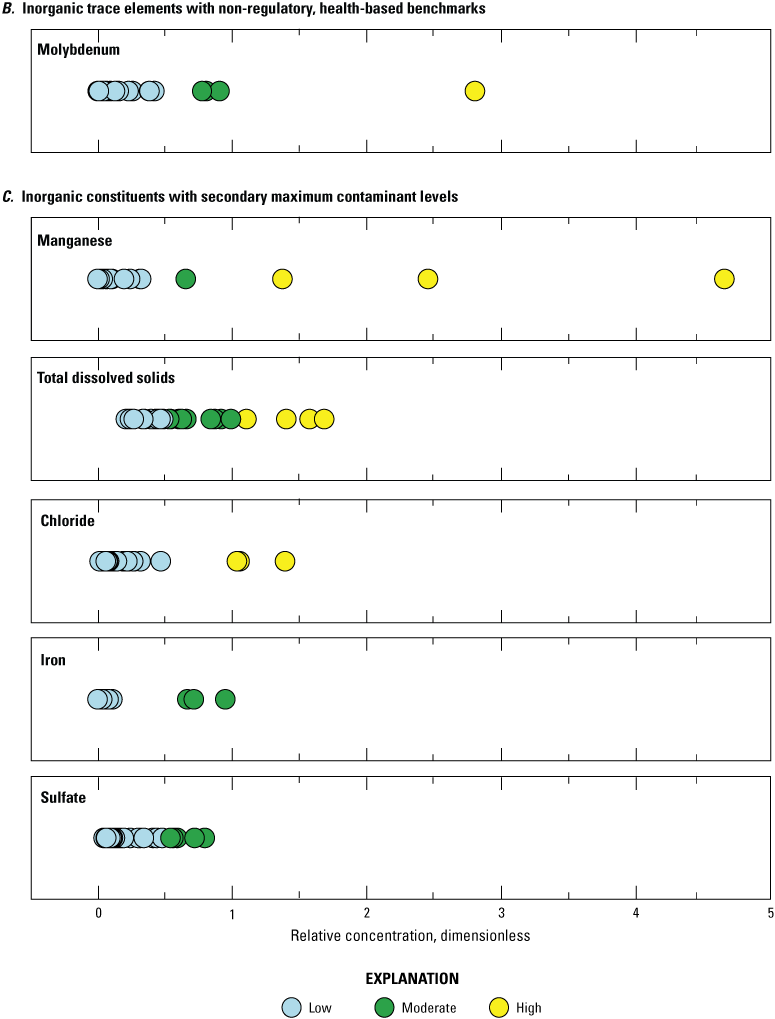
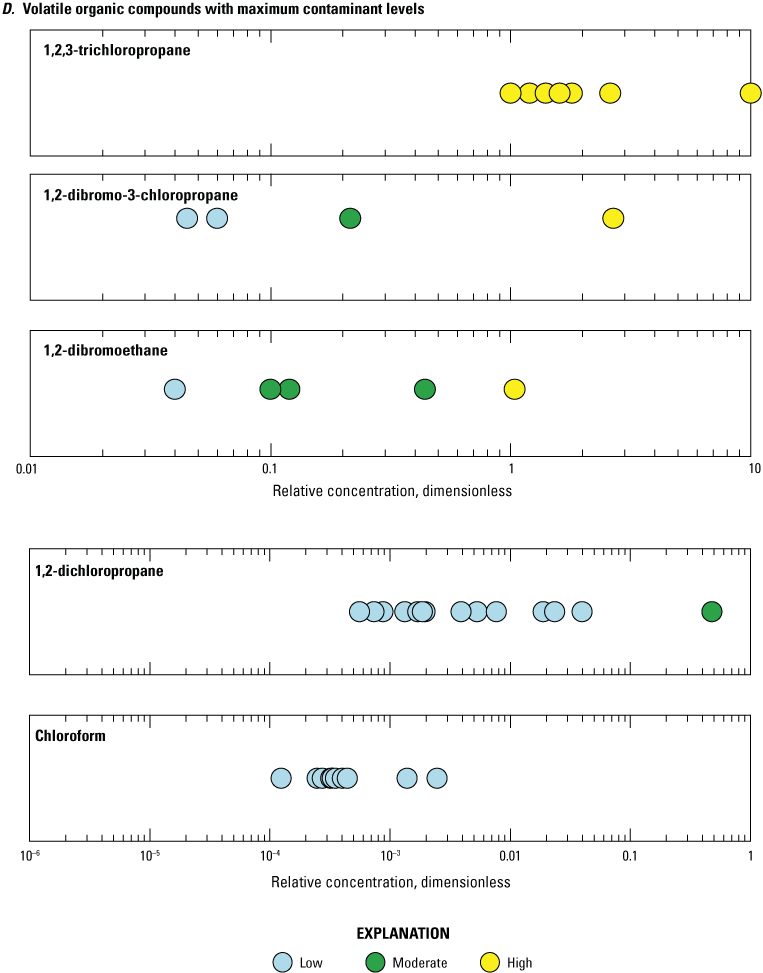
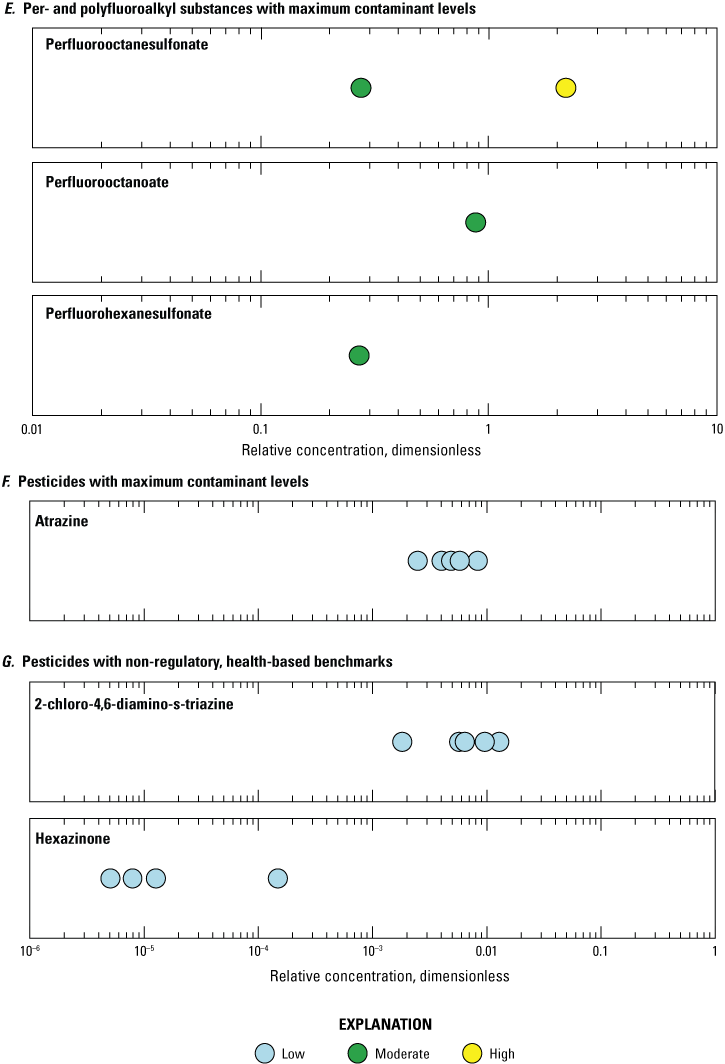
Relative concentrations of selected constituents in groundwater samples collected from domestic-supply wells, San Joaquin Valley Kern County subbasin study unit, 2022, California Groundwater Ambient Monitoring and Assessment Program Priority Basin Project (Faulkner and Dupuy, 2023): A, inorganic constituents with maximum contaminant level benchmarks; B, inorganic trace elements with non-regulatory, health-based benchmarks; C, inorganic constituents with secondary maximum contaminant levels; D, volatile organic compounds with maximum contaminant levels; E, per- and polyfluoroalkyl substances with maximum contaminant levels; F, pesticides with maximum contaminant levels; and G, pesticides with non-regulatory, health-based benchmarks. Benchmarks are listed in Faulkner and Dupuy (2023). Nondetections are not plotted.
The fumigant 1,2,3-TCP was the constituent most commonly present at high concentrations (RC greater than 1), with 38 percent of the domestic groundwater resource having concentrations more than the MCL of 0.005 µg/L (figs. 4, 5C). Three other organic constituents were detected at high concentrations: two fumigants, 1,2-dibromo-3-chloropropane (dibromochloropropane; DBCP) and 1,2-dibromoethane (EDB), and the per- and polyfluoroalkyl substance (PFAS) perfluorooctanesulfonate (PFOS). The two fumigants DBCP and EDB were detected at concentrations greater than their MCLs of 0.2 µg/L and 0.05 µg/L in well S15-KERBS-32 and PFOS was detected at a concentration greater than its MCL of 4 nanograms per liter (ng/L) in well S15-KERBS-09 (Faulkner and Dupuy, 2023), resulting in high concentrations of these three organic compounds in 3 percent each of domestic groundwater resource (fig. 4). Fumigants are VOC pesticides that have historically been applied to agricultural crops, such as vineyards or orchards, for nematode control in the Central Valley (Burow and others, 2024). Although 1,2,3-TCP, DBCP, and EDB were all banned in the late 1970s and early 1980s, they have long half-lives and can persist in groundwater (Burow and others, 2019, 2024). 1,2,3-TCP has been widely detected in California groundwater due to nonpoint source agricultural inputs (Burow and others, 2019).
One disinfection by-product (chloroform), one fumigant (1,2-dichloropropane), and two herbicides (atrazine and hexazinone) were detected in more than 10 percent of samples but did not exceed any benchmarks, and four pesticide degradates (2-chloro-4,6-diamino-s-triazine, 2-chloro-6-ethylamino-4-amino-s-triazine, 4-hydroxychlorothalonil, and metolachlor sulfonic acid) were detected in more than 10 percent of samples but they do not have regulatory benchmarks (fig. 5D). Chloroform is the most common VOC detected in groundwater in the United States (Zogorski and others, 2006; Bexfield and others, 2022).
Per- and polyfluoroalkyl substances encompass a collection of human-made fluorinated compounds that have a myriad of industrial uses, most commonly as surfactants in industrial processes (McMahon and others, 2022; Tokranov and others, 2024). Per- and polyfluoroalkyl substances are stable and persistent in the environment, and can be sourced from atmospheric deposition, direct discharge, and use of PFAS-containing products, including fire-resistant furniture, fire-fighting chemicals, and non-stick cooking appliances. The EPA announced the final National Primary Drinking Water Regulation in April 2024 that established an MCL of 4 ng/L for the PFAS compounds perfluorooctanoate (PFOA) and PFOS, and an MCL of 10 ng/L for perfluorohexanesulfonate (PFHxS), perfluorononanoate (PFNA), and hexafluoropropylene oxide dimer acid (HFPO-DA; U.S. Environmental Protection Agency, 2024). In the Kern County subbasin study unit, 5 of the 28 measured PFAS compounds, PFOA, PFOS, PFHxS, perfluoropentanoate (PFPeA), and perfluorohexanoate (PFHxA), were detected in one sample, and PFOS was also detected in a second sample (Faulkner and Dupuy, 2023). PFOS was the only PFAS that exceeded the MCL, and the remaining detections were at moderate concentrations (fig. 5C).
Factors that Affect Groundwater Quality
For the understanding assessment, relations between groundwater quality and potential explanatory variables are examined to identify the physical and chemical processes that could be affecting water quality. This section of the report contains (1) description of the factors that affect groundwater quality; (2) identification of sources of recharge to wells; (3) discussion of the spatial distribution of wells with high concentrations of constituents primarily affected by anthropogenic factors, constituents primarily affected by geogenic factors, and constituents that are salinity indicators; and (4) identification of old groundwater tapped by domestic wells.
Explanatory Factors
The explanatory factors described here provide insight into the processes potentially affecting groundwater quality. Factors that show relations to water-quality constituents that exceed thresholds in the domestic groundwater resources in the Kern County subbasin include groundwater age classification, stable isotopic composition of water, reduction-oxidation (redox) conditions, and land use.
Groundwater Age
Groundwater age is a measure of the time that water has resided in an aquifer or traveled from a recharge source to a sample point, such as a well. A single sample represents a distribution of ages through the depth of the aquifer captured by the well. Modern groundwater recharged after about 1950, is characterized by higher concentrations of tritium and carbon-14 scavenged from the atmosphere by rain before infiltrating into the aquifer system (Lindsey and others, 2019). Premodern groundwater, recharged before about 1950 and sometimes up to thousands of years old, has lower concentrations of tritium and carbon-14. Wells often contain mixtures of modern and premodern groundwater, and lumped parameter modeling using the tritium and carbon-14 concentrations was used to calculate mean ages and fraction of modern water in wells with binary age mixtures (Jurgens and others, 2020; Faulkner and Jurgens, 2025). Modeled mean ages in domestic wells in the study unit ranged from 12 to 36,000 years, but mean age alone does not provide enough information to determine if modern and premodern groundwater are mixed in a sample. Groundwater age classification was determined from modeled fraction of modern water and tritium concentrations. Wells with modeled modern fractions less than 5 percent were classified as premodern (18 percent). Wells with tritium concentrations greater than 1 tritium unit (TU) and the modern fraction greater than 75 percent were classified as modern (45 percent), and wells with tritium concentrations below 1 TU and more than 5 percent modern fraction were classified as mixed (37 percent; table 1; fig. 6A; Harkness, 2026). Groundwater ages increased with distance from the Kern River (fig. 7A) and wells with modern-aged groundwater were located near the Kern River, local rivers, canals, and recharge ponds (fig. 6A).
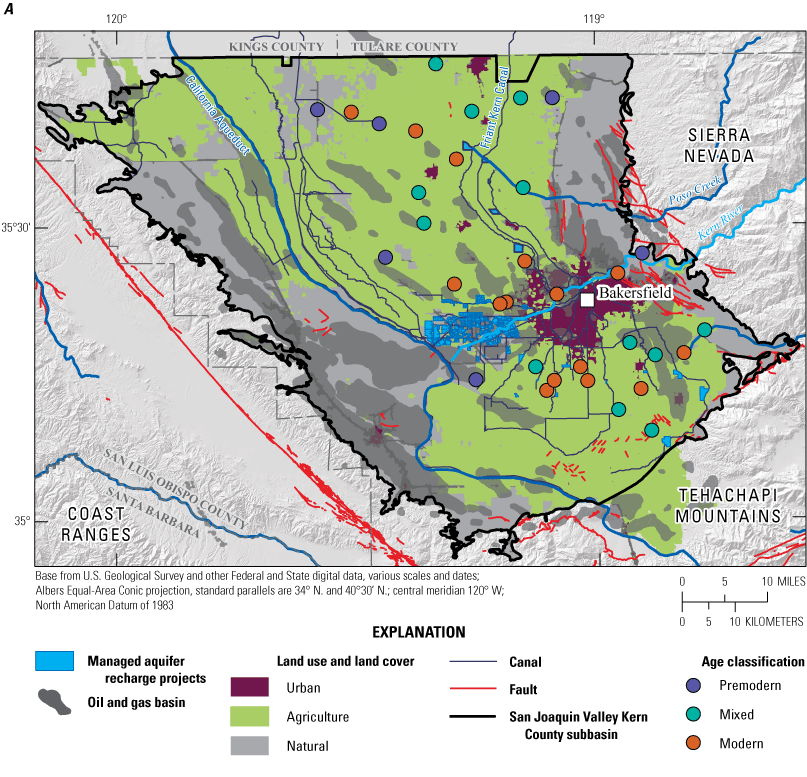
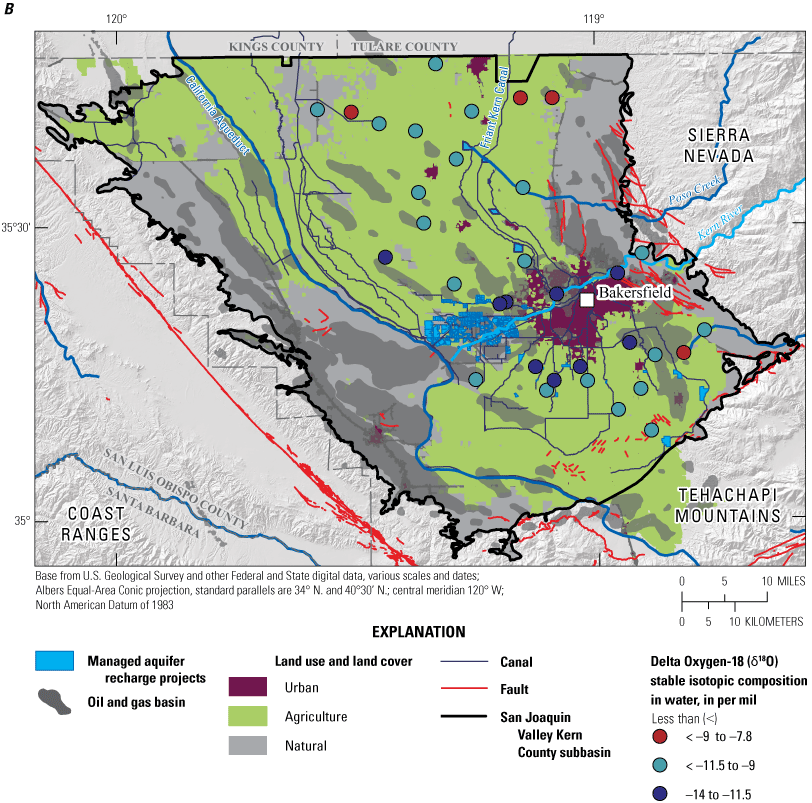
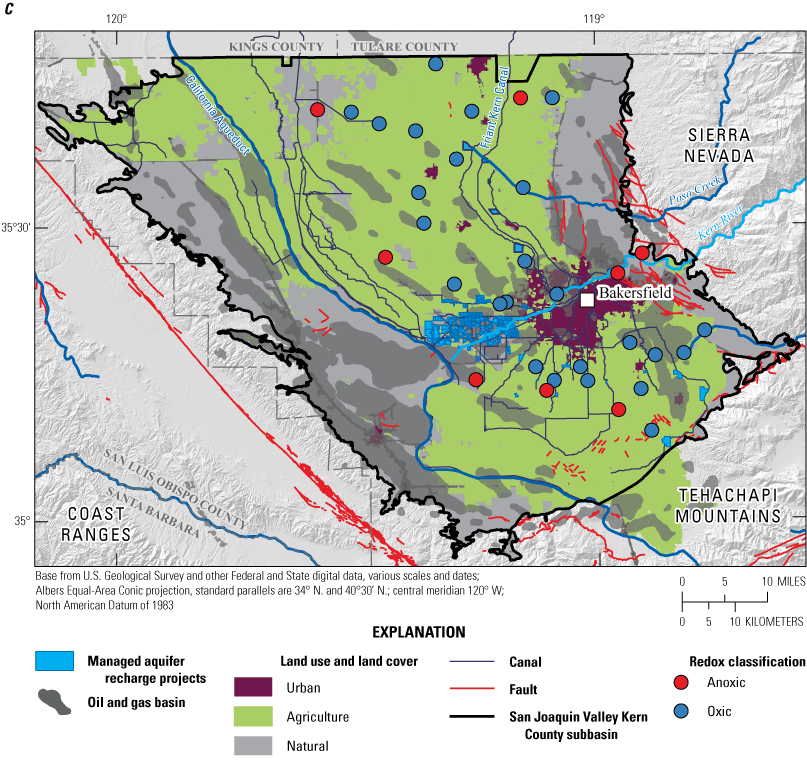
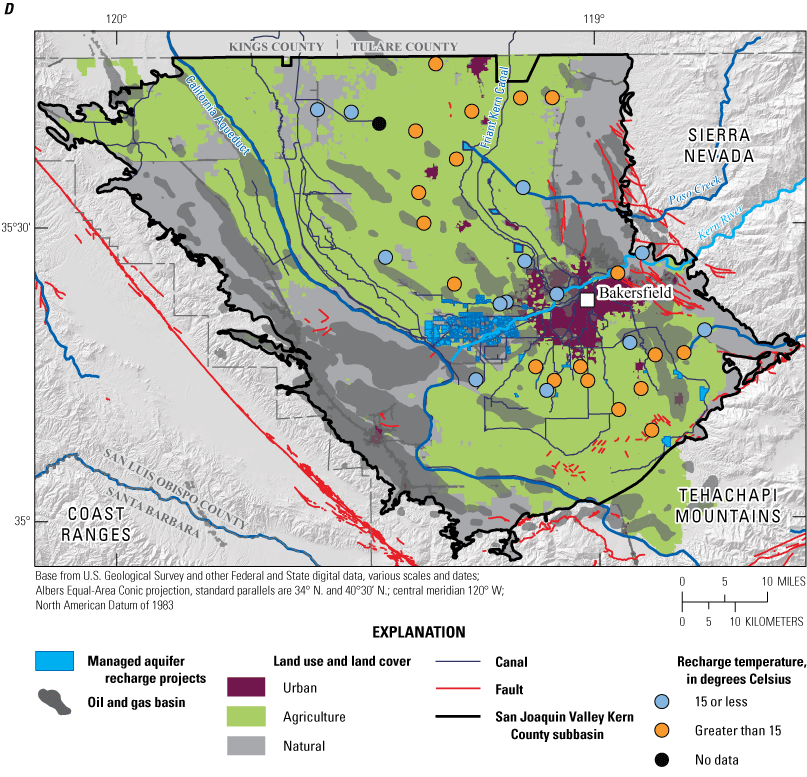
Study-area boundary, land use, surface water features, oil and gas basins, and explanatory variables for sampled wells of A, age classification; B, oxygen stable isotopic composition in water in per mil; C, redox classification; and D, recharge temperature in the San Joaquin Valley Kern County subbasin study unit, 2022, California Groundwater Ambient Monitoring and Assessment Program Priority Basin Project (Falcone, 2015; Harkness, 2026).
Water Isotopes
Stable isotopes of water, delta oxygen-18 (δ18O) and delta hydrogen-2 (δ2H) provide a tracer of recharge source and can be used to identify the relevant contributions of river water to groundwater wells throughout the Central Valley and other parts of California (Visser and others, 2018; Wright and others, 2019; Burow and others, 2024; McMahon and others, 2024). In the domestic well samples, we see clustering of lighter, more negative oxygen stable isotope ratios in waters with δ18O values between −11 and −14 per mil and heavier, less negative δ18O values between −10 and −7.5 per mil (figs. 6B; Faulkner and Dupuy, 2023). The lighter isotope ratios were present in groundwater closer to the Kern River and recharge areas around Bakersfield (fig. 6B). Wells with heavier isotope ratios were further away from the Kern River, with the heaviest values in wells in the northern part of the study area (fig. 6B). Isotope ratios increased significantly with distance from the Kern River (p-value<0.001; table 1), consistent with the classification of groundwater with ratios lighter than −12 per mil as recharged with river water (fig. 7B; Visser and others, 2018).
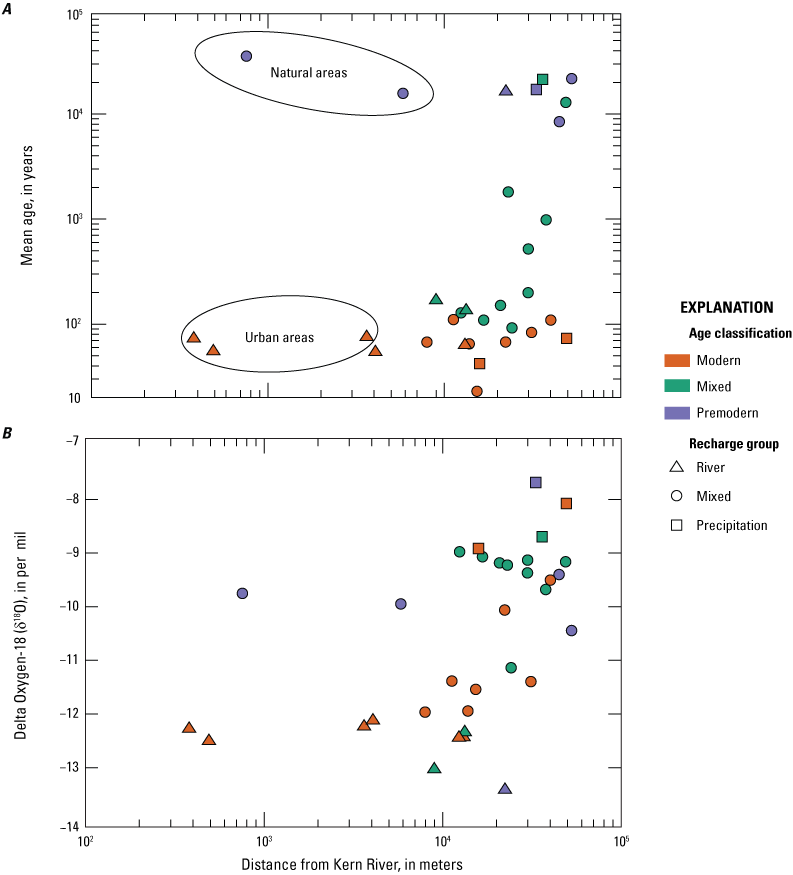
Relations of A, mean groundwater age and B, oxygen stable isotopic composition of water (δ18O) with distance of the well from the Kern River, age class, and recharge source in domestic wells in the San Joaquin Valley Kern County subbasin study unit, 2022, California Groundwater Ambient Monitoring and Assessment Program Priority Basin Project (Faulkner and Dupuy, 2023; Faulkner and Jurgens, 2025; Harkness, 2026). Wells located in natural and urban areas are encircled.
Lechler and Niemi (2012) calculated a local meteoric water line (LMWL) for the southern San Joaquin Valley of δ2H=7.0×δ18O−5.2 (fig. 8). Local precipitation in the San Joaquin Valley has an δ18O value of −8.2±0.2 per mil (Visser and others, 2018). The Kern River has a lighter, more negative δ18O value of −13.34 (Kendall and Coplen, 2001) per mil that intersects the LMWL consistent with water sources from high-elevation Sierra Nevada headwaters (fig. 8; Wright and others, 2019). In addition to the Kern River, managed recharge projects receive water from the State Water Project and the Central Valley Project. These sources have higher δ2H and δ18O values compared to the Kern River, which could explain the number of wells with mixed source stable isotope ratios (Warden and others, 2024a).
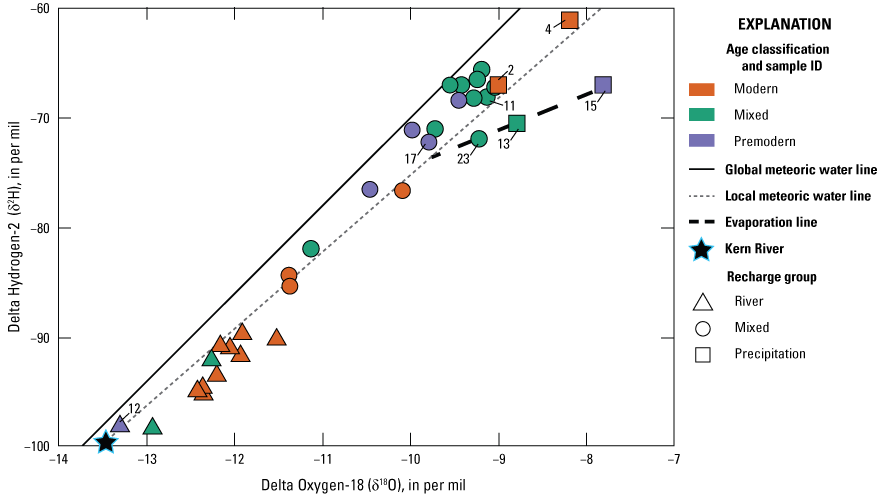
Relations between stable isotope ratios in water, age class, and recharge group for sampled wells in the San Joaquin Valley Kern County subbasin study unit, 2022, California Groundwater Ambient Monitoring and Assessment Program Priority Basin Project (Faulkner and Dupuy, 2023; Faulkner and Jurgens, 2025; Harkness, 2026). Global meteoric water and local meteoric water line are derived from Craig (1961) and Lechler and Niemi (2012). Kern River value from Coplen and Kendall (2000).
Most domestic well water samples containing modern water had lighter stable isotope ratios (river water group), whereas most mixed and premodern samples had heavier stable isotope ratios (precipitation and mixed group; fig. 8). Wells in the river water group fell to the right of the LMWL which is consistent with the stable isotopes ratios being affected by higher rates of evaporation in managed recharge ponds or agricultural fields (fig. 8). Wells in the precipitation and mixed group tended to fall on or between the LMWL and global meteoric water line from Craig (1961; fig. 8). A subset of samples (S15-KERBS-13, S15-KERBS-15, S15-KERBS-23) close to the northeastern boundary of the study area plotted to the right of the LMWL, consistent with a more evaporative source (fig. 8).
Redox Classification
The oxygen content of groundwater affects the mobilization and degradation of some constituents in groundwater and appears to be a driver in the presence of nutrients, trace elements, and VOCs in domestic wells in Kern County subbasin. Wells sampled in the study unit were categorized as oxic or anoxic (fig. 6C; Harkness, 2026). Samples with DO greater than 1 mg/L were classified as oxic (76 percent of samples), and samples with DO concentrations below 1 mg/L were classified as anoxic (24 percent of samples). Anoxic wells were generally reported in the outer edges of the study area and the eastern extent of the Kern River, in wells with premodern groundwater (fig. 6C).
Groundwater from wells in fine-grained alluvial sediments, especially those at the far end of groundwater flow paths, are more likely to be anoxic because of the geochemical evolution of groundwater as it moves through the system (McMahon and Chapelle, 2008). Median DO concentrations were significantly higher (p-value=0.045) in modern (5.3 mg/L) and mixed (4.25 mg/L) groundwater than premodern groundwater (0.325 mg/L; fig. 9).
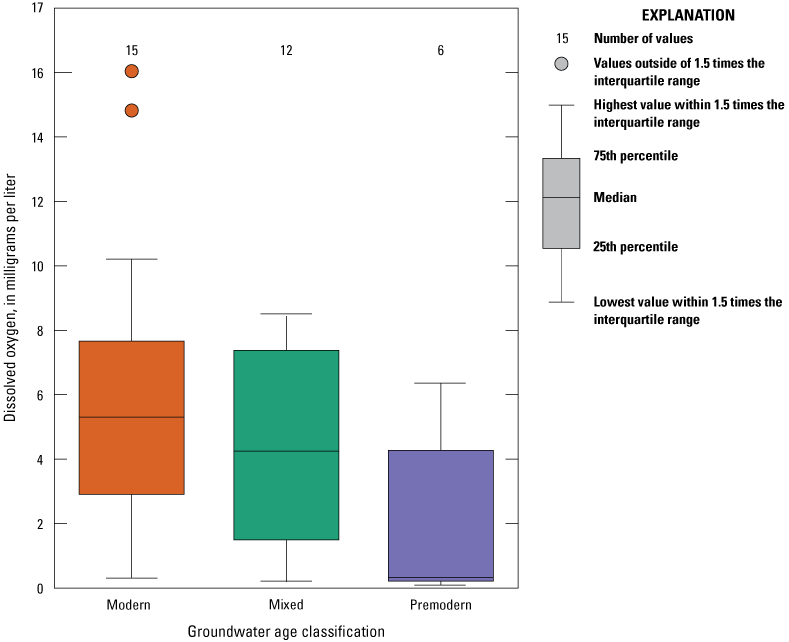
Relations of dissolved oxygen concentrations and groundwater age classification in domestic wells in the San Joaquin Valley Kern County subbasin study unit, 2022, California Groundwater Ambient Monitoring and Assessment Program Priority Basin Project (Faulkner and Dupuy, 2023; Harkness, 2026).
Land Use
Most domestic wells (80 percent) were in areas defined by agricultural land use, with an overall average agricultural land use of 77 percent within a 500-m radius of wells (fig. 2; Harkness, 2026). Three of the domestic wells (9.1 percent) were in urban areas, defined here as greater than 50 percent urban land use within a 500-m radius of the well. These wells are near Bakersfield, the only large metropolitan area in the study unit. The average proportion of urban land use in the 500-m buffers around all 33 wells was 9.6 percent, and the proportion of urban land decreased with distance from the Kern River (p<0.001; table 1; fig. 10). Three wells (9 percent) were in low-use natural areas, defined here as greater than 50 percent natural land use within a 500-m radius of the well, and the average natural land proportion for all 33 wells was 13.4 percent within a 500-m radius (Harkness, 2026).
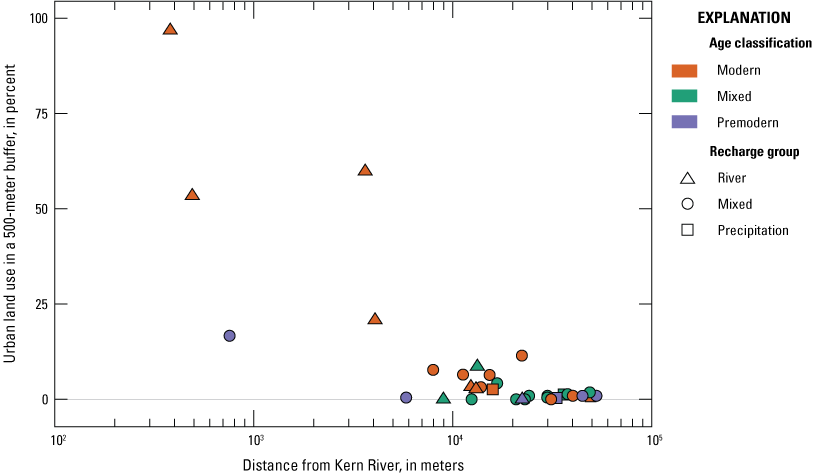
Relations between proportion of urban land use in a 500-meter radius, distance from the Kern River, age class, and recharge group for domestic wells in the San Joaquin Valley Kern County subbasin study unit, 2022, California Groundwater Ambient Monitoring and Assessment Program Priority Basin Project (Harkness, 2026).
Land use is related to groundwater age and recharge sources in domestic wells. The median age of groundwater in urban wells is 43 years, which is lower than the median age of 65 years in agricultural wells and significantly lower (p-value=0.012) than the median of 21,000 years in wells in natural areas (fig. 11). The fraction of modern water increased with proportion of urban land use and decreased with natural land use and δ18O decreased with proportion of urban land use due to recharge of young river water in the Bakersfield area and increased with proportion of natural lands (table 1; fig. 12). The proportion of agricultural land use was not correlated with age or stable water isotope ratios likely due to mixed sources of water used for irrigation that is recharging the domestic groundwater resources in agricultural areas.
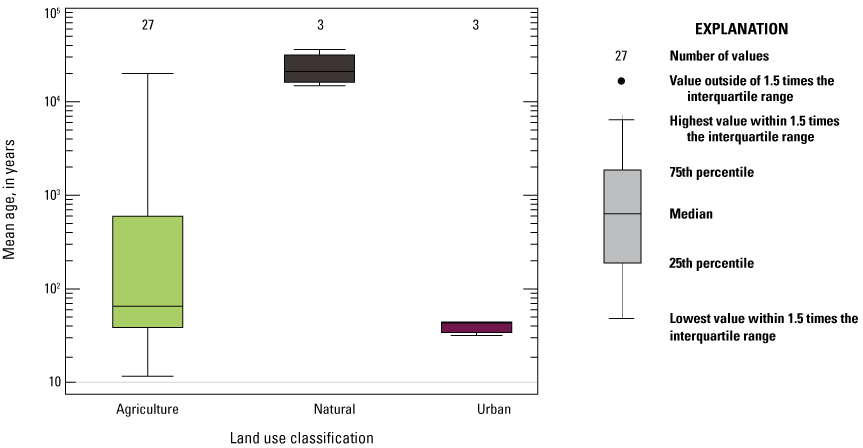
Relations between mean groundwater age and urban land use classification around a domestic well in the San Joaquin Valley Kern County subbasin study unit, 2022, California Groundwater Ambient Monitoring and Assessment Program Priority Basin Project (Faulkner and Jurgens, 2025; Harkness, 2026).
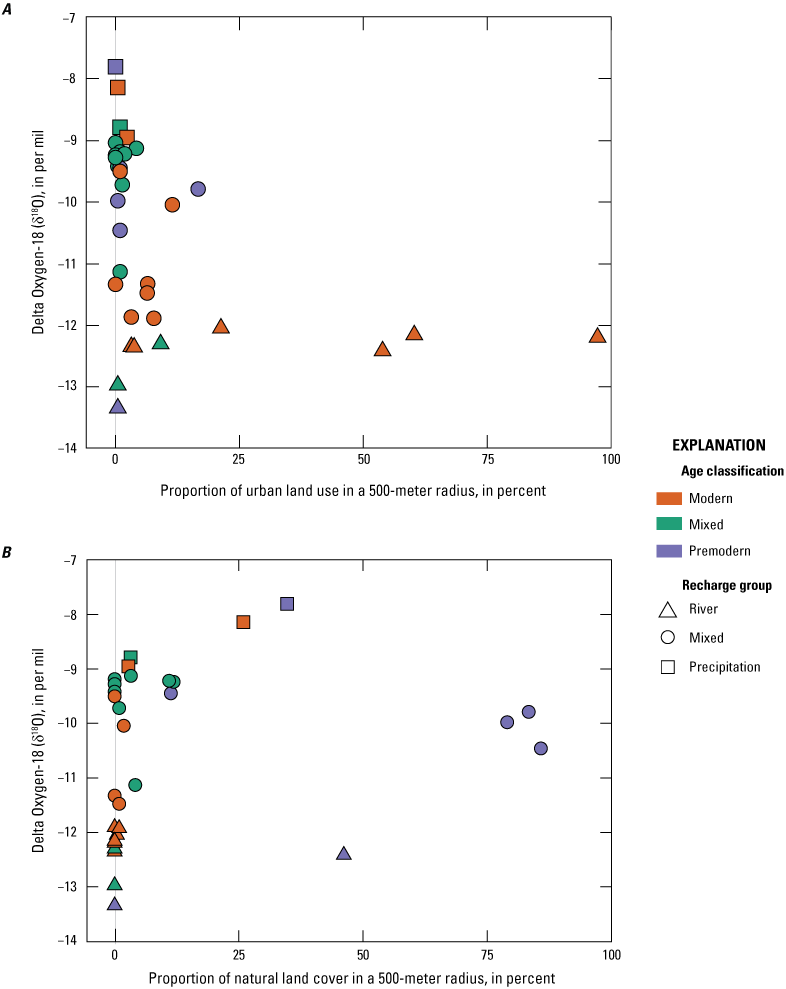
Relations between oxygen stable isotopic composition of water (δ18O), age class, recharge group, A, proportion of urban land use in a 500-meter radius; and B, proportion of natural land cover in a 500-meter radius around a domestic well in the San Joaquin Valley Kern County subbasin study unit, 2022, California Groundwater Ambient Monitoring and Assessment Program Priority Basin Project (Faulkner and Dupuy, 2023; Harkness, 2026).
Noble Gas Modeling
Noble gases in groundwater provide information about the recharge environment of the water source before it migrates to drinking water wells. Estimated NGRTs reflect the air temperature at the time and location of recharge. The NGRT in domestic wells are from 9.3 to 25 degrees Celsius (°C), reflecting a range from temperatures at high elevation in the Sierra Nevada to summer temperatures in the valley. Recharge of Kern River water in the Bakersfield area is associated with significantly lower NGRT (14.4 °C) than the mean annual air temperature (19.2 °C) due to higher elevation sources in the Sierra Nevada and rapid infiltration riverbed and recharge ponds, limiting equilibration of the colder river water with warmer atmospheric temperatures in the valley (Visser and others, 2014, 2018). The NGRT increased with the proportion of agricultural area around domestic wells and distance of domestic wells from the Kern River for wells with mixed and modern groundwater ages (table 1; fig. 13). Higher NGRTs in agricultural areas is consistent with recharge of summer irrigation water and lower NGRTs closer to the Kern River is consistent with recharge of river water derived from winter precipitation at higher elevation (fig. 6D; Cey and others, 2008; Visser and others 2018; Castaldo and others, 2021).
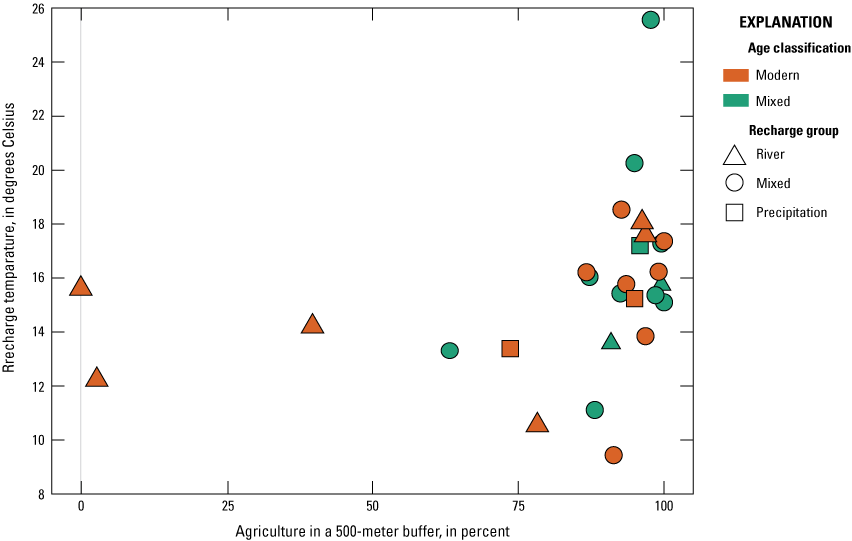
Relations between recharge temperature modeled from noble gas data (NGRT), proportion of agriculture land use in a 500-meter radius around a domestic well, age class, and recharge group in the San Joaquin Valley Kern County subbasin study unit, 2022, California Groundwater Ambient Monitoring and Assessment Program Priority Basin Project (Faulkner and Jurgens, 2025; Harkness, 2026).
During rapid recharge, excess air bubbles are trapped or dissolved into groundwater, and ΔNe is a measure of that excess air (Cey and others, 2008). The ΔNe in domestic wells ranged from 6.2 to 283 percent. High excess air is associated with enhanced recharge, particularly due to MAR. The higher ΔNe in domestic wells in the Kern County study unit, particularly above 100 percent, are derived from enhanced recharge in the Kern River and MAR operations (Cey and others, 2008; Visser and others, 2014, 2018).
Principal Component Analysis
Multivariate analysis using PCA helps to evaluate the relations between groundwater age, recharge source indicators, redox conditions, and land use in a highly complex system like the Kern County subbasin. Variables that plot close to each other are more correlated than variables that plot further away. The length of the vector, or arrows, shows the amount of variability contributed by the variable in the first two principal components. Principal components (PC) 1 and 2 explain more than 60 percent of the variability in the explanatory variables (fig. 14). Mean age and proportion of natural land cover are strongly associated with PC 1 and increase in the positive direction, whereas proportion of agricultural land use is strongly associated with PC 1 in the negative direction (fig. 14). Dissolved oxygen is also associated with PC 1 in the negative direction but contributes a smaller amount to total variability. Proportion of urban land use is strongly associated with PC 2 in the positive direction, whereas water level, well depth, and NGRT are strongly associated with PC 2 and increase in the negative direction (fig. 14). The fraction of modern water, ΔNe, stable isotopes of water, and aridity are associated with both PC1 and PC2. Aridity and water isotopes increase in the positive PC1 direction and negative PC2 direction, whereas the modern fraction and ΔNe increase in the negative PC1 direction and positive PC2 direction. ΔNe shows a weaker association with PC1 and PC2 than that of other variables.
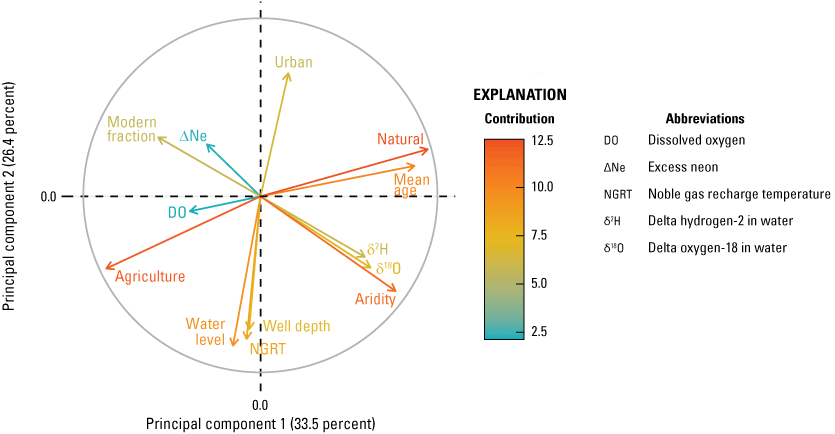
Contributions of explanatory variables to principal components 1 and 2 from multivariate principal component analysis for sampled wells in the San Joaquin Valley Kern County subbasin study unit, 2022, California Groundwater Ambient Monitoring and Assessment Program Priority Basin Project (Faulkner and Jurgens, 2025; Harkness, 2026).
The PCA results indicate the relation between groundwater age and land use, with age increasing with increasing proportion of natural land cover, and the fraction of modern water increasing with agricultural and urban land use. The presence of modern water is related to DO and ΔNe variations, with a greater effect of urban land use on ΔNe and agricultural use on DO. The fraction of modern water and ΔNe vary inversely to the stable isotope ratios of water, likely due to young, river water recharging at MAR operations having lighter, more negative ratios compared to local precipitation. Less negative, heavier stable isotopes of water close to the local precipitation ratio of −8 per mil (Visser and others, 2018) are associated with older water in natural areas and deeper wells with deeper water levels. Well depth and water levels vary inversely with the fraction of modern water and the proportion of urban land use, suggesting that wells near the Kern River and MAR operations around Bakersfield have shallow water levels and younger water related to the river water recharge. The NGRT is closely related to water level and well depth, as well as agricultural land use, suggesting that summer irrigation water is a larger fraction of groundwater in deeper wells in agricultural areas further from the Kern River and MAR.
Recharge Sources
Combining geochemical, isotopic, and geospatial analyses provides a framework for delineating multiple sources and processes affecting water quality in the domestic groundwater resources of the Kern County subbasin. The explanatory variables helped build a conceptual model of the groundwater system and geochemical environment in the parts of the aquifer system used by domestic wells. Although the Kern River used to be a source of groundwater discharge in the basin, pumping and river diversions have led to the river becoming a primary source of recharge (Faunt, 2009; Visser and others, 2018; Wright and others, 2019). In addition, MAR projects at the Kern Water Bank and in the eastern part of Kern County, enhance recharge of surface water from the Kern River, State Water Project, and Friant-Kern Canal into the aquifer system (fig. 1). Wright and others (2019) reported modern water from the Kern River as a primary source of recharge in public-supply wells in the Fruitvale Oil Field, just north of Bakersfield near the Kern River and recharge areas. They reported a positive correlation between the fraction of modern water and distance to the Kern River in their sample set, but mean age was not correlated with distance. The samples collected by Wright and others (2019) were more densely located in an area within 6 km of the Kern River, whereas the samples collected for the GAMA-PBP were distributed throughout the Kern County subbasin and include samples collected in natural areas up to 52 km away from the river (fig. 1). A study by McMahon and others (2024) also reported that the Kern River, Poso Creek, and adjacent engineered recharge facilities were sources of modern recharge in the Poso Creek Oil Field northeast of Bakersfield. As noted in previous studies (Cey and others, 2008; Visser and others, 2018; Wright and others, 2019; Castaldo and others, 2021), a plume of isotopically light (δ18O<−12 per mil) groundwater extends out from the Kern River (fig. 6B). Wells in the plume contain modern and oxic water (DO concentrations between 4.6 and 16 mg/L; figs. 6A, 6C). Additionally, noble gas modeling also supports recently recharged water from the Kern River and adjacent MAR operations moving into the groundwater resource; NGRT are significantly correlated with distance from the Kern River and below 15 °C in domestic wells close to recharge areas (table 1; fig. 6D).
In addition to direct recharge of surface water in MAR, river water is used for irrigation throughout the extensive agricultural areas in the study unit. The NGRT and ΔNe can help distinguish summer irrigation recharge of river water delivered from the extensive canal system throughout the subbasin. Irrigation water is generally a mixture of sources, surface water from the Kern River and other northern Central Valley rivers delivered via canals and groundwater pumped locally. During drought years, up to 50 percent of irrigation water is from groundwater (Faunt and others, 2024). Wells in agricultural areas have intermediate δ18O between −9 and −12 per mil, consistent with mixing of river water with groundwater sourced from precipitation (fig. 6C). Irrigation generally happens in the summer months; therefore, NGRT in domestic wells recharged with irrigation water will have higher NGRT, regardless of water source (Visser and others, 2014). Recharge temperatures are higher in areas with a higher proportion of agricultural use, and NGRTs are greater than 14 °C, and as much as 23 °C (figs. 6D, 13; Faulkner and Jurgens, 2025). A positive correlation between NGRT and proportion of agricultural land use and distance from the Kern River supports irrigation as the source of recharge in agricultural areas (table 1; fig. 13).
Anthropogenic Constituents
Most inorganic constituents are naturally present in groundwater at low concentrations, but human activities can be sources of elevated concentrations. Volatile organic compounds can be naturally present in groundwater associated with hydrocarbon (natural gas and oil) deposits, but their presence in groundwater in most areas outside oil and gas fields is related to anthropogenic sources; however, pesticides are entirely derived from anthropogenic applications at the surface (Zogorski and others, 2006; Rowe and others, 2007; Toccalino and others, 2014). In the Kern County subbasin, nitrate, the fumigants 1,2,3-TCP and DBCP, and PFAS were detected at high relative concentrations in the domestic groundwater resources.
Nitrate
Nitrate is present naturally in groundwater at low concentrations, but concentrations above 2 mg/L are typically attributed to anthropogenic sources such as fertilizer applications and septic systems (Nolan and others, 2002; Dubrovsky and others, 2010). Nitrate persists in oxic groundwater with DO concentrations more than 1 mg/L. Under low oxygen or anoxic environments, denitrification, or the bacterial-mediated consumption of nitrate, removes nitrate from groundwater. Nitrate concentrations exceeded the MCL of 10 mg/L in five domestic wells and high RCs were only reported in wells in agricultural areas (fig. 15A). Nitrate concentrations were positively correlated with total number of VOC and pesticide detections, and with concentrations of 1,2,3-TCP, DBCP, and chloroform, which were the three most commonly detected VOCs in the study (tables 2, 3). Nitrate was significantly higher in oxic domestic wells (fig. 16), and nitrate was positively correlated with DO concentrations (p-value<0.001) and NGRT (p-value=0.049), indicating higher nitrate concentrations in wells receiving recharge of high oxygen, irrigation water during summer months (table 3; fig. 17). High and moderate concentrations of nitrate co-occurring with detections of fumigants and pesticides further supports irrigation recharge as a source of high nitrate to domestic wells in the Kern County subbasin.
Table 2.
Results of Spearman's rank correlation tests for relations between water-quality constituents in the San Joaquin Kern County subbasin study unit, 2022, California Groundwater Ambient Monitoring and Assessment Program Priority Basin Project (Faulkner and Dupuy, 2023; Harkness, 2026).[Spearman's rho (ρ) are shown for tests in which the variables were determined to be significantly correlated based on p-values (not shown) being less than the critical level (α) of 0.05. Negative numbers indicate a negative correlation. Abbreviations: —, Spearman’s test indicates no significant correlation between factors]
Table 3.
Results of Spearman's rank correlation tests for between water quality constituents and explanatory variables in domestic wells in the San Joaquin Kern County subbasin study unit, 2022, California Groundwater Ambient Monitoring and Assessment Program Priority Basin Project (Faulkner and Dupuy, 2023; Harkness, 2026).[Spearman's rho (ρ) are shown for tests in which the variables were determined to be significantly correlated based on p-values (not shown) being less than the critical level (α) of 0.05. Negative numbers indicate a negative correlation. Abbreviations: δ2H, delta deuterium in water; δ18O, delta oxygen-18 in water; m, meters; VOC, volatile organic compound; —, Spearman’s test indicates no significant correlation between factors]
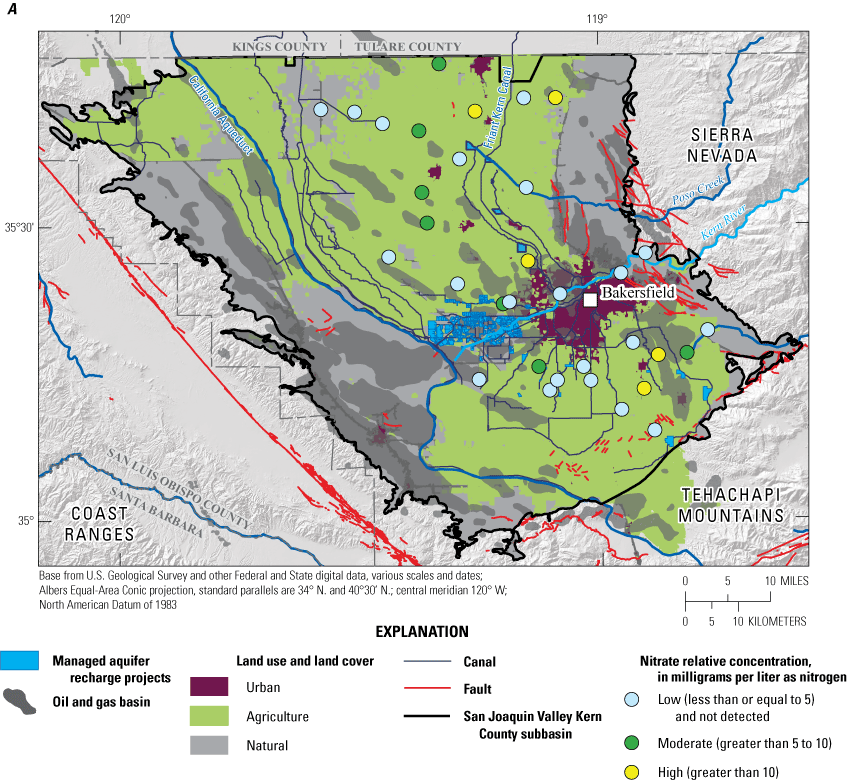
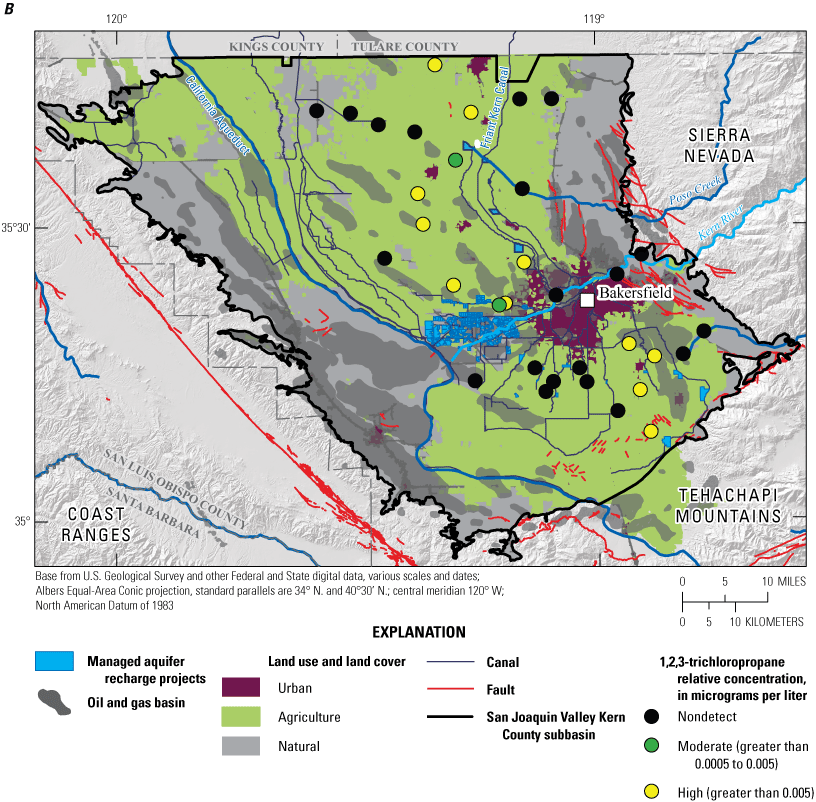
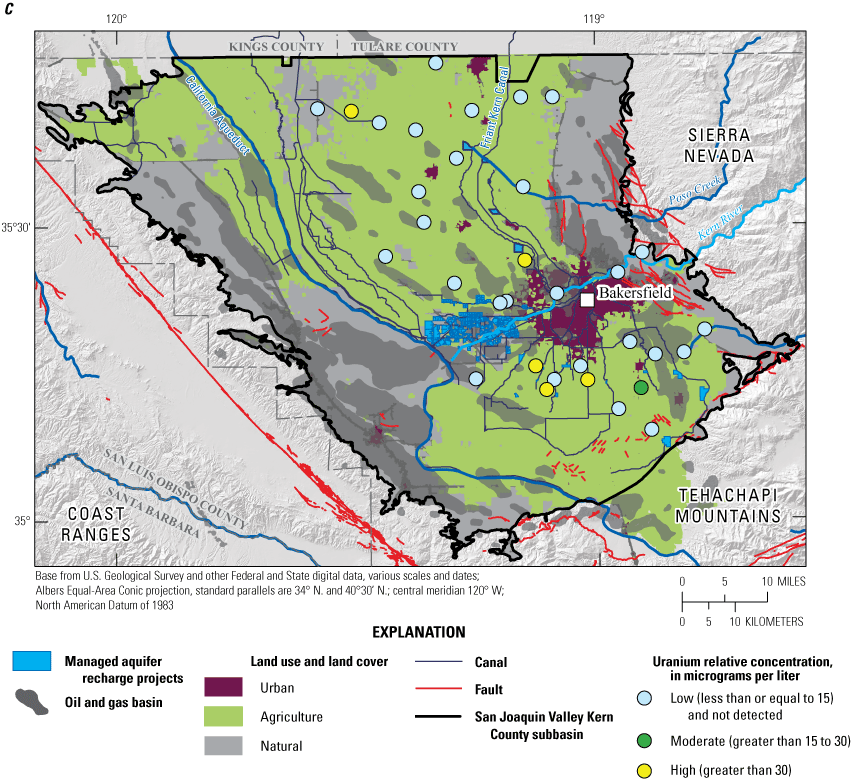

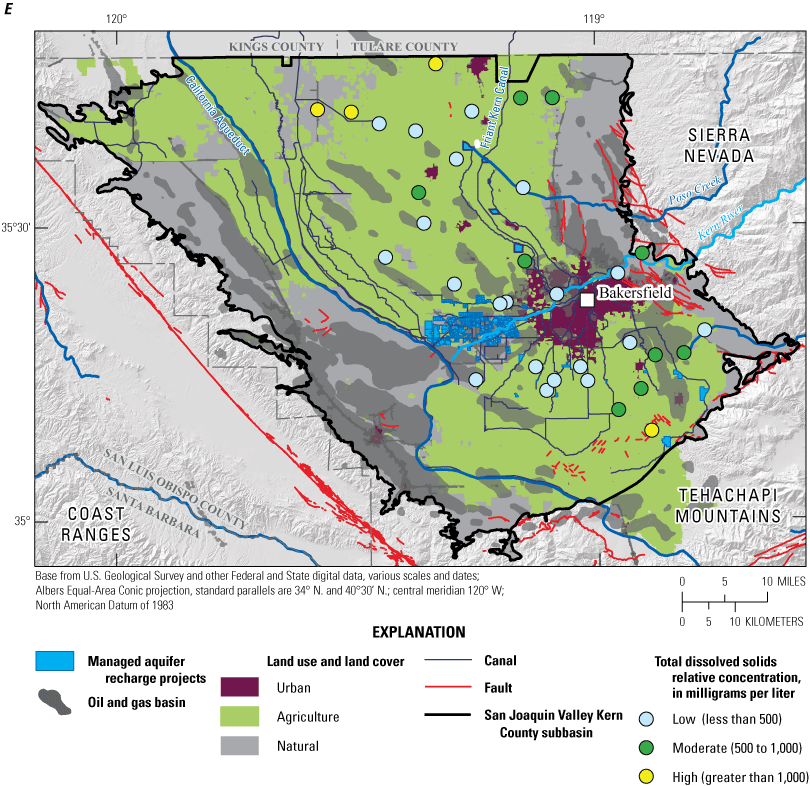
The study-area boundary, land use, surface water features, oil and gas basins, and sampled wells having no detections or low, moderate, or high relative concentrations of A, nitrate; B, 1,2,3-trichloropropane; C, uranium; D, arsenic; and E, total dissolved solids in the San Joaquin Valley Kern County subbasin study unit, 2022, California Groundwater Ambient Monitoring and Assessment Program Priority Basin Project (Falcone, 2015; Faulkner and Dupuy, 2023).
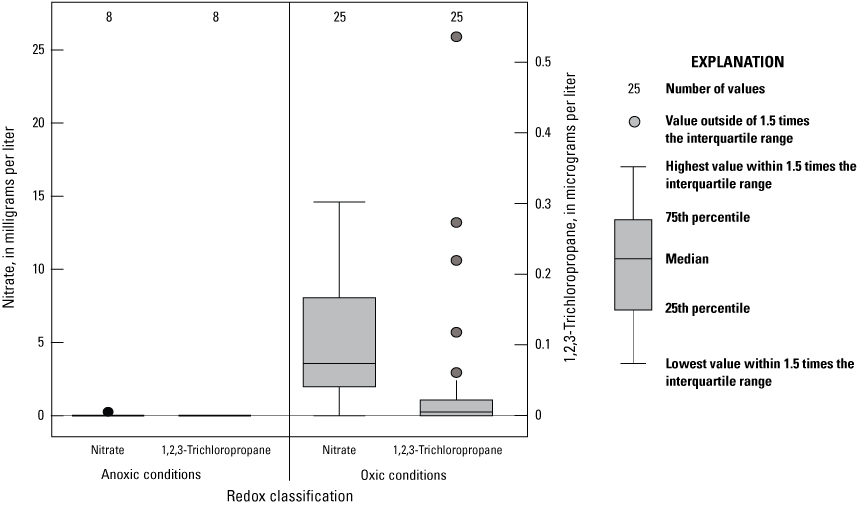
Relations among nitrate concentrations, 1,2,3-trichloropropane concentrations, and groundwater redox classification (oxic or anoxic) in domestic-supply wells of the San Joaquin Valley Kern County subbasin study unit, 2022, California Groundwater Ambient Monitoring and Assessment Program Priority Basin Project (Faulkner and Dupuy, 2023; Harkness, 2026).
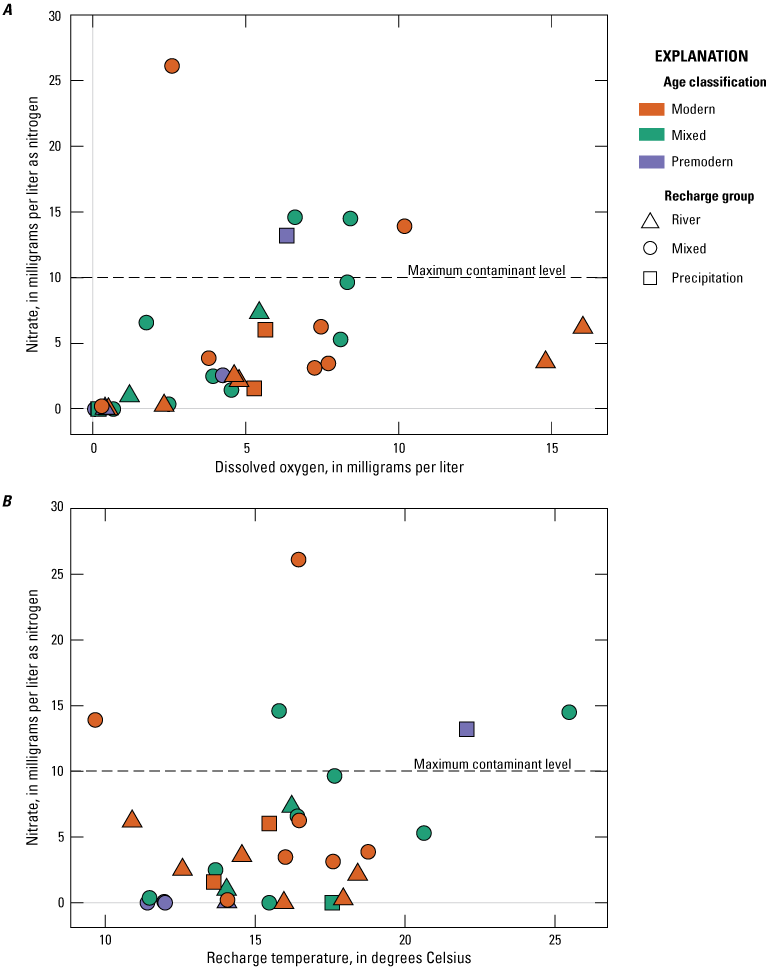
Relations between nitrate concentrations, A, dissolved oxygen, B, recharge temperatures, age class, and recharge group in domestic wells in the San Joaquin Valley Kern County subbasin study unit, 2022, California Groundwater Ambient Monitoring and Assessment Program Priority Basin Project (Faulkner and Dupuy, 2023; Faulkner and Jurgens, 2025; Harkness, 2026).
Previous studies in the Central Valley have indicated that river water recharge is an important factor in controlling nitrate concentrations in domestic wells (Castaldo and others, 2021). They hypothesized that dilution with river water is the driving factor for lower nitrate in domestic wells near rivers or MAR operations, and irrigation run-off is a source of elevated nitrate to groundwater recharge in agricultural areas. Nitrate concentrations in the major rivers that are the sources of water for irrigation and MAR are generally low. For example, average nitrate concentration in the San Joaquin River at Vernalis (USGS-11303500) in 2020–24 was 0.9 mg/L as N (U.S. Geological Survey, 2023). In 2017, a sample from the Kern Water Bank had a nitrate concentration below 0.04 mg/L as N (Warden and others, 2024b). Ambient precipitation in California generally has nitrate concentrations less than 0.2 mg/L N (Keresztesi and others, 2020). Therefore, the recharged river water and precipitation water themselves are not the source of the elevated nitrate concentrations in domestic wells.
Nitrate is applied on the land surface as fertilizer or accumulated in underground septic systems and swept into the groundwater system by recharge. The recharge from the river water is also oxic, and these oxic conditions prevent removal of nitrate by denitrification. Anoxic aquifer conditions conducive to denitrification are not widely present in the San Joaquin Valley and generally confined to the old discharge zone in the axial trough of the Valley (Landon and others, 2011; Rosecrans and others, 2017, 2018). In the Kern County subbasin, anoxic conditions are reported in wells in the northwestern and southwestern edges of the study area (fig. 6C).
Organic Compounds
The presence of organic compounds in the domestic-supply wells indicates anthropogenic surface sources mixing into the groundwater resources. Organic compounds were observed in domestic wells in agricultural and urban areas (fig. 18). The fumigants 1,2,3-TCP and DBCP, which are present at concentrations exceeding their MCLs in some domestic wells, are associated with agricultural applications. Wells with 1,2,3-TCP detections were distributed throughout the study area but mostly located in the central part of the subbasin, north of the Kern River, and the eastern region, south of the Kern River (fig. 15B). 1,2,3-TCP concentrations were correlated with other fumigants (DCBP and EDB) and the pesticides bromacil and CAAT (table 2). The extensive agricultural industry in the subbasin, the history of fumigant use for crops in the Central Valley, and oxic conditions explain the large proportion of high RCs of 1,2,3-TCP. The persistence of 1,2,3-TCP and other fumigants has been reported in other groundwater quality studies in the Central Valley (Burow and others, 2019, 2024).
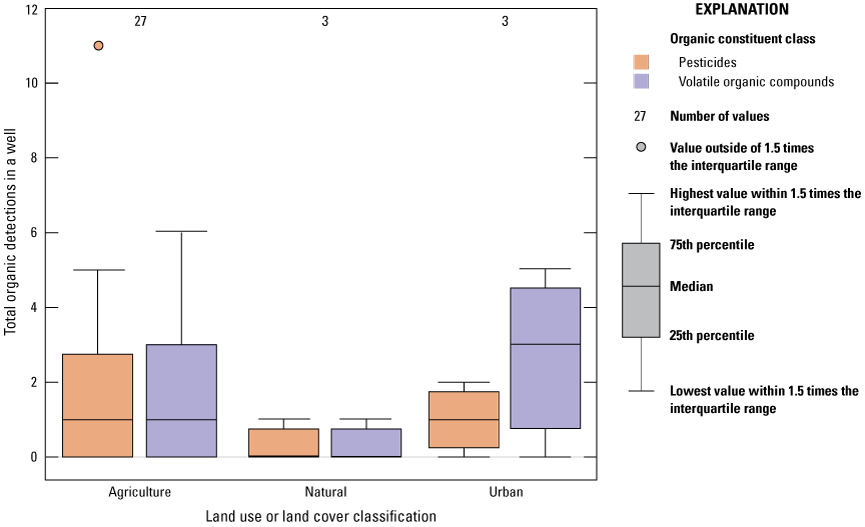
Relations among volatile organic compounds and pesticide detections in domestic wells and land use in the San Joaquin Valley Kern County subbasin study unit, 2022, California Groundwater Ambient Monitoring and Assessment Program Priority Basin Project (Faulkner and Dupuy, 2023; Harkness, 2026).
Non-fumigant VOCs and PFAS were also detected in some domestic-supply wells. The proportion of urban land use was positively correlated with total VOC detections and concentrations of chloroform and tetrachloroethene (PCE; table 3). These chemicals are associated with industrial and disinfection processes, and concentrations do not exceed any MCLs. S15-KERBS-32, the only sample in Bakersfield (fig. 1), has a high concentration of PFOA and moderate concentrations of four other PFAS in addition to detections of chloroform, PCE, and 1,4-dioxane, all associated with an urban source of VOCs (Burow and others, 2024). Sample S15-KERBS-32 contained modern river water recharge with low TDS and ΔNe more than 200 percent. Sample S15-KERBS-32 was in an urban area with the highest density of septic tanks and the shortest distance to a leaking underground storage tank (Harkness, 2026). We cannot determine from this study whether the recharge water itself is a source of anthropogenic contaminants or if there is subsurface mixing of leakage from a septic system or underground storage tank.
Overall, 35 percent of the domestic groundwater resources have high (17 percent) or moderate (18 percent) nitrate concentrations from agricultural sources. However, in areas close to recharge, most notably the Kern River, nitrate concentrations are low, likely due to dilution by low-nitrate river water. However, the river water recharge does not necessarily reduce the presence of organic constituents. Persistent oxic conditions in agricultural and urban areas support the hypothesis that the high detections of fumigants are from agricultural applications, and the detections of VOCs and PFAS are from industrial applications in domestic wells throughout the study area.
Geogenic Constituents
Most inorganic constituents are naturally present in groundwater, but human activities can affect their concentrations (Hem, 1985). Uranium and arsenic were the two constituents with regulatory, health-based benchmarks that were present in domestic groundwater resources at high relative concentrations.
Uranium
Uranium concentrations exceed the MCL of 30 µg/L in wells located in agricultural areas (fig. 15C). Uranium concentrations are positively correlated with the fraction of modern water (p<0.001), bicarbonate (p=0.008), total pesticide detections (p<0.001) and concentrations of several pesticides and pesticide degradates and negatively correlated with pH (p<0.001; tables 2, 3; fig. 19). Uranium concentrations decreased with depth to the top of the perforated interval (p=0.046) and uranium concentrations were significantly higher in wells screened above the Corcoran Clay (mean=24.4 µg/L) than below (3.9 µg/L) or outside the Corcoran Clay extent (6.1 µg/L; fig. 20). A relation between elevated uranium and bicarbonate due to geochemical changes in groundwater driven by irrigation recharge has been reported in previous studies in the San Joaquin Valley and elsewhere (Jurgens and others, 2010; Coyte and others, 2018; Rosen and others, 2019). The introduction of young, alkaline irrigation recharge into shallow domestic wells is contributing to the mobilization of uranium.
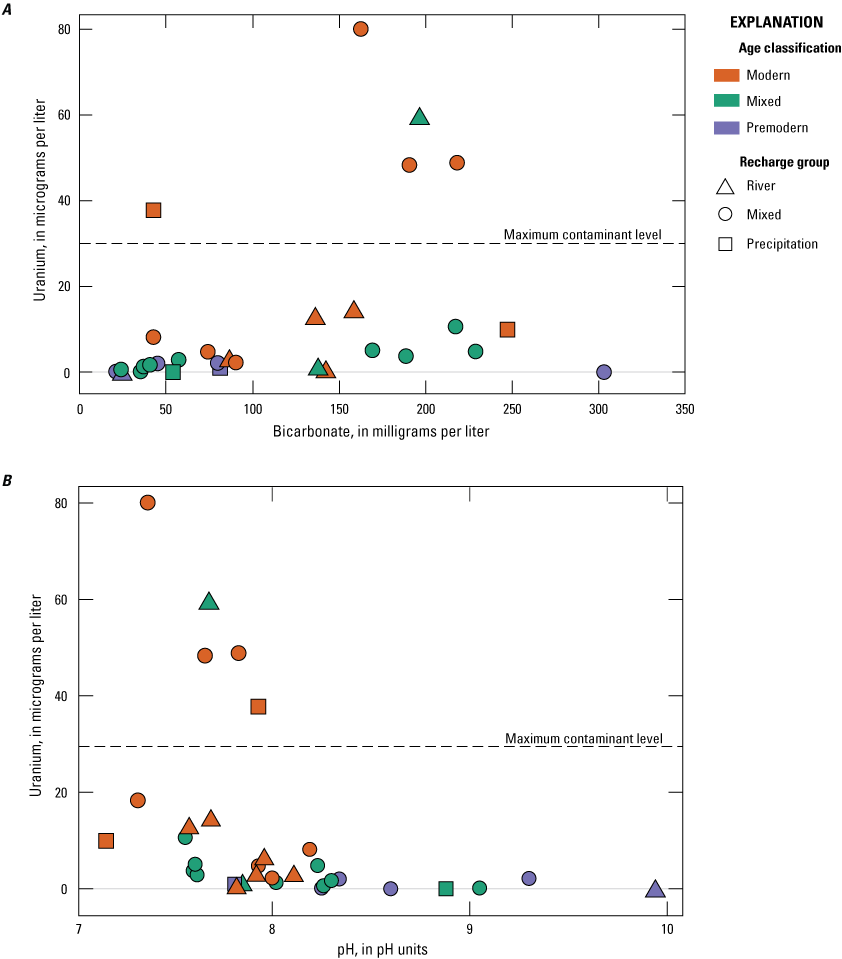
Relations among uranium, A, bicarbonate concentrations, B, pH, age class, and recharge group in domestic wells in the San Joaquin Valley Kern County subbasin study unit, 2022, California Groundwater Ambient Monitoring and Assessment Program Priority Basin Project (Faulkner and Dupuy, 2023; Faulkner and Jurgens, 2025).
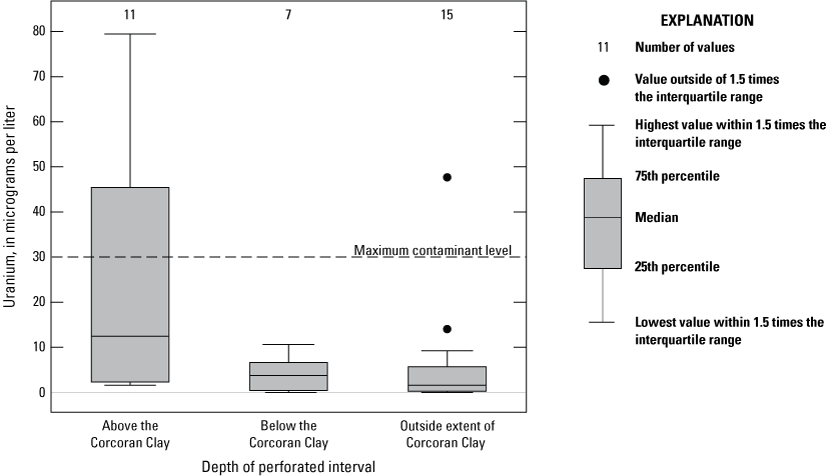
Relations between uranium concentrations in domestic wells and location of the perforated interval compared to depth of the Corcoran Clay in the San Joaquin Valley Kern County subbasin study unit, 2022, California Groundwater Ambient Monitoring and Assessment Program Priority Basin Project (Faulkner and Dupuy, 2023; Harkness, 2026).
Arsenic
Arsenic is the other geogenic trace element reported at high RCs in the study unit, and high concentrations were reported in wells with anoxic or alkaline groundwater (fig. 15D). Arsenic concentrations were negatively correlated with DO and RCs above the MCL mostly occurred in groundwater with pH between 8 and 9.5 (table 3; fig. 21). Dissolution of ion and manganese oxides in aquifer sediments under anoxic conditions can release arsenic into groundwater and arsenic is more mobile under alkaline conditions (pH>8), even in oxic conditions (Smedley and Kinniburgh, 2002; Belitz and others, 2003). Arsenic concentrations were not correlated with mean groundwater age, although they were inversely correlated with carbon-14, indicating that arsenic concentrations generally are higher in older groundwater (table 1). All samples with arsenic concentrations greater than the MCL had mean ages of 75 to 20,000 years and fractions of modern groundwater less than 25 percent (Faulkner and Dupuy, 2023; Faulkner and Jurgens, 2025).
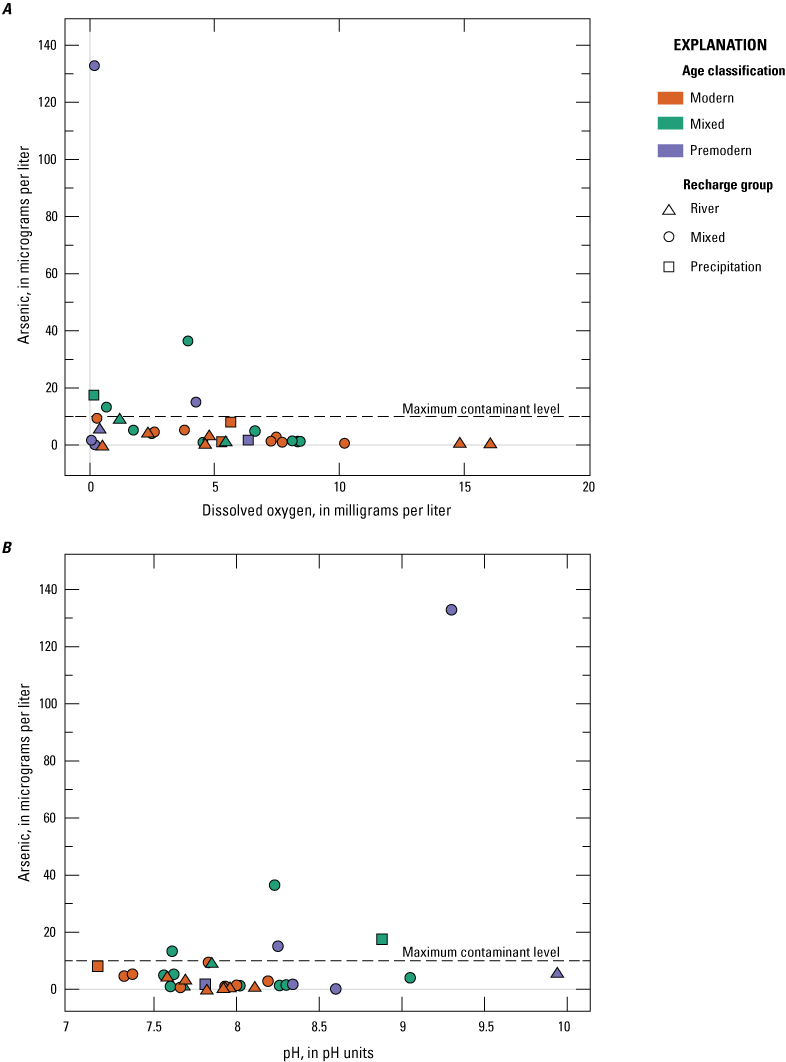
Relations among arsenic concentrations, A, dissolved oxygen concentrations, B, pH, age class, and recharge group in domestic wells in the San Joaquin Valley Kern County subbasin study unit, 2022, California Groundwater Ambient Monitoring and Assessment Program Priority Basin Project (Faulkner and Dupuy, 2023; Harkness, 2026).
The longer groundwater resides in the aquifer system, DO levels decrease and pH increases, resulting in conditions that favor high arsenic concentrations (Smedley and Kinniburgh, 2002). Arsenic concentrations were negatively correlated with the proportion of urban land use, suggesting the high-oxygen river water recharged along the Kern River in Bakersfield is protective against arsenic mobilization in domestic resources (figs. 15D). However, mixed or premodern anoxic or alkaline groundwaters in domestic wells outside of the Bakersfield area can have elevated arsenic concentrations.
Total Dissolved Solids
Total dissolved solids can be used as a proxy for groundwater salinity. Sources of TDS in the San Joaquin Valley are minerals dissolved from aquifer sediments, particularly marine sediments from the coastal ranges, concentration of solutes during evapotranspiration in shallow groundwater, mixing with hydrothermal fluids, and anthropogenic sources such as irrigation water recharged in agricultural areas and wastewater (Burton and others, 2012; Fram, 2017; Burow and others, 2024). A previous USGS-GAMA study of the groundwater resources used by public-supply in the Kern County subbasin reported that high TDS concentrations were related to both natural and agricultural sources (Burton and others, 2012). Total dissolved solid concentrations in domestic wells range from 186 to 1,660 mg/L, and 12 percent of the domestic groundwater resources have high TDS concentrations (greater than the SMCL of 1,000 mg/L). Total dissolved solid concentrations increased with distance from recharge around the Kern River and high relative concentrations are in wells in the north and southmost extent of the study area (table 3, fig. 15E). Kern River and recharge water have lower TDS concentrations, higher DO, and lower pH than most groundwater in the Kern County subbasin (Warden and others, 2024b; California Department of Water Resources, 2025). Changes in major ion concentrations also changed as TDS increased away from the Kern River, with calcium, sodium, bromide, chloride, and sulfate all increasing with distance from the Kern River and bicarbonate decreasing with distance from the Kern River (table 3). Total dissolved solid concentrations are positively correlated with δ18O, because of increasing TDS concentrations with decreasing proportions of river water recharge. Sodium (p-value<0.001), chloride (p-value<0.001), and sulfate (p-value<0.001) were also positively correlated with stable isotope ratios of water (table 3). However, TDS was not correlated to groundwater age despite a relationship with river water recharge.
Agricultural irrigation also is a source of recharge in the Kern County subbasin and has higher concentrations of TDS than the recharge along the Kern River or at MAR operations. Multiple sources of recharge with different salinity may explain why TDS is not correlated with groundwater age. We identified two types of wells in agricultural areas: Type A wells have low TDS concentrations below 500 mg/L, and Type B wells have moderate to high TDS concentrations over 500 mg/L, indicating varying degrees of mixing between irrigation water and river water (fig. 22). Previous studies have noted the increase in TDS with distance from the Kern River and hypothesized that water-rock interactions and enhanced mineral dissolution along groundwater flow paths in agricultural areas control salinity and dissolved solid concentrations (Hansen and others, 2018; Wright and others, 2019; McMahon and others, 2024). Marine sediments deposited from the Coast Ranges to the west and the San Emigdio Mountains in the southwest could be contributing TDS to groundwater in the more distal parts of the study area (Burton and others, 2012; Fram, 2017). Disposal of water produced from oil and gas operations may also contribute bicarbonate and TDS to irrigation water in the study area (Tisherman and others, 2023). Total dissolved solids in domestic wells are positively correlated with terrigenic helium concentrations, and wells in agricultural areas with moderate to high TDS (Type B) have lower neon-to-helium ratios, suggesting either accumulation of helium due to longer residence times or mixing with old water as sources of TDS (fig. 22).
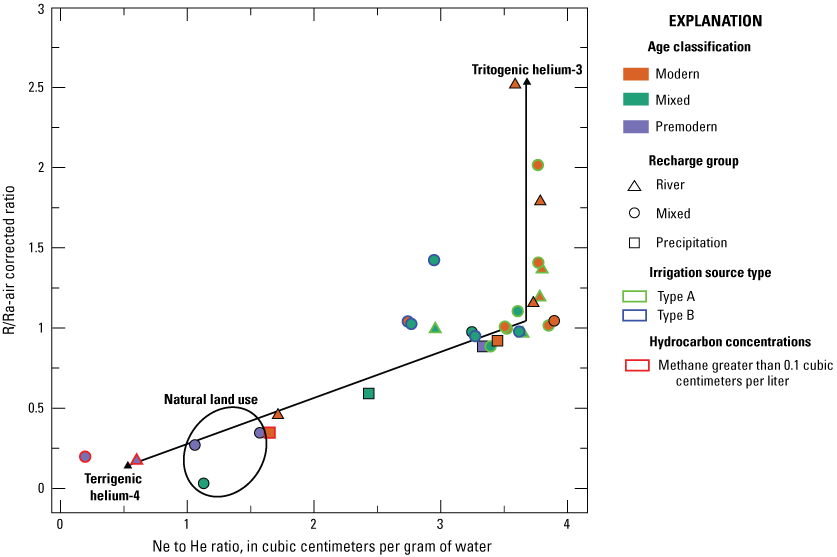
Relations between the neon-to-helium (Ne to He) ratio and helium-3 to helium-4 ratio in the sample to the helium-3 to helium-4 ratio in air (R/Ra), age class, and recharge group for sampled domestic wells in the San Joaquin Valley Kern County subbasin study unit, 2022, California Groundwater Ambient Monitoring and Assessment Program Priority Basin Project (Faulkner and Dupuy, 2023; Faulkner and Jurgens, 2025; Harkness, 2026). Type A wells have total dissolved solids below 500 milligrams per liter and Type B wells have total dissolved solids above 500 milligrams per liter.
Old Water in Domestic Wells
Kern County is one of California’s most densely developed areas for oil and gas extraction (Davis and others, 2018). Water quality effects on groundwater, including domestic wells, in Kern County oil and gas basins have been closely evaluated in other studies (Davis and others, 2018; McMahon and others, 2019, 2024; Wright and others, 2019; DiGiulio and others, 2021; Karolytė and others, 2021; Warden and others, 2024a). Although this study was not designed to provide the same level of in-depth analysis, there is evidence of old, crustal fluids mixing into the domestic resources in Kern County. There are seven samples in either undeveloped areas or withing a kilometer of an oil and gas basin that have a substantial source of non-atmospheric helium indicated by low R/Ra ratios and high terrigenic helium concentrations (fig. 22). Crustal fluids in groundwater wells near faults or oil and gas basins have been observed in previous studies in Kern County (Wright and others, 2019; Karolytė and others, 2021; McMahon and others, 2024). These fluids could be sourced from an oil and gas basin or shallow surface disposal of produced fluids, or groundwater with long residence times that have accumulated terrigenic helium (McMahon and others, 2021).
The geochemistry of these samples varies, and there are likely multiple processes that result in the mixing of old water into domestic wells. Samples S15-KERBS-02, S15-KERBS-33, and S15-KERBS-11 are mixed with modern-aged groundwater with high terrigenic helium concentrations and low R/Ra ratios (less than 0.5), but also high excess air and ΔNe over 1 (fig. 22). These results could suggest either mixing of deep brines into wells receiving MAR water or oil and gas fluids migrating from surface storage ponds. S15-KERBS-33 is within the West Bellevue Oil Field and near the Kern Water Bank and the Kern Fan Groundwater Storage Project in the Rosedale-Rio Bravo Water Storage District. Samples S15-KERBS-2 and S15-KERBS-11 are outside the Edison Oil Field and located along Caliente Creek in the southeastern part of the study area. Those samples also had moderate and high arsenic concentrations, respectively (fig. 15D). However, the methods used in this study cannot determine whether these fluids are derived from oil and gas production or storage of produced waters. The groundwater geochemistry is consistent with previous studies that have identified naturally occurring crustal fluids in drinking water wells in the Kern County subbasin (Wright and others, 2019; McMahon and others, 2021; Warden and others, 2024a).
Old, crustal fluids contain higher concentrations of arsenic, TDS, and methane in the domestic resources in the Kern County subbasin. Although arsenic and TDS can be associated with produced fluids from oil and gas development (McMahon and others, 2024), there is no indication that this is the source of high concentrations in domestic wells in the study area. The relations of arsenic and TDS concentrations and the residence times and geochemistry of domestic resources in the study area were discussed in the previous sections. Methane gas in groundwater is not a health concern, but it can be a useful tracer of groundwater migrated from oil and gas basins through either natural pathways or because of oil and gas production (Warden and others, 2024a). Methane concentrations in the domestic resources are low, but S15-KERBS-2, S15-KERBS-12, and S15-KERBS-17 have elevated concentrations (greater than 0.1 cubic centimeters per liter [cm3/L]) compared to the other samples, and ethane was also detected in S15-KERBS-2 and S15-KERBS-17. Methane produced during thermal maturation of hydrocarbons will co-occur with heavier hydrocarbons such as ethane and will have a heavier carbon isotope ratio (δ13C-CH4>−50 per mil; Warden and others, 2024a). The stable isotopes of carbon in methane in the domestic resources do not conclusively show that the elevated hydrocarbons are derived from deep thermal sources, but the ratios in S15-KERBS-2 (δ13C-CH4=−57 per mil and C1/C2+=104) and S15-KERBS-12 (δ13C-CH4=−51 per mil) fall in a range that indicates there could be mixing between thermogenic gases and microbial methane (Warden and others, 2024a). Methane can migrate naturally from a thermogenic source through subsurface pathways or during the production and disposal of hydrocarbon fluids. However, the concentrations are low compared to other studies of gases released from production wells, and there is no other geochemical evidence suggesting they have migrated from the oil and gas development process (Warden and others, 2024a).
Summary
Over 1 million Californians rely on groundwater from privately owned domestic wells for drinking-water supply. This report summarizes a water-quality survey of domestic wells in the San Joaquin Valley Kern County subbasin (basin number 5-022.14), where 30,000 residents are estimated to use privately owned domestic wells as of 2010. To assess groundwater quality in the domestic resources in the Kern County subbasin, concentrations of nutrients, trace elements, volatile organic compounds (VOCs), and per- and polyfluoroalkyl substances (PFAS) were compared to regulatory benchmarks for public drinking-water quality, such as the U.S. Environmental Protection Agency and State maximum contaminant levels (MCL). Study results indicate that at least one inorganic or organic constituent in groundwater was present above a regulatory benchmark (high relative concentration) in 67 percent of the aquifer area used for domestic resources. The inorganic constituents detected above regulatory benchmarks were nitrate, arsenic, and uranium. The organic constituents exceeding regulatory benchmarks were the fumigants 1,2,3-trichloropropane (1,2,3-TCP), 1,2-dibromo-3-chloropropane (DBCP), 1,2-dibromoethane (EDB), and the PFAS compound perfluorooctanesulfonate. The disinfection by-product chloroform, the fumigant 1,2-dichloropropane, the herbicides atrazine and hexazinone, the herbicide degradates 2-chloro-6-ethylamino-4-amino-s-triazine, 2-chloro-4,6-diamino-s-triazine (CAAT), and metolachlor sulfonic acid, and the fungicide degradate 4-hydroxychlorothalonil, were detected in more than 10 percent of domestic groundwater resources. Total dissolved solids (TDS), chloride, and manganese exceeded non-regulatory aesthetic guidelines for drinking water in 12, 9, and 9 percent of domestic groundwater resources, respectively.
Land use, redox conditions, and groundwater age are the strongest predictors of water quality in the study area. Redox and groundwater age are influenced by land use and sources of recharge, which include surface water from the Kern River, managed aquifer recharge (MAR) projects and irrigation. The two constituents most commonly present at concentrations above MCLs were the fumigant 1,2,3-TCP and the nutrient nitrate. Both constituents are applied to agricultural fields and have been previously reported in groundwater in the study area. Chloroform was frequently detected in this study, but at low levels. Chloroform is a disinfection byproduct and is commonly present in domestic wells treated by shock chlorination. Nitrate, 1,2,3-TCP, and other fumigants and pesticides were observed in wells with high noble gas recharge temperatures (NGRT) associated with irrigation recharge in agricultural areas. Chloroform, PFAS, and other VOCs were observed in wells containing water recharged from the Kern River in Bakersfield. Arsenic and uranium are redox-sensitive oxyanions that are known to occur naturally in groundwater in the Central Valley. High arsenic concentrations were associated with anoxic or alkaline conditions in older, premodern groundwater, and high uranium concentrations were present in young, oxic waters in agricultural areas above the Corcoran Clay. A subset of domestic wells in undeveloped areas or near oil and gas basins had geochemical signatures that indicated mixing with old formation waters from either natural migration processes or oil field disposal practices. However, because most domestic wells in the Kern County subbasin tap primarily modern groundwater, the effect of these old formation waters on the groundwater resources used for domestic drinking water supply is limited.
The quality of groundwater used by domestic wells is more strongly influenced by the source and quality of modern recharge. Recharge in the Kern County subbasin is derived from infiltration from the Kern River and MAR at water banking operations, from surface water and groundwater used for agricultural irrigation, and from natural precipitation, which each have different water quality signatures. Recharge of water used for irrigation is associated with increased proportions of high concentrations of nitrate, fumigants, uranium, and TDS in domestic wells. Recharge of Kern River water was commonly associated with lower concentrations of constituents relative to irrigation recharge, likely due to dilution; however, the Kern River flows through the most urbanized part of the study unit (Bakersfield), and areas recharged by the Kern River had more detections of other anthropogenic constituents like PFAS and solvents, although concentrations were generally below MCLs.
References Cited
Bennett, G.L., V, 2020, Updated study reporting levels (SRLs) for trace-element data collected for the California Groundwater Ambient Monitoring and Assessment (GAMA) Program Priority Basin Project, October 2009–October 2018: U.S. Geological Survey Scientific Investigations Report 2020–5034, 24 p., accessed March 12, 2025, at https://doi.org/10.3133/sir20205034.
Belitz, K., Dubrovsky, N.M., Burow, K., Jurgens, B., and Johnson, T., 2003, Framework for a ground-water quality monitoring and assessment program for California: U.S. Geological Survey Water-Resources Investigations Report 2003–4166, 78 p., accessed March 12, 2025, at https://doi.org/10.3133/wri034166.
Belitz, K., Fram, M.S., and Johnson, T.D., 2015, Metrics for assessing the quality of groundwater used for public supply, CA, USA—Equivalent-population and area: Environmental Science & Technology, v. 49, no. 14, p. 8330–8338, accessed March 12, 2025, at https://doi.org/10.1021/acs.est.5b00265.
Belitz, K., Jurgens, B., Landon, M.K., Fram, M.S., and Johnson, T.D., 2010, Estimation of aquifer scale proportion using equal area grids—Assessment of regional scale groundwater quality: Water Resources Research, v. 46, no. 11, 14 p., accessed March 12, 2025, at https://doi.org/10.1029/2010WR009321.
Bexfield, L.M., Belitz, K., Fram, M.S., and Lindsey, B.D., 2022, Volatile organic compounds in groundwater used for public supply across the United States—Occurrence, explanatory factors, and human-health context: Science of the Total Environment, v. 827, 12 p., accessed March 12, 2025, at https://doi.org/10.1016/j.scitotenv.2022.154313.
Borkovich, J.G., Arroyo-Lopez, J.A., Haugen, E., Stork, S.V., McGregor, A.M., Balkan, M., Peng, S., Jasper, M., Lor, V., Soldavini, A.L., Estrada, C.L., McVey, C.J., Grechkosey, D.P., Koepke, J.E., Oldham, N.A., Vroman, R.C., Handley, R., Bennett, G.L., Faulkner, K.E., Luckett, J.M., Mitchell, H.M., Wenrick, S.L., Tejeda, E., and Kitterman, E.F., 2019, Attributed California water supply well completion report data for selected areas, derived from CA WCR OSCWR Data (ver. 4.0, September 2024): U.S. Geological Survey data release, accessed March 12, 2025, at https://doi.org/10.5066/P93ICKAF.
Burow, K.R., Belitz, K., Dubrovsky, N.M., and Jurgens, B.C., 2017, Large decadal-scale changes in uranium and bicarbonate in groundwater of the irrigated western US: Science of the Total Environment, v. 586, no. 12, p. 87–95, accessed March 12, 2025, at https://doi.org/10.1016/j.scitotenv.2017.01.220.
Burow, K.R., Floyd, W.D., and Landon, M.K., 2019, Factors affecting 1,2,3-trichloropropane contamination in groundwater in California: Science of the Total Environment, v. 672, p. 324–334, accessed March 12, 2025, at https://doi.org/10.1016/j.scitotenv.2019.03.420.
Burow, K.R., Jurgens, B.C., Belitz, K., and Dubrovsky, N.M., 2013, Assessment of regional change in nitrate concentrations in groundwater in the Central Valley, California, USA, 1950s–2000s: Environmental Earth Sciences, v. 69, no. 8, p. 2609–2621, accessed March 12, 2025, at https://doi.org/10.1007/s12665-012-2082-4.
Burow, K.R., Shelton, J.L., and Dubrovsky, N.M., 2008, Regional nitrate and pesticide trends in ground water in the eastern San Joaquin Valley, California: Journal of Environmental Quality, v. 37, no. S5, p. S249–S263, accessed March 12, 2025, at https://doi.org/10.2134/jeq2007.0061.
Burow, K.R., Shelton, J.L., and Fram, M.S., 2024, Status of water quality in groundwater resources used for drinking-water supply in the southeastern San Joaquin Valley, 2013–15—California GAMA Priority Basin Project: U.S. Geological Survey Scientific Investigations Report 2024–5009, 135 p., accessed March 12, 2025, at https://doi.org/10.3133/sir20245009.
Burton, C.A., Shelton, J.L., and Belitz, K., 2012, Status and understanding of groundwater quality in the two southern San Joaquin Valley study units, 2005–2006—California GAMA Priority Basin Project: U.S. Geological Survey Scientific Investigations Report 2011–5218, 150 p., accessed March 12, 2025, at https://doi.org/10.3133/sir20115218.
California Department of Water Resources, 2020, California’s Groundwater Bulletin 118, Update 2020: California Department of Water Resources, 485 p., accessed March 12, 2025, at https://data.cnra.ca.gov/dataset/calgw_update2020/resource/d2b45d3c-52c0-45ba-b92a-fb3c90c1d4be.
California Department of Water Resources, 2024, Online system for well completion reports (OSWCR) well completion reports dataset: California Department of Water Resources website, accessed September 3, 2024, at https://data.cnra.ca.gov/dataset/well-completion-reports.
California Department of Water Resources, 2025, C0515000 KERN R NR BAKERSFIELD: California Department of Water Resources Water Data Library, accessed February 12, 2025, at https://wdl.water.ca.gov/WaterDataLibrary/MainFlow.StationDetailsPopup.aspx?WaterQualityStationId=3281.
California State Water Resources Control Board Division of Drinking Water, 2022a, Domestic water quality and monitoring regulations: California Code of Regulations—Title 22, Division 4, Chapter 15, Article 4, §64431, Chapter 15, Article 5.5 §64444, Chapter 15, Article 3 §64421–64427, Chapter 15, Article 3.5, §64430, and Chapter 15.5, Article 2, §64533, accessed December 30, 2022, at https://govt.westlaw.com/calregs/Browse/Home/California/CaliforniaCodeofRegulations?guid=I76C415025B6111EC9451000D3A7C4BC3&originationContext=document toc&transitionType=Default&contextData=(sc.Default).
California State Water Resources Control Board Division of Drinking Water, 2022b, Domestic water quality and monitoring regulations—Secondary maximum contaminant levels: California Code of Regulations—Title 22, Division 4, Chapter 15, Article 16, §64449, accessed July 6, 2023, at https://govt.westlaw.com/calregs/Document/I79D218535B6111EC9451000D3A7C4BC3?contextData=%28sc.Default%29&transitionType=Default.
California State Water Resources Control Board Division of Drinking Water, 2022c, Drinking water notification and response levels—An overview: California State Water Resources Control Board, Division of Drinking Water, 17 p., accessed July 6, 2023, at https://www.waterboards.ca.gov/drinking_water/certlic/drinkingwater/documents/notificationlevels/notification_response_level_overview_2022_11_01.pdf.
California State Water Resources Control Board, 2023, Groundwater ambient monitoring and assessment program (GAMA) groundwater information system: California State Water Resources Control Board website, accessed February 9, 2023, at https://gamagroundwater.waterboards.ca.gov/gama.
Carle, D., 2016, Introduction to water in California (2d ed.): Berkeley, Calif., University of California Press, 348 p., accessed March 12, 2025, at https://www.jstor.org/stable/10.1525/j.ctv1xxwxp.
Castaldo, G., Visser, A., Fogg, G.E., and Harter, T., 2021, Effect of groundwater age and recharge source on nitrate concentrations in domestic wells in the San Joaquin Valley: Environmental Science & Technology, v. 55, no. 4, p. 2265–2275, accessed March 12, 2025, at https://doi.org/10.1021/acs.est.0c03071.
Cey, B.D., Hudson, G.B., Moran, J.E., and Scanlon, B.R., 2008, Impact of artificial recharge on dissolved noble gases in groundwater in California: Environmental Science & Technology, v. 42, no. 4, p. 1017–1023, accessed March 12, 2025, at https://doi.org/10.1021/es0706044.
Coplen, T.B., and Kendall, C., 2000, Stable hydrogen and oxygen isotope ratios for selected sites of the U.S. Geological Survey's NASQAN and benchmark surface-water network: U.S. Geological Survey Open-File Report 2000–160, 409 p., accessed March 12, 2025, at https://doi.org/10.3133/ofr00160.
Coyte, R.M., Jain, R.C., Srivastava, S.K., Sharma, K.C., Khalil, A., Ma, L., and Vengosh, A., 2018, Large-scale uranium contamination of groundwater resources in India: Environmental Science & Technology Letters, v. 5, no. 6, p. 341–347, accessed March 12, 2025, at https://doi.org/10.1021/acs.estlett.8b00215.
Craig, H., 1961, Isotopic variations in meteoric waters: Science, v. 133, no. 3465, p. 1702–1703, accessed March 12, 2025, at https://doi.org/10.1126/science.133.3465.1702.
Davis, T.A., Landon, M.K., and Bennett, G.L., 2018, Prioritization of oil and gas fields for regional groundwater monitoring based on a preliminary assessment of petroleum resource development and proximity to California’s groundwater resources: U.S. Geological Survey Scientific Investigations Report 2018–5065, 115 p., accessed March 12, 2025, at https://doi.org/10.3133/sir20185065.
DiGiulio, D.C., Rossi, R.J., Jaeger, J.M., Shonkoff, S.B.C., and Ryan, J.N., 2021, Vulnerability of groundwater resources underlying unlined produced water ponds in the Tulare Basin of the San Joaquin Valley, California: Environmental Science & Technology, v. 55, no. 21, p. 14782–14794, accessed March 12, 2025, at https://doi.org/10.1021/acs.est.1c02056.
Dubrovsky, N.M., Burow, K.R., Clark, G.M., Gronberg, J.M., Hamilton, P.A., Hitt, K.J., Mueller, D.K., Munn, M.D., Nolan, B.T., Puckett, L.J., Rupert, M.G., Short, T.M., Spahr, N.E., Sprague, L.A., and Wilber, W.G., 2010, The quality of our Nation’s waters—Nutrients in the Nation’s streams and groundwater, 1992–2004: U.S. Geological Survey Circular 1350, 174 p., accessed December 10, 2024, at https://doi.org/10.3133/cir1350.
Fakhreddine, S., Prommer, H., Scanlon, B.R., Ying, S.C., and Nicot, J.-P., 2021, Mobilization of arsenic and other naturally occurring contaminants during managed aquifer recharge—A critical review: Environmental Science & Technology, v. 55, no. 4, p. 2208–2223, accessed March 12, 2025, at https://doi.org/10.1021/acs.est.0c07492.
Falcone, J.A., 2015, U.S. conterminous wall-to-wall anthropogenic land use trends (NWALT), 1974–2012: U.S. Geological Survey Data Series 948, 33 p. plus appendixes 3–6 as separate files, accessed June 10, 2022, at https://doi.org/10.3133/ds948.
Faulkner, K.E., and Dupuy, D.I., 2023, Groundwater-quality data in the Kern County Domestic-Supply Aquifer Study Unit, 2022—Results from the California GAMA Priority Basin Project: U.S. Geological Survey data release, accessed March 12, 2025, at https://doi.org/10.5066/P9GGNIQI.
Faulkner, K.E., and Jurgens, B.C., 2025, Data for assessing the susceptibility of groundwater used for domestic-supply, California: U.S. Geological Survey data release. [Available at https://doi.org/10.5066/P13ISEGA.]
Faulkner, K.E., Jurgens, B.C., Voss, S.A., Dupuy, D.I., and Levy, Z.F., 2023, Modeling the dynamic penetration depth of post-1950s water in unconfined aquifers using environmental tracers—Central Valley, California: Journal of Hydrology, v. 616, p. 128818, accessed March 12, 2025, at https://doi.org/10.1016/j.jhydrol.2022.128818.
Faunt, C.C., ed., 2009, Groundwater availability of the Central Valley Aquifer, California: U.S. Geological Survey Professional Paper 1766, 225 p., accessed March 12, 2025, at https://doi.org/10.3133/pp1766.
Faunt, C.C., Traum, J.A., Boyce, S.E., Seymour, W.A., Jachens, E.R., Brandt, J.T., Sneed, M., Bond, S., and Marcelli, M.F., 2024, Groundwater sustainability and land subsidence in California’s Central Valley: Water, v. 16, no. 8, p. 1189, accessed March 12, 2025, at https://doi.org/10.3390/w16081189.
Fram, M.S., and Belitz, K., 2014, Status and understanding of groundwater quality in the Sierra Nevada Regional study unit, 2008—California GAMA Priority Basin Project: U.S. Geological Survey Scientific Investigations Report 2014–5174, 118 p., accessed March 12, 2025, at https://doi.org/10.3133/sir20145174.
Fram, M.S., 2017, Groundwater quality in the Western San Joaquin Valley study unit, 2010—California GAMA Priority Basin Project: U.S. Geological Survey Scientific Investigations Report 2017–5032, 130 p. [Available at https://doi.org/10.3133/sir20175032.]
Hansen, J.A., Jurgens, B.C., and Fram, M.S., 2018, Quantifying anthropogenic contributions to century-scale groundwater salinity changes, San Joaquin Valley, California, USA: Science of the Total Environment, v. 642, no. 5, p. 125–136, accessed March 12, 2025, at https://doi.org/10.1016/j.scitotenv.2018.05.333.
Harkness, J.S., 2026, Potential explanatory variables for groundwater quality in the San Joaquin Valley Kern County subbasin domestic well study unit, 2022: U.S. Geological Survey data release. [Available at https://doi.org/10.5066/P13WQA8P.]
Harkness, J.S., and Jurgens, B.C., 2022, Effects of imported recharge on fluoride trends in groundwater used for public supply in California: Science of the Total Environment, v. 830, 15 p., accessed March 12, 2025, at https://doi.org/10.1016/j.scitotenv.2022.154782.
Harkness, J.S., McCarthy, P.M., Jurgens, B.C., and Levy, Z.F., 2023, Salinity trends in a groundwater system supplemented by 50 years of imported Colorado River water: ACS ES&T Water, v. 3, no. 10, p. 3253–3264, accessed March 12, 2025, at https://doi.org/10.1021/acsestwater.3c00239.
Harrell, F.E. Jr., and Dupont, C., 2023, Hmisc: Harrell Miscellaneous, v. 5.2–3, accessed March 12, 2025, at https://doi.org/10.32614/CRAN.package.Hmisc.
Hartog, N., and Stuyfzand, P.J., 2017, Water quality considerations on the rise as the use of managed aquifer recharge systems widens: Water, v. 9, no. 10, 6 p., accessed March 12, 2025, at https://doi.org/10.3390/w9100808.
Helsel, D.R., Hirsch, R.M., Ryberg, K.R., Archfield, S.A., and Gilroy, E.J., 2020, Statistical methods in water resources: U.S. Geological Survey Techniques and Methods, book 4, chap. A3, 458 p., accessed July 6, 2023, at https://doi.org/10.3133/tm4A3.
Hem, J.D., 1985, Study and interpretation of the chemical characteristics of natural water (3d ed.): U.S. Geological Survey Water Supply Paper 2254, Document xii, 263 p.; 4 Plates, 17.4 x 18.5 inches or smaller. [Available at https://doi.org/10.3133/wsp2254.]
Johnson, T.D., and Belitz, K., 2003, Hydrogeologic provinces for California based upon established groundwater basins and watershed polygons: U.S. Geological Survey Open-File Report 2003–470, accessed March 12, 2025, at https://doi.org/10.3133/ofr03470.
Johnson, T.D., and Belitz, K., 2015, Identifying the location and population served by domestic wells in California: Journal of Hydrology—Regional Studies, v. 3, p. 31–86, accessed March 12, 2025, at https://doi.org/10.1016/j.ejrh.2014.09.002.
Johnson, T.D., and Belitz, K., 2019, Domestic well locations and populations served in the contiguous U.S.—Datasets for decadal years 2000 and 2010: U.S. Geological Survey data release, accessed March 12, 2025, at https://doi.org/10.5066/P9FSLU3B.
Jurgens, B.C., Böhlke, J.K., and Eberts, S.M., 2012, TracerLPM (Version 1)—An Excel workbook for interpreting groundwater age distributions from environmental tracer data: U.S. Geological Survey Techniques and Methods, book 4, chap. F3, 60 p., accessed March 12, 2025, at https://doi.org/10.3133/tm4F3.
Jurgens, B.C., Böhlke, J.K., Haase, K., Busenberg, E., Hunt, A.G., and Hansen, J.A., 2020, DGMETA (version 1)—Dissolved gas modeling and environmental tracer analysis computer program: U.S. Geological Survey Techniques and Methods, book 4, chap. F5, 50 p., accessed March 12, 2025, at https://doi.org/10.3133/tm4F5.
Jurgens, B.C., Fram, M.S., Belitz, K., Burow, K.R., and Landon, M.K., 2010, Effects of groundwater development on uranium—Central Valley, California, USA: Groundwater, v. 48, no. 6, p. 913–928, accessed March 12, 2025, at https://doi.org/10.1111/j.1745-6584.2009.00635.x.
Jurgens, B.C., Jasper, M., Nguyen, D.H., and Bennett, G.L., 2018, USGS California Groundwater Ambient Monitoring and Assessment Program Priority Basin Project (GAMA-PBP) groundwater-quality results—Assessment and trends: U.S. Geological Survey website, accessed March 12, 2025, at https://doi.org/10.5066/P91WJ2G1.
Karolytė, R., Barry, P.H., Hunt, A.G., Kulongoski, J.T., Tyne, R.L., Davis, T.A., Wright, M.T., McMahon, P.B., and Ballentine, C.J., 2021, Noble gas signatures constrain oil-field water as the carrier phase of hydrocarbons occurring in shallow aquifers in the San Joaquin Basin, USA: Chemical Geology, v. 584, 11 p., accessed March 12, 2025, at https://doi.org/10.1016/j.chemgeo.2021.120491.
Kendall, C., and Coplen, T.B., 2001, Distribution of oxygen‐18 and deuterium in river waters across the United States: Hydrological Processes, v. 15, no. 7, p. 1363–1393, accessed March 12, 2025, at https://doi.org/10.1002/hyp.217.
Keresztesi, Á., Nita, I.A., Boga, R., Birsan, M.V., Bodor, Z., and Szép, R., 2020, Spatial and long-term analysis of rainwater chemistry over the conterminous United States: Environmental Research, v. 188, 14 p., accessed December 5, 2025, at https://doi.org/10.1016/j.envres.2020.109872.
Kern River Bank Authority, 2021, Project facilities: Kern River Bank Authority website, accessed July 6, 2023, at https://www.kwb.org/project-facilities.
Kondash, A.J., Redmon, J.H., Lambertini, E., Feinstein, L., Weinthal, E., Cabrales, L., and Vengosh, A., 2020, The impact of using low-saline oilfield produced water for irrigation on water and soil quality in California: Science of the Total Environment, v. 733, 10 p., accessed March 12, 2025, at https://doi.org/10.1016/j.scitotenv.2020.139392.
Landon, M.K., Green, C.T., Belitz, K., Singleton, M.J., and Esser, B.K., 2011, Relations of hydrogeologic factors, groundwater reduction-oxidation conditions, and temporal and spatial distributions of nitrate, central-eastside San Joaquin Valley, California, USA: Hydrogeology Journal, v. 19, no. 6, p. 1203–1224, accessed December 3, 2025, at https://doi.org/10.1007/s10040-011-0750-1.
Lechler, A.R., and Niemi, N.A., 2012, The influence of snow sublimation on the isotopic composition of spring and surface waters in the southwestern United States—Implications for stable isotope-based paleoaltimetry and hydrologic studies: Bulletin, v. 124, nos. 3–4, p. 318–334, accessed March 12, 2025, at https://doi.org/10.1130/B30467.1.
Lindsey, B.D., Ayotte, J.D., Jurgens, B.C., and Desimone, L.A., 2017, Using groundwater age distributions to understand changes in methyl tert-butyl ether (MtBE) concentrations in ambient groundwater, northeastern United States: Science of the Total Environment, v. 579, no. 9, p. 579–587, accessed March 12, 2025, at https://doi.org/10.1016/j.scitotenv.2016.11.058.
Lindsey, B.D., Jurgens, B.C., and Belitz, K., 2019, Tritium as an indicator of modern, mixed, and premodern groundwater age: U.S. Geological Survey Scientific Investigations Report 2019–5090, 18 p., accessed March 12, 2025, at https://doi.org/10.3133/sir20195090.
McMahon, P.B., and Chapelle, F.H., 2008, Redox processes and water quality of selected principal aquifer systems: Groundwater, v. 46, no. 2, p. 259–271, accessed March 12, 2025, at https://doi.org/10.1111/j.1745-6584.2007.00385.x.
McMahon, P.B., Landon, M.K., Davis, T.A., Wright, M.T., Rosecrans, C.Z., Anders, R., Land, M.T., Kulongoski, J.T., and Hunt, A.G., 2021, Relative risk of groundwater-quality degradation near California (USA) oil fields estimated from 3H, 14C, and 4He: Applied Geochemistry, v. 131, 15 p., accessed March 12, 2025, at https://doi.org/10.1016/j.apgeochem.2021.105024.
McMahon, P.B., Landon, M.K., Stephens, M.J., Taylor, K.A., Wright, M.T., Hansen, A.M., Kraus, T.E., Cozzarelli, I.M., Shimabukuro, D.H., Sowers, T.A., and Kulongoski, J.T., 2024, Land-use interactions, oil-field infrastructure, and natural processes control hydrocarbon and arsenic concentrations in groundwater, Poso Creek Oil Field, California, USA: Applied Geochemistry, v. 168, 18 p., accessed March 12, 2025, at https://doi.org/10.1016/j.apgeochem.2024.106025.
McMahon, P.B., Tokranov, A.K., Bexfield, L.M., Lindsey, B.D., Johnson, T.D., Lombard, M.A., and Watson, E., 2022, Perfluoroalkyl and polyfluoroalkyl substances in groundwater used as a source of drinking water in the eastern United States: Environmental Science & Technology, v. 56, no. 4, p. 2279–2288, accessed March 12, 2025, at https://doi.org/10.1021/acs.est.1c04795.
McMahon, P.B., Vengosh, A., Davis, T.A., Landon, M.K., Tyne, R.L., Wright, M.T., Kulongoski, J.T., Hunt, A.G., Barry, P.H., Kondash, A.J., and Wang, Z., 2019, Occurrence and sources of radium in groundwater associated with oil fields in the southern San Joaquin Valley, California: Environmental Science & Technology, v. 53, no. 16, p. 9398–9406, accessed March 12, 2025, at https://doi.org/10.1021/acs.est.9b02395.
Meillier, L., Loáiciga, H.A., and Clark, J.F., 2008, Groundwater dating and flow-model calibration in the Kern Water Bank, California: Journal of Hydrologic Engineering, v. 13, no. 11, p. 1029–1036, accessed March 12, 2025, at https://doi.org/10.1061/(ASCE)1084-0699(2008)13:11(1029).
Nolan, B.T., Hitt, K.J., and Ruddy, B.C., 2002, Probability of nitrate contamination of recently recharged groundwaters in the conterminous United States: Environmental Science & Technology, v. 36, no. 10, p. 2138–2145. [Available at https://doi.org/10.1021/es0113854.]
Norman, J.E., Toccalino, P.L., and Morman, S.A., 2018, Health-based screening levels for evaluating water-quality data (2d ed.): U.S. Geological Survey webpage, accessed March 12, 2025, at https://water.usgs.gov/water-resources/hbsl/.
PRISM Climate Group, 2024, PRISM climate data: Oregon State University, accessed March 3, 2024, at https://prism.oregonstate.edu.
R Core Team, 2024, R—A language and environment for statistical computing: R Foundation for Statistical Computing, Vienna, Austria, accessed March 12, 2025, at https://www.R-project.org/.
Ransom, K.M., Nolan, B.T., Traum, J.A., Faunt, C.C., Bell, A.M., Gronberg, J.A.M., Wheeler, D.C., Rosecrans, C.Z., Jurgens, B., Schwarz, G.E., and Belitz, K., 2017, A hybrid machine learning model to predict and visualize nitrate concentration throughout the Central Valley aquifer, California, USA: Science of the Total Environment, v. 601–602, p. 1160–1172, accessed March 12, 2025, at https://doi.org/10.1016/j.scitotenv.2017.05.192.
Rosecrans, C.Z., Nolan, B.T., and Gronberg, J.M., 2017, Prediction and visualization of redox conditions in the groundwater of Central Valley, California: Journal of Hydrology, v. 546, p. 341–356, accessed December 3, 2025, at https://doi.org/10.1016/j.jhydrol.2017.01.014.
Rosecrans, C.Z., Nolan, B.T., and Gronberg, J.M., 2018, Maps showing predicted probabilities for selected dissolved oxygen and dissolved manganese threshold events in depth zones used by the domestic and public drinking water supply wells, Central Valley, California: U.S. Geological Survey Scientific Investigations Map 3397, 2 sheets, various scales. [Available at https://doi.org/10.3133/sim3397.]
Rosen, M.R., Burow, K.R., and Fram, M.S., 2019, Anthropogenic and geologic causes of anomalously high uranium concentrations in groundwater used for drinking water supply in the southeastern San Joaquin Valley, CA: Journal of Hydrology, v. 577, no. 6, p. 124009, accessed March 12, 2025, at https://doi.org/10.1016/j.jhydrol.2019.124009.
Rowe, B.L., Toccalino, P.L., Moran, M.J., Zogorski, J.S., and Price, C.V., 2007, Occurrence and potential human-health relevance of volatile organic compounds in drinking water from domestic wells in the United States: Environmental Health Perspectives, v. 115, no. 11, p. 1539–1546, accessed March 12, 2025, at https://pmc.ncbi.nlm.nih.gov/articles/PMC2072842/.
Shelton, J.L., Burow, K.R., Belitz, K., Dubrovsky, N.M., Land, M., and Gronberg, J., 2001, Low-level volatile organic compounds in active public supply wells as ground-water tracers in the Los Angeles physiographic basin, California, 2000: U.S. Geological Survey Water-Resources Investigations Report 2001–4188, 35 p., accessed March 12, 2025, at https://doi.org/10.3133/wri20014188.
Shelton, J.L., and Fram, M.S., 2017, Groundwater-quality data for the Madera/Chowchilla-Kings shallow aquifer study unit, 2013–14—Results from the California GAMA Program: U.S. Geological Survey Data Series 1019, 115 p., accessed March 12, 2025, at https://doi.org/10.3133/ds1019.
Shelton, J.L., and Tejeda, E., 2024, California Groundwater Ambient Monitoring and Assessment (GAMA) Program Priority Basin Project-domestic-supply assessment: U.S. Geological Survey Fact Sheet 2024–3002, 2 p., accessed March 12, 2025, at https://doi.org/10.3133/fs20243002.
Smedley, P.L., and Kinniburgh, D.G., 2002, A review of the source, behaviour and distribution of arsenic in natural waters: Applied Geochemistry, v. 17, no. 5, p. 517–568, accessed March 12, 2025, at https://doi.org/10.1016/S0883-2927(02)00018-5.
Tisherman, R.A., Rossi, R.J., Shonkoff, S.B., and DiGiulio, D.C., 2023, Groundwater uranium contamination from produced water disposal to unlined ponds in the San Joaquin Valley: Science of the Total Environment, v. 904, p. 166937, accessed March 12, 2025, at https://doi.org/10.1016/j.scitotenv.2023.166937.
Toccalino, P.L., Gilliom, R.J., Lindsey, B.D., and Rupert, M.G., 2014, Pesticides in groundwater of the United States—Decadal‐scale changes, 1993–2011: Groundwater, v. 52, no. S1, p. 112–125, accessed April 8, 2026, at https://doi.org/10.1111/gwat.12176.
Toccalino, P.L., and Norman, J.E., 2006, Health‐based screening levels to evaluate US ground water quality data: Risk Analysis, v. 26, no. 5, p. 1339–1348, accessed March 12, 2025, at https://doi.org/10.1111/j.1539-6924.2006.00805.x.
Tokranov, A.K., Ransom, K.M., Bexfield, L.M., Lindsey, B.D., Watson, E., Dupuy, D.I., Stackelberg, P.E., Fram, M.S., Voss, S.A., Kingsbury, J.A., Jurgens, B.C., Smalling, K.L., and Bradley, P.M., 2024, Predictions of groundwater PFAS occurrence at drinking water supply depths in the United States: Science, v. 386, no. 6723, p. 748–755, accessed March 12, 2025, at https://doi.org/10.1126/science.ado6638.
U.S. Environmental Protection Agency, 2018, 2018 Edition of the drinking water standards and health advisories tables: Washington, D.C., U.S. Environmental Protection Agency, EPA 822-F-18-001, 20 p., accessed March 12, 2025, at https://www.epa.gov/system/files/documents/2022-01/dwtable2018.pdf.
U.S. Environmental Protection Agency, 2021, 2021 Human health benchmarks for pesticides: U.S. Environmental Protection Agency website, accessed March 12, 2025, at https://www.epa.gov/sdwa/2021-human-health-benchmarks-pesticides.
U.S. Environmental Protection Agency, 2024, Per-and polyfluoroalkyl substances (PFAS)—Final PFAS national primary drinking water regulation: U.S. Environmental Protection Agency website, accessed April 15, 2024, at https://www.epa.gov/sdwa/and-polyfluoroalkyl-substances-pfas.
U.S. Geological Survey, 2023, USGS water data for the Nation: U.S. Geological Survey National Water Information System, accessed February 12, 2023, at https://doi.org/10.5066/F7P55KJN.
U.S. Geological Survey, [variously dated], National field manual for the collection of water-quality data: U.S. Geological Survey Techniques of Water-Resources Investigations, book 9, chaps. A1–A9, [variously paged], accessed March 12, 2025, at https://doi.org/10.3133/twri09.
Visser, A., Moran, J.E., Singleton, M.J., and Esser, B.K., 2014, California GAMA special study—Geostatistical analysis of groundwater age and other noble gas derived parameters in California: Lawrence Livermore National Laboratory LLNL-TR-654049, 44 p., accessed March 12, 2025, at https://doi.org/10.2172/1162236.
Visser, A., Moran, J.E., Singleton, M.J., and Esser, B.K., 2018, Importance of river water recharge to the San Joaquin Valley groundwater system: Hydrological Processes, v. 32, no. 9, p. 1202–1213, accessed March 12, 2025, at https://doi.org/10.1002/hyp.11468.
Voss, S.A., Jurgens, B.C., Fram, M.S., and Bennett, G.L., V, 2019, Delineation of spatial extent, depth, thickness, and potential volume of aquifers used for domestic and public water-supply in the Central Valley, California: U.S. Geological Survey Scientific Investigations Report 2019–5076, 34 p., accessed March 12, 2025, at https://doi.org/10.3133/sir20195076.
Warden, J.G., Landon, M.K., Stephens, M.J., Davis, T.A., Gillespie, J.M., McMahon, P.B., Kulongoski, J.T., Hunt, A.G., Shimabukuro, D.H., Gannon, R.S., and Ball, L.B., 2024a, Assessing potential effects of oil and gas development activities on groundwater quality near and overlying the Elk Hills and North Coles Levee Oil Fields, San Joaquin Valley, California: PLOS Water, v. 3, no. 8, 37 p. [Available at https://doi.org/10.1371/journal.pwat.0000258.]
Warden, J.G., Marcusa, J.A., Schmer, M.E., Roberts, S.A., Watson, E., Stanton, J.S., McCarlson, A.J., and Johnson, J.C., 2024b, Water chemistry data for samples collected at groundwater and surface water sites in the Elk Hills study area, June 2017–April 2018, Kern County, California: U.S. Geological Survey data release, accessed March 12, 2025, at https://doi.org/10.5066/P98LFQA2.
Water Association of Kern County, 2026, Water banking: Water Association of Kern County website, accessed April 8, 2026, at https://www.wakc.com/water-overview/sources-of-water/water-banking/.
Wright, M.T., McMahon, P.B., Landon, M.K., and Kulongoski, J.T., 2019, Groundwater quality of a public supply aquifer in proximity to oil development, Fruitvale oil field, Bakersfield, California: Applied Geochemistry, v. 106, p. 82–95, accessed March 12, 2025, at https://doi.org/10.1016/j.apgeochem.2019.05.003.
Zogorski, J.S., Carter, J.M., Ivahnenko, T., Lapham, W.W., Moran, M.J., Rowe, B.L., Squillace, P.J., and Toccalino, P.L., 2006, The quality of our Nation’s waters—Volatile organic compounds in the Nation’s ground water and drinking-water supply wells: U.S. Geological Survey Circular 1292, 101 p., accessed March 12, 2025, at https://doi.org/10.3133/cir1292.
Conversion Factors
Datums
Vertical coordinate information is referenced to the North American Vertical Datum of 1988 (NAVD 88).
Horizontal coordinate information is referenced to the North American Datum of 1983 (NAD 83).
Altitude, as used in this report, refers to distance above the vertical datum.
Supplemental Information
Concentrations of chemical constituents in water are in either milligrams per liter (mg/L), micrograms per liter (µg/L), or nanograms per liter (ng/L).
Concentrations of tritium are in tritium units (TU). 1 TU equals 3.19 picocuries per liter (pCi/L).
Results for measurements of stable isotopes of an element (with symbol E) in water, solids, and dissolved constituents are commonly expressed as the relative difference in the ratio of the number of the less abundant isotope (iE) to the number of the more abundant isotope of a sample with respect to a measurement standard. The stable hydrogen and oxygen ratios in water are reported in the unit per mil.
Abbreviations
1,2,3-TCP
1,2,3-trichloropropane
DM
dispersion model
3He
tritogenic helium-3
4He
helium-4
4Heterr
terrigenic helium-4
ΔNe
modeled excess neon
δ2H
stable hydrogen isotopic composition of water
δ18O
stable oxygen isotopic composition of water
CAAT
2-chloro-4,6-diamino-s-triazine (didealkylatrazine)
DBCP
1,2-dibromo-3-chloropropane (dibromochloropropane)
DO
dissolved oxygen
EDB
1,2-dibromoethane (ethylene dibromide)
EPA
U.S. Environmental Protection Agency
GAMA
Groundwater Ambient Monitoring and Assessment Program
GAMA-PBP
Groundwater Ambient Monitoring and Assessment Program Priority Basin Project
HAL-US
U.S. Environmental Protection Agency lifetime health advisory level
HBSL
health-based screening level
HFPO-DA
hexafluoropropylene oxide dimer acid
HHBP
human health benchmark for pesticides
LMWL
local meteoric water line
LPM
lumped parameter models
MAR
managed aquifer recharge
MCL
maximum contaminant level
MCL-CA
California State Water Resources Control Board Division of Drinking Water’s maximum contaminant level
MCL-US
U.S. Environmental Protection Agency maximum contaminant level
NGRT
noble gas recharge temperature
NL-CA
California State Water Resources Control Board-Division of Drinking Water notification level
PC
principal component
PCA
principal component analysis
PCE
tetrachloroethene
PFAS
per- and polyfluoroalkyl substances
PFNA
perfluorononanoate
PFOA
perfluorooctanoate
PFOS
perfluorooctanesulfonate
PFPeA
perfluoropentanoate
PFHxA
perfluorohexanoate
PFHxS
perfluorohexanesulfonate
R/Ra
helium-3 to helium-4 ratio in the sample to the helium-3 to helium-4 ratio in air
RC
relative concentration
RL-CA
California State Water Resources Control Board-Division of Drinking Water response level
SMCL-CA
California State Water Resources Control Board Division of Drinking Water secondary maximum contaminant level
SMCL-US
U.S. Environmental Protection Agency secondary maximum contaminant level
SRL
study reporting levels
SWRCB
California State Water Resources Control Board
SWRCB-DDW
California State Water Resources Control Board-Division of Drinking Water
TDS
total dissolved solids
USGS
U.S. Geological Survey
VOC
volatile organic compound
For more information concerning the research in this report, contact the
Director, California Water Science Center
U.S. Geological Survey
6000 J Street, Placer Hall
Sacramento, California 95819
https://www.usgs.gov/centers/california-water-science-center
Publishing support provided by the USGS Science Publishing Network,
Sacramento Publishing Service Center
Disclaimers
Any use of trade, firm, or product names is for descriptive purposes only and does not imply endorsement by the U.S. Government.
Although this information product, for the most part, is in the public domain, it also may contain copyrighted materials as noted in the text. Permission to reproduce copyrighted items must be secured from the copyright owner.
Suggested Citation
Harkness, J.S., Faulkner, K.E., and Jurgens, B.C., 2026, Status and understanding of groundwater quality in the San Joaquin Valley Kern County subbasin domestic-supply aquifer study unit, 2022—California GAMA Priority Basin Project: U.S. Geological Survey Scientific Investigations Report 2026–5012, 53 p., https://doi.org/10.3133/sir20265012.
ISSN: 2328-0328 (online)
Study Area
| Publication type | Report |
|---|---|
| Publication Subtype | USGS Numbered Series |
| Title | Status and understanding of groundwater quality in the San Joaquin Valley Kern County subbasin domestic-supply aquifer study unit, 2022—California GAMA Priority Basin Project |
| Series title | Scientific Investigations Report |
| Series number | 2026-5012 |
| DOI | 10.3133/sir20265012 |
| Publication Date | May 19, 2026 |
| Year Published | 2026 |
| Language | English |
| Publisher | U.S. Geological Survey |
| Publisher location | Reston, VA |
| Contributing office(s) | California Water Science Center |
| Description | Report: x, 53 p.; 3 Data Releases |
| Country | United States |
| State | California |
| Other Geospatial | San Joaquin Valley Kern County subbasin study unit |
| Online Only (Y/N) | Y |
| Additional Online Files (Y/N) | N |