

Determination of Baseline Water-Quality Conditions Using Continuous Specific Conductance and Discrete Measurements of Total Dissolved Solids and Selected Major Ions, Arkansas River Basin, Colorado
Links
- Document: Report (9.60 MB pdf) , HTML , XML
- Companion Files:
- Table 1.1 (5.15 KB csv) Distribution of significant trends in monthly mean streamflow using the Mann-Kendall test at selected sites on the Arkansas River and Fountain Creek, water years 1995–2022
- Table 1.2 (12.0 KB csv) Distribution of significant trends in monthly median specific conductance values using the Mann-Kendall test at selected sites on the Arkansas River and Fountain Creek, water years 1995–2022
- Data Release: USGS data release - Surrogate Models for Total Dissolved Solids and Major Ion Concentrations at Real-Time Water-Quality Sites, Arkansas River Basin, Colorado, October 1989 - December 2023
- Database: USGS water data for the Nation U.S. Geological Survey National Water Information System database
- Download citation as: RIS | Dublin Core
Abstract
From 2022 through 2024, the U.S. Geological Survey (USGS) in cooperation with the Regional Resources Planning Group (Southeastern Colorado Water Conservancy District, Colorado Springs Utilities, Pueblo Water, Lower Arkansas Valley Water Conservancy District, Aurora Water, and Upper Arkansas Water Conservancy District) established a basinwide water-quality monitoring network in the Arkansas River Basin in Colorado. The study leveraged ongoing continuous measurements of streamflow and specific conductance (SC) at 13 sites along the main stem Arkansas River and Fountain Creek from the USGS 07108600 Arkansas River at Granite, Colo., (Ark Granite) site to the USGS 07137500 Arkansas River near Coolidge, Kansas, (Ark Coolidge) site. Baseline water-quality conditions were established using data from October 1989 through September 2022 to help identify changes in water quality that could result from changes in land and water use.
Total dissolved solids (TDS) concentration was the main indicator of general water quality in this study because it can be accurately estimated from SC and is sensitive to changes in streamflow, water operations, and source contributions. Median TDS concentrations in Arkansas River samples (October 1989 through December 2023) ranged from 75 milligrams per liter (mg/L) at Ark Granite near the headwaters to 3,660 mg/L at Ark Coolidge near the Colorado–Kansas State line. Distinct seasonal differences in median streamflow and TDS were apparent during the winter and summer months.
Seasonal Kendall tests showed no significant trends in monthly mean streamflow (October 1995 through September 2022) at Arkansas River sites upstream from Pueblo Reservoir. Upward trends in TDS concentrations and loads occurred only at Ark Granite. Downward trends in streamflow, TDS concentrations, and TDS loads occurred at Arkansas River sites from USGS 07109500 Arkansas River near Avondale, Colo., to Ark Coolidge. Downward trends in streamflow and SC (surrogate for TDS) were more prevalent during winter base flow months and may indicate changes in groundwater quantity, and possibly groundwater quality, potentially affecting the river water-quality condition.
Plain Language Summary
The Arkansas River Basin in Colorado is an important water source for southeastern Colorado. This report discusses continuous water-quality monitoring data across the Arkansas River Basin from 13 sites and evaluates 2 major indicators of general water quality: total dissolved solids and specific conductance. These data were used to establish baseline water-quality conditions that could help identify water-quality changes from potential changes in land and water use or water management.
Introduction
The Arkansas River Basin covers an area of more than 28,000 square miles in southeastern Colorado. Water is imported into and exported out of the Arkansas River Basin (hereafter “the Basin”) to meet the water demands of the growing population in eastern Colorado (Colorado Water Conservation Board [CWCB], 2022). From 2010 to 2020, the population in Colorado Springs and Pueblo, the two largest cities in the Basin, increased by about 14 percent and 5 percent, respectively (U.S. Census Bureau, 2025). Demand for water is projected to increase in the Basin as populations in the Basin and in Colorado continue to grow. Effective management of existing water-storage capacity and water exchanges in the Basin is essential to supply water for municipal, agricultural, recreational, and industrial uses in southeastern Colorado (CWCB, 2022).
To better understand how water operations (such as changes in reservoir storage and releases and municipal and irrigation diversions and releases) affect water quality in the Arkansas River, a water-quality monitoring network was established in 2002 (Ortiz, 2004), near Pueblo, Colorado, that extended about 32 miles from the U.S. Geological Survey (USGS) 07097000 Arkansas River at Portland, Colo., (Ark Portland) site to the USGS 07109500 Arkansas River near Avondale, Colo., (Ark Avondale) site (fig. 1; table 1). That study offered an understanding of the effects of storage capacity management on water quality in the immediate area surrounding Pueblo (Ortiz, 2004). The current (2022−24) study includes 13 continuous specific conductance (SC) monitoring sites and spans a reach of approximately 300 river miles from the USGS 07108600 Arkansas River at Granite, Colo., (Ark Granite) site to the USGS 07137500 Arkansas River near Coolidge, Kansas, (Ark Coolidge; fig. 1; table 1) site.
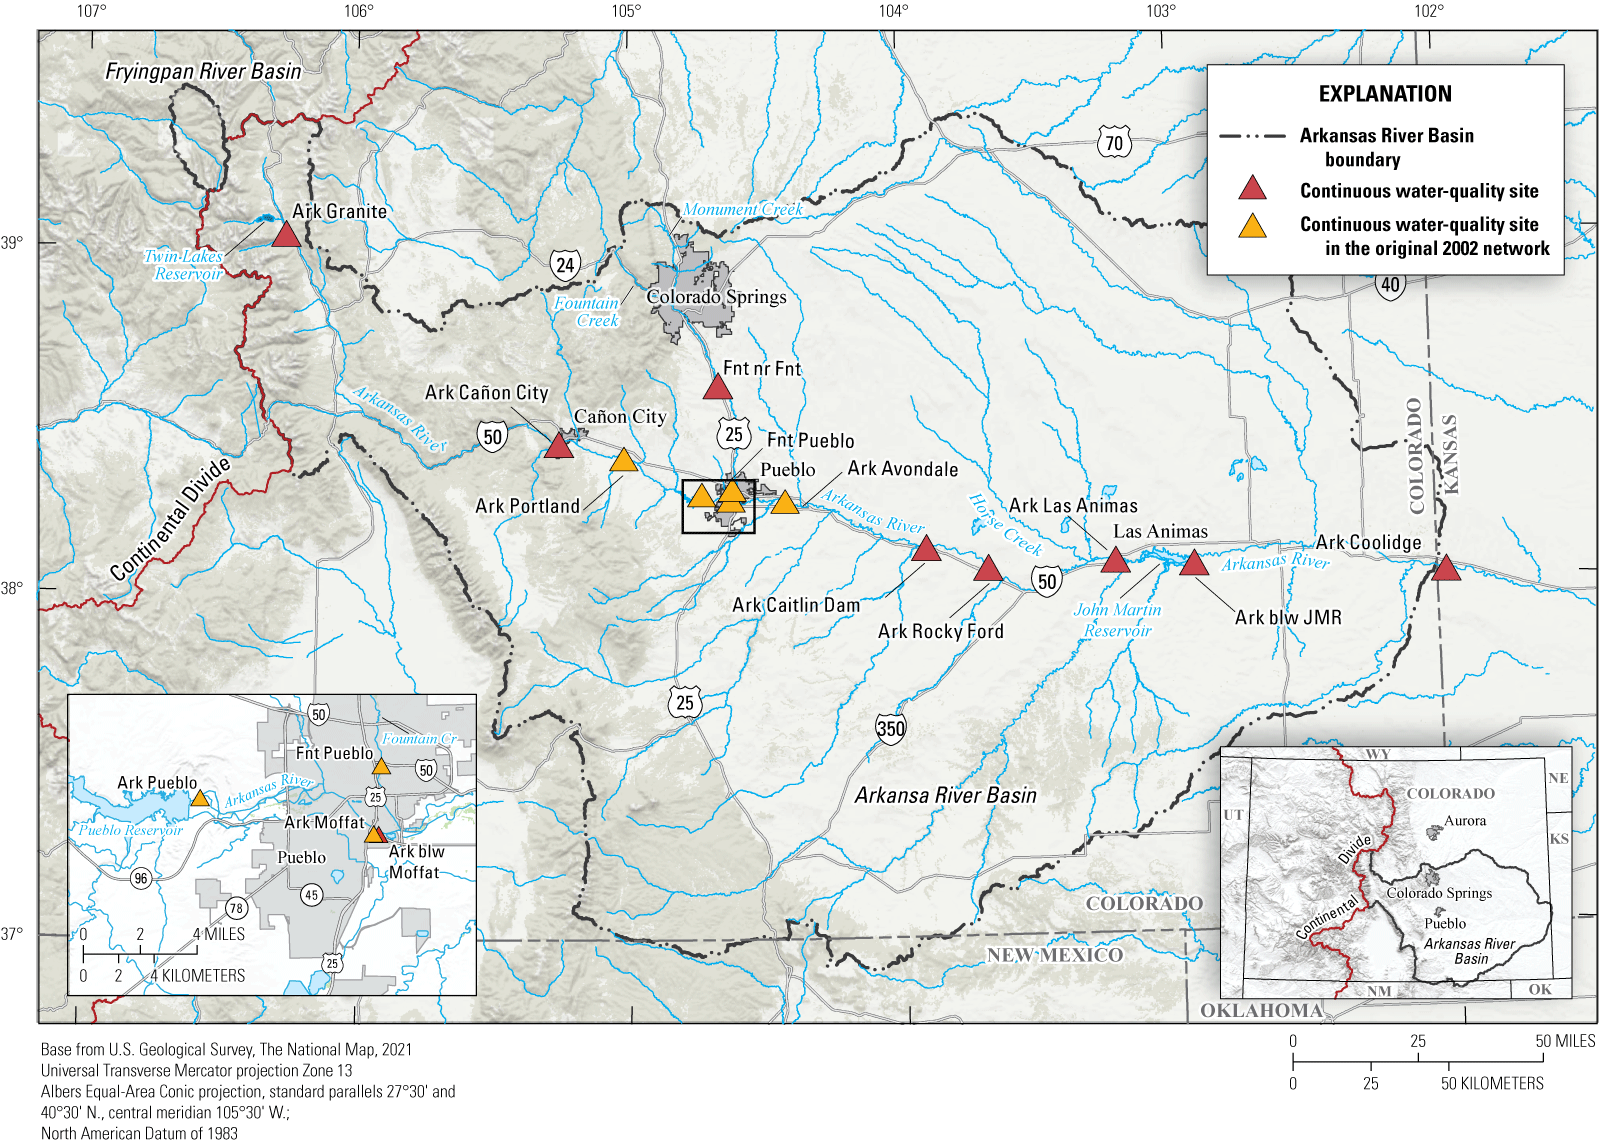
Map showing the study area and selected real-time water-quality sites within the Arkansas River Basin in Colorado. Refer to table 1 for site short names. Ark, Arkansas River; Fnt, Fountain Creek; nr, near; blw, below; JMR, John Martin Reservoir.
Table 1.
Site names and abbreviations, period of record for continuous daily streamflow and specific conductance and discrete total dissolved solids data, and streamgage operator for selected real-time water-quality sites in the Arkansas River Basin.[Water-quality data are available at U.S. Geological Survey (USGS, 2024). Streamflow data are available at USGS (2024) or Colorado Division of Water Resources (DWR; DWR, 2024). SC, specific conductance; TDS, total dissolved solids; Colo., Colorado; Ark, Arkansas River; Apr., April; Oct., October; Dec., December; Nov., November; abv, above; NA, not applicable; blw, below; Fnt, Fountain Creek; nr, near; Mar., March; Jan., January; Sept., September; JMR, John Martin Reservoir]
Previously discontinued water-quality site. Samples were collected from 2022 through 2023 as part of this study.
Streamgage operated by Colorado Division of Water Resources (DWR, 2024) during study.
Streamgage operated by U.S. Geological Survey (USGS, 2024) during study.
Original water-quality network site (Ortiz, 2004).
The objective of the initial (2002) study was to develop methods that could identify if future water-quality conditions have changed substantially from background (pre-existing) conditions (Ortiz, 2004). Total dissolved solids (TDS) was chosen as the main indicator of general water quality for the study because it can be accurately estimated from SC; is sensitive to changes in streamflow, water operations, and source contributions; and can be easily measured in the field (Ortiz, 2004). Specific conductance is highly correlated with TDS concentrations in the Basin (Ortiz and others, 1998). Total dissolved solids is a measurement of the relative amount of dissolved constituents in water that includes minerals, salts, dissolved metals, and other organic materials. Bicarbonate (HCO3), nitrate (NO3), calcium (Ca), magnesium (Mg), sodium (Na), potassium (K), chloride (Cl), sulfate (SO4), and silica (Si) usually make up most of the TDS in water (Hem, 1985). Elevated concentrations of TDS in water can (1) damage water distribution systems by corrosion, scaling, and sedimentation; (2) affect the taste, odor, and color of drinking water; (3) reduce crop yields and cause salts to build up in soils and aquifers and can eventually make the land unsuitable for growing crops (USGS, 2019). Changes in TDS concentrations and loads could be used to identify changing water-quality conditions, providing managers with information to adjust water delivery strategies to meet the needs of downstream users, and could be attributed to changes in streamflow, changes in source water to the system, or a combination of both.
Specific conductance can be used as a surrogate for TDS. As part of the previous study by Ortiz (2004), continuous streamflow and SC were measured, and discrete water-quality samples were collected and analyzed for TDS at five sites: 4 on the Arkansas River and 1 on Fountain Creek (fig. 1). Daily TDS concentrations and loads were calculated at the five sites using relations developed between SC and TDS values (Ortiz, 2004). The computed TDS concentrations and loads were then displayed on a USGS web application to enable stakeholders to more readily use the data to potentially guide water management decisions in that study area.
From 2022 through 2024, the USGS conducted a study in cooperation with the Regional Resources Planning Group (Southeastern Colorado Water Conservancy District, Colorado Springs Utilities, Pueblo Water, Lower Arkansas Valley Water Conservancy District, Aurora Water, and Upper Arkansas Water Conservancy District) to establish a basinwide water-quality monitoring network by leveraging ongoing continuous measurements of streamflow and SC at 13 sites along the main stem Arkansas River and Fountain Creek from the Ark Granite site to the Ark Coolidge site (fig. 1; table 1). As part of this study, additional data were collected at selected sites to expand the historical dataset, allow for the development of updated relations between SC and Ca, Mg, Na, SO4, and TDS, and characterize major ions across sites. New relations between SC and Ca, Mg, Na, SO4, and TDS were established using data collected from October 1989 through December 2023, and baseline statistics were computed using data collected from October 1989 through September 2022. The original web application was modified and expanded (https://www.usgs.gov/tools/arkansas-river-and-fountain-creek-water-quality-dashboard).
Purpose and Scope
This report describes an assessment of streamflow and water-quality data from a long-term water-quality network in the basin, extending from the Ark Granite site to the Ark Coolidge site. Specifically, this report establishes baseline water-quality conditions based on data from October 1989 through September 2022 (water years [WY] 1990−2022) that could be used to help identify changes in water quality that may result from changes in land and water use or water management. A WY is the 12-month period from October 1 through September 30 of the following year and is designated by the calendar year in which it ends. The report (1) describes methods used to establish a relation between daily mean SC at a recently discontinued (2023) water-quality site USGS 07099970 Arkansas River at Moffat Street (Ark Moffat) and daily mean SC at a newly established (2021) water-quality site USGS 07099971 Arkansas River below Moffat Street (Ark blw Moffat), (2) describes methods used to establish relations between discrete SC and Ca, Mg, Na, SO4, and TDS values across 13 sites using data collected from October 1989 through December 2023, (3) describes the spatial and temporal variation in TDS composition in the Arkansas River from Portland, Colorado, downstream to Coolidge, Kansas, using data collected during calendar year 2023, (4) describes seasonal and temporal trends in streamflow and TDS concentrations and loads from October 1994 through September 2022, and (5) identifies areas with higher TDS using data collected from October 1989 through December 2023. The concentrations documented in this report are from samples that are representative of the raw, untreated ambient conditions of the surface water in the Basin. The purpose of drinking water standards presented in this report for TDS are for reference only and to provide environmentally relevant context to the results.
This report uses surface-water data collected by the USGS and the Colorado Division of Water Resources (DWR) from October 1989 through December 2023. Hydrologic and water-quality data collected by the USGS are publicly available through the USGS National Water Information System (NWIS) database (USGS, 2024) using the USGS site number provided in table 1. Hydrologic data collected by the DWR are publicly available through Colorado’s Decision Support Systems database (DWR, 2024) using the DWR site abbreviation shown in table 1.
Description of the Study Area
The Arkansas River originates in the high mountains of the Continental Divide in central Colorado and flows onto the eastern plains into Kansas (fig. 1). Upstream from Cañon City, Colo., the Arkansas River is characterized by steep gradient, high velocity flows that are confined to a narrow rock and cobble stream channel. Downstream from Cañon City, the river gradient decreases as the river flows out of the mountains onto the plains. Colorado Springs, the largest city in the study area, is in the Fountain Creek Basin in El Paso County (figs. 1 and 2). Fountain Creek, a major tributary in the study area, flows into the Arkansas River within the city limits of Pueblo. Downstream from Fountain Creek, the river channel is a shifting sand channel that meanders along the alluvial floodplain (Miller and others, 2010).
Pueblo Reservoir is the first main stem reservoir on the Arkansas River; is about 6 miles west of Pueblo, Colorado (fig. 1); and provides water storage for agricultural, municipal, and industrial uses; recreation; fish and wildlife; and flood control (Bureau of Reclamation, 2022). Pueblo Reservoir was constructed between 1970 and 1975 as part of the Bureau of Reclamation’s Fryingpan-Arkansas Project (Bureau of Reclamation, 2022). The Fryingpan-Arkansas Project provides approximately 57,400 acre-feet of nonnative (transmountain) water annually from the Fryingpan River Basin (fig. 1) on the western slope of the Continental Divide to the eastern slope by means of the Arkansas River (Southeastern Colorado Water Conservancy District, 2025). During WYs 1990−2022, Fryingpan-Arkansas Project water imports varied from 13,960 acre-feet in WY 2012, to 99,810 acre-feet in WY 2011 (Southeastern Colorado Water Conservancy District, 2025; DWR, 202414). Much of the water from the project is routed to Twin Lakes Reservoir upstream from Ark Granite (fig. 1) and then released to the Arkansas River to water users upstream from Pueblo Reservoir or stored in Pueblo Reservoir (Southeastern Colorado Water Conservancy District, 2025). Native or nonnative water belonging to Colorado Springs or Aurora (fig. 1), can be directly diverted from Twin Lakes Reservoir into a pipeline for delivery to the municipal water-supply systems of the two cities (Lewis, 1999).
Under Colorado law, nonnative water imported from outside a watershed can be used and reused to the point of extinction if the amount of water can be quantified at its points of intended use (Radosevich and others, 1976). Colorado Springs, like other cities in eastern Colorado, supplements its water supply with nonnative water from outside of the Basin (Colorado Springs Utilities, 2026). This nonnative water is used to supply water for municipal, commercial, industrial, and irrigation purposes and then much of it is returned to Monument Creek and Fountain Creek (fig. 1), mostly in the form of treated wastewater effluent, to potentially be reused. Since April 1989, a physically based transit loss accounting model has been used to track native and nonnative water and administer water rights along Fountain Creek on a daily basis (Colarullo and Miller, 2019). The total volume of nonnative water flowing into Monument Creek and Fountain Creek varies from year to year but has generally increased over time as the population in El Paso County (fig. 2) has grown (Colarullo and Miller, 2019; Hennessy and others, 2024). Bern and others (2024) found significant (p-value less than [<] 0.05) increases in nonnative return flows at sites on Monument Creek and Fountain Creek for WYs 1999−2022. The annual percentage of nonnative reusable return flow ranged from 7 percent to 54 percent of the total streamflow measured near the mouth of Fountain Creek at USGS site 07106500 Fountain Creek at Pueblo, Colo., (Fnt Pueblo; fig. 1; table 1) for WYs 1999−2022 (Bern and others, 2024; Hennessy and others, 2024).
Streamflow in the Arkansas River shows considerable seasonal variability due to the timing and magnitude of snowmelt and rainfall runoff; reservoir operations; and municipal, agricultural, and industrial diversions and releases. Reservoir operations, such as the Winter Water Storage Program (WWSP), greatly affect the quantity and timing of streamflow in the Arkansas River downstream from Pueblo Reservoir. Water is stored in Pueblo Reservoir from November 15 of each year to March 14 of the next year under the WWSP and released in the spring or late summer when natural streamflow in the river may not be sufficient for irrigation needs (Ortiz, 2013; Southeastern Colorado Water Conservancy District, 2025). For nearly 120 miles downstream from Pueblo Reservoir, water from the river is diverted through a network of irrigation canals and is applied and reapplied to crops in the valley before flowing into John Martin Reservoir downstream from Las Animas (Ortiz, 2013). The Arkansas River flows into Kansas about 58 miles downstream from John Martin Reservoir (fig. 1).
From the headwaters to near Cañon City in Fremont County, the Arkansas River traverses mountainous terrain underlain by Cambrian and Proterozoic age igneous and metamorphic rocks (figs. 1 and 2). East of Cañon City, the river traverses flatter terrain underlain by Cretaceous marine shales and limestones (figs. 1 and 2) as it flows eastward through the plains toward the Colorado–Kansas State line (Green, 1992; Zielinski and others, 1995). Soils on the plains east of Cañon City originate from locally weathered marine shale and limestone and mixtures of rock fragments and minerals (Zielinski and others, 1995). Miller and others (2010) found that TDS concentrations in groundwater from Quaternary alluvial, glacial drift, and wind-laid deposits (fig. 2) increased downgradient with median values of about 220 milligrams per liter (mg/L) in the Basin headwaters to Pueblo Reservoir to about 3,400 mg/L from John Martin Reservoir to near the Colorado–Kansas State line. The sedimentary rocks, particularly the Upper Cretaceous rocks (fig. 2), in the Basin downstream from Pueblo Reservoir and in the Fountain Creek Basin were a primary source of TDS in groundwater and surface water in the Basin (Miller and others, 2010). Bern and Stogner (2017) found that inflows originating from areas affected by the Cretaceous Niobrara Formation (fig. 3) between Ark Cañon City and Ark Portland had substantially higher concentrations of TDS, particularly during the nonirrigation season when geologic effects were likely greater, than inflows where surface exposures of Niobrara Formation were absent. Ivahnenko and others (2013) found that Ca and HCO3 were the dominant ions in samples at Ark Granite and Ark Cañon City (fig. 1) where igneous and metamorphic (crystalline) rocks are present (fig. 2). Inflows affected by the Niobrara generally had Na-SO4 compositions, whereas inflows not affected by the Niobrara Formation had Ca-HCO3 compositions (Bern and Stogner, 2017).
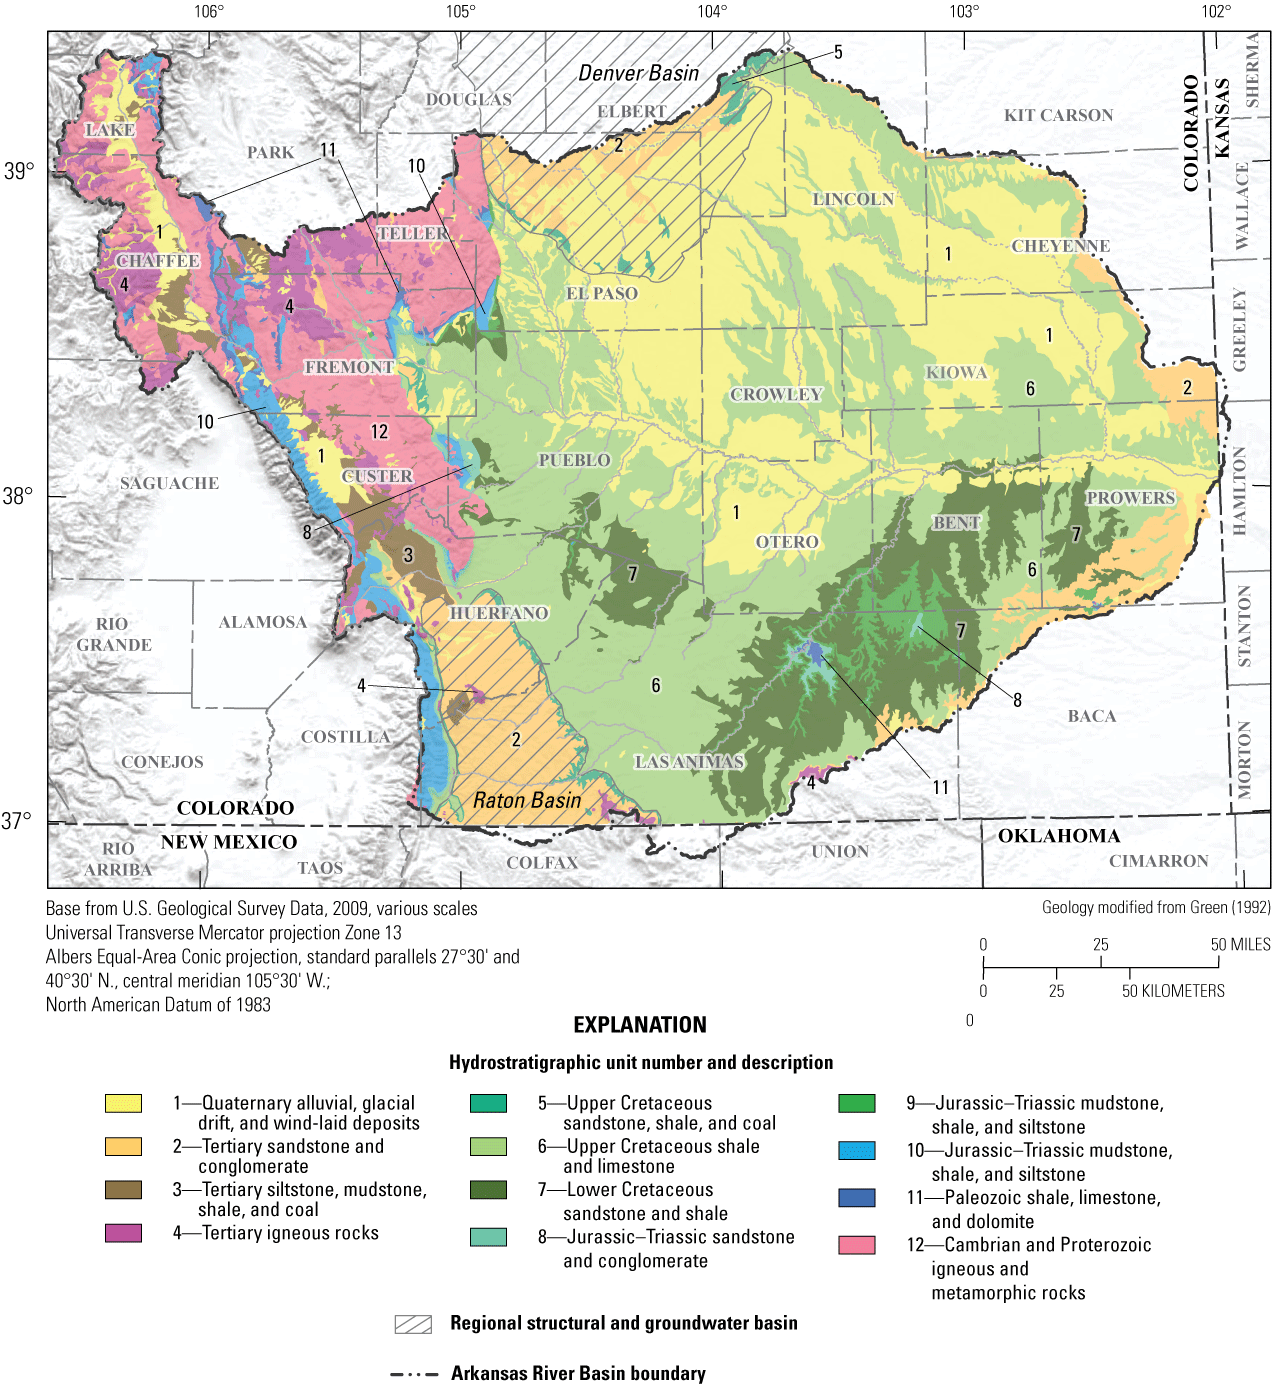
Map showing surface exposure of principal hydrostratigraphic units in the Arkansas River Basin, Colorado (geology modified from Green [1992]). Modified from Miller and others (2010).
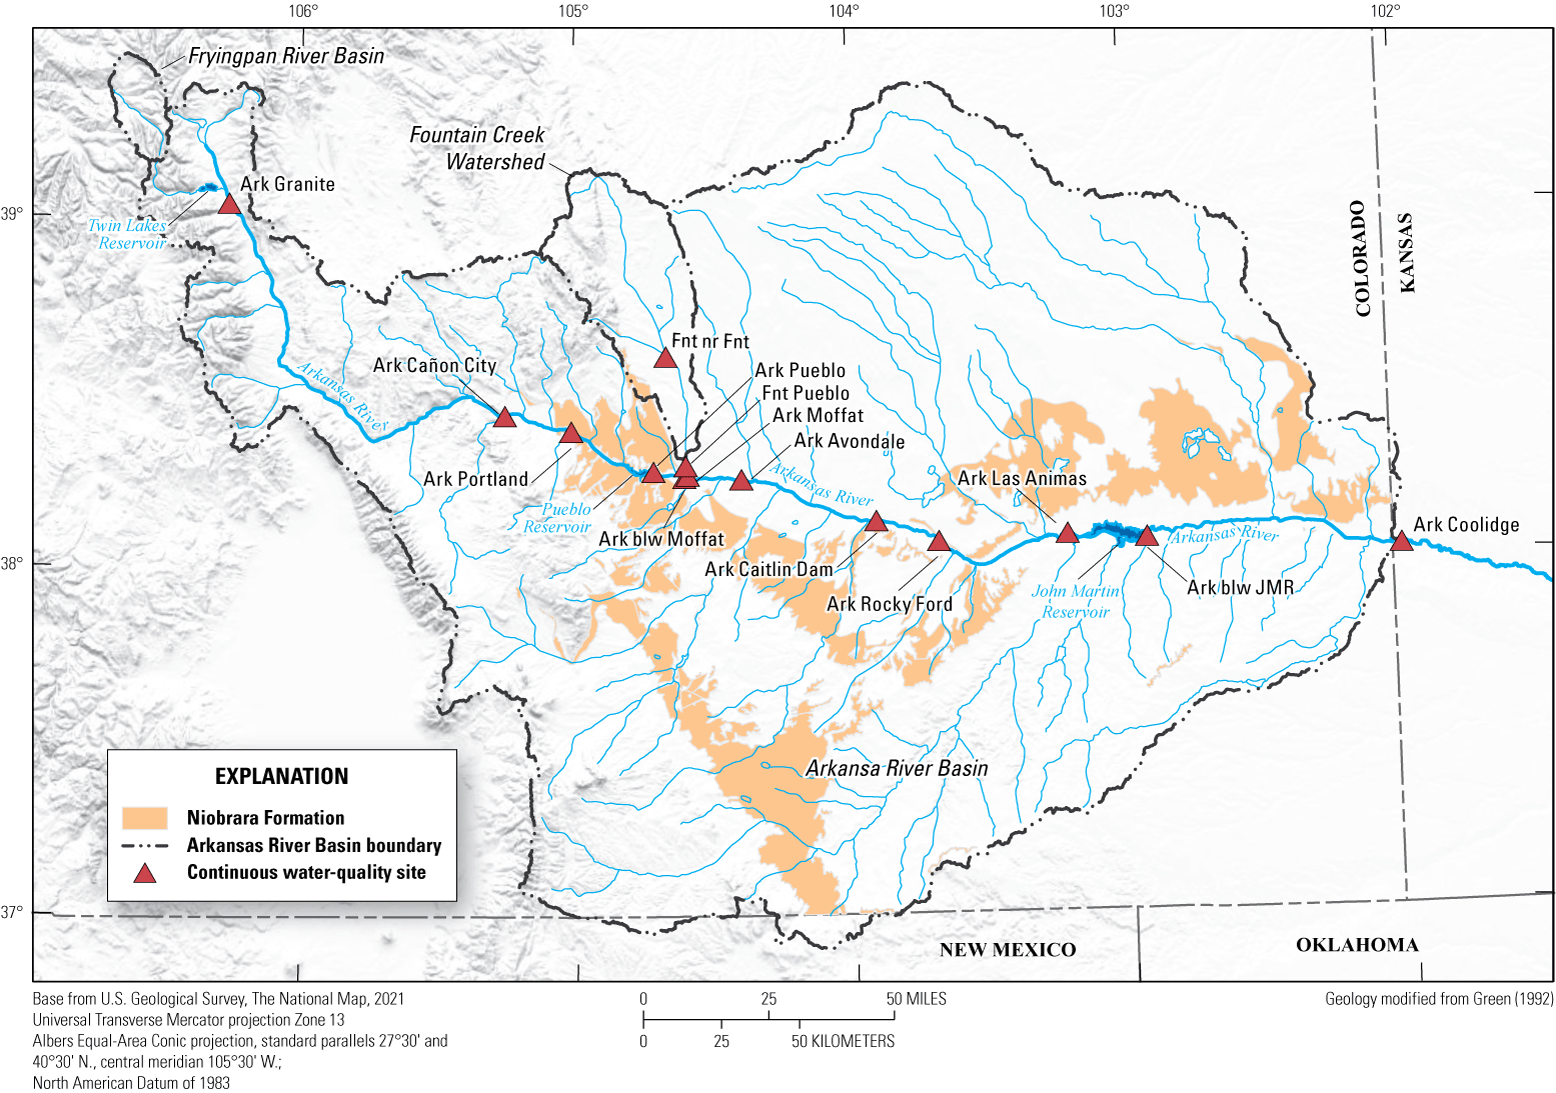
Map showing continuous water-quality sites and surface exposures of the Niobrara Formation in the Arkansas River Basin, Colorado (geology modified from Green [1992]). Refer to table 1 for site short names. Ark, Arkansas River; Fnt, Fountain Creek; nr, near; blw, below; JMR, John Martin Reservoir.
Methods for Collection and Evaluation of Water-Quality Data
This section of the report describes methods used to collect, evaluate, illustrate, and analyze water-quality and quantity data at study sites using data collected by the USGS and DWR from October 1989 through December 2023 (fig. 1). Between 1982 and 2012, 13 continuous water-quality monitors were installed by the USGS at selected continuous streamflow sites in the study area, 11 sites along the Arkansas River from Granite, Colorado, to Coolidge, Kansas, and 2 sites along Fountain Creek (fig. 1; table 1). Seven of the 13 continuous streamflow sites were operated by the USGS and the remaining six were operated by DWR (table 1). Continuous streamflow data were available from October 1989 through December 2023 for all sites but the USGS 07120500 Arkansas River near Rocky Ford, Colo., (Ark Rocky Ford) site. Collection of continuous streamflow data began on October 15, 1992, at Ark Rocky Ford (DWR, 2024). Discrete water-quality samples, including samples for TDS, were also collected at several of these sites beginning as early as the mid-1940s (table 1). However, the number of water-quality samples, timing, and the frequency of sample collection varied substantially between sites. As of 2021, TDS samples were being collected by the USGS at 9 of the 13 sites as part of other programs, generally four times a year. At the remaining four sites where water-quality data collection had been discontinued (table 1), beginning in January 2022, samples were collected monthly during a range of streamflow conditions as part of this study. All water-quality data, along with streamflow data collected by the USGS, are publicly available in the USGS NWIS database (USGS, 2024) using USGS site numbers provided in table 1. Streamflow data collected by the DWR are publicly available through Colorado’s Decision Support Systems database (DWR, 2024) using the DWR site abbreviation shown in table 1.
Collection of Water-Quality Samples
From January 2022 through December 2023, water-quality samples were collected and analyzed for TDS at all 13 study sites. In 2023, selected ions (carbonate [CO3], HCO3, Ca, Mg, Na, K, Cl, SO4, fluoride [Fl], Si, iron [Fe], manganese [Mn], alkalinity, and bromide [Br]) were added to the sampling effort to determine the composition of TDS spatially and temporally at 11 of the 13 sites, including 9 sites in the Arkansas River from Portland, Colorado, downstream to Coolidge, Kansas, and 2 sites in Fountain Creek, USGS 07106000 Fountain Creek near Fountain, Colo., (Fnt nr Fnt) and USGS 07106500 Fountain Creek at Pueblo, Colo., (Fnt Pueblo; fig. 1; table 1). All water-quality samples were collected and processed using standard USGS techniques and procedures described by the USGS “National Field Manual for the Collection of Water-Quality Data” (USGS, variously dated). Isokinetic, depth-integrating, discharge-weighted samples were collected using intervals of equal width when site and flow conditions allowed. When site or flow condition did not allow for collection of equal-width interval samples, a single point sample or multiple point (verticals) samples were collected using a DH–81 sampler (USGS, variously dated). Sample processing was done primarily in a mobile USGS laboratory at the sampling site. Sampling equipment was cleaned using part-per-billion protocols (USGS, variously dated). Specific conductance, pH, and water temperature measurements were made using protocols described in the National Field Manual (USGS, variously dated). Water-quality constituents (CO3, HCO3, Ca, Mg, Na, K, Cl, SO4, Fl, Si, Fe, Mn, alkalinity, TDS, and Br) were analyzed at the USGS National Water Quality Laboratory (NWQL) in Lakewood, Colorado (Fishman and Friedman, 1989; Fishman, 1993; Struzeski and others, 1996; Clesceri and others, 1999).
Quality Assurance and Quality Control Samples
Quality control and quality assurance (QAQC) samples (10 field blank and 13 replicate samples) accounted for about 10 percent of the total number of samples collected at the 13 study sites (fig. 1; table 1) from January 2022 through December 2023. The QAQC samples were analyzed for TDS in 2022. In 2023, QAQC samples were also analyzed for major ions (CO3, HCO3, Ca, Mg, Na, K, Cl, SO4, Fl, Si, Fe, Mn, alkalinity, TDS, and Br) at selected sites. Procedures from the National Field Manual for equipment cleaning, sample collection, and field processing were followed to minimize bias and contamination (USGS, variously dated). Field blank and replicate samples were collected to evaluate potential contamination and variability with the sampling process and analysis (Mueller and others, 2015) and analyzed by the USGS NWQL.
During this study, 10 field blank samples were collected at 8 sites (1 field blank at 6 sites and 2 field blanks at 2 sites). A field blank consisted of processing inorganic-free blank water at a field site using the same equipment and methods used in the environmental sample processing. Inorganic-free blank water was obtained from the NWQL. Field blanks were used to evaluate the potential for sample contamination from several sources, including from equipment, ambient contaminants at the site, and laboratory procedures (Mueller and others, 2015). An analysis of field blank data showed that all cleaning and processing protocols were mostly effective in minimizing contamination of water-quality samples throughout the study.
Only two constituents, filtered Cl and filtered SO4, were detected in field blanks. Filtered Cl was detected at concentrations ranging from 0.05 to 0.06 mg/L, slightly greater than the NWQL laboratory reporting limit (RL) of 0.04 mg/L, at four sites (USGS, 2024). Concentrations of filtered Cl in environmental samples, collected from the 11 sites where major ion data were collected as part of this study, ranged from 3.37 to 143 mg/L (USGS, 2024), more than 50 times higher than concentrations detected in field blanks. Filtered SO4 was detected at a concentration of 0.023 mg/L in a field blank at one site, USGS 07099400 Arkansas River above Pueblo, Colo., (Ark abv Pueblo). Concentrations of filtered SO4 in environmental samples collected from the same 11 sites ranged from 34.8 to 2,210 mg/L (USGS, 2024), more than 1,500 times higher than the concentration detected in the field blank. Consequently, concentrations of filtered Cl and filtered SO4 in field blanks likely did not affect the interpretation of environmental data.
During this study, 13 field replicate samples were collected at 11 sites (1 replicate at 9 sites and 2 replicates at 2 sites). A replicate sample involves processing two environmental samples at the same site during the same visit. Three types of replicates were collected during this study: concurrent, sequential, and split (Mueller and others, 2015). Concurrent and sequential replicates are used to target the variability in constituent concentrations resulting from sample collection, processing, and analysis. Split replicates target the source of variability resulting from sample processing and analysis and exclude variability resulting from sample collection (Mueller and others, 2015). For a concurrent sample, two volumes of water were collected in separate churns. This was accomplished by collecting two samples at each stream vertical (that is, each sample point in the cross section) using a DH-81 sampler. One sample was poured into a churn, and the other sample was poured into a different churn, resulting in two composited samples from the same cross section at about the same time. For a sequential sample, one volume of water was collected using a DH-81 sampler at multiple verticals and poured into a churn, and then a second volume of water was collected using a different DH-81 sampler along the same channel cross section and poured into a different churn. Both samples were then processed. For a split replicate, 1 volume of water was collected, and 2 sets of samples were processed out of the same churn. The environmental sample was processed first, then the replicate sample was processed.
Of the 119 constituent replicate pairs, 112 had detections greater than the RLs for the environmental and replicate sample. The relative percent difference (RPD) between the environmental and replicate concentrations was calculated for the 112 pairs using the following equation (Mueller and others 2015; eq. 1):
whereSeven of the 112 constituent replicate pairs were flagged for having an RPD greater than (>) 10 percent (table 2). The constituents for these seven pairs included carbonate (CO3) as CO3 processed in the field from a filtered sample, filtered SO4, filtered Fe, filtered Br, and acid neutralizing capacity (ANC) as calcium carbonate (CaCO3) processed in the laboratory from an unfiltered sample (table 2). All the flagged pairs were from split replicates.
Table 2.
Comparison of replicate samples at study sites in the Arkansas River Basin for constituents where the relative percent difference exceeded 10 percent, 2022–23.[Water-quality data are available at U.S. Geological Survey (USGS, 2024). Colo., Colorado; MST, mountain standard time; ANC, acid neutralizing capacity; CaCO3, calcium carbonate; unfltd, unfiltered; EP, end point; titr, titration; mg/L, milligram per liter; fltd, filtered; MDT, mountain daylight time; CO3, carbonate; NA, not applicable; µg/L, micrograms per liter]
Concentrations of filtered CO3 and Br in the flagged environmental and replicate pairs were low (<1 mg/L; table 2); as a result, small changes in concentrations produced large changes in RPD values. Concentrations of filtered Fe were near or less than the RL of 10 micrograms per liter (μg/L; table 2) in the flagged pair. The flagged pair for filtered Fe had an absolute difference (that is, the difference between the environmental and replicate values) of 2.6 μg/L (table 2). An analysis of the QAQC data from the NWQL from October 2017 through September 2022 found that there was a mean absolute difference for Fe at surface water sites of 17.354 μg/L (Bexfield and others, 2023), so the difference found in this replicate pair is likely due to variance within the NWQL analysis method with a higher RPD because of the low Fe concentration. Possible sources of variability during the processing of the sample could include clogging of the 0.45-micron filter between the environmental and replicate samples or dilution of one of the samples in a pair by not fully purging the filter of deionized water. For the purposes of this study, the variability in filtered CO3, Fe, and Br at the low concentrations shown in table 2, did not affect data interpretation because these constituents made up a very small part of the overall TDS. Sulfate concentrations in the environmental and replicate sample fell within the historical range of values for SO4 at Fnt nr Fnt (USGS, 2024). Because the primary purpose of sampling for major ions for this study was to determine the composition of TDS at each site, the difference in SO4 concentrations did not affect the data interpretation.
Acid neutralizing capacity and alkalinity are measures of the ability of a sample to neutralize a strong acid (Hem, 1985). Acid neutralizing capacity is determined using an unfiltered sample, whereas alkalinity is determined using a filtered sample. The ANC replicate pair at Ark blw JMR had the largest RPD (43.6 percent) of all samples (table 2). The replicate ANC value (218 mg/L) was substantially higher than the environmental value (140 mg/L; table 2), likely because the replicate sample was more concentrated and had more particulates than the environmental sample. The alkalinity values, determined using filtered samples, only varied by about 1 percent in the replicate (150 mg/L) and environmental (153 mg/L) samples (USGS, 2024). As a split replicate, the replicate sample was processed using the water remaining in the churn that possibly was not well mixed after the environmental sample had been processed. Consequently, the variability in ANC was likely due to how the split replicate was processed and not to sampling techniques or analysis.
Statistical Analyses
Statistical analyses used in this report include (1) linear regression techniques; (2) computation of baseline period mean, 10th percentile, 25th percentile, 75th percentile, and 90th percentile daily streamflow, SC, and TDS values for each day of the year; (3) computation of flow adjusted TDS concentrations; (4) the locally estimated scatterplot smoothing (LOESS) regression technique; (5) the Seasonal Kendall test; and (6) the Mann-Kendall test.
Two different laboratory methods were used to analyze TDS through time at study sites: (1) residue on evaporation at 180 degrees Fahrenheit and (2) the sum of constituents. Only TDS determined by residue on evaporation was used in the analyses presented in this report. These water-quality data are publicly available through the USGS NWIS database (USGS, 2024) using the USGS site number provided in table 1.
Prior to using regression techniques to develop relations between SC and Ca, Mg, Na, SO4, and TDS values, scatter plots of the discrete paired data were visually inspected to determine whether linear relations were present and consistent compared with the range of measured values. Simple linear regression was used to determine the best straight-line fit between paired discrete SC (independent variable) and Ca, Mg, Na, SO4, and TDS (dependent variables) values measured from October 1989 through December 2023, to obtain predictive equations for each constituent. The coefficient of determination, r-squared (r2), is a statistical measure of how well the predictive equation (regression line) explains variation in the actual data, varies between 0 and 1, and indicates the amount of variability in the dependent variable described by the independent variable. An r2 value of 0 indicates that there is no relation between the dependent and independent variables, and an r2 value of 1 indicates that there is a perfect relation between the dependent and independent variables (Helsel and others, 2020). The null hypothesis is that there is no relation between the dependent and independent variables (that is, the slope of the regression line is equal to zero). Small p-values indicate that the null hypothesis is unlikely to be true. A p-value of <0.05 was used in this report to indicate if a statistical test was significant.
Water years 1990−2022 were chosen as the baseline period to represent current conditions. Mean, 10th percentile, 25th percentile, 75th percentile, and 90th percentile daily streamflow and SC values were computed for each day of the calendar year at each site using all available daily mean data during the 34-year baseline period. For example, the mean, 10th percentile, 25th percentile, 75th percentile, and 90th percentile for all January 1st streamflow and SC values were calculated for January 1, 1990, through January 1, 2022. Baseline TDS concentrations were computed for each calendar day using the relations developed between SC and TDS (table 3) and the baseline daily SC values. Baseline TDS loads (tons per day [tons/d]) were computed by multiplying the baseline TDS concentrations (mg/L) by the baseline streamflow values (cubic feet per second [ft3/s]; Liebermann and others, 1987) and a conversion factor of 0.002697. In the same way, instantaneous TDS loads were computed for each sample by multiplying the discrete TDS concentration by the instantaneous streamflow value and the conversion factor. The conversion factor is the product of the unit conversions required to go from mg/L per ft3/s to tons/day. The NWIS surface-water daily statistics function (USGS, 2024) was used to calculate the baseline period, mean, 10th percentile, 25th percentile, 75th percentile, and 90th percentile daily values for SC at all sites and for streamflow at sites operated by the USGS (table 1). For streamflow gages operated by DWR (table 1), the R statistical software version 4.4.0 (R Core Team, 2024) was used to compute baseline streamflow values.
Table 3.
Relations between specific conductance and calcium, magnesium, sodium, sulfate, and total dissolved solids in surface water at selected sites in the Arkansas River Basin, October 1989–December 2023.[Water-quality data are available at U.S. Geological Survey (USGS, 2024). Specific conductance in microsiemens per centimeter at 25 degrees Celsius. Concentrations of calcium (Ca), magnesium (Mg), sodium (Na), sulfate (SO4), and total dissolved solids (TDS) in milligrams per liter. Standard error indicates the average distance that the observed values fall from the regression line. n, number of samples; r2, coefficient of determination, p-value, probability value; Colo., Colorado; Ark, Arkansas River; SC, specific conductance; =, equals; *, multiplied by; +, plus; <, less than; −, minus; abv, above; blw, below; Fnt, Fountain Creek; JMR, John Martin Reservoir]
Values of SC and TDS were flow-adjusted using the residual method to remove the effect of streamflow (Cohn and others, 1992; Ortiz, 200437). First, multiple linear regression was used to determine the best fit relation between daily mean streamflow and instantaneous SC values for WYs 1990−2022, to obtain a predictive equation 2 for SC due to streamflow (Cohn and others, 1992). Second, these predictive equations (table 4) were used to compute the daily mean SC attributed to streamflow at each site. Finally, the daily mean SC attributed to streamflow was subtracted from the daily mean SC (USGS, 2024) to obtain the flow-adjusted daily mean SC. The daily mean flow-adjusted TDS concentration was then computed by using the flow-adjusted daily mean SC with the linear regression relations developed between paired discrete SC and TDS values (table 3).
whereln
is the natural logarithm function,
SC
is the instantaneous specific conductance, in microsiemens per centimeter at 25 degrees Celsius,
ln
is the natural logarithm function,
β0
is the constant,
β1
is the coefficient of the regression parameter ln(Q/Qbar),
β2
is the coefficient of the regression parameter [ln(Q/Qbar)]2,
β3
is the coefficient of the regression parameter sin(2πT),
β4
is the coefficient of the regression parameter cos(2πT),
Q
is the daily mean streamflow in cubic feet per second,
Qbar
is the normalized daily mean streamflow in cubic feet per second,
sin
is the sine function,
cos
is the cosine function,
π
is the numerical constant approximated by the value 3.142857,
T
is the time in decimal years, and
ε
is the independent, random error.
The equation requires the estimation of five parameters: β0 is a constant, β1 and β2 describe the relation between SC value and streamflow, and β3 and β4 describe the seasonal variability in the measured SC data. The error, denoted ε, is assumed to be independent and normally distributed with zero mean and variance (Ortiz, 2004). Qbar is the normalized daily streamflow for each day of the year for WYs 1990−2022.
Table 4.
Regression model coefficients for estimation of daily mean specific conductance attributed to streamflow at selected sites on the Arkansas River and Fountain Creek, Colorado.[Refer to table 1 for a list of site numbers, site names, and short names. Water quality and streamflow data are available at U.S. Geological Survey (2024). β0, constant; β1, coefficient of the regression parameter ln(Q/Qbar); β2, coefficient of the regression parameter (ln[Q/Qbar])2; β3, coefficient of the regression parameter sin(2πT); β4, coefficient of the regression parameter cos(2πT); ln, natural logarithm function; sin, sine function; cos, cosine function; π, numerical constant approximated by the value 3.142857; Q, streamflow in cubic feet per second; Qbar, normalized daily streamflow in cubic feet per second; T, time in decimal years; r2, coefficient of determination; Ark., Arkansas River; abv, above; Fnt, Fountain; nr, near; blw, below; JMR, John Martin Reservoir]
The LOESS smoothing technique (Cleveland and others, 1992) was used to visually evaluate temporal trends in mean monthly streamflow and median monthly SC and TDS values. The LOESS smoothing technique allows the shape of the relation between the dependent variables (streamflow, SC, and TDS) and the independent variable (time) to be dictated by the data and creates a visual representation of the dominant pattern in the data (Helsel and others, 2020). To evaluate temporal monotonic trends in streamflow, SC, and TDS, two nonparametric tests were used: a Seasonal Kendall test (Hirsch and others, 1982) and a Mann-Kendall test (Mann, 1945; Kendall, 1975). The Seasonal Kendall test is a nonparametric trend test that is used to test for trends in environmental data where data from the same season is compared from year to year (Hirsch and Slack, 1984; Helsel and others, 2020). For this study, months were used as the seasons. The Seasonal Kendall test computes the Mann-Kendall test on each of the seasons, then combines the results, yielding an overall statistic (Helsel and others, 2020). The Mann-Kendall test was used to evaluate the overall change for each month during the baseline period. The slope estimates for both tests were calculated using the Theil-Sen estimator (Sen, 1968; Theil, 1992). The LOESS analysis, Seasonal Kendall test, and Mann-Kendall test were conducted using the R statistical software version 4.4.0 (R Core Team, 2024). The “EnvStats” package (Millard, 2013) was used to conduct the Seasonal Kendall test and the Mann-Kendall test.
Comparison of Specific Conductance at Arkansas River Sites Near Moffat Street
In 2021, the USGS installed a new water-quality monitor at the USGS 07099971 Arkansas River below Moffat Street, Colo., (Ark blw Moffat; fig. 1; table 1) site to replace the existing water-quality monitor at the USGS 07099970 Arkansas River at Moffat Street, Colo., (Ark Moffat; fig. 1; table 1) site. The Ark Moffat water-quality monitor site was part of the original water-quality network (Ortiz, 2004) and was colocated with a streamgage about 100 feet upstream from a sheet-piling, concrete, and rock dam. The dam serves as a good channel control for the streamflow gage but affects mixing in the river, particularly at low to medium streamflow; therefore, the dam is not an optimal site for continuous water-quality measurements. As a result, SC measurements recorded by the water-quality monitor at Ark Moffat had to be adjusted based on river stage (gage height) to account for poor mixing. The new water-quality monitor at Ark blw Moffat is about 500 feet downstream from Ark Moffat in a well-mixed section of the river.
Water-quality monitors at Ark Moffat and Ark blw Moffat were run concurrently from May 2021 through December 2023 to allow for the development of a relation between SC values measured at the two sites to facilitate use of the historical SC data collected at Ark Moffat. The SC values were not available for all days at each site during the concurrent period of operation for various reasons. Inaccurate or missing SC readings can occur because of algae growth on the SC sensor, ice, or rapid changes in streamflow (Wagner and others, 2006). Only paired daily mean data were used in the comparison of Ark Moffat and Ark blw Moffat values. Daily mean SC and streamflow data used in this analysis are available in USGS (2024). During the concurrent period of operation, the mean SC was 601 μS/cm at Ark Moffat and 547 μS/cm at Ark blw Moffat. The lower SC values at Ark blw Moffat likely occurred because the stage-related adjustments applied to the SC record at Ark Moffat do not account for all the mixing issues at the site. The water-quality monitor at Ark Moffat was discontinued on December 31, 2023; however, streamflow continues to be collected at the site (USGS, 2024). A multiple linear regression equation (r2=0.891, p-value<0.01) was developed to relate daily mean SC values at Ark Moffat and Ark blw Moffat as a function of daily mean streamflow measured at Ark Moffat (Miller and Eng, 2025; eq. 3):
whereSC
is the daily mean SC value at Ark blw Moffat (USGS 07099971),
Q
is the daily mean streamflow value at Ark Moffat (USGS 07099970), and
SC Old
is the daily mean SC value at Ark Moffat (USGS 07099970).
Daily mean SC values were estimated for Ark blw Moffat using daily mean streamflow and SC data measured at Ark Moffat from May 2021 through December 2023 (eq. 3). These estimated values were then compared to the measured SC values at Ark blw Moffat for the same period (fig. 4). Percentage differences between measured and estimated daily mean SC values at Ark blw Moffat varied from −16.5 to 9.0 percent with a mean percentage difference of −0.15 percent. Percentage differences >10.0 percent only occurred during 2023 and almost exclusively during some days in August, September, and October following a period of high summer streamflow. Eighty-seven percent of the estimated values were <5 percent different from the measured values. The mean measured SC and the mean estimated SC value were equal (547 µS/cm) during the analysis period. Consequently, historical data from Ark Moffat could be used in the water-quality analysis of data measured at Ark blw Moffat.
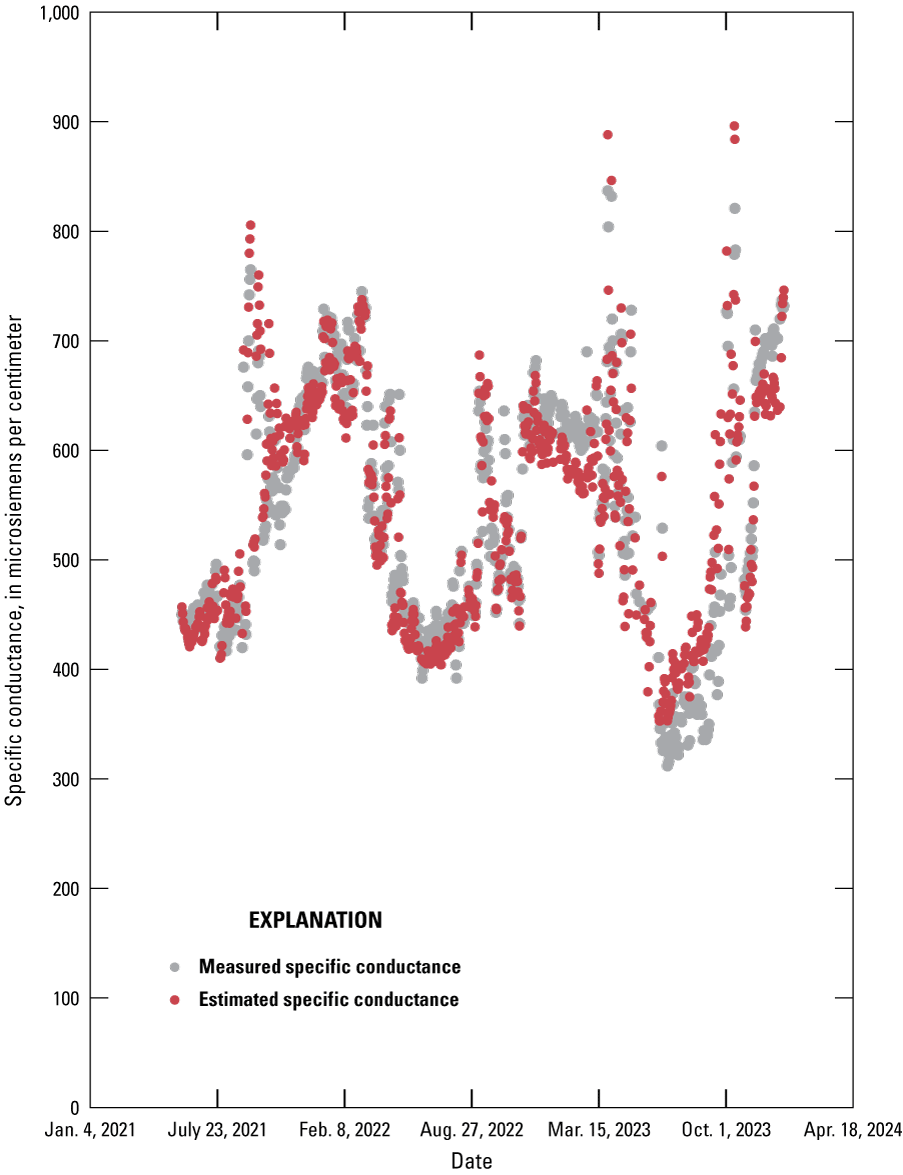
Graph showing the differences in measured and estimated daily mean specific conductance values at U.S. Geological Survey (USGS) 07099971 Arkansas River below Moffat Street at Pueblo, Colorado, using relations developed with measured specific conductance and streamflow at USGS 07099970 Arkansas River at Moffat Street at Pueblo, Colorado, May 2021 through December 2023. Daily mean streamflow and specific conductance values are in the USGS NWIS database (USGS, 2024). Methods and data used to develop the relation to estimate specific conductance at USGS 07099971 Arkansas River below Moffat Street at Pueblo, Colorado, are shown in Miller and Eng (2025). NWIS, National Water Information System; Jan., January; Feb., February; Aug., August; Mar., March; Oct., October; Apr., April.
Determination of Baseline Water-Quality Conditions
The SC values and concentrations of Ca, Na, SO4, TDS and other major ions in groundwater and surface water are affected by natural hydrogeologic and human-caused factors associated with land- and water-use practices (Hem, 1985; Miller and others, 2010). The source of most TDS in water is the mineral assemblage in rocks near the land surface. As rocks are weathered, water flowing across and through rocks will dissolve soluble minerals and chemically react with other minerals, releasing dissolved ions to the water (Hem, 1985; Miller and others, 2010). Most rocks are complex mixtures of minerals that differ widely in their solubility in water; however, except for the evaporites (halite, gypsum, and anhydrite), most minerals are not readily soluble (Hem, 1985). Total dissolved solids also concentrate in water because of evapotranspiration from crops and other vegetation and evaporation from canals, reservoirs, and from the land surface. Recycling (that is, the use and reuse of water as it flows downgradient) of irrigation water promotes enhanced water–soil and water–rock interactions that contribute to progressive downriver increases in TDS in surface and groundwater (Cain, 1987; Zielinski and others, 1995; Bern and others, 2020).
In the Arkansas River, TDS concentrations and the variability in TDS concentrations generally increase as it flows from the high mountain headwaters through the eastern plains of Colorado (figs. 1 and 5). Median TDS concentrations in Arkansas River samples (October 1989 through December 2023) ranged from 75 mg/L at Ark Granite near the headwaters to 3,660 mg/L at Ark Coolidge near the Colorado–Kansas State line (figs. 1 and 5). Median TDS concentrations in samples exceeded 500 mg/L, the national secondary drinking water standard for TDS (U.S. Environmental Protection Agency, 2024), at both Fountain Creek sites and in the Arkansas River from Ark Avondale to Ark Coolidge (figs. 1 and 5). Miller and others (2010) found similar TDS patterns in groundwater in the study area.
The TDS loads in the Arkansas River did not always increase when TDS concentrations increased (fig. 5A, B) because loads were also affected by the amount of water in the river at each site. Even though the median TDS concentration increased from 582 mg/L to 959 mg/L between Ark Avondale and Ark Rocky Ford (figs. 1 and 5A), the median instantaneous TDS load was substantially higher upstream at Ark Avondale (660 tons/day [t/d]) than downstream at Ark Rocky Ford (396 t/d) because multiple ditches divert water out of the river between the sites (figs. 1 and 5B). The greatest variability in instantaneous TDS loads occurred at sites immediately downstream from Pueblo Reservoir (Ark abv Pueblo) and John Martin Reservoir (Ark blw JMR; fig. 5B). The variability in TDS loads at these sites is most likely related to the variability in reservoir releases.
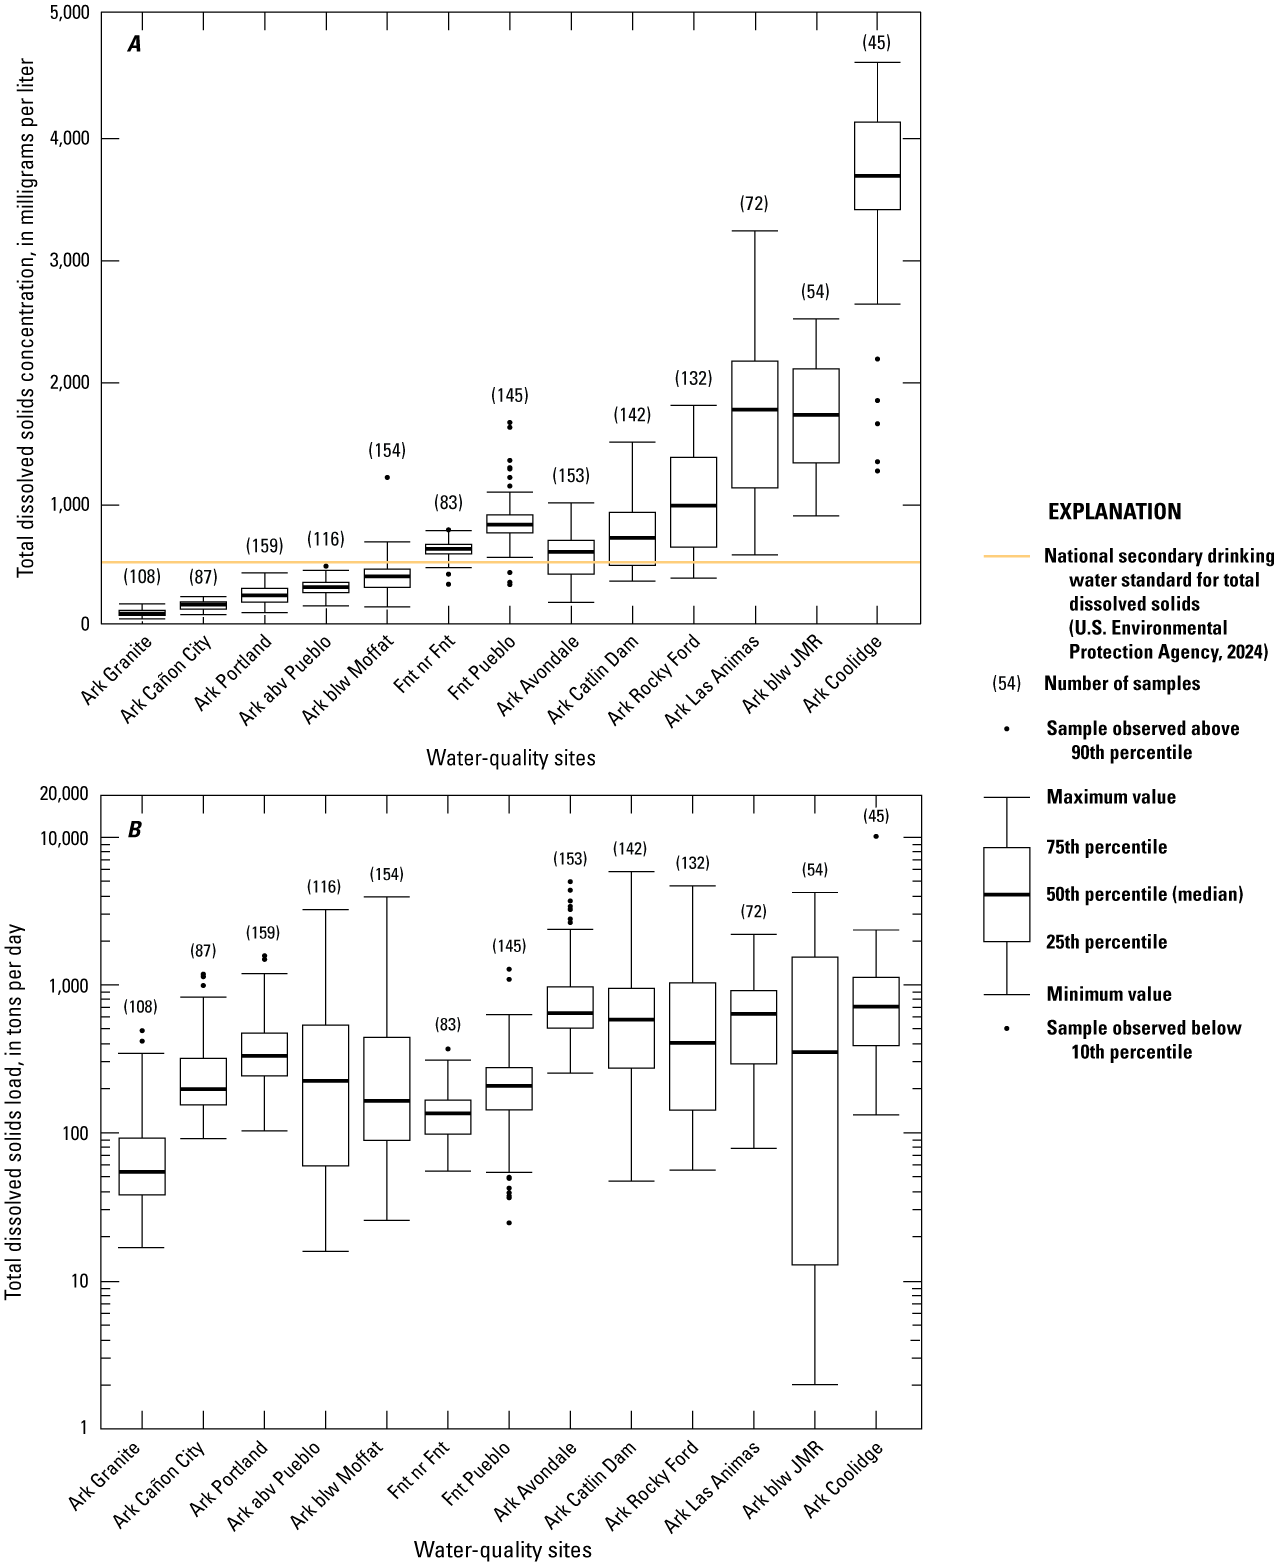
Box plots showing the spatial distribution of total dissolved solids A, concentrations (in milligrams per liter) and B, instantaneous loads (in tons per day) in samples collected at selected water-quality sites in the Arkansas River Basin, October 1989 through December 2023. Refer to table 1 for site short names. Ark., Arkansas River; abv, above; blw, below; Fnt, Fountain Creek; nr, near; JMR, John Martin Reservoir.
Bicarbonate, Ca, Mg, Na, and SO4 made up most of the TDS in Arkansas River samples. Ark Granite and Ark Cañon City were not sampled for major ions during this study, but samples have been collected historically at the two sites (Ortiz and others, 1998; Ivahnenko and others, 2013). Ivahnenko and others (2013) found that Ca and HCO3 were the dominant ions in samples at Ark Granite and Ark Cañon City (fig. 1) in the upper Basin where igneous and metamorphic (crystalline) rocks are present (fig. 2). Water type transitioned from Ca-Mg-HCO3 to Ca-Mg-SO4 between Ark Cañon City and Ark Portland (Ivahnenko and others, 2013) likely because of Niobrara-affected inflows (fig. 3) entering the river between the two sites as the surrounding geology transitions from less soluble igneous formations to more soluble sedimentary formations (Bern and Stogner, 2017; fig. 2). Downstream from Ark Portland, the dominant ions transitioned to Ca and SO4 (fig. 6A, B). Calcium and SO4 remained the dominant ions in the river to the USGS 07130500 Arkansas River below John Martin Reservoir, Colo., (Ark JMR) site. Between Ark JMR and Ark Coolidge (figs. 1 and 6B), the dominant ions in the river transitioned to Na and SO4.
Concentrations of Ca, Mg, Na, and SO4 generally increase in the Arkansas River as it flows from the headwaters to the State line (fig. 6A, B), but instantaneous loads of Ca, Mg, Na, and SO4 vary depending on streamflow quantity at each site. Median Na and SO4 concentrations in samples collected as part of this study during 2023 increased by more than 2,800 percent, and median Ca concentrations increased by 702 percent between Ark Portland and Ark Coolidge. The median Na concentrations increased from 15.3 mg/L at Ark Portland to 446 mg/L at Ark Coolidge, the median SO4 concentrations increased from 65.9 mg/L at Ark Portland to 1,955 mg/L at Ark Coolidge, and the median Ca concentration increased from 40.5 mg/L at Ark Portland to 325 mg/L at Ark Coolidge (fig. 6A, B). The median instantaneous Na and SO4 loads increased by 244 percent and 251 percent, respectively. However, the median instantaneous Ca loads decreased by 6 percent. The median instantaneous Na loads increased from 19 t/d at Ark Portland to 65 t/d at Ark Coolidge, the median instantaneous SO4 loads increased 82 t/d at Ark Portland to 288 t/d at Ark Coolidge, but the median instantaneous Ca loads decreased from 52 t/d at Ark Portland to 48 t/d at Ark Coolidge.
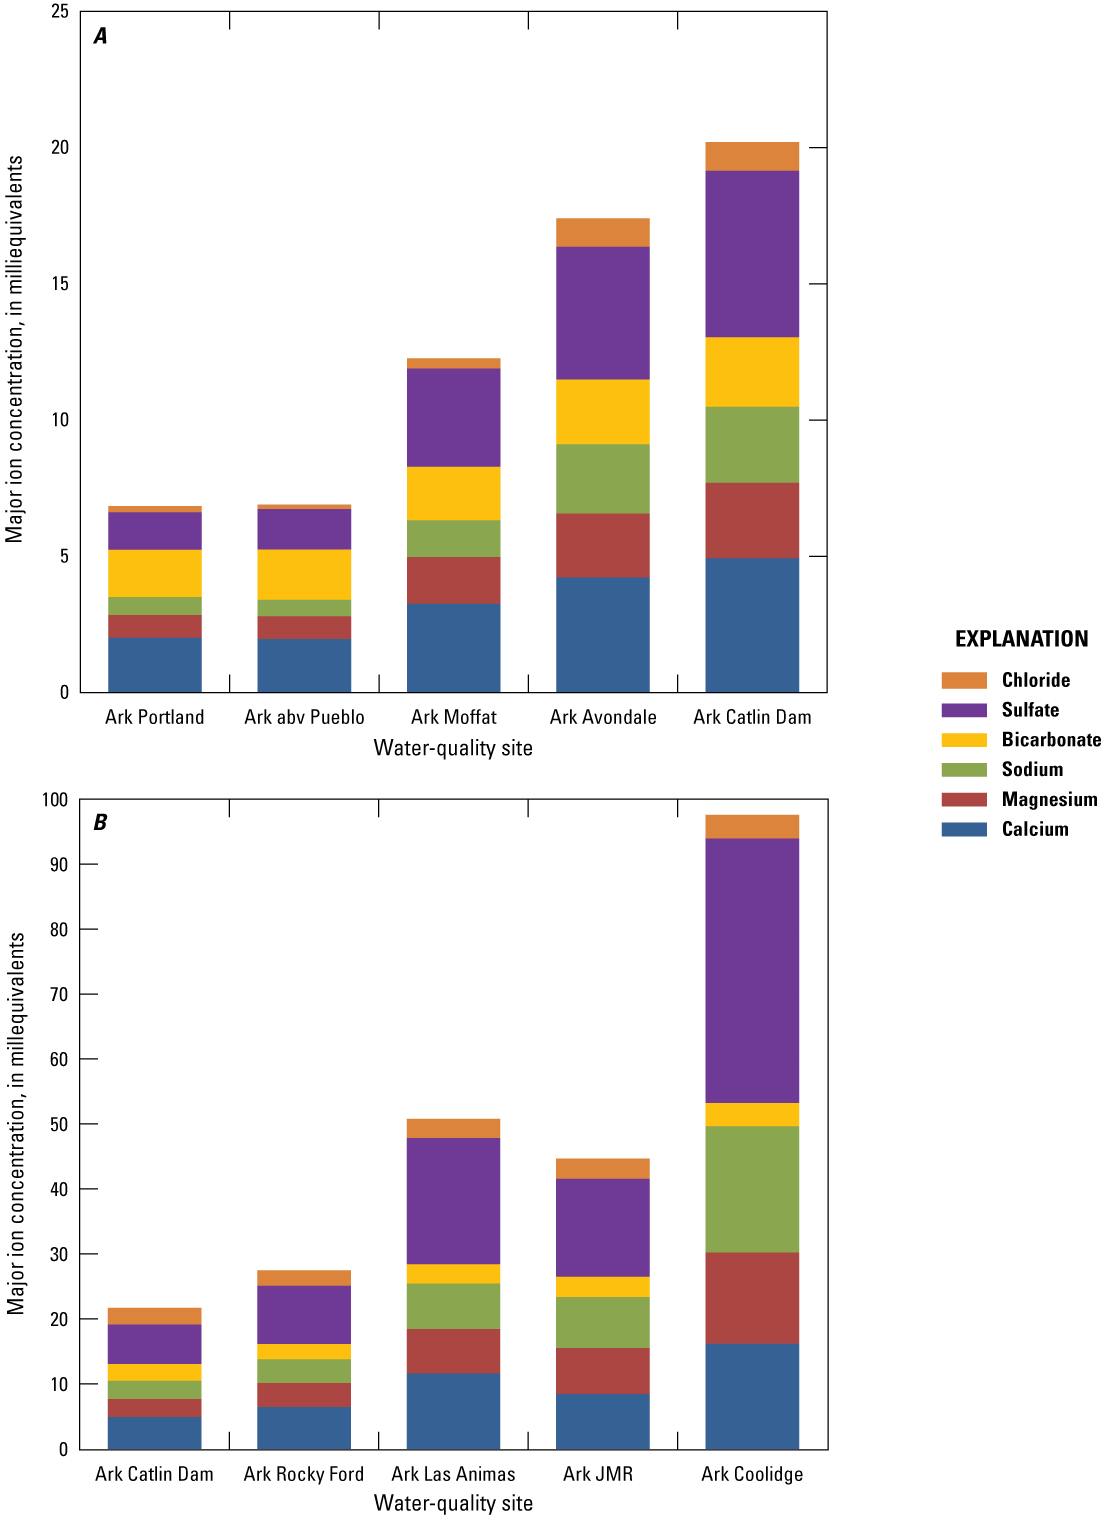
Bar graphs showing the comparison of median concentrations of six major ions (in milliequivalents) at selected water-quality sites in the Arkansas River (Ark) from A, U.S. Geological Survey (USGS) 07097000 Arkansas River at Portland, Colorado, to USGS 07119700 Arkansas River at Catlin Dam near Fowler, Colorado, and B, USGS 07119700 Arkansas River at Catlin Dam near Fowler, Colorado, to USGS 07137500 Arkansas River near Coolidge, Kansas, 2023. Refer to table 1 for site short names. abv, above; JMR, John Martin Reservoir.
Relations Between Specific Conductance and Total Dissolved Solids
Specific conductance is highly correlated with Ca, Mg, Na, SO4, and TDS concentrations in the Basin (Cain, 1987; Ortiz and others, 1998). Simple linear regression was used to determine the best straight-line fit between paired discrete SC (independent variable) and Ca, Mg, Na, SO4, and TDS (dependent variables) values measured from October 1989 through December 2023, at each study site, to obtain predictive equations for each constituent. The metadata, input, output, and script files used to develop these equations are shown in Miller and Eng (2025). Table 3 shows the regression model coefficients and the r2 value for each equation. Statistically significant (p-value <0.001) linear relations were present between SC and Ca, Mg, Na, SO4, and TDS at all sites (table 3). Values of r2 for these relations varied from 0.720 to 0.993 (table 3). However, the relation between SC and Mg, SO4, and TDS at Fnt Pueblo was not the same across the full range of SC values; a slope change in the linear relation was evident for each constituent. This change in slope likely indicates a change in source water composition during certain flow regimes (Clean Water Team, 2004). As a result, SC specific linear regression equations dependent on SC magnitude were developed to estimate Mg, SO4, and TDS at Fnt Pueblo (table 3). For example, a slight break in the relation between SC and Mg, SO4, and TDS occurred when SC values were greater than about 1,250 microsiemens per centimeter (μS/cm) at Fnt Pueblo. The single relation for that site, developed using all data, generally underestimated Mg, SO4, and TDS concentrations when SC values were <1,000 μS/cm and >1,500 μS/cm and slightly overestimated TDS values when SC values were between about 1,200 and 1,300 μS/cm. The SC specific relations (less than or equal to 1,250 μS/cm and greater than 1,250 μS/cm) had lower standard errors and fit the measured data better than a single relation at Fnt Pueblo (table 3). For relations developed between SC and TDS at study sites, r2 values varied from 0.894 at Ark Granite to 0.992 at Ark Rocky Ford (table 3).
Daily mean TDS concentrations were computed using the new relations developed between SC and TDS during this study (table 3) and previously developed relations by Ortiz (2004) and Miller and others (2010) and daily mean SC values for the baseline period (WYs 1990–2022) at 12 of the 13 sites. Ark Rocky Ford was not included in this analysis because no previous relation between SC and TDS was published for the site. Daily mean TDS concentrations, based on the new and old relations, were compared to determine whether relations between SC and TDS had changed through time. Absolute percentage differences between these TDS concentrations varied from 0.09 to 1.75 percent; TDS concentrations at most sites varied by less than 1.0 percent. These results indicate that the relations between SC and TDS have remained consistent through time at the compared sites.
Mean, 10th percentile, 25th percentile, 75th percentile, and 90th percentile daily streamflow and TDS concentrations and loads were computed for each day of the calendar year at each site using all available daily mean data during the 34-year baseline period as described in the “Statistical Analyses” section of the report. Comparisons can be made between these baseline values and current or future values to help identify changes in water quality that may result from changes in land or water use or timing of runoff events. Figure 7 illustrates how baseline values can be used to identify changes in water quality over time and shows a comparison of daily mean TDS concentrations and loads and the computed mean, 10th percentile, and 90th percentile daily baseline values at Ark Avondale. Daily mean TDS concentrations during June 2024, were below the mean daily baseline TDS concentrations (fig. 7A). TDS loads (fig. 7B) were near the mean daily baseline values at the beginning of June, increased rapidly starting about June 5th, peaked on June 10th when the highest streamflow of the calendar year occurred because of snowmelt runoff, and then decreased below the mean daily baseline values starting around June 19th (USGS, 2024).
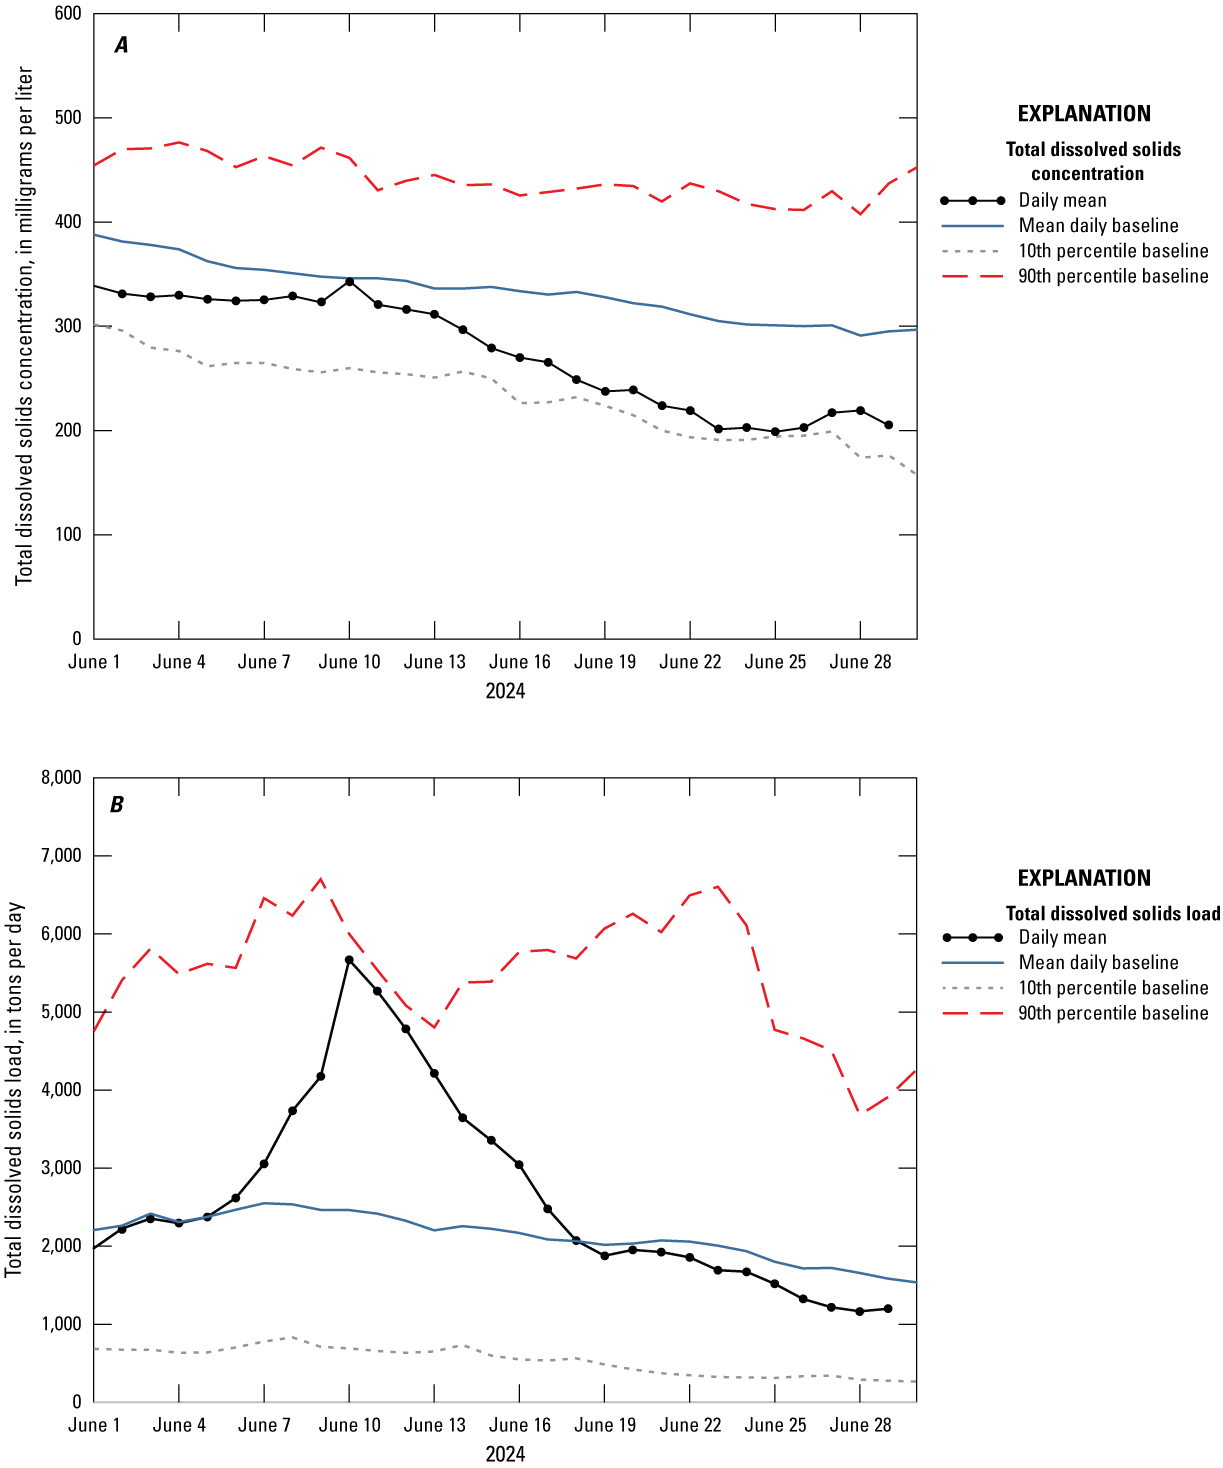
Graphs showing a comparison of daily mean total dissolved solids A, concentrations (in milligrams per liter) and B, loads (in tons per day) to mean daily baseline values at U.S. Geological Survey 07109500 Arkansas River near Avondale, Colorado, June 2024.
Relations Between Streamflow and Specific Conductance
As shown in the “Relations between Specific Conductance and Total Dissolved Solids” section, SC values can act as a surrogate for TDS concentrations, and relations between streamflow and SC can indicate likely effects on TDS concentrations at the sites. Streamflow in the Arkansas River shows considerable seasonal variability due to the timing and magnitude of snowmelt and rainfall runoff; reservoir operations; and municipal, agricultural, and industrial diversions and releases (Lewis and Brendle, 1998). The SC values and streamflow are generally inversely related in the study area, where higher values of SC generally occur with lower streamflow and lower values of SC with higher streamflow, as shown in figure 8A, B. Figure 8A, B illustrates how water operations and seasonal variability in streamflow sources can affect SC values. Distinct seasonal differences in median streamflow and SC values were apparent during the winter and summer months at Ark Portland and the USGS 07124000 Arkansas River at Las Animas, Colo., (Ark Las Animas; fig. 8A, B) site. During the winter, water is stored primarily in Pueblo Reservoir starting on November 15 and ending March 14 of the following year as part of the WWSP (Southeastern Colorado Water Conservancy District, 2025). Abrupt changes in median streamflow and SC values were evident in the Arkansas River downstream from Pueblo Reservoir at Ark Las Animas (figs. 1 and 8B) around the beginning and ending of the WWSP because water is stored in the winter and released and diverted by canals upstream from the site during the spring and summer. Ark Portland is upstream from Pueblo Reservoir and upstream from most major canals, so these abrupt changes in streamflow and SC values were not apparent at the beginning and end of the WWSP and irrigation season, which generally goes from March through October (fig. 8A). Snowmelt runoff from the mountainous areas of the Basin, generally in May and June, produces the highest streamflow and lowest SC values of the year at most sites as illustrated by Ark Portland and Ark Las Animas (fig. 8A, B). During low flow periods, especially during the winter months, SC and TDS values are higher than when the dominant source of flow to the river originates from snowmelt or storm runoff. Inflows to the river during low flow periods likely originate from groundwater sources, return flows, or other releases (Burns, 1985) that have had more interaction with the land surface, resulting in higher SC and TDS.
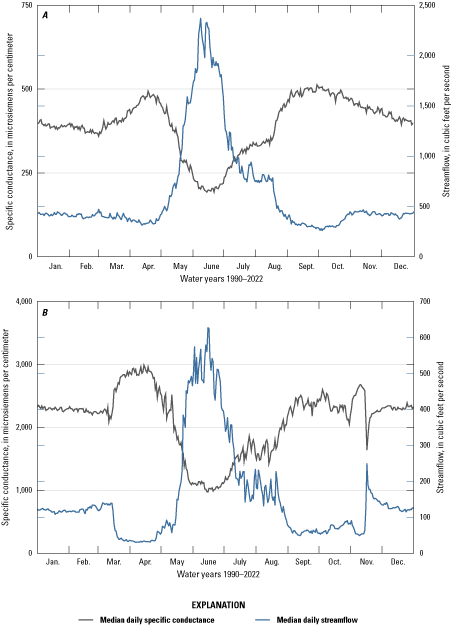
Graphs showing the seasonal differences in median daily baseline streamflow (in cubic feet per second) and specific conductance (in microsiemens per centimeter) values at A, USGS 07097000 Arkansas River at Portland, Colorado, and B, USGS 07124000 Arkansas River at Las Animas, Colorado, water years 1990–2022. Jan., January; Feb., February; Mar., March; Apr., April; Aug., August; Sept., September; Oct., October; Nov., November; Dec., December.
Much of the variance in SC and thus TDS can be attributed to the variance in streamflow, as shown in figure 8. Specific conductance and TDS were flow-adjusted to remove the effect of streamflow to evaluate changes in SC and TDS not due to changes in streamflow (Cohn and others, 1992; Ortiz, 2004) using relations developed between discrete SC and streamflow values (Miller and Eng, 2025; table 4). For these relations between SC and streamflow, r2 values varied from 0.355 at Ark abv Pueblo to 0.854 at Ark Catlin Dam (table 4; fig. 1). Ark Avondale, Ark Catlin Dam, and Ark Rocky Ford relations had the highest r2 values and Ark abv Pueblo, Ark Cañon City, and Ark Portland relations had the lowest r2 values (table 4). Low r2 values indicate poor relations between SC and streamflow. Reservoir operations, water exchanges, diversions, and return flows from wastewater and irrigation affect the quantity of streamflow in the Arkansas River and Fountain Creek and may also affect SC values (Lewis, 1999) and the relations between SC and streamflow.
Trends in Streamflow, Specific Conductance, and Total Dissolved Solids
Temporal changes in TDS concentrations and loads can be used to identify changing water-quality conditions. Changes in TDS concentrations could be attributed to a change in streamflow, a change in the source water to the system, or a combination of both. The mixing of nonnative water and native water may affect water quality in the Arkansas River and Fountain Creek. However, the quality of nonnative water was not evaluated as part of this study. To accurately assess trends in water-quality constituents, such as TDS, it is important to have a dataset that accurately represents the seasonal variability in source waters and year-to-year variability in streamflow (Hirsch and others, 2010). Mean monthly streamflow and median monthly SC values, TDS concentrations, and TDS loads used in the trend analyses were computed from daily mean streamflow and SC values recorded at the sites. The period of records varied across sites for SC, and most sites have complete records starting in WY 1995 (table 1). Therefore, trends in SC and TDS were evaluated for WYs 1995 through 2022 at 9 of the 13 sites. Water-quality monitors were installed at Ark Coolidge in 1999, at Ark Rocky Ford in 2012, and Ark blw Moffat in 2021 (table 1). Trends in SC and TDS were evaluated using data for WYs 2000 through 2022 at Ark Coolidge and for WYs 2013 through 2022 at Ark Rocky Ford. Trends in streamflow were evaluated using data for WYs 1995 through 2022 at both Ark Coolidge and Ark Rocky Ford. Trends in streamflow were not evaluated at Ark Catlin Dam because the streamflow gage operated only seasonally from 2019 through 2022. Trend analyses were not done at Ark blw Moffat.
Higher than mean streamflow occurred in the mid to late 1990s at the start of the trend analysis period (October 1994) and below mean streamflow occurred in 2020–22 at the end of the trend analysis period (September 2022) at sites downstream from Pueblo Reservoir; very low flows occurred in 2002 and 2012 (fig. 9). Streamflow values and TDS loads are generally directly correlated, and streamflow values and TDS concentrations are generally inversely correlated in the study area as illustrated in figures 7 and 8. For this reason, downward trends in streamflow and TDS loads and upward trends in TDS concentrations would be expected during the WYs 1995−2022 analysis period. It is likely that trend results could turn out differently if the analysis period began in the early 2000s or mid to late 1970s, when streamflows were lowest at Ark Las Animas (fig. 9).
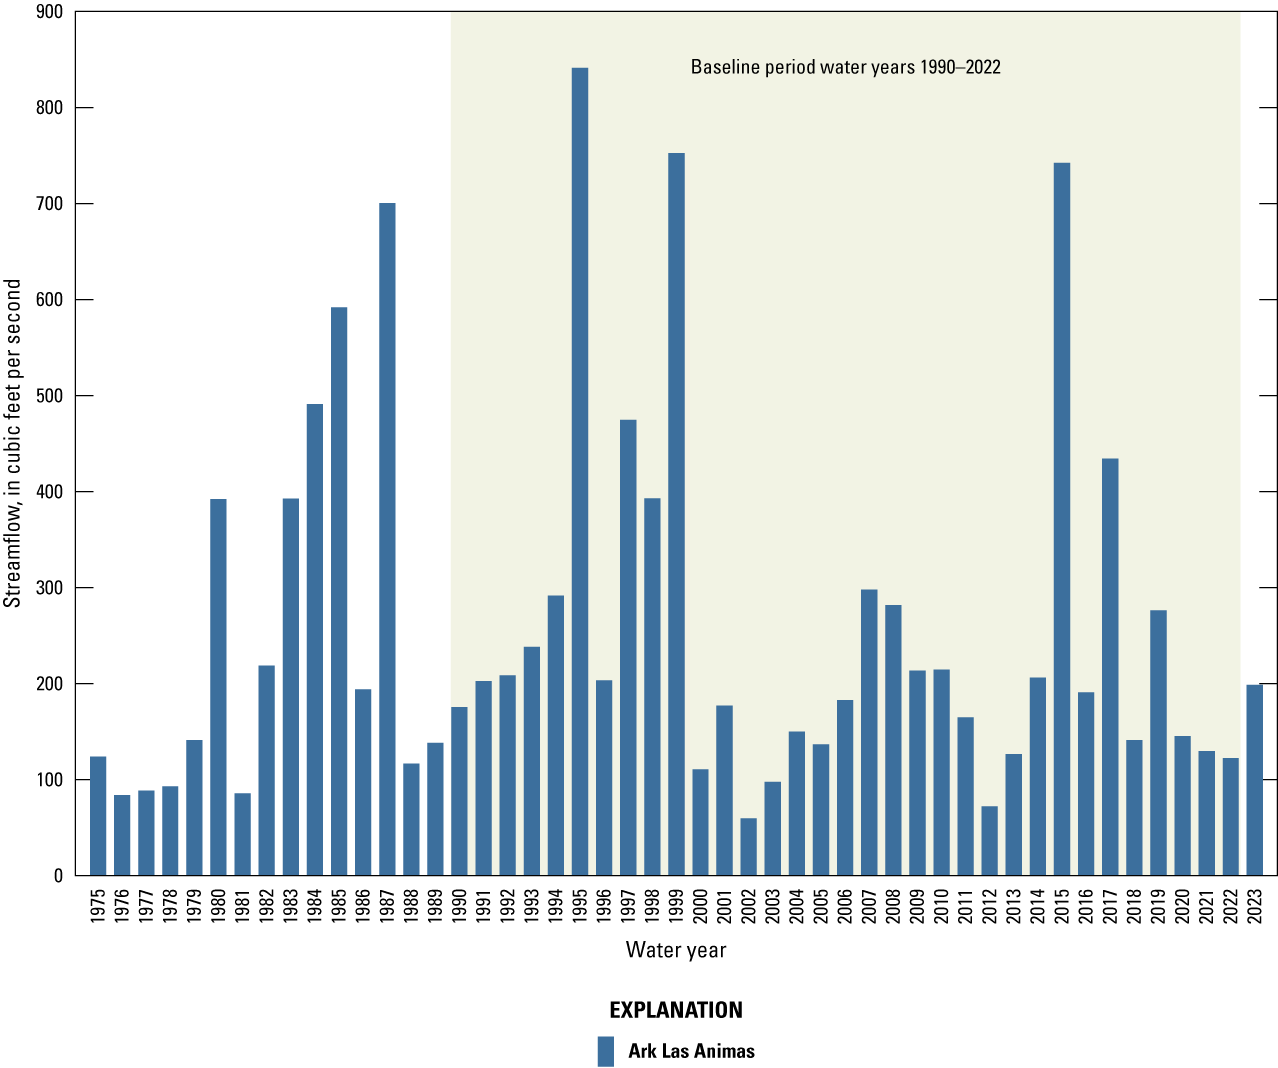
Bar graph showing annual mean streamflow (in cubic feet per second) at U.S. Geological Survey 07124000 Arkansas River at Las Animas, Colorado, (Ark Las Animas) water years 1975–2022.
Seasonal Kendall tests (WYs 1995−2022) showed no significant trends in streamflow at the two most upstream sites on the Arkansas River, Ark Granite and Ark Cañon City (table 5). However, significant downward trends in streamflow were detected at Arkansas River sites from Ark Portland to Ark Coolidge and at Fountain Creek sites (table 5). Significant upward trends in TDS concentrations (table 6) and loads (table 7) were detected at Ark Granite. No significant trends in TDS concentrations were detected at Ark Cañon City or Ark Moffat (table 6), but significant downward trends in TDS loads were detected at the sites (table 7). Significant downward trends in TDS concentrations and loads were detected at the Fountain Creek sites, Ark Portland, Ark abv Pueblo, and at all Arkansas River sites from Ark Avondale to Ark Coolidge (fig. 1; tables 6 and 7). At Ark Rocky Ford, analyses for WYs 2013–2022 showed a significant downward trend in streamflow and a significant upward trend in TDS concentrations (table 6) but no significant trend in TDS loads (table 7).
Table 5.
Trends in streamflow at selected sites in the Arkansas River Basin, water years 1995–2022.[Streamflow data available at U.S. Geological Survey (USGS, 2024) or Colorado Division of Water Resources (DWR, 2024). Refer to Hirsch and others (1982) and Hirsch and Slack (1984) for information about the Seasonal Kendall statistical test. Tau, Kendall's tau correlation coefficient for ranked data; ft3/s/yr, cubic feet per second per year; p-value chisq, chi-square probability value; p-value trend; probability value for Seasonal Kendall trend test; LCL, lower confidence interval at confidence level 95 percent; UCL, upper confidence interval at confidence level 95 percent; start date, beginning year and month for analysis period for site; end date, end year and month for analysis period for site; Colo., Colorado; Oct., October; Sept., September; <, less than]
Table 6.
Trends in total dissolved solids concentrations at selected sites in the Arkansas River Basin, water years 1995–2022.[Water-quality data available at U.S. Geological Survey (2024). Refer to Hirsch and others (1982) and Hirsch and Slack (1984) for information about the Seasonal Kendall statistical test. Tau, Kendall's tau correlation coefficient for ranked data; mg/L/yr, milligrams per liter per year; p-value chisq, chi-square probability value; p-value trend; probability value for Seasonal Kendall trend test; LCL, lower confidence interval at confidence level 95 percent; UCL, upper confidence interval at confidence level 95 percent; start date, beginning year and month for analysis period for site; end date, end year and month for analysis period for site; Colo., Colorado; <, less than; Oct., October; Sept., September]
Table 7.
Trends in total dissolved solids loads at selected sites in the Arkansas River Basin, water years 1995–2022.[Water-quality data are available at U.S. Geological Survey (USGS, 2024). Streamflow data are available at USGS (2024) or Colorado Division of Water Resources (2024). Refer to Hirsch and others (1982) and Hirsch and Slack (1984) for information about the Seasonal Kendall statistical test. Tau, Kendall's tau correlation coefficient for ranked data; tons/d/yr, milligrams per liter per year; p-value chisq, chi-square probability value; p-value trend; probability value for Seasonal Kendall trend test; LCL, lower confidence interval at confidence level 95 percent; UCL, upper confidence interval at confidence level 95 percent; start date, beginning year and month for analysis period for site; end date, end year and month for analysis period for site; Colo., Colorado; <, less than; Oct., October; Sept., September]
Results from the Mann-Kendall test (WYs 1995−2022) on monthly values showed fewer significant trends than the Seasonal Kendall test, likely because seasonal differences were present in the data (figures 8A, B). The Mann-Kendall test is used to test for consistent upward or downward trends in continuous data, not to detect seasonal patterns (Helsel and others, 2020). No significant trends in monthly mean streamflow were detected at the three sites (Ark Granite, Ark Cañon City, and Ark Portland) upstream from Pueblo Reservoir (fig. 1; app. 1; table 1.1) using the Mann-Kendall test. Significant upward trends in monthly median SC values were detected at Ark Granite from June through September (table 1.2; fig. 10A). No significant trends were detected in SC values at Ark Cañon City or Ark Portland (table 1.2).
Immediately downstream from Pueblo Reservoir at Ark abv Pueblo, significant downward trends in monthly mean streamflow occurred from October through March and May (table 1.1); significant downward trends occurred in monthly median SC values from October through May at the site (table 1.2). Along Fountain Creek, significant downward trends in monthly median SC values occurred during November and December at Fnt nr Fnt and October through December at Fnt Pueblo (fig. 1; table 1.2), but significant downward trends in monthly mean streamflow occurred only during February (table 1.1). Significant downward trends in monthly mean streamflow occurred for one or more months at all sites downstream from Pueblo Reservoir (fig. 1; table 1.1). Significant downward trends in monthly median SC values occurred for one or more months at all sites downstream from Pueblo Reservoir (fig. 1; table 1.2). These downward trends in monthly median SC values occurred more frequently during the WWSP months, particularly during December (table 1.2). At Ark Rocky Ford, analyses for WYs 2013–2022 showed no significant trends in monthly median SC values (table 1.2), but a significant downward trend in monthly mean streamflow was detected for April. When evaluated over the longer WYs 1995–2022 period, significant downward trends in monthly mean streamflow were detected in January, April, November, and December at Ark Rocky Ford (table 1.1).
Upward trends in TDS concentrations and loads and SC values at Ark Granite could have resulted from remedial actions that took place to minimize erosion of fluvial mine waste deposits along the Arkansas River upstream from the site during the analysis period. As part of the remedial process, selected irrigated meadows and tailings deposits were revegetated. Initial treatment consisted of lime amendment or lime and organic matter amendment, deep tilling, seeding, and mulching (Christner, 2013). Lime application reduces soil acidity and increases Ca and possibly Mg in the soil (Ritchey and others, 2025). Bicarbonate, Ca, Mg, Na, and SO4 made up most of the TDS in the Arkansas River samples (fig. 6A, B). Runoff from areas treated with lime during the analysis period could have had higher than background concentrations of Ca and Mg and, consequently, increased concentrations of TDS in the Arkansas River at Ark Granite.
Downward trends in streamflow and TDS loads were expected at sites downstream from Pueblo Reservoir because streamflow was higher than mean at the beginning of the trend analysis period and lower than mean at the ending of the trend analysis period (fig. 9). However, downward trends in TDS concentrations and SC values were not expected because higher TDS concentrations and SC values generally occur during lower streamflow in the study area (fig. 8A, B). Because downward trends in streamflow and SC (surrogate for TDS) were more prevalent during winter base flow months (tables 1.1 and 1.2; fig. 10B), this trend may indicate changes in groundwater quantity, and possibly groundwater quality, potentially affecting the river water-quality condition. From 1994 to 2022, irrigated farmlands in Colorado declined by more than 23 percent (U.S. Department of Agriculture, 2025). Along the Arkansas River between Pueblo Reservoir and Las Animas (fig. 1), land in farms declined by 7 percent, 23 percent, and 40 percent in Pueblo, Otero, and Crowley counties (fig. 2), respectively, from 2017 to 2022 (U.S. Department of Agriculture, 2025). Seasonal Kendall tests (WYs 1995−2022) showed mean annual decreases in TDS concentrations of 1.33 mg/L per year (mg/L/yr) at Ark Avondale, 1.65 mg/L/yr at Ark Catlin Dam, and 19.4 mg/L/yr at Ark Las Animas, respectively (table 6; fig. 3). Declines in irrigated farmlands, changes in farming practices, and transfer of water to municipalities may have reduced the amount of water being applied to the land surface through time, which in turn could reduce groundwater return flows and the effects of water recycling on water quality during WYs 1995–2022 (CWCB, 2022; DWR, 2025; U.S. Department of Agriculture, 2025). In addition, mixing of importated Fryingpan-Arkansas Project water and native streamflow may also act affect TDS concentrations and SC values in the Arkansas River and Fountain Creek. Lewis and Brendle (1998) found that imported water released to the river during the winter tended to dilute TDS concentrations and lower SC values upstream from Pueblo Reservoir.

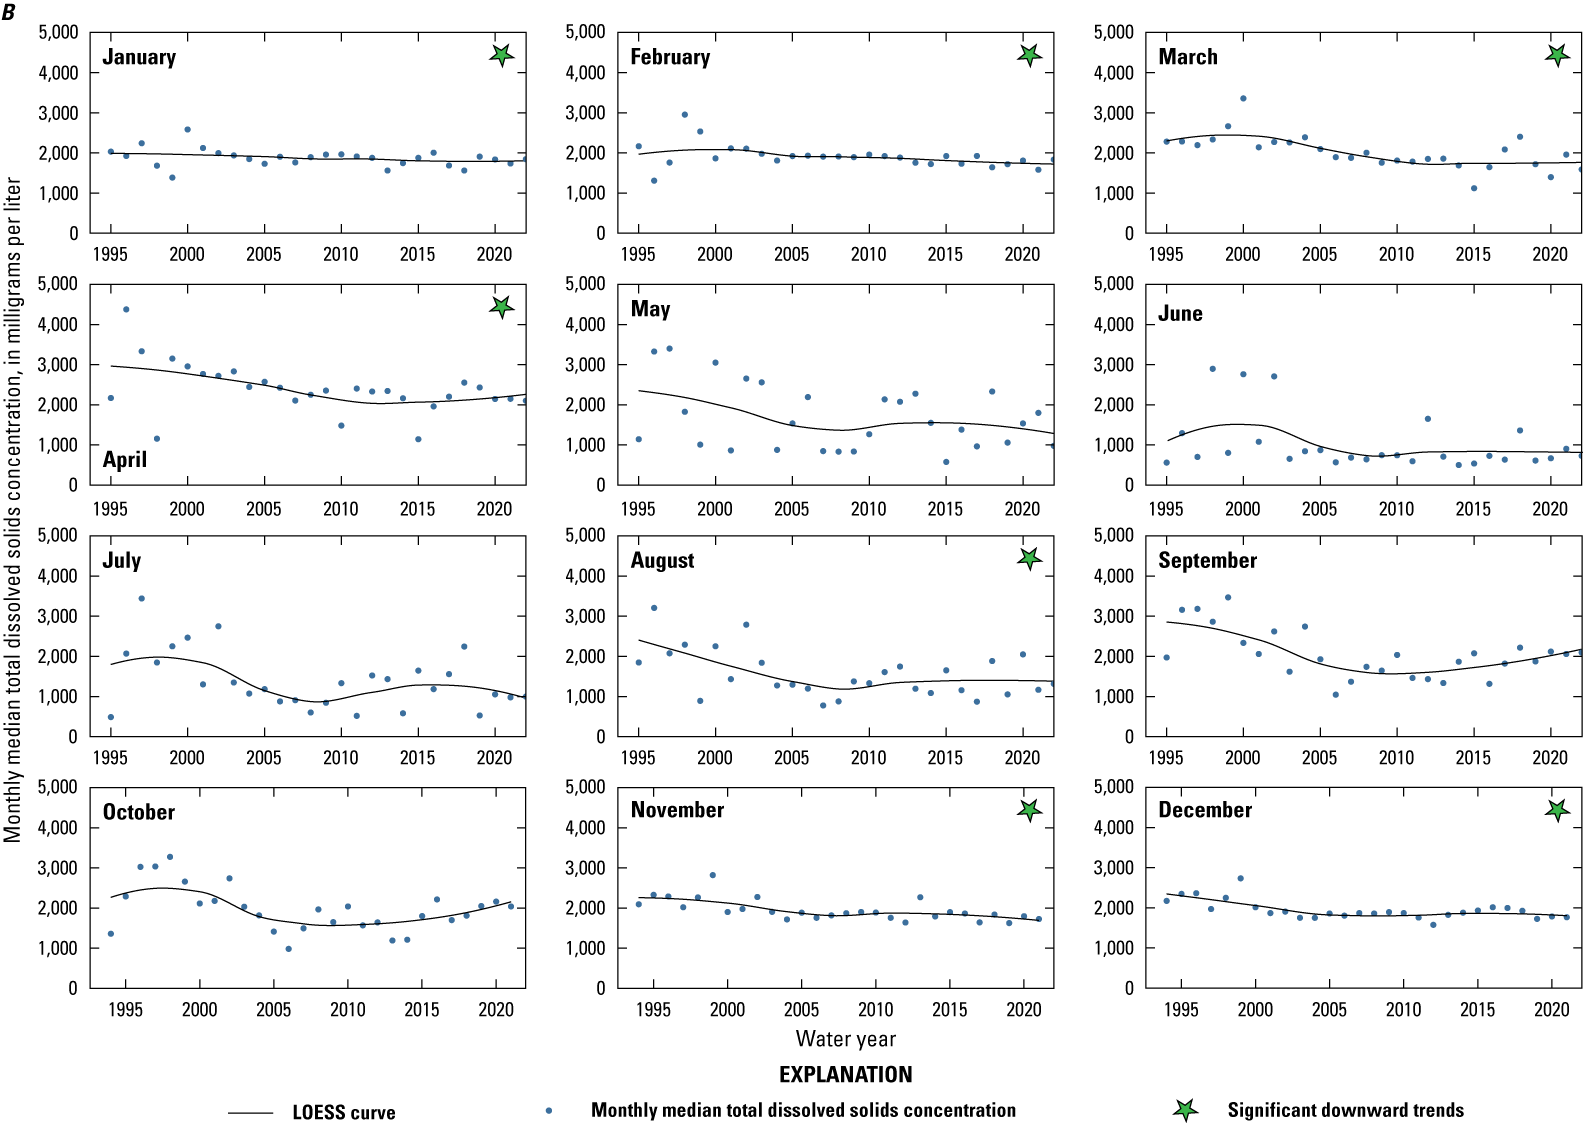
Graphs showing temporal variation in monthly median total dissolved solids concentrations at A, U.S. Geological Survey (USGS) 07086000 Arkansas River at Granite and B, USGS 07124000 Arkansas River at Las Animas sites, water years 1995–2022. Significant trends (p-value less than 0.05) in monthly median total dissolved solids concentrations are indicated by stars. LOESS, locally estimated scatterplot smoothing.
Summary
From 2022 through 2024, the U.S. Geological Survey (USGS) in cooperation with the Regional Resources Planning Group (Southeastern Colorado Water Conservancy District, Colorado Springs Utilities, Pueblo Water, Lower Arkansas Valley Water Conservancy District, Aurora Water, and Upper Arkansas Water Conservancy District) conducted a study that established a basinwide water-quality monitoring network in the Arkansas River Basin in Colorado. This network leveraged ongoing continuous measurements of streamflow and specific conductance (SC) at 13 sites, 11 sites along the main stem Arkansas River from the USGS 07108600 Arkansas River at Granite, Colo., (Ark Granite) site to the USGS 07137500 Arkansas River near Coolidge, Kansas, (Ark Coolidge) site and 2 sites on Fountain Creek. Baseline water-quality conditions were established as part of this study based on daily mean data from water years (WY; October through September of the following year) 1990−2022 to help identify changes in water quality that could result from changes in land and water use and water management.
Total dissolved solids (TDS) concentrations were used as an indicator of general water quality in the Basin, because TDS concentrations are affected by changes in streamflow, water operations, and source contributions and can be estimated using SC. Total dissolved solids concentrations and the variability in TDS concentrations generally increase in the Arkansas River as it flows from the high mountain headwaters through the eastern plains of Colorado. Median TDS concentrations in Arkansas River samples (October 1989 through December 2023) ranged from 75 milligrams per liter (mg/L) at Ark Granite near the headwaters to 3,660 mg/L at Ark Coolidge near the Colorado–Kansas State line.
Bicarbonate (HCO3), calcium (Ca), magnesium (Mg), sodium (Na), and sulfate (SO4) made up most of the TDS in samples collected during 2023 at 9 main stem sites from USGS 07097000 Arkansas River at Portland (Ark Portland) to Ark Coolidge. Bicarbonate and Ca were the dominant ions in samples at Ark Granite and USGS 07096000 Arkansas River at Cañon City (Ark Cañon City) in the upper Basin, where igneous and metamorphic (crystalline) rocks are present. At Ark Portland, the dominant ions in the river were HCO3, Ca, and SO4; downstream from Ark Portland, the dominant ions transitioned to Ca and SO4. The change in water composition between the Ark Cañon City and Ark Portland sites could be because of Niobrara-affected inflows entering the river between the two sites, as the surrounding geology transitions from less soluble igneous and metamorphic formations to more soluble sedimentary formations. Calcium and SO4 remained the dominant ions in the river to the USGS 07130500 Arkansas River below John Martin Reservoir (Ark JMR) site. Between Ark JMR and Ark Coolidge, the dominant ions in the river transitioned to Na and SO4.
Concentrations of Ca, Mg, Na, and SO4 generally increase in the Arkansas River as it flows from the headwaters to the Colorado–Kansas State line, but Ca, Mg, Na, and SO4 loads vary based on the amount of streamflow in the river at each site. In the Arkansas River between Ark Portland and Ark Coolidge, median Na and SO4 concentrations increased by more than 2,800 percent, and median Ca concentrations increased by 702 percent, respectively. Median instantaneous Na loads increased by 244 percent and median instantaneous SO4 loads increased by 251 percent between Ark Portland and Ark Coolidge. However, median instantaneous Ca loads decreased by 6 percent between Ark Portland and Ark Coolidge because streamflow was higher at Ark Portland than at Ark Coolidge even though Ca concentrations were lower at Ark Portland than Ark Coolidge.
Statistically significant (p-value less than 0.001) linear relations were present between SC and Ca, Mg, Na, SO4, and TDS at all sites (October 1989 through December 2023). For relations developed between SC and TDS at study sites r-squared (r2) values varied from 0.894 at Ark Granite to 0.992 at USGS 07120500 Arkansas River near Rocky Ford, Colo. (Ark Rocky Ford). Absolute percent differences between TDS concentrations computed using the relations developed during this study and previously published relations varied by less than 1.0 percent at most sites, indicating that the relations between SC and TDS have remained consistent through time at the sites.
Streamflow in the Arkansas River shows considerable seasonal variability likely due to the timing and magnitude of snowmelt and rainfall runoff; reservoir operations; and municipal, agricultural, and industrial diversions and releases. Water is stored primarily in Pueblo Reservoir starting on November 15 and ending March 14 of the following year as part of the Winter Water Storage Program. Abrupt changes in median streamflow and SC values were measured in the Arkansas River downstream from Pueblo Reservoir at the USGS 07124000 Arkansas River at Las Animas, Colo., (Ark Las Animas) site around the beginning and ending of the Winter Water Storage Program because water is stored in the winter and released and diverted by canals upstream from the site during the spring and summer. Snowmelt runoff from the mountainous areas of the Basin, generally in May and June, produces the highest streamflow and lowest SC values of the year at most sites. During low flow periods, especially during the winter months, SC and TDS values are higher than when the dominant source of flow to the river originates from snowmelt or storm runoff. Inflows to the river during low flow periods likely originate from groundwater sources, return flows, or other releases that have had more interaction with the land surface, resulting in higher SC and TDS.
Temporal changes in TDS concentrations and loads were used to identify changing water-quality conditions. The mixing of nonnative water (that is, water imported from outside of the Basin) and native water may affect water quality in the Arkansas River and Fountain Creek. However, the quality of nonnative water was not evaluated as part of this study. Seasonal Kendall tests (WYs 1995−2022) showed no significant trends in streamflow at the two most upstream sites on the Arkansas River, Ark Granite and Ark Cañon City. However, significant downward trends in streamflow occurred in the Arkansas River from Ark Portland to Ark Coolidge. Significant upward trends in TDS concentrations and loads were detected at Ark Granite. No significant trends in TDS concentrations were detected at Ark Cañon City or Ark Moffat, but significant downward trends in TDS loads were detected at the sites. Significant downward trends in TDS concentrations and loads were detected at the Fountain Creek sites, Ark Portland, Ark abv Pueblo, and at all Arkansas River sites from Ark Avondale to Ark Coolidge.
The Mann-Kendall test (WYs 1995–2022) showed significant upward trends in SC at Ark Granite from June through September. No significant trends in streamflow were detected at the three sites upstream (Ark Granite, Ark Cañon City, and Ark Portland) from Pueblo Reservoir using the Mann-Kendall test. Significant downward trends in streamflow were detected for one or more months at all sites downstream from Pueblo Reservoir, and significant downward trends in SC were detected for one or more months at all sites downstream from Pueblo Reservoir except at Ark Rocky Ford. These downward trends in SC values occurred more frequently during the winter water storage months, particularly during December. Trend tests on SC values were run using a shorter analysis period (WYs 2013−22) at Ark Rocky Ford than the other sites (WYs 1995−2022).
Upward trends in TDS concentrations and loads and SC values at Ark Granite could have resulted from remedial actions that took place to minimize erosion of fluvial mine waste deposits along the Arkansas River upstream from the site during the analysis period. Downward trends in streamflow and TDS loads were expected at sites downstream from Pueblo Reservoir because streamflow was higher than mean at the beginning of the trend analysis period and lower than mean at the ending of the trend analysis period. However, downward trends in TDS concentrations and SC values were not expected because higher TDS concentrations and SC values generally occur during lower streamflow in the study area. Downward trends in streamflow and SC (surrogate for TDS) during winter base flow months may indicate changes in groundwater quantity, and possibly groundwater quality, potentially affecting the river water-quality condition. Along the Arkansas River between Pueblo Reservoir and Las Animas, land in farms declined by 7 percent, 23 percent, and 40 percent in Pueblo, Otero, and Crowley counties, respectively, from 2017 to 2022. Seasonal Kendall tests showed mean annual decreases in TDS concentrations of 1.33 mg/L per year (mg/L/yr) at Ark Avondale, 1.65 mg/L/yr at Ark Catlin Dam, and 19.4 mg/L/yr at Las Animas. Declines in irrigated farmlands, changes in farming practices, and transfer of water to municipalities may have reduced the amount of water being applied to the land surface through time, which could reduce groundwater return flows and the effects of water recycling on water quality. In addition, mixing of imported Fryingpan-Arkansas Project water and native streamflow could possibly dilute TDS concentrations and lower SC values in the Arkansas River and Fountain Creek.
References Cited
Bern, C.R., Holmberg, M.J., and Kisfalusi, Z.D., 2020, Salt flushing, salt storage, and controls on selenium and uranium—A 31-year mass-balance analysis of an irrigated, semiarid valley: Journal of the American Water Resources Association, v. 56, no. 4, p. 647–668, accessed February 11, 2024, at https://doi.org/10.1111/1752-1688.12841.
Bern, C.R., Ruckhaus, M.H., and Hennessy, E., 2024, Potential climate and human water-use effects on water-quality trends in a semiarid, western U.S. watershed: Fountain Creek, Colorado, USA: Water 2024, v, 16, no. 1343, accessed March 4, 2025, at https://doi.org/10.3390/w16101343.
Bern, C.R. and Stogner, R.W., Sr., 2017, The Niobrara Formation as a challenge to water quality in the Arkansas River, Colorado, USA: Journal of Hydrology—Regional Studies, v. 12, p. 181–195, accessed February 6, 2024, at https://doi.org/10.1016/j.ejrh.2017.05.001.
Bexfield, L.M., DeSimone, L.A., Beaty, D., Murtagh, L.K., Rose, D.L., and Struzeski, T.M., 2023, Field, laboratory, and third-party quality-control data associated with sites and analytes monitored by the USGS National Water Quality Network, October 2017 through September 2022: U.S. Geological Survey data release, accessed November 4, 2024, at https://doi.org/10.5066/P9NBXVSE.
Bureau of Reclamation, 2022, Pueblo reservoir: Bureau of Reclamation website, accessed November 20, 2024, at https://www.usbr.gov/gp/ecao/pueblo/pueblo.html.
Burns, A.W., 1985, Selected hydrographs and statistical analyses characterizing the water resources of the Arkansas River Basin, Colorado: U.S. Geological Survey Water-Resources Investigations Report 85–4264, 199 p. [Also available at https://doi.org/10.3133/wri854264.]
Cain, D., 1987, Relations of specific conductance to streamflow and selected water-quality characteristics of the Arkansas River Basin, Colorado: U.S. Geological Survey Water-Resources Investigations Report 87–4041, 93 p., accessed January 24, 2022, at https://doi.org/10.3133/wri874041.
Christner, J., 2013, California Gulch Operable Unit 11, Lake County, Colorado: U.S. Environmental Protection Agency, prepared by URS Operating Services, Inc., under contract no. EP-W-05-050, [TDD no. 0509-13], 1,284 p. [Also available at https://semspub.epa.gov/work/08/1267353.pdf.]
Clean Water Team, 2004, Electrical conductivity/salinity fact sheet, in Guidance compendium for watershed monitoring and assessment, version 2.0: Sacramento, Calif., California State Water Resources Control Board Division of Water Quality Fact Sheet 3.1.3.0, 5 p. [Also available at https://www.waterboards.ca.gov/water_issues/programs/swamp/docs/cwt/guidance/3130en.pdf.]
Cohn, T.A., Caulder, D.L., Gilroy, E.J., Zynjuk, L.D., and Summers, R.M., 1992, The validity of a simple statistical model for estimating fluvial constituent loads—An empirical study involving nutrient loads entering Chesapeake Bay: Water Resources Research, v. 28, no. 9, p. 2353–2363, accessed May 6, 2024, at https://doi.org/10.1029/92WR01008.
Colarullo, S.J., and Miller, L.D., 2019, Upgrades to a Fortran program for estimating stream transit losses of reusable water, El Paso and Pueblo Counties, Colorado: U.S. Geological Survey Scientific Investigations Report 2018–5163, 21 p., https://doi.org/10.3133/sir20185163.
Colorado Division of Water Resources [DWR], 2024, Colorado’s decision support systems: Colorado Division of Water Resources database, accessed June 26, 2024, at https://dwr.state.co.us/Tools/Stations?Stations=All&submitButton=Submit.
Colorado Division of Water Resources [DWR], 2025, Division 2 Office—Arkansas irrigation improvement rules [rule 8 and 10 plans]: Colorado Division of Water Resources website, accessed March 11, 2025, at https://dwr.colorado.gov/division-offices/division-2-office#rule-8-and-10-plans.
Colorado Springs Utilities, 2026, Water System: Colorado Springs Utilities website, accessed March 4, 2026, at https://www.csu.org/water-service/water-system.
Colorado Water Conservation Board [CWCB], 2022, Arkansas Basin implementation plan: State of Colorado, v. 2, p. 109, accessed April 30, 2025, at https://dnrweblink.state.co.us/cwcbsearch/0/edoc/216706/Arkansas_BIP_Volume2_2022.pdf.
Fishman, M.J., 1993, Methods of analysis by the U.S. Geological Survey National Water Quality Laboratory-Determination of inorganic and organic constituents in water and fluvial sediments: U.S. Geological Survey Open File Report 93–125, 217 p. [Also available at https://doi.org/10.3133/ofr93125.]
Fishman, M.J., and Friedman, L.C., 1989, Methods for determination of inorganic substances in water and fluvial sediments: U.S. Geological Survey Techniques of Water-Resources Investigations, book 5, chap. A1, 545 p. [Also available at https://doi.org/10.3133/twri05A1.]
Green, G.N., 1992, The digital geologic map of Colorado in ARC/INFO format: U.S. Geological Survey Open-File Report 92–507. [Also available at https://pubs.usgs.gov/publication/ofr92507DO.]
Helsel, D.R., Hirsch, R.M., Ryberg, K.R., Archfield, S.A., and Gilroy, E.J., 2020, Statistical methods in water resources: U.S. Geological Survey Techniques and Methods, book 4, chap. A3, 458 p., accessed October 14, 2021, at https://doi.org/10.3133/tm4A3. [Supersedes USGS Techniques of Water-Resources Investigations, book 4, chap. A3, version 1.1.]
Hem, J.D., 1985, Study and interpretation of the chemical characteristics of natural water: U.S. Geological Survey Water-Supply Paper 2254, 263 p. [Also available at https://doi.org/10.3133/wsp2254.]
Hennessy, E.K., Miller, L.D., Bern, C., and Qi, S.L., 2024, Daily subreach output from the transit-loss accounting program for Monument and Fountain Creeks, Colorado, 1988–22: U.S. Geological Survey data release, accessed March 4, 2026, at https://doi.org/10.5066/P90J3L5S.
Hirsch, R.M., Moyer, D.L., and Archfield, S.A., 2010, Weighted regressions on time, discharge, and season (WRTDS), with an application to Chesapeake Bay River inputs: JAWRA Journal of the American Water Resources Association, v. 46, no. 5, p. 857–880, accessed March 29, 2022, at https://doi.org/10.1111/j.1752-1688.2010.00482.x.
Hirsch, R.M., and Slack, J.R., 1984, A nonparametric trend test for seasonal data with serial dependence: Water Resources Research, v. 20, no. 6, p. 727–732, accessed March 28, 2022, at https://doi.org/10.1029/WR020i006p00727.
Hirsch, R.M., Slack, J.R., and Smith, R.A., 1982, Techniques of trend analysis for monthly water quality data: Water Resources Research, v. 18, no. 1, p. 107–121, accessed October 2019 at https://doi.org/10.1029/WR018i001p00107.
Ivahnenko, T., Ortiz, R.F., and Stogner, R.W., Sr., 2013, Characterization of streamflow, water quality, and instantaneous dissolved solids, selenium, and uranium loads in selected reaches of the Arkansas River, southeastern Colorado, 2009–2010: U.S. Geological Survey Scientific Investigations Report 2012–5234, 60 p., accessed February 7, 2024, at https://doi.org/10.3133/sir20125234.
Lewis, M.E., 1999, Simulated effects of water exchanges on streamflow and specific conductance in the Arkansas River upstream from Avondale, Colorado: U.S. Geological Survey Water-Resources Investigations Report 98–4140, 34 p., accessed August 19, 2024, at https://doi.org/10.3133/wri984140.
Lewis, M.E. and Brendle, D.L., 1998, Relations of streamflow and specific-conductance trends to reservoir operations in the lower Arkansas River, southeastern Colorado: U.S. Geological Survey Water-Resources Investigations Report 97–4239, 48 p., accessed January 24, 2022, at https://doi.org/10.3133/wri974239.
Liebermann, T.D., Middelburg, R.F., and Irvine, S.A., 1987, User’s manual for the estimation of dissolved-solids concentrations and loads in surface water: U.S. Geological Survey Water-Resources Investigations Report 86–4124, 51 p. [Also available at https://doi.org/10.3133/wri864124.
Mann, H.B., 1945, Nonparametric tests against trend: Econometrica, v. 13, no. 3, p. 245–259, accessed February 25, 2023, at https://doi.org/10.2307/1907187.
Millard, S.P., 2013, EnvStats—An R package for environmental statistics: New York, Springer, 291 p., accessed September 2024 at https://link.springer.com/book/10.1007/978-1-4614-8456-1.
Miller, L.D. and Eng, L.E., 2025, Surrogate models for total dissolved solids and major ion concentrations at real-time water-quality sites, Arkansas River Basin, Colorado, October 1989–December 2023: U.S. Geological Survey data release, https://doi.org/10.5066/P1DRV9FR.
Miller, L.D., Watts, K.R., Ortiz, R.F., and Ivahnenko, T., 2010, Occurrence and distribution of dissolved solids, selenium, and uranium in groundwater and surface water in the Arkansas River Basin from the headwaters to Coolidge, Kansas, 1970–2009: U.S. Geological Survey Scientific Investigations Report 2010–5069, 59 p., accessed January 24, 2022, at https://doi.org/10.3133/sir20105069.
Mueller, D.K., Schertz, T.L., Martin, J.D., and Sandstrom, M.W., 2015, Design, analysis, and interpretation of field quality-control data for water-sampling projects: U.S. Geological Survey Techniques and Methods, book 4, chap. C4, 54 p., accessed April 29, 2024, at https://doi.org/10.3133/tm4C4.
Ortiz, R.F., 2004, Methods to identify changes in background water-quality conditions using dissolved-solids concentrations and loads as indicators, Arkansas River and Fountain Creek, in the vicinity of Pueblo, Colorado: U.S. Geological Survey Scientific Investigations Report 2004–5024, 20 p., accessed May 27, 2021, at https://doi.org/10.3133/sir20045024.
Ortiz, R.F., 2013, Estimates of gains and losses from unmeasured sources and sinks for streamflow and dissolved-solids load in selected reaches of the Arkansas River, southeastern Colorado, 2009–2010: U.S. Geological Survey Scientific Investigations Report 2012–5252, 53 p., accessed November 4, 2024, at https://doi.org/10.3133/sir20125252.
Ortiz, R.F., Lewis, M.E., and Radell, M.J., 1998, Water-quality assessment of the Arkansas River Basin, southeastern Colorado, 1990–93: U.S. Geological Survey Water-Investigations Report 97–4111, 69 p. [Also available at https://doi.org/10.3133/wri974111.]
R Core Team, 2024, R—A language and environment for statistical computing, version 4.4.0 (Puppy Cup): Vienna, Austria, R Foundation for Statistical Computing, accessed September 9, 2024, at https://www.R-project.org/.
Ritchey, E.L., Murdock, L.W., Ditsch, D., McGrath, J.M., and Sikora, F.J., 2025, Agricultural lime recommendations based on lime quality: University of Kentucky, Cooperative Extension Service ID–163, 6 p., accessed May 27, 2025, at https://publications.ca.uky.edu/sites/publications.ca.uky.edu/files/ID163.pdf.
Sen, P.K., 1968, Estimates of the regression coefficient based on Kendall's Tau: Journal of the American Statistical Association, v. 63, no. 324, p. 1379–1389, accessed September 2024 at https://doi.org/10.1080/01621459.1968.10480934.
Southeastern Colorado Water Conservancy District, 2025, Winter water storage: Southeastern Colorado Water Conservancy District website, accessed November 7, 2024, at https://www.secwcd.org/content/winter-water-storage.
Struzeski, T.M., DeGiacomo, W.J., and Zayhowski, E.J., 1996, Methods of analysis by the U.S. Geological Survey National Water Quality Laboratory-Determination of dissolved aluminum and boron in water by inductively coupled plasma-atomic emission spectrometry: U.S. Geological Survey Open File Report 96–149, 17 p. [Also available at https://doi.org/10.3133/ofr96149.]
Theil, H., 1992, A rank-invariant method of linear and polynomial regression analysis, in Raj, B., Koerts, J., eds, Henri Theil’s contributions to economics and econometrics, v. 23 of Advanced studies in theoretical and applied econometrics: Dordrecht, Springer, p. 345–381, accessed October 2019 at https://doi.org/10.1007/978-94-011-2546-8_20.
U.S. Census Bureau, 2025, QuickFacts: U.S. Census Bureau website, accessed January 23, 2025, at https://www.census.gov/quickfacts/.
U.S. Department of Agriculture, 2025, Census of agriculture: U.S. Department of Agriculture National Agricultural Statistics Service website, accessed March 11, 2025, at https://www.nass.usda.gov/AgCensus/.
U.S. Environmental Protection Agency, 2024, Secondary drinking water standards—Guidance for nuisance chemicals: U.S. Environmental Protection Agency website, accessed October 31, 2024, at https://www.epa.gov/sdwa/secondary-drinking-water-standards-guidance-nuisance-chemicals.
U.S. Geological Survey, 2019, Chloride, salinity, and dissolved solids: U.S. Geological Survey website, accessed October 2, 2024, at https://www.usgs.gov/mission-areas/water-resources/science/chloride-salinity-and-dissolved-solids.
U.S. Geological Survey, 2024, USGS water data for the Nation: U.S. Geological Survey National Water Information System database, accessed July 10, 2024, at https://doi.org/10.5066/F7P55KJN.
U.S. Geological Survey, [variously dated], National field manual for the collection of water-quality data, section A of Handbooks for water-resources investigations: U.S. Geological Survey Techniques of Water-Resources Investigations, book 9, 10 chap. (A1–A8, A10), accessed July 28, 2021, at https://doi.org/10.3133/twri09.
Wagner, R.J., Boulger, R.W., Jr., Oblinger, C.J., and Smith, B.A., 2006, Guidelines and standard procedures for continuous water-quality monitors—Station operation, record computation, and data reporting: U.S. Geological Survey Techniques and Methods 1–D3, 51 p. +8 attachments, accessed April 29, 2024, at https://pubs.usgs.gov/tm/2006/tm1D3/.
Zielinski, R.A., Asher-Bolinder, A., and Meier, A.L., 1995, Uraniferous waters of the Arkansas River valley, Colorado, U.S.A.—A function of geology and land use: Applied Geochemistry, v. 10, no. 2, p. 133–144, accessed February 25, 2025, at https://doi.org/10.1016/0883-2927(95)00002-2.
Appendix 1. Trends in Monthly Mean Streamflow and Specific Conductance Values at Selected Sites on the Arkansas River and Fountain Creek
Distribution of significant trends in monthly mean streamflow using the Mann-Kendall test at selected sites on the Arkansas River and Fountain Creek, water years 1995–2022.
[Table is available as a comma separated values (csv) format file available for download at https://doi.org/10.3133/sir20265013. Measurements of continuous water-quality parameters did not start at Ark Coolidge until November 1999 and at Ark Rocky Ford until March 2012. Lower confidence interval (LCL) and upper confidence level (UCL) are at confidence level 95 percent and in cubic feet per second per year (ft3/s/yr). Streamflow data available at U.S. Geological Survey (USGS, 2024) or Colorado Division of Water Resources (2024). Refer to Mann (1945) and Kendall (1975) for information about the Mann-Kendall statistical test. pval, p-value; Ark., Arkansas River; abv, above; <, less than; Fnt, Fountain; nr, near; blw, below; JMR, John Martin Reservoir]
Distribution of significant trends in monthly median specific conductance values using the Mann-Kendall test at selected sites on the Arkansas River and Fountain Creek, water years 1995–2022.
[Table is available as a comma separated values (csv) format file available for download at https://doi.org/10.3133/sir20265013. Measurements of continuous water-quality parameters did not start at Ark Coolidge until November 1999 and at Ark Rocky Ford until March 2012. Lower confidence interval (LCL) and upper confidence level (UCL) are at confidence level 95 percent and in cubic feet per second per year (ft3/s/yr). Streamflow data available at U.S. Geological Survey (USGS, 2024) or Colorado Division of Water Resources (2024). Refer to Mann (1945) and Kendall (1975) for information about the Mann-Kendall statistical test. pval, p-value; Ark., Arkansas River; abv, above; <, less than; Fnt, Fountain; nr, near; blw, below; JMR, John Martin Reservoir]
References Cited
Colorado Division of Water Resources, 2024, Colorado’s decision support systems: Colorado Division of Water Resources website, accessed June 26, 2024, at https://dwr.state.co.us/Tools/Stations?Stations=All&submitButton=Submit.
Mann, H.B., 1945, Nonparametric tests against trend: Econometrica, v. 13, no. 3, p. 245–259, accessed February 25, 2023, at https://doi.org/10.2307/1907187.
U.S. Geological Survey, 2024, USGS water data for the Nation: U.S. Geological Survey National Water Information System database, accessed July 10, 2024, at https://doi.org/10.5066/F7P55KJN.
Conversion Factors
U.S. customary units to International System of Units
Temperature in degrees Celsius (°C) may be converted to degrees Fahrenheit (°F) as follows:
°F = (1.8 × °C) + 32.
Supplemental Information
Specific conductance is in microsiemens per centimeter at 25 degrees Celsius (µS/cm at 25 °C).
Concentrations of chemical constituents in water are in either milligrams per liter (mg/L) or micrograms per liter (µg/L).
A water year is the 12-month period from October 1 through September 30 of the following year and is designated by the calendar year in which it ends.
Abbreviations
>
greater than
<
less than
ANC
acid neutralizing capacity
Br
bromide
Ca
calcium
CaCO3
calcium carbonate
Cl
chloride
CO3
carbonate
CWCB
Colorado Water Conservation Board
DWR
Division of Water Resources
Fe
iron
Fl
fluoride
HCO3
bicarbonate
K
potassium
LOESS
locally estimated scatterplot smoothing
Mg
magnesium
Mn
manganese
Na
sodium
NO3
nitrate
NWIS
National Water Information System
NWQL
National Water Quality Laboratory
QAQC
quality assurance and quality control
r2
coefficient of determination, r-squared
RPD
relative percent difference
RL
laboratory reporting limit
SC
specific conductance
Si
silica
SO4
sulfate
TDS
total dissolved solids
USGS
U.S. Geological Survey
WWSP
Winter Water Storage Program
WY
water year
Publishing support provided by the USGS Science Publishing Network,
Denver and Rolla Publishing Service Centers
For more information concerning the research in this report, contact the
Director, USGS Colorado Water Science Center
Box 25046, Mail Stop 415
Denver, CO 80225
(303) 236-4882
Or visit the Colorado Water Science Center website at
Disclaimers
Any use of trade, firm, or product names is for descriptive purposes only and does not imply endorsement by the U.S. Government.
Although this information product, for the most part, is in the public domain, it also may contain copyrighted materials as noted in the text. Permission to reproduce copyrighted items must be secured from the copyright owner.
Suggested Citation
Miller, L.D., Eng, L.E., and Sharp, J.B., 2026, Determination of baseline water-quality conditions using continuous specific conductance and discrete measurements of total dissolved solids and selected major ions, Arkansas River Basin, Colorado: U.S. Geological Survey Scientific Investigations Report 2026–5013, 33 p., https://doi.org/10.3133/sir20265013.
ISSN: 2328-0328 (online)
| Publication type | Report |
|---|---|
| Publication Subtype | USGS Numbered Series |
| Title | Determination of baseline water-quality conditions using continuous specific conductance and discrete measurements of total dissolved solids and selected major ions, Arkansas River Basin, Colorado |
| Series title | Scientific Investigations Report |
| Series number | 2026-5013 |
| DOI | 10.3133/sir20265013 |
| Publication Date | July 01, 2026 |
| Year Published | 2026 |
| Language | English |
| Publisher | U.S. Geological Survey |
| Publisher location | Reston VA |
| Contributing office(s) | Colorado Water Science Center |
| Online Only (Y/N) | Y |