

Precipitation-Based Flood-Inundation Maps for the East Fork Little Blue River and Tributaries at Lee’s Summit, Missouri, 2024
Links
- Document: Report (9.31 MB pdf) , HTML , XML
- Data Release: USGS data release - Geospatial data and model archives associated with precipitation-driven flood-inundation mapping of the East Fork Little Blue River and associated tributaries at Lee’s Summit, Missouri
- NGMDB Index Page: National Geologic Map Database Index Page (html)
- Download citation as: RIS | Dublin Core
Acknowledgments
The author acknowledges funding provided by the City of Lee’s Summit, Missouri, for this study and thanks Kara Starlin, Environmental Specialist, and Karen Quackenbush, Senior Staff Engineer, with the City of Lee’s Summit for their feedback throughout the project.
Abstract
The U.S. Geological Survey, in cooperation with the City of Lee’s Summit, Missouri, assessed flooding of the East Fork Little Blue River and tributaries for varying precipitation magnitudes and durations, varying antecedent runoff conditions, and projected climate-change conditions. The precipitation scenarios were used to develop a library of flood-inundation maps for a 2.95-mile reach of the East Fork Little Blue River and tributaries within the city.
A two-dimensional U.S. Army Corps of Engineers Hydrologic Engineering Center–River Analysis System (HEC–RAS; ver. 6.5) rain-on-grid model was calibrated to selected runoff events representing a range of antecedent runoff conditions and hydrologic responses. Lowest adjacent grades for structures within the nearby study area were incorporated into the terrain, and depth grids and water-surface elevation grids were developed for the study area. Simulated velocities at selected bridge locations were also developed from the model. The model was calibrated using water-surface elevation data collected from water-level loggers (pressure transducers) and streamflow measurements and water-surface elevation measurements made at a reference point during runoff events. The calibrated HEC–RAS model was used to simulate streamflows from design rainfall events of 15-minute to 24-hour durations and ranging from a 100- to 0.1-percent annual exceedance probability (1-year to 1,000-year recurrence intervals). Flood-inundation maps were produced for depths at a reference location of 3 to 16 feet, or a depth exceeding the 0.1-percent annual exceedance probability interval precipitation. The results of each precipitation duration-frequency value were represented by a 1-foot-increment inundation map based on the generated peak streamflow from that rainfall event and the corresponding water-surface elevation at the East Fork Little Blue River reference location.
Within the HEC–RAS model, 240 scenarios were developed from the design rainfall events with each of 3 antecedent conditions. Additional scenarios were created to simulate the effects of projected precipitation scenarios on the 100-year recurrence interval, 24-hour storm and the 100-year recurrence interval, 6-hour storm. All simulation results were assigned to a flood-inundation map condition based on the generated peak flow and corresponding water-surface elevation at the East Fork Little Blue River reference location.
The flood-inundation maps are shown on a web mapping application made available to the public through the City of Lee’s Summit (hyperlink will be added when available). The flood-inundation maps are tied to real-time precipitation data obtained from the Automated Surface Observing System weather station at the Lee’s Summit Municipal Airport, accessible at https://mesonet.agron.iastate.edu/request/download.phtml?network=MO_ASOS. The availability of these maps, along with information regarding observed rainfall, could help provide emergency management personnel and residents with information that is critical for flood-response activities, such as evacuations and road closures, and for postflood recovery efforts.
Plain Language Summary
The U.S. Geological Survey, in cooperation with the City of Lee’s Summit, Missouri, assessed flooding of the East Fork Little Blue River and tributaries for varying precipitation magnitudes and durations, varying antecedent runoff conditions, and projected climate-change conditions. The precipitation scenarios were used to develop a library of flood-inundation maps that included a 2.95-mile reach of the East Fork Little Blue River and tributaries within the city. The availability of these maps, along with information regarding observed rainfall, could help provide emergency management personnel and residents with information that is critical for flood-response activities, such as evacuations and road closures, and for postflood recovery efforts.
Introduction
The City of Lee’s Summit, in Jackson County in west-central Missouri (fig. 1), had an estimated population of 101,108 in 2020 (U.S. Census Bureau, 2021). The city has experienced moderate historical flooding from the East Fork Little Blue River and tributaries (City of Lee’s Summit, written commun., 2023) along an area with a high population density within the city. Floodplains along the main stem of the East Fork Little Blue River and its tributaries are generally highly developed and contain mostly residential structures and a few commercial structures. Before this study, emergency responders in Lee’s Summit, Missouri, relied on a few key information sources (all of which are available on the internet) to make decisions on how to best alert the public and mitigate flood damages. For example, the National Weather Service (NWS) issues watches, warnings, and advisories at https://www.weather.gov/ (National Weather Service, 2025c). Precipitation information, in addition to the rainfall data provided by the Automated Surface Observing System (ASOS) at the Lee’s Summit Municipal Airport, is available through Weather Underground’s WunderMap (Weather Underground, 2025). Weather Underground’s WunderMap also provides information from rain gages owned and operated by individual residents. Another source of information is the Federal Emergency Management Agency flood-insurance study (FIS) for Jackson County, Mo., and incorporated areas and Kansas City, which is available online and was most recently revised in December 2023 (Federal Emergency Management Agency, 2023). The maps included in the FIS provide flooding extents for the 1-percent annual exceedance probability (AEP) flood (100-year recurrence interval flood), but they do not provide any kind of dynamic mapping corresponding to current conditions nor do they provide detail on flood extents other than those for the 1-percent AEP flood.
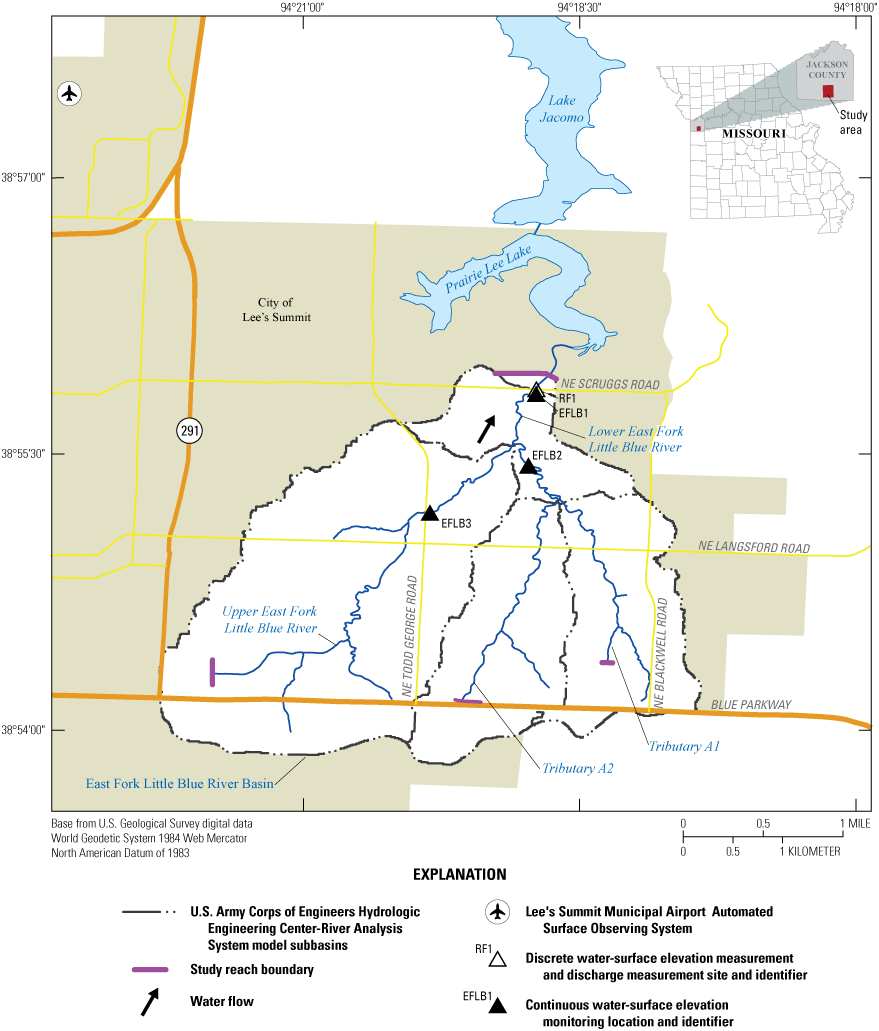
Map showing the East Fork Little Blue River and associated tributaries study basin within the City of Lee’s Summit in Jackson County, Missouri. Water-level monitoring locations are also shown.
In 2023, the U.S. Geological Survey (USGS), in cooperation with the City of Lee’s Summit, Mo., began a project to develop a library of flood-inundation maps for a selected reach of the East Fork Little Blue River (fig. 1) and to relate these maps to different rainfall frequencies and durations. This study uses real-time precipitation data from the ASOS weather system at Lee’s Summit Municipal Airport (also known as KLXT), which is near the East Fork Little Blue River study basin (fig. 1). Although having the water-surface elevation based on recent precipitation at a particular reference location is useful for residents near the location, this information is of limited use to residents farther upstream or downstream from the reference location because the resulting water-surface elevations are not constant across the drainage basin. Furthermore, knowledge of rainfall is difficult to translate into water levels or depths and areal extent of flooding.
The small drainage area (4.28 square miles) and highly developed nature of this selected reach of the East Fork Little Blue River Basin at Lee’s Summit mean that floods will peak in a short amount of time; for some storms, the time to peak may be less than 2 hours. Because the times to the flood peak are rather short, it is difficult to provide advance notice of potential flooding. One way to address this informational gap is to produce a library of flood-inundation maps that are based on varying precipitation amounts and durations and referenced to the stream water-surface elevation levels recorded at a selected reference location. By referring to the appropriate map based on the amount of rainfall in a recent time period, emergency responders can discern the expected severity of flooding (depth of water, areal extent, water-surface elevations, and expected water velocities at key locations), identify roads that are or will soon be flooded, and make plans for notification or evacuation of residents in harm’s way for the expected flooding at some distance upstream and downstream from a selected location. In addition, the capability to visualize the potential extent of flooding has been determined to motivate residents to heed flood warnings and take precautions that they previously might have disregarded.
Purpose and Scope
This report describes the development of a series of estimated flood-inundation maps for the East Fork Little Blue River and its tributaries at Lee’s Summit, Mo., and identifies where on the internet the maps and ancillary data (geographic information system [GIS] flood polygons, depth grids, water-surface elevation grids, and velocity markers at key locations) can be located and downloaded. The 2.95-mile-long study extent begins at Missouri State Highway 291, just north of the intersection with Blue Parkway, and flows northeast to NE Scruggs Road (fig. 1). The maps were produced for flood conditions using simulated flood peaks from a range of precipitation totals and durations and reference water-surface elevations at the East Fork Little Blue River near NE Scruggs Road. The maps were produced from a hydraulic model calibrated to water-surface elevation data collected from three pressure transducers throughout the reach and to streamflow measurements and water-surface elevation measurements made at a reference point at the outlet of the basin near NE Scruggs Road. The pressure transducers were installed in the following locations: (1) just downstream from NE Todd George Road (EFLB3), (2) near NE Concord Street (EFLB2), and (3) just upstream from NE Scruggs Road (EFLB1). All three pressure transducers were within the City of Lee’s Summit. The reference point was just downstream from NE Scruggs Road (RF1; fig. 1).
The hydraulic model was used to simulate flood-inundation scenarios resulting from rainfall events of 15-minute to 24-hour durations and magnitudes ranging from a 100- to 0.1-percent AEP (1-year to 1,000-year recurrence interval). The procedures applied in constructing the hydraulic model are described within this report.
The flood-inundation maps produced from the model cover a range from 884 to 897 feet (ft) above the North American Vertical Datum of 1988, which translates to about 3 to 16 ft in water depth at the reference point RF1 that is immediately downstream from NE Scruggs Road. Generally, USGS flood-inundation maps are developed beginning at the NWS “action stage” or the stage that, when reached by a rising stream, requires the NWS or partner to take some type of mitigation action in preparation for possible substantial hydrologic activity. Because no NWS flood stages were already defined for this stream, some discretion was available to modelers in choosing a bankfull location where, once the water-surface elevation exceeded bankfull, the river would be considered to be flooding and maps would be generated. For this project, the EFLB1 location was chosen as the bankfull location (fig. 1). Once the simulated water-surface elevation exceeded bankfull at the EFLB1 location, maps were developed to represent 1-ft water-surface elevation changes at the reference point (RF1; fig. 1) immediately downstream from NE Scruggs Road.
Study Area Description
The East Fork Little Blue River is in west-central Missouri, within the City of Lee’s Summit in Jackson County (fig. 1). The study basin is characterized by gently rolling topography with about 100 ft of relief as determined using the 2020 Jackson County digital elevation model (DEM; U.S. Geological Survey, 2021a). The river begins near Missouri State Highway 291 and flows northeast to Prairie Lee Lake. Tributary A1 joins the main stem of the East Fork Little Blue River upstream from the study basin outlet (fig. 1). Tributary A2 joins tributary A1 about one-half mile upstream from the confluence of tributary A1 with the East Fork Little Blue River main stem (fig. 1). The East Fork Little Blue River drains into Prairie Lee Lake about 0.5-mile downstream from the reference point at NE Scruggs Road (fig. 1). The drainage area for the study reach, terminating at NE Scruggs Road, is 4.28 square miles, as determined using the USGS StreamStats utility (U.S. Geological Survey, 2021b). The typical top-of-bank width in the study reach is 10 ft, and the channel slope is about 33 feet per mile.
About 94 percent of the land cover in the study reach drainage area is classified as “developed” and almost completely residential (Dewitz, 2023; fig. 2). The rest of the study area is classified as “deciduous forest” (1 percent), “pasture/hay” (3 percent), and “cultivated crops” (2 percent). The nondeveloped areas are near the outfall of the basin. Because the study reach is a developed area, roads and channel structures were considered to be of importance in the modeling process and the flood-inundation map generating process. According to the Missouri Department of Transportation’s Functional Classification System for Lee’s Summit (Missouri Department of Transportation, 2024), the study basin is traversed by one east-west minor arterial, one east-west freeway/expressway, one north-south principal arterial, and one north-south minor arterial (fig. 1). In the study hydraulic model, 21 channel structures (bridges and culverts) were included.
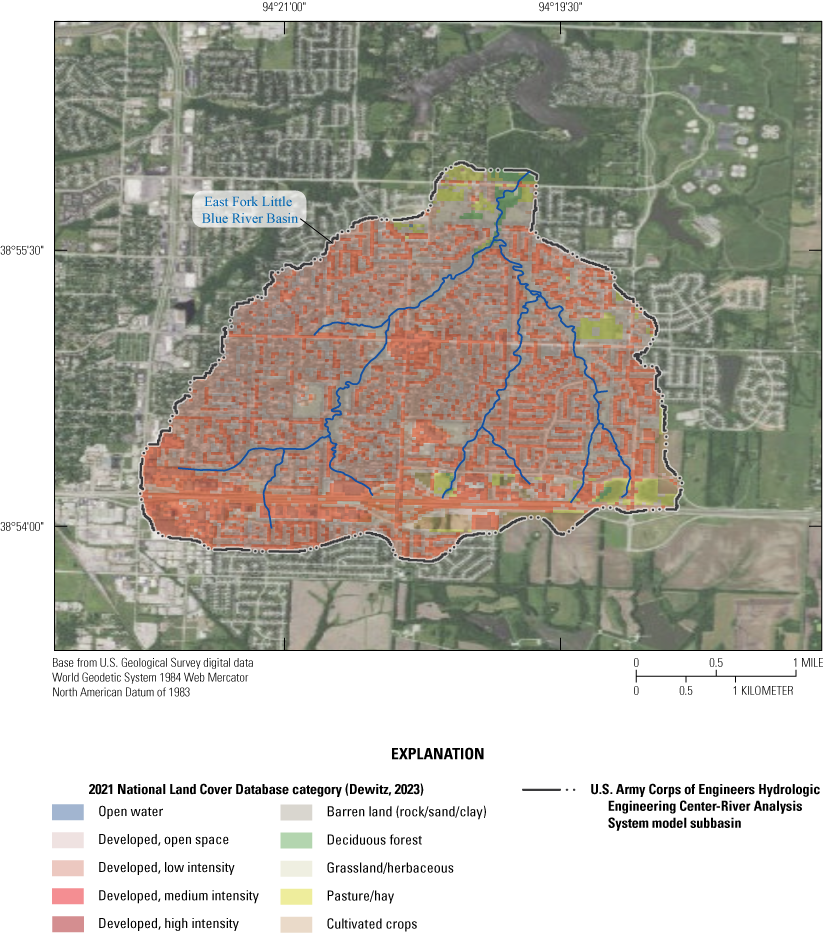
Map showing land cover for the East Fork Little Blue River and associated tributaries study basin based on the National Land Cover Database land-cover types (Dewitz, 2023).
Previous Studies
Probabilistic flood-inundation maps showing the extent of flood inundation for the 1-percent AEP flood previously were generated as part of the latest FIS for the East Fork Little Blue River and the City of Lee’s Summit (Federal Emergency Management Agency, 2023). The FIS also provides estimates of peak streamflows of 10-, 2-, 1-, and 0.2-percent AEPs and their associated water-surface elevations for the East Fork Little Blue River, tributary A1, and tributary A2. The Flood Insurance Rate Map for this area was last revised in 2017, and the streamflow values within the FIS were last revised in 1999 (Federal Emergency Management Agency, 2023). This study was begun with a furnished model that was developed as part of an ongoing FIS update (Alicia Williams, WSP, Inc., written commun., 2023).
Creation of Flood-Inundation-Map Library
The USGS has standardized the procedures for creating flood-inundation maps for flood-prone communities (U.S. Geological Survey, 2018) so that the process followed and products produced are similar regardless of which USGS office is responsible for the work. Tasks specific to the development of the flood maps for this study generally fell into three categories: (1) collecting hydrologic and topographic data, (2) calibrating parameters associated with the model, and (3) running selected storm scenarios and processing the results. Data collection consisted of acquiring and developing the combined hydrologic and hydraulic model for the East Fork Little Blue River study basin, collecting streamflow measurements and high-water marks for high-flow events during the study period through the use of pressure transducers and field visits, and collecting rainfall data from NWS records and processing the rainfall data for use in the model using GIS software. Calibrating the model involved calibrating the curve number (CN) parameters associated with the hydrologic component of the U.S. Army Corps of Engineers Hydrologic Engineering Center–River Analysis System (HEC–RAS) computer program (ver. 6.5; U.S. Army Corps of Engineers, 2024) rain-on-grid model and calibrating energy-loss factors (roughness coefficients) in the stream channel and floodplain associated with the hydraulic component of the model. The final category of tasks, running the selected storm scenarios and processing the results, involved running selected storm scenarios developed from NWS records, computing water-surface profiles using the HEC–RAS model, producing estimated flood-inundation maps for the selected study reach using HEC–RAS and GIS, and preparing the maps as shapefile polygons that depict the areal extent of flood inundation at various stages and as depth and water-surface elevation grids that provide the depth and water-surface elevations of floodwaters shown on a USGS flood-inundation mapping application. Additionally, peak velocities were derived from the HEC–RAS results at locations just downstream from selected hydraulic structures.
Computation of Water-Surface Profiles from Precipitation-Derived Streamflow
Flood stages at the reference point location RF1 at NE Scruggs Road (fig. 1) were determined from an estimated bankfull water-surface elevation threshold. Flood hydrographs were generated for varying rainfall magnitudes and durations using the calibrated model.
Hydraulic Data
This study uses hydraulic data from discrete streamflow measurements and discrete and continuous stage measurements made at pressure transducer locations (EFLB1, EFLB2, and EFLB3) on the East Fork Little Blue River and tributary A1 upstream from NE Scruggs Road (fig. 1) and discrete streamflow and water-surface elevation measurements made at RF1 (table 1). Two other pressure transducers were also initially installed in the basin but were ultimately removed because of continued vandalism, and no usable data were available from the removed pressure transducers for the calibration process. Discrete streamflow measurements during selected high-flow events were collected in accordance with techniques provided in Turnipseed and Sauer (2010). Stage at pressure transducer locations (continuous water-surface elevation monitoring locations; fig. 1) was measured every 5 minutes using a submersible data logger, and data were corrected for atmospheric pressure changes using continuous (5-minute increments) barometric pressure data. The stage data at the pressure transducer locations were converted to water-surface elevations referenced to the North American Vertical Datum of 1988 by adding the relevant elevation of the pressure transducer (table 1). The time-series data for the pressure transducers used in this study are available in an accompanying USGS data release (Atkinson, 2026). A level IV survey (Rydlund and Densmore, 2012) procedure was used in acquiring reference elevations for pressure transducer locations in the study reach. The pressure transducer locations were used as calibration points in the hydraulic modeling.
Table 1.
Locations of pressure transducers where continuous water-surface elevation data were recorded and the location of the reference point where discrete streamflow and water-surface elevation measurements were made.[°, degree; N, north; W, west; ft, foot; ʹ, minute; ʺ, second]
Hydrologic and Hydraulic Model Development
A combined hydrologic and hydraulic model was used to simulate the peak streamflow for the East Fork Little Blue River using design rainfall events covering a range of magnitudes and probabilities of exceedance. The combined model was developed using the U.S. Army Corps of Engineers modeling system HEC–RAS (ver. 6.5; U.S. Army Corps of Engineers, 2024). HEC–RAS is capable of running one-dimensional, step-backwater models for simulation of water-surface profiles with steady-state (gradually varied) flows and running one-dimensional and two-dimensional unsteady-state flow computations. The two-dimensional unsteady-state hydrologic and hydraulic model used for this study was originally developed for a detailed (Federal Emergency Management Agency zone AE) excess-rain-on-grid study by WSP, Inc. (formerly Wood E&IS), using HEC–RAS (ver. 6.2) in the year 2022 (Alicia Williams, WSP, Inc., written commun., 2023).
The two-dimensional HEC–RAS rain-on-grid model was calibrated using a series of event calibrations that represented a variety of antecedent moisture conditions and flow conditions with water-surface elevations measured at three pressure transducers: EFLB1, EFLB2, and EFLB3 (fig. 1). The model was also calibrated to discrete streamflow measurements made at a reference location just downstream from NE Scruggs Road (fig. 1). The primary calibration event was on July 1, 2024; this storm most closely matched the hydrograph of the simulated storms and captured a 4-percent AEP event during “normal” antecedent moisture conditions. An additional calibration event was on April 28, 2024 (“wet” antecedent moisture conditions), and a third calibration event was on May 2, 2024 (“dry” antecedent moisture conditions with no initial abstractions). According to the Natural Resources Conservation Service, initial abstractions consist primarily of “interception, infiltration during early parts of the storm, and surface depression storage” (Natural Resources Conservation Service, 2004, chap. 10, p. 10–3). The calibrated two-dimensional HEC–RAS rain-on-grid model was then used to simulate precipitation runoff from National Oceanic and Atmospheric Administration (NOAA) Atlas 14 rainfall events covering a range of 15 minutes to 24 hours in duration and AEPs of 100 to 0.1 percent (Atkinson, 2026) and selected rainfall events modified based on projected climate-change scenarios. For this study, the NOAA Atlas 14 partial-duration series was used. The data release accompanying this study (Atkinson, 2026) includes the model input files such as the rainfall events. The partial-duration series calculates storm depths using all storm values greater than a base value, as opposed to the annual maximum series, which only includes the greatest values for each year (Miller, 1964). The NOAA Atlas 14 precipitation frequency results were originally downloaded in recurrence interval format (years). In this study, the recurrence interval was converted to AEP for reporting purposes.
Model Scenarios
For this study, 248 overall hydrologic and hydraulic model scenarios were developed (table 2). Because of the similarities among the results of the different combinations of magnitude and duration, the final results were condensed into 14 representative stage conditions. These scenarios included the probabilistic storm simulations and “dry,” “normal,” and “wet” antecedent runoff condition variations. The probabilistic simulated storms are modeled as simple events; that is, they are stand alone and do not take into account possible combined effects that would result from multiple successive storms and runoff peaks. Climate-change conditions were developed based on the Coupled Model Intercomparison Project (CMIP) Climate Data Processing Tool 2.1, which was created by the Federal Highway Administration (Kilgore and others, 2021).
Table 2.
Description of U.S. Army Corps of Engineers Hydrologic Engineering Center–River Analysis System model scenarios developed in the study.[CNII, Soil Conservation Service runoff curve number representing a “normal” antecedent runoff condition; yr, year; min, minute; hr, hour; CNI, Soil Conservation Service runoff curve number representing a “dry” antecedent runoff condition; NOAA, National Oceanic and Atmospheric Administration; CNIII, Soil Conservation Service runoff curve number representing a “wet” antecedent runoff condition; RCP, representative concentration pathway used to project future greenhouse gas concentration scenarios; RCP 4.5 30 yr, representative concentration pathway of 4.5 watts per square meter and 30 years in the future; RCP 4.5 50 yr, representative concentration pathway of 4.5 watts per square meter and 50 years in the future; RCP 8.5 30 yr, representative concentration pathway of 8.5 watts per square meter and 30 years in the future; RCP 8.5 50 yr, representative concentration pathway of 8.5 watts per square meter and 50 years in the future]
Precipitation Data
Accurate precipitation data are needed as inputs to the hydrologic model to simulate the resulting runoff and stream profiles. The precipitation data used for model calibration events were from NOAA’s Multi-Radar Multi-Sensor system (Iowa State University of Science and Technology, 2024b). The precipitation data used for the model scenarios were probabilistic precipitation magnitudes associated with storm durations of 15 minutes to 24 hours at a single location within the basin (National Oceanic and Atmospheric Administration, 2024). To more closely align the methodology for processing the precipitation from the radar source with that of the point-source data to be used in practice, the gridded radar data were converted to a time series and averaged within four subbasins in the study area (fig. 1). In practice, precipitation data used for the display and interpretation of the flood-inundation maps would be obtained from the NWS’s ASOS network site at the Lee’s Summit Municipal Airport (Iowa State University of Science and Technology, 2024a).
Probabilistic precipitation events used as inputs to the hydrologic model for the modeled scenarios (table 2) were developed from the NOAA Atlas 14 point-precipitation frequency estimates (National Oceanic and Atmospheric Administration, 2024). The Atlas 14 event duration values were refined to include additional 4-hour duration events for this small study basin. The precipitation values for the 4-hour storms were interpolated by fitting a logarithmic trend line to the 5-, 10-, 15-, and 30-minute and 1-, 2-, 3-, 6-, 12-, and 24-hour duration values for each recurrence interval (fig. 3). The values represent a total amount of rainfall for the specified time duration. The storm distributions, or time series of precipitation based on the Atlas 14 totals, were developed by distributing the precipitation in 5-minute increments over the storm duration using an alternating block distribution approach (Chow and others, 1988).
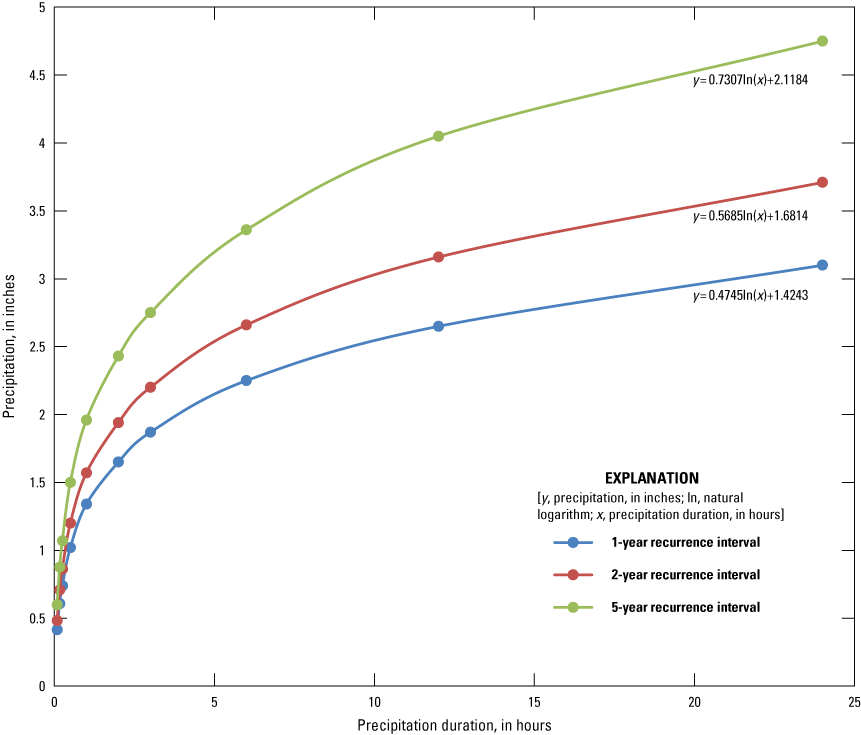
Graph showing examples of the interpolation of 4-hour precipitation totals for 1-, 2-, and 5-year recurrence interval frequencies (100-, 50-, and 20-percent annual exceedance probabilities) using provided 5-, 10-, 15-, and 30-minute and 1-, 2-, 3-, 6-, 12-, and 24-hour precipitation values from the National Oceanic and Atmospheric Administration Atlas 14 precipitation frequency estimates (National Oceanic and Atmospheric Administration, 2024).
Infiltration Method
The volume of precipitation in the HEC–RAS rain-on-grid model exceeding soil infiltration and storage is calculated and transformed into runoff using the Soil Conservation Service CN loss model with initial abstractions (Soil Conservation Service, 1986; Natural Resources Conservation Service, 2004). The infiltration layer in HEC–RAS was created by combining a Soil Survey Geographic database (Natural Resources Conservation Service, 2022) soils layer and the 2021 land cover from the National Land Cover Database (Dewitz, 2023).
For this project, initial abstraction values, representing the amount of soil storage before runoff, were applied to each CN value. The initial abstraction values were chosen from Soil Conservation Service (1986, table 4–1). Using the Soil Conservation Service CN approach, antecedent runoff conditions were divided into three classes: CNI for “dry,” CNII for “normal,” and CNIII for “wet” antecedent runoff conditions (Soil Conservation Service, 1986). All three antecedent runoff conditions were simulated in this study. The initial average, or “normal,” runoff condition (CNII) values used in this model were converted to initial estimates of “dry” conditions (CNI) and “wet” conditions (CNIII) using the following equations from Chow and others (1988):
and After the initial calculation of the CN values for the “dry” and “wet” antecedent runoff conditions was completed, the values were further refined manually during the calibration process.Streamflow Routing and Antecedent Flow
In a two-dimensional HEC–RAS hydrologic and hydraulic rain-on-grid model, “each computational cell face is evaluated similar to a cross section and is pre-processed into detailed hydraulic property tables” (U.S. Army Corps of Engineers, 2025). For these types of models, the routing method depends on the equations chosen to run the model because water-surface elevations, velocities, and depths are calculated at each cell face based on the equations chosen (U.S. Army Corps of Engineers, 2025). For this study, the model computations were completed using the shallow water equations method (U.S. Army Corps of Engineers, 2025).
To calibrate the model, antecedent flows were added to the East Fork Little Blue River, tributary A1, and tributary A2. The antecedent flow added to the East Fork Little Blue River was 10 cubic feet per second, and the antecedent flow added to both of the tributaries was 5 cubic feet per second. Adding the antecedent flows generated water-surface elevations that matched the observed water-surface elevations before the simulated storm event began. These antecedent flow values were held constant throughout the calibration simulations. For continuity purposes, these antecedent flows were also included in the probabilistic simulations.
Topographic and Bathymetric Data
The elevation data used in the HEC–RAS model were obtained from a 1-meter DEM that was derived from light detection and ranging (lidar) data collected by Quantum Spatial, Inc., between April and December 2020 (U.S. Geological Survey, 2021a). As per USGS quality level 2 data-accuracy specifications (ver. 1.2; Heidemann, 2018), the lidar data required a nonvegetated vertical accuracy of a maximum of 30 centimeters at the 95th percentile. For the DEM used in this study, the nonvegetated vertical accuracy had a tested value of 8.12 centimeters at the 95th percentile confidence level. Channel bathymetry at the reference location was verified by the USGS using channel bottom elevations the USGS hydrologist obtained while making streamflow measurements.
Hydraulic Structures
In the hydraulic model of the East Fork Little Blue River and its tributaries, 21 hydraulic structures are represented. These 21 structures include 3 four-lane road crossings and 3 extended pipe culverts and have the potential to affect water-surface elevations during flooding along the stream. The rest of the culverts and bridges are two-lane road crossings. All bridge-geometry information is contained in the hydraulic models used for analyses and provided in Atkinson (2026).
Energy-Loss Factors
Hydraulic analysis requires the estimation of energy losses that result from frictional resistance exerted by a channel on flow. These energy losses are quantified by the Manning’s roughness coefficient (n-value). Initial n-values were refined on the basis of field observations, aerial imagery, and the land-cover data downloaded from Dewitz (2023). During the calibration process, the initial n-values were varied by flow and adjusted until the differences between simulated and observed water-surface elevations at the calibration locations (fig. 1) were minimized. Calibration regions were added to simulate the channel bottom throughout the reach and the overbank areas near the pressure transducer locations EFLB2 and EFLB3. The final n-values ranged from 0.015 for paved areas to 0.16 for wooded areas. The channel n-value was 0.05. The channel coefficient was consistent along the length of the East Fork Little Blue River channel and all tributaries. The highest n-values were detected in wooded residential areas. Some of these areas were in the overbank area, but others were scattered throughout nearby parks and fields. The lowest n-values were in open parking lot areas and on the streets and cul-de-sacs.
Model Boundary Conditions
The HEC–RAS analysis for this study was completed using the two-dimensional unsteady-state flow computation option. Inflow boundary conditions consisted of (1) precipitation time series applied to the entire study basin using the “precipitation” boundary condition and (2) constant flow hydrographs applied to the channels within the study basin using the “flow hydrograph” boundary condition. The input hydrographs for the HEC–RAS model scenarios were generated using a range of precipitation frequency-duration events, as detailed in the “Precipitation Data” section. The model used the original shallow water equations, Eulerian-Lagrangian method to calculate the water-surface elevations (U.S. Army Corps of Engineers, 2024). Normal depth, based on an estimated average water-surface slope of 0.01 foot per foot, was used as the downstream boundary condition.
Model Calibration
The HEC–RAS model was calibrated to observed streamflow-stages collected during the April 28, 2024; May 2, 2024, and July 1, 2024, events at the reference point RF1 and to observed continuous water-surface elevations at the pressure transducer locations (fig. 1). Although the July 1 event was considered the primary event because the hydrograph pattern of the event followed a pattern similar to the modeled storms, the model was also calibrated to the other events to capture the full range of antecedent moisture conditions. Model calibration was completed by adjusting CN values until the results of the computations closely agreed with the observed water-surface elevations with a primary focus of calibration at the reference point RF1 (fig. 4A–C). In limited cases, the channel terrain was modified to provide a uniform channel. The channel and tributaries are small and narrow; consequently, the pixelation of the lidar-derived terrain could result in unreasonable fluctuations in water-surface levels.
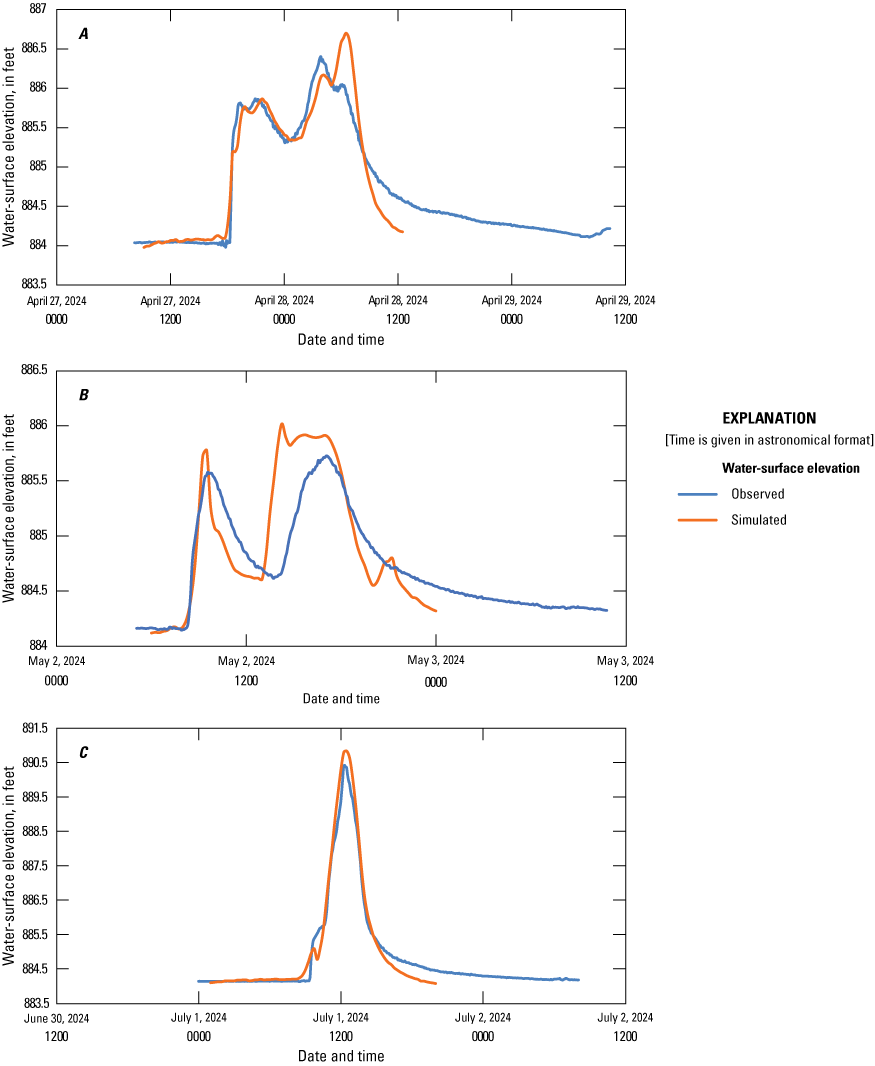
Graphs showing observed and simulated water-surface elevations and profiles for the flood events on the East Fork Little Blue River and tributaries at Lee’s Summit, Missouri, at the EFLB1 location. A, April 28, 2024; B, May 2, 2024; C, July 1, 2024.
Simulated water-surface elevations generally were within 0.51 ft of observed values, with the exception of the location of pressure transducer EFLB2 (fig. 1). For the July 1 event, the primary event, the difference between the observed and simulated water-surface elevation at the reference point RF1 was 0.06 ft (table 3). The differences during the July 1 event were 0.33 ft, 0.72 ft, and 0.10 ft for EFLB1, EFLB2, and EFLB3, respectively. Water-surface elevation comparisons between the simulated storms and the observed water-surface elevations at the EFLB1 location are shown in figure 4A–C. Simulated flood peaks for the three calibration events were within 23.2 percent, and the timing of the flood peaks was within 37 minutes of the observed peaks (table 4).
Table 3.
U.S. Army Corps of Engineers Hydrologic Engineering Center–River Analysis System calibration of selected high-flow events on April 28, 2024; May 2, 2024; and July 1, 2024.[ft, foot; NAVD 88, North American Vertical Datum of 1988; CNIII, Soil Conservation Service runoff curve number representing a “wet” antecedent runoff condition; CNI, Soil Conservation Service runoff curve number representing a “dry” antecedent runoff condition; CNII, Soil Conservation Service runoff curve number representing a “normal” antecedent runoff condition]
| Water-level recording location (fig. 1) | Target water-surface elevation (ft above NAVD 88) | Simulated water-surface elevation (ft above NAVD 88) | Absolute difference in elevation (ft) |
|---|---|---|---|
| EFLB1 | 885.91 | 885.89 | 0.02 |
| EFLB2 | 901.67 | 902.92 | 1.25 |
| EFLB3 | 919.08 | 918.87 | 0.21 |
| Streamflow measurement location | 884.17 | 884.22 | 0.05 |
| EFLB1 | 885.55 | 885.78 | 0.23 |
| EFLB2 | 901.27 | 901.61 | 0.34 |
| EFLB3 | 918.44 | 918.27 | 0.17 |
| Streamflow measurement location | 883.74 | 888.80 | 0.06 |
| EFLB1 | 890.42 | 890.75 | 0.33 |
| EFLB2 | 906.19 | 906.91 | 0.72 |
| EFLB3 | 922.08 | 922.18 | 0.10 |
| Streamflow measurement location | 888.73 | 888.67 | 0.06 |
Table 4.
Simulated and observed hydrograph characteristics of the April 28, 2024; May 2, 2024; and July 1, 2024, high-flow events at reference point RF1 on the East Fork Little Blue River at Lee’s Summit, Missouri.[Dates are given in month/day/year format, and time is given in astronomical format; ft3/s, cubic foot per second]
The Nash-Sutcliffe efficiency (NSE) coefficient (Nash and Sutcliffe, 1970) was used to assess model fit. Values of NSE can vary from negative infinity (−∞) to 1. Values of 1 correspond to a perfect match between simulated and observed time series, whereas values less than 0 indicate the observed average is a better predictor than the simulated values. Because the model does not account for changing hydrologic response conditions during the event, even though the first peaks hit within calibration limits, later peaks had greater variability. Hydrographs for all the calibration events are shown in figure 4A–C, and time-of-peak comparisons for all events are listed in table 4. The NSE values of the calibrated models for the April 28, 2024; May 2, 2024; and July 1, 2024, storms were about 0.84, 0.81, and 0.94, respectively, indicating a good fit for all storms (table 5). Overall, the results demonstrate that the model is capable of simulating accurate water levels throughout the reach at varying antecedent moisture conditions.
Table 5.
Model performance metrics of the U.S. Army Corps of Engineers Hydrologic Engineering Center–River Analysis System models developed for East Fork Little Blue River at Lee’s Summit, Missouri.[NSE, Nash-Sutcliffe model efficiency; CNIII, Soil Conservation Service runoff curve number representing a “wet” antecedent runoff condition; CNI, Soil Conservation Service runoff curve number representing a “dry” antecedent runoff condition; CNII, Soil Conservation Service runoff curve number representing a “normal” antecedent runoff condition]
Development of Water-Surface Profiles
All the probabilistic storm scenarios (table 2) were run using the model for “dry,” “normal,” and “wet” antecedent runoff conditions, and the peak water-surface elevations at the reference point RF1 were ranked in order from smallest to largest. A rating curve that was initially developed using the discrete streamflow measurements at the reference point RF1 was extended using the HEC–RAS model results so that inundation maps could be produced and associated streamflows estimated for water-surface elevations that exceeded the maximum observed condition. A representative scenario was then selected for each 1-ft water-surface elevation interval between 884 ft at the reference point (corresponding to the approximate bankfull condition at EFLB1) and 897 ft above the North American Vertical Datum of 1988 (water level corresponding to the 1,000-year recurrence interval, 24-hour event with “wet” antecedent runoff conditions). This 14-ft range of water-surface elevations corresponds to the approximate bankfull condition at EFLB1, or 3 ft of depth at the reference point RF1, to 16 ft of depth at the reference point RF1 (table 6). Inundation extents were then processed using Esri ArcGIS Pro (Esri, 2024) for these 14 selected scenarios. Each water-surface profile is intended to represent 1 ft of depth; specifically, the scenario representing a water-surface elevation of 886 ft is intended to represent the inundation extents for water-surface elevations ranging from 885.5 to 886.5 ft. The resulting flood-inundation maps indicate the maximum water-surface elevation attained at each location throughout the longitudinal reach for the corresponding precipitation magnitude and duration. A rating curve that was initially developed using the discrete streamflow measurements at the reference point RF1 was extended using the HEC–RAS model results. Simulated results were used to determine approximate flows at the reference point RF1 for each of the water-surface elevations (table 6).
Table 6.
Selected scenarios used to represent flood-inundation water-surface elevations of 884 to 897 feet at the reference point RF1 at East Fork Little Blue River at Lee’s Summit, Missouri.[ft, foot; NAVD 88, North American Vertical Datum of 1988; ft3/s, cubic foot per second; yr, year; min, minute; CNII, Soil Conservation Service runoff curve number representing a “normal” antecedent runoff condition; hr, hour; CNIII, Soil Conservation Service runoff curve number representing a “wet” antecedent runoff condition]
Summary of simulated results for all scenarios in Atkinson (2026).
In addition to flood-inundation extents, depth grids, water-surface elevation grids, and velocities at key locations downstream from bridges and culverts were derived from the model. The depth grid maps indicate the approximate depth of water within the inundated area, and the water-surface elevation grids indicate the approximate water-surface elevation within the inundated area for each of the 14 selected scenarios. The depths and water-surface elevations are provided to the user as a range of 1 ft; for example, a calculated flood depth of 7.5 ft would be shown on the mapper as 7–8 ft, and a calculated water-surface elevation of 941.45 ft would be shown on the mapper as 940.9–941.9 ft. The depth grids and the water-surface elevation grids incorporate lowest adjacent grade data. The lowest adjacent grades are the bare-earth surfaces nearest the buildings (Federal Emergency Management Agency, 2020). When a building is within the inundation extent, the flood depth and water-surface elevations over the building area would be an estimate of the flood depth and water level inside the structure, excluding any implemented elevating or flood-proofing measures. Finally, velocities downstream from bridges and culverts were derived from the model for each of the 14 selected scenarios. Similar to the depth grids and water-surface elevation grids, velocities are shown to users as a range; for example, a calculated velocity of 4.4 feet per second would be shown as 4–5 feet per second.
Development of Flood-Inundation Maps
Flood-inundation maps were created for the East Fork Little Blue River study reach based on modeled peak water-surface elevations at the reference location RF1. The model was calibrated to the nearest 0.5 ft; therefore, the maps have an estimated vertical accuracy of plus or minus 1 ft. Estimated flood-inundation boundaries and depth grids for each simulated profile were developed with the HEC–RAS mapper and exported from HEC–RAS (Atkinson, 2026). Shapefile polygons, depth grid rasters, and water-surface elevation grid rasters of the inundated areas for each profile were modified as needed in ArcGIS Pro (ver. 3.3; Esri, 2024) to ensure a hydraulically reasonable transition of the flood boundaries along the length of the East Fork Little Blue River and tributaries.
Any inundated areas that were detached from the main channel were examined to determine if they were hydrologically connected with the main river, such as through culverts under roadways. Where such connections existed, the mapped inundated areas were retained in their respective flood maps; otherwise, the erroneously delineated parts of the flood extent were deleted. For this study, possible connections because of overflowing storm sewers were not included in the final inundation extents because the storm sewers were not included in the model. The flood-inundation areas were overlain on high-resolution, georeferenced, aerial photographs of the study area to aid in this decision making. Bridge surfaces are not shown as inundated until the lowest flood stage exceeds the elevation of the bridge deck, in which case, the bridge surface is depicted as being inundated. Estimates of water depth, depth of water above the lowest adjacent grade, water-surface elevations, and maximum velocities at selected road crossings can be obtained with the presentation of the flood-inundation maps on an interactive mapping application described in the “Flood-Inundation Map Delivery” section. The “existing conditions” scenario flood-inundation map corresponding to the highest simulated water-surface profile, a water-surface elevation of 897 ft, is shown in figure 5.
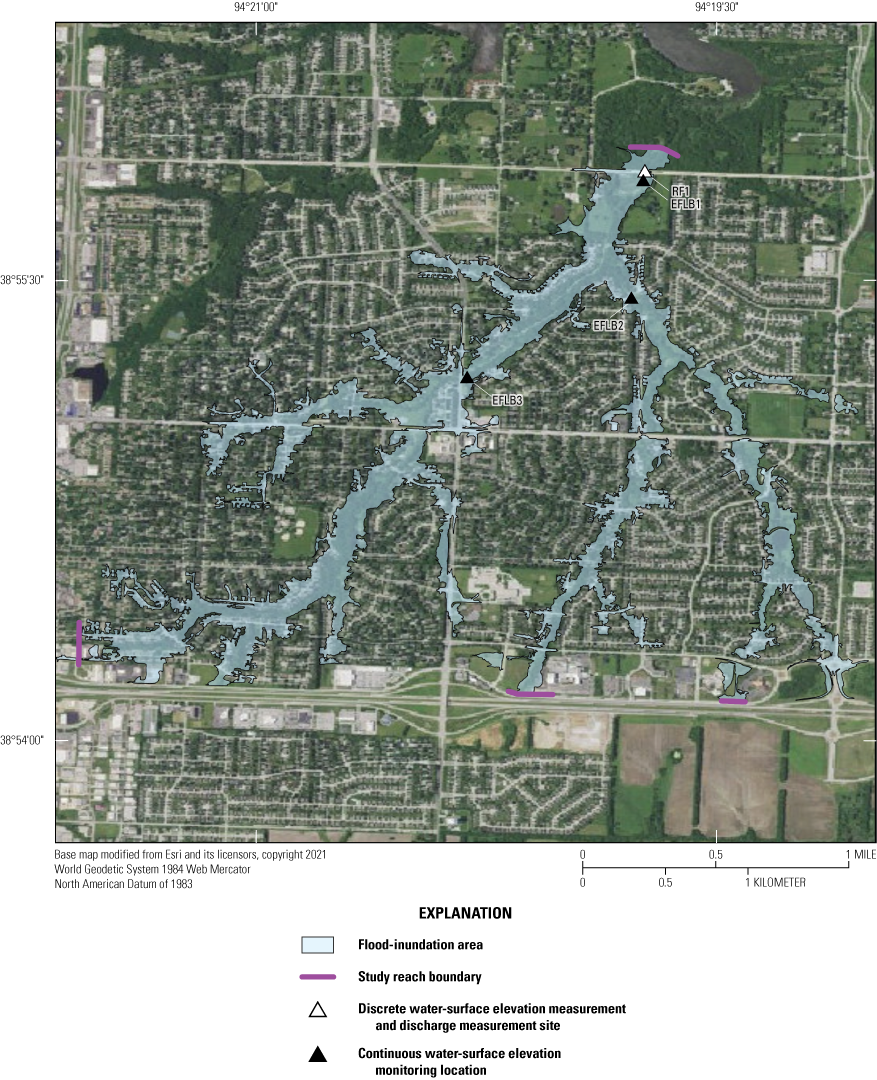
Flood-inundation map for the East Fork Little Blue River at Lee’s Summit, Missouri, study reach corresponding to a water-surface elevation of 897 feet at the reference location.
Only the “existing conditions” scenario maps are shown on the interactive flood-inundation map application; projected climate-change scenarios are discussed in the “Climate-Change Scenarios” section. The net differences in the resulting stages and corresponding flood-inundation maps for the various scenarios are provided in the “East Fork Little Blue River_summary_tables” file in Atkinson (2026).
Climate-Change Scenarios
The climate-change scenarios were developed using the Federal Highway Administration’s CMIP Climate Data Processing Tool 2.1 (Kilgore and others, 2021). This online software tool was developed to “take Localized Constructed Analogs (LOCA) downscaled CMIP5 data and process the information into statistical and other variables that can be used in planning and design with greater ease” (Kilgore and others, 2021, p. i). Using the CMIP tool, users can select a geographic area of interest, a period of interest, and an emissions condition, called the representative concentration pathway (RCP), to determine adjustment factors applied to “existing conditions” precipitation to obtain projected precipitation conditions.
The climate-change scenarios and CMIP tool were used to simulate the 100-year, 24-hour storm and the 100-year, 6-hour storm for all three antecedent moisture conditions. Projected precipitation amounts for varying future time and emission conditions were 4–7 percent greater than existing conditions (table 7).
Table 7.
Projected changes in precipitation based on the Federal Highway Administration’s Coupled Model Intercomparison Project tool (Kilgore and others, 2021).[yr, year; hr, hour; RCP, representative concentration pathway used to project future greenhouse gas concentration scenarios; RCP 4.5 30 yr, representative concentration pathway of 4.5 watts per square meter of radiative forcing and 30 years in future; RCP 4.5 50 yr, representative concentration pathway of 4.5 watts per square meter of radiative forcing and 50 years in the future; RCP 8.5 30 yr, representative concentration pathway of 8.5 watts per square meter of radiative forcing and 30 years in the future; RCP 8.5 50 yr, representative concentration pathway of 8.5 watts per square meter of radiative forcing and 50 years in the future]
After the scenarios were run, the modeled peak values at the reference point RF1 (fig. 1) were recorded. Overall, the increase in water-surface elevation at RF1 because of the increased precipitation is less than 0.5 ft, although increases are greater for the 100-year, 24-hour scenarios than the 100-year, 6-hour scenarios (table 8). However, although increases are larger for the 100-year, 24-hour scenarios, the changes in flood-inundation extents are similar for each scenario (fig. 6A and B).
Table 8.
Climate-change scenario comparison of percentage difference from base scenario and the magnitude of the increase or decrease from the base at the reference location.[CNII, Soil Conservation Service runoff curve number representing a “normal” antecedent runoff condition; ft, foot; yr, year; hr, hour; RCP, representative concentration pathway used to project future greenhouse gas concentration scenarios; RCP 4.5 30 yr, representative concentration pathway of 4.5 watts per square meter of radiative forcing and 30 years in future; RCP 4.5 50 yr, representative concentration pathway of 4.5 watts per square meter of radiative forcing and 50 years in the future; RCP 8.5 30 yr, representative concentration pathway of 8.5 watts per square meter of radiative forcing and 30 years in the future; RCP 8.5 50 yr, representative concentration pathway of 8.5 watts per square meter of radiative forcing and 50 years in the future]
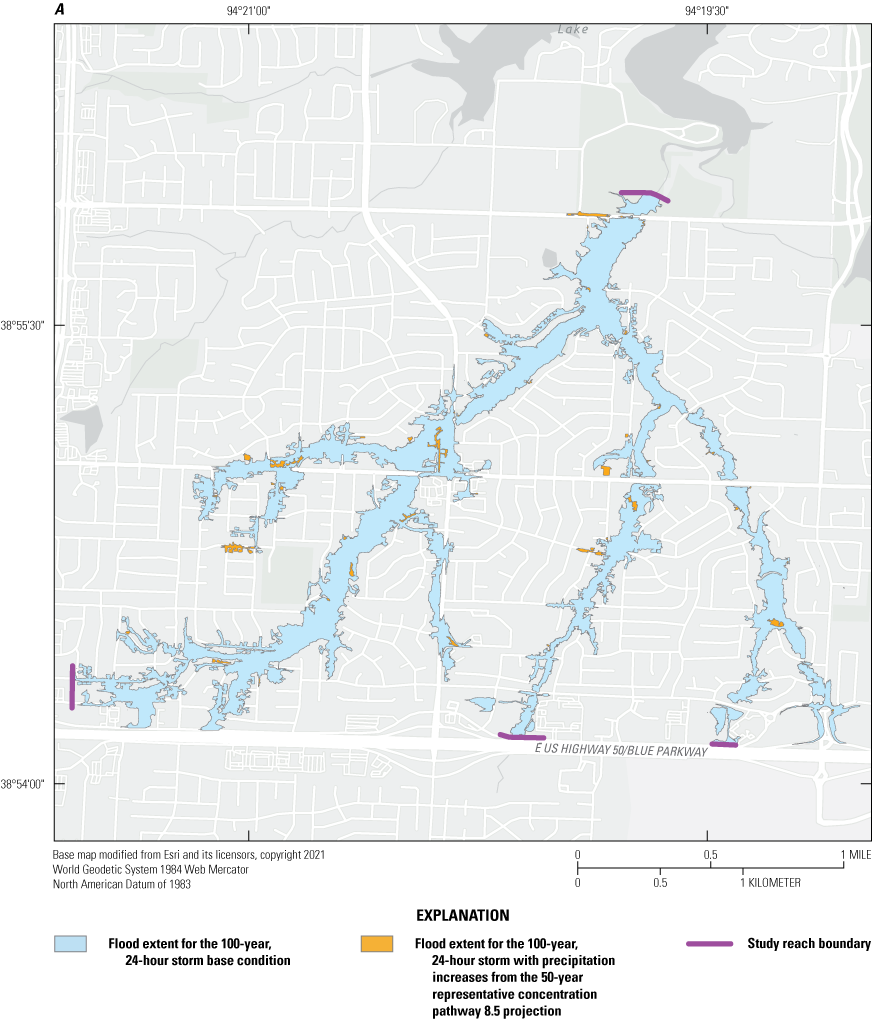
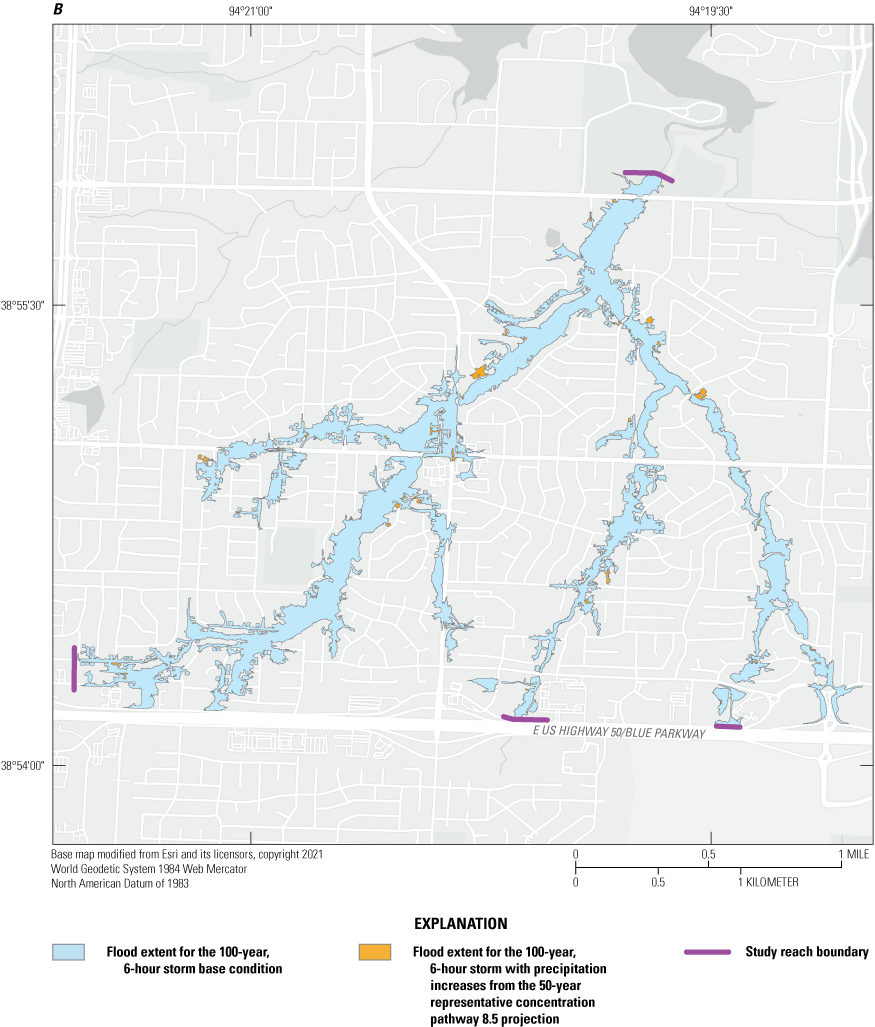
Flood-inundation maps for the East Fork Little Blue River and tributaries at Lee’s Summit, Missouri, study reach showing changes in flood-inundation extents based on selected climate-change scenarios. A, 24-hour storm projection; B, 6-hour storm projection. [50-year representative concentration pathway 8.5 refers to the representative concentration pathway (used to project future greenhouse gas concentration scenarios) of 8.5 watts per square meter and 50 years in the future]
Flood-Inundation Map Delivery
The geospatial data files of developed flood-inundation polygons and corresponding depth grids, water-surface elevation rasters, depth of water above lowest adjacent grade, and velocity data are available in Atkinson (2026). Additionally, a flood-inundation mapping interface (City of Lee’s Summit, 2025) has been established to make the fully processed USGS flood-inundation study information available to the public. The website links to a mapping application that provides map libraries and detailed information on flood extents and depths for modeled sites.
Determining an appropriate flood-inundation map to reference for a particular event begins with monitoring rainfall. At the time of this report, the Lee’s Summit mapping application, precipitation totals are gathered every 10 minutes from the NWS’s ASOS network station at the Lee’s Summit Municipal Airport. For the mapping application associated with this study, these data can be downloaded through Iowa State University’s Environmental Mesonet (Iowa State University of Science and Technology, 2024a) and shown on a mapping application. Forecasted precipitation is based on the quantitative precipitation forecast for the area and is available from the NWS’s text products (National Weather Service, 2025b).
The mapping application provides the opportunity to show current conditions or a user-specified rainfall. Based on the rainfall option chosen by the user or the recently downloaded current and forecasted precipitation, the hydrologic response of various precipitation events is used to determine the flood-inundation map shown to the user of the application. For example, if current conditions are showing a rainfall amount closely corresponding to 3.44 inches (in.) of rain falling in 2 hours, which is equivalent to the 25-year, 2-hour storm, then the mapping application would show the flood-inundation extents corresponding to the map related to the peak value produced for this particular storm at the reference point RF1 (fig. 1). Alternatively, the user can opt to choose a rainfall depth and time combination to view the resulting flood-inundation extents.
The response of the East Fork Little Blue River and tributaries to a rainstorm that is associated with a precipitation magnitude and duration and represented by the selected flood-inundation map will also vary depending on the selected antecedent runoff condition (“dry,” “normal,” or “wet”). In the mapping application, the antecedent runoff condition associated with the current condition is determined based on awareness of hydroclimatic conditions in the basin preceding an event. The current antecedent moisture conditions are based on the flash-flood guidance for a particular basin. The flash-flood guidance value for the basin is determined based on the soil moisture conditions before a storm event. The current value is downloaded from the NWS’s application programming interface (National Weather Service, 2025a) and shown on the flood-inundation mapping application (City of Lee’s Summit, 2025). Alternatively, users may manually select an antecedent moisture condition to pair with a manually selected rainfall amount and duration.
In calibrating the models for this study, the “normal” antecedent runoff condition was observed in the summer (July 1, 2024, event) with full vegetation cover with an antecedent 7-day rainfall of 2.87 in., mostly (2.72 in.) from one storm about 5 days before the July 1 event. The maximum daily air temperatures, in degrees Fahrenheit, were in the 80s and 90s for 4 weeks before the event. The “wet” condition calibration event was in April under growing vegetation with an antecedent 7-day rainfall of 1.62 in., mostly from a 1.46-in. event 2 days before April 28th. Maximum daily temperatures in the preceding month were mostly in the 50s, 60s, and low 70s, and a few days were in the 80s. “Dry” antecedent runoff conditions with no initial abstractions were observed for the May 2, 2024, event with still growing vegetation cover, and antecedent rainfall after the April 28 event was about 0.55 in. Maximum daily temperatures for these few days varied from the high 60s to mid-80s. Based on these conditions, the antecedent moisture conditions seem most affected by the rainfall and temperatures immediately before the calibration event. The application draws from the NWS’s application programming interface to update the estimated antecedent moisture condition each hour (National Weather Service, 2025a).
The estimated flood-inundation maps are shown in sufficient detail so that preparations for flooding and decisions for emergency response could be completed efficiently. Depending on the flood magnitude, roadways are shown as shaded (inundated and likely impassable) or not shaded (dry and likely passable) to facilitate emergency planning and use. Bridges are shaded (that is, shown as inundated) when the flood stage exceeds the elevation of the bridge deck. A shaded building should not be interpreted to mean that the structure is completely submerged; rather, the lowest adjacent grade bare-earth surfaces near the building are inundated (Federal Emergency Management Agency, 2020). In these instances, the water depth near the building would be an estimate of the water level inside the structure, unless elevating or flood-proofing measures had been implemented. For this study of the East Fork Little Blue River and associated tributaries, the mapping application shows water-surface elevations and water depths. Additionally, the mapping application shows approximate velocities just downstream from selected bridge locations.
Disclaimer for Flood-Inundation Maps
The flood-inundation maps should not be used for navigation, regulatory, permitting, or other legal purposes. The USGS provides these maps “as is” for a quick reference, emergency planning tool but assumes no legal liability or responsibility resulting from the use of this information.
Uncertainties and Limitations Regarding Use of Flood-Inundation Maps
Although the flood-inundation maps represent the boundaries of inundation areas with a distinct line, some uncertainty is associated with these maps. The flood boundaries shown were estimated based on water stages at a selected reference location based on the hydrologic response from selected precipitation magnitudes and durations. Water-surface elevations along the stream reach were estimated by unsteady-state hydraulic modeling, assuming unobstructed flow, and used streamflows and hydrologic conditions anticipated at the East Fork Little Blue River main stem, tributary A1, and tributary A2. The rain-on-grid model reflects the land-cover characteristics and any bridge, culvert, dam, levee, or other hydraulic structures existing as of June 2023. Unique meteorological factors (timing and distribution of precipitation) may cause actual streamflows along the modeled reach to vary from those assumed during a flood, which may lead to deviations in the water-surface elevations and inundation boundaries shown. Additional areas may be flooded because of unanticipated conditions such as changes in the streambed elevation or roughness, backwater into major tributaries along a river main stem, or backwater from localized debris or ice jams. The accuracy of the flood water extent portrayed on these maps will vary with the accuracy of the DEM used to simulate the land surface. Of the 14 flood-inundation map scenarios, 8 exceed the largest streamflow measurement made at the East Fork Little Blue River reference location. This highest measurement corresponds to a water-surface elevation of 888.7 ft, which corresponds to the 889-ft stage map; therefore, additional uncertainty for flood-inundation maps exists at water-surface elevations greater than 889 ft.
The user should be aware of additional uncertainties that may be inherent or factored into the simulation of flood peaks using rainfall-runoff simulations. A rain-on-grid model was used to simulate flood peaks associated with various probabilistic precipitation amounts, and the precipitation was assumed to follow a defined temporal distribution over the duration of the event with an even spatial distribution over the basin. The actual temporal and spatial distribution of precipitation may vary, thereby affecting the timing and magnitude of the predicted flood peak in the main stem or one of the tributaries; thus, a single “simple” storm was simulated with a near-base-flow starting condition to develop the flood-inundation maps. For multiple compounding precipitation events, the user should take into consideration that the starting streamflow condition may be considerably higher than base flow used in the simulations, and therefore, the peak condition also will be higher than simulated conditions. Other sources of uncertainty will arise from the selection of the appropriate antecedent runoff condition and the occurrence of atypical precipitation events including rainfall on frozen ground or on a substantial existing snowpack, all of which may affect the timing and magnitude of the predicted flood peak.
Additional Components to the Flood-Inundation Map
For this project, the cooperator wanted to incorporate some additional components into the final flood-inundation map dashboard (City of Lee’s Summit, 2025) beyond the standard inundation extents and water depths (U.S. Geological Survey, 2018). These enhancements include indicating depth of inundation above the lowest adjacent grade of structures within the floodplain, indicating water-surface elevation in addition to water depth at a selected location, and indicating maximum water velocity at selected locations. For this project, the lowest adjacent grade, or bare-earth surfaces near a building (Federal Emergency Management Agency, 2020), values were used to indicate whether or not a particular structure is likely to be flooded.
The Cybersecurity & Infrastructure Security Agency of the Federal Government defines several sectors of critical facilities (Cybersecurity & Infrastructure Security Agency, 2025). For this project, critical infrastructure within the study basin was included in the flood-inundation mapping display. For the purpose of this study, critical infrastructure was defined as emergency services; water and wastewater treatment plants; healthcare facilities, including pharmacies; government facilities, including schools; and any chemical and manufacturing facilities. Several businesses and churches are also within the basin area, although most of the basin contains residential properties.
Summary
A library containing 14 digital flood-inundation maps was developed by the U.S. Geological Survey, in cooperation with the City of Lee’s Summit, Missouri, for a 2.95-mile reach of the East Fork Little Blue River and tributaries within the city. The maps were developed using input streamflows derived from precipitation values of 15-minute to 24-hour durations and ranging from 1- to 1,000-year recurrence intervals (100- to 0.1-percent annual exceedance probability) and the U.S. Army Corps of Engineers Hydrologic Engineering Center–River Analysis System (ver. 6.5). Water-surface profiles from the rain-on-grid two-dimensional unsteady-state model were used to estimate flood-inundation areas and depths of flooding. The hydraulic model was calibrated to continuous water-surface elevations recorded during the April 28, 2024; May 2, 2024; and July 1, 2024, high-flow events representing a range of antecedent runoff conditions and hydrologic responses and to discrete streamflow measurements from a reference location on the East Fork Little Blue River.
The hydrologic and hydraulic model encompassing the study reach was used to simulate runoff, route streamflows, and map the resulting 14 water-surface profiles for flood stages at 1-foot (ft) intervals referenced to the reference point and ranging from a water-surface elevation of 884 ft at the reference point, equating to bankfull at the EFLB1 pressure transducer location, to 897 ft. The 897-ft water-surface elevation corresponds to the estimated 0.1-percent annual exceedance probability (1,000-year recurrence interval) precipitation under “wet” antecedent conditions.
Within the HEC–RAS model, 240 scenarios were developed from the design rainfall events with each of 3 antecedent conditions (“dry,” “normal,” or “wet”). Additional scenarios were created to simulate the effects of projected precipitation scenarios on the 100-year recurrence interval, 24-hour storm and the 100-year recurrence interval, 6-hour storm. The rainfall for these scenarios was modified based on the representative concentration pathways (RCPs) used to project future greenhouse gas concentration scenarios that apply rainfall modified based on projected precipitation conditions 30 and 50 years into the future: RCP 8.5 30-year (RCP of 8.5 watts per square meter [W/m2] and 30 years in the future), RCP 8.5 50-year (RCP of 8.5 W/m2 and 50 years in the future), RCP 4.5 30-year (RCP of 4.5 W/m2 and 30 years in the future), and RCP 4.5 50-year (RCP of 4.5 W/m2 and 50 years in the future) scenarios. All simulation results were assigned to a flood-inundation map condition based on the generated peak flow and corresponding water-surface elevation at the East Fork Little Blue River reference location.
The simulated water-surface profiles were then combined with a geographic information system and a digital elevation model derived from light detection and ranging (also known as lidar) data to delineate estimated flood-inundation areas as shapefile polygons showing inundation extents, depth grids, water-surface elevations, velocities at selected locations, critical infrastructure locations, and lowest adjacent grades for each profile. These flood-inundation polygons were overlaid on high-resolution, georeferenced aerial photographs of the study area.
Interactive use of the maps on this mapping application can give users a general indication of the depth of water or the water-surface elevation at any point in the inundated area by using the mouse cursor to click within the shaded areas. The flood-inundation maps are tied to real-time precipitation data obtained from the Automated Surface Observing System weather station at the Lee’s Summit Municipal Airport, accessible at https://mesonet.agron.iastate.edu/request/download.phtml?network=MO_ASOS. The joint products could help guide the public in taking individual safety precautions and provide emergency-management personnel with a tool to mitigate and prepare for flood-related emergencies, efficiently manage emergency flood operations, and effectively complete postflood recovery efforts.
References Cited
Atkinson, A.A., 2026, Geospatial data and model archives associated with precipitation-driven flood-inundation mapping of the East Fork Little Blue River and associated tributaries at Lee’s Summit, Missouri: U.S. Geological Survey data release, https://doi.org/10.5066/P13NSPHQ.
City of Lee’s Summit, 2025, Flood-inundation mapping application for the East Fork Little Blue River: City of Lee’s Summit website, accessed February 20, 2026, at https://apps.usgs.gov/fim-lees-summit/.
Cybersecurity & Infrastructure Security Agency, 2025, Critical infrastructure sectors: Cybersecurity & Infrastructure Security Agency website, accessed March 28, 2025, at https://www.cisa.gov/topics/critical-infrastructure-security-and-resilience/critical-infrastructure-sectors.
Dewitz, J., 2023, National Land Cover Database (NLCD) 2021 products: U.S. Geological Survey data release, accessed November 5, 2023, at https://doi.org/10.5066/P9JZ7AO3.
Esri, 2024, ArcGIS Pro (ver. 3.3): Esri software release, accessed June 4, 2024, at https://www.esri.com/en-us/arcgis/products/arcgis-pro/overview.
Federal Emergency Management Agency, 2020, Lowest adjacent grade: Federal Emergency Management Agency website, accessed March 28, 2025, at https://www.fema.gov/about/glossary/lowest-adjacent-grade.
Federal Emergency Management Agency, 2023, Flood insurance study, Jackson County, Missouri, and incorporated areas and Kansas City: Washington, D.C., Federal Emergency Management Agency, accessed on August 11, 2025, at https://msc.fema.gov/portal/availabilitySearch?addcommunity=290173&communityName=KANSAS%20CITY,%20CITY%20OF#searchresultsanchor.
Heidemann, H.K., 2018, Lidar base specification (ver. 1.3, February 2018): U.S. Geological Survey Techniques and Methods, book 11, chap. B4, 101 p., accessed March 28, 2025, at https://doi.org/10.3133/tm11B4.
Iowa State University of Science and Technology, 2024a, ASOS network—ASOS-AWOS-METAR data download: Iowa State University of Science and Technology digital data, accessed August 20, 2024, at https://mesonet.agron.iastate.edu/request/download.phtml?network=MO_ASOS.
Iowa State University of Science and Technology, 2024b, Iowa Environmental Mesonet—GIS raster in ERDAS Imagine (.IMG) format: Iowa State University of Science and Technology digital data, accessed September 11, 2024, at https://mesonet.agron.iastate.edu/rainfall/.
Kilgore, R., Bhat, C., Sharar-Salgado, D., and Kafalenos, R., 2021, Coupled Model Intercomparison Project (CMIP) Data Processing Tool 2.1—User’s guide: Washington, D.C., Federal Highway Administration report no. FHWA–HIF–21–016, 45 p. [Also available at https://rosap.ntl.bts.gov/view/dot/73035.]
Miller, J.F., 1964, Two- to ten-day precipitation for return periods of 2 to 100 years in the contiguous United States: U.S. Weather Bureau, Technical Paper no. 49, 29 p. [Also available at https://www.weather.gov/media/owp/hdsc_documents/TechnicalPaper_No49.pdf.]
Missouri Department of Transportation, 2024, Functional classification system, Lees Summit, Jackson County, Cass County, Missouri: Missouri Department of Transportation, 1 p., accessed February 7, 2025, at https://www.modot.org/sites/default/files/documents/LeesSummit.pdf.
Nash, J.E., and Sutcliffe, J.V., 1970, River flow forecasting through conceptual models part 1—A discussion of principles: Journal of Hydrology, v. 10, no. 3, p. 282–290. [Also available at https://doi.org/10.1016/0022-1694(70)90255-6.]
National Oceanic and Atmospheric Administration, 2024, Precipitation frequency data server (PFDS): National Weather Service digital data, accessed September 11, 2024, at https://hdsc.nws.noaa.gov/pfds/pfds_map_cont.html?bkmrk=mo.
National Weather Service, 2025a, API web service: National Weather Service website, accessed May 5, 2025, https://www.weather.gov/documentation/services-web-api.
National Weather Service, 2025b, National blend of models—Text products: National Weather Service website, accessed September 27, 2024, at https://www.weather.gov/mdl/nbm_text.
National Weather Service, 2025c, National Weather Service home: National Weather Service website, accessed March 28, 2025, at https://www.weather.gov.
Natural Resources Conservation Service, 2004, Estimation of direct runoff from storm rainfall—Part 630 hydrology—National engineering handbook: Washington, D.C., U.S. Department of Agriculture, [variously paged]. [Also available at https://www.hydrocad.net/neh/630contents.htm.]
Natural Resources Conservation Service, 2022, Soil Survey Geographic database (SSURGO): Natural Resources Conservation Service database, accessed June 14, 2024, at https://www.nrcs.usda.gov/resources/data-and-reports/soil-survey-geographic-database-ssurgo.
Rydlund, P.H., Jr., and Densmore, B.K., 2012, Methods of practice and guidelines for using survey-grade global navigation satellite systems (GNSS) to establish vertical datum in the United States Geological Survey: U.S. Geological Survey Techniques and Methods, book 11, chap. D1, 102 p. with appendixes. [Also available at https://doi.org/10.3133/tm11D1.]
Soil Conservation Service, 1986, Urban hydrology for small watersheds: Washington, D.C., Soil Conservation Service report no. TR–55, [variously paged; 105 p.]. [Also available at https://www.nrc.gov/docs/ML1421/ML14219A437.pdf.]
Turnipseed, D.P., and Sauer, V.B., 2010, Discharge measurements at gaging stations: U.S. Geological Survey Techniques and Methods, book 3, chap. A8, 87 p. [Also available at https://doi.org/10.3133/tm3A8.]
U.S. Army Corps of Engineers, 2024, HEC–RAS user’s manual (ver. 6.5, February 2024): U.S. Army Corps of Engineers website, accessed March 14, 2024, at https://www.hec.usace.army.mil/confluence/rasdocs/rasum/6.5.
U.S. Army Corps of Engineers, 2025, HEC–RAS 2D user’s manual: U.S. Army Corps of Engineers website, accessed March 14, 2025, at https://www.hec.usace.army.mil/confluence/rasdocs/r2dum/latest.
U.S. Census Bureau, 2021, Decennial census [Lee’s Summit city, Missouri]: U.S. Census Bureau digital data, accessed March 28, 2025, at https://data.census.gov/table/DECENNIALPL2020.P1?q=Lee%27s+Summit,+MO.
U.S. Geological Survey, 2018, Flood Inundation Mapping (FIM) Program: U.S. Geological Survey web page, accessed March 28, 2025, at https://www.usgs.gov/mission-areas/water-resources/science/flood-inundation-mapping-fim-program.
U.S. Geological Survey, 2021a, 3DEP LidarExplorer: U.S. Geological Survey digital data, accessed January 4, 2021, at https://apps.nationalmap.gov/lidar-explorer/#/.
U.S. Geological Survey, 2021b, StreamStats, version 4.40, Missouri: U.S. Geological Survey digital data, accessed June 2021 at https://streamstats.usgs.gov/ss/.
Weather Underground, 2025, WunderMap—Interactive weather map and radar: Weather Underground digital data, accessed December 17, 2024, at https://www.wunderground.com/wundermap.
Conversion Factors
U.S. customary units to International System of Units
Temperature in degrees Fahrenheit (°F) may be converted to degrees Celsius (°C) as follows:
°C = (°F – 32) / 1.8.
Datums
Vertical coordinate information is referenced to (1) stage, the height above an arbitrary datum established at a streamgage, and (2) elevation, the height above the North American Vertical Datum of 1988 (NAVD 88).
Horizontal coordinate information is referenced to the North American Datum of 1983 (NAD 83).
Supplemental Information
Representative concentration pathway scenario stabilized radiative forcing is given in watts per square meter (W/m2).
Abbreviations
AEP
annual exceedance probability
ASOS
Automated Surface Observing System
CMIP
Coupled Model Intercomparison Project
CN
curve number
DEM
digital elevation model
FIS
flood-insurance study
GIS
geographic information system
HEC–RAS
Hydrologic Engineering Center–River Analysis System
lidar
light detection and ranging
n-value
Manning’s roughness coefficient
NOAA
National Oceanic and Atmospheric Administration
NSE
Nash-Sutcliffe efficiency
NWS
National Weather Service
RCP
representative concentration pathway used to project future greenhouse gas concentration scenarios
USGS
U.S. Geological Survey
For more information about this publication, contact:
Director, USGS Central Midwest Water Science Center
1400 Independence Road
Rolla, MO 65401
573–308–3667
For additional information, visit: https://www.usgs.gov/centers/cm-water
Publishing support provided by the
USGS Science Publishing Network,
Rolla Publishing Service Center
Disclaimers
Any use of trade, firm, or product names is for descriptive purposes only and does not imply endorsement by the U.S. Government.
Although this information product, for the most part, is in the public domain, it also may contain copyrighted materials as noted in the text. Permission to reproduce copyrighted items must be secured from the copyright owner.
Suggested Citation
Atkinson, A.A., 2026, Precipitation-based flood-inundation maps for the East Fork Little Blue River and tributaries at Lee’s Summit, Missouri, 2024: U.S. Geological Survey Scientific Investigations Report 2026–5017, 24 p., https://doi.org/10.3133/sir20265017.
ISSN: 2328-0328 (online)
Study Area
| Publication type | Report |
|---|---|
| Publication Subtype | USGS Numbered Series |
| Title | Precipitation-based flood-inundation maps for the East Fork Little Blue River and tributaries at Lee’s Summit, Missouri, 2024 |
| Series title | Scientific Investigations Report |
| Series number | 2026-5017 |
| DOI | 10.3133/sir20265017 |
| Publication Date | May 19, 2026 |
| Year Published | 2026 |
| Language | English |
| Publisher | U.S. Geological Survey |
| Publisher location | Reston, VA |
| Contributing office(s) | Central Midwest Water Science Center |
| Description | Report: viii; 24 p.; Data Release |
| Country | United States |
| State | Missouri |
| Other Geospatial | East Fork Little Blue River and Tributaries at Lee’s Summit |
| Online Only (Y/N) | Y |
| Additional Online Files (Y/N) | N |