

Understanding the Occurrence and Distribution of Per- and Polyfluoroalkyl Substances (PFAS) in Surface Waters of the Nontidal Passaic River Basin
Links
- Document: Report (4.73 MB pdf) , HTML , XML
- Data Release: USGS data release - Per- and polyfluoroalkyl substances (PFAS) concentration results in the Wanaque, Ramapo, Pompton and Passaic River watersheds, New Jersey 2025
- NGMDB Index Page: National Geologic Map Database Index Page (html)
- Download citation as: RIS | Dublin Core
Acknowledgments
The authors would like to thank the following U.S. Geological Survey personnel for help with sampling and data approval: R.W. Atkinson, E.C. Bernal, B.W. Bjorklund, K.M. Bowen, P.W. Bowen, Z.J. Bunnell, S.A. Carullo, J.A. Cohl, J.B. Collenburg, J.V. Elstad, J.A. Medina, C.T. Mooney, and L.M. Sirotniak. We would also like to thank S.A. Miller and P.M. Bradley of the U.S. Geological Survey for reviewing the report. We would also like to acknowledge New Jersey American Water, Passaic Valley Water Commission, Veolia, and the City of Newark for their support of the study.
Funding was provided by the North Jersey District Water Supply Commission, the U.S. Geological Survey Cooperative Water Program, and the U.S. Geological Survey Environmental Health Program.
Abstract
This study, completed by the U.S. Geological Survey in cooperation with the North Jersey District Water Supply Commission, was designed to characterize the occurrence and distribution of per- and polyfluoroalkyl substances (PFAS) in surface waters of the nontidal Passaic River Basin in New Jersey that have the potential to affect public-drinking-water quality. In 2025, 37 sites in the Wanaque, Ramapo, Pompton, and Passaic River watersheds were sampled in January, March, July, and September under base-flow conditions and a subset of sites was sampled during two rain events. Samples were analyzed for 40 individual PFAS and total organic carbon and a subset of samples was analyzed for 1,4-dioxane and trace elements. Fifteen PFAS were detected at least once, with individual concentrations ranging from 0.42 to 28 nanograms per liter (ng/L; median, 2.8 ng/L). Perfluorooctanoate (PFOA) and perfluorooctane sulfonate (PFOS) were widespread and detected in 100 and 97 percent of the samples, respectively. Concentrations of PFOA and PFOS ranged from 1.2 to 28 ng/L (median, 7.7 ng/L) and from 0.52 to 12 ng/L (median, 3.8 ng/L), respectively. Generally, concentrations were lower in the Wanaque and Ramapo River watersheds compared to the Pompton and Passaic River watersheds. Concentrations of PFOA and PFOS were highest in July and September when flows were low. During rain events, median concentrations of PFOS were elevated compared to those observed under base-flow conditions, indicating potential inputs from non-point sources. To understand potential drivers of PFAS concentrations, land cover and potential PFAS sources were summarized for each sampling site, and an accumulated wastewater model was used to estimate the percentage of wastewater from upstream municipal and industrial sources in all flowlines of the Passaic River Basin. Developed land, the number of potential sources, and the mean-annual accumulated wastewater percentage were highly correlated with PFAS concentrations and Deciduous Forests were negatively related to concentrations. Data provided by this study can be used by water purveyors and resource managers to make treatment and mitigation decisions to minimize PFAS in local surface waters used as drinking-water resources.
Plain Language Summary
U.S. Geological Survey researchers, in cooperation with the North Jersey District Water Supply Commission, determined that per- and polyfluoroalkyl substances (PFAS) are present in northern New Jersey rivers that are used as drinking-water sources. During their 2025 study, the researchers sampled 37 locations across the Wanaque, Ramapo, Pompton, and Passaic River watersheds. The researchers tested each sample for 40 types of PFAS. Of these, 15 were detected at least once. Two PFAS, perfluorooctanoate (PFOA) and perfluorooctane sulfonate (PFOS), were present in nearly every sample. PFAS concentrations varied by watershed and season. The lowest were detected in the Wanaque and Ramapo River watersheds, and the highest, in the Pompton and Passaic River watersheds. Concentrations of PFOA and PFOS were highest under base-flow conditions in July and September.
Introduction
Per- and polyfluoroalkyl substances (PFAS) are a chemical class consisting of thousands of substances (Glüge and others, 2020) that are a human-health concern owing to environmental prevalence, persistence, toxicity, and human exposures through water and food (Sunderland and others, 2019; Tokranov and others, 2021; Evich and others, 2022). PFAS have been detected in human plasma (Hu and others, 2019) and can be maternally transferred pre- and post-natal (Bach and others, 2016; Blake and Fenton, 2020). Some PFAS have also been linked with human developmental, metabolic, and immune disorders, and certain types of cancers (Barry and others, 2013; Grandjean and Budtz-Jørgensen, 2013; Liu and others, 2018). Potential pathways to drinking-water resources are diverse and can include biosolids application, outdoor products (for example, weatherproof outdoor apparel and artificial turf), industrial releases, firefighting foams, atmospheric deposition, and discharges from wastewater treatment, septic, stormwater, and landfill systems (Masoner and others, 2019; Masoner and others, 2020; Kurwadkar and others, 2022; Salvatore and others, 2022; Sims and others, 2022; Coates and Harrington, 2024). PFAS have been detected globally in surface and groundwater drinking-water resources (Evich and others, 2022), in public drinking-water supplies before distribution (Hu and others, 2016; Domingo and Nadal, 2019; Andrews and Naidenko, 2020; McMahon and others, 2022; Tokranov and others, 2024), and in tapwater across the United States (Smalling and others, 2023).
PFAS regulations have been changing rapidly in the United States as a growing number of State and Federal drinking-water guidelines and benchmarks have been established over the last 20 years (Post, 2021; U.S. Environmental Protection Agency [EPA], 2025a; Interstate Technology & Regulatory Council, 2026a). Ahead of any Federal regulations, some States have adopted their own enforceable regulations (Interstate Technology & Regulatory Council, 2026b). For example, New Jersey adopted enforceable maximum contaminant levels (MCLs) for three PFAS before the release of EPA regulations in 2024 under the Safe Drinking Water Act: perfluorononanoate (PFNA; 13 nanograms per liter [ng/L]) in 2018, and perfluorooctanoate (PFOA; 14 ng/L) and perfluorooctane sulfonate (PFOS; 13 ng/L) in 2020 (New Jersey Department of Environmental Protection [NJDEP], 2025a). Under regulations adopted by the NJDEP, quarterly monitoring of PFOA, PFOS, and PFNA has been required for public community water systems and public non-transient non-community water systems (NJDEP, 2025b). The NJDEP maintains a publicly available list of all MCL violations to keep the public informed on the progress and results of compliance monitoring throughout the state. More than 150 water systems have reported PFAS violations above the 2018 and 2020 New Jersey MCLs (NJDEP, 2024a).
On April 10, 2024, the EPA released the final National Primary Drinking Water Regulation for PFAS, which set MCLs for five individual PFAS: PFOA, PFOS, PFNA, perfluorohexane sulfonate (PFHxS), and perfluoro-2-propoxypropanoate (GenX). The regulations also addressed mixtures of two or more PFAS among PFHxS, PFNA, GenX, and perfluorobutane sulfonate (PFBS) using a Hazard Index MCL to account for the combined effects of co-occurring PFAS in drinking water (EPA, 2025a). The creation of State and Federal guidelines was in response to improved information on potential health effects to sensitive subgroups, such as infants, pregnant women, and immunocompromised individuals, from exposure to PFAS from drinking water (Post, 2021). However, in May 2025, the EPA announced a plan to modify and reissue the PFAS rule in 2026. The proposed rule plans to retain the MCLs for PFOA and PFOS (both 4 ng/L), extend compliance deadlines for water purveyors from 2029 to 2031, and potentially rescind the regulations of and reconsider the regulatory determinations for PFHxS, PFNA, GenX, and the Hazard Index (EPA, 2025b). Despite the potential rescission of several regulations, understanding the concentrations and types of individual PFAS in source waters gives water treatment plant operators information that supports the design of PFAS reduction strategies (for example, add additional treatment technologies or switch to an alternate water source if available) to ultimately meet impending Federal regulations.
In September 2024, the NJDEP released the 2024 New Jersey Statewide Water Supply Plan, which, based on available statewide observational data, explored the potential effects of PFAS on drinking-water supplies owing to their presence as a relatively new threat to both water quality and human health (NJDEP, 2024b). Using data collected by the New Jersey Geological and Water Survey, regions or source waters where PFAS concentrations were considered elevated (above the New Jersey MCLs) were identified based on previously collected data from surface water and groundwater before the implementation of New Jersey drinking-water standards for PFOA, PFOS, and PFNA. The NJDEP identified potential “hot spots” throughout the state based on an elevated density of PFAS samples with concentrations above New Jersey’s regulatory standard (NJDEP, 2024b). The results of this analysis indicate that many of the “hot spots” are in northern New Jersey, with many of the samples exceeding the EPA MCLs for PFOA and PFOS. Several studies in New Jersey have also identified elevated levels of PFAS in source water and treated drinking water throughout the state (Post and others, 2009, 201365; Procopio and others, 2017). For example, several of New Jersey’s aquifers, including the Newark Basin aquifers, the unconsolidated glacial aquifers in northern New Jersey, the Valley and Ridge aquifer systems, and the Potomac-Raritan-Magothy aquifer system, have areas of reported detections of PFOA and PFOS at or above the EPA MCLs (NJDEP, 2024b).
Data previously collected within the Passaic River Basin by the U.S. Geological Survey (USGS) and NJDEP indicate that a comprehensive, basinwide assessment of PFAS in northern New Jersey could better guide future mitigation and management decisions to meet new Federal drinking-water regulations for PFAS. Several large drinking-water utilities, including North Jersey District Water Supply Commission (NJDWSC), Passaic Valley Water Commission (PVWC), Veolia, and New Jersey American Water, pump water from surface-water bodies in the Passaic River Basin; for example, the NJDWSC pumps water from the Ramapo River and from the confluence of the Pompton and Passaic Rivers via the Wanaque South Pump Station, the PVWC pumps from the Passaic River, and Veolia pumps from the Ramapo River (NJDEP, 2024b). Raw water diverted by the Wanaque South Pump station can be taken by Veolia directly from a water main connected to its system or indirectly after it has been pumped into the Wanaque Reservoir.
Purpose and Scope
The quality and sustainability of drinking water are affected by (1) population-driven water demands, (2) increasing contamination of drinking-water resources from development and agricultural practices, and (3) a growing understanding of potential human-health consequences associated with exposure to contaminants like PFAS. For example, runoff during rain events can mobilize contaminants like PFAS on the landscape, particularly in urban areas with complex stormwater systems, combined sewer overflows, and a high percentage of impervious surfaces (Masoner and others, 2019; Kali and others, 2025). Under lower flow conditions, wastewater effluent can contribute a large proportion of the flow (Weisman and others, 2021), increasing the potential risk of PFAS exposure because instream dilution is reduced (Faunce and others, 2023a). Based on data obtained from the USGS Water Data for the Nation (USGS, 2026; table 1.3), PFAS concentrations in northern New Jersey watersheds can exceed the EPA drinking-water standards for PFOA and PFOS established in 2024, indicating that more information on PFAS occurrence, concentrations, and potential sources could help drinking-water treatment plants design PFAS reduction strategies. This study was designed to enhance ongoing water-quality assessments in these watersheds by characterizing PFAS occurrence in surface water at select locations that have the potential to directly affect public drinking-water quality. The overall objective of this study was to complete a spatiotemporal baseline assessment of PFAS in the nontidal Passaic River Basin. Sites were selected in the Wanaque, Ramapo, Pompton, and Upper and Lower Passaic (combined and referred to hereafter as “Passaic”) River watersheds under multiple flow regimes to inform potential drinking-water MCL exceedances as new Federal drinking-water standards are implemented. The specific objectives were to (1) document the occurrence and concentrations of PFAS in the Wanaque, Ramapo, Pompton and Passaic River watersheds under base-flow and elevated-flow conditions, (2) identify and map the presumptive sources of PFAS and predominant land cover in the broader Passaic River Basin, and (3) gather and summarize available historical PFAS data in surface water, groundwater, wastewater, and industrial effluent collected by various agencies throughout the study watersheds. Information provided by this study identified tributaries and (or) river reaches that are primary contributors of PFAS under various flow conditions throughout the year to guide mitigation and resource management decisions designed to meet future drinking-water regulations for PFAS in these watersheds.
Further, at the request of the NJDWSC, opportunistic samples were also collected for trace elements during three base-flow samplings (March, July, and September) and for 1,4-dioxane during the March base-flow sampling event. These data are made available in Romanok and others (2026) and are only briefly described herein because they are outside the overall scope of the study.
Methods
Description of the study area and methods of data retrieval, sample collection, laboratory analysis, and determination of landscape metrics and potential sources are described below, with additional details in appendixes 1 and 2. Briefly, historical data were retrieved from government and non-government organizations to help contextualize the scope of PFOA and PFOS occurrence in the Passaic River Basin. Water-quality samples collected at 37 sites in four Passaic River Basin watersheds were analyzed for 40 PFAS and ancillary data (1,4-dioxane, trace elements, pH, specific conductance, turbidity, and water temperature).
Historical Data Retrieval
A review of available historical PFAS data within the studied watersheds was completed (tables 1, 1.3–1.5). Database queries were limited to publicly available PFAS data in surface and groundwater samples collected within the Passaic River Basin. Analytical methodology, when reported, was obtained through queries or provided with requested information, and not a search criterion. Querying the USGS Water Data for the Nation website (USGS, 2026) resulted in 71 PFAS sample results for 21 surface-water sites and 13 groundwater sites in the study area watersheds (table 1.3). Wastewater treatment plant (WWTP) data from the Passaic River Basin and submitted voluntarily to the NJDEP were obtained through an Open Public Records Act electronic request (https://www.nj.gov/opra/). The request resulted in data from one WWTP in the basin and included data for one influent site, one effluent site, and one effluent surface-water site (table 1.4). The NJDEP New Jersey Pollutant Discharge Elimination System (NJPDES) permitting program results were obtained by querying the NJDEP DataMiner database, and the search was limited to calendar years 2020–24. Results for two discharges to groundwater and one general remediation site were obtained (table 1.5; NJDEP, 2024a). Results of these queries and requests are detailed in table 1, and PFOA and PFOS results are summarized in the “Results” section.
Table 1.
Summary of historical data retrieval results from listed sources for four watersheds of the Passaic River Basin, New Jersey.[Dates are given in month/day/year. EPA, U.S. Environmental Protection Agency; WDFN, Water Data for the Nation; —, not provided; NJPDES, New Jersey Pollutant Discharge Elimination System; OPRA, Open Public Records Act]
Study Area
The Passaic River Basin is in northern New Jersey and southern New York and includes more than 2,400 square kilometers (km2) and a population greater than 2 million people according to the U.S. Census Bureau (2020). Predominant land cover within the basin is about 44 percent developed (including Developed Low, Medium, and High Intensity), and 18 percent was classified as “Developed, Open Space,” 39 percent forest (including Deciduous Forest, Evergreen Forest, Mixed Forest, Shrub/Scrub, and Herbaceous), and 12 percent wetlands (including Woody Wetlands and Emergent Herbaceous Wetlands) (Dewitz, 2023). Within the Passaic River Basin, sampling sites for this study fall within four 10-digit hydrologic unit code (HUC10) scale watersheds: Passaic River (750.96 km2), Wanaque River (274.44 km2), Ramapo River (417.03 km2), and Pompton River (289.32 km2) (USGS, 2025).
Four geospatial scales were used in this study and are shown in figure 1:
-
• Local catchment: National Hydrography Dataset Plus Version 2.1 (NHD; EPA, 2012) catchments were used to summarize potential PFAS sources and land cover for the sampling sites.
-
• Upstream watershed: Upstream NHD catchments contributing to and including the local catchment were used in landscape characteristic summaries.
-
• HUC10 watershed: Larger watersheds at the 10-digit HUC scale were used as the study areas for the sampling sites (USGS, 2025).
-
• Passaic River Basin: The broader Passaic River Basin was used as the geospatial study area to capture upstream landscape characteristics and develop an accumulated wastewater (ACCWW) model layer.
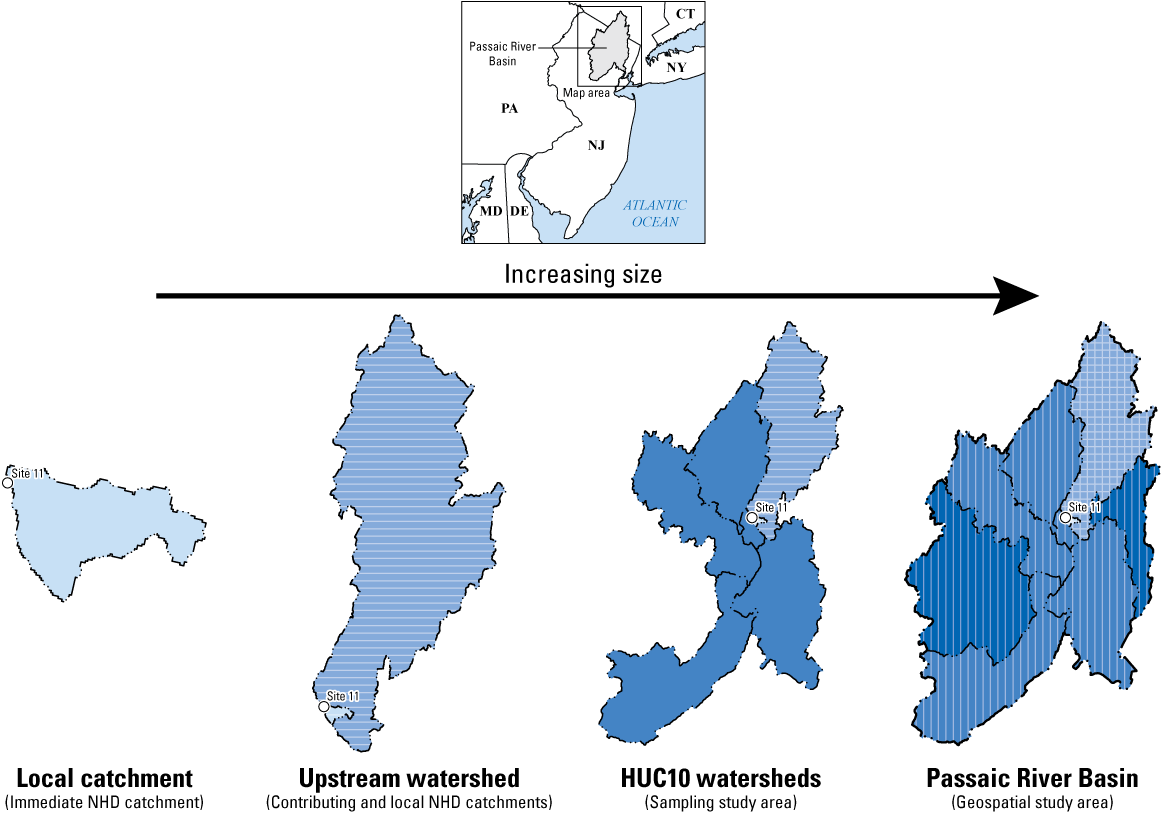
Conceptual diagram depicting the different spatial scales discussed throughout the report, ranging from a local NHD catchment (U.S. Environmental Protection Agency, 2012) to the Passaic River Basin (U.S. Geological Survey, 2025), with a U.S. Geological Survey station (USGS-01387935; Site 11) for reference. Additional site information is in tables 2 and 1.1. and available from U.S. Geological Survey (2026). [CT, Connecticut ; DE, Delaware; HUC10, 10- digit hydrologic unit code; MD, Maryland; NHD, National Hydrography Dataset Plus Version 2.1; NJ, New Jersey; NY, New York; PA, Pennsylvania]
Sampling Site Selection
A total of 37 sampling sites (table 2) were selected within the nontidal Passaic River Basin in collaboration with the NJDWSC and included 5 sites in the upper portion of the Wanaque River watershed above the Wanaque Reservoir, 9 sites in the Ramapo River watershed, 8 sites in the Pompton River watershed, and 15 sites in the Passaic River watershed (fig. 2). The sampling sites were comprised of tributaries and main-channel river locations. Selection of sites downstream from known point sources, sites at the confluence of major tributaries, and sites near drinking-water pump stations was prioritized (fig. 2). Additional considerations in site selection included ease of access to the location for sampling, safety, and the ability to collect a streamflow measurement or to leverage an existing USGS streamgage.
Table 2.
List of sites sampled for a study completed in the Passaic River Basin, New Jersey, 2025.[Additional station information is available from U.S. Geological Survey (2026). USGS, U.S. Geological Survey NJ, New Jersey; ft, feet; DS, downstream; Co, County; Rt, Route; nr, near; US, upstream; Bk, Brook; Rd, Road; Ave, Avenue; R, river; Chnl, Channel; bl, below; Trib, tributary; QW, water quality; CR, County Route; div, diversion]
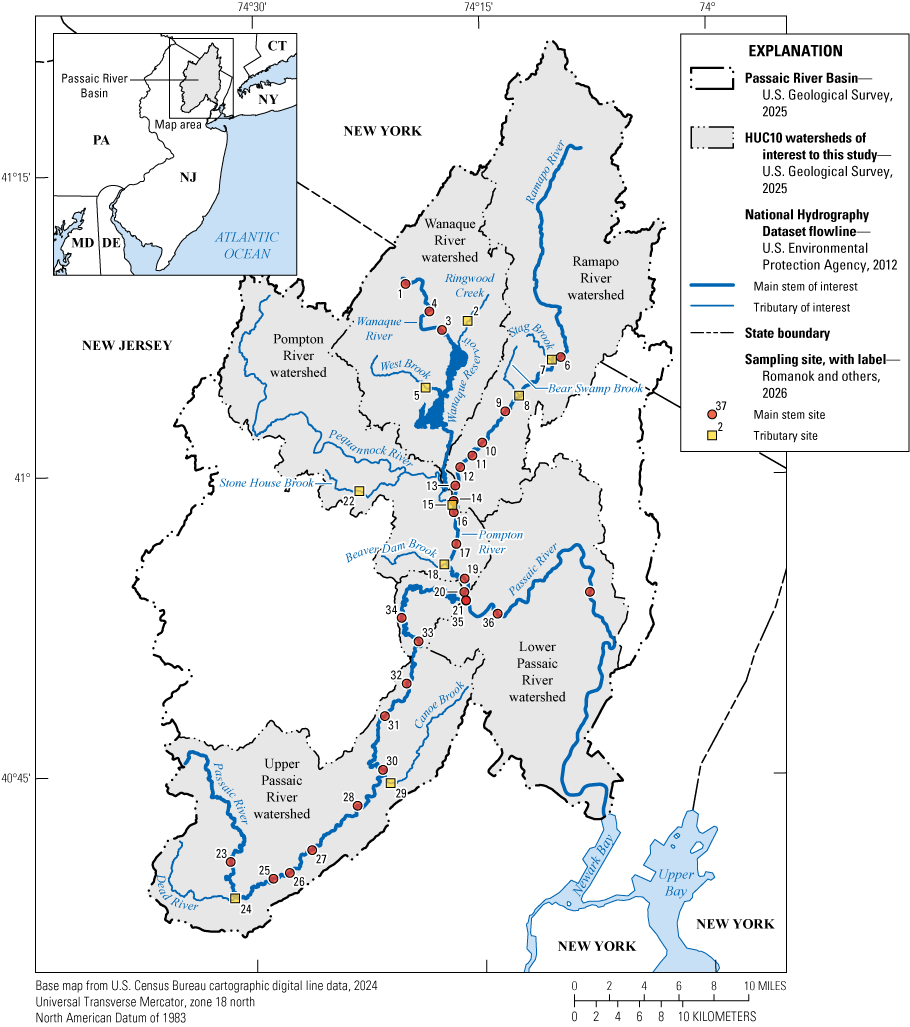
Map of the study area showing 37 sampling sites, the 10-digit hydrologic unit code (HUC10) watershed boundaries used in this study, the Passaic River Basin boundary, and flowlines and waterbodies of interest. Additional site information is in tables 2 and 1.1. [CT, Connecticut; DE, Delaware; MD, Maryland; NJ, New Jersey; NY, New York; PA, Pennsylvania]
Sample Collection
Surface-water-quality samples were collected at 37 sites in the Wanaque, Ramapo, Pompton, and Passaic River watersheds in January, March, July, and September 2025 as close to base-flow conditions as possible. The USGS defines “base flow” as, “sustained, low flow in a stream” (USGS, 2014). To determine when sampling should occur, weather radar and USGS hydrographs within the study area were monitored for periods of no rain and sustained lower flow. In addition to base-flow sampling, two additional sampling events targeted higher stream flows. In July 2025, 27 sites were sampled after a rain event when the rivers were just past peak streamflow; this sampling took place a week after a regularly scheduled base-flow sampling event. In December 2025, samples were collected from nine main-stem river sites during the rising limb of the hydrograph during a rain event. Samples were only collected at sites that could be safely accessed for sample collection and (or) streamflow measurements under existing weather conditions. Sampling event information is summarized in table 3. Refer to table 1.1 and Romanok and others (2026) for more sampling details.
Table 3.
Summary of sampling events in the Passaic River Basin, New Jersey, 2025.[Additional site information is in tables 2 and 1.1. in., inch; n.d., no data]
Water-quality samples were collected directly into the sample containers (grab samples) from the center of flow using standard methods: while wading or from a bridge as conditions permitted (USGS, 2018). A clean stainless-steel weighted-bottle sampler attached to a clean length of polyethylene rope was used for sample collection from a bridge. Surface-water samples were collected for PFAS and total organic carbon (TOC) during all six sampling events. At the request of the cooperator, opportunistic samples were collected for trace elements during three base-flow samplings (March, July, and September) and for 1,4-dioxane during the March base-flow sampling event (table 4; Romanok and others, 2026).
For PFAS analysis, whole-water samples were collected into two pre-cleaned 500-milliliter (mL) high-density polyethylene (HDPE) screw-cap bottles after three rinses with stream water, placed in a cooler on ice in the field, then transported to the New Jersey Water Science Center where they were stored frozen at −20 degrees Celsius (°C) until shipment to Eurofins Cleveland Laboratory (Barberton, Ohio). Samples for TOC were collected in 125-mL pre-cleaned, baked, amber-glass bottles and preserved with 2 mL of 1:1 OmniTrace hydrochloric acid (samples were not field rinsed). TOC samples were chilled on ice in the field until returned to the New Jersey Water Science Center and then refrigerated until their transport to the NJDWSC laboratory, Wanaque, New Jersey, where analysis was performed. Surface-water samples for trace elements were collected in a 500-mL HDPE screw-cap bottle, preserved with 2 mL of 7.7 normality nitric acid, placed on ice in the field until returned to the New Jersey Water Science Center and then refrigerated until their transport to the NJDWSC laboratory for analysis. Samples for 1,4-dioxane were collected in 500-mL pre-cleaned, baked, amber-glass bottles prepared with sodium sulfite and sodium bisulfate preservative, placed on ice in the field until returned to the New Jersey Water Science Center and then refrigerated until being shipped on ice to ALS Environmental Laboratories (Middletown, Pennsylvania) where analysis was performed. Field water-quality parameters were recorded in situ during the sampling events using a YSI EXO2 multi-parameter sonde. This included water temperature, dissolved oxygen, pH, specific conductivity, and turbidity. During the July rain event only, turbidity was alternatively measured at 13 sites with a Hach benchtop turbidimeter (nephelometric turbidity ratio units) from a grab sample collected in the stream.
Table 4.
Matrix showing the constituents collected during each sampling event in the Passaic River Basin, New Jersey, 2025.[PFAS, per- and polyfluoroalkyl substances; X, samples collected for analysis of listed constituent; TOC, total organic carbon; —, no sample collected for listed constituent]
Streamflow at the time of sample collection was determined using one of several methods. If the sampling site was at an active USGS continuous discharge streamgage, the approved computed streamflow from the streamgage at the time of the sample collection was used. If the sampling site was at a USGS station without a streamgage, a discrete discharge measurement was made using an acoustic Doppler current profiler or acoustic Doppler velocimeter to determine the streamflow at the time of sample collection. If a discrete measurement of discharge at an ungaged site was not made, the streamflow associated with the sample was calculated by adjusting the calculated discharge from an active USGS continuous records streamgage to the sampling site by the ratio of the drainage area of the streamgage to the drainage area of the sampling site. This method has an inherent increase in uncertainty because it relies on several assumptions, for example, that the watershed is contributing a relatively consistent combined base flow and runoff at each location and does not include any streamflow regulation, alteration, or notable storage effects in the reach. Estimated qualifiers were applied to certain discharge values because of the effect of backwater on the ability to calculate or measure discharge. The streamflow measurements described above apply methods of measuring and calculating discharge as described in Rantz (1982) and Turnipseed and Sauer (2010). All streamflow results are described in table 1.2 and in Romanok and others (2026).
Laboratory Analysis
For this study, PFAS samples were analyzed at the Eurofins Environmental Testing Laboratory using EPA Method 1633 (EPA, 2024a). The entire sample was extracted onto a pre-conditioned WAX solid-phase-extraction (SPE) cartridge using a pre-cleaned vacuum manifold at 5 milliliters per minute. The SPE cartridge was dried and eluted with 5 mL of 1 percent methanolic ammonium hydroxide. After extraction, 25 microliters of concentrated acetic acid were added to each sample extract. The extract was vortexed before 10 milligrams of carbon were added. Finally, the extraction tube was mixed, vortexed again for 30 seconds, then centrifuged at 2,800 rotations per minute for 10 minutes. All sample extracts were analyzed by liquid chromatography tandem mass spectrometry in multiple reaction monitoring mode. Method detection limits (MDL) ranged from 0.38 to 6.8 ng/L (Romanok and others, 2026, table 3). Values above the MDL, but below the reporting levels, are reported by the laboratory as estimated with an “E” code. These data were considered “detections,” and the value was included in all summary statistics. For a full list of compounds analyzed for this study, refer to Romanok and others (2026).
TOC analysis was performed within 10 days of sample collection at the NJDWSC laboratory following Standard Method 5310B (Lipps and others, 2017). After field preservation, the samples were homogenized. The acidified samples were sparged with high-purity air to eliminate ion chromatography components before measuring the total carbon (TC) concentration, which is defined as non-purgeable organic carbon; the measurement obtained is also generally called TOC. TOC was measured by injecting the sample into a TC combustion tube filled with a platinum oxidation catalyst and heated using a 680 °C furnace. Carrier gas, high-purity air, was added at a controlled flow rate of 150 milliliters per minute. After the sample’s introduction to the combustion tube, the TC component in the sample decomposed, producing carbon dioxide. After decomposition, the carrier gas containing the combustion product flowed through the combustion tube. An ion chromatography reaction vessel was cooled and dried via a dehumidifier, and sodium hydroxide pellets were added to eliminate bacterial growth as needed. The sample then went through a halogen scrubber into a sample cell set in a non-dispersive infrared gas analyzer where carbon dioxide is detected. The non-dispersive infrared gas analyzer output a detection signal that generated a peak, the area of which was calculated via a data processor.
Trace element samples were collected in a 500-mL HDPE bottle and were analyzed at the NJDWSC laboratory by EPA Method 200.8 (Creed and others, 1994) using a Perkin Elmer NexION 1000 Series Inductively Coupled Plasma-Mass Spectrometry instrument. After field acidification, samples were held for 24 hours and a pH of less than 2 was verified before analysis. Samples were then digested using nitric and hydrochloric acid. The sample was converted to an aerosol by a nebulizer, then introduced into a plasma via a peristaltic pump tube. In the plasma, the energy transfer processes caused desolvation, atomization, and ionization. Perkin Elmer Syngistix software (Perkin Elmer, 2026) was used to process and report results.
Samples for mercury analysis were collected in a 500-mL HDPE bottle and were acidified in the field to a pH less than 2. After 24 hours, the pH was checked and verified to have remained at less than 2. Mercury analysis followed EPA Method 245.1 (O’Dell and others, 1994) using a Perkin Elmer FIMS 100 atomic absorption instrument with an autosampler at the NJDWSC laboratory. A portion of each sample was digested in a 50-mL Digitube using a block digester at 95 °C for 2 hours and then aspirated into a mixing cell. Tin dichloride was then added to generate mercury as cold vapor. The vapor was passed on to a Cold Vapor Atomic Absorption analyzer fitted with an electrically heated 10-centimeter cell, then absorption was measured. Perkin Elmer Syngistix software (Perkin Elmer, 2026) was used for the processing and reporting of results.
1,4-dioxane was analyzed using EPA Method 522 (Munch and Grimmet, 2008) at the ALS Environmental Laboratory. Samples were extracted by SPE and eluted with dichloromethane before a tetrahydrofuran-d8 reference standard was added. The samples were subsequently dried and analyzed using gas chromatography and mass spectrometry with an MDL of 0.023 micrograms per liter (µg/L) and a reporting limit of 0.07 µg/L. Values above the reporting limit and below the MDL were reported as estimated with a “J” code.
Quality Assurance and Quality Control
Quality-assurance and quality-control samples were collected and reviewed for each sampling event and included field blanks, laboratory blanks and spikes, and (or) stable isotope surrogates. Field personnel collected the following quality-control blanks:
-
• 15 for TOC (base-flow conditions: 5 in March, 3 in July, and 3 in September; rain events: 2 in July and 2 in December)
-
• 20 for PFAS (base-flow conditions: 6 in January, 4 in March, 3 in July, and 3 in September; rain events: 2 in July and 2 in December)
-
• 6 for trace elements (base-flow conditions: 3 in July and 3 in September)
Field blank collection procedures matched the procedures used for the collection of environmental samples but used organic-free blank water. One low-level detection of TOC (0.504 mg/L) was observed in the field blank collected during the September sampling event at USGS-01384000 (Site 3), which was just above the reporting limit of 0.500 mg/L and not within the range of detected TOC concentrations (1.35 to 9.93 mg/L). One low-level detection of 6:2 fluorotelomer sulfonate (6:2 FTS) was reported during the January sampling event at USGS-01379200 (Site 24); the concentration was above the MDL but below the reporting limit and was reported as estimated. However, 6:2 FTS was not detected in any environmental sample during that sampling event, so no values required censoring. Trace element analysis of the field blanks detected low levels of mercury in three field blanks collected in September. Environmental detections at or below twice the associated field blank concentrations were censored to non-detect. This required censoring to non-detect for all mercury detections (18 total, all from September) for the dataset.
Laboratory quality assurance included isotope dilution standards for PFAS. The median isotope dilution standard percentage recovery for all sampling rounds was 92.2 percent (ranging from 8.98 to 170 percent, 25th and 75th percentiles are 88.6 and 96 percent, respectively). Refer to table 4b in Romanok and others (2026) for the sampling event summary table. Other laboratory quality assurance performed included method blanks (no detections for all sampling rounds) and laboratory spike samples (all recovery percentages were within the recovery percentage limits as defined by the laboratory). The USGS reviewed these data and no issues were identified.
Landscape Metrics and Potential PFAS Source Characterization
For this study, landscape metrics, including land cover, catchment size, and the number of catchments in the upstream watershed and potential PFAS sources, were obtained to help characterize areas that could be contributing PFAS to the environment. Data were analyzed for the broader Passaic River Basin to characterize the influence of areas upstream from the sampling area watersheds. Land-cover data were downloaded from the National Land Cover Database (NLCD) 2021 (Dewitz, 2023), and potential PFAS sources were downloaded from (1) EPA Enforcement and Compliance History Online (ECHO) PFAS Analytics Tools database (EPA, 2025c), (2) NJPDES (NJDEP, 2025c), and (3) the [New York] State Pollutant Discharge Elimination System (SPDES; New York State Department of Environmental Conservation, 2025). For more information on the potential source datasets used in the study, as well as the processing steps, refer to appendix 2.
Landscape metrics were evaluated at both the local catchment and the upstream watershed scales using NHD (EPA, 2012). Local catchment size for the sampling sites ranged from 0.0117 to 21.5631 km2, and upstream watershed size ranged from 3.476 to 2,109.229 km2. Local catchments for the sampling sites were identified using a spatial join in ArcGIS Pro (version 3.5.3; Esri, 2025). Upstream watersheds for the sampling sites were identified utilizing the “nhdplusTools” (version 1.4.2; Blodgett and Johnson, 2022) package of the R Statistical Software (version 4.5.1; R Core Team, 2021), which uses NHD flowline data to identify all contributing NHD catchments. These contributing catchments, including the local catchment, were merged to create one upstream watershed per sampling site. The resulting local catchment and upstream watershed boundaries were used to summarize the land-cover categories provided in the 2021 NLCD 30-meter raster dataset. The NLCD was used to ensure consistency between state lines because the Passaic River Basin falls in New Jersey and New York. The “Zonal Histogram” tool was used to create these summaries in ArcGIS Pro. Land-cover category descriptions can be found in table 5.
Table 5.
Description of National Land Cover Database (NLCD) categories that exist within the Passaic River Basin, New Jersey.[Descriptions from Dewitz, 2023. %, percent]
Potential PFAS sources were also summarized at the local catchment and upstream watershed scales for each sampling site. Before calculating the summaries, potential PFAS source records were assessed to identify and remove duplicates within and between datasets to ensure that PFAS sources were not counted more than once. Where multiple industrial categories were identified at a single facility in the ECHO database, a single point, or “potential source,” was retained, without regard to category. State data downloads (NJPDES and SPDES) were parsed only to include permit types relevant to PFAS (table 2.1). Because a single facility within the state datasets may hold more than one permit type owing to varying discharge methods, each permit was counted as an individual source. Once each dataset was checked for duplicates and cleaned, the ECHO data were compared to the state data. Where a permit location existed in both the ECHO and the NJPDES or SPDES datasets, the state record was kept owing to the higher level of detail provided, and the ECHO record was removed. Counts were executed using the “Summarize Within” tool in ArcGIS Pro. More information about this process can be found in appendix 2, with details about permits described in table 2.1.
Accumulated Wastewater Model
To understand water reuse broadly, the previously developed ACCWW model (Barber and others, 2019, 20254; Faunce and others, 2023a) was applied to the Passaic River Basin to quantify the percentage of streamflow in a flowline that was comprised of municipal and industrial WWTP effluent during various times of the year. The ACCWW percentage is equal to the sum of all upstream wastewater inputs divided by the streamflow of an individual flowline multiplied by one hundred. Because wastewater effluent is considered a likely source of PFAS to the environment (Barber and others, 2025), the ACCWW percentage can be used to identify potential “hot spots” of contamination for future study or to inform management actions. Code developed from algorithms to analyze location and point-discharge data from WWTPs (EPA, 2024b), travel time, and upstream and downstream connections from NHD flowline data were used to derive mean-monthly (mean-August or mean-April) and mean-annual ACCWW percentages (Faunce and others, 2023a,b21; Barber and others, 2025). The ACCWW percentage was then calculated as the percentage of accumulated (upstream) wastewater to total streamflow (Faunce and others, 2023a). Mean-monthly (12 values per flowline) and mean-annual (one value per flowline) streamflow were obtained from the NHD Enhanced Unit Runoff Method and reflect normalized data from 1971 to 2000 (EPA, 2012). More information about the input data sources and the ACCWW model archive is available in Romanok and others (2026).
Statistical Analysis and Yield Calculations
Cumulative (∑) PFAS concentrations were calculated for each sample by summing the concentrations of all detected compounds. Summary statistics (median and ranges) were calculated for PFOA, PFOS, and ∑PFAS concentrations in each watershed by month under base-flow conditions and for each rain event. All non-detects for PFOS (2.7 percent, or 5 of 181 samples) were replaced with zero before applying summary statistics and linear models; for PFOA and ∑PFAS, there were no non-detects. Statistical analyses were performed using R Statistical Software (version 4.5.2; R Core Team, 2021) and the “stats” (R Core Team, 2013), “emmeans” (Lenth, 2025), and “corrplot” (Wei and Simko, 2024) packages. Spearman’s rank correlation was used to evaluate potential correlations among water-quality parameters, potential sources, mean-annual ACCWW percentage, and land-cover metrics with median ∑PFAS concentrations and median concentrations of PFOA and PFOS. Median concentrations of PFOA, PFOS, and ∑PFAS were calculated using only base-flow sampling events. The linear association between median PFOA, PFOS, and ∑PFAS concentrations and significant geospatial predictor variables identified by the correlation analysis was graphed in SigmaPlot (version 16; Grafiti LLC, 2026) to assess the strength and linearity of the relationship. For graphing purposes, concentrations were log-transformed to address normality concerns.
Linear models were used to determine differences in mean concentrations of PFOA and PFOS (1) between the four watersheds at the HUC10 level, (2) between two seasonal groupings (winter and spring [represented by January and March] against summer and fall [represented by July and September]) under base-flow conditions, (3) between the July base-flow and rain-event samples across all watersheds, (4) between the July and December rain events at the eight sites sampled during both events, and (5) between the rain-event and base-flow samples across all sites. Estimated marginal means were calculated and pairwise comparisons for each of the five groups listed above were performed, including a Bonferroni correction (p<0.05), to identify significant differences.
PFAS yields were calculated to normalize each site to the watershed drainage area at both the local catchment and upstream watershed scale. Yields were calculated from measured PFAS concentrations, drainage area, and instantaneous discharge, reported in Romanok and others (2026), by converting flow to liters per day and concentrations to grams using the following equation:
whereY
= yield in grams per day per square kilometer (g/d/km2),
C
= PFAS concentration in nanograms per liter (ng/L),
Q
= instantaneous discharge in cubic feet per second (ft3/s), and
DA
= drainage area in square kilometers (km2).
Results
Summary of the historical data, streamflow, PFAS concentrations, and ancillary data in surface-water-quality samples are described in the following sections.
Summary of Historical Results
A review of all the groundwater and surface water data collected within the study area indicated that, with few exceptions, concentrations of PFOA were greater than PFOS (table 1.3; USGS, 2026). Where PFOS was greater, the concentrations were within the same magnitude. In five instances, PFAS samples collected by the USGS from 2020 to 2023 were at or near sites sampled in 2025 for this study (table 6). Differences in median concentrations of PFOA and PFOS for samples collected in 2020 to 2023, and those collected in 2025 at all five sites, were within ±3 ng/L of one another (table 6).
Table 6.
Comparison of historical perfluorooctanoate (PFOA) and perfluorooctane sulfonate (PFOS) concentrations, in nanograms per liter, collected from select sampling sites in the Passaic River Basin, New Jersey, from 2020 to 2023 and in 2025.[Data are from Romanok and others (2026). Additional site information is in tables 2 and 1.1. Their locations are shown in figure 2.]
Through the Open Public Records Act request, we obtained municipal wastewater influent and effluent sample data from 2021 to 2024 for the Pompton River (table 1.4). PFOA was detected in 10 of the 12 influent samples, and the median concentration was 15.0 ng/L. PFOS was detected in all but 3 samples, and the median concentration was 10.0 ng/L. The samples with no detections had elevated reporting limits (greater than 16 ng/L), which could explain the non-detects. Similarly, PFOA was detected in all 13 reported effluent samples, and the median concentration was 16.8 ng/L; PFOS was detected in all but one of the 13 samples, and the median was 6.80 ng/L. These results are consistent with concentrations of PFOA and PFOS detected in samples collected at Sites 20 and 21, both downstream from a WWTP. Median concentrations of PFOA at Sites 20 and 21 were 9.20 and 9.25 ng/L, respectively, and for PFOS, 6.20 and 6.05 ng/L, respectively.
Thirteen groundwater samples within this study area were collected by the USGS in 2022 (table 1.3; USGS, 2026). PFOA was detected in 85 percent of the samples. The concentrations ranged from below the reporting limit to 54.0 ng/L, the median concentration was 15.5 ng/L, and all detections exceeded 4 ng/L. PFOS was detected in 69 percent of the samples with concentrations ranging from below the reporting limit to 26.0 ng/L, the concentration median was 4.60 ng/L, and 53 percent of the samples exceeded 4 ng/L.
Querying the NJPDES database identified five permitted dischargers that were monitoring and reporting PFAS in effluent (table 1.5). Based on this query, at least one WWTP discharges effluent to the groundwater in the watershed. The median PFOA concentration in samples reported from 2023 and 2024 was 13.0 ng/L, and the median concentration of PFOS was 6 ng/L. One additional NJPDES permittee was noted as discharging to groundwater in the watershed from 2022 to 2024, with corresponding median sample concentrations of 9.70 ng/L and 5.20 ng/L for PFOA and PFOS, respectively. Two permitted surface-water dischargers had PFAS data available. The listed concentrations of PFOA and PFOS were low or not detected (table 1.5).
Streamflow
Streamflow was measured or computed along with 175 samples collected in this study (table 1.2). There was no streamflow for USGS-01383905 (Site 4) because the sample was collected near a boat launch and was not conducive to measuring. At two small tributary sites, USGS-0138752050 (Site 7) in September 2025 and Site 3 in January 2025, there was no flow. During the January sampling, the presence of ice affected streamflow measurements and computations, and resulted in several estimated streamflow values; these values are noted in table 1.2. For USGS-01389490 (Site 36), PVWC provided estimated streamflows for the diversion channel where samples were collected (Romanok and others, 2026). Sampling during January, March, July, and September aimed to be as close to base flow as possible.
Historical streamflow data were compared with the reported streamflow from this study for 11 sites where long-term mean-monthly streamflow data were available (table 7). Streamflow from this study ranged from 16 to 97 percent of the mean-monthly streamflow for the period of record listed, and from 31 to 159 percent of the monthly-mean streamflow for 2025. Median streamflow was highest in the Passaic River watershed, followed by (in descending order) the Pompton, Ramapo, and Wanaque River watersheds. Generally, streamflow in January (median, 95.0 ft3/s) and March (median, 242 ft3/s) was greater than that in July (median, 62.0 ft3/s) and September (median, 23.5 ft3/s).
In July, there were two sampling events, one under base-flow conditions and one after an estimated 1 to 4 inches of precipitation in the Passaic River Basin. The USGS computed streamflow for 26 of the 27 sites sampled during the July rain event, approximately 8 to 12 hours after the event. The computed streamflow values were 2 to 192 times higher than those reported during the base-flow sampling (median, 9 times higher) (table 1.2). In December, nine main-stem river sites were sampled as streamflow increased to help characterize PFAS concentrations from active overland runoff (fig. 3). Measured streamflow during the December rain-event sampling ranged from 55 percent less than the median base-flow samples (from January, March, July, and September) to 99 percent greater than the median base-flow samples (table 1.2).
Table 7.
Monthly-mean and mean-monthly streamflow, when available, for sites sampled at or near base-flow conditions, in the Passaic River Basin, New Jersey, 2025.[Historical streamflow data are from the U.S. Geological Survey (2026). Additional site information is in tables 2 and 1.1. Medians of the mean-monthly streamflow values were calculated for the years listed. Monthly-mean streamflow for 2025 was reported, as well as the computed streamflow from this study. ft3/s, cubic feet per second; —, no value]
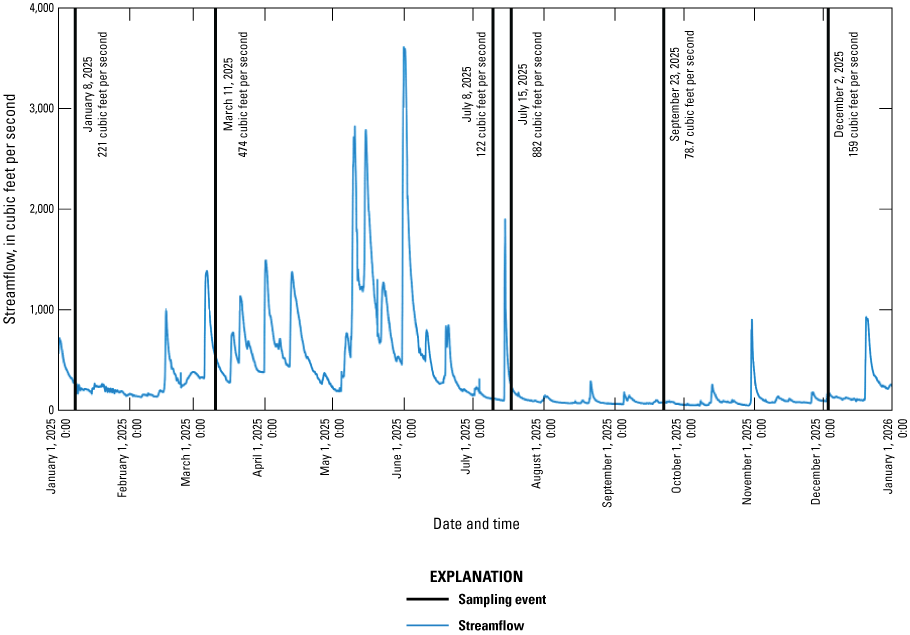
Hydrograph for the study period of record, January–December 2025, for Site 16. Data are from U.S. Geological Survey (2026) and Romanok and others (2026). Additional site information is available in tables 2 and 1.1.
PFAS in Surface Waters of the Passaic River Basin
Surface-water-quality samples were collected for PFAS and ancillary constituents under base-flow and rain-event conditions. Forty PFAS, 17 trace elements, TOC, 1,4-dioxane, and water-quality parameters (pH, specific conductance, water temperature, dissolved oxygen, and turbidity) were analyzed in samples collected from January to December 2025. All results are reported in Romanok and others (2026) and summarized below.
Base-Flow Sampling
Four base-flow sampling events were completed in January, March, July, and September and yielded 145 samples within the study area. Samples could not be collected on three occasions (table 1.1) owing to a lack of flow at the sampling sites and a misidentified site. Of the samples collected, 100 percent had at least one or more PFAS detected. Of the 40 individual PFAS analyzed, 15 were detected at least once; those with the highest frequencies of detection (greater than 55 percent) were PFOA, PFOS, perfluorohexanoate (PFHxA), perfluoropentanoate (PFPeA), PFHxS, PFBS, perfluorobutanoate (PFBA), and PFNA (table 8). Other compounds detected included perfluorodecanoate (19 percent), GenX (17 percent), perfluoropentane sulfonate (PFPeS; 8.8 percent), perfluoroundecanoate (3.9 percent), 6:2 FTS (0.55 percent), and 3-perfluoroheptylpropanoate (0.55 percent). Individual PFAS concentrations ranged from 0.42 to 28 ng/L with a median of 2.8 ng/L (interquartile range [IQR], 1.5–4.8 ng/L). Concentrations of PFOA and PFOS ranged from 1.2 to 28 ng/L (median, 7.7 ng/L) and from 0.52 to 12 ng/L (median, 3.8 ng/L), respectively. ∑PFAS concentration per site ranged from 1.3 to 78.4 ng/L and varied by watershed (table 9).
Table 8.
Summary of the most frequently detected individual per- and polyfluoroalkyl substances (PFAS; in percent) collected under base-flow conditions in four watersheds of the Passaic River Basin, New Jersey, 2025.[Data are from Romanok and others (2026). PFOA, perfluorooctanoate; PFOS, perfluorooctane sulfonate; PFHxA, perfluorohexanoate; PFPeA, perfluoropentanoate; PFHpA, perfluoroheptanoate; PFHxS, perfluorohexane sulfonate; PFBS, perfluorobutane sulfonate; PFBA, perfluorobutanoate; PFNA, perfluorononanoate]
Wanaque River Watershed
Nineteen samples were collected from five sites within the Wanaque River watershed at or near base-flow conditions (table 3). At least two PFAS were detected in each sample, with individual concentrations ranging from 0.47 to 5.8 ng/L per site and a median of 1.6 ng/L (IQR, 0.98–2.6 ng/L). The number of PFAS detected and median ∑PFAS concentrations varied by season, with the lowest concentrations and detections observed in January (table 9). PFOA was present in all samples. The seven other most frequently detected PFAS were present in more than 79 percent of the samples (table 8). Concentrations of PFOA and PFOS ranged from 2.0 to 5.8 ng/L (median, 5.0 ng/L) and from 1.3 to 3.4 ng/L (median, 2.7 ng/L), respectively.
Table 9.
Summary statistics of cumulative concentrations of per- and polyfluoroalkyl substances (PFAS) and the number of individual PFAS detected in surface water under base-flow and rain-event conditions in four watersheds of the Passaic River Basin, New Jersey, 2025.[Data are from Romanok and others (2026). ∑, cumulative; ng/L, nanograms per liter; Num., number; NA, not applicable; NS, no sample collected]
Ramapo River Watershed
Thirty-four samples were collected from nine sites within the Ramapo River watershed at or near base-flow conditions (table 3). At least one PFAS was detected in each sample, with individual concentrations ranging from 0.45 to 12 ng/L per site and a median of 2.6 ng/L (IQR, 1.3–4.6 ng/L). The number of PFAS detected ranged from 1 to 10 and varied by site and season (table 9). The median ∑PFAS concentrations varied by season, with the lowest concentrations observed in January and March (table 9). PFOA was present in all samples, and the seven other frequently detected PFAS were present in more than 74 percent of samples (table 8). Concentrations of PFOA and PFOS ranged from 1.5 to 11 ng/L (median, 4.6 ng/L) and 0.52 to 12 ng/L (median, 3.3 ng/L), respectively, and varied seasonally and spatially, with higher concentrations observed in the main stem compared to the two tributary sites (Site 7 and USGS-01387700 [Site 8]; fig. 2).
Pompton River Watershed
Thirty-two samples were collected from eight sites within the Pompton River watershed, at or near base-flow conditions (table 3). Eight PFAS were detected in 100 percent of the samples (table 8), with individual concentrations ranging from 0.55 to 22 ng/L and a median of 2.6 ng/L (IQR, 1.6–4.7 ng/L). The number of PFAS detected ranged from 8 to 10, depending on site and season, and the median ∑PFAS concentrations varied by season, with the lowest concentrations observed in March (table 9). Concentrations of PFOA and PFOS were 4.1−22 ng/L (median, 9.0 ng/L) and 1.8−8.7 ng/L (median, 4.6 ng/L), respectively. Concentrations of PFOA varied seasonally and spatially, and PFOS concentrations were relatively consistent across the watershed, with some variation seasonally. For PFOA, USGS-01388600 (Site 17; fig. 2) had the highest observed concentrations in January (17 ng/L), and USGS-01388720 (Site 18; fig. 2) had the highest concentrations in March, July, and September (12, 17, and 22 ng/L, respectively).
Passaic River Watershed
Sixty samples were collected from 15 sites within the Passaic River watershed at or near base-flow conditions (table 3). Seven PFAS were detected in 100 percent of the samples (table 8) with individual concentrations ranging from 0.42 to 28 ng/L and a median of 3.0 ng/L (IQR, 1.7−6.1 ng/L). The number of PFAS detected ranged from 8 to 11, depending on site and month, and median ∑PFAS concentrations varied by season, with the lowest concentrations observed in January and March (table 9). Concentrations of PFOA and PFOS ranged from 5.5 to 28 ng/L (median, 11 ng/L) and 2.3 to 9.8 ng/L (median, 4.1 ng/L), respectively. Median ∑PFAS concentrations and detection frequencies remained similar and had little seasonal variability. Concentrations of PFOA varied seasonally and spatially, with higher concentrations observed in July and September. Samples from USGS-01379530 (Site 29; fig. 2) contained the highest concentrations of PFOA across all four sampling events. Concentrations of PFOS were generally highest in July, except at USGS-01379200 (Site 24; fig. 2), where concentrations were highest in January.
Rain-Event Sampling
Thirteen individual PFAS were detected at least one time during the July 2025 rain-event sampling, with individual concentrations among the 27 sites ranging from 0.39 ng/L GenX (USGS-01387905 [Site 10]; fig. 2) to 16 ng/L PFOA (USGS-01388720 [Site 18]; fig. 2) and a median of 2.4 ng/L. Ten individual PFAS were detected at least one time among the nine sites sampled in December 2025, with individual concentrations ranging from 0.50 ng/L PFPeS (USGS-01387940 [Site 12]; fig. 2) to 9.8 ng/L PFOS (USGS-01388000 [Site 13]; fig. 2) and a median of 3.4 ng/L. Concentrations of PFOA and PFOS in July ranged from 3.8 to 16 ng/L (median, 8.5 ng/L) and from 0.80 to 9.0 ng/L (median, 5.2 ng/L), respectively. In December, they ranged from 5.7 to 9.1 ng/L (median, 7.9 ng/L) and 3.8 to 9.8 ng/L (median, 5.4 ng/L), respectively. Six compounds were observed in 100 percent of the samples in July: PFOA, PFOS, PFHxA, PFBA, perfluoroheptanoate, and PFNA. In December, seven compounds—the same as July plus PFPeA—were observed in 100 percent of the samples. ∑PFAS concentrations across all watersheds ranged from 7.8 (Site 8) to 49.3 ng/L (Site 29), with a median of 38.7 ng/L in July; and in December, ranged from 31.4 (USGS-01379500 [Site 28]; fig. 2) to 41.2 ng/L (Site 12), with a median of 34.8 ng/L. No samples were collected from the Wanaque River watershed in December.
Water-Quality Parameters, Total Organic Carbon, Trace Elements, and 1,4-Dioxane
Water-quality parameters, including TOC, varied spatially and seasonally, and are briefly summarized in this section. Refer to Romanok and others (2026) for the full dataset. Median specific conductance measurements in all watersheds ranged from 31.5 µS/cm in the Ramapo River watershed to 943 µS/cm in the Passaic River watershed. Specific conductance was highest during July and September (527 and 616 µS/cm, respectively) and lowest in January and March (453 and 402 µS/cm, respectively). The highest median specific conductance was observed during the December rain event (636 µS/cm), and the lowest was during the summer rain event (278 µS/cm). Median concentrations of TOC in all watersheds ranged from 1.96 mg/L in the Ramapo River watershed to 8.22 mg/L in the Passaic River watershed. The highest median TOC concentrations were observed during July (base flow and rain event) and September (4.67, 4.66, and 4.26 mg/L, respectively). The lowest TOC concentrations were observed during the December rain event and the base-flow event in January and March (3.50, 3.22, and 3.07 mg/L, respectively). Median dissolved oxygen measurements ranged from 6.90 mg/L in the Passaic River watershed to 15.0 mg/L in the Ramapo River watershed. The highest dissolved oxygen concentrations were in January, March, and the December rain event (13.6, 12.1, and 12.0 mg/L, respectively), and the lowest were in September, July during the rain event, and in July during base-flow (7.80, 7.10, and 6.95, respectively).
Samples during the March base-flow event were analyzed for 1,4-dioxane, which was detected above the MDL (23 ng/L) in 32 percent of the samples. Overall, concentrations ranged from 29 (USGS-01381940 [Site 34]; fig. 2) to 250 ng/L (Site 3), with a median of 105 ng/L. 1,4-dioxane was detected in samples from 3 of 5 sites in the Wanaque River watershed (Sites 1, 3, 5; range, 68–250 ng/L), from 3 of 9 sites in the Ramapo River watershed (Sites 6, 7, 9; range, 130–230 ng/L), and from 6 of 15 sites in the Passaic River watershed (Sites 32–37; range, 29–170 ng/L). There were no detections of 1,4-dioxane in the Pompton River watershed. The results for all 17 constituents collected opportunistically for trace element analysis are in Romanok and others (2026).
Presumptive PFAS Sources and Land Cover
Land cover and potential PFAS sources were summarized at the NHD local catchment and upstream watershed scales for each sampling site (Romanok and others, 2026; Williams and others, 2026). HUC10 summaries were also calculated (table 10) and showed that the Wanaque River watershed is the most forested among the HUC10 watersheds and that the Passaic River watershed is the most developed. “Developed, Open Space” (defined in table 5) was identified as a relatively prominent land cover category in several HUC10 watersheds. The Pompton River watershed had the fewest potential sources of PFAS (57), and the Passaic River watershed had the most (858). USGS-01389890 (Site 37; fig. 2), on the Passaic River, the most downstream sampling site in this study, has a local catchment size of 21.6 km2 that contains 55 ECHO and 20 NJPDES sources and is approximately 96-percent developed (Developed Low, Medium, and High Intensity, and Developed Open Space). The upstream watershed is 2,109 km2, is 38-percent developed, and contains 470 ECHO, 470 NJPDES, and 214 SPDES sources (fig. 4).
Table 10.
Approximate percentages of area of predominant National Land Cover Database (NLCD) land-cover categories and counts of potential sources or per- and polyfluoroalkyl substances within the watersheds of the Passaic River Basin, New Jersey, 2025.[Data are from Romanok and others (2026). Land-cover categories (for 10-digit hydrologic unit code [HUC10]) are from Dewitz (2023). %, percent; SPDES, [New York] State Pollutant Discharge Elimination System; NJPDES, New Jersey Pollution Discharge Elimination System; ECHO, U.S. Environmental Protection Agency Enforcement and Compliance History Online]
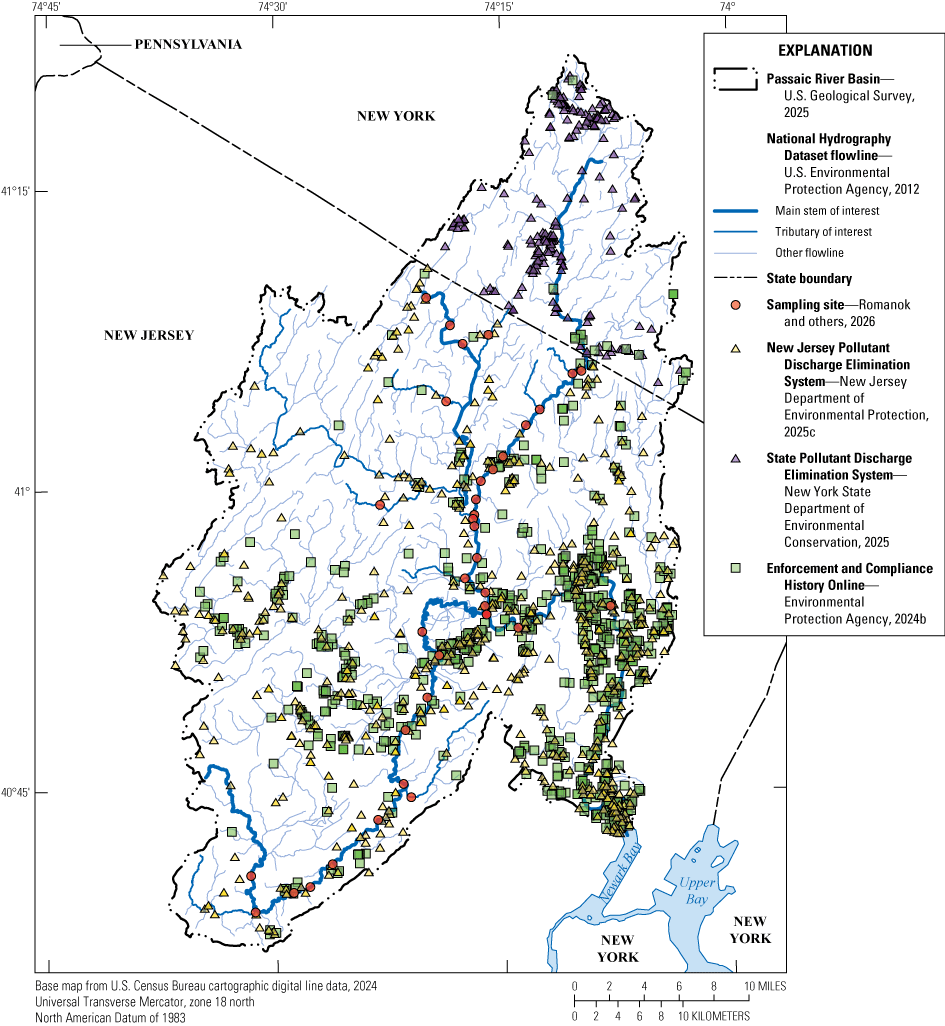
Map showing potential sources of per- and polyfluoroalkyl substances in the Passaic River Basin, New Jersey.
Mean-monthly and mean-annual ACCWW percentages were calculated for all flowlines (Romanok and others, 2026). Mean-monthly streamflow data were generally the lowest in August (EPA, 2012), so mean-August streamflow data were used in this study to demonstrate when wastewater inputs might make up the largest percentage of the streamflow, resulting in the greatest mean-monthly ACCWW percentages, similar to other studies (Faunce and others, 2023a; Barber and others, 2025). A de facto wastewater reuse of 1 percent in streams has been associated previously with higher concentrations of contaminants and can be considered an acceptable threshold for assessing potential risks to drinking-water resources (Weisman and others, 2021). This report describes only flowlines with mean-annual ACCWW percentages that are greater than or equal to 1 percent.
In the Wanaque River watershed, there were 254 total flowlines, 24 (9 percent) of which had ACCWW percentages greater than or equal to 1 percent. The greatest mean-annual (4.06 percent) and mean-August (13.6 percent) ACCWW within the Wanaque River watershed was calculated for a flowline downstream from a WWTP. The streamflow in this segment ranged from 23.8 ft3/s (mean-August) to 224 ft3/s (mean-April). The ACCWW for the flowline at the outlet of the Wanaque River watershed was calculated as 11.4 percent during mean-August conditions and 3.29 percent during mean-annual conditions.
In the Ramapo River watershed, there were 350 total flowlines, 81 (23 percent) of which had ACCWW percentages greater than or equal to 1 percent. A flowline classified as a “CanalDitch” had the largest mean-annual ACCWW of 26.7 percent, and a separate flowline classified as a lake/pond had the highest mean-August ACCWW in the HUC10 (43.4 percent). Both segments are adjacent to WWTP facilities. Site 13, on the main-stem Ramapo River near a drinking-water intake, was on a flowline with a mean-annual ACCWW of 3.15 percent. Just downstream, at the outlet of the Ramapo River watershed, ACCWW values were 3.19 percent (mean-annual) and 8.62 percent (mean-August).
In the Pompton River watershed, 21 out of the 204 flowlines (10 percent) had a mean-annual ACCWW percentage greater than or equal to 1 percent. The highest mean-annual ACCWW was 28.2 percent at a flowline classified as both a “LakePond” and a headwater (where mean-annual streamflow was 0.39 ft3/s) and was adjacent to a non-major publicly owned treatment works facility. The same flowline had the highest mean-August ACCWW of all segments in the watershed, at 32.6 percent (mean-August streamflow is 0.34 ft3/s). The segment immediately downstream had the next highest average mean-August ACCWW at 15.1 percent, potentially because of the dilution of treated effluent entering from the headwater segment. Where the Ramapo and Pequannock Rivers converge into the Pompton River (near USGS-01388500 [Site 16]; fig. 2), the mean-annual ACCWW was 2.72 percent and the mean-August ACCWW was 7.81 percent. The ACCWW conditions at USGS-405412074161601 (Site 20; fig. 2) on the main-stem Pompton River, near a drinking-water intake, were calculated as 2.52 percent (total streamflow of 598 ft3/s) and 7.50 percent (total streamflow of 201 ft3/s) for mean-annual and mean-August, respectively. Downstream, USGS-0138900503 (Site 21; fig. 2), at the outlet of the Pompton River watershed, just upstream from the confluence with the Passaic River, was on a flowline where the mean-annual ACCWW was 11.3 percent (total streamflow of 734 ft3/s) and the mean-August ACCWW was 21.9 percent (total streamflow of 378 ft3/s).
In the Passaic River watershed, 123 of the 349 flowlines (35 percent) within the watershed had a mean-annual ACCWW greater than or equal to 1 percent. The highest ACCWW percentages in the broader Passaic River Basin (geospatial study area) were within the Passaic River watershed at two headwater flowlines between USGS-01379550 (Site 30; fig. 2) and USGS-01381900 (Site 33; fig. 2), each adjacent to a WWTP. The highest mean-annual ACCWW was 77.7 percent (total streamflow, 8.70 ft3/s), and the second highest was 54.1 percent (total streamflow, 2.80 ft3/s). The maximum ACCWW percentage at each segment was in August under low-flow conditions (86.5 and 66.9 percent, respectively). One of the downstream-most sites in the study, USGS-01389490 (Site 36; fig. 2), was near a drinking-water intake on the main-stem Passaic River and on a flowline where mean-annual ACCWW was 8.63 percent (total streamflow, 1,280 ft3/s) and mean-August ACCWW was 18.5 percent (total streamflow, 597 ft3/s).
An interactive map application was developed by Williams and others (2026) as part of this study to support further exploration of the data (PFAS results, landscape characteristics, and ACCWW percentages) at the various analysis scales (local catchment, upstream watershed, sampling study area, and geospatial study area) presented in this report. The application can be accessed at geonarrative.usgs.gov/northjerseypfas/.
Discussion
PFAS were widespread in the Passaic River Basin, with at least one compound detected in every sample collected during the study, similar to other urbanized watersheds in the United States and globally (Goodrow and others, 2020; Kurwadkar and others, 2022; Wang and others, 2022). Globally, PFAS occurrence and distribution in surface waters have been related to a variety of point and non-point sources consisting of industry, fire training areas, landfills, wastewater discharges in urban areas (Hu and others, 2016; Salvatore and others, 2022), and biosolids applications and pesticide use in agricultural areas (Sepulvado and others, 2011; Donley and others, 2024). Atmospheric deposition has also been identified as a source to forested regions (Cousins and others, 2022; Pfotenhauer and others, 2022). On average, New Jersey gets about 50 percent of its drinking water from surface-water sources (NJDEP, 2024b), which can be contaminated by PFAS, particularly in urbanized areas. Information on PFAS occurrence, distribution, and potential sources can help drinking-water-treatment plant managers assess mitigation options to meet impending Federal regulations.
A primary PFAS exposure pathway to humans is through consumption of contaminated drinking water (Sunderland and others, 2019). Although this study did not focus specifically on treated drinking water, many of the sampled waterways are protected for the designated use of potable drinking water under New Jersey’s Surface Water Quality Standards (NJDEP, 2026). For this reason, concentrations of PFOA and PFOS measured at all sites were compared to the EPA MCLs for PFOA and PFOS (both 4 ng/L) to help water purveyors assess their mitigation needs as they plan for enforcement by 2031. Of the 181 samples collected during the study, 100 percent contained PFOA, with 91 percent exceeding the EPA MCL of 4 ng/L, and 97 percent contained PFOS, with 51 percent exceeding the EPA MCL. Detections and concentrations of PFOA and PFOS in this study were consistent with those reported previously in surface waters in New Jersey (NJDEP, 2024b) and throughout the eastern United States (McAdoo and others, 2022; Breitmeyer and others, 2023; Barber and others, 2025).
Under base-flow conditions, the Wanaque River watershed had some of the lowest median concentrations of both PFOA and PFOS compared to the other three watersheds, with 68 percent of the samples exceeding the EPA MCL for PFOA and no exceedances for PFOS. Median PFOA concentrations in the Wanaque River watershed were similar to those observed in the Ramapo River watershed (p=0.794), but median PFOS concentrations were lower in the Wanaque River watershed compared to the Ramapo River watershed (p=0.016; fig. 5). The five sites within the Wanaque River watershed represent the northern part of the Passaic River Basin, are mostly forested (table 10), and are the primary source to the Wanaque Reservoir, which is used in conjunction with other sources to provide drinking water to more than 3 million people in northern New Jersey (North Jersey District Water Supply Commission, 2018). In the Ramapo River watershed, concentrations of PFOA during base-flow conditions were lower compared to the Pompton River watershed (p=0.0004) and the Passaic River watershed (p<0.0001); however, no differences in PFOS concentrations were observed between the three watersheds (fig. 5). The EPA MCLs for PFOA and PFOS were exceeded in 78 and 43 percent of the samples, respectively, under base-flow conditions. Base-flow concentrations of PFOA and PFOS were similar in the Pompton and Passaic River watersheds: 100 percent of samples exceeded the PFOA MCL in both watersheds, and 61 and 52 percent exceeded the PFOS MCL in the Pompton and Passaic River watersheds, respectively. Samples were collected near three drinking-water pump stations in the Ramapo (Site 13), Pompton (Site 20), and Passaic River (Site 36) watersheds. Base-flow PFOA concentrations exceeded 4 ng/L during every sampling event and ranged from 4.6 to 9.9 ng/L at Site 13, 4.9 to 9.5 ng/L at Site 20, and 8.1 to 12.0 ng/L at Site 36. For PFOS, base-flow concentrations ranged from 2.5 to 9.1 ng/L (no exceedance in January) at Site 13, 3.1 to 7.5 ng/L (no exceedance in March) at Site 20, and 3.2 to 8.1 ng/L (no exceedance in March) at Site 36.
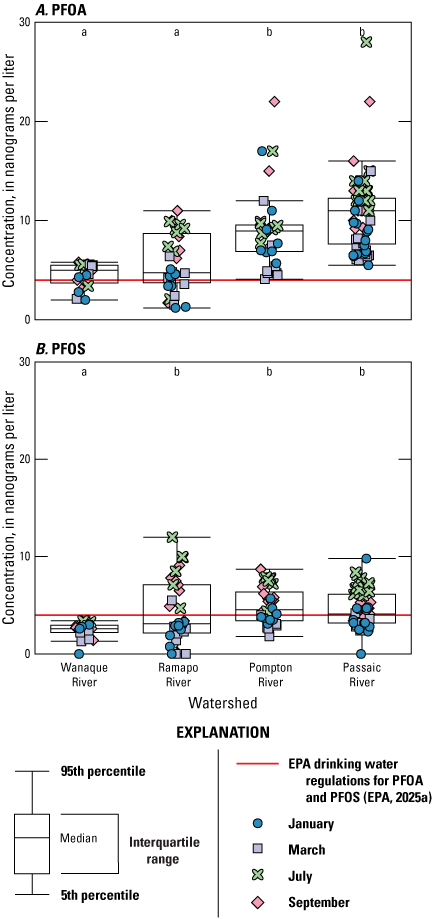
Boxplots showing differences between detected concentrations of (A) perfluorooctanoate (PFOA) and (B) perfluorooctane sulfonate (PFOS) in four watersheds under base-flow conditions in the Passaic River Basin, New Jersey. Letters above each boxplot represent significant statistical differences between medians, and areas with no letters in common are significantly different from one another (Bonferroni test, p<0.05). Data are from Romanok and others (2026). [EPA, U.S. Environmental Protection Agency]
Seasonal Differences
As expected, and similar to other studies (Nguyen and others, 2022; Castellani and others, 2025; Gorski, 2025), concentrations of PFAS varied seasonally, likely driven by streamflow. Under base-flow conditions, concentrations of PFOA were similar between samples collected in January and March (winter and spring; p=0.839) and those collected in July and September (summer and fall; p=1.000), with higher concentrations observed in the summer and fall compared to in the winter and spring when flows were higher (fig. 6). For PFOS, the highest concentrations were observed in July followed by September with no significant differences between January and March (fig. 6). In urban watersheds, under low-flow conditions in the summer and early fall, wastewater effluent can be a contributor to streamflow and, based on previous studies, an increased proportion of wastewater can lead to higher concentrations of PFAS and more frequent exceedances of the EPA MCL at drinking-water intakes (Barber and others, 2025). PFOA concentrations near the three water-treatment-plant intakes sampled as part of this study frequently exceeded the MCL despite seasonally higher flows in January, with concentrations ranging from 4.6 to 12.0 ng/L. However, PFOS concentrations tended to be below or only slightly above the MCL in January and March (2.5−5.5 ng/L), followed by a marked increase as flows decreased in July and September (5.9−9.1 ng/L). Shallow groundwater is another source of PFAS to surface-water systems (McMahon and others, 2022; Tokranov and others, 2024). Based on historical USGS data, PFOA and PFOS were detected in 85 and 69 percent, respectively, of the 13 groundwater samples collected from the study area in 2020–23. PFOA concentrations in groundwater ranged from not detected to 54.0 ng/L (median, 15.5 ng/L), and PFOS concentrations ranged from not detected to 26 ng/L (median, 4.6 ng/L), indicating that groundwater could be a source of PFAS to the study area, particularly in the summer and fall during lower flow conditions.
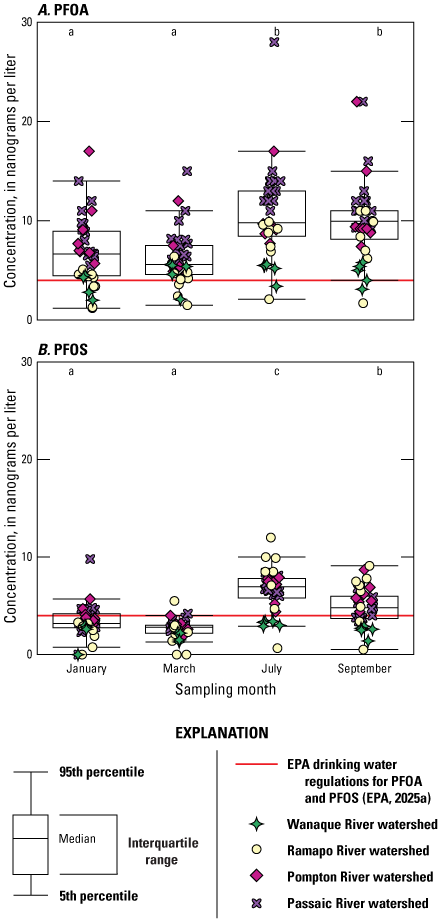
Boxplots showing differences between detected concentrations of (A) perfluorooctanoate (PFOA) and (B) perfluorooctane sulfonate (PFOS) by month under base-flow conditions in four watersheds of the Passaic River Basin, New Jersey. Letters above each boxplot represent significant statistical differences between medians, and areas with no letters in common are significantly different from one another (Bonferroni test, p<0.05). Data are from Romanok and others (2026). [EPA, U.S. Environmental Protection Agency]
Stormwater is often discharged into receiving waterbodies largely without treatment and thus has the potential to transport PFAS to streams within urban areas during rain events (Masoner and others, 2019). Because stormwater quality varies by rain-event and catchment, it can be difficult to determine the importance of stormwater runoff as a source of PFAS to the receiving water bodies. However, studies have shown increases in both the concentration and number of unique PFAS, particularly long-chain PFAS, detected during rain-events (Müller and others, 2011; Kali and others, 2025). In July, the number of individual compounds detected and concentrations of PFOA, PFOS, and ∑PFAS basinwide were similar between wet and dry events sampled within a week of each other, indicating that stormwater may not be a primary contributor of PFAS to the Passaic River Basin, particularly in the summer. At the site level, the only exception was USGS-01386000 (Site 5), where concentrations of PFOA and PFOS increased from 5.6 to 14 ng/L and 2.9 to 5.3 ng/L, respectively. Further, when comparing all base-flow events with the two rain events, concentrations of PFOA were similar (p=0.5919). PFOS concentrations were higher (p=0.0056) during the rain events compared to base-flow events (fig. 7). Rain-event-driven PFAS dynamics can be complicated by sources (point versus non-point) and the hydrology of the watershed. More information temporally and spatially could further our understanding of PFAS contributions from non-point sources in the study area.
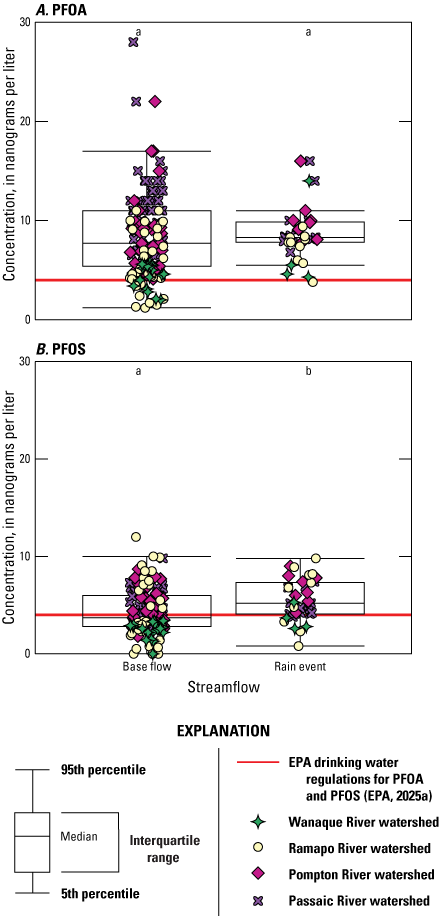
Boxplots showing differences between detected concentrations of (A) perfluorooctanoate (PFOA) and (B) perfluorooctane sulfonate (PFOS) at or near base-flow conditions (all months combined) and during two rain events in four watersheds of the Passaic River Basin, New Jersey, 2025. Letters above each boxplot represent significant statistical differences between medians, and areas with no letters in common are significantly different from one another (Bonferroni test, p<0.05). Data are from Romanok and others (2026). [EPA, U.S. Environmental Protection Agency]
Eight sites were sampled during both the July and December rain events: three sites each in the Ramapo and Pompton River watersheds, and two sites in the Passaic River watershed (table 1.1). No differences between events across all watersheds were observed for the number of PFAS detected (p=0.109) and concentrations of PFOS (p=0.0707). However, despite some site-level variations, concentrations of ∑PFAS (p=0.012) and PFOA (p=0.0055) across all watersheds were higher during the July rain event compared to the December rain event (fig. 8). The average streamflow during the July rain event was higher than what was observed in December (table 1.2), which could explain the higher concentrations observed during the July rain event. In the Passaic River Basin, PFAS occurrence and distribution varied seasonally and were complicated by varying flow regimes, stormwater quality, potential shallow groundwater interactions, and the loading of WWTP effluent into local stream reaches. Although data on PFAS in WWTP effluent in New Jersey is limited, based on other studies, PFAS loading from individual WWTP effluent can be highly variable and tends to be affected by sources of wastewater, treatment, and seasonality (Tavasoli and others, 2021; Thompson and others, 2022).
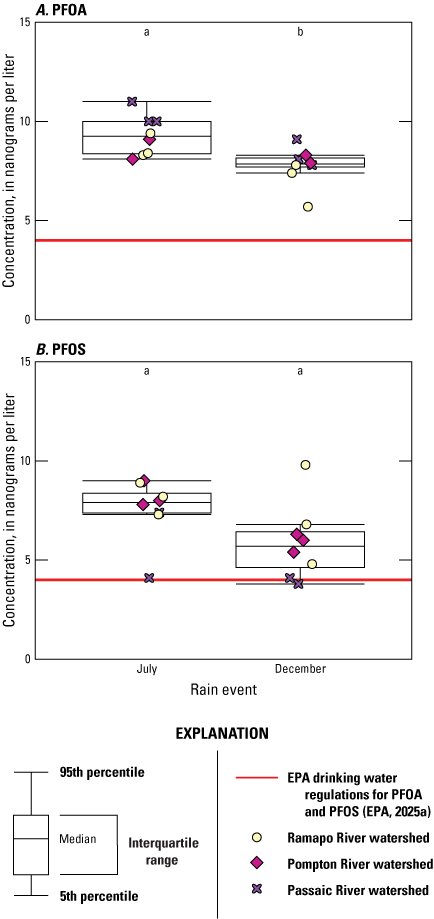
Boxplots showing differences between detected concentrations of (A) perfluorooctanoate (PFOA) and (B) perfluorooctane sulfonate (PFOS) at eight sites sampled during the July and December rain events in three watersheds of the Passaic River Basin, New Jersey, 2025. No samples were collected from the Wanaque River watershed during either rain event. Letters above each boxplot represent significant statistical differences between medians, and months with no letters in common are significantly different from one another (Bonferroni test, p<0.05). Data are from Romanok and others (2026). [EPA, U.S. Environmental Protection Agency]
PFOA and PFOS Yields
To provide a more direct comparison of relative PFAS loads among sites with different drainage areas and streamflow, yields were calculated for the local catchment and the upstream watershed (tables 1.6, 1.7). Throughout the Passaic River Basin, PFAS yields associated with individual sites calculated at the local catchment scale were driven mainly by PFOA and PFOS, which comprised anywhere from 17.5 to 100 percent (median, 25.4 percent) and 0 to 56.6 percent (median, 13.8 percent), respectively, of the total yields. The PFAS yields varied by site, season, and watershed, with the lowest yields calculated for the Wanaque River watershed (table 11). Except for Site 20 on the Pompton River, directly downstream from a WWTP and within a very small local catchment (0.0189 km2), yields were similar among the Ramapo, Pompton, and Passaic River watersheds (table 11). Yields at Site 20 ranged from 99 to 1,098 g/d/km2 for PFOA and from 67 to 829 g/d/km2 for PFOS, with the highest yields observed during the July rain event. Wanaque South pump station is between Sites 20 and 21. Yields decreased substantially at Site 21 and ranged from 10 to 17 g/d/km2 for PFOA and 6.5 to 12.4 g/d/km2 for PFOS.
Table 11.
Summary of total per- and polyfluoroalkyl substance yields (in grams per day per square kilometer) calculated for surface waters of four watersheds during base-flow and rain-event conditions, Passaic River Basin, New Jersey, 2025.[Data are from Romanok and others (2026). Additional site information is tables 2 and 1.1. Site-level yields were calculated using the size of the local catchment. NA, not applicable; NS, no sample collected]
Under base-flow conditions, the yields were generally highest in March and lowest in September (table 11). However, under elevated flow conditions caused by rain events, yields did increase as expected. Under base-flow conditions at all sites except Site 24, tributary PFAS yields tended to be lower (table 11) and contributed a limited mass of PFAS to the main-stem rivers, owing to their characteristically lower flows and the fact that the tributary sampling sites generally had fewer potential sources in the local and upstream catchments (fig. 9). Rain and higher-flow events have the potential to mobilize PFAS, and in mixed urban and industrial catchments, diffuse non-point sources such as stormwater can be as important as point sources. A more detailed understanding of yields within watersheds could better characterize PFAS dynamics which are complicated by hydrologic events and source types (diffuse versus point sources). Further, water-treatment plants are considered pivotal control points for PFAS, but inconsistencies with removal capabilities and precursor formation complicate any planned reduction strategies (Kim and others, 2024).
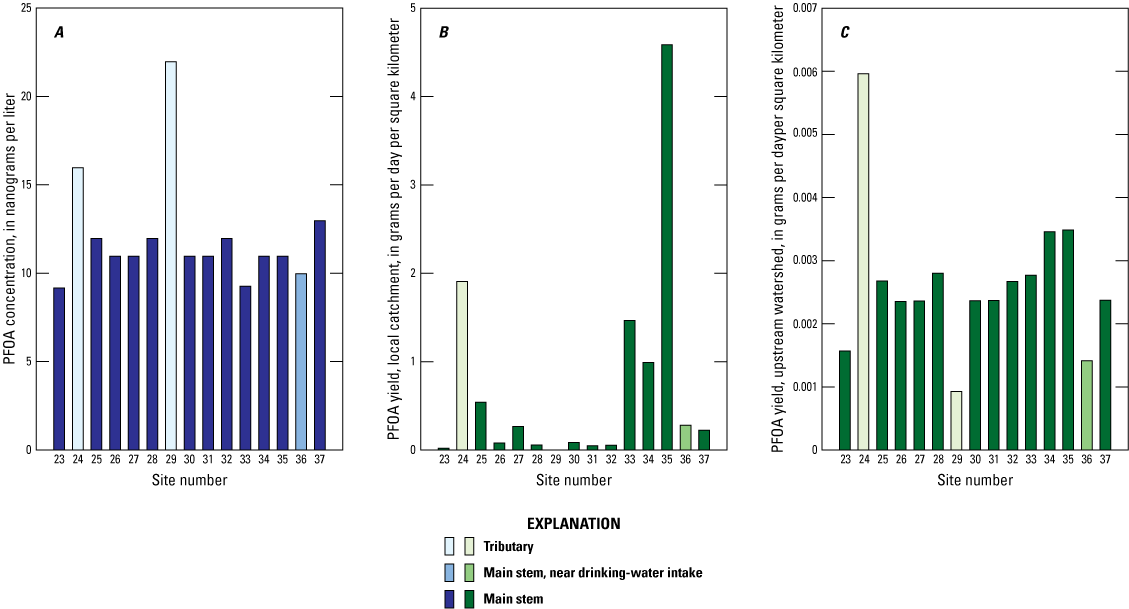
Bar graphs showing perfluorooctanoate (PFOA) (A) concentrations and their contribution to overall (B) site-level yields at the local catchment scale and (C) yields at the upstream watershed scale in the Passaic River watershed, New Jersey, for samples collected at or near base-flow conditions in September 2025. Data are from Romanok and others (2026). Additional site information is in tables 2 and 1.1.
Calculating yields in the Wanaque River watershed is complicated by lakes and diversions. Seasonal yields were calculated for Sites 1, 2, and 5, which represent the primary inputs to the Wanaque Reservoir (a major drinking-water source). Overall, yields were highest in March, followed by the July rain event; PFOA and PFOS site-level yields ranged from 0.009 to 3.24 g/d/km2 and 0.00 to 1.32 g/d/km2, respectively. Similarly, in the Ramapo, Pompton, and Passaic River watersheds, yields were highest during the July rain event, followed by March. PFOA and PFOS yield ranges were as follows: in the Ramapo River watershed, from less than 0.0001 to 13.96 g/d/km2 and 0.00 to 13.6 g/d/km2, respectively; in the Pompton River watershed, from 0.009 to 1,098 g/d/km2 and 0.003 to 829 g/d/km2, respectively; and in the Passaic River watershed, from 0.0001 to 23.1 g/d/km2 and less than 0.0001 to 9.69 g/d/km2, respectively. The highest site-level yields were at Sites 20 and 21 in the Pompton River watershed, followed by Sites 33, 34, and 35 in the Passaic River watershed. In the Passaic River watershed, an increase in streamflow was observed between USGS-01379580 (Site 32; fig. 2) and Site 33 that resulted from surface-water inputs from the Rockaway River, which flows into the Passaic River. PFOA yields increased substantially from 0.064 to 0.498 g/d/km2 at Site 32 to 1.47 to 9.35 g/d/km2 at Site 33 (fig. 9) and then again at USGS-0138900501 (Site 35; fig. 2) from 5.18 to 23.1 g/d/km2, at the confluence of the Pompton and the Passaic Rivers (fig. 10). The Rockaway River and its major tributary, the Whippany River, were not sampled during this study; however, based on the potential PFAS sources (fig. 4) and historical USGS results, they may contribute PFAS into the Passaic River. PFOA and PFOS samples collected on the Whippany River by the USGS from 2020 to 2023 ranged from 7.1 to 12.0 ng/L and 8.3 to 17.0 ng/L, respectively (USGS, 2026). Future sampling within the Rockaway and Whippany Rivers could likely help explain increased observed PFAS yields after Site 32 (fig. 9).
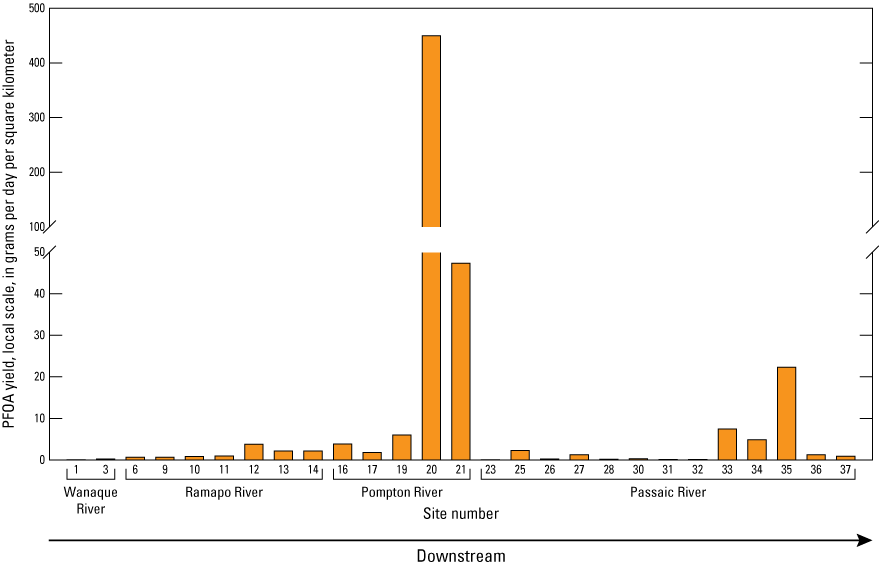
Graph showing site-level perfluorooctanoate (PFOA) yields at the local catchment scale for all main-stem river sites of the Passaic River Basin, New Jersey, from samples collected at or near base-flow conditions in September 2025. Data are from Romanok and others (2026). Site locations are shown in figure 2. Additional site information is in tables 2 and 1.1. Sites 13, 20, 21, and 36 are near drinking-water intakes. Sites are organized in downstream order for each watershed.
Landscape Predictors
Urban watersheds often exhibit higher values of specific conductance, turbidity, and TOC compared to non-urban (forested or agricultural) watersheds, but the degree varies by region, land-cover intensity, and season. Under base-flow conditions, median ∑PFAS concentrations and the number of PFAS detected were positively related to specific conductance, turbidity, and TOC (tables 1.8, 1.9). Similar relationships were observed with median PFOA and, to a lesser extent, median PFOS concentrations, particularly for specific conductance and TOC (tables 1.8, 1.9). Specific conductance and turbidity are often higher in urbanized watersheds owing to increased salinization, runoff of sediments, and mobilization of dissolved solids (EPA, 2017; Baker and others, 2019; Miguel-Chinchilla and others, 2019), and TOC tends to be elevated in urban settings. However, relationships between TOC and land cover can be complex because of wastewater effluent and increased flows (Elias and others, 2013; Smith and Kaushal, 2015).
To understand potential predictors of PFAS contamination in the Passaic River Basin, ∑PFAS concentrations and concentrations of PFOA and PFOS were compared to landscape metrics, including land-cover categories and presumptive sources, using a correlation matrix and linear regression to assess the strength of the relationship. Correlation analysis revealed several potential predictors of PFAS concentrations (table 12). These relationships varied by scale (local catchment versus upstream watershed). At the local scale (table 12), predictors that were positively associated (p<0.05) with PFOA concentrations included catchment size, mean-annual ACCWW percentage, number of sources (ECHO and NJPDES), percentage of Open Water, and percentage of developed land, including Developed Open Space, and Developed Low, Medium, and High Intensity land-cover categories. The percentage of Deciduous Forest was negatively correlated with PFOA concentrations (table 1.8). For PFOS, percentage of developed land, including Developed Open Space, and Developed Low, Medium, and High Intensity land-cover categories, was positively associated with median concentrations, and the percentage of Deciduous and Mixed Forest, as well as the percentage of Pasture/Hay, were negatively associated with median concentrations (tables 12, 1.8). In the upstream watershed (table 12), median PFOA concentrations were positively related to the number of ECHO and NJPDES sources, percentage of developed land, including Developed Open Space, Low, Medium, and High Intensity land-cover categories, percentage of Pasture/Hay and Cultivated Crops, and percentage of Woody Wetlands. PFOA concentrations were negatively related to the percentage of Open Water, Grassland/Herbaceous, Deciduous and Evergreen Forest, and Shrub/Scrub (tables 12, 1.9). Median PFOS concentrations were positively related to the number of catchments, watershed size, number of sources (ECHO, NJPDES, and SPDES), and the percentage of developed land, including Developed Open Space, Low, Medium, and High Intensity land-cover categories, Emergent Herbaceous Wetlands, and Barren Land. They were negatively related to the percentage of Deciduous Forest (tables 12, 1.9).
Results of the linear regressions indicate that ∑PFAS and PFOA concentrations increased with increasing percentages of total developed land (sum of Developed Low, Medium, and High Intensity), Developed Open Space, and mean-annual ACCWW, and decreased with increasing percentages of Deciduous Forest at both the local catchment (fig. 11; table 1.10) and upstream watershed scales (table 1.11). PFOS concentrations, on the other hand, increased with increasing developed land at the local catchment scale and decreased as the percentage of Deciduous Forest increased at both the local and upstream scale (tables 1.10, 1.11). Many of the other predictors showed a significant relationship with PFAS concentrations (for example, ECHO and NJPDES sources and Pasture/Hay and Cultivate Crops), but the relationships were relatively weak (tables 1.10, 1.11).
Table 12.
Spearman’s rank correlation between landscape predictors at the local and upstream scales and the median concentration of per- and polyfluoroalkyl substances (PFAS) in surface-water samples collected at or near base-flow conditions in the Passaic River Basin, New Jersey, 2025.[Data are from Romanok and others (2026). Land-cover categories are from Dewitz (2023). A plus sign (+) indicates a positive relationship and a minus sign (-) indicates a negative relationship between concentrations of selected PFAS and predictors. Only predictors with a p-value less than 0.05 from the correlation matrix are shown. All landscape predictors assessed and their respective p-values are available in tables 1.8 and 1.9. ∑, cumulative; PFAS, per- and polyfluoroalkyl substances; ACCWW, accumulated wastewater; ECHO, U.S. Environmental Protection Agency Enforcement and Compliance History Online; NJPDES, New Jersey Permitted Discharge Elimination System; PFOA, perfluorooctanoate; PFOS, perfluorooctane sulfonate; NA, not applicable; SPDES, [New York] State Pollutant Discharge Elimination System]
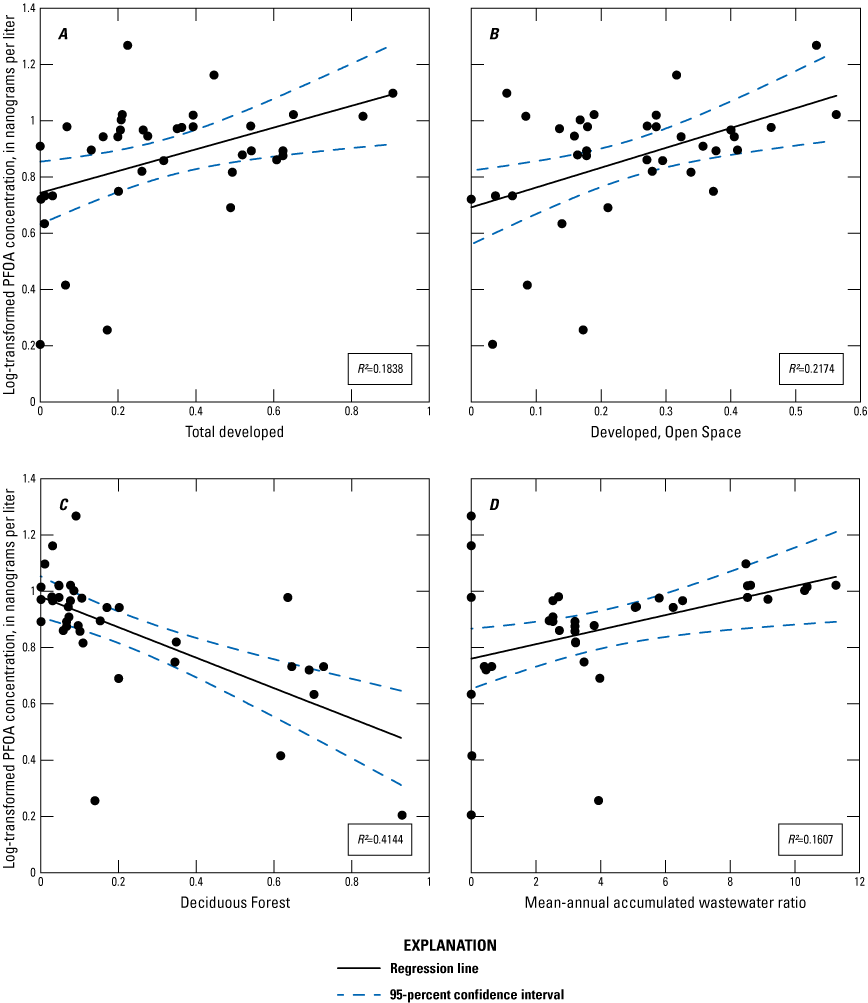
Plots showing the relationship between log-transformed perfluorooctanoate (PFOA) concentrations and various landscape predictors in the local catchments: the proportion of (A) total developed land (sum of Developed Low, Medium, and High Intensity) and areas classified as (B) Developed, Open Space and (C) Deciduous Forest; and (D) the mean-annual accumulated wastewater percentage for samples collected in the Passaic River Basin, New Jersey, 2025. Data are from Romanok and others (2026). Land-cover categories are from Dewitz (2023). [R2, coefficient of determination]
Across the United States, urban land cover is a predominant driver of PFAS occurrence in a variety of matrices and has been identified as one of the top predictor variables in previous modeling efforts (McMahon and others, 2022; Smalling and others, 2023; Tokranov and others, 2024). Further, point-source municipal and industrial WWTP effluent discharges have been related to increased PFAS in surface waters (Schultz and others, 2006; Hu and others, 2016; Barber and others, 2025), and factors such as wastewater treatment technique, population size served, and proximity to WWTPs have been linked to concentrations (Podder and others, 2021), which could explain the positive relationships observed between PFAS concentrations and mean-annual ACCWW percentage. Barber and others (2025) reported a similar positive relationship between ∑PFAS concentrations in surface waters and the ACCWW percentage calculated for the Potomac River watershed. It is important to note that municipal WWTPs are considered “reservoirs” or “passive receivers” of PFAS because they do not manufacture it and cannot control its presence in the influent that arrives from homes and businesses (Mehan and Norris, 2026; Liu and others, 2026). Although agricultural land cover was limited in the study area (less than 2.5 percent; table 10), concentrations were only marginally correlated with Pasture/Hay and Cultivated Crops in the upstream watersheds, and the relationships were relatively weak (tables 1.10, 1.11). In agricultural areas, the occurrence of PFAS has been linked to land application of biosolids (Sepulvado and others, 2011; Munoz and others, 2022) and field application of pesticides (Donley and others, 2024). Thus, stronger relationships in more heavily agricultural areas are expected, as was observed in Pennsylvania surface waters (Breitmeyer and others, 2023). Presumptive sources in a watershed are often correlated with urban land cover (Smalling and others, 2023), but knowing the specific locations and types of sources helps identify areas most vulnerable to PFAS contamination. Calculating mean-annual and mean-monthly ACCWW percentages (fig. 12; table 1.12) for each flowline in a watershed can help identify and compare areas where PFAS concentrations could be elevated during various times of the year, such as during August when streamflow is generally lower, and help prioritize future sampling and mitigation efforts.
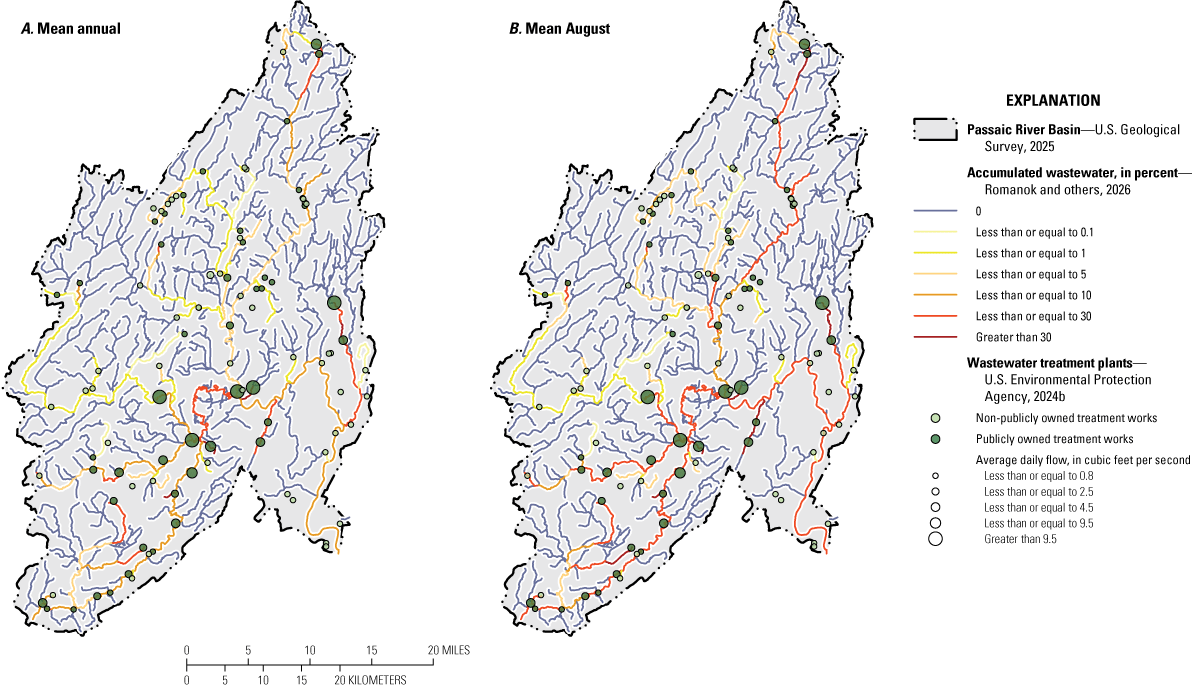
Maps of the Passaic River Basin, New Jersey, showing accumulated wastewater (A) mean-annual and (B) mean-August percentages (Barber and others, 2025).
Potential Implications for Management
In urbanized watersheds like the Passaic River Basin, PFAS are widespread in surface waters used as drinking-water resources. Despite advanced techniques in the treatment process to minimize PFAS concentrations in treated drinking water, information on PFAS concentrations in source water can support water purveyors in managing their systems and preparing for enforcement of Federal drinking-water regulations in the coming years. Addressing water reuse and associated introduction of PFAS into drinking-water sources requires knowledge of upstream presumptive sources and changes in concentrations across time and space. Data collected across four large watersheds in the Passaic River Basin, including near two drinking-water intakes and upstream from the Wanaque Reservoir, can help water purveyors make decisions regarding effective treatment and mitigation strategies and work with the NJDEP to reduce PFAS contamination of drinking-water supplies.
Understanding seasonal differences in PFAS concentrations and yields and in water chemistry (for example, TOC) can inform decisions on when to pump water from existing surface-water intakes as well as water treatment options. PFAS associated with elevated TOC can complicate treatment options (Tshangana and others, 2025), therefore understanding the complete water chemistry allows purveyors to best address treatment throughout the year. For example, PFOA and PFOS concentrations were lower during the winter and spring when flows were higher. Further mean-annual ACCWW percentages across the study area were low (maximum, 7 percent) compared to mean-August (maximum, 22 percent) when streamflow was low. Sites 13, 20, and 36 were sampled near drinking-water intakes, with mean-annual ACCWW percentages of 3.2, 2.5, and 8.6 percent, respectively, and mean-August ACCWW percentages of 8.6, 7.5, and 18.4 percent, respectively. Further, median groundwater concentrations in the study area were 15.5 ng/L and 4.6 ng/L for PFOA and PFOS, respectively, indicating shallow-subsurface groundwater could also be an important contributor to surface waters, particularly in the summer and fall when streamflow is low. Additional information could inform decisions to change pumping rates or drinking water sources. For example, water purveyors may be able to minimize the degree of treatment and mitigation needed to meet Federal drinking-water standards by pumping less from surface waters, relying primarily on reservoirs, when PFAS concentrations are highest (the summer and fall), thereby reducing intake concentrations. Concentrations of PFAS in the Wanaque River watershed, upstream from the Wanaque Reservoir, were low most of the year compared to the other watersheds. The Wanaque River watershed is affected by fewer sources, lower urbanization, and more forested land cover. During the July rain event, concentrations of PFOA and PFOS increased compared to those observed under base-flow conditions, which indicates non-point sources like overland flow are also likely contributors of PFAS in the Wanaque River watershed. Because non-point sources were not the primary focus of the current study, continued sampling of the reservoir and its major tributaries under different flow conditions could help accurately assess PFAS dynamics within the Wanaque Reservoir.
The ACCWW model applied to the Passaic River Basin is adaptable to other watersheds, can be scaled up or down to address a variety of water-quality issues. For example, the ACCWW model could be used to identify potential “hot spots” of PFAS and other wastewater-derived contaminants in unsampled watersheds, allowing resource managers to target funds to specific areas and potentially eliminate the need for broad spatial and temporal reconnaissance studies. Water purveyors could also use this type of information to determine when to pump water from certain stream reaches, potentially identify areas in need of mitigation, or inform potential locations of new surface-water intakes. Monitoring PFAS concentrations in wastewater and industrial effluent could help improve the ACCWW model and allow for improved prediction of PFAS concentrations in unsampled stream reaches throughout the state, as described in other watersheds (Barber and others, 2025). To understand the occurrence, distribution, and potential loading of PFAS into local surface waters used as drinking-water resources, studies could be designed in collaboration with water purveyors to address their needs and inform potential strategies for reducing PFAS to help meet new Federal regulations.
Study Limitations
The current study provided preliminary information needed to understand overall occurrence, distribution, and loading into local surface waters over 1 year of sampling under various seasons and flow regimes, but it has its limitations. First, shallow groundwater, which is considered a source of PFAS (Tokranov and others, 2024), was not assessed in the study and could be a contributor in some reaches, particularly during low-flow conditions in the summer. Based on limited data from groundwater samples collected in 2022, PFOA and PFOS were observed in more than 65 percent of the samples, with 84 and 53 percent of the samples, respectively, exceeding the EPA MCL of 4 ng/L (USGS, 2026). This indicates that shallow groundwater could be a contributing source of PFAS to surface waters, particularly during lower-flow conditions, and more data on groundwater PFAS contributions could help managers more adequately assess PFAS dynamics in the region. Oyen and Ophori (2025)’s chloride particle-tracking study within the Passaic River watershed indicated the probability of groundwater-to-surface-water interaction. They also highlighted a study by Newell and others (2022) that described how the application of road salt could potentially prolong the occurrence of PFAS contamination owing to changes in solubility, potentially affecting PFAS dynamics in the winter. Second, atmospheric deposition is a known source of PFAS, particularly in forested areas like the Wanaque River watershed where anthropogenic sources are more limited. Often, atmospheric concentrations of PFOA and PFOS exceed 4 ng/L (Cousins and others, 2022) and could be affecting smaller, forested stream reaches with low ACCWW percentages. Third, there is currently little data on PFAS concentrations in wastewater and industrial discharges available, making it difficult to pinpoint specific sources that could be a major contributor of PFAS to a stream reach. To model potential occurrence and concentrations in unsampled reaches, more accurate data on PFAS concentrations from all sources with a discharge permit are needed. Fourth, the Rockaway and Whippany Rivers were not sampled as part of this study but could be a source of PFAS loading to the Passaic River watershed based on the geospatial data compiled, the increase in yields on the Passaic River downstream from the confluence with these rivers, and the limited USGS data available. Lastly, event sampling was limited across time and space in this study. Although some conclusions can be made regarding presumptive sources of PFAS to the basin, how non-point sources, such as combined sewer overflows and urban runoff, affect PFAS occurrence and distribution during rain events, and if those effects vary seasonally, is not fully understood. Despite the above limitations, the current study provides foundational information on PFAS in surface waters to help resource managers make decisions and identify next steps as they prepare to meet PFAS regulations for drinking water.
Summary and Conclusions
This study was designed to assess per- and polyfluoroalkyl substances (PFAS) occurrence and distribution in northern New Jersey surface waters, which are used as drinking-water resources. Samples were collected once in January, March, July, and September 2025 under base-flow conditions to represent various flow regimes that can affect instream PFAS concentrations. Two rain-event-driven samples were also collected at a subset of sites to further assess how higher flows affect concentrations. As expected, base-flow concentrations varied spatially and seasonally, with higher concentrations in July and September. In those months, flows were lower, wastewater effluent was a larger contributor to base flow, particularly in the Pompton and Passaic River watersheds, and shallow groundwater recharge could have been contributing PFAS to surface waters. The lowest concentrations of perfluorooctanoate (PFOA) and perfluorooctane sulfonate (PFOS) were observed in the Wanaque River watershed above the Wanaque Reservoir, where land cover was more dominated by forest. However, as urbanization and the number of presumptive sources in the local catchments and upstream watersheds increased, so did PFAS concentrations.
Yields were calculated to assess site-specific and watershed-wide changes in spatial and temporal PFAS mass loading and to account for variations in catchment and watershed areas and streamflow. Generally, yields of PFOA and PFOS varied temporally and spatially, with higher yields occurring under high-flow conditions and at main-stem river sites compared to most tributaries, with some exceptions. In the main-stem rivers under various flow regimes, the highest site-level yields were observed at U.S. Geological Survey (USGS) stations in the Pompton River (USGS-405412074161601, USGS-0138900503 [Sites 20–21]) and in the Passaic River watersheds (USGS-01381900, USGS-01381940, USGS-0138900501 [Sites 33–35]). PFAS yields varied by site, season, and watershed, with the lowest yields calculated for the Wanaque River watershed.
Surface-water PFAS dynamics are complex and driven by a variety of factors, including hydrology, seasonality, water reuse, land cover, and presumptive sources, making management for human consumption difficult. Addressing these factors to minimize PFAS contamination of drinking-water resources requires a detailed understanding of upstream presumptive sources as well as spatial and temporal loading trends. Data provided by this study can inform water purveyors’ and resource managers’ treatment and mitigation decisions to minimize PFAS in local surface waters used as drinking-water resources.
References Cited
Andrews, D.Q., and Naidenko, O.V., 2020, Population-wide exposure to per- and polyfluoroalkyl substances from drinking water in the United States: Environmental Science & Technology Letters, v. 7, no. 12, p. 931–936, accessed January 9, 2026, at https://doi.org/10.1021/acs.estlett.0c00713.
Bach, C.C., Vested, A., Jørgensen, K.T., Bonde, J.P.E., Henriksen, T.B., and Toft, G., 2016, Perfluoroalkyl and polyfluoroalkyl substances and measures of human fertility—A systematic review: Critical Reviews in Toxicology, v. 46, no. 9, p. 735–755, accessed January 9, 2026, at https://doi.org/10.1080/10408444.2016.1182117.
Baker, M.E., Schley, M.L., and Sexton, J.O., 2019, Impacts of expanding impervious surface on specific conductance in urbanizing streams: Water Resources Research, v. 55, no. 8, p. 6482–6498, accessed February 12, 2026, at https://doi.org/10.1029/2019WR025014.
Barber, L.B., Miller, S.A., Blaney, L., Bradley, P.M., Faunce, K.E., Fleck, J.A., Frick, M., He, K., Hollins, R.D., Lewellyn, C.J., Majcher, E.H., McAdoo, M.A., and Smalling, K.L., 2025, Municipal and industrial wastewater treatment plant effluent contributions to per- and polyfluoroalkyl substances in the Potomac River—A basin-scale measuring and modeling approach: Environmental Science & Technology, v. 59, no. 23, p. 11720–11734, accessed January 7, 2026, at https://doi.org/10.1021/acs.est.4c12167.
Barber, L.B., Rapp, J.L., Kandel, C., Keefe, S.H., Rice, J., Westerhoff, P., Bertolatus, D.W., and Vajda, A.M., 2019, Integrated assessment of wastewater reuse, exposure risk, and fish endocrine disruption in the Shenandoah River Watershed: Environmental Science & Technology, v. 53, no. 7, p. 3429–3440, accessed January 7, 2026, at https://doi.org/10.1021/acs.est.8b05655.
Barry, V., Winquist, A., and Steenland, K., 2013, Perfluorooctanoic acid (PFOA) exposures and incident cancers among adults living near a chemical plant: Environmental Health Perspectives, v. 121, no. 11–12, p. 1313–1318, accessed on January 9, 2026, at https://doi.org/10.1289/ehp.1306615.
Blake, B.E., and Fenton, S.E., 2020, Early life exposure to per- and polyfluoroalkyl substances (PFAS) and latent health outcomes—A review including the placenta as a target tissue and possible driver of peri- and postnatal effects: Toxicology, v. 443, no. October, accessed January 9, 2026, at https://doi.org/10.1016/j.tox.2020.152565.
Blodgett, D., and Johnson, J.M., 2022, nhdplusTools—Tools for accessing and working with the NHDPlus: U.S. Geological Survey software release, accessed on February 4, 2026, at https://doi.org/10.5066/P97AS8JD.
Breitmeyer, S.E., Williams, A.M., Duris, J.W., Eicholtz, L.W., Shull, D.R., Wertz, T.A., and Woodward, E.E., 2023, Per- and polyfluorinated alkyl substances (PFAS) in Pennsylvania surface waters—A statewide assessment, associated sources, and land-use relations: Science of the Total Environment, v. 888, accessed February 12, 2026, at https://doi.org/10.1016/j.scitotenv.2023.164161.
Castellani, F., Galletti, M., Charavgis, F., Cingolani, A., Renzi, S., Nucci, M., Carmela Protano, C., and Vitali, M., 2025, Perfluoroalkyl substances—A risk for the aquatic environment? A 1-year case study in river waters of central Italy: Environmental Science and Pollution Research International, v. 32, no. 16, p. 10464–10475, accessed February 12, 2026, at https://doi.org/10.1007/s11356-024-34807-4.
Coates, K.A., and Harrington, P.B., 2024, Contamination levels of per- and polyfluoroalkyl substances (PFAS) in recent North American precipitation events—A review: Water Research, v. 266, accessed March 13, 2026, at https://doi.org/10.1016/j.watres.2024.122390.
Cousins, I.T., Johansson, J.H., Salter, M.E., Sha, B., and Scheringer, M., 2022, Outside the safe operating space of a new planetary boundary for per- and polyfluoroalkyl substances (PFAS): Environmental Science & Technology, v. 56, no. 16, p. 11172–11179, accessed February 9, 2026, at https://doi.org/10.1021/acs.est.2c02765.
Creed, J.T., Brockhoff, C.A., and Martin T.D., 1994, Method 200.8—Determination of trace elements in waters and wastes by inductively coupled plasma-mass spectrometry (ver. 5.4): Cincinnati, Ohio, U.S. Environmental Protection Agency, 55 p., accessed on February 3, 2025, at https://www.epa.gov/sites/default/files/2015-06/documents/epa-200.8.pdf.
Dewitz, J., 2023, National Land Cover Database (NLCD) 2021 products: U.S. Geological Survey data release, accessed on February 27, 2026, at https://doi.org/10.5066/P9JZ7AO3.
Domingo, J.L., and Nadal, M., 2019, Human exposure to per- and polyfluoroalkyl substances (PFAS) through drinking water—A review of the recent scientific literature: Environmental Research, v. 177, accessed on January 9, 2026, at https://doi.org/10.1016/j.envres.2019.108648.
Donley, N., Cox, C., Bennett, K., Temkin, A.M., Andrews, D.Q., and Naidenko, O.V., 2024, Forever pesticides—A growing source of PFAS contamination in the environment: Environmental Health Perspectives, v. 132, no. 7, article 75003, 15 p., accessed February 12, 2026, at https://pmc.ncbi.nlm.nih.gov/articles/PMC11268133/. https://doi.org/10.1289/EHP13954
Elias, E., Dougherty, M., Srivastava, P., and Laband, D., 2013, The impact of forest to urban land conversion on streamflow, total nitrogen, total phosphorus, and total organic carbon inputs to the converse reservoir, Southern Alabama, USA: Urban Ecosystems, v. 16, p. 79–107, accessed February 12, 2026, at https://doi.org/10.1007/s11252-011-0198-z.
Esri, 2025, ArcGIS Pro (ver. 3.5.3): Esri software release, accessed on February 27, 2026, at https://www.esri.com/en-us/arcgis/products/arcgis-pro/overview.
Evich, M.G., Davis, M.J.B., McCord, J.P., Acrey, B., Awkerman, J.A., Knappe, D.R.U., Lindstrom, A.B., Speth, T.F., Tebes-Stevens, C., Strynar, M.J., Wang, Z., Weber, E.J., Henderson, W.M., and Washington, J.W., 2022, Per- and polyfluoroalkyl substances in the environment: Science, v. 375, no. 6580, accessed January 9, 2026, at https://doi.org/10.1126/science.abg9065.
Faunce, K.E., Barber, L.B., Keefe, S.H., Jasmann, J.R., and Rapp, J.L., 2023a, Wastewater reuse and predicted ecological risk posed by contaminant mixtures in Potomac River watershed streams: Journal of the American Water Resources Association, v. 59, no. 4, p. 779–802, accessed January 7, 2026, at https://doi.org/10.1111/1752-1688.13110.
Faunce, K.E., Keefe, S.H., and Barber, L.B., 2023b, Upper Colorado River Basin accumulated wastewater ratios: U.S. Geological Survey data release, accessed on January 7, 2026, at https://doi.org/10.5066/p9c2gwhl.
Glüge, J., Scheringer, M., Cousins, I.T., DeWitt, J.C., Goldenman, G., Herzke, D., Lohmann, R., Ng, C.A., Trier, X., and Wang, Z., 2020, An overview of the uses of per- and polyfluoroalkyl substances (PFAS): Environmental Science: Process Impacts, v. 2020, no. 22, p. 2345–2373, accessed January 8, 2026, at https://pubs.rsc.org/en/content/articlehtml/2020/em/d0em00291g.
Goodrow, S.M., Ruppel, B., Lippincott, R.L., Post, G.B., and Procopio, N.A., 2020, Investigation of levels of perfluoroalkyl substances in surface water, sediment and fish tissue in New Jersey, USA: Science of the Total Environment, v. 729, accessed February 12, 2026, at https://doi.org/10.1016/j.scitotenv.2020.138839.
Gorski, P.R., 2025, The distribution and seasonality of per- and polyfluoroalkyl substances (PFAS) in the vertical water column of a stratified eutrophic freshwater lake: Environments, v. 12, no. 48, accessed on February 12, 2026, at https://doi.org/10.3390/environments12020048.
Grafiti LLC, 2026, SigmaPlot—Exact graphs and data analysis (ver. 16): Grafiti LLC software release, accessed on March 20, 2026, at https://grafiti.com/sigmaplot-v16/.
Grandjean, P., and Budtz-Jørgensen, E., 2013, Immunotoxicity of perfluorinated alkylates—Calculation of benchmark doses based on serum concentrations in children: Environmental Health, v. 12, article 35, accessed January 9, 2026, at https://doi.org/10.1186/1476-069X-12-35.
Hu, X.C., Andrews, D.Q., Lindstrom, A.B., Bruton, T.A., Schaider, L.A., Grandjean, P., Lohmann, R., Carignan, C.C., Blum, A., Balan, S.A., Higgins, C.P., and Sunderland, E.M., 2016, Detection of poly- and perfluoroalkyl substances (PFASs) in U.S. drinking water linked to industrial sites, military fire training areas, and wastewater treatment plants: Environmental Science & Technology Letters, v. 3, no. 10, p. 344–350, accessed January 9, 2026, at https://doi.org/10.1021/acs.estlett.6b00260.
Hu, X.C., Tokranov, A.K., Liddie, J., Zhang, X., Grandjean, P., Hart, J.E., Laden, F., Sun, Q., Yeung, L.W.Y., and Sunderland, E.M., 2019, Tap water contributions to plasma concentrations of poly- and perfluoroalkyl substances (PFAS) in a nationwide prospective cohort of U.S. women: Environmental Health Perspectives, v. 127, no. 6, article 67006, 11 p., accessed January 9, 2026, at https://doi.org/10.1289/EHP4093.
Interstate Technology & Regulatory Council, 2026a, PFAS home page—PFAS technical and regulatory guidance document: Interstate Technology & Regulatory Council webpage, accessed January 9, 2026, at https://pfas-1.itrcweb.org/.
Interstate Technology & Regulatory Council, 2026b, Data tables: Interstate Technology & Regulatory Council webpage, accessed March 16, 2026, at https://pfas-1.itrcweb.org/external-data-tables.
Kali, S.E., Osterlund, H., Viklander, M., and Blecken, G., 2025, Stormwater discharges affect PFAS occurrence, concentrations, and spatial distribution in water and bottom sediment of urban streams: Water Research, v. 271, accessed February 12, 2026, at https://doi.org/10.1016/j.watres.2024.122973.
Kim, J., Xin, X., Hawkins, G.L., Huang, Q., and Huang, C., 2024, Occurrence, fate, and removal, or per- and polyfluoroalkyl substances (PFAS) in small- and large-scale municipal wastewater treatment facilities in the United States: ACS ES&T Water, v. 4, no. 12, p. 5428–5436, accessed February 11, 2026, at https://doi.org/10.1021/acsestwater.4c00541.
Kurwadkar, S., Dane, J., Kanel, S.R., Nadagouda, M.N., Cawdrey, R.W., Ambade, B., Struckhoff, G.C., and Wilkin, R., 2022, Per- and polyfluoroalkyl substances in water and wastewater—A critical review of their global occurrence and distribution: Science of the Total Environment, v. 809, accessed January 9, 2026, at https://doi.org/10.1016/j.scitotenv.2021.151003.
Lenth, R., 2025, emmeans—Estimated marginal means, aka Least-Square Means (ver. 2.0.1): Comprehensive R Archive Network software release, accessed on February 4, 2026, at https://doi.org/10.32614/CRAN.package.emmeans.
Lipps, W.C., Baxter, T.E., and Braun-Howland, E., eds., 2017, Aggregate organic constituents in water and wastewater—5310 total organic carbon, in Standard methods for the examination of water and wastewater: Washington, D.C., APHA Press, accessed January 7, 2025, at https://www.standardmethods.org/doi/abs/10.2105/SMWW.2882.104.
Liu, G., Dhana, K., Furtado, J.D., Rood, J., Zong, G., Liang, L., Qi, L., Bray, G.A., DeJonge, L., Coull, B., Grandjean, P., and Sun, Q., 2018, Perfluoroalkyl substances and changes in body weight and resting metabolic rate in response to weight-loss diets—A prospective study: PLoS Medicine, v. 15, no. 2, accessed January 9, 2026, at https://doi.org/10.1371/journal.pmed.1002502.
Liu, Y., Wang, B., Guo, J., Sun, H., Zhang, Y., Wang, G., Yang, X., and Duan, J., 2026, Per– and polyfluoroalkyl substances (PFAS) in wastewater treatment plants—An overview of their occurrence, fate, effects, and ecological risks: Journal of Environmental Management, v. 399, accessed March 13, 2026, at https://doi.org/10.1016/j.jenvman.2026.128630.
Masoner, J.R., Kolpin, D.W., Cozzarelli, I.M., Barber, L.B., Burden, D.S., Foreman, W.T., Forshay, K.J., Furlong, E.T., Groves, J.F., Hladik, M.L., Hopton, M.E., Jaeschke, J.B., Keefe, S.H., Krabbenhoft, D.P., Lowrance, R., Romanok, K.M., Rus, D.L., Selbig, W.R., Williams, B.H., and Bradley, P.M., 2019, Urban stormwater—An overlooked pathway of extensive mixed contaminants to surface and groundwaters in the United States: Environmental Science & Technology, v. 53, no. 17, p. 10070–10081, accessed January 9, 2026, at https://doi.org/10.1021/acs.est.9b02867.
Masoner, J.R., Kolpin, D.W., Cozzarelli, I.M., Smalling, K.L., Bolyard, S.C., Field, J.A., Furlong, E.T., Gray, J.L., Lozinski, D., Reinhart, D., Rodowa, A., and Bradley, P.M., 2020, Landfill leachate contributes per-/poly-fluoroalkyl substances (PFAS) and pharmaceuticals to municipal wastewater: Environmental Science—Water Research & Technology, v. 6, no. 5, p. 1300–1311, accessed January 9, 2026, at https://doi.org/10.1039/D0EW00045K.
McAdoo, M.A., Connock, G.T., and Messinger, T., 2022, Occurrence of per- and polyfluoroalkyl substances and inorganic analytes in groundwater and surface water used as sources for public water supply in West Virginia: U.S. Geological Survey Scientific Investigations Report 2022–5067, p. 52, accessed on February 12, 2026, at https://doi.org/10.3133/sir20225067.
McMahon, P.B., Tokranov, A.K., Bexfield, L.M., Lindsey, B.D., Johnson, T.D., Lombard, M.A., and Watson, E., 2022, Perfluoroalkyl and polyfluoroalkyl substances in groundwater used as a source of drinking water in the Eastern United States: Environmental Science & Technology, v. 56, no. 4, p. 2279–2288, accessed January 9, 2026, at https://doi.org/10.1021/acs.est.1c04795.
Mehan, G.T., and Norris, N., 2026, Utilities are at risk of superfund liability: Journal AWWA, v. 118, no. 2, p. 5, accessed March 13, 2026, at https://doi.org/10.1002/awwa.70036.
Miguel-Chinchilla, L., Heasley, E., Loiselle, S., and Thronhill, I., 2019, Local and landscape influences on turbidity in urban streams—A global approach using citizen scientists: Freshwater Science, v. 38, no. 2, p. 303–320, accessed on February 12, 2026, at https://doi.org/10.1086/703460.
Müller, C.E., Spiess, N., Gerecke, A.C., Scheringer, M., and Hungerbuhler, K., 2011, Quantifying diffuse and point inputs of perfluoroalkyl acids in a nonindustrial river catchment: Environmental Science & Technology, v. 45, no. 23, p. 9901–9909, accessed on February 12, 2026, at https://doi.org/10.1021/es202140e.
Munch, J.W., and Grimmet, P.E., 2008, Method 522—Determination of 1,4-dioxane in drinking water by solid phase extraction (SPE) and gas chromatography/mass spectrometry (GC/MS) with selected ion monitoring (SIM; EPA/600/R-08/101, ver. 1): Cincinnati, Ohio, U.S. Environmental Protection Agency, accessed on January 27, 2026, at https://nepis.epa.gov/Exe/ZyPDF.cgi?Dockey=P100EQ8A.txt.
Munoz, G., Michaud, A.M., Liu, M., Duy, S.V., Montenach, D., Resseguier, C., Watteau, F., Sappin-Didier, V., Feder, F., Morvan, T., Houot, S., Desrosiers, M., Liu, J., and Sauve, S., 2022, Target and nontarget screening of PFAS in biosolids, composts, and other organic waste products for land application in France: Environmental Science & Technology, v. 56, no. 10, p. 6056–6068, accessed February 12, 2026, at https://doi.org/10.1021/acs.est.1c03697.
National Weather Service, 2025, Past precipitation: National Oceanic and Atmospheric Administration data release, accessed on April 13, 2025, at https://www.weather.gov/unr/precipitation-past.
New Jersey Department of Environmental Protection [NJDEP], 2024a, DEP DataMiner (ver. 3): New Jersey Department of Environmental Protection database, accessed August 18, 2025, at https://njems.nj.gov/DataMiner.
New Jersey Department of Environmental Protection [NJDEP], 2024b, New Jersey Statewide Water Supply Plan: New Jersey Department of Environmental Protection, 236 p., 12 app., accessed on January 9, 2026, at https://dep.nj.gov/water-supply-plan/.
New Jersey Department of Environmental Protection [NJDEP], 2025a, Per- and polyfluoroalkyl substances (PFAS)—PFAS standards and regulations: New Jersey Department of Environmental Protection webpage, accessed on January 9, 2026, at https://dep.nj.gov/pfas/standards/.
New Jersey Department of Environmental Protection [NJDEP], 2025b, Per- and polyfluoroalkyl substances (PFAS)—PFAS in drinking water: New Jersey Department of Environmental Protection webpage, accessed January 9, 2026, at https://dep.nj.gov/pfas/drinking-water/.
New Jersey Department of Environmental Protection [NJDEP], 2025c, New Jersey Discharge Permit Elimination System (NJPDES) [NJPDES Permitting Program, NJPDES Active Permit List]: NJDEP DataMiner database, accessed on November 20, 2025, at https://njems.nj.gov/DataMiner.
New Jersey Department of Environmental Protection [NJDEP], 2026, Surface water quality standards: New Jersey Department of Environmental Protection webpage, accessed on March 20, 2026, at https://dep.nj.gov/wms/bears/surface-water-quality-standards-swqs/.
New York State Department of Environmental Conservation, 2025, DECinfo locator layers: New York Department of Environmental Conservation webpage, accessed November 20, 2025, at https://dec.ny.gov/maps/interactive-maps/decinfo-locator/layers.
Newell, C.J., Javed, H., Li, Y., Johnson, N.W., Richardson, S.D., Connor, J.A., and Adamson, D.T., 2022, Enhanced attenuation (EA) to manage PFAS plumes in groundwater: Remediation, v. 32, no. 4, p. 239–257, accessed January 15, 2026, at https://doi.org/10.1002/rem.21731.
Nguyen, M.A., Norström, K., Wiberg, K., Gustavsson, J., Josefsson, S., and Ahrens, L., 2022, Seasonal trends of per- and polyfluoroalkyl substances in river water affected by fire training sites and wastewater treatment plants: Chemosphere, v. 308, accessed February 12, 2026, at https://doi.org/10.1016/j.chemosphere.2022.136467.
North Jersey District Water Supply Commission, 2018, About NJDWSC: North Jersey District Water Supply Commission webpage, accessed on February 12, 2026, at https://www.njdwsc.com/about-njdwsc.
O’Dell, J.W., Potter, B.B., Lobring, L.B., and Martin, T.D., 1994, Method 245.1—Determination of mercury in water by cold vapor atomic absorption spectrometry (ver. 3.0): Cincinnati, Ohio, U.S. Environmental Protection Agency, 18 p., accessed on February 3, 2026, at https://www.epa.gov/sites/default/files/2015-08/documents/method_245-1_rev_3_1994.pdf.
Oyen, T., and Ophori, D., 2025, Regional groundwater flow and adjective contaminant transport modeling in a typical hydrogeological environment of Northern New Jersey: Hydrology, v. 12, no. 7, article 167, accessed January 15, 2026, at https://doi.org/10.3390/hydrology12070167.
Perkin Elmer, 2026, Syngistix for ICP-MS software version 3.2: Shelton, Conn., Perkin Elmer, accessed March 25, 2026, at https://www.perkinelmer.com/category/inductively-coupled-plasma-mass-spectrometry-icp-ms/icp-ms-software.
Pfotenhauer, D., Sellers, E., Olson, M., Praedel, K., and Shafer, M., 2022, PFAS concentrations and deposition in precipitation—An intensive 5-month study at National Atmospheric Deposition Program—National trends sites (NADP-NTN) across Wisconsin, USA: Atmospheric Environment, v. 291, accessed February 12, 2026, at https://doi.org/10.1016/j.atmosenv.2022.119368.
Podder, A., Sadmani, A.H.M.A., Reinhart, D., Chang, N., and Goel, R., 2021, Per and poly-fluoroalkyl substances (PFAS) as a contaminant of emerging concern in surface water—A transboundary review of their occurrences and toxicity effects: Journal of Hazardous Materials, v. 419, accessed February 12, 2026, at https://doi.org/10.1016/j.jhazmat.2021.126361.
Post, G.B., 2021, Recent US State and Federal drinking water guidelines for per‐ and polyfluoroalkyl substances: Environmental Toxicology and Chemistry, v. 40, no. 3, p. 550–563, accessed January 9, 2026, at https://doi.org/10.1002/etc.4863.
Post, G.B., Cooper, K.R., Louis, J.B., and Lippincott, R.L., 2009, Addition to “Response to comment on ‘Occurrence and potential significance of perfluorooctanoic acid (PFOA) detected in New Jersey public drinking water systems’”: Environmental Science & Technology, v. 43, no. 22, p. 8702, accessed January 9, 2026, at https://doi.org/10.1021/es903038p.
Post, G.B.V., Louis, J.B., Lippincott, R.L., and Procopio, N.A., 2013, Occurrence of Perfluorinated compounds in raw water from New Jersey public drinking water systems: Environmental Science & Technology, v. 47, no. 23, p. 13266–13275, accessed January 9, 2026, at https://doi.org/10.1021/es402884x.
Procopio, N.A., Karl, R., Goodrow, S.M., Maggio, J., Louis, J.B., and Atherholt, T.B., 2017, Occurrence and source identification of perfluoroalkyl acids (PFAAs) in the Metedeconk River watershed, New Jersey: Environmental Science and Pollution Research International, v. 24, no. 35, p. 27125–27135, accessed January 9, 2026, at https://doi.org/10.1007/s11356-017-0309-3.
R Core Team, 2013, R—A language and environment for statistical computing (stats, ver. 4.5.2): R Foundation for Statistical Computing software release, accessed on February 4, 2026, at http://www.R-project.org/.
R Core Team, 2021, R—A language and environment for statistical computing (ver. 4.5.2): R Foundation for Statistical Computing software release, accessed on February 4, 2025, at https://www.R-project.org/.
Rantz, S.E., 1982, Measurement and computation of streamflow: U.S. Geological Survey Water Supply Paper 2175, accessed on February 27, 2026, at https://doi.org/10.3133/wsp2175.
Romanok, K.M., Schreiner, M.L., Gray, J.T., Smalling, K.L., Trainor, J.J., Kneser, M., Boerner, J., Williams, B.M., Brown, E.J., Atkinson, R.W., Bernal, E.C., Bunnell, Z.J., Bjorklund, B.W., Bowen, K.M., Bowen, P.W., Carullo, S.A., Cohl, J.A., Collenburg, J.V., Elstad, J.B., Medina, J.A., Mooney, C.T., and Sirotniak, L.M., 2026, Per- and polyfluoroalkyl substances (PFAS) concentration results in the Wanaque, Ramapo, Pompton and Passaic River watersheds, New Jersey 2025: U.S. Geological Survey data release, https://doi.org/10.5066/P1RGG9YQ.
Salvatore, D., Mok, K., Garrett, K.K., Poudrier, G., Brown, P., Birnbaum, L.S., Goldenman, G., Miller, M.F., Patton, S., Poehlein, M., Varshavsky, J., and Cordner, A., 2022, Presumptive contamination—A new approach to PFAS contamination based on likely sources: Environmental Science & Technology Letters, v. 9, no. 11, p. 983–990, accessed January 9, 2026, at https://doi.org/10.1021/acs.estlett.2c00502.
Schultz, M.M., Higgins, C.P., Huset, C.A., Luthy, R.G., Barofsky, D.F., and Field, J.A., 2006, Fluorochemical mass flows in a municipal wastewater treatment facility: Environmental Science & Technology, v. 40, is. 23, p. 7350–7357, accessed on February 12, 2026, at https://doi.org/10.1021/es061025m.
Sepulvado, J.G., Blaine, A.C., Hundal, L.S., and Higgins, C.P., 2011, Occurrence and fate of perfluorochemicals in soil following the land application of municipal biosolids: Environmental Science & Technology, v. 45, no. 19, p. 8106–8112, accessed February 12, 2026, at https://doi.org/10.1021/es103903d.
Shoemaker, J.A., and Tettenhorst, D.R., 2020, Method 537.1—Determination of selected per- and polyfluorinated alkyl substances in drinking water by solid phase extraction and liquid chromatography/tandem mass spectrometry (LC/MS/MS; ver. 2.0): Cincinnati, Ohio, U.S. Environmental Protection Agency, 50 p. accessed on March 16, 2026, at https://cfpub.epa.gov/si/si_public_record_report.cfm?dirEntryId=348508&Lab=CESER&simpleSearch=0&showCriteria=2&searchAll=537.1&TIMSType=&dateBeginPubl ishedPresented=03%2F24%2F2018.
Sims, J.L., Stroski, K.M., Kim, S., Killeen, G., Ehalt, R., Simcik, M.F., and Brooks, B.W., 2022, Global occurrence and probabilistic environmental health hazard assessment of per- and polyfluoroalkyl substances (PFASs) in groundwater and surface waters: Science of the Total Environment, v. 816, accessed January 9, 2026, at https://doi.org/10.1016/j.scitotenv.2021.151535.
Smalling, K.L., Romanok, K.M., Bradley, P.M., Morriss, M.C., Gray, J.L., Kanagy, L.K., Gordon, S.E., Williams, B.M., Breitmeyer, S.E., Jones, D.K., DeCicco, L.A., Eagles-Smith, C.A., and Wagner, T., 2023, Per- and polyfluoroalkyl substances (PFAS) in United States tapwater—Comparison of underserved private-well and public-supply exposures and associated health implications: Environment International, v. 178, accessed January 9, 2026, at https://doi.org/10.1016/j.envint.2023.108033.
Smith, R.M., and Kaushal, S.S., 2015, Carbon cycle of an urban watershed—Exports, sources, and metabolism: Biogeochemistry, v. 126, no. 1–2, p. 173–195, accessed February 12, 2026, at https://doi.org/10.1007/s10533-015-0151-y.
Sunderland, E.M., Hu, X.C., Dassuncao, C., Tokranov, A.K., Wagner, C.C., and Allen, J.G., 2019, A review of the pathways of human exposure to poly- and perfluoroalkyl substances (PFASs) and present understanding of health effects: Journal of Exposure Science & Environmental Epidemiology, v. 29, no. 2, p. 131–147, accessed January 9, 2026, at https://doi.org/10.1038/s41370-018-0094-1.
Tavasoli, E., Luek, J.L., Malley, J.P., Jr., and Mouser, P.J., 2021, Distribution and fate of per- and polyfluoroalkyl substances (PFAS) in wastewater treatment facilities: Environmental Science. Processes & Impacts, v. 23, no. 6, p. 903–913, accessed February 12, 2026, at https://doi.org/10.1039/D1EM00032B.
Thompson, K.A., Mortazavian, S., Gonzalez, D.J., Bott, C., Hooper, J., Schaefer, C.E., and Dickenson, E.R.V., 2022, Poly- and perfluoroalkyl substances in municipal wastewater treatment plants in the United States—Seasonal patterns and meta-analysis of long-term trends and average concentrations: ACS ES&T Water, v. 2, no. 5, p. 690–700, accessed February 12, 2026, at https://doi.org/10.1021/acsestwater.1c00377.
Tokranov, A.K., Bradley, P.M., Focazio, M.J., Kent, D.B., LeBlanc, D.R., McCoy, J.W., Smalling, K.L., Steevens, J.A., and Toccalino, P.L., 2021, Integrated science for the study of perfluoroalkyl and polyfluoroalkyl substances (PFAS) in the environment—A strategic science vision for the U.S. Geological Survey: U.S. Geological Survey Circular 1490, 50 p., accessed on January 9, 2026, at https://doi.org/10.3133/cir1490.
Tokranov, A.K., Ransom, K.M., Bexfield, L.M., Lindsey, B.D., Watson, E., Dupuy, D.I., Stackelberg, P.E., Fram, M.S., Voss, S.A., Kingsbury, J.A., Jurgens, B.C., Smalling, K.L., and Bradley, P.M., 2024, Predictions of groundwater PFAS occurrence at drinking water supply depths in the United States: Science, v. 386, no. 6723, p. 748–755, accessed January 16, 2026, at https://doi.org/10.1126/science.ado6638.
Tshangana, C.S., Nhlengethwa, S.T., Glass, S., Denison, S., Kuvarega, A.T., Nkambule, T.T.I., Mamba, B.B., Alvarez, P.J.J., and Muleja, A.A., 2025, Technology status to treat PFAS-contaminated water and limiting factors for their effective full-scale application: NPJ Clean Water, v. 8, article 41, accessed March 17, 2026, at https://doi.org/10.1038/s41545-025-00457-3.
Turnipseed, D.P., and Sauer, V.B., 2010, Discharge measurements at gaging stations: U.S. Geological Survey Techniques and Methods book 3, chap. A8, 87 p., accessed on February 5, 2026, at https://pubs.usgs.gov/tm/tm3-a8/.
U.S. Census Bureau, 2020, “Total population,” Decennial census, DEC demographic and housing characteristics, table P1: U.S. Census Bureau data, accessed February 9, 2026, at https://data.census.gov/table/DECENNIALDHC2020.P1.
U.S. Environmental Protection Agency [EPA], 2012, NHDPlus National Data (ver. 2.1): U.S. Environmental Protection Agency data, accessed May 16, 2025, at https://www.epa.gov/waterdata/nhdplus-national-data.
U.S. Environmental Protection Agency [EPA], 2017, Causal Analysis/Diagnosis Decision Information System (CADDIS): U.S. Environmental Protection Agency webpage, accessed on February 13, 2026, at https://www.epa.gov/caddis.
U.S. Environmental Protection Agency [EPA], 2024a, Method 1633—Analysis of per- and polyfluoroalkyl substances (PFAS) in aqueous, solid, biosolids, and tissue samples by LC-MS/MS (revision A, December 2024): U.S. Environmental Protection Agency, accessed on January 8, 2026, at https://www.epa.gov/system/files/documents/2024-12/method-1633a-december-5-2024-508-compliant.pdf.
U.S. Environmental Protection Agency [EPA], 2024b, Water pollution search (Discharge monitoring report (DMR): U.S. Environmental Protection Agency database, accessed August 19, 2025, at https://echo.epa.gov/trends/loading-tool/water-pollution-search.
U.S. Environmental Protection Agency [EPA], 2025a, Per- and polyfluoroalkyl substances (PFAS) final pfas national primary drinking water regulation: U.S. Environmental Protection Agency webpage, accessed January 9, 2025, at https://www.epa.gov/sdwa/and-polyfluoroalkyl-substances-pfas.
U.S. Environmental Protection Agency [EPA], 2025b, EPA announces it will keep maximum contaminant levels for PFOA, PFOS: U.S. Environmental Protection Agency press release, accessed January 9, 2026, at https://www.epa.gov/newsreleases/epa-announces-it-will-keep-maximum-contaminant-levels-pfoa-pfos.
U.S. Environmental Protection Agency [EPA], 2025c, PFAS analytics tool: U.S. Environmental Protection Agency, accessed November 20, 2025, at https://awsedap.epa.gov/public/extensions/PFAS_Tools/PFAS_Tools.html.
U.S. Geological Survey [USGS], 2014, National Water-Quality Assessment (NAWQA) Project—Glossary: U.S. Geological Survey webpage, accessed on April 13, 2026, at https://water.usgs.gov/nawqa/glos.html.
U.S. Geological Survey [USGS], 2018, General introduction for the “National field manual for the collection of water-quality data” (ver. 1.1, June 2018): U.S. Geological Survey Techniques and Methods, book 9, chap. A0, 4 p., https://doi.org/10.3133/tm9A0. [Supersedes USGS Techniques and Methods, book 9, chap. A0, version 1.0.]
U.S. Geological Survey [USGS], 2025, Watershed Boundary Dataset (WBD) Hydrologic Unit Codes (HUC) 10: U.S. Geological Survey data, accessed June 17, 2025, at https://www.usgs.gov/national-hydrography/access-national-hydrography-products.
U.S. Geological Survey [USGS], 2026, USGS Water Data for the Nation: U.S. Geological Survey National Water Information System website, accessed on March 19, 2026, at https://doi.org/10.5066/F7P55KJN.
Wang, Y., Kim, K., Huang, C., Hawkins, G.L., Li, K., Chen, Y., and Huang, Q., 2022, Occurrence of per- and polyfluoroalkyl substances in water—A review: Environmental Science—Water Research & Technology, v. 8, no. 6, p. 1136–1151, accessed February 12, 2026, at https://doi.org/10.1039/D1EW00851J.
Wei, T., and Simko, V., 2024, corrplot—Visualization of a correlation matrix (ver. 0.95): accessed on February 4, 2025, at https://github.com/taiyun/corrplot. [Also available at https://doi.org/10.32614/CRAN.package.corrplot.]
Weisman, R.J., Barber, L.B., Faunce, K.E., Rapp, J.L., and Ferreira, C.M., 2021, Temporal variations of de facto wastewater reuse and disinfection by-products in public water systems in the Shenandoah River watershed, USA: Water Practice & Technology, v. 16, no. 4, p. 1434–1445, accessed March 17, 2026, at https://doi.org/10.2166/wpt.2021.076.
Williams, B.M., Brown, E.J., Smalling, K.L., Schreiner, M.L., Romanok, K.M., and Gray, J.T., 2026, PFAS in surface waters of the nontidal Passaic River Basin: U.S. Geological Survey, at geonarrative.usgs.gov/northjerseypfas/.
Appendix 1. Ancillary Study Results
Introduction
Information contained in this appendix may be helpful for interpreting the results detailed in the report. The full set of results and additional information are in Romanok and others (2026).
Sample Collection
Surface-water-quality samples were collected from sites in the Wanaque, Ramapo, Pompton, and Passaic River watersheds, part of the Passaic River Basin in New Jersey. Samples were collected seasonally under base-flow conditions in January, March, July, and September 2025. Additional samples were collected during or after rain events in July and December 2025. A full list of the 37 sites included in the study and when they were sampled is available in table 1.1. Water-quality samples were analyzed for per- and polyfluoroalkyl substances (PFAS) and ancillary data. A full list of analytes and analytical method information is in the data release (Romanok and others, 2026).
Table 1.1.
Summary of sampling site and event information for a study completed in the Passaic River Basin, New Jersey, 2025.[Data are from Romanok and others (2026). Additional station information is available from U.S. Geological Survey (2026). USGS, U.S. Geological Survey NJ, New Jersey; X, sample was collected; —, no sample was collected; ft, feet; DS, downstream; Co, County; Rt, Route; nr, near; US, upstream; Bk, Brook; Rd, Road; Ave, Avenue; R, river; Chnl, Channel; bl, below; Trib, tributary; QW, water quality; CR, County Route; div, diversion]
Streamflow
When possible, streamflow was measured directly using an acoustic Doppler current profiler or acoustic Doppler velocimeter, measured remotely using continuous streamflow streamgages, or calculated by extrapolating upstream streamflow and drainage area. Instantaneous streamflow data were used to calculate yields of perfluorooctanoate (PFOA) and perfluorooctane sulfonate (PFOS). Streamflow data are in table 1.2, and additional details are in the data release (Romanok and others, 2026). The data are also available through the U.S. Geological Survey (USGS) Water Data for the Nation website (USGS, 2026) using the USGS station number.
Table 1.2.
Instantaneous streamflow data, in cubic feet per second, for site visits associated with water-quality samples.[Data are from Romanok and others (2026). Additional station information is in table 1.1. Additional streamflow method information is in Romanok and others (2026). E, estimated; —, no flow measured or no sample collected]
Flow was calculated using time-of-travel from upstream sites and is considered estimated owing to river ice causing rapidly changing flow dynamics and (or) available measured upstream flows.
Streamflow was provided by Passaic Valley Water Commission and published in Romanok and others (2026).
Historical Data Retrieval
Historical concentration results of PFOA and PFOS analyzed in water-quality samples from reservoirs, influent, effluent, groundwater, and surface water were obtained from multiple sources. Results are reported in tables 1.3, 1.4, and 1.5.
Table 1.3.
Perfluorooctane sulfonate (PFOS) and perfluorooctanoate (PFOA) concentrations of samples collected from groundwater wells and surface-water sites within the Passaic River Basin, New Jersey, 2020–23.[Data are from Romanok and others (2026). Additional station information is available from U.S. Geological Survey (2026). Samples were analyzed using U.S. Environmental Protection Agency (EPA) Methods 537.1 or 1633 (Shoemaker and Tettenhorst, 2020; EPA, 2024a). Dates are shown in month/day/year. USGS, U.S. Geological Survey; ng/L, nanograms per liter; <, less than the reporting limit; NJ, New Jersey NA, not applicable; Rd, Road; Re, reservoir; R, River; abve, above; Bk, Brook; nr, near; trib, tributary; Hist, Historic; P, Park]
Table 1.4.
Perfluorooctane sulfonate (PFOS) and perfluorooctanoate (PFOA) concentration data for wastewater effluent, 2021–24.[Data are from a New Jersey Open Public Records Act request. Samples were analyzed using U.S. Environmental Protection Agency (EPA) methods 537 or 1633 (Shoemaker and Tettenhorst, 2020; EPA, 2024a) modified for New Jersey. Dates are shown in month/day/year; ng/L, nanograms per liter; <, less than]
Table 1.5.
Perfluorooctane sulfonate (PFOS) and perfluorooctanoate (PFOA) concentration data for effluent sample obtained from the New Jersey Department of Environmental Protection (2025), 2023–24.[Dates are shown in month/day/year. NJPDES, New Jersey Pollutant Discharge Elimination System; ng/L, nanograms per liter; GP, general permit; BGR, General Remediation Clean up Discharge General Permit (Category BGR); <, less than reporting limit; IP, individual permit; GW, groundwater]
Table 1.6.
Summary of the total per- and polyfluoroalkyl substances yield calculation results, in grams per day per square kilometer, in the local catchment area in the Passaic River Basin, New Jersey, 2025.[Data are from Romanok and others (2026). Additional station information is available from U.S. Geological Survey (2026) and table 1.1. —, indicates no yield calculated]
Table 1.7.
Summary of the total per- and polyfluoroalkyl substances yield calculation results, in grams per day per square kilometer, in the upstream catchment area in the Passaic River Basin, New Jersey, 2025.[Data are from Romanok and others (2026). Additional station information is available from U.S. Geological Survey (2026). —, indicates no yield calculated]
Table 1.8.
Reported p-values for the Spearman’s rank correlation between landscape predictors in the local catchment and the concentration of per- and polyfluoroalkyl substances (PFAS) and other water-quality parameters from surface-water samples collected under base-flow conditions in the Passaic River Basin, New Jersey, 2025.[Data are from Romanok and others (2026). Land-cover categories are from Dewitz (2023). P-values less than or equal to 0.05 are considered significant. Parentheses indicate a negative correlation. ∑, cumulative; PFOA, perfluorooctanoate; PFOS, perfluorooctane sulfonate; ECHO, U.S. Environmental Protection Agency Enforcement and Compliance History Online; NJPDES, New Jersey Permitted Discharge Elimination System; ACCWW, accumulated wastewater]
Table 1.9.
Reported p-values for the Spearman’s rank correlation between landscape predictors in the upstream watershed and the concentration of per- and polyfluoroalkyl substances (PFAS) and other water-quality parameters from surface-water samples collected under base-flow conditions in the Passaic River Basin, New Jersey, 2025.[Data are from Romanok and others (2026). Land-cover categories are from Dewitz (2023). P-values less than or equal to 0.05 are considered significant. Parentheses indicate a negative correlation. ∑, cumulative; PFOA, perfluorooctanoate; PFOS, perfluorooctane sulfonate; ECHO, U.S. Environmental Protection Agency Enforcement and Compliance History Online; NJPDES, New Jersey Permitted Discharge Elimination System; SPDES, [New York] State Pollutant Discharge Elimination System]
Table 1.10.
Summary statistics for simple linear regressions assessing the relationship between log-normalized concentrations of per- and polyfluoroalkyl substances (PFAS) and select landscape predictors in the local catchment that showed significance during the Spearman’s rank correlation analysis, in the Passaic River Basin, 2025.[Data are from Romanok and others (2026). Land-cover categories are from Dewitz (2023). Results of the Spearman’s rank correlation analysis are in table 1.9. P-values less than or equal to 0.05 are considered significant. ∑, cumulative; PFOA, perfluorooctanoate; PFOS, perfluorooctane sulfonate; R2, coefficient of determination; —, no analysis was performed because there was no significance in the Spearman’s rank correlation analysis; ACCWW, accumulated wastewater; ECHO, U.S. Environmental Protection Agency Enforcement and Compliance History Online; NJPDES, New Jersey Permitted Discharge Elimination System; <, less than]
Table 1.11.
Summary statistics for simple linear regressions assessing the relationship between log-normalized concentrations of per- and polyfluoroalkyl substances (PFAS) and select landscape predictors in the upstream watersheds that showed significance during the Spearman’s rank correlation analysis, in the Passaic River Basin, 2025.[Data are from Romanok and others (2026). P-values less than or equal to 0.05 are considered significant. Land-cover categories are from Dewitz (2023). Results of the Spearman’s rank correlation analysis are in table 1.9. ∑, cumulative; PFOA, perfluorooctanoate; PFOS, perfluorooctane sulfonate; R2, coefficient of determination; —, no analysis was performed because there was no significance in the Spearman’s rank correlation; ECHO, U.S. Environmental Protection Agency Enforcement and Compliance History Online; NJPDES, New Jersey Permitted Discharge Elimination System; SPDES, [New York] State Pollutant Discharge Elimination System; <, less than]
Table 1.12.
Mean-annual and mean-August accumulated wastewater percentages for the flowline associated with each site sampled in the Passaic River Basin, New Jersey, 2025.[Data are from Romanok and others (2026). Additional station information is available from U.S. Geological Survey (2026) and table 1.1. COMID, common identifier of an NHDFlowline feature]
References Cited
Dewitz, J., 2023, National Land Cover Database (NLCD) 2021 products: U.S. Geological Survey data release, accessed on February 27, 2026, at https://doi.org/10.5066/P9JZ7AO3.
New Jersey Department of Environmental Protection, 2025, Division of Water Quality PFAS strategy—Identify, reduce, and eliminate sources of PFAS: New Jersey Department of Environmental Protection webpage, accessed September 25, 2025, at https://dep.nj.gov/dwq/pfas/.
New York State Department of Environmental Conservation, 2025, DECinfo locator layers: New York Department of Environmental Conservation webpage, accessed November 20, 2025, at https://dec.ny.gov/maps/interactive-maps/decinfo-locator/layers.
Romanok, K.M., Schreiner, M.L., Gray, J.T., Smalling, K.L., Trainor, J.J., Kneser, M., Boerner, J., Williams, B.M., Brown, E.J., Atkinson, R.W., Bernal, E.C., Bunnell, Z.J., Bjorklund, B.W., Bowen, K.M., Bowen, P.W., Carullo, S.A., Cohl, J.A., Collenburg, J.V., Elstad, J.B., Medina, J.A., Mooney, C.T., and Sirotniak, L.M., 2026, Per- and polyfluoroalkyl substances (PFAS) concentration results in the Wanaque, Ramapo, Pompton and Passaic River watersheds, New Jersey 2025: U.S. Geological Survey data release, https://doi.org/10.5066/P1RGG9YQ.
Shoemaker, J.A., and Tettenhorst, D.R., 2020, Method 537.1—Determination of selected per- and polyfluorinated alkyl substances in drinking water by solid phase extraction and liquid chromatography/tandem mass spectrometry (LC/MS/MS; ver. 2.0): Cincinnati, Ohio, U.S. Environmental Protection Agency, 50 p. accessed on March 16, 2026, at https://cfpub.epa.gov/si/si_public_record_report.cfm?dirEntryId=348508&Lab=CESER&simpleSearch=0&showCriteria=2&searchAll=537.1&TIMSType=&dateBeginPubl ishedPresented=03%2F24%2F2018.
U.S. Environmental Protection Agency [EPA], 2024a, Method 1633—Analysis of per- and polyfluoroalkyl substances (PFAS) in aqueous, solid, biosolids, and tissue samples by LC-MS/MS (revision A, December 2024): U.S. Environmental Protection Agency, accessed on January 8, 2026, at https://www.epa.gov/system/files/documents/2024-12/method-1633a-december-5-2024-508-compliant.pdf.
U.S. Environmental Protection Agency [EPA], 2024b, Water pollution search (Discharge monitoring report (DMR): U.S. Environmental Protection Agency database, accessed August 19, 2025, at https://echo.epa.gov/trends/loading-tool/water-pollution-search.
U.S. Geological Survey, 2026, USGS Water Data for the Nation: U.S. Geological Survey National Water Information System website, accessed March 19, 2026, at https://doi.org/10.5066/F7P55KJN.
Appendix 2. Presumptive Sources of Per- and Polyfluoroalkyl Substances
Potential Source Datasets and Processing
The potential PFAS sources compiled for this report were obtained from the following databases: (1) U.S. Environmental Protection Agency (EPA) Environmental Compliance and History Online (ECHO) (EPA, 2024), per- and polyfluoroalkyl substances (PFAS) Analytics Tools (EPA, 2025), (2) New Jersey Department of Environmental Protection (NJDEP) New Jersey Pollutant Discharge Elimination System (NJPDES) (NJDEP, 2025a) and, (3) [New York] State Pollutant Discharge Elimination System (SPDES) (New York State Department of Environmental Conservation, 2025). These sources were selected based on literature describing known and suspected sources of PFAS, which are listed in the bibliography at the end of this section. For more information on data processing, please reference Romanok and others (2026).
Enforcement Compliance and History Online (ECHO), Per- and Polyfluoroalkyl Substances (PFAS) Analytic Tools
URL: https://echo.epa.gov/trends/pfas-tools#background
This is a national dataset and is limited by State requirements. The facilities included in this dataset fall within industry sectors that are known to produce or manufacture PFAS, but whether or not each facility handles PFAS is not directly known. The point locations are primarily self-reported by the facility and often do not represent direct transport to a stream or waterbody.
The ECHO datasets that were summarized in this effort include industry, production, and spills. Industry categories include undefined, airports, chemical manufacturing, cleaning product manufacturing, electronics industry, fire training, furniture and carpet, glass products, industrial gas, metal coating, metal machinery manufacturing, mining and refining, national defense, oil and gas, paint and coatings, paper mills and products, petroleum, plastics and resins, printing, textiles and leather, and waste management.
Caveats and Limitations
This dataset relies on self-reported location and categorical data, which may not be accurate or complete. Efforts were made to remove duplicates within this dataset and between the ECHO dataset and the state datasets (NJPDES and SPDES). When duplicates were found between the datasets, the state record was used and the ECHO record was removed.
New Jersey Pollutant Discharge Elimination System (NJPDES)
URL: https://njems.nj.gov/DataMiner
The NJDEP DataMiner is a State-operated website that allows the public to download up-to-date environmental data for numerous categories, including information about the NJPDES permitting program, which regulates and authorizes the direct or indirect discharge of pollutants to surface water and groundwater in New Jersey. On November 20, 2025, a list of all active NJPDES permits was downloaded, regardless of discharge type. Permit types that have the potential to be a source of PFAS based on information from the NJDEP Division of Water Quality PFAS Strategy (NJDEP, 2025b) and the expertise of the authors were retained for analysis. Permit types that were not identified as being potential PFAS sources were removed from the dataset before any additional processing. Please refer to table 2.1 for more information on the permit types included in this dataset.
Permitted facilities outside of the Passaic River Basin, New Jersey, were removed from the dataset. In some cases, a single facility may hold more than one NJPDES permit owing to different methods of discharge occurring at the facility. In these instances, the individual permits were retained to maintain an accurate count of locations where PFAS may be discharged to waters. The final dataset includes 653 NJPDES permit locations.
Caveats and Limitations
Permit data were downloaded from an external source; the authors curated the dataset to retain only relevant locations but made no further changes to the underlying data. An effort was made to only include NJPDES permits that have the potential to be a source of PFAS based on the discharge type (table 2.1); however, the authors did not review individual facility effluent data and cannot confirm if these locations are actively discharging PFAS. Conversely, it is possible that a permitted facility excluded from this dataset could later be determined to be a source of PFAS.
State Pollutant Discharge Elimination System (SPDES)
Data Download URL: https://www.arcgis.com/apps/instant/filtergallery/index.html?appid=5723a116393945469f9cd32b0b833d4d
Additional data layers URL: https://dec.ny.gov/maps/interactive-maps/decinfo-locator/layers
DECinfo Locator is a tool available through the New York State Department of Environmental Conservation that provides information on permitted facilities in New York. Some of these facilities are permitted through the SPDES program, which regulates point source discharge to surface water and groundwater. Permitted facilities outside of the SPDES program are not authorized to discharge directly into state waters; however, these facilities may indirectly affect environmental quality. Select permitted facilities outside of the SPDES program were included in this dataset because of the potential to be a source of PFAS (for example, boat ramps). Both types of facilities (discharge and non-discharge) included in this dataset are referred to as SPDES permit locations.
Point layers from the DECinfo Locator were added to ArcGIS Pro (version 3.5.2; Esri, 2025) via ArcGIS Online on November 20, 2025. Because only a small part of the Passaic River Basin crosses into New York, most of the permitted facilities were outside of the study area and not included in the dataset. Facilities within the study area were summarized by permit type, and the expertise of authors was leveraged to determine which permit types to retain or exclude. Permit types included in the dataset are in table 2.1. The final dataset includes 217 SPDES permit locations.
Caveats and Limitations
Permit data were downloaded from an external source; this dataset is a combination of permitted facilities that discharge directly to waters (SPDES) and other indirect sources that may release PFAS into the environment. The authors curated the dataset to retain only relevant locations but made no further changes to the underlying data. An effort was made to only include permit types that have the potential to be sources of PFAS (table 2.1); however, the authors did not review individual facility effluent data and cannot confirm if these locations are actively discharging PFAS. Conversely, it is possible that a permitted facility excluded from this dataset could later be determined to be a source of PFAS.
Bibliography—Supporting Literature for Potential Source Selection
Below is a list of publications that supported the decision-making of determining types of permits (table 2.1) to include in the counts of potential sources for this study.
Bulson, E.E., Remucal, C.K., and Hicks, A.L., 2023, End-of-life circulation of PFAS in metal recycling streams—A sustainability-focused review: Resources, Conservation and Recycling, v. 194, accessed September 25, 2025, at https://doi.org/10.1016/j.resconrec.2023.106978.
Chukwuonye, G.N., Alqattan, Z.A., Jones, M., Jones, C., Brusseau, M.L., and Ramírez-Andreotta, M.D., 2024, Toxic layering and compound extremes—Per- and polyfluoroalkyl substances (PFAS) exposure in rural, environmental-justice copper-mining communities: Science of the Total Environment, v. 957, accessed September 25, 2025, at https://doi.org/10.1016/j.scitotenv.2024.177767.
Donley, N., Cox, C., Bennett, K., Temkin, A.M., Andrews, D.Q., and Naidenko, O.V., 2024, Forever pesticides—A growing source of PFAS contamination in the environment: Environmental Health Perspectives, v. 132, no. 7, accessed September 25, 2025, at https://doi.org/10.1289/EHP13954.
Douglas, G.B., Vanderzalm, J.L., Williams, M., Kirby, J.K., Kookana, R.S., Bastow, T.P., Bauer, M., Bowles, K.C., Skuse, D., and Davis, G.B., 2023, PFAS contaminated asphalt and concrete—Knowledge gaps for future research and management: Science of the Total Environment, v. 887, accessed September 25, 2025, at https://doi.org/10.1016/j.scitotenv.2023.164025.
Martinez, B., Robey, N.M., Da Silva, B.F., Ditz, H., Sobczak, W.J., Deliz Quiñones, K.Y., and Bowden, J.A., 2023, Swimming with PFAS in public and private pools: Chemosphere, v. 310, accessed September 25, 2025, at https://doi.org/10.1016/j.chemosphere.2022.136765.
New Jersey Department of Environmental Protection, 2025, Division of Water Quality PFAS Strategy—Identify, reduce, and eliminate sources of PFAS: New Jersey Department of Environmental Protection webpage, accessed September 25, 2025, at https://dep.nj.gov/dwq/pfas/.
Sullivan, C., 2025, NH lawmakers look to ban ski and boat waxes containing PFAS: New Hampshire Bulletin, accessed September 25, 2025, at https://www.nhpr.org/nh-news/2025-03-25/nh-lawmakers-look-to-ban-ski-boat-waxes-containing-pfas.
Table 2.1.
Wastewater discharge permit types and associated information.[NJDEP, New Jersey Department of Environmental Protection; GP, general permit; DST, stormwater discharge; DEP, Department of Environmental Protection; SIC, standard industrial classification; NAICS, North American industry classification system; NJ, New Jersey; EPA, U.S. Environmental Protection Agency; DSW, discharge to surface water; FW1, fresh waters that are to be maintained in their natural state of quality; CSO, combined sewer overflow; DTW, Domestic Treatment Works; MGD, million gallons per day; SIU, significant indirect user; POTW, publicly owned treatment works; IP, individual permit; NYSDEC, New York State Department of Environmental Conservation; DEC, Department of Environmental Conservation; kg, kilogram; SPDES, State Pollutant Discharge Elimination System]
| Source | Permit name | Type | Permit code | Description |
|---|---|---|---|---|
| NJDEP, 2025a | Basic Industrial Stormwater (GP) (5G2) | DST (GP) | 5G2 | This general permit is available to regulated industrial facilities that have eliminated, or can eliminate within 6 months of authorization, all exposure of industrial materials or activities to stormwater discharges (rainfall and snowmelt waters). Exposure may be eliminated by covering the materials or activities or by moving materials or activities indoors. |
| NJDEP, 2025a | Concrete Products Manufacturing Stormwater (GP) (CPM) | DST (GP) | CPM | This general permit regulates industrial stormwater discharges to surface and groundwaters of the State from facilities that manufacture concrete or concrete products (block and brick, and ready mixed concrete) or facilities classified as manufacturers of concrete or concrete-related products by the DEP. |
| NJDEP, 2025a | Hot Mix Asphalt Producers Stormwater (GP) (R4) | DST (GP) | R4 | This general permit authorizes stormwater discharges to surface and groundwater for facilities engaged in the activity of manufacturing hot mix asphalt, defined by SIC 2951 and NAICS 324121. |
| NJDEP, 2025a | Mining and Quarrying Activity Stormwater (GP) (R13) | DST (GP) | R13 | This general permit authorizes stormwater and certain process wastewater discharges to surface waters and stormwater-only discharges to groundwater for facilities involved in mining and quarrying operations under SICs 1411, 1423, 1429, 1442, 1446, 1459 (NAICSs 212311, 212313, 212319, 212321, 212322, 212325, 212319, 212399). |
| NJDEP, 2025a | MS4 - Highway Agency Stormwater (GP) (R12) | DST (GP) | R12 | The Highway Agency Stormwater General Permit authorizes the discharge of stormwater from highways or other thoroughfares operated by counties or by entities such as the NJ Department of Transportation, NJ Turnpike Authority, and the South Jersey Transportation Authority. |
| NJDEP, 2025a | MS4 - Public Complex Stormwater (GP) (R11) | DST (GP) | R11 | The Public Complex Stormwater General Permit authorizes the discharge of stormwater from large publicly owned complexes such as colleges, universities, prisons, and hospital complexes. |
| NJDEP, 2025a | MS4 - Tier A Municipal Stormwater (GP) (R9) | DST (GP) | R9 | The Tier A Municipal Stormwater General Permit authorizes the discharge of stormwater from small municipal separate storm sewers. The permit was issued in response to the EPA’s phase II rules. Tier A municipalities are generally located within the more densely populated regions of the state or along or near the coast. The Tier A permit addresses stormwater quality issues related to both new and existing development. |
| NJDEP, 2025a | Potable Water Treatment Plant (GP) (BPW) | DSW (GP) | BPW | This general permit authorizes the discharge of wastewater associated with potable water treatment that is largely comprised of filter backwash. Potable water treatment plants provide potable water, after appropriate treatment, for domestic and industrial use. |
| NJDEP, 2025a | Swimming Pool Discharges (GP) (B6) | DSW (GP) | B6 | This general permit authorizes the discharge from the draining of pool water and (or) filter backwash from any municipal, commercial, non-residential, or community (for example, townhouse and condominium) swimming pools to eligible surface waters of the State. This general permit is not intended for swimming pool discharges from residential homes. This general permit does not authorize the discharge into those waters classified as FW1, Pinelands, and certain Shellfish waters. In addition, the discharge of filter backwash water to Category One designated receiving waters is not permitted. |
| NJDEP, 2025a | Combined Sewer Management (IP) (CSM) | DSW (IP) | CSM | This individual NJPDES DSW permit is issued to owners or operators of combined sewer systems and (or) CSO outfalls. |
| NJDEP, 2025a1 | Industrial Wastewater (IP) (B) | DSW (IP) | B | This individual NJPDES DSW permit is issued to those facilities that discharge treated and non-treated wastewater derived from, but not limited to, process and non-process wastewater, contact and non-contact cooling water, and comingled stormwater runoff. |
| NJDEP, 2025a | Sanitary Wastewater (IP) (A) | DSW (IP) | A | This individual NJPDES DSW permit is issued to those facilities that primarily discharge domestic sewage from residential and commercial properties. |
| NJDEP, 2025a | Sludge Quality Category 1 (GP) (S1G) | Residuals (GP) | S1G | These general permits implement the provisions of the Sludge Quality Assurance Regulations for residual quality and quantity monitoring for DTWs. For DTWs that have a permitted flow between 0.02 and 0.099 MGD. |
| NJDEP, 2025a | Sludge Quality Category 2 (GP) (S2G) | Residuals (GP) | S2G | These general permits implement the provisions of the Sludge Quality Assurance Regulations for residual quality and quantity monitoring for DTWs. For DTWs that have a permitted flow between 0.1 and 0.999 MGD. |
| NJDEP, 2025a | Sludge Quality Category 3 (GP) (S3G) | Residuals (GP) | S3G | These general permits implement the provisions of the Sludge Quality Assurance Regulations for residual quality and quantity monitoring for DTWs. For DTWs that have a permitted flow between 1.0 and 4.999 MGD. |
| NJDEP, 2025a | Sludge Quality Category 4 (GP) (S4G) | Residuals (GP) | S4G | These general permits implement the provisions of the Sludge Quality Assurance Regulations for residual quality and quantity monitoring for DTWs. For DTWs that have a permitted flow greater than or equal to 5.0 MGD. |
| NJDEP, 2025a | Sludge Quality Exempt (GP) (SXG) | Residuals (GP) | SXG | These general permits implement the provisions of the Sludge Quality Assurance Regulations for residual quality and quantity monitoring for DTWs. For DTWs that generate only domestic septage, or that have a permitted flow of 0.020 MGD or less and that remove all sewage sludge generated to an off-site in-State treatment works treating domestic sewage. |
| NJDEP, 2025a | Land Application of Food Processing Residuals (IP) (E) | Residuals (IP) | E | This individual permit authorizes the land application of industrial residuals. |
| NJDEP, 2025a1 | Significant Indirect User (IP) (L) | SIU (IP) | L | This permit authorizes the discharge of wastewater from an SIU into a POTW of a local agency that does not have an approved pretreatment program (in other words, a non-delegated POTW). |
| NYSDEC, 2025 | Boat Launch Sites | — | — | Hand launch and trailer launch sites administered by the DEC and other entities. Locations that are accessible are denoted by icons that have blue outlines. |
| NYSDEC, 2025 | Chemical Bulk Storage Facility | — | — | The Chemical Bulk Storage program applies to properties that store a hazardous substance in: 1) an aboveground storage tank larger than 185 gallons, 2) any size underground storage tank, or 3) a container that can store 1,000 kg or more for a period of 90 consecutive days or more. All regulated tanks at facilities must be registered with DEC and managed in compliance with applicable regulations for the storage and handling of hazardous substances. |
| NYSDEC, 2025 | Permitted and Reclaimed Mines | — | — | These data are from the Division of Mineral Resources Mined Land program files and represent locations of New York State-regulated mines. |
| NYSDEC, 2025 | Petroleum Bulk Storage Facility | — | — | The Petroleum Bulk Storage program applies to properties that have, except for tank systems that are specifically exempted: 1) one or more tank systems that are designed to store a combined capacity of more than 1,100 gallons or more of petroleum in aboveground and (or) underground storage tanks, 2) one or more underground tank systems that are designed to store 110 or more gallons of petroleum. Any such facilities must register all tank systems with DEC and must be managed in compliance with applicable regulations for the storage of petroleum. |
| NYSDEC, 2025 | Recyclables Handling and Recovery Facilities | — | — | These facilities collect and separate non-putrescible recyclables from the solid wastestream or process previously separated non-putrescible recyclables. |
| NYSDEC, 2025 | Wastewater Facility | — | — | The purpose of the SPDES Program is to protect human health and the environment. The SPDES permit program in the NYSDEC's Division of Water regulates municipal, industrial, private, commercial, and institutional wastewater treatment facilities that discharge to the groundwaters as well as surface waters of New York State. |
NJDEP (2025b) identified this permit type in their strategy to identify, reduce, and eliminate sources of per- and polyfluoroalkyl substances in industrial wastewater.
References Cited
Esri, 2025, ArcGIS Pro (ver. 3.5.2): Esri software release, accessed on February 27, 2026, at https://www.esri.com/en-us/arcgis/products/arcgis-pro/overview.
New Jersey Department of Environmental Protection [NJDEP], 2025a, Permits, application forms, & checklists: New Jersey Department of Environmental Protection webpage, accessed November 20, 2025, at https://dep.nj.gov/dwq/permitting_information/permits_application_forms_and_checklists/.
New Jersey Department of Environmental Protection [NJDEP], 2025b, Division of Water Quality PFAS strategy—Identify, reduce, and eliminate sources of PFAS: New Jersey Department of Environmental Protection webpage, accessed September 25, 2025, at https://dep.nj.gov/dwq/pfas/.
New York State Department of Environmental Conservation [NYSDEC], 2025, DECinfo locator layers: New York Department of Environmental Conservation webpage, accessed November 20, 2025, at https://dec.ny.gov/maps/interactive-maps/decinfo-locator/layers.
Romanok, K.M., Schreiner, M.L., Gray, J.T., Smalling, K.L., Trainor, J.J., Kneser, M., Boerner, J., Williams, B.M., Brown, E.J., Atkinson, R.W., Bernal, E.C., Bunnell, Z.J., Bjorklund, B.W., Bowen, K.M., Bowen, P.W., Carullo, S.A., Cohl, J.A., Collenburg, J.V., Elstad, J.B., Medina, J.A., Mooney, C.T., and Sirotniak, L.M., 2026, Per- and polyfluoroalkyl substances (PFAS) concentration results in the Wanaque, Ramapo, Pompton and Passaic River watersheds, New Jersey 2025: U.S. Geological Survey data release, https://doi.org/10.5066/P1RGG9YQ.
U.S. Environmental Protection Agency [EPA], 2024, Water pollution search [Discharge monitoring report (DMR)]: U.S. Environmental Protection Agency database, accessed August 19, 2025, at https://echo.epa.gov/trends/loading-tool/water-pollution-search.
U.S. Environmental Protection Agency [EPA], 2025, PFAS analytics tool: U.S. Environmental Protection Agency, accessed November 20, 2025, at https://awsedap.epa.gov/public/extensions/PFAS_Tools/PFAS_Tools.html.
Conversion Factors
U.S. customary units to International System of Units
International System of Units to U.S. customary units
Temperature in degrees Celsius (°C) may be converted to degrees Fahrenheit (°F) as follows:
°F = (1.8 × °C) + 32.
Supplemental Information
Specific conductance is in microsiemens per centimeter at 25 degrees Celsius (µS/cm at 25 °C).
Concentrations of chemical constituents in water are in either milligrams per liter (mg/L), micrograms per liter (µg/L), or nanograms per liter (ng/L).
Yields are in grams per day per square kilometer (g/d/km2).
Flows are reported as cubic feet per second (ft3/s).
Abbreviations and Symbols
Chemicals
6:2 FTS
6:2 fluorotelomer sulfonate
GenX
perfluoro-2-propoxypropanoate
HDPE
high-density polyethylene
PFAS
per- and polyfluoroalkyl substances
PFBA
perfluorobutanoate
PFBS
perfluorobutane sulfonate
PFHxA
perfluorohexanoate
PFHxS
perfluorohexane sulfonate
PFNA
perfluorononanoate
PFOA
perfluorooctanoate
PFOS
perfluorooctane sulfonate
PFPeA
perfluoropentanoate
PFPeS
perfluoropentane sulfonate
Other Abbreviations and Symbols
∑
cumulative
ACCWW
accumulated wastewater
ECHO
U.S. Environmental Protection Agency Enforcement and Compliance History Online
HUC10
10-digit hydrologic unit code
IQR
interquartile range
MCL
maximum contaminant level
MDL
method detection limit
NHD
National Hydrography Dataset Plus Version 2.1
NJPDES
New Jersey Pollutant Discharge Elimination System
NLCD
National Land Cover Database
SPE
solid phase extraction
SPDES
[New York] State Pollutant Discharge Elimination System
TC
total carbon
TOC
total organic carbon
WWTP
wastewater treatment plant
For more information about this report, contact:
Director, New Jersey Water Science Center
U.S. Geological Survey
3450 Princeton Pike, Suite 110
Lawrenceville, NJ 08648
or visit our website at
https://www.usgs.gov/centers/new-jersey-water-science-center
Publishing support provided by the U.S. Geological Survey, Science Publishing Network, Baltimore Publishing Service Center
Disclaimers
Any use of trade, firm, or product names is for descriptive purposes only and does not imply endorsement by the U.S. Government.
Although this information product, for the most part, is in the public domain, it also may contain copyrighted materials as noted in the text. Permission to reproduce copyrighted items must be secured from the copyright owner.
Suggested Citation
Schreiner, M.L., Romanok, K.M., Gray, J.T., Brown, E.J., Williams, B.M., Kneser, M., Capuzzi, A.J., Boerner, J., Giunta, L., Serillo, P., Trainor, J.J., and Smalling, K.L., 2026, Understanding the occurrence and distribution of per- and polyfluoroalkyl substances (PFAS) in surface waters of the nontidal Passaic River Basin: U.S. Geological Survey Scientific Investigations Report 2026–5018, 64 p., https://doi.org/10.3133/sir20265018.
ISSN: 2328-0328 (online)
Study Area
| Publication type | Report |
|---|---|
| Publication Subtype | USGS Numbered Series |
| Title | Understanding the occurrence and distribution of per- and polyfluoroalkyl substances (PFAS) in surface waters of the nontidal Passaic River Basin |
| Series title | Scientific Investigations Report |
| Series number | 2026-5018 |
| DOI | 10.3133/sir20265018 |
| Publication Date | April 30, 2026 |
| Year Published | 2026 |
| Language | English |
| Publisher | U.S. Geological Survey |
| Publisher location | Reston, VA |
| Contributing office(s) | New Jersey Water Science Center |
| Description | Report: ix, 64 p.; Data Release |
| Country | United States |
| State | New Jersey, New York |
| Other Geospatial | Passaic River basin |
| Online Only (Y/N) | Y |
| Additional Online Files (Y/N) | N |