

Top Elevation of Glacial Till and Thickness of the Big Sioux Aquifer Delineated From Electrical Resistivity Tomography Surveys Near Sioux Falls, South Dakota, 2022 and 2025
Links
- Document: Report (18.8 MB pdf) , HTML , XML
- Data Release: USGS data release - Electrical resistivity tomography (ERT) data collected March 14–18 and November 17–21 north of Sioux Falls, South Dakota
- NGMDB Index Page: National Geologic Map Database Index Page (html)
- Download citation as: RIS | Dublin Core
Acknowledgments
The authors wish to acknowledge the City of Sioux Falls Water Division for their support and cooperation in collecting data required for this project. The authors also acknowledge U.S. Geological Survey colleagues who provided insightful reviews of the study.
Abstract
The City of Sioux Falls, South Dakota, requested the U.S. Geological Survey perform electrical resistivity surveys on three parcels of land north of the city. Electrical resistivity data were collected along a total of 22 transects during March 14–18, 2022, and November 17–21, 2025. Results from electrical resistivity surveys were used to delineate the top of glacial till deposits for the purpose of characterizing the Big Sioux aquifer near the city. Delineating geologic contacts provides important information on groundwater storage, flow dynamics, well design and placement, contaminant transport, groundwater–surface-water interactions, and regional water modeling. The top elevation of glacial till and the thickness of the Big Sioux aquifer varied among the three survey areas. The interpreted top elevation of glacial till in the North survey area decreases from east to west toward a slough, with elevations ranging from 1,403 to 1,418 feet (ft). The estimated thickness of the Big Sioux aquifer in the North survey area increased from east to west, with thicknesses ranging from 23 to 38 ft. The top elevation of glacial till in the Well 72 survey area generally decreases from northwest to southeast. Top elevations of the glacial till in the Well 72 survey area ranged from 1,400 to 1,409 ft along the southern end of transect W72_2. The estimated thickness of the Big Sioux aquifer in the Well 72 survey area was greatest along a southeast to northwest trending channel, with thicknesses ranging from 28 to 40 ft. The top elevation of glacial till in the Nose survey area generally decreases west toward the Big Sioux River. Top elevations of the glacial till in the Nose survey area ranged from 1,362 to 1,395 ft. The estimated thickness of the Big Sioux aquifer in the Nose survey area ranged from 33 to 70 ft.
Introduction
The City of Sioux Falls, South Dakota, requested the U.S. Geological Survey (USGS) perform electrical resistivity surveys on three parcels of land north of the city (fig. 1). Electrical resistivity surveys were used as a non-invasive and cost-effective way to image the subsurface without drilling additional borings or excavating. Parcels were identified by city personnel as potential locations for new municipal supply wells if the parcel was acquirable and within the extent of the Big Sioux aquifer. Additional information, such as the depth to water, aquifer composition and thickness, and direction of groundwater flow, was necessary for city managers to determine the most suitable location for well placement.
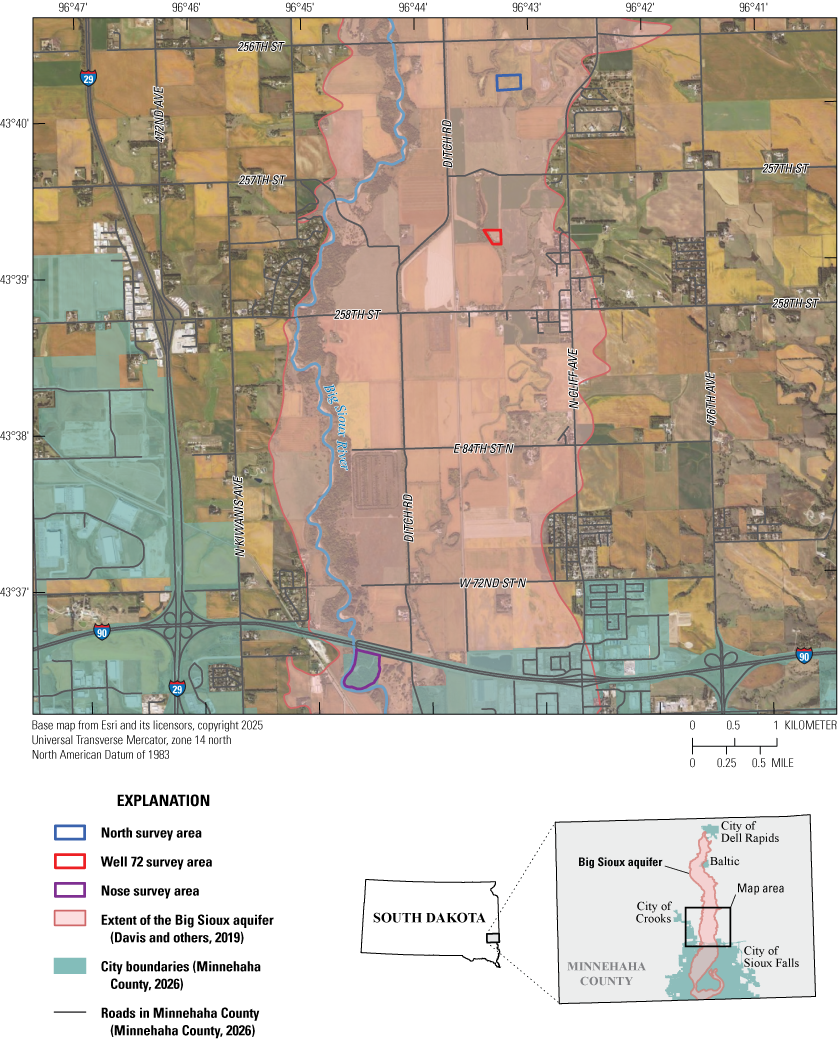
Map showing three survey areas (North, Well 72, and Nose) north of the City of Sioux Falls, South Dakota. Additional site information is available in Medler and Anderson (2026).
In 2021 and 2022, the City of Sioux Falls began exploring a parcel of land just south of Interstate 90 (I-90; Nose survey area; fig. 1) by drilling exploratory borings and installing temporary monitoring wells to gather information and data on the parcel’s suitability for a municipal supply well. Electrical resistivity surveys were conducted in the Nose survey area in March 2022 to provide supplemental information about the subsurface between borings and monitoring wells. Results from the 2022 surveys proved the utility of electrical resistivity surveys near the City of Sioux Falls and subsequent surveys were conducted east of the Big Sioux River between 256th and 257th streets (North survey area; fig. 1) and near municipal supply well 72 between 257th and 258th streets (Well 72 survey area; fig. 1) in November 2025. The multi-year gap between survey dates was the time elapsed between requests made by the City of Sioux Falls.
Electrical resistivity surveys were conducted to image the subsurface and delineate contacts between geologic units. Delineating geologic contacts provides important information on groundwater storage, flow dynamics, well design and placement, contaminant transport, groundwater–surface-water interactions, and regional water modeling. Geologic units in the survey areas were described by Davis and others (2019). Although these descriptions provided a framework for interpreting electrical resistivity results, they do not fully represent aquifer heterogeneity across the survey areas, and spatial variability in the unit composition is expected.
The youngest and uppermost layer (layer 1) is composed of surficial deposits containing topsoil, organic material, silts, and clay deposits. Beneath the surficial deposits are deposits of glacial outwash that comprise the Big Sioux aquifer (layer 2) and consist of silts, sands, and gravels. The average thickness of the Big Sioux aquifer is about 34 feet (ft), with an estimated maximum thickness of 96 ft between the Cities of Sioux Falls and Dell Rapids (Davis and others, 2019). Glacial till composed of dense clay containing interbedded silt, sand, and gravel (layer 3) underlies the Big Sioux aquifer and can be as thick as 120 ft. The oldest and lowermost layer in the study area is the Sioux Quartzite (layer 4), which underlies the glacial till or the Big Sioux aquifer where glacial till is absent. Previous airborne electromagnetic surveys of the area between the Cities of Sioux Falls and Dell Rapids (fig. 1; Valseth and others, 2018) showed distinct contrasts between the four geologic layers, and it was assumed that results from electrical resistivity surveys would produce similar contrasts.
Purpose and Scope
The purpose of this report is to document the methods of data collection and analysis used to delineate contacts between geologic units and to create contour maps of the top elevation of glacial till deposits and the thickness of the Big Sioux aquifer in three survey areas north of the City of Sioux Falls, S. Dak. (fig. 1). Electrical resistivity tomography (ERT) data were collected along a total of 22 transects during March 14–18, 2022, and November 17–21, 2025, in cooperation with the City of Sioux Falls. Results from these surveys were used to delineate the top of glacial till deposits for the purpose of characterizing the Big Sioux aquifer near the City of Sioux Falls. Maps of the top elevation of glacial till and the thickness of the Big Sioux aquifer were evaluated qualitatively to determine potential groundwater flow paths and highlight areas of relatively thick aquifer materials. A companion data release accompanying this report (Medler and Anderson, 2026) contains all survey data collected for the results described in this report.
Electrical Resistivity and Real-Time Kinematic Surveying
Methods used in this study include electrical resistivity surveys and real-time kinematic (RTK) surveying techniques. Electrical resistivity data were collected March 14–18, 2022, and November 17–21, 2025, near the City of Sioux Falls, S. Dak. (figs. 2–4). In total, the USGS surveyed 22 transects for a combined length of 3.4 line-kilometers. Latitude, longitude, and land-surface elevation data were collected at electrical-resistivity survey electrodes using RTK surveys. Site information (latitude, longitude, and elevation) and geophysical survey results are available in an accompanying USGS data release for this report (Medler and Anderson, 2026). The methods used to delineate the contact between the Big Sioux aquifer and the underlying glacial till and to create contour maps are discussed.
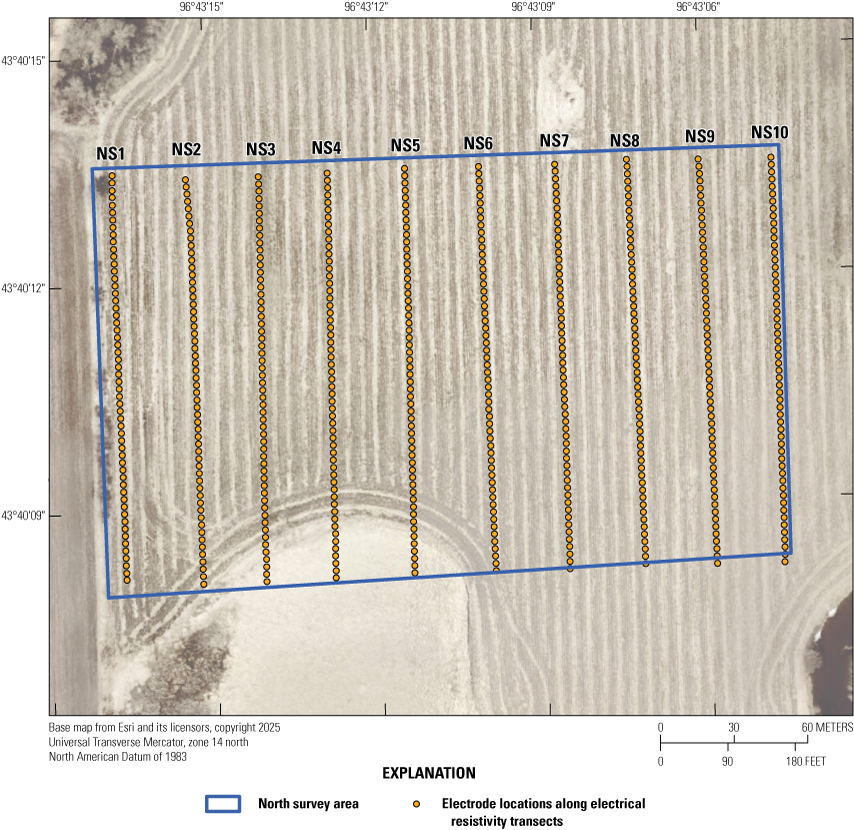
Map of the North survey area north of the City of Sioux Falls, South Dakota, showing electrode locations along 10 electrical resistivity transects (NS1–NS10). Additional site information is available in Medler and Anderson (2026).
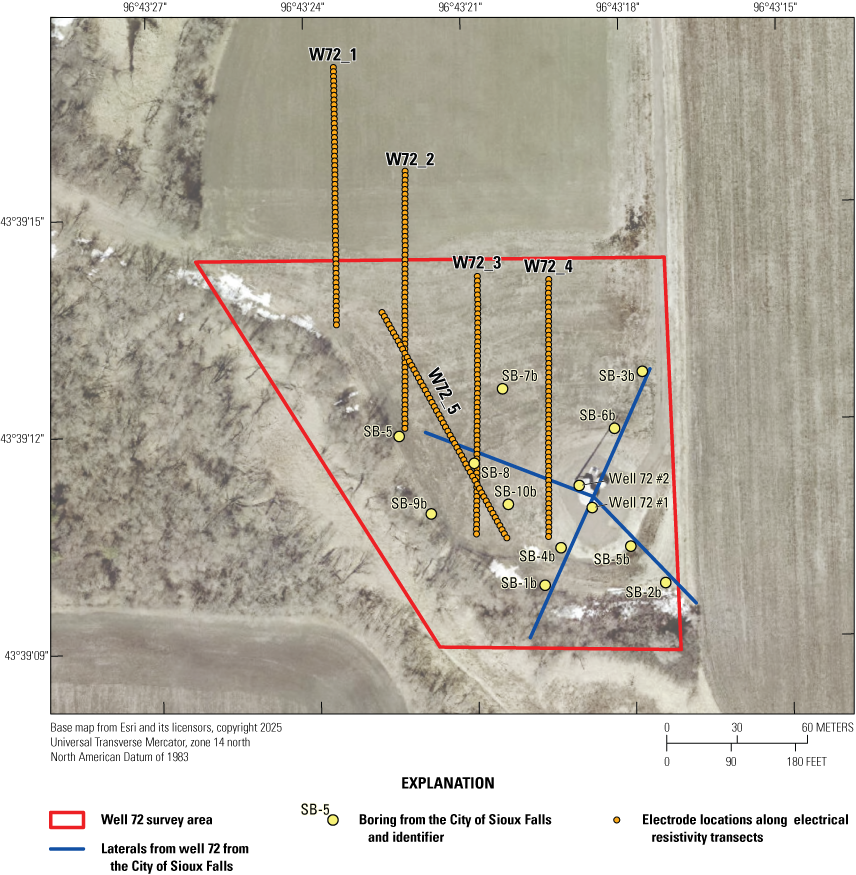
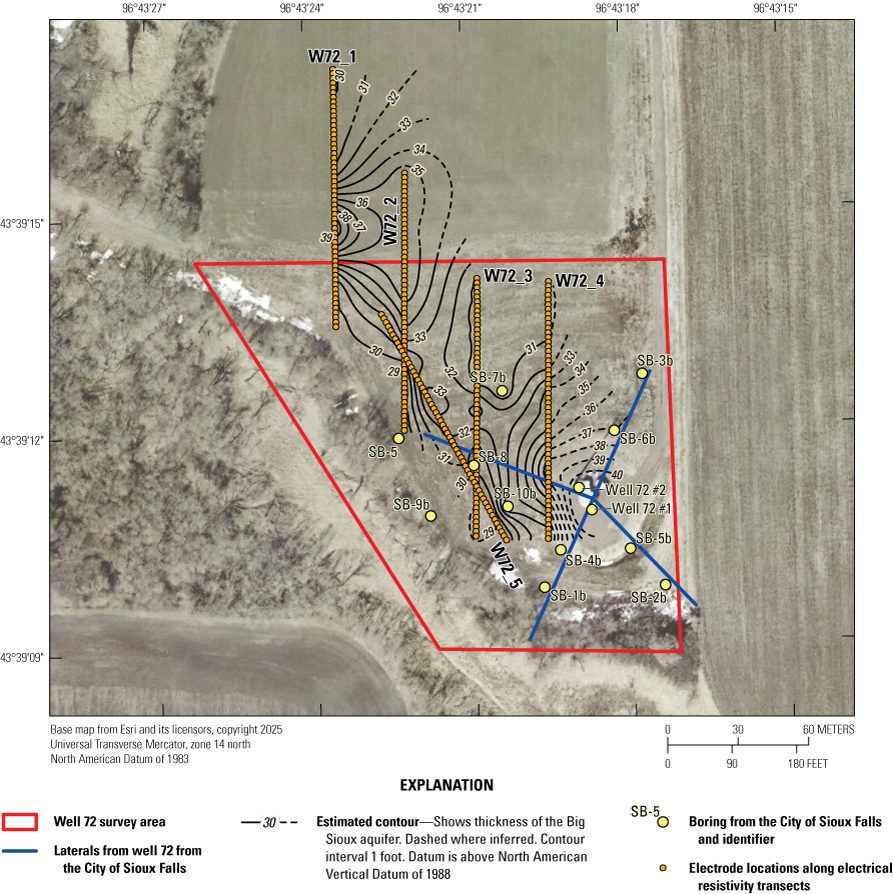
Map of the Well 72 survey area north of the City of Sioux Falls, South Dakota, showing electrode locations along five electrical resistivity transects (W72_1–W72_5). Four lateral arms with perforations placed in the Big Sioux aquifer are connected to well 72 to increase the well’s pumping capacity. Additional site information is available in Medler and Anderson (2026). Well information is provided by the South Dakota Department of Agriculture and Natural Resources (2025) and the City of Sioux Falls Water Division (Ted Lewis, City of Sioux Falls Water Division, written commun., 2025).
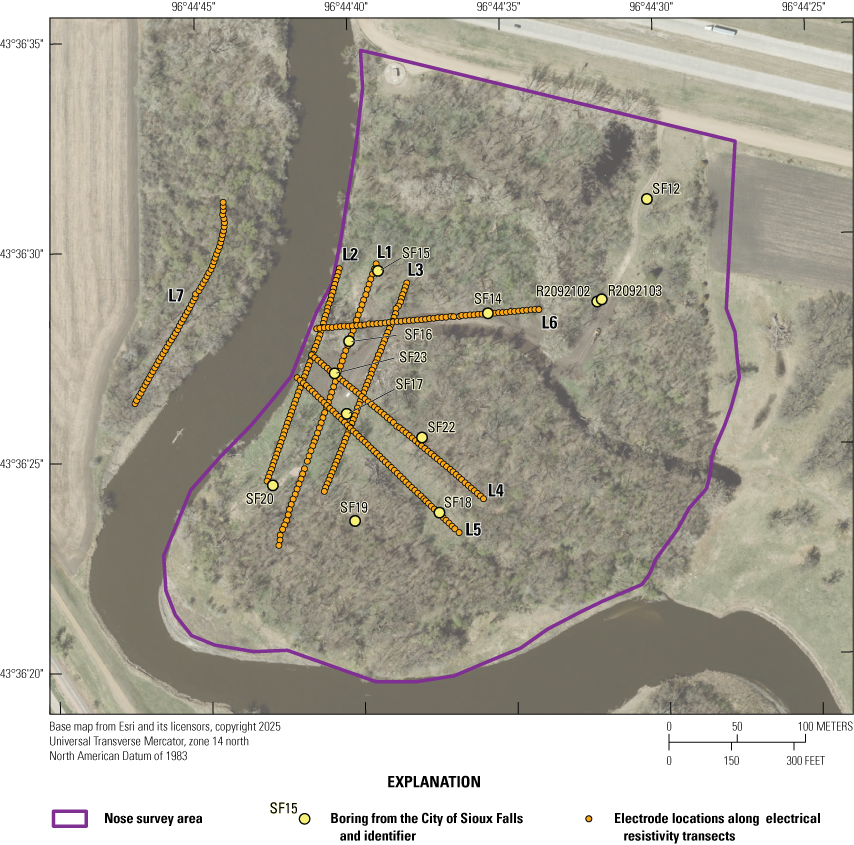
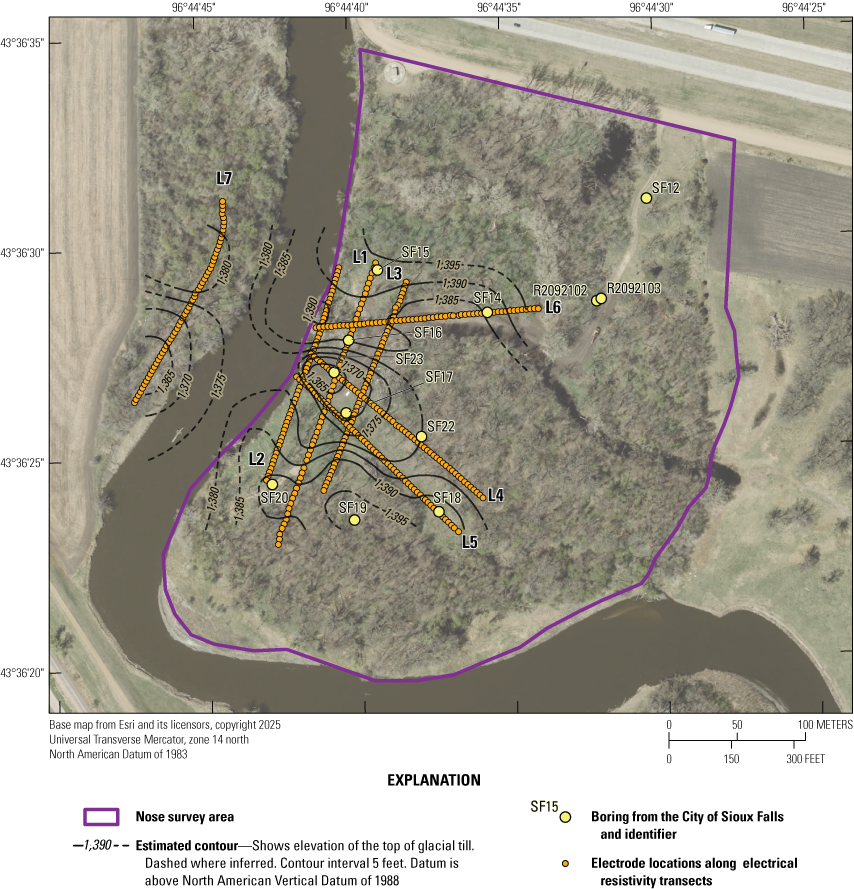
Map of the Nose survey area along the eastern shore of the Big Sioux River, City of Sioux Falls, South Dakota, showing electrode locations along seven electrical resistivity transects (L1–L7). The northern part of transect L7 was skewed to avoid brush piles and dense vegetation. Additional site information is available in Medler and Anderson (2026). Well information is provided by the South Dakota Department of Agriculture and Natural Resources (2025) and the City of Sioux Falls Water Division (Ted Lewis, City of Sioux Falls Water Division, written commun., 2025).
Electrical Resistivity
Electrical resistivity surveys identify horizontal and vertical changes in subsurface resistivity that typically correspond to changes in lithology, pore fluid chemistry, and water content of subsurface materials (Sheets, 2002). Land-surface-based two-dimensional (2D) electrical resistivity surveys commonly use many electrodes equally spaced along a straight transect. The spacing of electrodes along a transect generally controls measurement resolution and the depth of investigation. Greater electrode spacing generally corresponds to a greater depth of investigation but lower measurement resolution, whereas finer electrode spacing results in a shallower depth of investigation but higher measurement resolution (Loke, 2000).
Electrodes are connected to stainless-steel stakes spaced at regular intervals along a cable, which is connected to the resistivity meter that controls the measurements. The resistivity meter runs a pre-programmed, data-collection routine that automatically selects two current electrodes and at least two potential electrodes. Electrical current is transmitted into the ground through the current electrodes, and the resulting voltage is measured at the potential electrodes. Electrode groupings and the sequence of measurements are controlled by the type of array specified for the survey. Commonly used arrays include Wenner, dipole-dipole, and Schlumberger (Loke, 2000, 2004). After the survey is completed, electrical resistivity data are downloaded from the resistivity meter and modeled using tomographic inversion software to obtain 2D cross sections of subsurface resistivity.
The parcels identified by the City of Sioux Falls were evaluated by USGS staff before conducting electrical resistivity surveys to identify potential sources of interference (such as underground utilities or infrastructure), verify the presence of borings with lithologic data, and plan the location and length of survey transects. The three survey areas were determined to be free of interference based on underground utility maps (Ted Lewis, City of Sioux Falls Water Division, written commun., 2025), satellite imagery (Esri, 2026a), and field inspection by USGS staff. Lithologic data from nearby borings were obtained from the South Dakota Department of Agriculture and Natural Resources (2025) and the City of Sioux Falls (Ted Lewis, City of Sioux Falls Water Division, written commun., 2025). Lithologic data and parcel dimensions were used to plan the placement of electrical resistivity transects in the three survey areas (figs. 2–4).
One irrigation well and two borings were near the North survey area (not shown in fig. 2). The irrigation well, about 25 meters (m) north of transect NS7, was excluded from analysis because lithologic data were absent and the well was inaccessible to USGS staff. The two borings were more than 200 m from the North survey area; however, both contained lithologic data that were used to estimate the depth of investigation necessary for electrical resistivity surveys. The top of glacial till was about 38 ft (11.6 m) below land surface according to lithologic data from the two borings (South Dakota Department of Agriculture and Natural Resources, 2025). An electrode spacing of 3 m was selected for transects in the North survey area (total transect length of 165 m; fig. 2) to achieve the desired depth of investigation and horizontal and vertical resolution. Transects were arranged in a north-south grid pattern with approximately 30 m of spacing between each (fig. 2). This configuration allowed electrical resistivity results to be combined to produce contours of the top elevation of glacial till.
Several borings and a municipal supply well (well 72) within the Well 72 survey area (fig. 3) had associated lithologic data. Two soil borings were completed before drilling municipal supply well 72 (well 72 #1 and well 72 #2; fig. 3). Well 72 was designed as a specialized horizontal collector well to improve its pumping capacity and extend its operation life. The well consists of a 16-ft-inside-diameter caisson completed to a depth of about 40 ft below land surface, with four 200-ft-long concrete lateral well screens projecting horizontally from the caisson into the Big Sioux aquifer (fig. 3; HR Green, Inc., 2026). Borings surrounding well 72 were drilled to assist design engineers in determining lateral placement. Three of the five transects (W72_3–W72_5) were positioned near borings so that lithologic data could be compared to electrical resistivity results and to fill data gaps between borings. Transect W72_5 was oriented at an angle relative to transects W72_3 and W72_4, which generated intersection points that could be used to check the interpretation of electrical resistivity models from different directions. Transects W72_1 and W72_2 were placed outside of the primary survey area and away from borings for exploratory purposes. The transects were arranged in an irregular grid pattern to enable the generation of contours representing the top elevation of glacial till.
Several borings within the Nose survey area (fig. 4) had associated lithologic data. The top of glacial till below land surface from lithologic data at nine borings (SF14–SF20, SF22, and SF23; fig. 4) varied from 33.6 ft at boring SF15 to 73.7 ft at boring SF23. Because the first transect (L1; total length of 220 m) was positioned near the deepest observed glacial till at SF23, an electrode spacing of 4 m was tested to evaluate the potential depth of investigation in the Nose survey area. Although the 4 m spacing provided sufficient depth to image the deepest glacial till, an electrode spacing of 3 m was used for subsequent transects L2–L7. The 3 m spacing offered adequate depth of investigation and reduced the transect length, which minimized the placement of electrodes in dense vegetation near the ends of transects L2–L7.
The grid pattern of electrical resistivity transects on the eastern side of the Big Sioux River was irregular because data collection was prioritized in areas cleared of vegetation by City of Sioux Falls staff. Transects L1–L3 were arranged in a northeast-southwest orientation along the eastern edge of the Big Sioux River. Transects L4–L6 intersected transects L1–L3, allowing for comparison of results at intersection points and filling data gaps between transects. Transects L4–L6 were not evenly spaced or aligned at consistent angles because USGS staff positioned them based on available cleared areas. Transect L7 was completed for exploratory purposes on the western side of the Big Sioux River to examine the top of glacial till on the opposite bank.
Electrical resistivity data were acquired near the City of Sioux Falls, S. Dak., using an eight-channel, SuperSting R8 resistivity meter (Advanced Geosciences Inc., 2026a) with 56 total electrodes on four cable sections (14 electrodes per section). Electrodes along each cable were connected to stainless-steel stakes placed at evenly spaced intervals (2, 3, or 4 m) along predetermined transects on the land surface. Unless the ground was saturated from precipitation or snowmelt, the land surface was sprayed with freshwater after placing the electrodes to reduce electrical contact resistance before data collection. The cables were then connected to the SuperSting R8, which automatically collected resistivity data by switching between programmed combinations of current and potential electrode pairs using the dipole-dipole array configuration. The dipole-dipole array configuration was chosen because the array setup is relatively simple, requires less survey time than other methods, and has relatively balanced horizontal and vertical resolution. Loke (2000) and Zohdy and others (1974) provide a detailed description of the dipole-dipole array.
Models were prepared for each transect using the EarthImager2D tomographic inversion software suite (Advanced Geosciences Inc., 2026b). The first step in model preparation was the automatic and manual removal of noisy data in EarthImager2D. Noisy electrical resistivity data typically appears as data points with abnormally high or low electrical resistivity values that deviate from surrounding data points. Sources of noisy data can include poor contact between electrodes and the land surface, the presence of nearby conductors above and below land surface (chain-link fences or metal pipes), variations in subsurface material or land-surface topography, and electrical noise from internal or external factors, such as changes in current flow, battery voltage, and air temperature. The automatic data removal used seven criteria specified in the recommended EarthImager2D settings to remove noisy data before inversion. The second step in model preparation was to incorporate elevation information using land-surface elevation data from RTK surveys for each electrode to minimize errors caused by topographic changes.
The third step in model preparation was to choose the method of inversion and remove noisy data identified after inversion. Electrical resistivity data were modeled using a least-squares smooth model inversion (Constable and others, 1987; Farquharson and Oldenburg, 1998) because the surveyed area was best approximated as a simple layered model with only three or four layers, rather than a more complex model with geologic structures or intrusion of conductive waters, such as seawater. Smooth model inversion reduces differences between measured values and model-predicted values in a simple starting model using an iterative process, in which successive iterations attempt to reduce the difference between measured data and predicted values by determining the root mean square error (RMSE). The goal of smooth model inversion is to reduce the RMSE until a desired error tolerance is met rather than to minimize the RMSE, which increases model roughness, causes artifacts, and diverges from the simple layered model (Constable and others, 1987). The maximum number of model iterations was set to eight for all ERT transects, and the accepted model was chosen as the one that best fit the site conceptual model and was closest to the convergence criteria. In some instances, noisy data missed during the first step were removed manually after the first inversion, then a new inversion was completed. For all ERT transects, the accepted model was chosen within the first three iterations and the RMSE, expressed as a percentage, of accepted models was 6 percent or less. Finalized 2D ERT models meeting convergence criteria are provided in appendixes 1–3.
Delineation of Deposits of Glacial Till
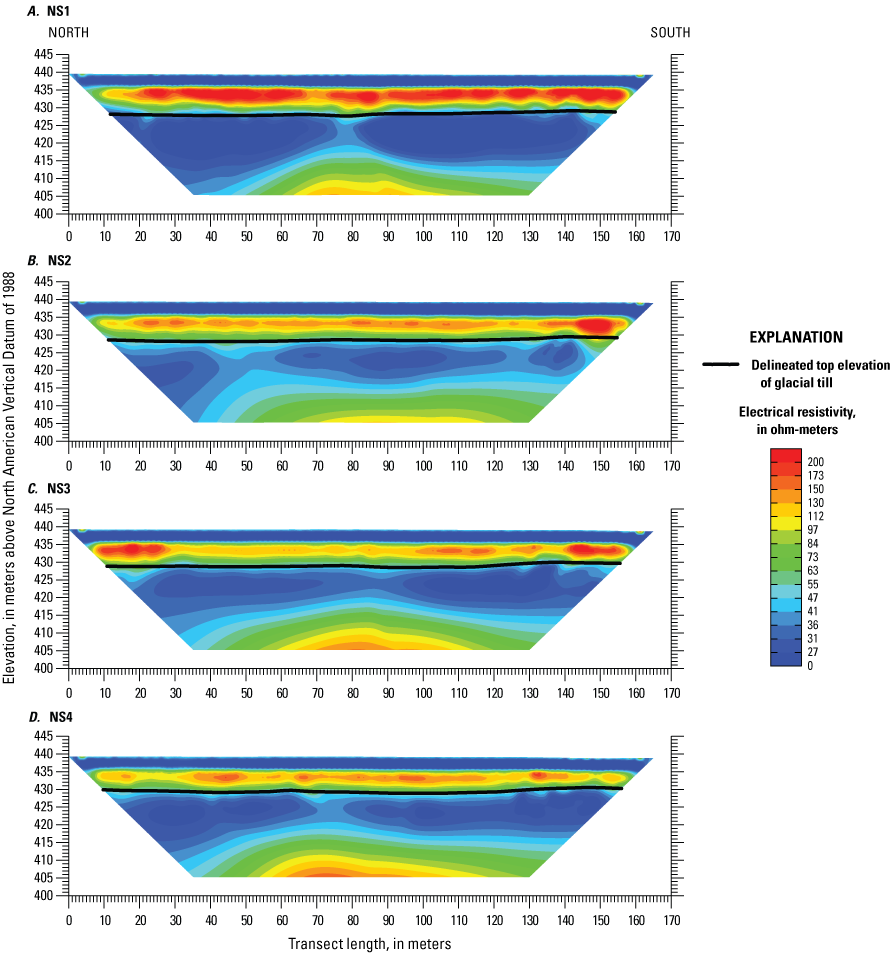
ERT models from the three survey areas (figs. 2–4) displayed consistent vertical distributions of electrical resistivity (apps. 1–3) matching the three or four distinct layers observed in lithologic data from nearby borings (fig. 5; South Dakota Department of Agriculture and Natural Resources, 2025) and in airborne electromagnetic results (Valseth and others, 2018). Electrical resistivity values for geologic materials vary (Telford and others, 1990), so interpretations from ERT models were constrained using lithologic data from nearby borings. Low electrical resistivity values (less than 30 ohm-meters [ohm-m]) near the land surface were interpreted as the soil horizon (layer 1; fig. 5), which was about 2–3 m thick and relatively uniform along the transect. Aquifer materials comprising the Big Sioux aquifer (sands and gravels; layer 2) generally underlie the soil horizon, where present, and are represented in ERT models as the layer of relatively high electrical resistivity values (greater than 60 ohm-m) immediately below the uppermost low electrical resistivity layer (fig. 5). The thickness of the high electrical resistivity layer varies from about 5 m to more than 10 m in some areas (apps. 1–3). Deposits of glacial till underlie the Big Sioux aquifer (layer 3) and appear as the thick (greater than 6–8 m) low electrical resistivity (less than 40 ohm-m) layer below the high electrical resistivity values in ERT models (fig. 5). A fourth layer was observed in ERT models within the North survey area (fig. 2; app. 1). The fourth layer was characterized by relatively high electrical resistivity values and underlies the thick low electrical resistivity layer representing deposits of glacial till (fig. 5). The fourth layer likely represents the Sioux Quartzite bedrock and correlates well with airborne electromagnetic results (Valseth and others, 2018).
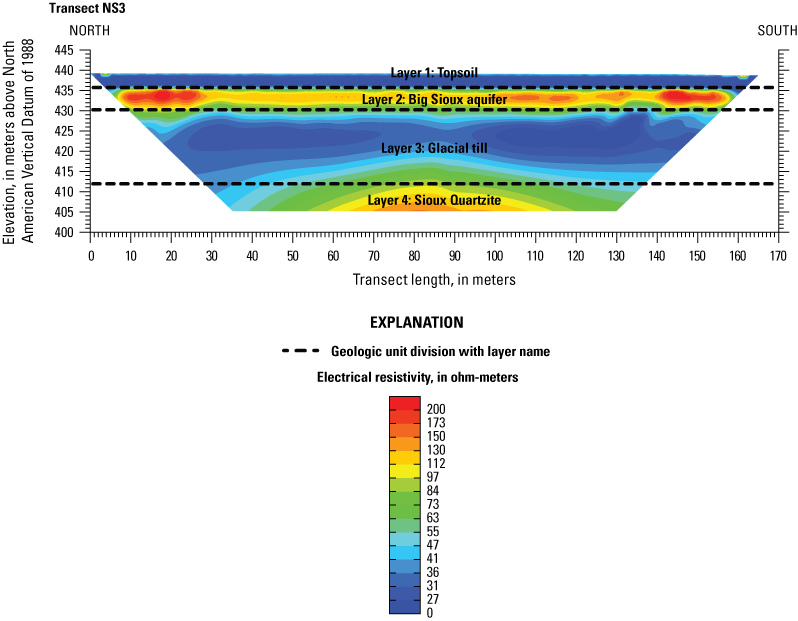
Cross section of electrical resistivity results for transect NS3 (fig. 2) with differing electrical resistivity values for the four distinct geologic units described in lithologic data (South Dakota Department of Agriculture and Natural Resources, 2025). Each geologic unit is labeled to illustrate how units were generally delineated.
The contact between the Big Sioux aquifer and the underlying glacial till was delineated using ERT models (apps. 1–3) and, when available, was constrained using nearby lithologic data from borings (South Dakota Department of Agriculture and Natural Resources, 2025). The contact was manually delineated for all ERT transects near the transition from the relatively high electrical resistivity values of the Big Sioux aquifer (layer 2; 60 ohm-m or greater) to the low resistivity glacial till (layer 3; typically 40 ohm-m or less; fig. 5). Delineated contacts do not span the entire length of the transect because the models are truncated along edges where data are relatively sparse. ERT models, and therefore delineated contacts, are most accurate near the center of each transect where the greatest concentration of data is collected. Greater uncertainty exists for delineated contacts near the edges of ERT models. The top elevation of glacial till from nearby borings was used to constrain delineated contacts if the borings fully penetrated the Big Sioux aquifer, contained lithologic data, and were within 20 m of a transect. The distance between the boring and the ERT transect was considered during delineation; borings that were about 20 m from the transect had less influence on the placement of the delineated contact than those closer to the transect. Additionally, some ERT transects intersected, which allowed for delineated contacts to be further constrained. ERT models were inspected at intersection points to ensure model results matched and that the top elevation of delineated surfaces was within 0.1 m.
Delineated contacts between the Big Sioux aquifer and deposits of glacial till were used to construct contour maps of the top elevation of glacial till and the thickness of Big Sioux aquifer materials for the three survey areas (fig. 1). The delineated top elevation of glacial till was treated as a 2D surface. Its elevation values were extracted at each electrode along ERT transects (56 electrodes per transect) to create a dataset of points to be used in the construction of contours. The thickness of the Big Sioux aquifer was calculated by subtracting the top elevation of glacial till from the land surface elevation at each electrode. Thickness estimates for the Big Sioux aquifer include the soil horizon, which was, on average, about 2–3 m thick (apps. 1–3). The point datasets of the top elevation of glacial till and the thickness of Big Sioux aquifer materials are provided for all 22 transects in the data release accompanying this report (Medler and Anderson, 2026).
Three-dimensional raster datasets were interpolated from the point datasets delineated from ERT models and from borings that fully penetrate the Big Sioux aquifer using the Topo to Raster tool in ArcGIS Pro software (Esri, 2026b). Raster datasets were then contoured using the Contour tool (Esri, 2026c) at various intervals depending on the variability of elevation and thickness in the three areas of interest. Contours generated using the tool were manually adjusted to correct areas of relatively sparse data near the edges of ERT models or where transects did not align in a grid pattern. Contours were considered inferred when more than 20 m from a transect. Shapefiles for contours of the top elevation of glacial till and the thickness of the Big Sioux aquifer for the three survey areas are provided in the data release accompanying this report (Medler and Anderson, 2026).
Real-Time Kinematic Surveying
Single-base RTK surveys were used to measure the three-dimensional positions of ERT electrodes. Single-base RTK surveys use Global Navigation Satellite Systems technology consisting of a single stationary receiver (or “base station”) and a mobile unit (or “rover”) to collect spatial data at survey points. Base stations send real-time differential corrections via radio transmission to the rover so the elevation of a site can be measured. Before the real-time corrections are applied from the base station, the rover undergoes an initialization process that downloads information, such as satellite positions and transmission time delays used to calculate the rover’s position (Rydlund and Densmore, 2012). Traditionally, the base station is set on a surveyed benchmark for comparison with established position data for quality-assurance purposes. In areas without a benchmark, the base station can be set at any location. For surveys where the base station is not set on a surveyed benchmark, the elevation and position of spatial data collected by the rover are determined as a differential from the base station (Rydlund and Densmore, 2012).
Established survey benchmarks were not used for RTK surveys in this study because they were too far from transects in the study area for the base station and rover to maintain a reliable connection. The poor connection was likely caused by topographic obstruction, the distance between the two receivers, or a combination of both. Instead, temporary benchmarks were established by occupying locations close to survey transects for at least 4 hours, when possible, while the rover was used to collect spatial data along survey transects. Static occupation files from the base stations were processed using the Online Positioning User Service (OPUS; National Geodetic Survey, 2014). The coordinates and land-surface elevation data of the electrodes were adjusted based on the difference between the OPUS solution and the position data collected by the base station. The accuracy of the surveyed temporary benchmark elevations was estimated from the overall RMSE calculated by the OPUS solution. During some surveys, the static occupation file was recorded for less than 4 hours. In these cases, the OPUS solution was evaluated by checking the RMSE, plotting the corrected positions and comparing them to plotted data from other survey lines, and comparing elevations from RTK surveys to 1-m digital elevation models (DEMs) of the area (U.S. Geological Survey, 2024).
The estimated uncertainty and RMSE for position information determined from static occupation files processed by OPUS varied by site. In the North survey area (fig. 2), the horizontal (latitude and longitude) uncertainty ranged from 0.003 to 0.012 m and the vertical (elevation) uncertainty ranged from 0.028 to 0.058 m. The overall RMSE for the North survey area ranged from 0.015 to 0.036 m. The average, minimum, and maximum differences between RTK-surveyed elevations at the 560 surveyed electrode points from 1-m DEM were −0.060 m, −0.266 m, and 0.003 m, respectively.
In the Well 72 survey area (fig. 3), the horizontal uncertainty ranged from 0.004 to 0.048 m and the vertical uncertainty ranged from 0.055 to 0.65 m. The overall RMSE for the Well 72 survey area ranged from 0.013 to 0.016 m. Surveyed elevations for the 280 electrode points were compared to elevations from the 1-m DEM; however, the DEM was created before completion of well 72 and did not include the fill material added for the well housing and support buildings (fig. 3). The added fill material caused elevation differences as large as 1.55 m along transect W72_4 at electrodes 36 to 56 (fig. 3). Excluding electrodes 36 through 56 along transect W72_4, the average, minimum, and maximum differences between RTK-surveyed elevations and DEM elevations were −0.187 m, −0.558 m, and 0.072 m, respectively.
In the Nose survey area (fig. 4), the estimated horizontal uncertainty ranged from 0.002 to 0.458 m and vertical uncertainty ranged from 0.071 to 1.872 m. The overall RMSE ranged from 0.016 to 0.220 m. The average, minimum, and maximum differences between RTK-surveyed elevations at the 392 surveyed electrode points and the 1-m DEM were 0.057 m, −0.624 m, and 1.429 m, respectively. Elevation differences greater than 0.5 m were attributed to the Nose survey area being cleared of vegetation (bushes, trees, and so on) and its ground being leveled a few days before ERT and RTK surveys. Uncertainty and RMSE could not be calculated for the static occupation file for transect L6 because the file was corrupted and could not be processed by OPUS. Instead, the average base station position from transects L1–L5 was used to correct horizontal and vertical data for transect L6 because the base station was set up in the same location for each RTK survey.
Top Elevation of Glacial Till and Thickness of the Big Sioux Aquifer
The top elevation of glacial till and the thickness of the Big Sioux aquifer varied among the three survey areas (figs. 6–11). When possible, the top elevation of glacial till was compared between borings with lithologic data and the ERT model from the transect nearest to the boring. The top elevation of glacial till and the thicknesses of the Big Sioux aquifer were converted from meters to feet for compatibility with city datasets, and elevations are reported in feet above the North American Vertical Datum of 1988. The closest borings to the North survey area were from monitoring wells installed by the City of Sioux Falls (not shown in fig. 6) that were either 250 m east or 300 m north and therefore were not compared to delineated contacts from ERT models. The interpreted top elevation of glacial till in the North survey area decreases from east to west toward a slough (not shown in fig. 6), with elevations ranging from 1,403 ft along transect NS1 to 1,418 ft along transect NS10 (fig. 6). The estimated thickness of the Big Sioux aquifer in the North survey area increased from east to west, with thicknesses ranging from 23 to 38 ft (fig. 7). The average estimated thickness of the Big Sioux aquifer in the North survey area was about 30 ft. The top elevation and thickness contour maps of the North survey area display east-west trending channels where groundwater could preferentially flow from east to west if flow follows the top of glacial till (figs. 6, 7).
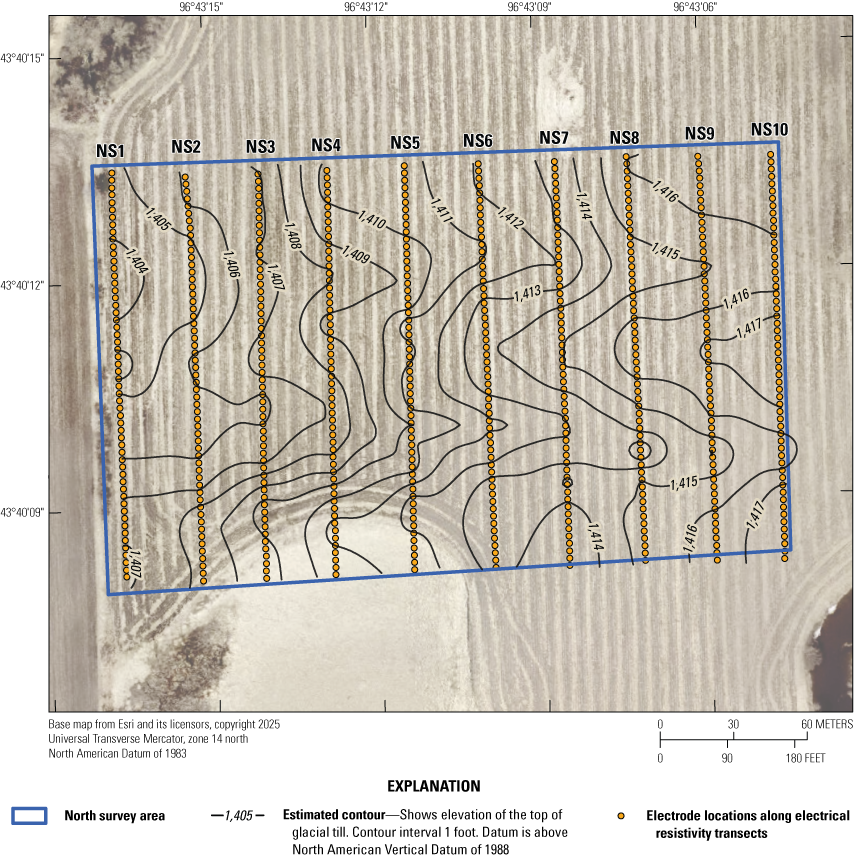
Map showing the estimated contours of the top elevation of glacial till in 1-foot intervals from electrical resistivity results at the North survey area north of the City of Sioux Falls, South Dakota.
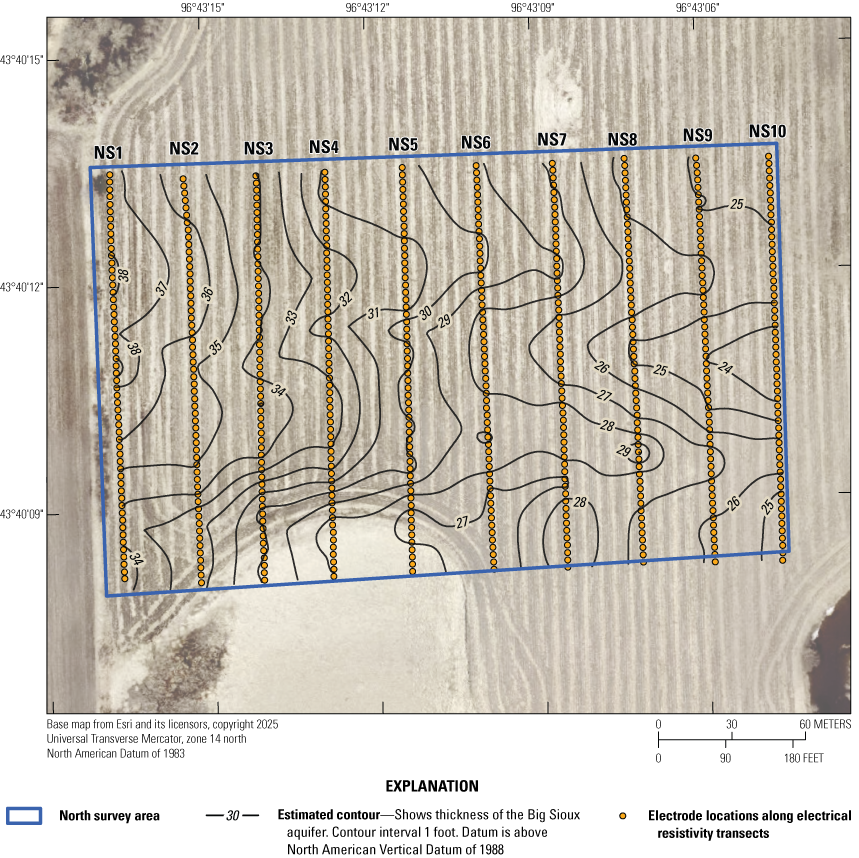
Map showing the estimated contours of the thickness of the Big Sioux aquifer in 1-foot intervals from electrical resistivity results at the North survey area north of the City of Sioux Falls, South Dakota.
In the Well 72 survey area, the top elevation of the glacial till delineated from ERT models was compared to lithologic data from eight borings that were within 20 m of transects (figs. 8, 2.1). Elevation differences between the borings and the ERT models ranged from 0.68 to 11.80 ft, with an average difference of about 4.1 ft. Elevation differences increased with distance from the transects. The top elevation of glacial till at the 48th electrode (electrode count increases from north to south along transects) along transect W72_4 was 1,406.6 ft, which was 5.6 and 11.8 ft higher than the top elevation of glacial till at the two borings near well 72 (1,401 ft and 1,395 ft; fig. 2.1D). Lithologic data from borings that fully penetrate the Big Sioux aquifer in the Well 72 area (fig. 8) indicates the top elevation of glacial till can vary considerably over short distances, so the elevation differences between ERT models and borings may reflect real subsurface variability. Alternatively, the estimates provided near the edges of transects where models are known to produce greater uncertainty may have influenced the differences in elevation.
The top elevation of glacial till in the Well 72 survey area generally decreases from northwest to southeast toward well 72 (fig. 8). Top elevations of glacial till in the Well 72 survey area ranged from 1,400 ft along the central part of transects W72_1 and W72_4 to 1,409 ft along the southern end of transect W72_2 (fig. 8). A relatively low elevation channel was observed along the central parts of transects W72_1–W72_4 (fig. 8), which may affect groundwater flow in the area. If groundwater flow follows the top elevation of glacial till, then groundwater west of transect W72_2 would flow northwest and groundwater east of W72_02 would flow southeast toward well 72 (fig. 8). The estimated thickness of the Big Sioux aquifer in the Well 72 survey area was greatest along a southeast to northwest trending channel near the central parts of transects W72_1–W72_4, with thicknesses ranging from 28 to 40 ft (fig. 9). The greatest thickness of the Big Sioux aquifer was observed along the southern part of transect W72_4 near well 72 (fig. 9). The average estimated thickness of the Big Sioux aquifer in the Well 72 survey area was about 32 ft.
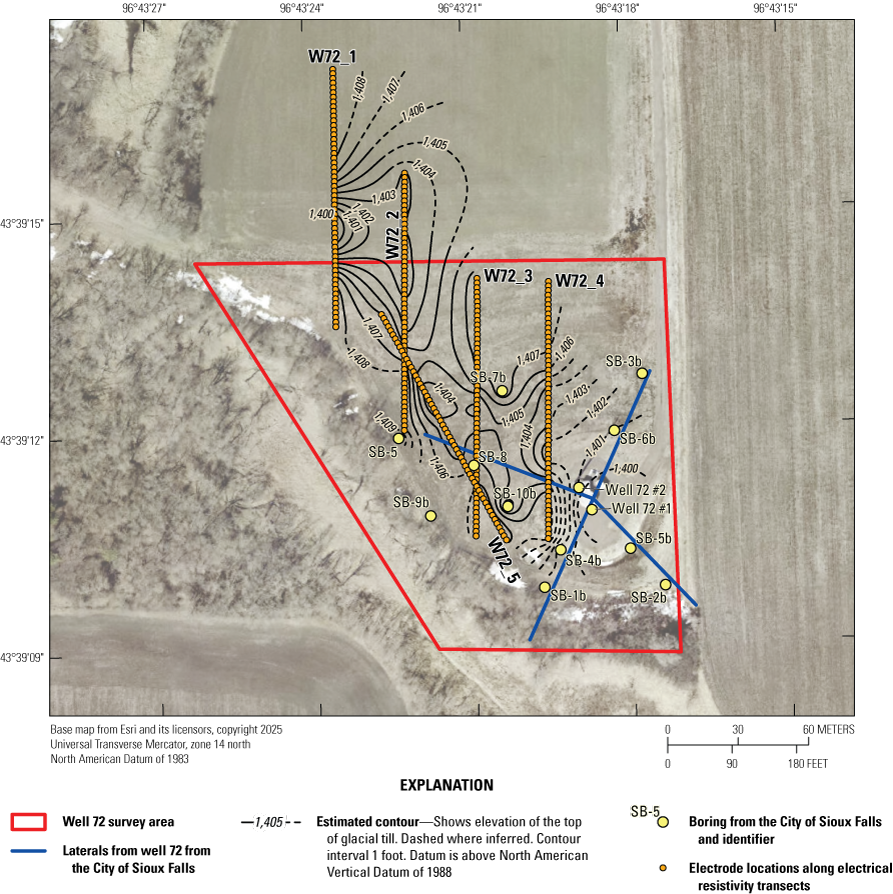
Map showing the estimated contours of the top elevation of glacial till in 1-foot intervals from electrical resistivity results at the Well 72 survey area north of the City of Sioux Falls, South Dakota. Four lateral arms with perforations placed in the Big Sioux aquifer are connected to well 72 to increase the pumping capacity of the well.
Map showing the estimated contours of the thickness of the Big Sioux aquifer in 1-foot intervals from electrical resistivity results at the Well 72 survey area north of the City of Sioux Falls, South Dakota. Four lateral arms with perforations placed in the Big Sioux aquifer are connected to well 72 to increase the pumping capacity of the well.
In the Nose survey area, the top elevation of glacial till was compared to lithologic data from nine borings (fig. 10). In general, the top elevation of glacial till from borings correlated well with delineated contacts from ERT models. Elevation differences between borings and ERT models were less than 3 ft for most transects (fig. 3.1), with a maximum difference of about 10 ft at transects L2 and L3 (figs. 3.1B, C). The top elevation of glacial till in the Nose survey area generally decreases westward toward the Big Sioux River (fig. 10). Top elevations of the glacial till in the Nose survey area ranged from 1,362 ft near the center of transect L1 near boring SF23 to 1,395 ft in the southeast and northeast parts of the area (fig. 10). The estimated thickness of the Big Sioux aquifer in the Nose survey area was greatest along the western parts of transects L1–L5, with thicknesses ranging from 33 to 70 ft (fig. 11). The greatest thickness of the Big Sioux aquifer was observed along transect L1 near boring SF23 where the thickness was between 65 and 70 ft (fig. 11). The average estimated thickness of the Big Sioux aquifer in the Nose survey area was about 50 ft. The top elevation and thickness contour maps in the Nose survey area both displayed a relatively deep channel along the western edges of transects L1 and L2 that extended toward the Big Sioux River (figs. 10, 11). The lower top elevation of glacial till and the greater thickness of the Big Sioux aquifer along the southeastern part of transect L7 correlated well with the lower elevations and greater thicknesses directly east toward boring SF23 (figs. 10, 11).
Map showing the estimated contours of the top elevation of glacial till in 5-foot intervals from electrical resistivity results at the Nose survey area near the City of Sioux Falls, South Dakota.

Map showing the estimated contours of the thickness of the Big Sioux aquifer in 5-foot intervals from electrical resistivity results at the Nose survey area near the City of Sioux Falls, South Dakota.
Summary
The City of Sioux Falls, South Dakota, requested the U.S. Geological Survey (USGS) perform electrical resistivity surveys on three parcels of land north of the city. Results from these surveys were used to delineate the top of glacial till deposits for the purpose of characterizing the Big Sioux aquifer near the City of Sioux Falls. Electrical resistivity tomography (ERT) data were collected March 14–18, 2022 in the Nose survey area, and November 17–21, 2025, in the North and Well 72 survey areas. In total, the USGS surveyed 22 transects for a combined length of 3.4 line-kilometers. Latitude, longitude, and land-surface elevation data were collected at electrical-resistivity survey electrodes using real-time kinematic surveys.
The top elevation of glacial till and the thickness of the Big Sioux aquifer varied among the three survey areas. The interpreted top elevation of glacial till in the North survey area decreases from east to west toward a slough, with elevations ranging from 1,403 feet (ft) along transect NS1 to 1,418 ft along transect NS10. The estimated thickness of the Big Sioux aquifer in the North survey area increased from east to west, with thicknesses ranging from 23 to 38 ft. The average estimated thickness of the Big Sioux aquifer in the North survey area was about 30 ft. The top elevation and thickness contour maps in the North survey area both displayed east-west trending channels where groundwater could preferentially flow from east to west if flow follows the top of glacial till.
In the Well 72 survey area, the top elevation of glacial till delineated from ERT models was compared to lithologic data from eight borings. Elevation differences between the borings and the ERT models ranged from 0.68 to 11.80 ft, with an average difference of about 4.1 ft. Lithologic data from borings that fully penetrate the Big Sioux aquifer in the Well 72 area indicates that the top elevation of glacial till can vary considerably over short distances, so the elevation differences between ERT models and borings may reflect real subsurface variability. The top elevation of glacial till in the Well 72 survey area generally decreases from northwest to southeast toward well 72. Top elevations of glacial till in the Well 72 survey area ranged from 1,400 ft along the central parts of transects W72_1 and W72_4 to 1,409 ft along the southern end of transect W72_2. A relatively low elevation channel was observed along the central parts of transects W72_1–W72_4, which may affect groundwater flow in the area. The estimated thickness of the Big Sioux aquifer in the Well 72 survey area was greatest along a southeast to northwest trending channel near the central parts of transects W72_1–W72_4, with thicknesses ranging from 28 to 40 ft. The greatest thickness of the Big Sioux aquifer was observed along the southern part of transect W72_4 near well 72. The average estimated thickness of the Big Sioux aquifer in the Well 72 survey area was about 32 ft.
In the Nose survey area, the top elevation of glacial till was compared to lithologic data from nine borings. Elevation differences between borings and ERT models were less than 3 ft for most transects, with a maximum difference of about 10 ft at transects L2 and L3. The top elevation of glacial till in the Nose survey area generally decreases westward toward the Big Sioux River. Top elevations of the glacial till in the Nose survey area ranged from 1,362 ft near the center of transect L1 near boring SF23 to 1,395 ft in the southeast and northeast parts of the area. The estimated thickness of the Big Sioux aquifer in the Nose survey area was greatest along the western parts of transects L1–L5, with thicknesses ranging from 33 to 70 ft. The greatest thickness of the Big Sioux aquifer was observed along transect L1 near boring SF23, where the thickness was between 65 and 70 ft. The average estimated thickness of the Big Sioux aquifer in the Nose survey area was about 50 ft. The top elevation and thickness contour maps in the Nose survey area both displayed a relatively deep channel along the western edges of transects L1 and L2 that extended toward the Big Sioux River. The lower top elevation of glacial till and the greater thickness of the Big Sioux aquifer along the southeastern part of transect L7 correlated well with the lower elevations and greater thicknesses directly east toward boring SF23.
References Cited
Advanced Geosciences Inc, 2026a, High-speed 2D/3D resistivity/IP/SP imaging system package—56 electrodes: Advanced Geosciences Inc. web page, accessed January 2026 at https://www.agiusa.com/high-speed-2d3d-resistivityipsp-imaging-system-package-56-electrodes.
Advanced Geosciences Inc, 2026b, AGI EarthImager 2D: Advanced Geosciences Inc. software, accessed February 2026 at https://www.agiusa.com/agi-earthimager-2d.
Constable, S.C., Parker, R.L., and Constable, C.G., 1987, Occam’s inversion—A practical algorithm for generating smooth models from electromagnetic sounding data: Geophysics, v. 52, no. 3, p. 289–300, accessed January 2026, at https://doi.org/10.1190/1.1442303.
Davis, K.W., Eldridge, W.G., Valder, J.F., and Valseth, K.J., 2019, Groundwater-flow model and analysis of groundwater and surface-water interactions for the Big Sioux aquifer, Sioux Falls, South Dakota: U.S. Geological Survey Scientific Investigations Report 2019–5117, 86 p., accessed January 2026 at https://doi.org/10.3133/sir20195117.
Esri, 2026a, World Imagery: Esri map service, various resolution, accessed March 2026 at https://services.arcgisonline.com/ArcGIS/rest/services/World_Imagery/MapServer.
Esri, 2026b, Topo to raster (spatial analyst): Esri web page, accessed January 2026 at https://pro.arcgis.com/en/pro-app/latest/tool-reference/spatial-analyst/topo-to-raster.htm.
Esri, 2026c, Contour (Spatial Analyst): Esri web page, accessed January 2026 at https://pro.arcgis.com/en/pro-app/latest/tool-reference/spatial-analyst/contour.htm.
Farquharson, C.G., and Oldenburg, D.W., 1998, Non-linear inversion using general measures of data misfit and model structure: Geophysical Journal International, v. 134, no. 1, p. 213–227, accessed January 2026, at https://doi.org/10.1046/j.1365-246x.1998.00555.x.
HR Green, Inc., 2026, Sioux Falls Collector Well 72 helps optimize water supply: HR Green, Inc., accessed February 2026 at https://www.hrgreen.com/projects/sioux-falls-collector-well-72-helps-optimize-water-supply/.
Loke, M.H., 2000, Electrical imaging surveys for environmental and engineering studies—A practical guide to 2-D and 3-D surveys: Michigan Technological University, 57 p., accessed February 2026 at https://pages.mtu.edu/~ctyoung/LOKENOTE.PDF.
Loke, M.H., 2004, Tutorial—2-D and 3-D electrical imaging surveys: University of Alberta, Unsworth Lab, 157 p., accessed January 2026 at https://sites.ualberta.ca/~unsworth/UA-classes/223/loke_course_notes.pdf.
Medler, C.J., and Anderson, T.M., 2026, Electrical resistivity tomography (ERT) data collected March 14–18, 2022 and November 17–21, 2025, north of Sioux Falls, South Dakota: U.S. Geological Survey data release, https://doi.org/10.5066/P18XCLZT.
Minnehaha County, 2026, Interactive Public Map Viewer: Minnehaha County Planning and Zoning Department web application, accessed February 2026 at https://mcgis-minnehahacounty.opendata.arcgis.com/.
National Geodetic Survey, 2014, Finding survey marks and datasheets: National Geodetic Survey Data Explorer—Data sheet for permanent identifier PU2524: National Oceanic and Atmospheric Administration, National Geodetic Survey digital data, accessed February 2026 at https://www.ngs.noaa.gov/. [Datasheet for permanent identifier PU2524 directly accessible at https://geodesy.noaa.gov/cgi-bin/ds_pid.prl.]
Rydlund, P.H., Jr., and Densmore, B.K., 2012, Methods of practice and guidelines for using survey-grade Global Navigation Satellite Systems (GNSS) to establish vertical datum in the United States Geological Survey: U.S. Geological Survey Techniques and Methods, book 11, chap. D1, 102 p., accessed January 2026 at https://doi.org/10.3133/tm11D1.
Sheets, R.A., 2002, Use of electrical resistivity to detect underground mine voids in Ohio: U.S. Geological Survey Water-Resources Investigations Report 2002–4041, 10 p., accessed January 2026 at https://doi.org/10.3133/wri024041.
South Dakota Department of Agriculture and Natural Resources, 2025, Water well completion reports: South Dakota Department of Agriculture and Natural Resources, accessed December 2025 at https://apps.sd.gov/nr68welllogs/.
Telford, W.M., Geldart, L.P., and Sheriff, R.E., 1990, Applied geophysics (2d ed.): Cambridge, U.K., Cambridge University Press, 770 p. [Also available at https://doi.org/10.1017/CBO9781139167932.]
U.S. Geological Survey, 2024, 1 meter digital elevation models—USGS National Map 3DEP downloadable data collection: U.S. Geological Survey Science Data Catalog, accessed December 2025 at https://data.usgs.gov/datacatalog/data/USGS:77ae0551-c61e-4979-aedd-d797abdcde0e.
Valseth, K.J., Delzer, G.C., and Price, C.V., 2018, Delineation of the hydrogeologic framework of the Big Sioux aquifer near Sioux Falls, South Dakota, using airborne electromagnetic data: U.S. Geological Survey Scientific Investigations Map 3393, 2 sheets, accessed January 2026 at https://doi.org/10.3133/sim3393.
Zohdy, A.A.R., Eaton, G.P., and Mabey, D.R., 1974, Application of surface geophysics to ground-water investigations: U.S. Geological Survey Techniques of Water Resources Investigations, book 2, chap. D1, 116 p., accessed February 2026 at https://doi.org/10.3133/twri02D1.
Appendix 1. North Survey Area Electrical Resistivity Models
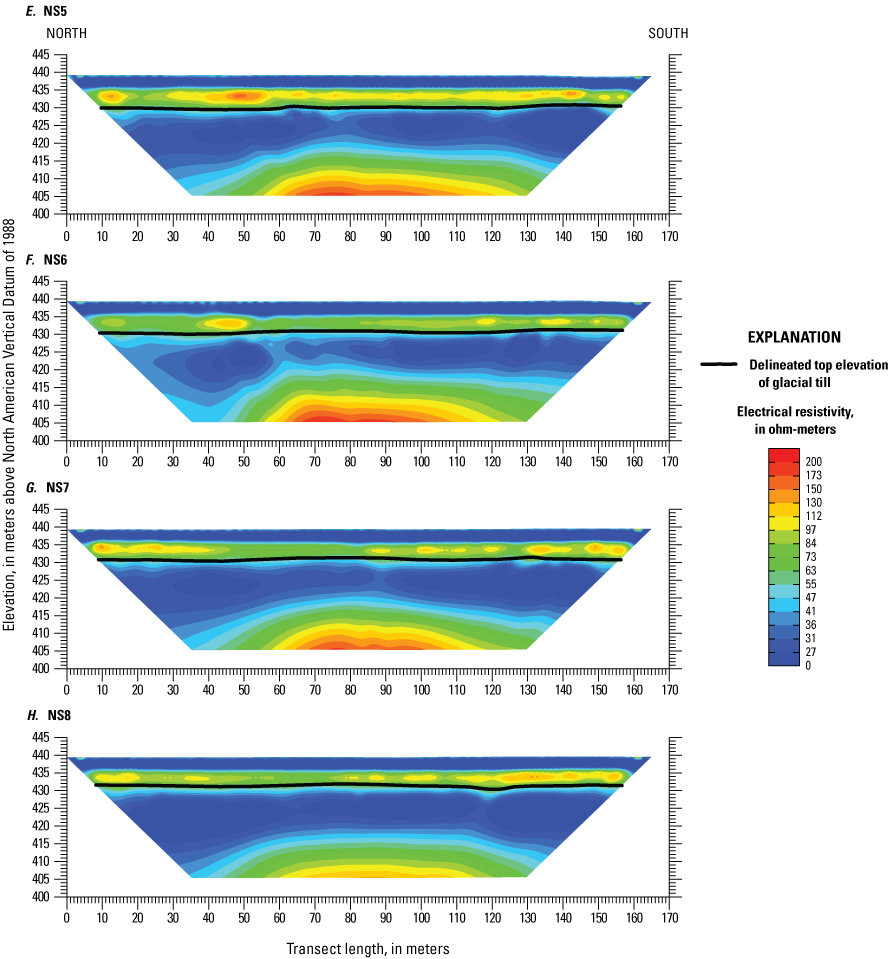
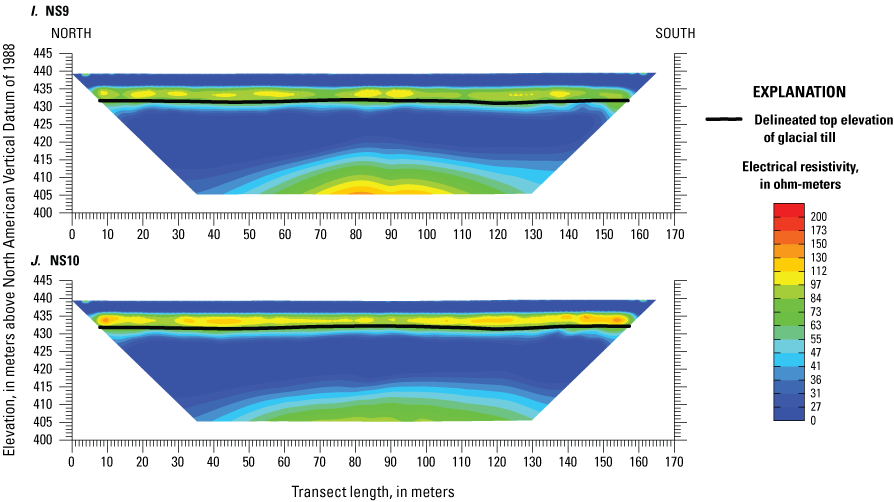
Graphs showing electrical resistivity models for the North survey area for transects NS1–NS10. A, NS01. B, NS02. C, NS03. D, NS04. E, NS05. F, NS06. G, NS07. H, NS08. I, NS09. J, NS10.
Appendix 2. Well 72 Survey Area Electrical Resistivity Models
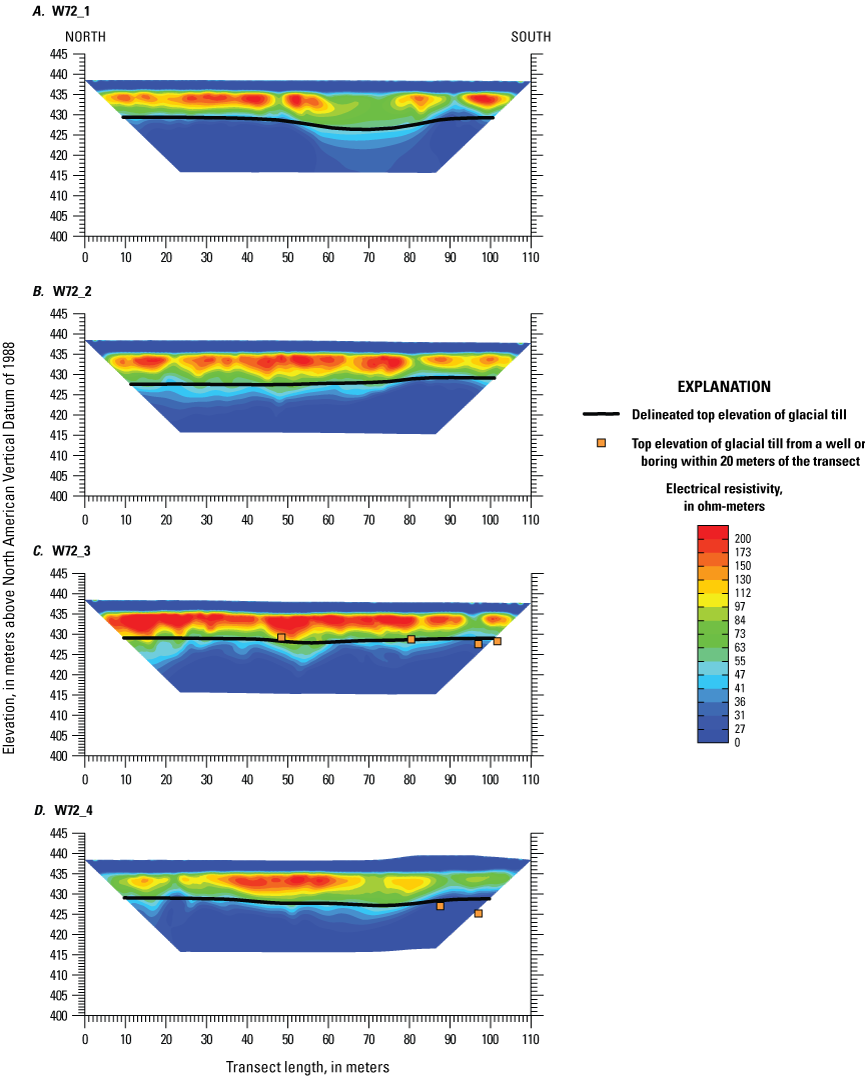
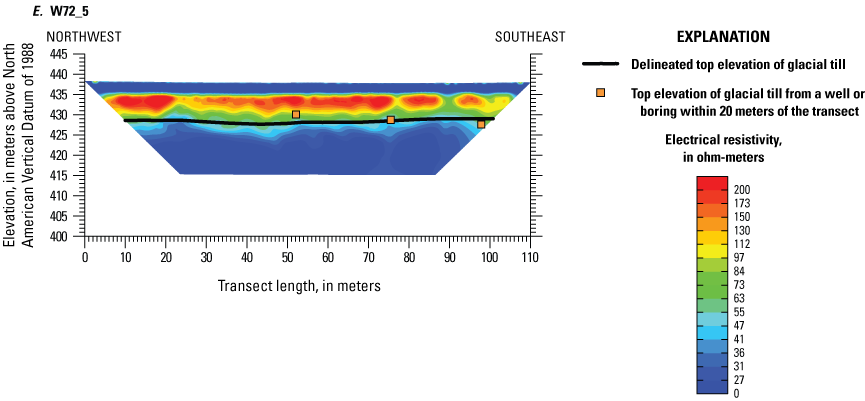
Graphs showing electrical resistivity models for the Well 72 survey area for transects W72_1–W72_5. A, W72_1. B, W72_2. C, W72_3. D, W72_4. E, W72_5.
Appendix 3. Nose Survey Area Electrical Resistivity Models
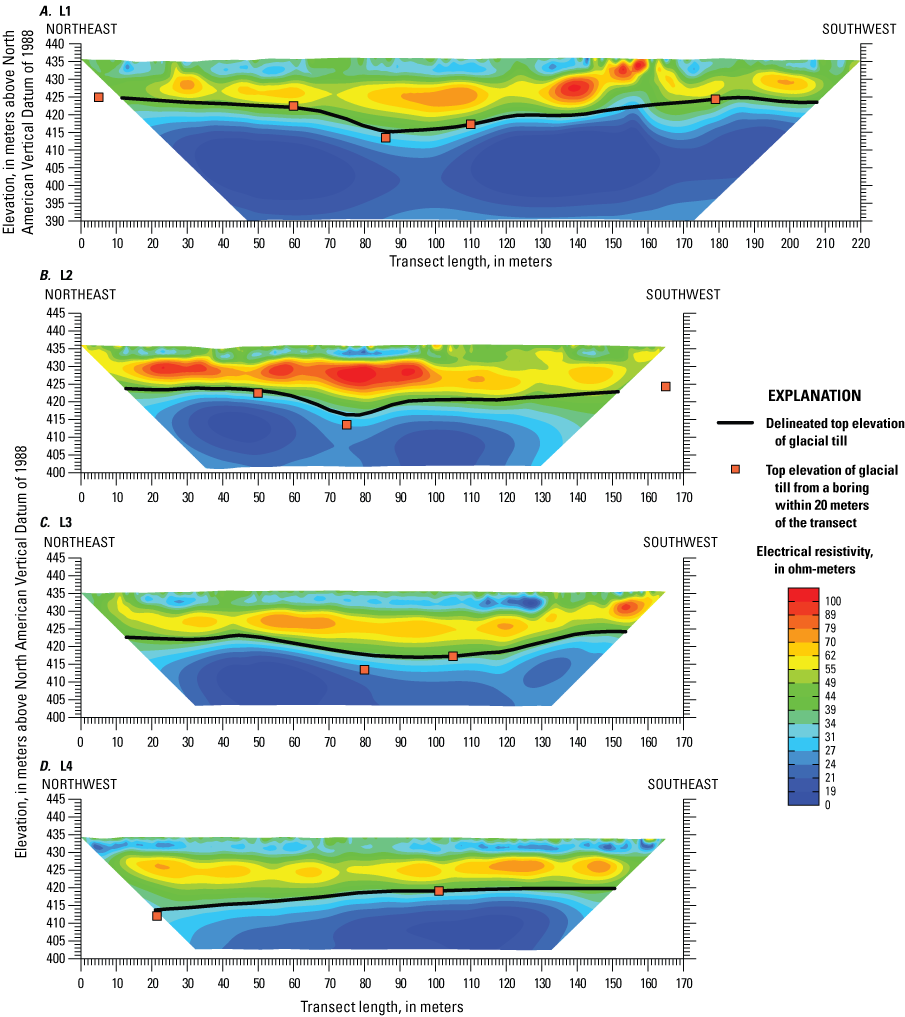
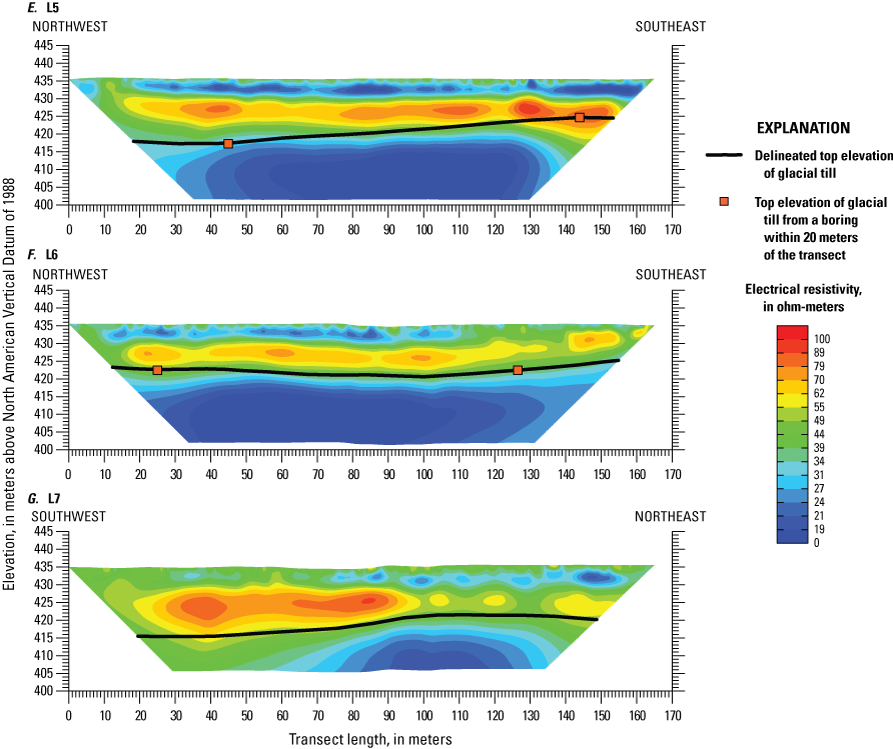
Graphs showing electrical resistivity models for the Nose survey area for transects L1–L7. A, L1. B, L2. C, L3. D, L4. E, L5. F, L6. G, L7.
Datums
Vertical coordinate information is referenced to the North American Vertical Datum of 1988 (NAVD 88).
Horizontal coordinate information is referenced to the North American Datum of 1983 (NAD 83).
Elevation, as used in this report, refers to distance above the vertical datum.
For more information about this publication, contact:
Director, Dakota Water Science Center
821 East Interstate Avenue
Bismarck, ND 58503
701–250–7400
1608 Mountain View Road
Rapid City, SD 57702
605–394–3200
For additional information, visit: https://www.usgs.gov/centers/dakota-water
Publishing support provided by the
USGS Science Publishing Network,
Rolla, Sacramento, and Baltimore Publishing Service Centers
Disclaimers
Any use of trade, firm, or product names is for descriptive purposes only and does not imply endorsement by the U.S. Government.
Although this information product, for the most part, is in the public domain, it also may contain copyrighted materials as noted in the text. Permission to reproduce copyrighted items must be secured from the copyright owner.
Suggested Citation
Medler, C.J., and Anderson, T.M., 2026, Top elevation of glacial till and thickness of the Big Sioux aquifer delineated from electrical resistivity tomography surveys near Sioux Falls, South Dakota, 2022 and 2025: U.S. Geological Survey Scientific Investigations Report 2026–5023, 29 p., https://doi.org/10.3133/sir20265023.
ISSN: 2328-0328 (online)
Study Area
| Publication type | Report |
|---|---|
| Publication Subtype | USGS Numbered Series |
| Title | Top Elevation of Glacial Till and Thickness of the Big Sioux Aquifer Delineated From Electrical Resistivity Tomography Surveys Near Sioux Falls, South Dakota, 2022 and 2025 |
| Series title | Scientific Investigations Report |
| Series number | 2026-5023 |
| DOI | 10.3133/sir20265023 |
| Publication Date | May 12, 2026 |
| Year Published | 2026 |
| Language | English |
| Publisher | U.S. Geological Survey |
| Publisher location | Reston, VA |
| Contributing office(s) | Dakota Water Science Center |
| Description | Report: vi, 29 p.; Data Release |
| Country | United States |
| State | South Dakota |
| Other Geospatial | Big Sioux Aquifer |
| Online Only (Y/N) | Y |
| Additional Online Files (Y/N) | N |