

Flood-Inundation Maps of the Blue River and Major Tributaries in and near Kansas City, Missouri, 2023–25
Links
- Document: Report (33 MB pdf) , HTML , XML
- Data Release: USGS data release - Flood-inundation map products, travel time estimates, geospatial information, and hydraulic models of the Blue River and major tributaries, in and near Kansas City, Missouri, 2023–25
- Download citation as: RIS | Dublin Core
Acknowledgments
The authors acknowledge the local and Federal agencies—the City of Kansas City, Missouri, Johnson County (Kansas) Stormwater Management Program, and the U.S. Army Corps of Engineers—that have cooperated in the funding for the operation and maintenance of the streamgages used for this study. Special thanks are given to KC Water, the City of Kansas City water services department, for their cooperation with this study, and to the National Weather Service for their continued support of the U.S. Geological Survey flood-inundation mapping initiative.
Abstract
Digital flood-inundation maps for 35.5 miles of the Blue River, in and near Kansas City, Missouri, were created by the U.S. Geological Survey (USGS) in cooperation with the City of Kansas City. Maps were also developed for a combined 7.3 miles of Brush Creek (4.4 miles) and Indian Creek (2.9 miles), two primary tributaries to the Blue River in the study reach. The flood-inundation maps, available through the USGS Flood Inundation Mapping Program website at https://water.usgs.gov/osw/flood_inundation/, depict estimates of the areal extent and depth of flooding, depth of water above first-floor elevations in selected buildings, water velocity, water-surface elevations, and time of travel corresponding to selected water levels or gage heights (hereafter referred to as “stages”) at nine reference USGS streamgages—five on the Blue River (USGS station numbers 06893590, 06893578, 06893500, 06893150, and 06893100), two on Brush Creek (USGS station numbers 06893562 and 06893557), one on Indian Creek (USGS station number 06893390), and one on the Missouri River (USGS station number 06893000). Near-real-time stages at these streamgages may be obtained from USGS Water Data for the Nation at https://doi.org/10.5066/F7P55KJN or the National Weather Service National Water Prediction Service at http://water.noaa.gov/, which also forecasts flood hydrographs at seven of these sites (USGS station numbers 06893000, 06893590, 06893578, 06893500, 06893150, 06893557, and 06893390).
Flood profiles were computed for eight map reaches by means of two-dimensional hydraulic models. The models were calibrated using the USGS-developed stage–streamflow relations at each reference streamgage. Two map reaches on the lower Blue River also include the effects of backwater from the Missouri River on flood inundation extent and hydraulic characteristics.
The hydraulic models were used to compute water-surface profiles for flood stages at 1-foot intervals referenced to the streamgage datums. The profile stages ranged from the National Weather Service “Action Stage” or near bankfull to a stage exceeding the highest recorded water level at each streamgage. The simulated water-surface profiles were then combined with a digital elevation model (derived from light detection and ranging data having a nonvegetated vertical accuracy of a maximum 10-centimeter root-mean-square error) to delineate the area flooded at each water level and the associated hydraulic characteristics.
The availability of these maps, along with information regarding current stage from the USGS streamgage and forecasted high-flow stages from the National Weather Service, will provide emergency management personnel, resource managers, and residents with information that could be critical for flood-response activities such as evacuations and road closures, as well as for postflood recovery efforts.
Plain Language Summary
The U.S. Geological Survey (USGS) created a new set of flood-inundation maps for the Blue River and two of its tributaries, Brush Creek and Indian Creek, in and near Kansas City, Missouri. These maps show where flooding is likely to spread and how deep the water may get when the river rises to different water levels. The maps are based on water-level information measured at eight USGS streamgages in the area. Using computer simulations, the USGS estimated how water would move through river channels and across nearby land during floods. The results show the likely extent of flooding, areas where water may flow quickly, and places where the water might become deep enough to threaten buildings and roads. These maps can help residents, businesses, and emergency managers understand their flood risk and make informed decisions before and during flood events. Knowing which areas may flood at different river levels helps people better plan evacuation routes, road closures, and other safety measures.
Introduction
The City of Kansas City, Missouri (Mo.), (hereafter referred to as Kansas City) which, as of 2024, had an estimated population of about 508,000 (U.S. Census Bureau, 2025), has experienced moderate to major flooding from multiple sources, including the Blue River on numerous occasions, most notably in 1951, 1961, 1977, 1984, 1990, 1998, 2010, and 2017 (National Water Prediction Service, 2025a). Losses from the 1951, 1977, and 1998 events alone resulted in damage within Kansas City costing $650 million dollars and a reported 64 casualties (U.S. Army Corps of Engineers, 1967; Hauth and others, 1981; Ward, 2017; National Weather Service, 2025). Floodplains within Kansas City are moderately to highly developed and contain a mix of residential and commercial structures (U.S. Geological Survey, 2024a). Flood-inundation maps were generated for reaches of the Blue River and for selected tributaries in previous studies (Kelly and Rydlund, 2006; Kelly and Huizinga, 2008; Heimann and others, 2015, 2021). An additional source of flood information is U.S. Geological Survey (USGS) streamgage data (U.S. Geological Survey, 2023d) and Automated Local Elevation in Real Time (ALERT) streamgage information (available at https://www.stormwatch.com/) from which current (2026) or historical water levels (stages) and streamflows, if measured, can be obtained. Lastly, the National Water Prediction Service (NWPS) displays the USGS stage data from the streamgages and issues forecasts of stage at selected sites, including six of the sites used in this study (USGS station numbers 06893590, 06893578, 06893500, 06893150, 06893557, and 06893390; National Water Prediction Service, 2025e). Emergency responders have relied on these flood-inundation maps and the provided information sources to make decisions on how to best alert the public and mitigate flood damage.
Although real-time stage readings at a USGS streamgage are particularly useful for residents near a streamgage, these data are of limited use to residents farther upstream or downstream because the water-surface elevation is not constant along the entire stream reach. Knowledge of a water level at a streamgage is difficult to translate into the depth and areal extent of flooding at points distant from the streamgage. One way to address these informational gaps is to produce a library of flood-inundation maps that are referenced to the stages recorded at the USGS streamgage. By referring to the appropriate map, emergency responders can discern the severity of flooding (depth of water and areal extent), identify roads that are or will soon be flooded, and plan for notifying or evacuating residents in harm’s way for some distance upstream and downstream from the streamgage. The capability to visualize the potential extent of flooding has been shown to motivate residents to take precautions and heed warnings that they previously might have disregarded. In 2023, the USGS, in cooperation with the City of Kansas City, Mo., began a project to produce libraries of updated flood-inundation maps for eight reaches, representing 35.5 miles (mi) of the Blue River and 7.3 mi of selected tributaries (Indian Creek and Brush Creek) in Kansas City, Mo., and nearby areas.
Purpose and Scope
This report describes the development of a series of estimated flood-inundation map products for the Blue River and selected tributaries in and near Kansas City, Mo., and identifies where the maps and ancillary data (geographic information system [GIS] flood polygons, depth grids, water-surface elevation grids, water velocity grids, and water depth above estimated first-floor elevations at selected floodplain structures) are available for download. This report expands upon flood-inundation mapping studies documented in earlier USGS reports of the area, describing flood-inundation mapping for the same general area (Heimann and others, 2015, 2021). Time-of-travel estimates are also provided with the GIS products to indicate travel time between streamgages with varying stages. The study area includes a 35.5-mi reach of the Blue River from its confluence with the Missouri River, in Kansas City, Mo., to 1.5 mi upstream from the streamgage at Kenneth Road, Overland Park, Kans. (USGS station number 06893100; fig. 1). Additional map reaches include 4.4 mi of Brush Creek from near its junction with the Blue River upstream from the Missouri-Kansas State line and 2.9 mi of Indian Creek from near its junction with the Blue River upstream from the Missouri-Kansas State line (fig. 1). The maps were produced for flood levels simulated with two-dimensional hydraulic models and referenced to stages recorded at nine USGS streamgages (table 1). The reference streamgages included five gages on the Blue River (06893100, 06893150, 06893500, 06893578, 06893590), two gages on Brush Creek (06893557, 06893562), one gage on Indian Creek (06893390), and one gage on the Missouri River (06893000). Flood-inundation maps for the two downstream-most reaches of the Blue River included the effects of backwater from the Missouri River on flood-inundation extent and ancillary hydraulic conditions. The map products cover a range of stages from near-bankfull conditions, or the National Weather Service (NWS, 2024) “Action Stage,” to a stage exceeding the highest observed stage at the reference streamgage. Maps that show the extent of inundation of the Blue River affected by backwater from the Missouri River are referenced to the Missouri River at Kansas City, Mo., (USGS streamgage 06893000) and cover a range of stages from 33 to 65 feet (ft) at this streamgage. The 33-ft stage is approximately the NWS flood stage at the Missouri River at Kansas City. The 65-ft stage exceeds the estimated 0.2-percent annual exceedance probability (AEP) flood at the Missouri River at Kansas City, as determined by the U.S. Army Corps of Engineers (2023). All streamgages referenced in this report are situated in or near Kansas City, Mo., unless otherwise noted. The flood-inundation map products can be accessed from the USGS flood-inundation mapper website (U.S. Geological Survey, 2026).
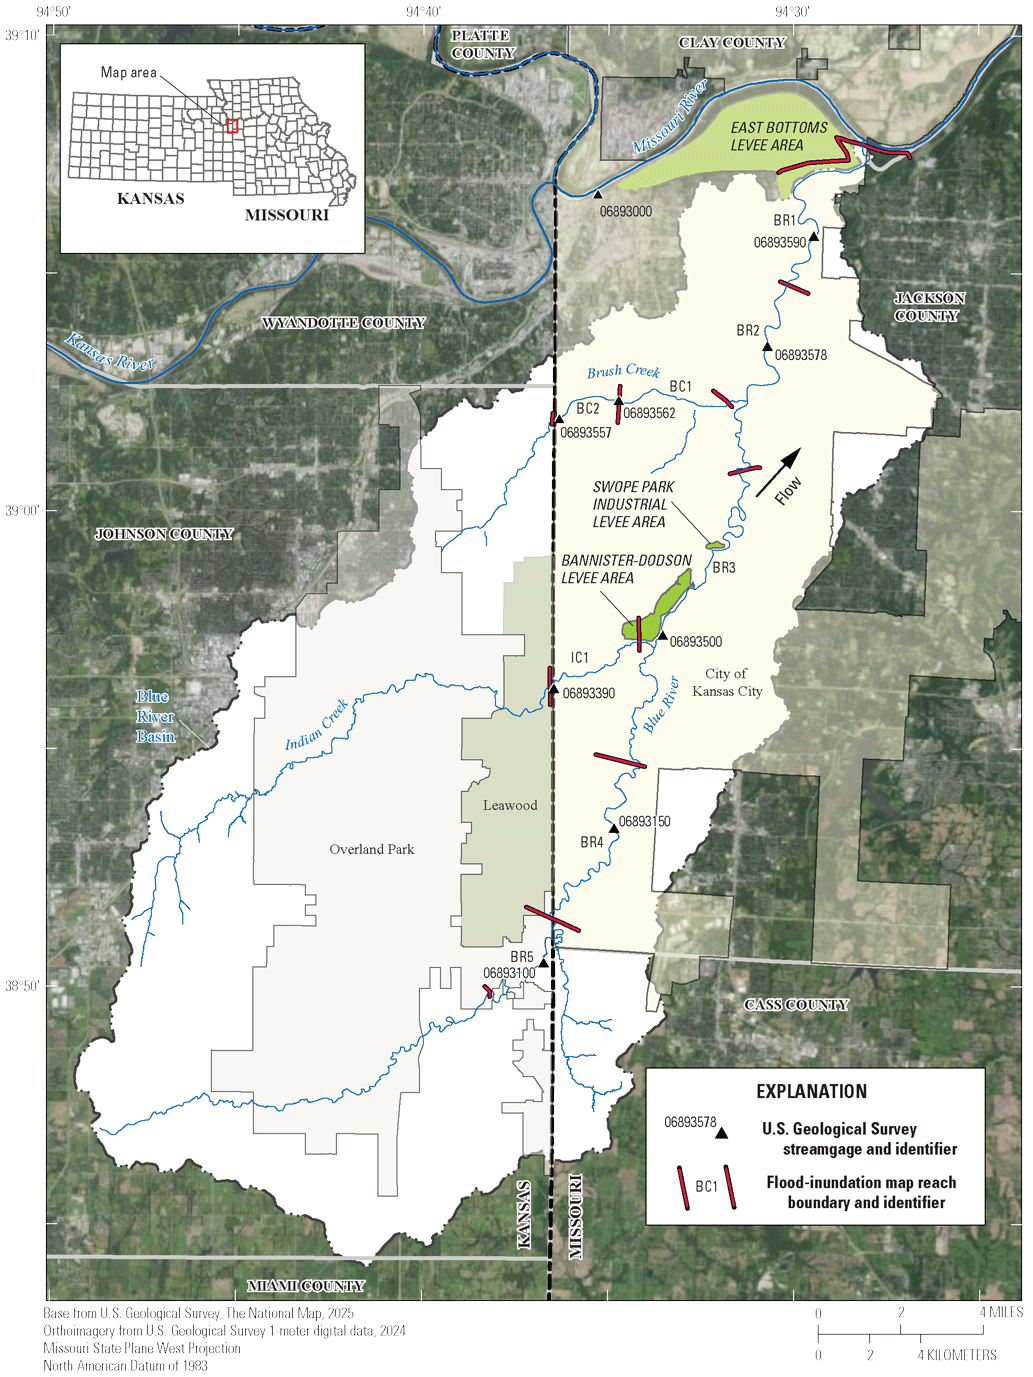
Blue River Basin, streamgage locations, and extents of the flood-inundation map reaches, Kansas City, Missouri, and vicinity.
Table 1.
U.S. Geological Survey streamgage information for the Blue River Basin, Kansas City, Missouri, and vicinity.[Information from U.S. Geological Survey (2023d) unless otherwise noted. Latitude and longitude are given in degrees (°), minutes (′), and seconds (″). ID, identification; USGS, U.S. Geological Survey; mi2, square mile; ft, foot; NAVD 88, North American Vertical Datum of 1988; ft3/s, cubic foot per second; BR, Blue River; MO, Missouri; Blvd, boulevard; Ext, extension; KC, Kansas City; R, river; Rd, road; KS, Kansas; BC, Brush Creek; IC, Indian Creek; C, creek; NA, not applicable]
| Reach ID (fig. 1) | Station name | USGS station number | Drainage area (mi2) |
Gage datum (ft, NAVD 88) | Latitude | Longitude | Period of continuous record(s)1 | Maximum recorded stage | Maximum recorded streamflow | ||
|---|---|---|---|---|---|---|---|---|---|---|---|
| ft | Date | ft3/s | Date | ||||||||
| BR1 | Blue River at 12th Street in Kansas City, MO | 06893590 | 258 | 714.84 | 39°05′48.9″ | 94°29′27.7″ | October 1982 to September 1984, October 1987 to November 1993, October 1994 to September 1996, October 1998 to September 2002, October 2006 to present | 31.91 | May 16, 1990 | 34,900 | September 13, 1977 |
| BR2 | Blue River at Stadium Drive in Kansas City, MO | 06893578 | 256 | 718.41 | 39°03′30″ | 94°30′42″ | July 2002 to present | 35.39 | August 22, 2017 | 33,400 | August 22, 2017 |
| BR3 | Blue River at Kansas City, MO | 06893500 | 188 | 754.39 | 38°57′25.2″ | 94°33′32.0″ | May 1939 to present | 44.46 | September 13, 1961 | 43,900 | August 22, 2017 |
| BR4 | Blue River at Blue Ridge Blvd Ext in KC, MO | 06893150 | 93.1 | 800.38 | 38°53′21.9″ | 94°34′50.4″ | June 2002 to present | 244.50 | September 13, 1961 | 22,600 | August 22, 2017 |
| BR5 | Blue R at Kenneth Rd, Overland Park, KS | 06893100 | 65.8 | 858.36 | 38°50′32″ | 94°36′44″ | April 2003 to present | 22.29 | August 22, 2017 | 12,400 | August 22, 2017 |
| BC1 | Brush Creek at Rockhill Road in Kansas City, MO | 06893562 | 17.0 | 800.14 | 39°02′21.3″ | 94°34′43.4″ | July 1998 to present | 21.71 | October 4, 1998 | 21,700 | October 4, 1998 |
| BC2 | Brush Creek at Ward Parkway in Kansas City, MO | 06893557 | 12.2 | 800.48 | 39°01′59.1″ | 94°36′19.4″ | July 1998 to present | 353.00 | September 12, 1977 | 14,400 | July 27, 2017 |
| IC1 | Indian C at State Line Rd, Leawood, KS | 06893390 | 64.2 | 803.43 | 38°56′18″ | 94°36′28″ | April 2003 to present | 28.26 | August 22, 2017 | 23,600 | August 22, 2017 |
| NA | Missouri River at Kansas City, MO | 06893000 | 484,100 | 706.68 | 39°06′42.2″ | 94°35′17.3″ | October 1928 to present | 48.87 | July 27, 1993 | 625,000 | June 16, 1844 |
Data from National Water Prediction Service (2025b).
Data from National Water Prediction Service (2025c).
Study Area Description
The Blue River Basin in west-central Missouri and east-central Kansas is in the Central Irregular Plains ecoregion (Omernik, 1987), which can be further divided into the Wooded Osage Plains, Osage Cuestas, Rolling Loess Prairies, and Missouri Alluvial Plain (Omernik, 1987; Nigh and Schroeder, 2002; U.S. Environmental Protection Agency, 2020). The headwaters of the Blue River originate in Johnson County, Kans., and the stream flows generally northward before entering the City of Kansas City city limits (fig. 1). The drainage area of the main stem Blue River streamgages used in this study range from 65.8 square miles (mi2) at the Blue River at Kenneth Road, Kans., (06893100) to 258 mi2 at the Blue River at 12th Street (06893590). Brush Creek (subbasin drainage area of 30 mi2) and Indian Creek (subbasin drainage area of 75 mi2) are the two largest tributaries to the Blue River main stem as it flows through Kansas City (Heimann and others, 2015). The Blue River study reach has an average top-of-bank channel width of about 185 ft and an average channel slope of 4.4 feet per mile (ft/mi; Heimann and others, 2015). The Brush Creek study reach is approximately 5.2 mi long and has an average top-of-bank channel width of 117 ft and an average slope of 20.5 ft/mi. The Indian Creek reach is approximately 3.3 mi with an average top-of-bank channel width of 144 ft and average slope of 15.9 ft/mi (Heimann and others, 2015).
The Blue River Basin is mostly urbanized downstream from the Blue Ridge Boulevard Extension streamgage (06893150; fig. 1) and consists primarily of grassland or forest upstream from this streamgage (Wilkison and others, 2006). The upper Blue River Basin is still under development, as indicated by a 14 percent increase in development-category land cover upstream from the Blue Ridge Boulevard Extension streamgage between 2000 and 2021 (U.S. Geological Survey, 2024a). Overall, about 70 percent of the land use-land cover in the Blue River Basin was classified in the National Land Cover Database developed land-cover categories in 2021, whereas 99 percent of the Brush Creek Basin and 94 percent of the Indian Creek Basin were categorized as developed (U.S. Geological Survey, 2024a). Commercial and industrial developments are concentrated along the lower reaches of Blue River, Brush Creek, and Indian Creek. The Blue River Channel Project, which began in 1983 and ended in 2016, resulted in the channelization of the lower 12.5 mi of the Blue River to reduce flood risk (U.S. Army, 2016). Levee-protected areas are situated near the confluence of the Blue River with the Missouri River—the East Bottoms levee area, near the confluence of Indian Creek with the Blue River—the Bannister-Dodson levee area, and 2.75 mi downstream of the Blue River at Kansas City streamgage—the Swope Park Industrial levee area (fig. 1). The leveed areas are included in the U.S. Army Corps of Engineers National Levee Database (U.S. Army Corps of Engineers, 2025).
Previous Studies
Flood-inundation maps for the Blue River have been developed in several previous studies. Kelly and Rydlund (2006) created maps for the section of the Blue River Basin downstream of 63rd Street to the confluence with the Missouri River (equivalent to reaches BR2 and BR1 in current study, fig. 1). Kelly and Huizinga (2008) developed maps for the reach upstream from 63rd Street (about 2.5 mi upstream from Brush Creek and Blue River confluence) to streamgage 06893100 at Kenneth Road, Overland Park, Kans. (similar to reaches BR3, BR4, and BR5 in current study, fig. 1). Those studies generated maps in 2-ft water-surface-elevation increments and referenced all inundation extents to a single City of Kansas City ALERT gage at the Blue River at 63rd Street, Kansas City, Mo. Heimann and others (2015) expanded the mapping to 15 reaches of the Blue River and major tributaries, producing maps generated from one-dimensional hydraulic models in 1-ft increments and referencing each reach to its corresponding reference streamgage. In 2019, Heimann and others (2021) revised flood-inundation maps for a reach of the Blue River located from near the confluence of Indian Creek upstream about 4.5 miles (fig. 1) and referenced those maps to a City of Kansas City ALERT streamgage near Red Bridge Road (not shown on map).
The latest published flood insurance study that includes the City of Kansas City presents estimates of the peak streamflows and associated AEPs and their associated water-surface elevations at several locations along the Blue River and selected tributaries (Federal Emergency Management Agency, 2023). The latest flood insurance study for the upper Blue River in Johnson County, Kans., was published in 2009 (Federal Emergency Management Agency, 2009). Estimated peak streamflows for an AEP of 0.2 percent (500-year recurrence interval) that were used to define the upper extent of the range of flood-inundation maps for the Blue River at selected tributaries were obtained from the USGS StreamStats application (U.S. Geological Survey, 2023c).
Creation of Flood-Inundation-Map Library and Analysis of Flood Travel Times
The USGS has standardized procedures for creating flood-inundation maps for flood-prone communities (U.S. Geological Survey, 2023b), ensuring that the processes followed and products produced are consistent regardless of which USGS office is responsible for the work. Tasks specific to the development of the flood maps for this study included (1) surveying the bathymetry (channel geometry) of Blue River, Brush Creek, and Indian Creek channels and selected bridge crossings; (2) surveying and estimating first floor elevations of selected buildings in the Blue River floodplain, (3) developing two-dimensional models of eight reaches of the Blue River and its tributaries, (4) generating model streamflow inputs over the range of simulated conditions, (5) calibrating energy-loss factors (roughness coefficients) in the stream channel and floodplain, (6) computing estimated time-of-travel estimates based on historical streamgage records; (7) computing water-surface profiles using the U.S. Army Corps of Engineers (2024) Hydrologic Engineering Center’s River Analysis System (HEC–RAS) computer program, (8) producing estimated flood-inundation maps for selected stream stages using HEC–RAS and a GIS, and (9) preparing the inundation maps as shapefile polygons that depict the areal extent of flooding at various stages, and as depth grids, velocity grids, and water-surface-elevation grids that provide the hydraulic characteristics of floodwaters for display on a USGS flood-inundation mapping application (U.S. Geological Survey, 2026).
Computation of Water-Surface Profiles
Water-surface profiles were simulated using four two-dimensional (HEC–RAS, version 6.6; U.S. Army Corps of Engineers, 2024) quasi-unsteady flow models representing the eight flood-inundation map reaches (fig. 1). The HEC–RAS model is a one- or two-dimensional model capable of simulating water-surface profiles with steady flow or unsteady-flow computation options. Quasi-unsteady (temporally varied using “stair-stepped” approach) streamflow conditions were used in this study such that inflows were incrementally increased at 12-hour intervals throughout the range of streamflows in the reference streamgage stage–streamflow relations (hereafter referred to as “ratings”).
Hydrologic Data
The study-area hydrologic network consists of nine USGS reference streamgages (hereafter referred to as “streamgages”; fig. 1; table 1) that began operation between 1928 and 2003 (U.S. Geological Survey, 2023d). Stage is measured every 15 minutes at all streamgages, continuous records of streamflow are currently (2026) computed at all sites, and the data are made available through USGS Water Data for the Nation (U.S. Geological Survey, 2023d). Seven of the nine sites are NWPS forecast points, including four sites on the Blue River (USGS station numbers 06893590, 06893578, 06893500, 06893150) one site on Brush Creek (USGS station number 06893557), one site on Indian Creek (USGS station number 06893390) and one site on the Missouri River (USGS station number 06893000; fig. 1). All water-surface elevations used in this study were referenced to the North American Vertical Datum of 1988 (NAVD 88), and all horizontal positions were referenced to the North American Datum of 1983 (NAD 83). Stage data from the streamgages are referenced to a local streamgage datum but can be converted to water-surface elevations referenced to NAVD 88 by adding the streamgage datum elevation (table 1). The stage–streamflow ratings from the Blue River, Brush Creek, and Indian Creek streamgaging stations were used in the calibration of the HEC–RAS models.
The inflows used in the model simulations were taken directly from, or extrapolated using, the current (2026) stage–streamflow rating at each streamgage. The inflows ranged from a flow corresponding to about bankfull conditions to a maximum flow that either exceeded the 0.2 AEP (500-year recurrence interval) flow, as determined using the USGS StreamStats application (U.S. Geological Survey, 2023c), or matched the flow corresponding to the highest observed stage at the reference streamgage. The streamgage-derived streamflows were adjusted, as necessary, by applying internal boundary conditions in the models to account for tributary inflows. These adjustments were estimated using a drainage-area ratio correction applied to the main-channel flows and internal boundary conditions placed at locations corresponding to 5- to 10-percent changes in drainage area from the upstream model extent. The range of inflows used in the model simulations (table 2) was obtained from the streamgage stage–streamflow rating at the reference streamgages. When the range of the stages used to develop the flood-inundation maps exceeded the stage–streamflow rating of the USGS streamgage, the rating was extended using results from the hydraulic model.
Table 2.
Range of simulated conditions at each reference streamgage for the eight flood-inundation map reaches in this study.[Information from Kostynick and others (2026). ft, foot; NAVD 88, North American Vertical Datum of 1988; ft3/s, cubic foot per second; BR, Blue River; MO, Missouri; Blvd, boulevard; Ext, extension; KC, Kansas City; R, river; Rd, road; KS, Kansas; BC, Brush Creek; IC, Indian Creek; C, creek]
| Map reach (refer to fig.1) | Reference streamgage | Stages (and number) of water-surface profiles (ft) | Water-surface elevations (ft, NAVD 88) |
Simulated range of streamflows (ft3/s) |
|---|---|---|---|---|
| 1BR1 | Blue River at 12th Street in Kansas City, MO | 223–44 (155) | 3737.84–758.84 | 4763–96,300 |
| 1BR2 | Blue River at Stadium Drive in Kansas City, MO | 226–45 (169) | 3744.41–763.41 | 4834–75,800 |
| BR3 | Blue River at Kansas City, MO | 28–48 (21) | 782.39–802.39 | 12,700–66,200 |
| BR4 | Blue River at Blue Ridge Blvd Ext in KC, Missouri | 29–48 (20) | 829.38–848.38 | 2,210–51,300 |
| BR5 | Blue R at Kenneth Rd, Overland Park, KS | 10–24 (15) | 868.36–882.36 | 1,530–41,500 |
| BC1 | Brush Creek at Rockhill Road in Kansas City, MO | 7–24 (18) | 807.14–824.14 | 1,110–21,500 |
| BC2 | Brush Creek at Ward Parkway in Kansas City, MO | 40–54 (15) | 840.48–854.48 | 960–39,600 |
| IC1 | Indian C at State Line Rd, Leawood, KS1 | 17–33 (17) | 820.43–836.43 | 3,300–49,100 |
This flood-inundation-map reach on the Blue River includes backwater effects from the Missouri River based on stage conditions at the Missouri River at Kansas City, Mo., streamgage.
Conditions representing stages of 10, 33, 37, 41, 45, 49, 53, 57, 61, and 65 feet at the Missouri River at Kansas City streamgage.
Topographic and Bathymetric Data
All topographic data used in this study are referenced vertically to NAVD 88 and horizontally to the North American Datum of 1983. The terrain data for the Blue River Basin in Missouri were obtained from a digital elevation model (DEM) derived from light detection and ranging (lidar) data collected from April 10, 2020, through November 27, 2020, and processed by NV5 Geospatial (U.S. Geological Survey, 2023a). The lidar data used in developing the DEM had a horizontal-accuracy root-mean-square error (RMSE) of 0.47 ft and a nonvegetated vertical accuracy of 0.26 ft RMSE. The terrain data for the part of the upper Blue River Basin in Kansas were collected between January 17, 2018, and March 22, 2019, and processed by the Atlantic Group, LLC (now WGI Geospatial; U.S. Geological Survey, 2023a) in accordance with USGS V1.2 QL2 data accuracy specifications (Heidemann, 2012). The generated DEM had a vertical accuracy of 0.25 ft RMSE. Because of uncertainty issues with this DEM along flight paths within the BR5 terrain region (David Nail, U.S. Geological Survey, written commun., 2024), the 2012 DEM (AIMS, 2012) used in the previous flood-inundation-mapping effort (Heimann and others, 2015) was substituted for this reach. The lidar used in this dataset had a vertical accuracy of 0.314 ft RMSE.
Because lidar data cannot provide ground elevations below the water surface of a stream, the lidar-derived DEM data used in the hydraulic models were augmented with channel and bridge survey data collected by USGS field crews between December 2021 and May 2023. Channel water depths in the thalweg were acquired using an acoustic Doppler current profiler, and water-surface elevations were obtained using global positioning system (GPS) with real-time kinematic technology or static observations. Water depths were subtracted from the interpolated water-surface elevations to obtain channel depths. Additional bathymetric data were acquired by tape-down measurements from bridge decks. A differential GPS with real-time kinematic technology was used to obtain reference elevations for the bridge decks from which channel-bed elevations were derived. A Level-IV survey procedure (Rydlund and Densmore, 2012) was used to acquire reference-point elevations. The bathymetric data were incorporated into the HEC–RAS model by merging the bathymetry DEM with the terrain DEM (Kostynick and others, 2026).
Estimates of first-floor elevations of commercial and residential structures within the Blue River floodplain were determined by a combination of field surveys and estimates from the model DEM. A total of 1,334 structures were identified within the 0.2-percent AEP floodplain area (as determined from Heimann and others, 2015). Elevations from a differential GPS field survey of 187 points that included building first-floor elevation points, lowest adjacent-grade elevation points, and flat-surface elevation points (road intersections) were compared to the DEM elevation at each point location. The mean absolute difference between survey-point elevations and corresponding DEM elevations was 0.18 ft (Kostynick and others, 2026). When the first floor of a structure was above the adjacent grade, an offset was applied either using a measured tape-down, for field survey-derived elevations, or estimated from Google Earth Pro version 7.3 Street View (Google, 2024), for DEM-derived first-floor elevations.
Hydraulic Structures
The study models contain 91 hydraulic structures, including 25 four-lane road bridges; 20 railroad bridges; 17 two-lane road bridges; 8 six-lane road bridges; 6 pedestrian bridges; 4 three-lane road bridges; 2 one-lane road bridges; 8 weirs; and 1 culvert, representing conditions as of June 2023. These structures have the potential to affect water-surface elevations during floods along the study reaches. Bridge-geometry data were obtained from previous Blue River studies (Heimann and others, 2015, 2020), field surveys completed by USGS personnel, and bridge plans obtained from the Missouri Department of Transportation (Bryan Hartnagel, Missouri Department of Transportation, written commun., 2023). The three levee areas within the study area (East Bottoms, Swope Park Industrial, and Bannister-Dodson; fig. 1) were incorporated into the model via the existing terrain or by using terrain modifications if the levees were constructed after the lidar data were collected.
Energy-Loss Factors
Hydraulic analyses require the estimation of energy losses resulting from frictional resistance exerted by a channel on flow. These energy losses are quantified by Manning’s roughness coefficient (n value). Initial (precalibration) n values were selected using the National Land Cover Database land cover classifications (U.S. Geological Survey, 2024a) field observations, and tabulated estimates of n values (Chow, 1959).
As part of the calibration process, the initial n values were adjusted until the differences between simulated and observed water-surface elevations at the reference streamgage within each map reach were minimized. The final n values ranged from 0.02 to 0.056 for the main channel and from 0.030 to 0.16 for the land-cover features in overbank areas, except for building footprints (refer to specified model roughness characteristics in Kostynick and others, 2026). The floodplains in the highly developed areas were simulated by representing buildings as separate calibration regions assigned an n=1.0, whereas the remaining adjacent-floodplain matrix consisting of streets, parking lots, developed open areas, and grassland was assigned a separate n value depending on the predominant land cover. The lowest channel roughness coefficients were placed in downstream reaches of the mapping area with concrete channels and fine-material substrate, and the highest were placed in sinuous, large substrate upstream reaches with vegetated banks. The lowest roughness coefficients on the floodplain were placed in open-water bodies, parking lots, and roadways. The highest were placed in calibration regions representing timber and buildings.
Hydraulic Models
The HEC–RAS analyses for this study were done by using four two-dimensional, hydraulic models with two map reaches within each model (map reach combinations within the models included BR1 and BR2, BR3 and IC1, BR4 and BR5, and BC1 and BC2; table 2). The models were run using a quasi-unsteady flow condition, because model-input data consisted of a “stair-stepped” temporally varied flow regime over a range of flows necessary to simulate the range of flood-inundation map stages. The range of streamflows used in the models is discussed in the “Hydrologic Data” section and specified in table 2. The models were used to generate water-surface profiles at target elevations that coincided with 1-ft increments of stage, referenced to the local streamgage datum. Subcritical (tranquil) flow conditions were assumed for the simulations. Generally normal depth, based on an estimated average water-surface slope downstream of the model extent, was used as a downstream boundary condition. For the model used to simulate reaches BR1 and BR2, normal depth was used as the downstream boundary condition for the model calibration scenario because it corresponds to a stage at the Missouri River at Kansas City streamgage of about 10 ft—a stage well below the NWS flood stage of 32 ft (National Water Prediction Service, 2025d). Additional scenarios were developed for the BR1 and BR2 model to represent the effects of backwater from the Missouri River at high-flow conditions (Missouri River at Kansas City stages of 33, 37, 41, 45, 49, 53, 57, 61, and 65 ft; table 2). In these scenarios, the downstream boundary condition of the lower BR1 and BR2 model near the junction with the Missouri River was set to varying Missouri River water-surface elevations, representing a range of Missouri River flood conditions. The water-surface at the mouth of the Blue River for a range of streamflows (20- to 0.2-percent AEP; U.S. Army Corps of Engineers, 2023) at the Missouri River at Kansas City streamgage was determined using the relation between the water-surface elevation at the Missouri River at Kansas City streamgage and the water-surface elevation at the mouth of the Blue River defined in figure 9 in Heimann and others (2015). More detailed information regarding the hydraulic models used in this study, including the model run files and outputs, can be obtained from Kostynick and others (2026).
Developed USGS stage–streamflow ratings at the streamgages were used in calibrating the models. Model calibration for each map reach was accomplished by adjusting n values until the results of the hydraulic computations closely agreed with the observed water-surface elevations for given flows.
Map Reach BR1—Blue River at 12th Street
The hydraulic model used for representing reach BR1 was calibrated to the stage–streamflow rating at the USGS streamgage Blue River at 12th Street (station number 06893590; hereafter referred to as 12th Street; fig. 1). The model was calibrated at the reference streamgage within map reach BR1 using a normal depth downstream boundary condition, excluding the hydraulic effects of the Missouri River. The simulated water-surface-elevation–streamflow rating at the streamgage location in the map reach was compared to rating number 4.1 at the 12th Street streamgage over a range of stages (20.0–32.0 ft) bounding the highest streamflow measurement recorded at 21.61 ft. The differences between the simulated values and the USGS rating at 1-ft stage increments ranged from −0.49 to 0.16 ft, with a mean absolute difference of 0.19 ft (table 3).
Table 3.
Calibration of model to water-surface elevations for stage–streamflow rating number 4.1 at the U.S. Geological Survey streamgage Blue River at 12th Street, Kansas City, Missouri (station number 06893590).[Data from U.S. Geological Survey (2023d) and Kostynick and others (2026). The simulated water-surface elevation and mean absolute difference are rounded to two decimal places for consistency. ft, foot; USGS, U.S. Geological Survey; NAVD 88, North American Vertical Datum of 1988; ft3/s, cubic feet per second; NA, not applicable; Mo., Missouri]
Map Reach BR2—Blue River at Stadium Drive
The USGS reference streamgage for the Blue River map reach BR2 (fig. 1) was the Blue River at Stadium Drive (station number 06893578; hereafter referred to as “Stadium Drive”). The model was calibrated at the reference streamgage within map reach BR2 using a normal depth downstream boundary condition, excluding the hydraulic effects of the Missouri River. The simulated water-surface-elevation–streamflow rating at the streamgage location was compared to rating number 10.0 at the Stadium Drive streamgage from the NWS Action Stage of 26.0 ft through 35.0 ft (a stage corresponding to the highest measured streamflow [about 35 ft]). The differences between the simulated values and the USGS rating at 1-ft stage increments ranged from −0.48 to 0.45 ft, with a mean absolute difference of 0.26 ft (table 4).
Table 4.
Calibration of model to water-surface elevations for stage–streamflow rating number 10.0 at the U.S. Geological Survey streamgage Blue River at Stadium Drive, Kansas City, Missouri (station number 06893578).[Data from U.S. Geological Survey (2023d) and Kostynick and others (2026). The simulated water-surface elevation and mean absolute difference are rounded to two decimal places for consistency. ft, foot; USGS, U.S. Geological Survey; NAVD 88, North American Vertical Datum of 1988; ft3/s, cubic feet per second; NA, not applicable; Mo., Missouri]
Map Reach BR3—Blue River at Kansas City
The USGS streamgage for the Blue River map reach BR3 (fig. 1) was the Blue River at Kansas City (station number 06893500; hereafter referred to as “Kansas City”). The simulated water-surface-elevation–streamflow rating at the streamgage location was compared to rating number 34.0 at the Kansas City streamgage from the NWS Action Stage of 28.0 ft through 42.0 ft (a stage exceeding the highest measured streamflow [about 41 ft]). The differences between the simulated values and the USGS rating at 1-ft stage increments ranged from −0.14 to 0.36 ft with a mean absolute difference of 0.18 ft (table 5).
Table 5.
Calibration of model to water-surface elevations for stage–streamflow rating number 34.0 at the U.S. Geological Survey streamgage Blue River at Kansas City, Missouri (station number 06893500).[Data from U.S. Geological Survey (2023d) and Kostynick and others (2026). The simulated water-surface elevation and mean absolute difference are rounded to two decimal places for consistency. ft, foot; USGS, U.S. Geological Survey; NAVD 88, North American Vertical Datum of 1988; ft3/s, cubic feet per second; NA, not applicable; Mo., Missouri]
Map Reach BR4—Blue River at Blue Ridge Boulevard Extension
The USGS reference streamgage for the Blue River map reach BR4 (fig. 1) was the Blue River at Blue Ridge Boulevard Extension (station number 06893150; hereafter referred to as “Blue Ridge”). The simulated water-surface-elevation–streamflow rating at the streamgage location was compared to rating number 7.0 at the Blue Ridge streamgage from the NWS Action Stage of 29.0 ft through 38.0 ft (a stage corresponding to the highest non-estimated direct streamflow measurement [about 38 ft]). The differences between the simulated values and the USGS rating at 1-ft stage increments ranged from −0.48 to 0.51 ft with a mean absolute difference of 0.28 ft (table 6).
Table 6.
Calibration of model to water-surface elevations for stage–streamflow rating number 7.0 at the U.S. Geological Survey streamgage Blue River at Blue Ridge Boulevard Extension, Kansas City, Missouri (station number 06893150).[Data from U.S. Geological Survey (2023d) and Kostynick and others (2026). The simulated water-surface elevation and mean absolute difference are rounded to two decimal places for consistency. ft, foot; USGS, U.S. Geological Survey; NAVD 88, North American Vertical Datum of 1988; ft3/s, cubic feet per second; NA, not applicable; Mo., Missouri]
Map Reach BR5—Blue River at Kenneth Road
The USGS reference streamgage for the Blue River map reach BR5 (fig. 1) was the Blue River at Kenneth Road (station number 06893100; hereafter referred to as “Kenneth Road”). The simulated water-surface-elevation–streamflow rating at the streamgage location was compared to rating number 10.0 at the Kenneth Road streamgage from an estimated bankfull stage of 10.0 ft through 20.0 ft (a stage corresponding to the highest measured streamflow [about 20 ft]). The differences between the simulated values and the USGS rating at 1-ft increments ranged from −0.43 to 0.41 ft with a mean absolute difference of 0.24 ft (table 7).
Table 7.
Calibration of model to water-surface elevations for stage–streamflow rating number 10.0 at the U.S. Geological Survey streamgage Blue River at Kenneth Road, Overland Park, Kansas (station number 06893100).[Data from U.S. Geological Survey (2023d) and Kostynick and others (2026). The simulated water-surface elevation and mean absolute difference are rounded to two decimal places for consistency. ft, foot; USGS, U.S. Geological Survey; NAVD 88, North American Vertical Datum of 1988; ft3/s, cubic feet per second; NA, not applicable; Kans., Kansas]
Map Reach BC1—Brush Creek at Rockhill Road
The USGS reference streamgage for the Brush Creek map reach BC1 (fig. 1) was Brush Creek at Rockhill Road (station number 06893562; hereafter referred to as “Rockhill Road”). The simulated water-surface-elevation–streamflow rating at the streamgage location was compared to rating number 6.0 at the Rockhill Road streamgage from a near bankfull stage of 7.0 ft through 18.0 ft (a stage exceeding the highest direct measured streamflow [about 9 ft]). The differences between the simulated values and the USGS rating at 1-ft stage increments ranged from –0.05 to 0.64 ft with a mean absolute difference of 0.26 ft (table 8).
Table 8.
Calibration of model to water-surface elevations for stage–streamflow rating number 6.0 at the U.S. Geological Survey streamgage Brush Creek at Rockhill Road, Kansas City, Missouri (station number 06893562).[Data from U.S. Geological Survey (2023d) and Kostynick and others (2026). The simulated water-surface elevation and mean absolute difference are rounded to two decimal places for consistency. ft, foot; USGS, U.S. Geological Survey; NAVD 88, North American Vertical Datum of 1988; ft3/s, cubic feet per second; NA, not applicable; Mo., Missouri]
Map Reach BC2—Brush Creek at Ward Parkway
The USGS streamgage for the Brush Creek map reach BC2 (fig. 1) was Brush Creek at Ward Parkway (station number 06893557; hereafter referred to as “Ward Parkway”). The simulated water-surface-elevation–streamflow rating at the streamgage location was compared to rating number 8.0 at the Ward Parkway streamgage from a near bankfull stage of 38.0 ft through 44.0 ft (a stage exceeding the highest measured streamflow [about 43 ft]). The differences between the simulated values and the USGS rating at 1-ft stage increments ranged from −0.77 to 0.53 ft with a mean absolute difference of 0.42 ft (table 9).
Table 9.
Calibration of model to water-surface elevations for stage–streamflow rating number 8.0 at the U.S. Geological Survey streamgage Brush Creek at Ward Parkway, Kansas City, Missouri (station number 06893557).[Data from U.S. Geological Survey (2023d) and Kostynick and others (2026). The simulated water-surface elevation and mean absolute difference are rounded to two decimal places for consistency. ft, foot; USGS, U.S. Geological Survey; NAVD 88, North American Vertical Datum of 1988; ft3/s, cubic feet per second; NA, not applicable; Mo., Missouri]
Map Reach IC1—Indian Creek at State Line Road
The USGS reference streamgage for the Indian Creek map reach IC1 (fig. 1) was Indian Creek at State Line Road (station number 06893390; hereafter referred to as “State Line”). The simulated water-surface-elevation–streamflow rating at the streamgage location was compared to rating number 7.0 at the State Line streamgage from the NWS Action Stage of 17.0 ft through 30.0 ft (a stage exceeding the highest measured streamflow [about 24 ft]). The differences between the simulated values and the USGS rating at 1-ft stage increments ranged from −0.40 to 0.36 ft with a mean absolute difference of 0.27 ft (table 10).
Table 10.
Calibration of model to water-surface elevations for stage–streamflow rating number 7.0 at the U.S. Geological Survey streamgage Indian Creek at State Line Road, Leawood, Kansas (station number 06893390).[Data from U.S. Geological Survey (2023d) and Kostynick and others (2026). The simulated water-surface elevation and mean absolute difference are rounded to two decimal places for consistency. ft, foot; USGS, U.S. Geological Survey; NAVD 88, North American Vertical Datum of 1988; ft3/s, cubic feet per second; NA, not applicable; Kans., Kansas]
Development of Water-Surface Profiles
The calibrated hydraulic models were used to generate from 15 to 169 water-surface profiles, depending on the map reach (table 2; refer to Kostynick and others (2026) for detailed information on model output for each map reach), for stages at 1-ft intervals that were referenced to a USGS streamgage within each reach. The water-surface profiles for two Blue River reaches BR1 and BR2 included the effects of backwater from the Missouri River (refer to “model_outputs” folder for the BR1_BR2 model in Kostynick and others [2026]). A total of 155 water-surface profiles were generated for map reach BR1; these included a series of 3 to 23 Blue River reach profiles under 10 backwater conditions from the Missouri River referenced to the Missouri River at Kansas City, Mo., streamgage. A total of 169 profiles, including 7 to 20 profiles under 10 backwater conditions from the Missouri River, were developed for Blue River reach BR2. Streamflows corresponding to the various target stages for each map reach were obtained from the stage–streamflow rating curve at the reference streamgage. Streamflows were then adjusted throughout the reaches to account for tributary inflows.
Flood Peak Time of Travel Analyses
The time of travel between upstream-downstream streamgage pairs were analyzed using the 2010 to 2025, 15-year period of observed stage record at the Blue River and tributary reference streamgages used in this study. Peaks in observed stage above the defined or estimated NWS Action Stage were synchronized, the values between the upstream-downstream pairs were compared, and the lag time was determined. The lag times were stratified into stage categories matching the defined or estimated NWS flood categories (Action Stage, Minor Flood Stage, Moderate Flood Stage, Major Flood Stage; National Weather Service, 2024) at the streamgage, and the median travel time and the range of observed travel times were tabulated (refer to “Travel_Time_Analysis” in Kostynick and others (2026). Sometimes, observed peaks during the analysis period within a specific flood category were not available; therefore, the time-of-travel estimate from the previous flood category was used.
Development of Flood-Inundation Map Products
Flood-inundation maps were created for eight flood-inundation map reaches and referenced to a USGS streamgage in each reach. The DEM data were derived from the same lidar data described in the “Topographic and Bathymetric Data” section and, therefore, have an estimated vertical accuracy of 2 ft (plus or minus 1 ft). Estimated flood-inundation boundaries for each simulated profile were then exported from HEC–RAS (U.S. Army Corps of Engineers, 2024). Shapefile polygons and depth grids of the inundated areas for each profile were modified, as needed, in the ArcPro version 3.3.2 application of ArcGIS (Esri, 2024) to ensure a hydraulically reasonable transition of the flood boundaries between modeled areas.
Any inundated areas that were detached from the main channel were examined to identify subsurface connections with the main river, such as through culverts under roadways. Where such connections existed, the mapped inundated areas were retained in their respective flood maps; otherwise, the incorrectly delineated parts of the flood extent were deleted. The flood-inundation areas were overlaid on high-resolution, georeferenced, aerial photographs of the study area. Bridge surfaces are shown as not inundated until the simulated water-surface elevation exceeds the bridge deck. Estimates of water depth, water velocity, and water-surface elevation can be obtained from the raster datasets (Kostynick and others, 2026) that are included with the presentation of the flood maps on an interactive USGS mapping application described in the “Flood-Inundation Map and Time-of-Travel Delivery” section. The flood maps corresponding to the highest simulated water-surface profile in each map reach are presented in figures 2–9. An example of an accompanying time-of-travel table for the Blue River at Kenneth Road reference streamgage is provided in table 11.
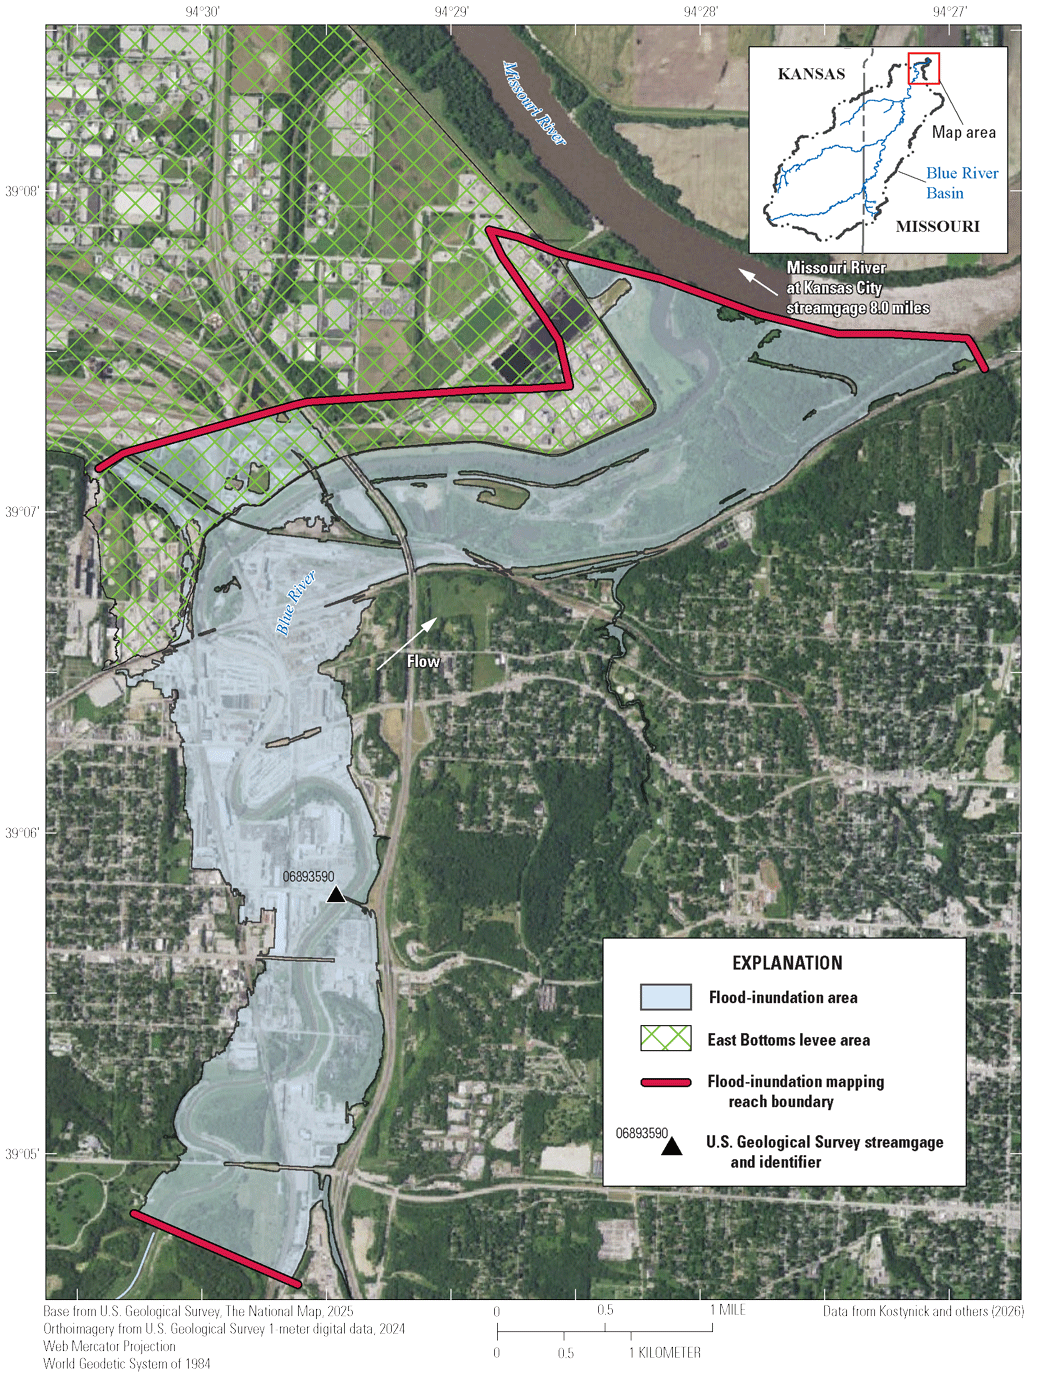
Flood-inundation extent within the Blue River map reach, BR1, corresponding to a stage of 44.0 feet at the U.S. Geological Survey streamgage Blue River at 12th Street, Kansas City, Missouri (station number 06893590) and a stage of 10.0 feet at the U.S. Geological Survey streamgage Missouri River at Kansas City, Missouri (station number 06893000, not shown).
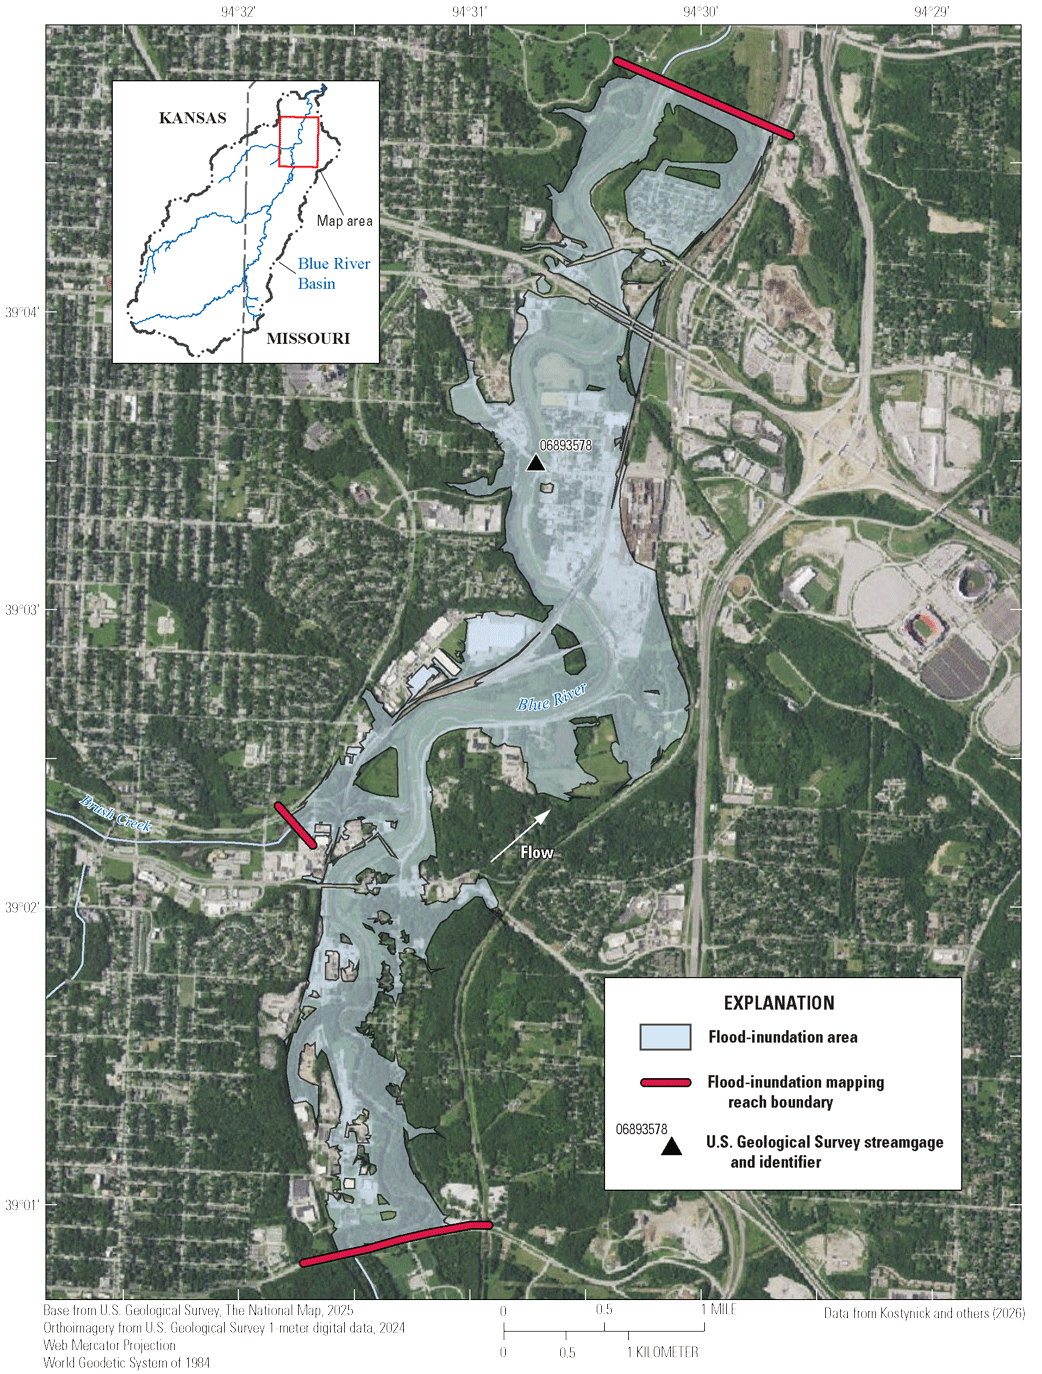
Flood-inundation extent within the Blue River map reach, BR2, corresponding to a stage of 45.0 feet at the U.S. Geological Survey streamgage Blue River at Stadium Drive, Kansas City, Missouri (station number 06893578) and a stage of 10.0 feet at the U.S. Geological Survey streamgage Missouri River at Kansas City, Missouri (station number 06893000, not shown).
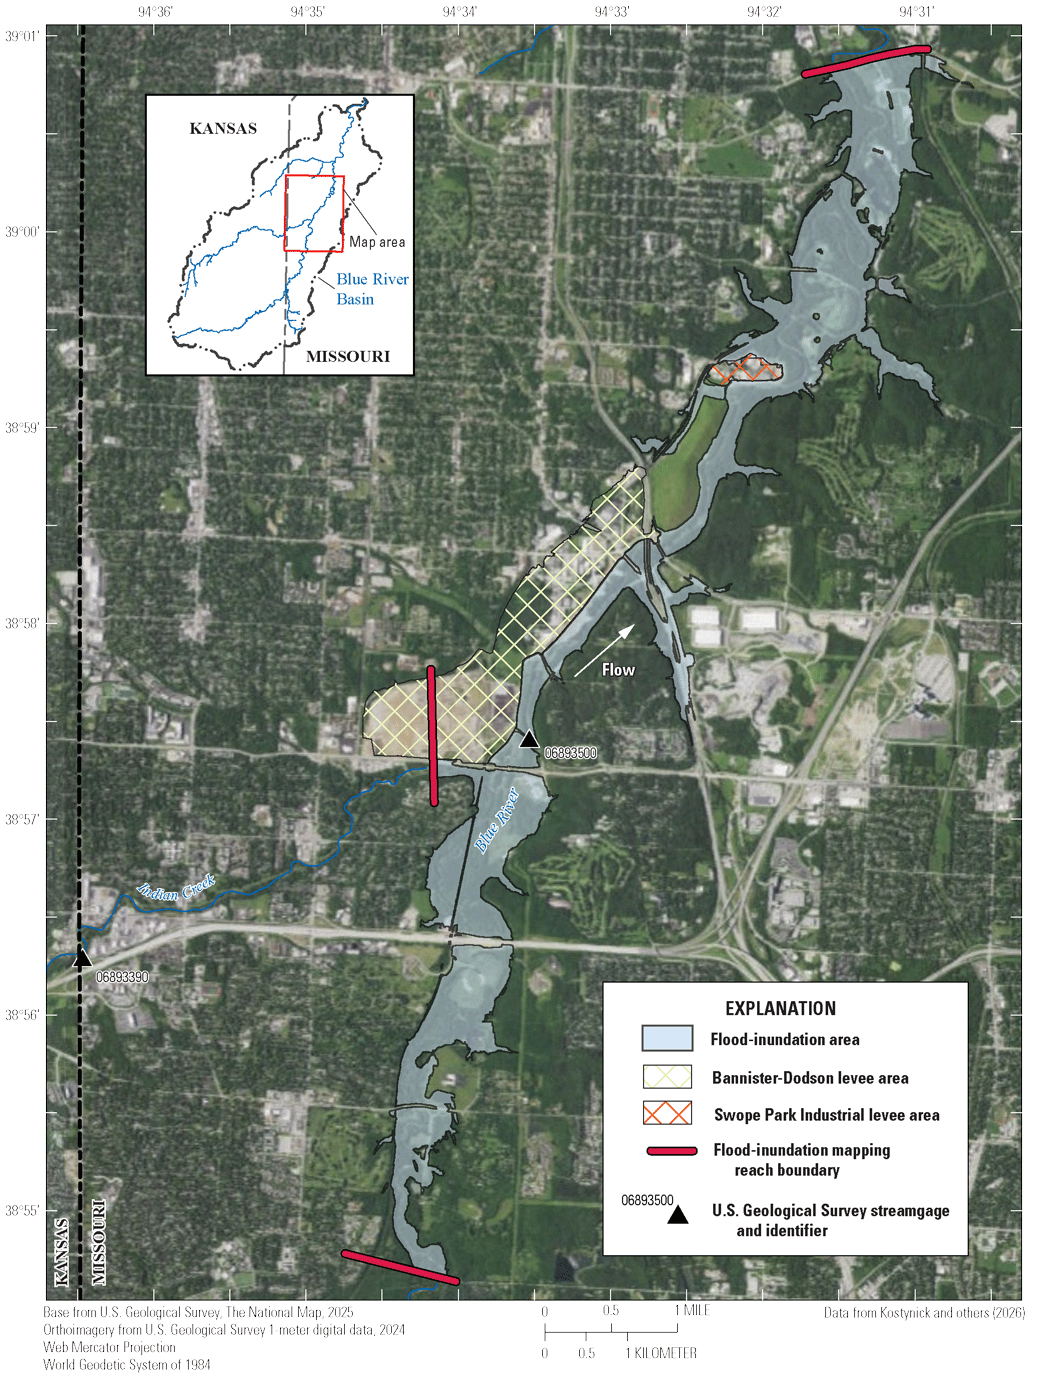
Flood-inundation extent within the Blue River map reach, BR3, corresponding to a stage of 48.0 feet at the U.S. Geological Survey streamgage Blue River at Kansas City, Missouri (station number 06893500).
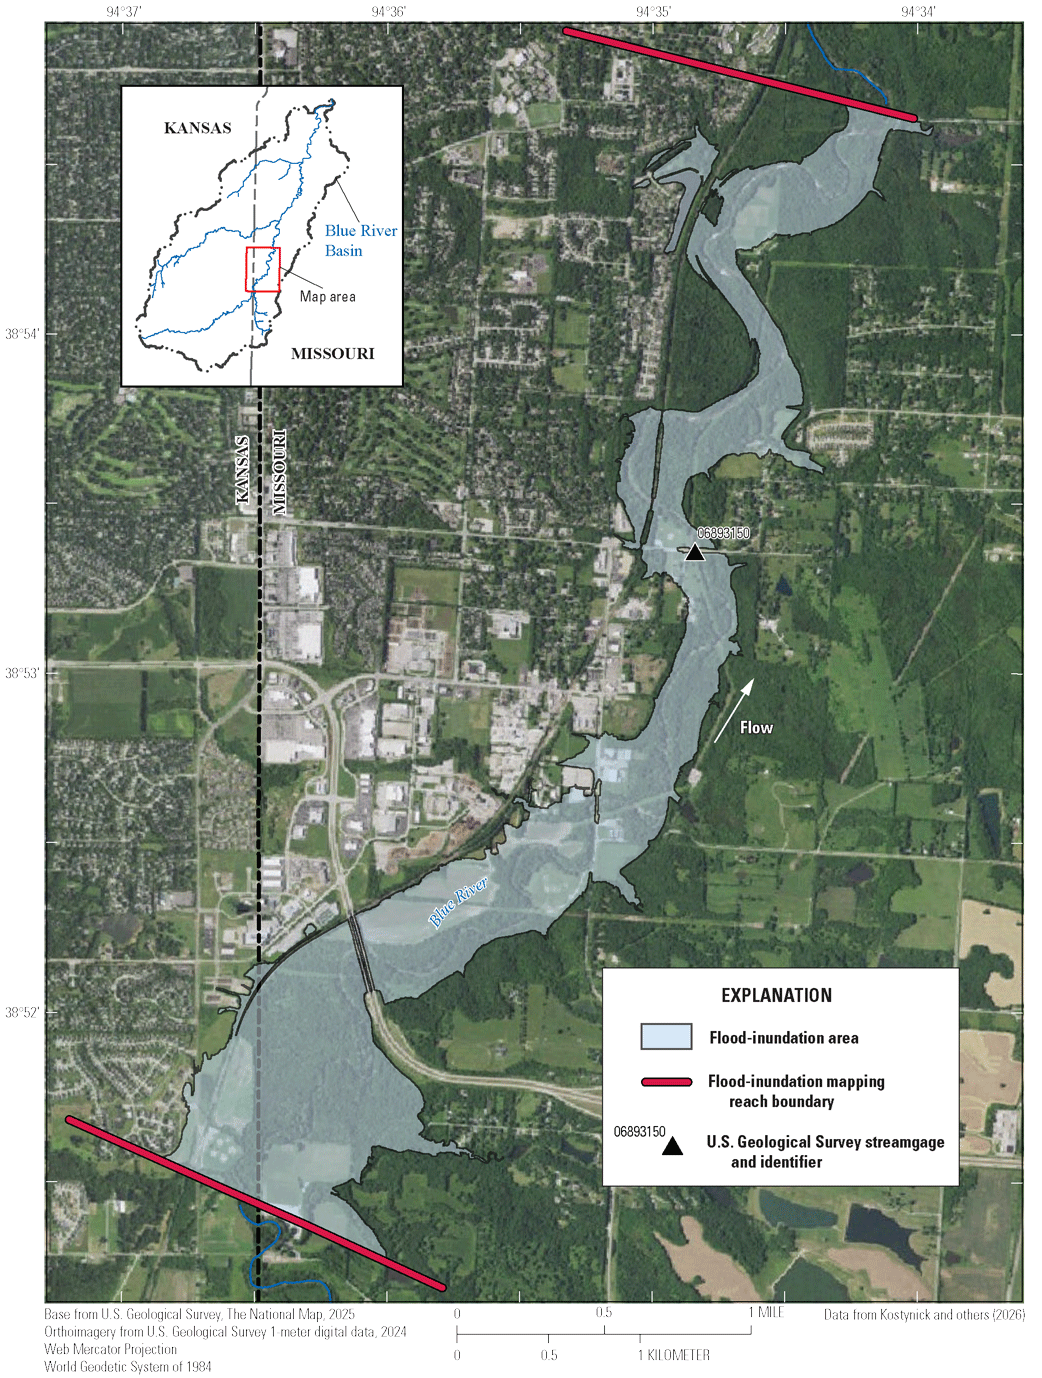
Flood-inundation extent within the Blue River map reach, BR4, corresponding to a stage of 48.0 feet at the U.S. Geological Survey streamgage Blue River at Blue Ridge Boulevard Extension, Kansas City, Missouri (station number 06893150).
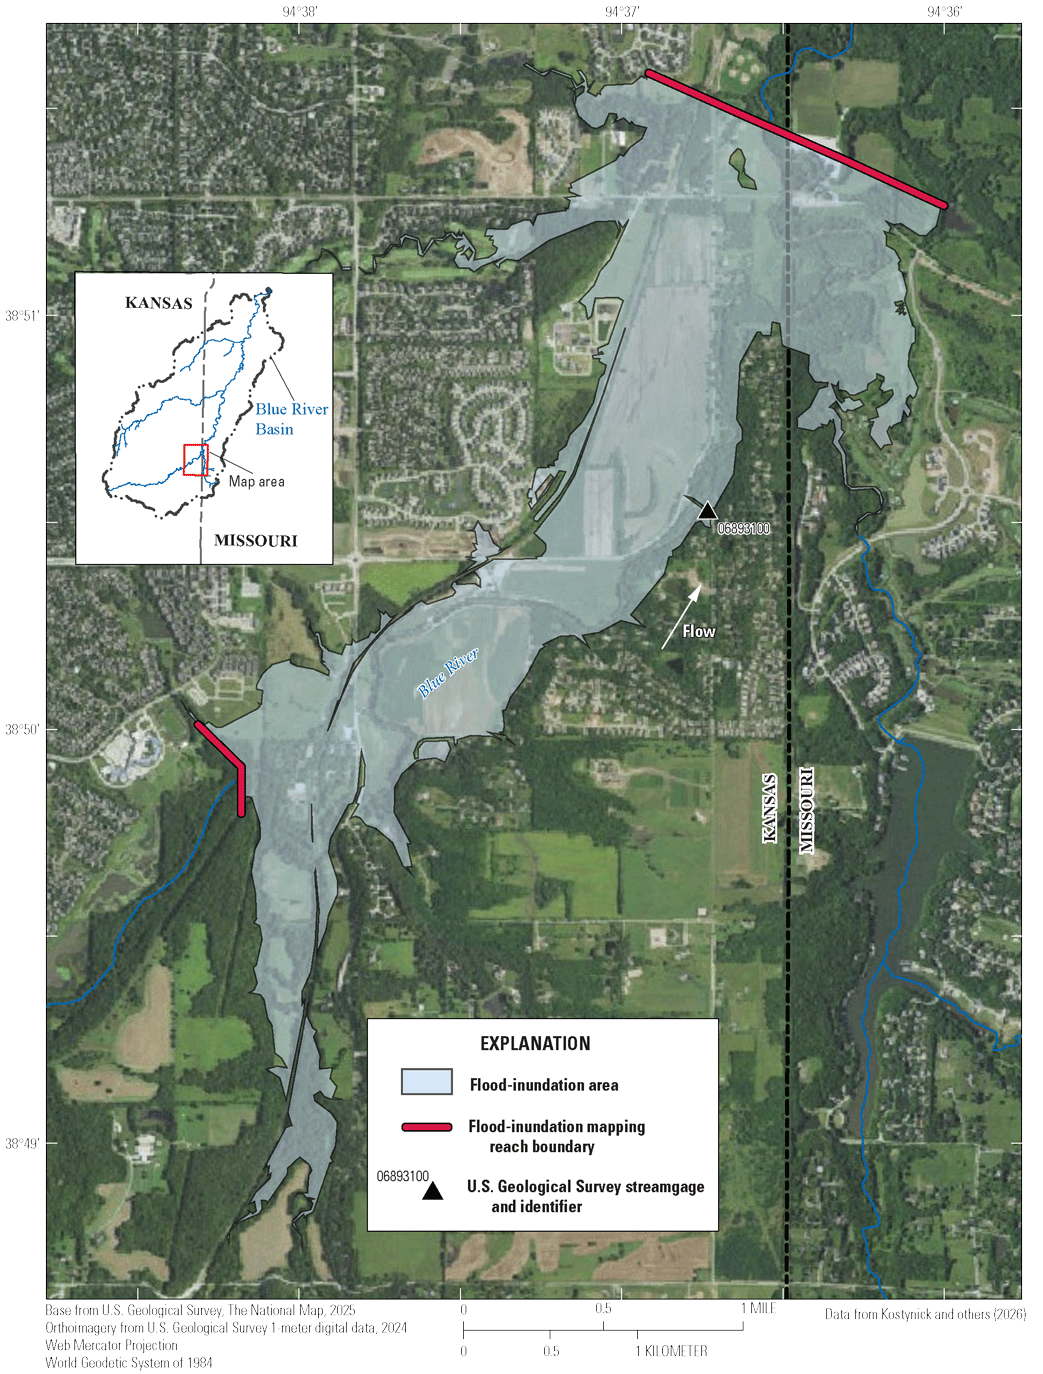
Flood-inundation extent within the Blue River map reach, BR5, corresponding to a stage of 24.0 feet at the U.S. Geological Survey streamgage Blue River at Kenneth Road, Overland Park, Kansas (station number 06893100).
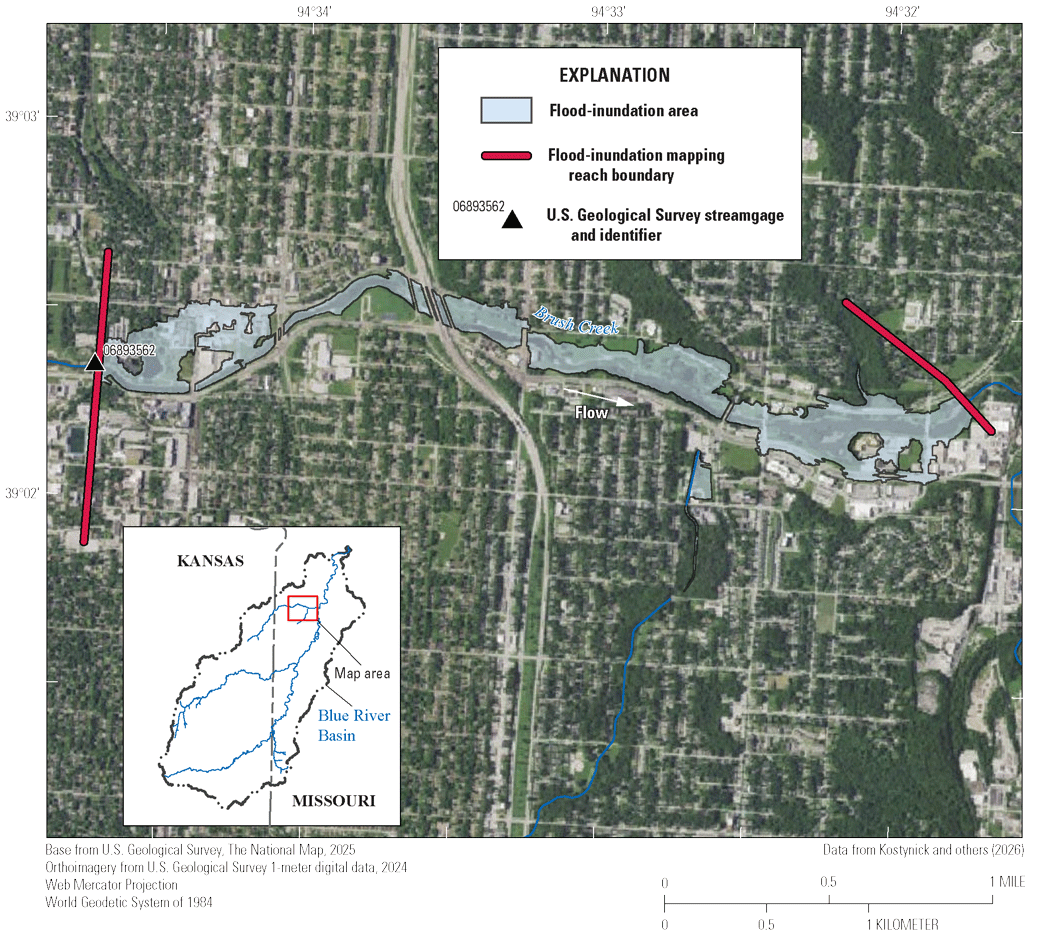
Flood-inundation extent within the Brush Creek map reach, BC1, corresponding to a stage of 24.0 feet at the U.S. Geological Survey streamgage Brush Creek at Rockhill Road, Kansas City, Missouri (station number 06893562).
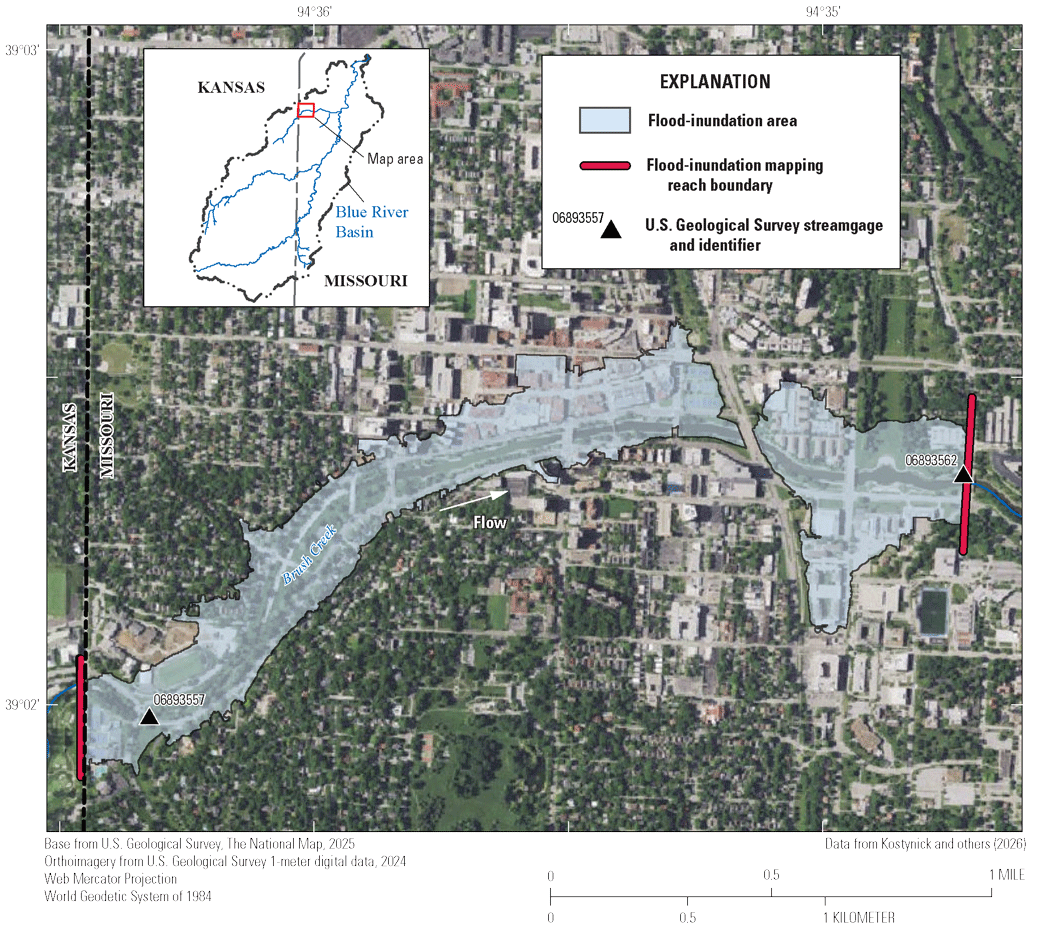
Flood-inundation extent within the Brush Creek map reach, BC2, corresponding to a stage of 54.0 feet at the U.S. Geological Survey streamgage Brush Creek at Ward Parkway, Kansas City, Missouri (station number 06893557).
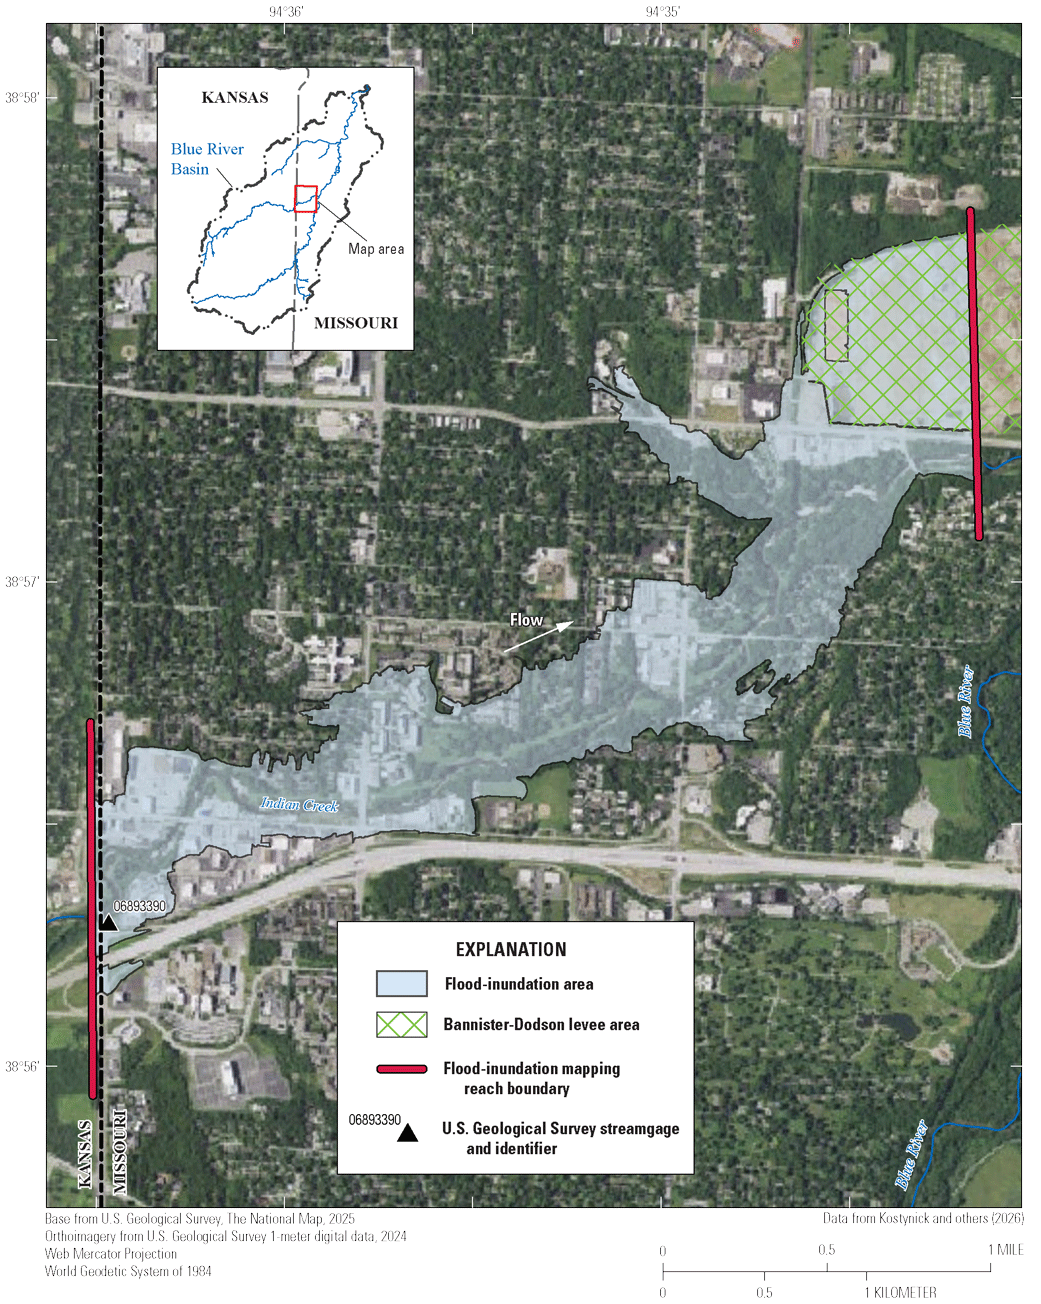
Flood-inundation extent within the Indian Creek map reach, IC1, corresponding to a stage of 33.0 feet at the U.S. Geological Survey streamgage Indian Creek at State Line Road, Leawood, Kansas (station number 06893390).
Table 11.
Estimated time of travel of peak flows between the Blue River at Kenneth Road, Overland Park, Kansas (station number 06893100), and the Blue River at Blue Ridge Boulevard Extension, Kansas City, Missouri, (station number 06893150) for selected stage categories.[Data from Kostynick and others (2026). Flood categories from National Weather Service (2024). ft, foot]
Flood-Inundation Map and Time-of-Travel Delivery
A Flood Inundation Mapping Program website (U.S. Geological Survey, 2023b) has been established to make USGS flood-inundation study information available to the public. The website links to a mapping application that presents map libraries and provides detailed information on flood extents, water depths, water velocities, water-surface elevations, and travel times for modeled sites. The mapping application enables the production of customized flood-inundation maps from the map libraries (Kostynick and others, 2026). A link on the mapping application website connects to USGS Water Data for the Nation (U.S. Geological Survey, 2023d), which presents the current stage at the USGS streamgages to which the inundation maps are referenced. Additionally, a link is provided on the mapping application to the USGS WaterAlert application (U.S. Geological Survey, 2024b), which notifies the user when a specified stage threshold at a streamgage is reached. The estimated flood-inundation maps are displayed in sufficient detail so that preparations for flooding and decisions for emergency response can be performed efficiently. Depending on the flood magnitude, roadways are shown as shaded (inundated and likely impassable) or not shaded (dry and passable) to facilitate emergency planning and use. Bridges are shaded—that is, shown as inundated—when the flood stage exceeds the elevation of the bridge deck or both approaches. A shaded building should not be interpreted to mean that the structure is completely submerged, but, rather, that bare-earth surfaces near the building are inundated. In this application, the water depth (displayed when the user hovers the cursor over an inundated area) at a building footprint would provide an estimate of the water level above the first floor of the structure, unless flood-proofing measures had been implemented.
Disclaimer for Flood-Inundation Maps
The flood-inundation maps should not be used for navigation, regulatory, permitting, or other legal purposes. The USGS provides these maps “as-is” for a quick reference, emergency planning tool, but assumes no legal liability or responsibility resulting from the use of this information.
Uncertainties and Limitations Regarding Use of Flood-Inundation Products
Although the flood-inundation, velocity, and water-surface-elevation maps represent the boundaries of inundated areas with a distinct line, some uncertainty is associated with these maps. The flood boundaries shown were estimated based on water stages and streamflows at selected USGS streamgages. Water-surface elevations and velocities along the stream reaches were estimated by quasi-unsteady-state hydraulic modeling, which assumed unobstructed flow, and used streamflows and hydrologic conditions anticipated at the USGS streamgage(s). The hydraulic model reflects the land-cover characteristics and any bridge, dam, levee, or other hydraulic structures existing as of July 2023. For the three leveed areas in the study area, the areas behind levees are shown in green on the USGS flood-inundation mapping application unless the lowest elevation of the levee was exceeded. Unique meteorological factors (timing and distribution of precipitation) may cause actual streamflows along the modeled reach to vary from those assumed during a flood, which may lead to deviations in the water-surface elevations, velocities, time of travel, and inundation boundaries shown. Additional areas may be flooded because of unanticipated conditions, such as changes in the streambed elevation or roughness, backwater into major tributaries along a main-stem river, or backwater from localized debris or ice jams. The accuracy of the floodwater extent portrayed on these maps will also vary with the accuracy of the DEM used to simulate the land surface. In developing the map libraries, the model scenarios exceed the highest streamflow measurement recorded at the streamgage location; therefore, flood-inundation maps at stages above that highest streamflow measurement reflect increased uncertainty.
If this series of flood-inundation maps will be used in conjunction with NWPS river forecasts, the user should be aware of additional uncertainties that may be inherent in, or factored into, NWPS forecast procedures. The NWPS uses forecast models to estimate the quantity and timing of water flowing through selected stream reaches in the United States. These forecast models (1) estimate the amount of runoff generated by precipitation and snowmelt, (2) simulate the movement of floodwater as it moves downstream, and (3) predict the flow and stage (and water-surface elevation) for the stream at a given location (NWPS forecast point) throughout the forecast period (every 6 hours for a forecast window of 3 to 5 days in many locations). For more information on NWPS forecasts and products, please refer to https://water.noaa.gov.
The water depth above the first floor of a structure was estimated from the DEM elevation adjacent to the building or from the DEM estimate plus an offset if the first floor was above the adjacent grade. Any structure with a first floor above the adjacent grade will, therefore, have additional uncertainty in water depths compared to structures at ground level with first-floor elevations derived from the DEM alone.
Conclusion
A series of digital flood-inundation maps and associated products were developed for the Blue River and primary tributaries in Kansas City, Missouri, in cooperation with the City of Kansas City. The maps cover about 35.5 miles (mi) of the Blue River, 4.4 mi of tributary Brush Creek, and 2.9 mi of tributary Indian Creek. Water-surface profiles were simulated using the U.S. Army Corps of Engineers’ Hydrologic Engineering Center’s River Analysis System (HEC–RAS) program version 6.6. Estimates of flood-inundation extents, depths of flooding, water velocities, and water-surface elevations were generated for a range of stages referenced to streamgages in each map reach. The time of travel between U.S. Geological Survey (USGS) reference gages for varying stage conditions also was determined. The HEC–RAS hydraulic models were calibrated to stage–streamflow ratings at the USGS reference streamgages. The models were used to compute water-surface profiles for flood stages at 1-foot (ft) intervals referenced to the local streamgage datum and ranging from near bankfull to a stage exceeding the highest recorded water level at each streamgage.
The simulated water-surface profiles were then combined with a geographic information system digital elevation model derived from light detection and ranging data to delineate estimated flood-inundation areas as shapefile polygons and depth, velocity, and water-surface elevation grids for each profile. These flood-inundation polygons were overlaid on high-resolution, georeferenced, aerial photographs of the study area.
The flood-inundation map products, available through the USGS Flood Inundation Mapping Program website at https://fim.wim.usgs.gov/fim/, depict estimated areal extents of inundation, water depth, water velocity, and water-surface elevation of flooding corresponding to selected water levels at nine reference USGS streamgages—five gages on the Blue River (06893100, 06893150, 06893500, 06893578, 06893590), two gages on Brush Creek (06893557, 06893562), one gage on Indian Creek (06893390), and one gage on the Missouri River (06893000). Near-real-time stage information for these streamgages is available from USGS Water Data for the Nation at https://doi.org/10.5066/F7P55KJN or from the National Weather Service National Water Prediction Service at http://water.noaa.gov/. The National Weather Service also provides flood-hydrograph forecasts for seven of these sites (USGS station numbers 06893590, 06893578, 06893500, 06893150, 06893557, 06893390, and 06893000).
Interactive use of the maps on the mapping application provides users a general indication of inundation extent and water depth, velocity, and water-surface elevation at any point. These maps are used in conjunction with real-time stage data from the USGS reference streamgages. The joint products can help guide the public in taking individual safety precautions and can provide emergency-management personnel with a tool to mitigate and prepare for flood-related emergencies, manage emergency flood operations, and complete postflood recovery efforts.
References Cited
Automated Information Mapping System [AIMS], 2012, DTM_2012 (ImageServer): ArcGIS REST Services Directory, Automated Information Mapping System, accessed January 5, 2024, at https://maps.jocogov.org/ArcGIS/rest/services/DTM_2012/ImageServer.
Esri, 2024, ArcGIS Pro (ver. 3.3.2): Esri software, accessed October 12, 2024, at https://www.esri.com/en-us/arcgis/products/arcgis-pro/overview.
Federal Emergency Management Agency [FEMA], 2009, Flood insurance study—Johnson County, Kansas and incorporated areas: Federal Emergency Management Agency Flood Map Service Center database, vol. 1–7, accessed August 15, 2025, at https://msc.fema.gov/portal/advanceSearch#searchresultsanchor.
Federal Emergency Management Agency [FEMA], 2023, Flood insurance study—Jackson County, Missouri and incorporated areas and Kansas City: Federal Emergency Management Agency Flood Map Service Center database, vol. 1–8, accessed August 15, 2025, at https://msc.fema.gov/portal/availabilitySearch?addcommunity=290173&communityName=KANSAS%20CITY,%20CITY%20OF#searchresultsanchor.
Google, 2024, Google Earth Pro (ver. 7.3): Google software, accessed January 4, 2024, at https://www.google.com/earth/about/versions/.
Hauth, L.D., Carswell, W.J., Jr., and Chin, E.H., 1981, Floods in Kansas City, Missouri and Kansas, September 12–13, 1977: U.S. Geological Survey Professional Paper 1169, 47 p., accessed February 4, 2020, at https://doi.org/10.3133/pp1169.
Heidemann, H.K., 2012, Lidar base specification (ver. 1.3, February 2018): U.S. Geological Survey Techniques and Methods, book 11, chap. B4, 101 p., accessed February 7, 2020, at https://doi.org/10.3133/tm11B4.
Heimann, D.C., Kelly, B.P., and Studley, S.E., 2015, Flood-inundation maps and Wetland Restoration Suitability Index for the Blue River and selected tributaries, Kansas City, Missouri, and vicinity, 2012: U.S. Geological Survey Scientific Investigations Report 2014–5180, 23 p., accessed January 3, 2020, at https://doi.org/10.3133/sir20145180.
Heimann, D.C., Voss, J.D., and Rydlund, P.H., Jr., 2020, Geospatial datasets for the flood-inundation study of Blue River near Red Bridge Road, Kansas City, Missouri, 2019: U.S. Geological Survey data release, accessed December 18, 2024, at https://doi.org/10.5066/P90MH291.
Heimann, D.C., Voss, J.D., and Rydlund, P.H., Jr., 2021, Flood-inundation maps for the Blue River near Red Bridge Road, Kansas City, Missouri, 2019: U.S. Geological Survey Scientific Investigations Report 2020–5057, 14 p., accessed December 18, 2024, at https://doi.org/10.3133/sir20205057.
Kelly, B.P., and Rydlund, P.H., Jr., 2006, Estimated flood-inundation mapping for the Lower Blue River in Kansas City, Missouri, 2003–05: U.S. Geological Survey Scientific Investigations Report 2006–5089, 27 p., accessed January 3, 2020, at https://doi.org/10.3133/sir20065089.
Kelly, B.P., and Huizinga, R.J., 2008, Estimated flood-inundation mapping for the Upper Blue River, Indian Creek, and Dyke Branch in Kansas City, Missouri, 2006–08: U.S. Geological Survey Scientific Investigations Report 2008–5068, 34 p., accessed January 3, 2020, at https://doi.org/10.3133/sir20085068.
Kostynick, R.P., Heimann, D.C., High, J.L., Cigrand, C.V., and Atkinson, A.A., 2026, Model archives and geospatial files used in the development of flood-inundation products for the Blue River and selected tributaries, Kansas City, Missouri, 2023–25: U.S. Geological Survey data release, https://doi.org/10.5066/P1NSJHXH.
National Water Prediction Service, 2025a, Blue River at Bannister Road—Historic crests: National Oceanic and Atmospheric Administration, accessed December 8, 2025, at https://water.noaa.gov/gauges/KCCM7.
National Water Prediction Service, 2025b, Blue River at Blue Ridge Boulevard Extension—Historic crests: National Oceanic and Atmospheric Administration, accessed December 8, 2025, at https://water.noaa.gov/gauges/KBRM7.
National Water Prediction Service, 2025c, Brush Creek at Ward Parkway-Kansas City—Historic crests: National Oceanic and Atmospheric Administration, accessed December 8, 2025, at https://water.noaa.gov/gauges/06893557.
National Water Prediction Service, 2025d, Missouri River at Kansas City—Historic crests: National Oceanic and Atmospheric Administration, accessed December 8, 2025, at https://water.noaa.gov/gauges/KCDM7.
National Water Prediction Service, 2025e, National Water Prediction Service river forecasts: National Oceanic and Atmospheric Administration, accessed October 26, 2025, at https://water.noaa.gov.
National Weather Service, 2024, Hydrology terms and definitions: National Weather Service web page, accessed November 17, 2024, at https://www.weather.gov/lot/hydrology_definitions.
National Weather Service, 2025, Kansas City Flash Flood of October 4, 1998: National Weather Service web page, accessed October 19, 2025, at https://www.weather.gov/eax/event-oct041998.
Omernik, J.M., 1987, Ecoregions of the conterminous United States: Annals of the Association of American Geographers, v. 77, no. 1, p. 118–125. [Also available at https://doi.org/10.1111/j.1467-8306.1987.tb00149.x.]
Rydlund, P.H., Jr., and Densmore, B.K., 2012, Methods of practice and guidelines for using survey-grade global navigation satellite systems (GNSS) to establish vertical datum in the United States Geological Survey: U.S. Geological Survey Techniques and Methods, book 11, chap. D1, 102 p. [Also available at https://doi.org/10.3133/tm11D1.]
U.S. Army, 2016, After three-decades [sic], Blue River Corridor flood risk management project complete: U.S. Army web page, September 14, 2016, accessed July 27, 2025, at https://www.army.mil/article/175129/after_three_decades_blue_river_corridor_flood_risk_management_project_complete.
U.S. Army Corps of Engineers, 2023, Missouri River flow frequency study—Yankton, South Dakota to Hermann, Missouri: U.S. Army Corps of Engineers, [variously paged], accessed April 14, 2025, at https://usace.contentdm.oclc.org/utils/getfile/collection/p16021coll7/id/24866.
U.S. Army Corps of Engineers, 2024, HEC–RAS—River analysis system (ver. 6.6): U.S. Army Corps of Engineers, accessed October 15, 2024, at https://www.hec.usace.army.mil/software/hec-ras/download.aspx.
U.S. Army Corps of Engineers, 2025, Welcome to the National Levee Database [Kansas City, Missouri]: U.S. Army Corps of Engineers National Levee Database digital data, accessed July 2, 2025, at https://levees.sec.usace.army.mil/.
U.S. Census Bureau, 2025, QuickFacts—Kansas City city, Missouri; United States—Population, census, April 1, 2020: U.S. Census Bureau, accessed December 8, 2025, at https://www.census.gov/quickfacts/fact/table/kansascitycitymissouri,US.
U.S. Environmental Protection Agency, 2020, Ecoregion download files by State—Region 7—Level IV Ecoregions of Iowa and Missouri: U.S. Environmental Protection Agency digital data, accessed January 14, 2020, at https://www.epa.gov/eco-research/ecoregion-download-files-state-region-7.
U.S. Geological Survey, 2023a, 3DEP LidarExplorer: U.S. Geological Survey database, accessed October 13, 2023, at https://apps.nationalmap.gov/lidar-explorer/#/.
U.S. Geological Survey, 2023b, Flood inundation mapping (FIM) program: U.S. Geological Survey web page, accessed January 7, 2023, at https://water.usgs.gov/osw/flood_inundation.
U.S. Geological Survey, 2023c, StreamStats: U.S. Geological Survey web application, accessed January 8, 2023, at https://streamstats.usgs.gov/ss/.
U.S. Geological Survey, 2023d, USGS water data for the Nation: U.S. Geological Survey National Water Information System database, accessed January 3, 2023, at https://doi.org/10.5066/F7P55KJN.
U.S. Geological Survey, 2024a, Annual NLCD collection 1 science products (ver. 1.1, June 2025): U.S. Geological Survey data release, accessed July 23, 2025, at https://doi.org/10.5066/P94UXNTS.
U.S. Geological Survey, 2024b, WaterAlert: U.S. Geological Survey web application, accessed March 20, 2024, at https://accounts.waterdata.usgs.gov/wateralert/.
U.S. Geological Survey, 2026, Flood Inundation Mapper: U.S. Geological Survey web application accessed April 1, 2026, at https://fim.wim.usgs.gov/fim/.
Ward, E., 2017, Nature’s Fury—Floods [digital exhibition]: Kansas City, Mo., Linda Hall Library, accessed December 8, 2025, at https://www.lindahall.org/experience/digital-exhibitions/natures-fury/06-floods/#main-content.
Wilkison, D.H., Armstrong, D.J., Norman, R.D., Poulton, B.C., Furlong, E.T., and Zaugg, S.D., 2006, Water quality in the Blue River Basin, Kansas City Metropolitan Area, Missouri and Kansas, July 1998 to October 2004: U.S. Geological Survey Scientific Investigations Report 2006–5147, 170 p. [Also available at https://doi.org/10.3133/sir20065147.]
Conversion Factors
U.S. customary units to International System of Units
Datums
Vertical coordinate information is referenced to the North American Vertical Datum of 1988 (NAVD 88).
Horizontal coordinate information is referenced to the North American Datum of 1983 (NAD 83).
Supplemental Information
A water year is the 12-month period from October 1 through September 30 of the following year and is designated by the calendar year in which it ends.
Abbreviations
AEP
annual exceedance probability
ALERT
Automated Local Elevation in Real Time
DEM
digital elevation model
GIS
geographic information system
GPS
global positioning system
HEC–RAS
U.S. Army Corps of Engineers Hydrologic Engineering Center's River Analysis System
lidar
light detection and ranging
n
Manning's roughness coefficient
NWPS
National Water Prediction Service
NWS
National Weather Service
RMSE
root-mean-square error
USGS
U.S. Geological Survey
For more information about this publication, contact:
Director, USGS Central Midwest Water Science Center
405 North Goodwin
Urbana, IL 61801
217–328–8747
For additional information, visit: https://www.usgs.gov/centers/cm-water
Publishing support provided by the
USGS Science Publishing Network,
Rolla and Baltimore Publishing Service Centers
Disclaimers
Any use of trade, firm, or product names is for descriptive purposes only and does not imply endorsement by the U.S. Government.
Although this information product, for the most part, is in the public domain, it also may contain copyrighted materials as noted in the text. Permission to reproduce copyrighted items must be secured from the copyright owner.
Suggested Citation
Heimann, D.C., Cigrand, C.V., High, J.L., Kostynick, R.P., Atkinson, A.A., and Rydlund, P.H., Jr., 2026, Flood-inundation maps of the Blue River and major tributaries in and near Kansas City, Missouri, 2023–25: U.S. Geological Survey Scientific Investigations Report 2026–5033, 26 p., https://doi.org/10.3133/sir20265033.
ISSN: 2328-0328 (online)
Study Area
| Publication type | Report |
|---|---|
| Publication Subtype | USGS Numbered Series |
| Title | Flood-inundation maps of the Blue River and major tributaries in and near Kansas City, Missouri, 2023–25 |
| Series title | Scientific Investigations Report |
| Series number | 2026-5033 |
| DOI | 10.3133/sir20265033 |
| Publication Date | June 23, 2026 |
| Year Published | 2026 |
| Language | English |
| Publisher | U.S. Geological Survey |
| Publisher location | Reston, VA |
| Contributing office(s) | Central Midwest Water Science Center |
| Description | Report: viii, 26 p.; Data Release |
| Country | United States |
| State | Kansas, Missouri |
| City | Kansas City |
| Other Geospatial | Blue River |
| Online Only (Y/N) | Y |
| Additional Online Files (Y/N) | N |