

Groundwater-Level Elevations in the Bedrock Aquifers of the Denver Basin Aquifer System, Elbert County, Colorado, 2015–23
Links
- Document: Report (13.5 MB pdf) , HTML , XML
- Database: Database USGS Water Data for the Nation: U.S. Geological Survey National Water Information System database
- NGMDB Index Page: National Geologic Map Database Index Page (html)
- Download citation as: RIS | Dublin Core
Acknowledgments
The authors would like to thank the residents of Elbert County, especially the well owners who allowed access to their property. The authors also acknowledge the participation of the Elbert County Board of County Commissioners. The authors also acknowledge U.S. Geological Survey colleagues Zach Kisfalusi for providing guidance in data analysis and Manya Ruckhaus, Lauren Eng, and Nick Hall for their assistance with analyzing data related to this study. Thank you to Suzanne Paschke and Rhett Everett for their help in establishing this network in 2015. Thank you to Peter Wright and Jackson Sharp for their thorough reviews.
Abstract
Water users in Elbert County, Colorado, rely on groundwater from bedrock aquifers in the Denver Basin aquifer system (upper Dawson, lower Dawson, Denver, Arapahoe, and Laramie-Fox Hills aquifers) for approximately half of their water uses. Withdrawals from the bedrocks aquifers have increased to meet the water use needs of expanding regional population growth and development. The U.S. Geological Survey, in cooperation with the Elbert County Board of County Commissioners, began a study in 2015 to monitor groundwater levels within Elbert County. The primary purpose of this report is to present a summary of groundwater levels measured during the study period (2015–23) and present results from statistical analyses of changes in groundwater-level elevations through time.
Discrete groundwater levels were measured at 36 wells within Elbert County. Seven of those wells contained equipment to make and record continuous groundwater-level measurements at hourly intervals. All aquifers, except the lower Dawson aquifer, had only declining groundwater-level elevations in discrete measurements for wells with statistically significant trends. Of the eight statistically significant trends in the lower Dawson aquifer, two wells indicated increasing groundwater-level elevation from discrete measurements. The groundwater-level elevation trend medians in the upper Dawson, lower Dawson, Denver, Arapahoe, and Laramie-Fox Hills aquifers were −0.23, −0.66, −0.64, −0.39, and −0.63 feet per year, respectively, for discrete groundwater-level elevation measurements. Trends in continuous groundwater-level elevations were in agreement with statistically significant trends in discrete groundwater-level elevations for all wells. The groundwater-level elevation trend medians in this study, compared to the overall trends in a 2015−2018 study, both indicated declining groundwater-level elevations except in the upper Dawson aquifer, where the trend direction was opposite, a positive trend from 2015 to 2018 and a negative trend (declining groundwater elevations) from 2015 to 2023. The change in trends within the upper Dawson aquifer may be affected by differences in the study period and the trend analysis applied. Trends during the 2015–23 study period were compared to departures from the median 2015 groundwater-level elevation for each site in each aquifer. In general, the departures from the 2015 median supported trends observed at each site and correlated spatially with greater departures near the western border of Elbert County. Additionally, 30-year precipitation data showing wet and dry periods were overlaid with the departure from the 2015 median to assess groundwater-level patterns in wells in the five aquifers. Departures from the 2015 median groundwater-level elevations appeared greatest during the dry period between 2020 and 2023. Potentiometric-surface maps of the upper and lower Dawson aquifers created from static April 2023 groundwater elevations indicated groundwater-flow direction is generally from the south to the north. Results of this study could be used to guide additional groundwater monitoring in Elbert County and could aid in long-term planning of water resources.
Introduction
Elbert County, located in eastern Colorado, is a rural county with agricultural land and is surrounded on three sides by counties (Arapahoe, Douglas, and El Paso Counties) with rapidly growing populations and water uses. Elbert, Arapahoe, Douglas, and El Paso Counties rely heavily on groundwater withdrawals from the Denver Basin aquifer system (upper Dawson, lower Dawson, Denver, Arapahoe, and Laramie-Fox Hills aquifers; fig. 1) to support water-supply uses (Forsgren Associates Inc., 2018; Maupin and others, 2014).
Location of the aquifer extents for the upper Dawson, lower Dawson, Denver, Arapahoe, and Laramie-Fox Hills aquifers in the Denver Basin aquifer system and geologic lines of section A, A–A' and B, B–B' near Elbert County, Colorado. Modified from Paschke (2011) and Malenda and Penn (2020).
The Elbert County population has increased approximately 45 percent between 2000 and 2023 with a 25 percent increase between 2010 and 2023 (Penn and Everett, 2019; U.S. Census Bureau, 2023). Douglas County, which borders Elbert County to the west, has had more than a 100 percent increase in population between 2000 and 2019 (Malenda and Penn, 2020). El Paso County, which borders Elbert County to the south, has nearly doubled in population from 1990 to 2020 (Kisfalusi and others, 2025). Arapahoe County increased in population approximately 15 percent between 2010 and 2023 (U.S. Census Bureau, 2023). The 2020 Elbert County population is estimated at 26,062 (U.S. Census Bureau 2023) with predicted growth to 53,654 in 2035 and 68,375 in 2050 (Forsgren Associates Inc., 2018). As of 2017, half of Elbert County’s total water use was supplied by the Denver Basin aquifer system. Continued population growth is expected to result in increased water use from the Denver Basin aquifer system with an estimated 80 percent increase from the 2017 to the 2050 usage to meet needs (Forsgren Associates Inc., 2018). The U.S. Geological Survey (USGS), in cooperation with the Elbert County Board of County Commissioners, began a study in 2015 to assess the groundwater resources of the Denver Basin aquifer system within Elbert County by establishing and maintaining a groundwater-level monitoring network (fig. 2) and by analyzing the groundwater levels in the bedrock aquifers in Elbert County (Penn and Everett, 2019). The well network was determined by selecting wells in areas where drawdown from pumping may affect groundwater levels (drawdown of 100 feet [ft] or more) based on predictions from the USGS MODFLOW-2000 groundwater model of the Denver Basin aquifer system from Paschke (2011). The primary focus was aimed at selecting wells in the upper Dawson, lower Dawson, and Denver aquifers, based on discussions with the Elbert County Board of County Commissioners; however, wells in the other bedrock aquifers were included to assess countywide groundwater levels (Penn and Everett, 2019). Continued monitoring could improve the ability to assess short- and long-term changes in the groundwater-level elevations and could potentially aid communities in water-resource management. Understanding how increased water uses are potentially affecting the groundwater levels in the Denver Basin aquifer system through recurring monitoring could be beneficial for guiding groundwater management in Elbert County.
Location of groundwater-level monitoring network wells with aquifer of completion and aquifer extents for the upper Dawson, lower Dawson, Denver, Arapahoe, and Laramie-Fox Hills aquifers, in the Denver Basin aquifer system, Elbert County, Colorado. Well common name abbreviations are as follows: UDAW, upper Dawson aquifer well; LDAW, lower Dawson aquifer well; DAWMAS, upper or lower Dawson aquifer well; DENV and DENMAS, Denver aquifer well; ARAP and ARAPMAS, Arapahoe aquifer well; LARA, Laramie-Fox Hills aquifer well.
Well common names are a combination of aquifer of completion abbreviation and an assigned number (table 1) for this study, except for wells with common names ending in ”MAS.“ Well common names ending with the ”MAS” nomenclature are historical wells that were part of the USGS National Water-Quality Assessment study (Rosen and Lapham, 2008). Well common names include the following aquifer abbreviations and a number assigned to complete each well name: upper Dawson aquifer well, UDAW; lower Dawson aquifer well, LDAW; upper or lower Dawson aquifer well, DAWMAS; Denver aquifer well, DENV and DENMAS; Arapahoe aquifer well, ARAP and ARAPMAS; and Laramie-Fox Hills aquifer well, LARA.
Table 1.
Well identification and location information and a summary of discrete groundwater-level measurements, April 2015 through November 2023, Elbert County, Colorado.[Well data can be downloaded using the site identification numbers in the U.S. Geological Survey National Water Information System (NWIS) database (USGS, 2023). Refer to figure 2 for well locations. ft, foot; NAD 83, North American Datum of 1983; LSD, land-surface datum; NAVD 88, North American Vertical Datum of 1988; °, degree; ', minute; ", second; bls, below land surface; “P”, pumping affected; UDAW, upper Dawson aquifer well; LDAW, lower Dawson aquifer well; DAWMAS, upper or lower Dawson aquifer well; DENV and DENMAS, Denver aquifer well; ARAP and ARAPMAS, Arapahoe aquifer well; LARA, Laramie-Fox Hills aquifer well]
Purpose and Scope
This report builds on initial observations made by Penn and Everett (2019), who examined groundwater-level elevations measured in Elbert County from 2015 through 2018. Some wells analyzed by Penn and Everett (2019) were not evaluated in this report because they were discontinued. This report uses data collected from a network of 36 groundwater wells where discrete measurements of groundwater levels were measured bimonthly from 2015 through 2023. There are at least two wells in each of the bedrock aquifers. In 7 of the 36 wells, a vented pressure transducer with an internal data logger records hourly groundwater-level measurements (also referred to as continuous groundwater levels). The purpose of this report is to summarize groundwater levels measured during the study period and present results from statistical analyses of changes in groundwater-level elevations through time (trends) in the Denver Basin aquifer system in Elbert County, from April 2015 through November 2023.
Previous Studies
One of the first published studies of the Denver Basin aquifer system described the artesian groundwater conditions (Cross and others, 1884). Since then, numerous studies have documented the geology, physiography, climate, stratigraphy, and hydrologic conditions of the Denver Basin aquifer system. By 1989, a bibliography of geology and groundwater geology for the Denver Basin (Wireman and Romero, 1989) contained more than 160 references (Everett, 2014). Paschke (2011) cited more than 190 references in a detailed description of previous work. Throughout the 1970s and 1980s, the USGS and the Colorado Division of Water Resources (CDWR) mapped and characterized the Denver Basin aquifer system (Romero and Hampton, 1972; Romero, 1976; Robson and Romero, 1981a, 1981b; Robson, Romero, and Zawistowski, 1981; Robson, Wacinski, and others, 1981; and Robson, 1983), which helped lead to the development of a groundwater-flow model (Robson, 1987) and a three-dimensional MODFLOW-2000 groundwater-flow model (Paschke, 2011) of the Denver Basin aquifer system.
Groundwater-level measurements in the Denver Basin aquifer system began in the 1890s (Emmons and others, 1896). From 1956 to 1963, the USGS conducted the first basinwide assessment of groundwater levels (McConaghy and others, 1964), followed by a comprehensive set of groundwater-level data for the bedrock and alluvial aquifers measured from 1956 to 1981 (Major and others, 1983). During the 1980s, the CDWR established a groundwater-level monitoring network with data published in annual reports (Pottorff and Horn, 2013). From 2007 to 2017, CDWR conducted long-term groundwater monitoring in the Denver Basin aquifer system, which indicated decreasing groundwater-level elevations in all bedrock aquifers; however, changes in groundwater levels from 2016 to 2017 and 2012 to 2017 were inconsistent (Flor, 2017). The USGS published a study of groundwater-level elevations in the Denver Basin aquifer system within Elbert County (Penn and Everett, 2019), which presented results showing all aquifers except the upper Dawson aquifer had more wells with statistically significant trends indicating decreasing groundwater-level elevations than increasing groundwater-level elevations. In Douglas and El Paso Counties (fig. 1), groundwater-level monitoring networks, similar to the Elbert County network presented in this report, has been operating since 2011 (Everett, 2014; Malenda and Penn, 2020) and 2021 (Kisfalusi and others, 2025), respectively.
Description of Study Area
Elbert County is 1,851 square miles of mostly rural land in eastern Colorado, southeast of Denver, and northeast of Colorado Springs. Elbert County is bordered by Arapahoe County to the north, Lincoln County to the east and southeast, El Paso County to the south and west, and Douglas County to the west (fig. 1). Elbert County receives approximately 12 to 18 inches of precipitation per year, accounting for both rain and snowfall, compared to the average 16 inches for Colorado (Elbert County Planning Commission, 2018). Drought-tolerant plants such as Bouteloua gracilis (blue grama), Bouteloua dactyloides (buffalograss), Pascopyrum (wheatgrass), and Fescuta, sp. (fescue) dominate the plains, whereas Pinus ponderosa (ponderosa pine) lines the western region of Elbert County. Populus deltoides (cottonwood) and Salix, sp. (willow) populate the riparian corridors (Elbert County Planning Commission, 2018). Numerous intermittent tributaries of the South Platte River originate in Elbert County, including Kiowa Creek, East, Middle, and West Bijou Creeks. Big Sandy Creek, an intermittent stream, flows into the Arkansas River (fig. 1).
Description of the Denver Basin Aquifer System
The Denver Basin aquifer system, which covers an approximate 7,000 square miles, is bound on the western edge by the base of the Colorado Front Range Mountains and extends into the eastern plains of Colorado (Bauch and others, 2014; fig. 1 of this report). The northern extent ends near Greeley, Colorado, and the southern extent reaches into El Paso County. The structure of the basin is synclinal (bowl shaped) and is composed of Late Cretaceous to Tertiary sandstone bedrock aquifers separated by claystone confining units (Fenneman, 1931; Robson, 1987; Paschke, 2011). The four principal bedrock aquifers, from youngest (shallowest) to oldest (deepest), are the Dawson aquifer in the Late Cretaceous to Eocene Dawson Formation, Denver aquifer in the Late Cretaceous to Paleocene Denver Formation, Arapahoe aquifer in the Late Cretaceous Arapahoe Formation, and Laramie-Fox Hills aquifer in the Late Cretaceous Laramie Formation and Fox Hills Sandstone. The principal bedrock aquifers are underlain by the confining Cretaceous Pierre Shale (fig. 3). The Dawson and Arapahoe aquifers are divided into lower and upper units in parts of the basin by discontinuous confining units. In Elbert County, the Arapahoe aquifer is undivided, and the Dawson aquifer is divided, thus totaling five distinct bedrock aquifers. Outcrops of each aquifer can be found along the outer edge of their extents and are generally considered unconfined, whereas confined conditions exist towards the interior of the basin in each aquifer where it is overlain by a younger confining unit (Paschke, 2011). The physical characteristics of the bedrock aquifers in Elbert County are summarized in table 2. Studies from which the information in table 2 was acquired include Romero (1976), Kirkham and Ladwig (1979), Schneider (1980), Robson and others (1981a), Robson and others (1981b), Robson (1987), Crifasi (1992), Raynolds and others (2001), Raynolds (2002, 2004), and Paschke (2011).
Table 2.
Physical characteristics of bedrock aquifers in the Denver Basin aquifer system, Elbert County, Colorado.[Refer to figure 1 for extent and location of aquifers and extent and location of Elbert County. mi2, square mile; ft, foot; N/A, not applicable]
Romero, 1976; Robson and others, 1981b; Robson, 1987; Raynolds and others, 2001; Raynolds, 2002; Paschke, 2011.
Romero, 1976; Kirkham and Ladwig, 1979; Robson and others, 1981b; Robson, 1987; Crifasi, 1992; Raynolds and others, 2001; Raynolds, 2002; Paschke, 2011.
Generalized geologic cross sections A, A–A', west to east, and B, B–B', south to north, for the upper Dawson, lower Dawson, Denver, Arapahoe, and Laramie-Fox Hills aquifers through the Denver Basin aquifer system, Elbert County, Colorado. Refer to figure 1 for cross section locations and table 2 for bedrock aquifer descriptions within each geologic unit. Modified from Robson (1987), Penn and Everett (2019), and Malenda and Penn (2020).
Study Methods
This section describes the methods used to make and process groundwater-level measurements, how to access data, the statistical tools used to analyze trends in groundwater-level elevations throughout Elbert County, and how potentiometric-surface maps were compiled from static groundwater-level elevations.
Groundwater-Level Measurements and Groundwater-Level Elevations
This section presents the methods used for making and processing the discrete and continuous groundwater-level measurements analyzed in this study. Groundwater levels are presented as depth to groundwater in ft below land surface datum (LSD). Calculated groundwater-level elevations are presented in ft above the North American Vertical Datum of 1988 (NAVD 88). Well common names are a combination of aquifer of completion abbreviation and an assigned number: upper Dawson aquifer well, UDAW; lower Dawson aquifer well, LDAW; upper or lower Dawson aquifer well, DAWMAS; Denver aquifer well, DENV and DENMAS; Arapahoe aquifer well, ARAP and ARAPMAS; Laramie-Fox Hills aquifer well, LARA (table 1).
Discrete Groundwater-Level Measurements and Groundwater-Level Elevations
Groundwater-level measurements were analyzed for the Penn and Everett (2019) study from April 2015 through June 2018. This report presents data from 36 wells within Elbert County routinely measured during the study period, April 2015 through November 2023 (table 1). The following wells were discontinued from routine monitoring since the previous study period because of various reasons, including but not limited to, new homeownership, homeowner request, or accessibility issues: LARA 4, ARAPMAS22, DENV 13, DAWMAS28, UDAW 11, UDAW 17, and UDAW 18. Three more wells were discontinued from the network but are included in this study: LDAW 16 in November 2023 and DENV 16 in October 2022 because of accessibility issues, and ARAMAS27 in December 2022 because of equipment malfunctions within the well (table 1).
Manual measurements were made bimonthly (February, April, June, August, October, December) except for a few instances when well access was temporarily restricted. The procedures for making manual groundwater-level measurements are outlined in Cunningham and Schalk (2011), with the exception that a breakaway weight was not used because of concerns it could get entangled with pump wiring or piping, which are present within most wells in the network. A measuring point (MP) was established on the casing of each well as a consistent point from which to make measurements, as depicted in appendix 1 (fig. 1.1). The height of each MP above the land surface was manually measured. The elevation of each well MP was determined using the real-time kinetic global positioning system survey referenced to NAVD 88 using the methods by Rydlund and Densmore (2012), described by Penn and Everett (2019). The LSD of each well was calculated by subtracting the well MP height from the MP elevation (determined by the survey). The horizontal coordinates and elevation of LSD for each well are summarized in table 1. By computing the elevation of LSD for each well with a consistent coordinate system, horizontal datum, and vertical datum, groundwater-level elevations can be calculated and accurately compared across Elbert County. In this report, groundwater-level elevation is calculated from groundwater level below LSD according to the following equation (Cunningham and Schalk, 2011):
whereGroundwater-level elevation
is groundwater-level elevation, in ft above NAVD 88;
LSD
is the land-surface datum, in ft above NAVD 88; and
Depth to groundwater below LSD
is the measured depth, in ft, to groundwater below land-surface datum.
For most discrete measurements, a calibrated electric water-level tape was lowered into the well until the electrode probe indicated contact with water. Once the electric water-level tape indicated contact with water, the depth to water from an established MP on the well was recorded. In some instances, a calibrated steel tape was lowered into the well to record the depth to groundwater from the well MP. In each instance, the depth to groundwater from the MP was recorded to the nearest 0.01 ft and corrected for the height of the MP above LSD to give a final reading of measured depth to groundwater below LSD. To determine if the groundwater level measured in the well was static and to follow USGS protocol as a quality-control measure, a second check measurement was made, typically 3–5 minutes after the first measurement. Measurements that differed by 0.02 ft or less were considered a reliable measurement and assigned the status of “static.” Measurement methods were in accordance with the Office of Groundwater Technical Procedures Manual (Cunningham and Schalk, 2011).
When the check measurement did not agree with the original measurement (measurements differed by greater than [>] 0.02 ft), additional measurements were made until the reason for lack of agreement was determined, or results were shown to be reliably representative of field conditions. If consecutive measurements indicated a rising groundwater level (decreasing depth to groundwater), the well was considered to be recovering from recent pumping, and the highest groundwater level (smallest depth to groundwater) measured during the field visit was recorded and given the status of “recently pumped.” If consecutive measurements indicated a decreasing groundwater level (increasing depth to groundwater), the well was considered to be actively pumping, and the highest groundwater level measured during the field visit was recorded and given the status of “actively pumping.” Typical reasons for recently pumped or actively pumping wells include agricultural operations or domestic use. Static measurements, which were made approximately 83 percent of the time during the study period, can be more representative of natural aquifer conditions and therefore are ideal for assessing changes and trends in aquifer groundwater levels.
Continuous Groundwater-Level Measurements and Groundwater-Level Elevations
Of the 36 wells in the monitoring network, 7 wells were equipped with pressure transducers for recording hourly groundwater levels (table 1, fig. 2). The pressure transducers are vented and rated for a 69-ft range (well identified as LDAW 12 had 231-ft range transducer deployed because of large water-level fluctuation ranges [>50 ft]) in a freshwater elevation, with a manufacturer accuracy of plus or minus (±) 0.05 percent at 59 degrees Fahrenheit (In-Situ Inc., 2023). The transducers are suspended in the well on a vented communication cable allowing the user to download data from the instrument while the transducer remains in place and to directly use the data to calculate depth to water, without needing to correct for barometric pressure. The internal data logger was programmed to record depth to groundwater below LSD every hour, based on a static manual groundwater-level measurement at the time the transducer was deployed, following the methods described in Cunningham and Schalk (2011).
Each transducer was downloaded and serviced during each bimonthly site visit. At the time of each manual groundwater-level measurement, a concurrent instantaneous transducer groundwater-level measurement was recorded. In instances where the transducer measurement had drifted greater than 0.10 ft from the concurrent discrete groundwater-level measurement, the data logger was reset to match the discrete value for depth to groundwater. However, if groundwater levels were not static, the transducers were not reset. To account for drift, the continuous groundwater levels were corrected to match discrete groundwater-level measurements. Processing of the continuous groundwater-level measurements followed USGS guidelines (Freeman and others, 2004). Like discrete measurements, a continuous hourly record of groundwater-level elevation was calculated using equation 1. At wells with continuous hourly groundwater-level elevations, a dataset of daily maximum groundwater-level elevations was derived from the maximum hourly groundwater-level elevation measured each day. The daily maximum groundwater-level elevation values tend to represent periods of the day when pumping is not occurring at the well or in nearby wells and has not occurred recently (USGS, 2023).
Accessing Data
All discrete and continuous groundwater levels summarized in this report are publicly available through the USGS National Water Information System (NWIS) database (USGS, 2023). The NWIS database website provides an interface for accessing USGS site information and data and is regularly updated to reflect the most current data. Users of the interface can retrieve USGS data by category, region, site number, or many other criteria and produce tables and graphs for web viewing or export. Site identification numbers in table 1 are from the U.S. Geological Survey NWIS database (USGS, 2023). Data accessible from the NWIS database can be downloaded in the R statistical software (R Core Team, 2018) using the USGS “dataRetrieval” package (De Cicco and others, 2024).
Groundwater-Level Summary, Groundwater-Level Elevation Trend Analysis, and Mapping
After measurement of, and corrections to, discrete and continuous groundwater levels, all groundwater levels used in this report went through an internal review and an independent approval process. Groundwater levels, both discrete and continuous, were converted to groundwater-level elevations prior to trend analysis and graphical representation. The hydrographs showing groundwater-level elevations of the discrete and continuous data through time are available in appendix 2. The presence of temporal trends in both the discrete and continuous groundwater-level elevation data was evaluated using nonparametric statistical methods. This study used a similar approach to Malenda and Penn (2020) using a seasonal Mann-Kendall (sM–K) trend test (Helsel and others, 2020). These trend analyses were completed using the R statistical software (R Core Team, 2018) and the “EnvStats” package (Millard, 2013) as described in appendix 3. The calculated trend estimate, in ft per year, was quantified using the Theil-Sen slope estimate (Sen, 1968; Hirsch and others, 1982) with the “EnvStats” package (Millard, 2013). This approach performs a nonparametric test for a monotonic trend within each season and summarizes the trend as the median of all within season slopes (Hirsch and others, 1982; Helsel and others, 2020). Refer to appendix 3 for a more detailed description of the statistical methods and the respective equations.
The sM–K test (Mann, 1945; Kendall, 1975; Helsel and others, 2020) was applied to static discrete and continuous groundwater-level elevations measured between April 2015 and November 2023. The sM–K test accounts for temporal correlation caused by seasonality by comparing data from a user-defined season only to data from the same season (appendix 3). For the sM–K test on discrete data, seasons were defined as months when measurements were made to minimize effects of temporal correlation among months (totaling six seasons for bimonthly site visits). For the sM–K test on continuous data, the test was completed on the maximum hourly groundwater-level elevation measured each day, and seasons were defined as individual months to minimize effects of temporal correlation among months (totaling 12 seasons). The null hypothesis of no monotonic trend and an alpha (α), or probability value (p-value), of 0.05 was used to evaluate trend significance. Therefore, when the p-value was less than or equal to 0.05, the null hypothesis was rejected, and a trend in groundwater-level elevations was considered statistically significant (Helsel and others, 2020). Previous reports by Malenda and Penn (2020) and Penn and Everett (2019) used a p-value of 0.1. A more conservative confidence level was used in this report to reduce the likelihood of incorrectly rejecting the null hypothesis (Helsel and others, 2020). A negative trend indicates generally declining groundwater-level elevations in the well through time, and a positive trend indicates generally rising groundwater-level elevations in the well through time.
In addition to the sM–K test, the sensitivity of wells to their environment and conditions was assessed by calculating the departure of static discrete groundwater-level elevations from the 2015 median groundwater-level elevation for each well, in each aquifer. For this study, the 2015 median groundwater-level elevation was selected because it is the earliest available USGS groundwater-level data for Elbert County. Additionally, 2015 had the highest groundwater-elevation for the entire study period for the most wells (USGS, 2023). Ideally, the median groundwater level would be selected from predevelopment or early development in order to represent stable aquifer conditions; however, these data are not available from the wells in the study site. As such, the earliest (2015) groundwater-level data were selected. If a well did not have data in 2015, it was not included in this analysis. The departure from the 2015 median was compared with the average 30-year normal precipitation for Elbert County (PRISM Climate Group, 2024) where dry periods are less than, and wet periods are more than the 30-year normal. The 30-year normal of precipitation, provided by Parameter-elevation Regression on Independent Slopes Model (PRISM) climatological datasets, for Elbert County between the years 1991 and 2020 is 17.2 inches (PRISM Climate Group, 2024). Potentiometric-surface maps show the hydraulic head distribution of an area with contour lines of equal hydraulic head. Groundwater flow is from areas of high hydraulic head to areas of low hydraulic head; flow direction is perpendicular to the contours (Winter and others, 1998). Groundwater-level elevations from April 2023 observations were interpolated spatially using the Python programming language (Van Rossum and Drake, 2009) Numpy package (Harris and others, 2020) to derive the hydraulic head distribution and contour lines of equal hydraulic head using the static discrete values of groundwater-level elevation above NAVD 88 in ft in the upper and lower Dawson aquifers. Potentiometric-surface maps in Penn and Everett (2019) were compiled from April 2018 data. April 2023 data were used in this report for consistency between both reports and to provide a comparison between April 2018 and April 2023 data.
Groundwater-Level Elevations in the Denver Basin Bedrock Aquifers of Elbert County
From April 2015 through November 2023, more than 1,700 discrete and 340,000 continuous groundwater-level measurements were made in the Elbert County groundwater monitoring network. Hydrographs showing discrete and continuous groundwater-level elevations through time for each well in the network are provided in appendix 2.
Discrete Groundwater-Level Elevation Summary and Trends
Groundwater levels in each of the bedrock aquifers varied both temporally and spatially. In general, groundwater-level elevations were lowest during summer and fall (June through October) and recovered to higher elevations in winter and spring (December through April) (appendix 2). Some wells exhibited strong seasonal fluctuations of about 10 ft (for example, well UDAW 13, fig. 2.8), whereas others show minimal seasonality with fluctuations less than 1 ft between measurements (for example, well DENV 16, fig. 2.20). Seasonal variations are caused by natural processes, including precipitation and evapotranspiration in aquifer zones connected to the land surface and timing of aquifer recharge in confined aquifer zones (Paschke, 2011). Human activities, such as increased irrigation for agriculture (during the growing season) and domestic pumping (for lawns), can also affect seasonal variations.
Of the 36 wells monitored, 35 were analyzed (UDAW 20 [fig. 2.9] was excluded because of insufficient data) in the study period, with 29 exhibiting statistically significant trends in discrete groundwater-level elevations, based on the sM–K test (table 3, appendix 3). Potential reasons for wells not resulting in statistically significant trends could be inadequate static measurements, such as DENV 17 (fig. 2.19) with approximately fewer than 35 percent static measurements. Continued monitoring and more static measurements at the wells where trends were not identified may increase the likelihood of statistically significant trend occurrence at those wells in the future. Of the remaining five wells that did not have statistically significant trends, three wells (ARAP 7, DAWMAS22, and ARAPMAS27) have sufficient data (more than 75 percent of measurements with a static status), but based on the sM–K results and hydrographs are considered in apparent steady state (table 3, figs. 2.26, 2.3, and 2.27, respectively). The two remaining wells (LDAW 15 and ARAP 6) had more than 57 percent of measurements with a static status but did not meet the criteria of a statistically significant p-value of less than or equal to 0.05 (table 3, figs. 2.12 and 2.28, respectively). Based on the criteria used by Penn and Everett (2019) however, the trends would be considered statistically significant with p-values less than or equal to 0.10.
Table 3.
Trend analysis summary of static discrete and continuous groundwater-level elevation data, April 2015 through November 2023, Elbert County, Colorado.[Refer to table 1 and figure 2 for well locations (USGS, 2023). The discrete and continuous data analyzed were from April 2015 through November 2023. Only static measurements were used in the discrete dataset. Seasonal Mann-Kendall trend test evaluates the significance of a monotonic trend in the data (Mann, 1945; Kendall, 1975; Helsel and others, 2020), whereas the Theil-Sen slope estimator (Sen, 1968; Hirsch and others, 1982) calculates the trend, or change in groundwater-level elevations through time. Statistically significant trends were considered significant if the p-value is less than or equal to the defined alpha of 0.05. Refer to “Methods” section and appendix 3 of this report for details of field measurement and statistical methods used. n, number of observations used in the analysis for discrete data; tau, rank correlation coefficient, also known as “Kendall's tau” (Kendall, 1975), which measures the strength of the correlation between time and groundwater-level elevations; p-value, probability value, which indicates the level of significance; ft/yr, foot per year; --, not calculated because of insufficient data (UDAW 20) or unavailable data; UDAW, upper Dawson aquifer well; LDAW, lower Dawson aquifer well; DAWMAS, lower or upper Dawson aquifer well; DENV and DENMAS, Denver aquifer well; ARAP and ARAPMAS, Arapahoe aquifer well; LARA, Laramie-Fox Hills aquifer well]
In wells with statistically significant trends, groundwater-level elevations were declining in all aquifers except the lower Dawson aquifer. The lower Dawson aquifer had two wells (DAWMAS27 and DAWMAS16) with increasing groundwater-level elevations of 0.040 and 0.63 ft/yr, respectively, near the border of Douglas and El Paso Counties. In this study, the groundwater-level elevation trend medians in the upper Dawson, lower Dawson, Denver, Arapahoe, and Laramie-Fox Hills aquifers were −0.23, −0.66, −0.64, −0.39, and −0.63 ft/yr, respectively (table 3). The groundwater-level elevation trend medians in this study, compared to the overall trends in Penn and Everett (2019), both indicated decreasing groundwater-level elevations except in the upper Dawson aquifer, where the trend direction was opposite, a positive trend (increasing groundwater elevations) from 2015 to 2018 and a negative trend (decreasing groundwater elevations) from 2015 to 2023. Trends from the previous study (Penn and Everett, 2019) were determined by a linear regression analysis, whereas trends in this study were determined using the sM–K test. Additionally, trends from Penn and Everett (2019) used a shorter period of analysis; therefore, trend magnitudes (amount groundwater-level elevation changed, in ft/yr) may be affected by both the period and method applied. Statistically significant trends throughout Elbert County are relatively consistent for grouping and distribution, where the largest trends are near the western border of Elbert County and along Colorado State Highway 86 (fig. 4). Trend magnitude and direction were generally in agreement for wells near and in the same aquifer (for example, UDAW 13 and UDAW 15; LDAW 12 and DAWMAS21; DENV 14 and DENV 15; ARAP 5 and ARAPMAS28; LARA 5 and LARA 6; fig. 4).
Distribution of statistically significant trends in discrete groundwater-level elevations, for the upper Dawson, lower Dawson, Denver, Arapahoe, and Laramie-Fox Hills aquifers in the Denver Basin aquifer system, Elbert County, Colorado, 2015–23. Refer to table 1 and figure 2 for well locations (USGS, 2023). Well common name abbreviations are as follows: UDAW, upper Dawson aquifer well; LDAW, lower Dawson aquifer well; DAWMAS, upper or lower Dawson aquifer well; DENV and DENMAS, Denver aquifer well; ARAP and ARAPMAS, Arapahoe aquifer well; LARA, Laramie-Fox Hills aquifer well.
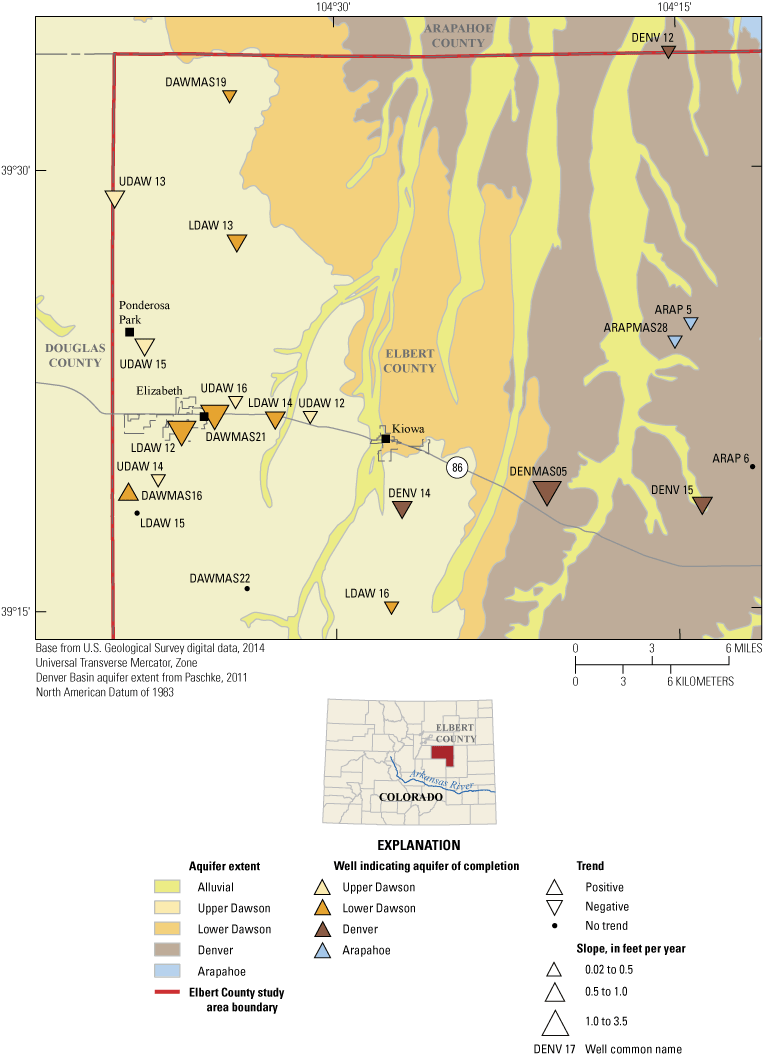
Distribution of statistically significant trends in discrete groundwater-level elevations in the upper Dawson, lower Dawson, Denver, and Arapahoe aquifers in the Denver Basin aquifer system near Elizabeth and Kiowa, Elbert County, Colorado, 2015–23. Refer to table 1 and figure 2 for well locations (USGS, 2023). Well common name abbreviations are as follows: UDAW, upper Dawson aquifer well; LDAW, lower Dawson aquifer well; DAWMAS, upper or lower Dawson aquifer well; DENV and DENMAS, Denver aquifer well; ARAP and ARAPMAS, Arapahoe aquifer well.
The departure from the 2015 median groundwater-level elevation for each well in each aquifer (fig. 6A−E) indicated departures from the median in each aquifer were negative, meaning groundwater level was less than the median, more frequently (at least 60 percent) than positive (groundwater level greater than the median), supporting the overall pattern of negative trends in groundwater-level elevation in Elbert County. The maximum negative departures from the 2015 median groundwater-level elevations were greater than the maximum positive departure for all wells in each aquifer (maximum negative and positive departures, respectively, were as follows: −17.06 ft and 3.81 ft in the upper Dawson aquifer [fig. 6A]; −59.55 ft and 20.10 ft in the lower Dawson aquifer [fig. 6B]; −17.96 ft and 1.83 ft in the Denver aquifer [fig. 6C]; −13.26 ft and 2.48 ft in the Arapahoe aquifer [fig. 6D]; and −12.28 ft and 1.86 ft in the Laramie-Fox Hills aquifer[fig. 6E]). Wells nearest to Elizabeth, Colorado, and the border between Elbert and Douglas Counties had the greatest negative departures from the 2015 median in the upper and lower Dawson aquifers (UDAW 13, UDAW 15, LDAW 12, LDAW 13, LDAW 14, and DAWMAS 21, figs. 5, 6A−B). Wells in the Denver aquifer (DENV 14, DENV 15, and DENMAS05), Arapahoe aquifer (ARAP 8 and ARAP 3), and Laramie-Fox Hills aquifer (LARA 5, LARA 6, and LARA 7) that showed the greatest negative departures from the 2015 median also indicated the largest decreasing groundwater-level elevations (figs. 4, 6C−E). Departures from the 2015 median groundwater-level elevations were greatest during the dry period between the years 2020 and 2023. Notably, departures from the 2015 median were largest in LDAW 12 well (approximately −60 ft; fig. 6B), which has proximity to a multiresidential development beginning between 2017 and 2019 based on imagery of the area (Google, 2023); these years coincide with the largest drawdowns during the study period at this site (fig. 6B; fig. 2.14). Based on CDWR well records, the recent residential development included the addition of two commercial wells intersecting the Denver and Arapahoe aquifers (CDWR, 2023). Although LDAW 12 had the largest departures from the 2015 median, seasonal recharge is shown, which returns the departure from the 2015 median to a near zero difference annually. Conversely, most wells with the greatest departures in the Denver, Arapahoe, and Laramie-Fox Hills aquifers do not have departures returning to zero annually and instead, some continue to decline (fig. 6C−E). These aquifers are predominately under confined conditions (Ruybal and others, 2019) and are generally dominated by thousands of years old groundwater which has not been affected by mixing with young recharge groundwater (Musgrove and others, 2014). Substantial drawdown from increased pumping in the bedrock aquifers resulted in lowered potentiometric surfaces and increased areas of unconfined conditions, making them more susceptible to varying recharge (Paschke, 2011; Ruybal and others, 2019). The departure from the 2015 median groundwater-level elevation can be used as a tool to observe potential effects from increased groundwater withdrawals, especially in confined aquifers in the Denver Basin bedrock aquifer system.
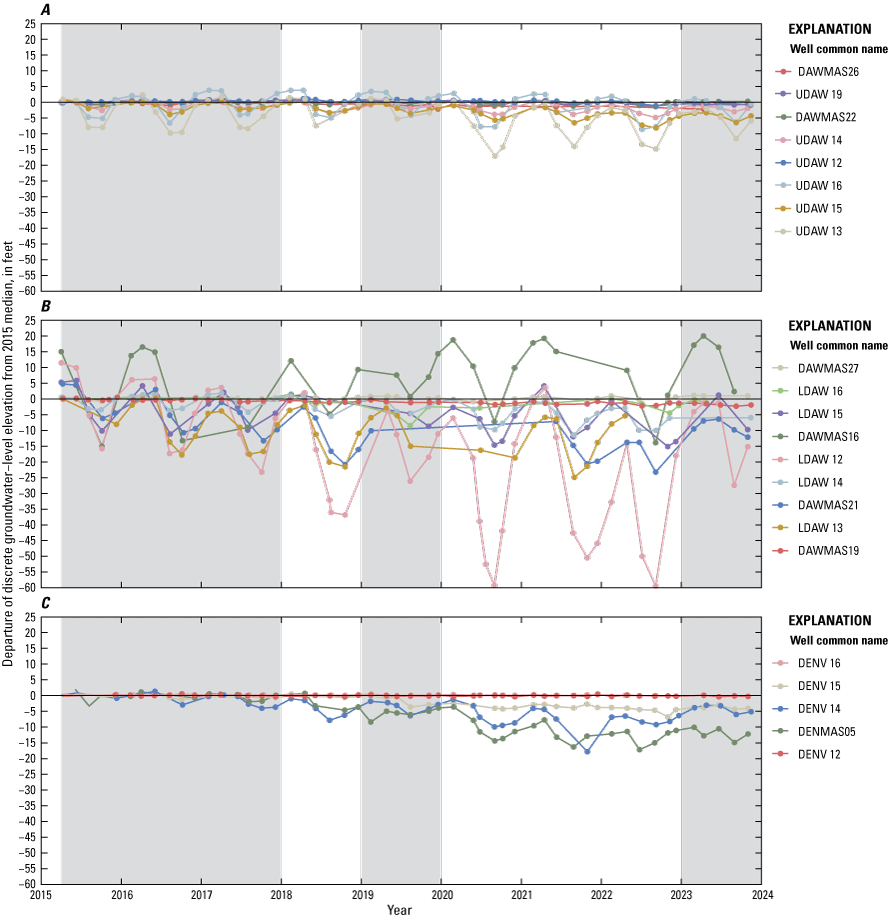
Departure of static discrete groundwater-level elevations from the 2015 median groundwater-level elevation for each well [Refer to table 1 and figure 2 for well locations (USGS, 2023)] in the A, upper Dawson aquifer; B, lower Dawson aquifer; C, Denver aquifer; D, Arapahoe aquifer and; E, Laramie-Fox Hills aquifer, Elbert County, Colorado. The departure from the 2015 median was overlaid with wet (shaded) and dry (nonshaded) periods calculated based on the average 30-year normal precipitation for Elbert County (PRISM Climate Group, 2024) where dry periods are less than, and wet periods are more than the 30-year normal. Well common name abbreviations are as follows: UDAW, upper Dawson aquifer well; LDAW, lower Dawson aquifer well; DAWMAS, upper or lower Dawson aquifer well; DENV and DENMAS, Denver aquifer well; ARAP and ARAPMAS, Arapahoe aquifer well; and LARA, Laramie-Fox Hill aquifer well.
Continuous Groundwater-Level Elevation Summary and Trends
Hydrographs of continuous groundwater-level elevations from the wells containing pressure transducers were generally in agreement with discrete groundwater levels measured at the same well (figs. 2.4, 2.5, 2.14, 2.18, 2.24, 2.36). The pressure transducer at site LDAW 15 (fig. 2.12) was installed in December 2022 and was not included in the trend analysis because of insufficient data. Groundwater-level elevations were generally highest during winter and spring (December through April) and lowest during summer and fall (June through October), except for DENV 12 (fig. 2.24), which does not have a strong seasonal pattern. Based on the results from the sM–K trend test conducted on the continuous daily maximum groundwater-level elevations, the trend direction (increasing or decreasing groundwater-level elevations) and magnitude (change in groundwater-level elevation, in ft/yr) generally agreed with the trend analysis results calculated from discrete groundwater-level elevations (table 3). The hydrograph for LARA 3 (fig. 2.36) clarifies the additional information that continuous measurements can provide about groundwater-level elevation changes between discrete measurements.
Potentiometric-Surface Maps
Potentiometric-surface maps were compiled from static groundwater-level elevations made during April 2023 in the upper and lower Dawson aquifers. Only wells with static measurements were used to derive the groundwater-level elevations using the Python programming language (Van Rossum and Drake, 2009) Numpy package (Harris and others, 2020). The potentiometric surface as 40-ft interval contours for April 2023 in the upper and lower Dawson aquifers are shown in figures 7 and 8, respectively. Groundwater flow in the upper and lower Dawson aquifers in western Elbert County, based on the derived potentiometric-surface maps, is generally from south to north. The potentiometric surface maps are generalized representations of a complex groundwater system in the upper and lower Dawson aquifers. Because of the small spatial dataset size for each aquifer, the potentiometric-surface maps are limited to a generalized interpretation of the groundwater-flow direction (Anderson and Lundgren, 2024). Despite generalizations of the interpretation, potentiometric surface maps can be used to assist water resource managers to identify areas for future monitoring and gain a general understanding of groundwater flow (Anderson and Lundgren, 2024).
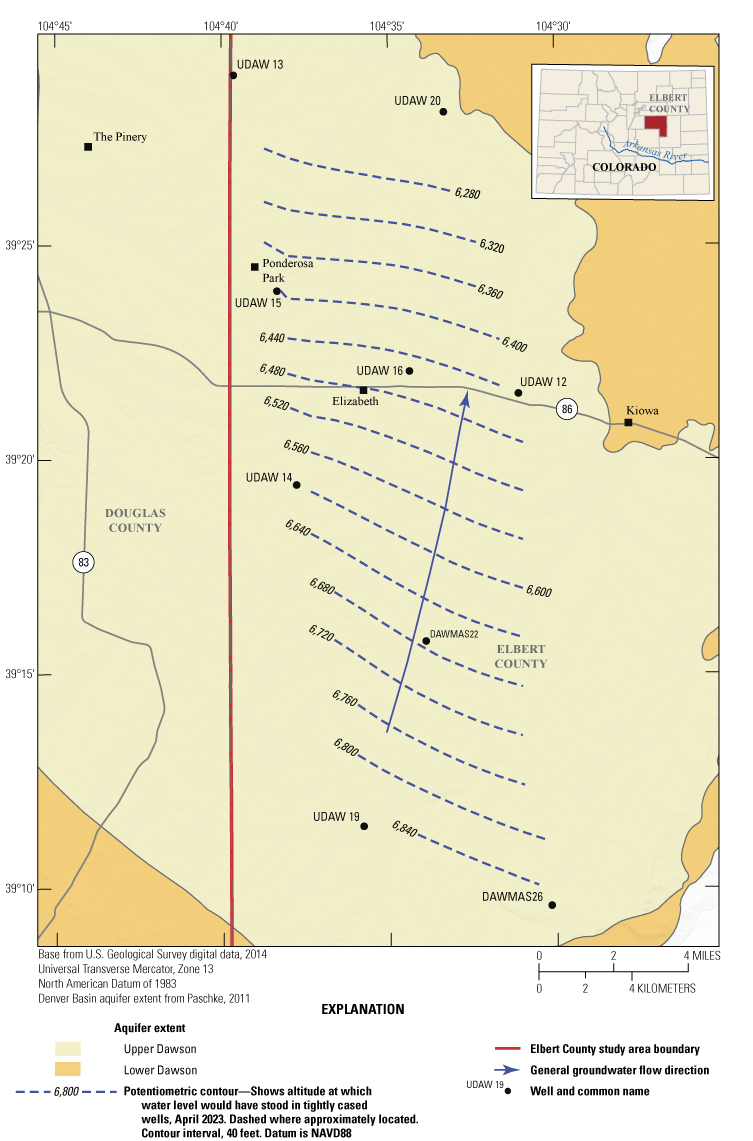
Generalized potentiometric surface of the upper Dawson aquifer in the Denver Basin aquifer system, April 2023, western Elbert County, Colorado. Refer to table 1 and figure 2 for well locations (USGS, 2023). Well common name abbreviations are as follows: UDAW, upper Dawson aquifer well; and DAWMAS, upper or lower Dawson aquifer well.
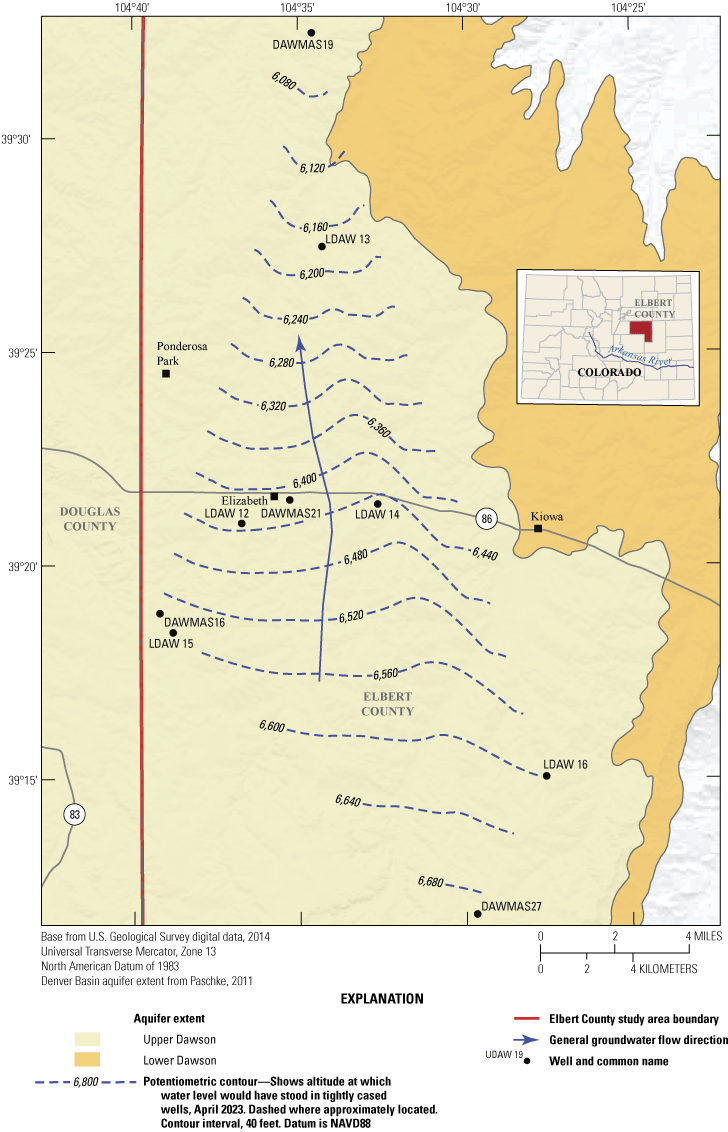
Generalized potentiometric surface of the lower Dawson aquifer in the Denver Basin aquifer system, April 2023, western Elbert County, Colorado. Refer to table 1 and figure 2 for well locations (USGS, 2023). Well common name abbreviations are as follows: LDAW, lower Dawson aquifer well; and DAWMAS, upper or lower Dawson aquifer well.
Potential Additional Work
Long-term groundwater-level elevations and trends monitoring through time can be used as a tool for water-resource managers to guide and inform decisions on water use and understanding potential effects of expected increasing water use needs within Elbert County (Forsgren Associates Inc., 2018). Differences in trends from Penn and Everett (2019) and trends presented in this study clarify the potential benefit of continued long-term monitoring and trend analysis. Continued monitoring and analysis could be beneficial to assess water supplies because of the expected decline in groundwater within the Denver Basin aquifer system (Forsgren Associates Inc., 2018).
With the greatest negative trends occurring along the western border of Elbert County near Douglas County, a regional study and analysis combining data from groundwater-monitoring networks of the Denver Basin aquifer system in both Douglas and Elbert Counties could provide a better understanding of how groundwater levels are changing regionally. A larger-scale study could produce regional groundwater-level trend maps and regional potentiometric surface and hydraulic-head difference maps. Additionally, a regional study measuring groundwater-levels combined with groundwater-age tracers (that is, carbon-14, stable isotope ratios of hydrogen and oxygen, tritium, and chlorofluorocarbons) as conducted by Musgrove and others (2014) could be used to calibrate and potentially improve the Denver Basin groundwater model (Paschke, 2011). Groundwater-age tracers could also provide insight into aquifer vulnerability to contamination as well as changing recharge sources (Musgrove and others, 2014), which cannot be determined from groundwater levels alone.
Summary
Municipal and domestic water users in Elbert County rely on groundwater from the bedrock aquifers in the Denver Basin aquifer system (upper Dawson, lower Dawson, Denver, Arapahoe, and Laramie-Fox Hills aquifers) for approximately half of their water uses. Withdrawals from the bedrock aquifers in the Denver Basin aquifer in Elbert, Arapahoe, El Paso, and Douglas Counties have increased to meet the water use needs of a growing population. The U.S. Geological Survey, in cooperation with the Elbert County Board of County Commissioners, began a study in 2015 to establish a network of wells and measure groundwater levels on a bimonthly interval. The purpose of the study is to assess the groundwater resources of the Denver Basin aquifer system within Elbert County by maintaining a groundwater-monitoring network and by analyzing the groundwater levels of the bedrock aquifers throughout Elbert County.
The primary purpose of this report builds on initial observations made for a previous investigation that examined groundwater-level elevations measured in Elbert County from 2015 through 2018 and to present a summary of groundwater levels measured during the study period (2015–23). Some wells previously analyzed were not evaluated in this report because of discontinuation of the wells from the groundwater network. Discrete groundwater levels were measured at 36 wells within Elbert County. Seven of those wells contained equipment to make and record continuous groundwater-level measurements at hourly intervals. Data collected from the wells were used to calculate changes and trends in groundwater-level elevations in all five bedrock aquifers within Elbert County. Trends were calculated using the seasonal Mann-Kendall trend test on static discrete groundwater-level elevations and continuous daily maximum groundwater-level elevations. All aquifers, except the lower Dawson aquifer, had only decreasing groundwater-level elevations in discrete measurements for wells with statistically significant trends. Of the eight statistically significant trends in the lower Dawson aquifer, two wells indicated increasing groundwater-level elevation from discrete measurements. The groundwater-level elevation trend medians in the upper Dawson, lower Dawson, Denver, Arapahoe, and Laramie-Fox Hills aquifers were −0.23, −0.66, −0.64, −0.39, and −0.63 feet per year, respectively, for discrete groundwater-level elevation measurements. Trends in discrete groundwater-level elevations were in agreement with statistically significant trends in continuous groundwater-level elevations for all wells. The groundwater-level elevation trend medians in this study, compared to the overall trends in the 2015−18 study, both indicated decreasing groundwater-level elevations except in the upper Dawson aquifer, where the trend direction was opposite, a positive trend (increasing groundwater elevations) from 2015 to 2018 and a negative trend (decreasing groundwater elevations) from 2015 to 2023. The change in trends within the upper Dawson aquifer may be affected by differences in the study period and the trend analysis applied. The departure from the 2015 median groundwater-level elevation for each site in each aquifer indicated groundwater levels in each aquifer were negative more frequently (at least 60 percent) than positive, supporting negative trends. Wells nearest to Elizabeth, Colorado, and the border between Elbert and Douglas Counties had the greatest departures from the 2015 median in the upper and lower Dawson aquifers. Additionally, 30-year precipitation data were overlaid with the median departure data to assess groundwater-level patterns in wells in the five aquifers during wet and dry periods. Departures from the 2015 median groundwater levels appeared greatest during the dry period between 2020 and 2023. Potentiometric-surface maps of the upper Dawson and lower Dawson aquifers for April 2023 indicate groundwater flow is generally from south to north in each aquifer.
Results of this study could be used by local water-resource managers to make decisions about water use within Elbert County and could be used to guide additional groundwater-monitoring options. Results also could also be used for a regional study of groundwater-level elevations in the Denver Basin aquifer system to understand how groundwater levels are changing in the region near Elbert County, such as groundwater networks in Douglas County and El Paso County Upper Black Squirrel Creek Designated Groundwater Basin.
References Cited
Anderson, T.M., and Lundgren, R.F., 2024, Generalized potentiometric maps of the Fort Union, Hell Creek, and Fox Hills aquifers within the Standing Rock Reservation: U.S. Geological Survey Scientific Investigations Map 3516, 4 sheets, includes 13-p. pamphlet, accessed March 1, 2023, at https://doi.org/10.3133/sim3516.
Bauch, N.J., Musgrove, M., Mahler, B.J., and Paschke, S.S., 2014, The quality of our Nation’s waters—Water quality in the Denver Basin aquifer system, Colorado, 2003–05: U.S. Geological Survey Circular 1357, 100 p., accessed January 24, 2024, at https://doi.org/10.3133/cir1357.
Colorado Water Conservation Board and Colorado Division of Water Resources [CDWR], 2023, Colorado’s Decision Support Systems—Well permits: Colorado Division of Water Resources website, accessed December 1, 2023, at https://dwr.state.co.us/Tools/WellPermits.
De Cicco, L.A., Hirsch, R.M., Lorenz, D., Watkins, W.D., Johnson, M., 2024, dataRetrieval: R packages for discovering and retrieving water data available from Federal hydrologic web services, v.2.7.17, accessed January 24, 2024, at https://doi.org/10.5066/P9X4L3GE.
Elbert County Planning Commission, 2018, Elbert County comprehensive plan update,: Elbert County Planning Commission, 77 p., accessed February 5, 2024, at https://www.elbertcounty-co.gov/DocumentCenter/View/127/04-10-2018-Elbert-County-Comprehensive-Plan-Update-PDF.
Everett, R.R., 2014, Groundwater levels in the Denver Basin bedrock aquifers of Douglas County, Colorado, 2011–2013: U.S. Geological Survey Scientific Investigations Report 2014–5172, 45 p., accessed January 24, 2024, at https://doi.org/10.3133/sir20145172.
Forsgren Associates Inc., 2018, Elbert County, CO, rural water supply study: Englewood, Colo., Forsgren Associates Inc., , 141 p., accessed February 6, 2024, at https://www.elbertcounty-co.gov/DocumentCenter/View/95/2018-Water-Supply-Study-Final-Report-PDF.
Freeman, L.A., Carpenter, M.C., Rosenberry, D.O., Rousseau, J.P., Unger, R., and McLean, J.C., 2004, Use of submersible pressure transducers in water-resources investigations: U.S. Geological Survey Techniques of Water-Resources Investigations, book 8, chap. A3, 52 p., accessed January 9, 2023, at https://doi.org/10.3133/twri08A3.
Google, 2023, Google Earth aerial imagery: Google Earth, accessed December 1, 2023, at https://www.google.com/earth/.
Harris, C.R., Millman, K.J., van der Walt, S.J., Gommers, R., Virtanen, P., Cournapeau, D., Wieser, E., Taylor, J., Berg, S., Smith, N.J., Kern, R., Picus, M., Hoyer, S., van Kerkwijk, M.H., Brett, M., Haldane, A., del Río, J.F., Wiebe, M., Peterson, P., Gérard-Marchant, P., Sheppard, K., Reddy, T., Weckesser, W., Abbasi, H., Gohlke, C., Oliphant, T.E., 2020, Array programming with NumPy: Nature, v. 585, 357–362. [Also available at https://doi.org/10.1038/s41586-020-2649-2.]
Helsel, D.R., Hirsch, R.M., Ryberg, K.R., Archfield, S.A., and Gilroy, E.J., 2020, Statistical methods in water resources: U.S. Geological Survey Techniques and Methods, book 4, chapter A3, 458 p., accessed June 2020 at https://doi.org/10.3133/tm4a3. [Supersedes USGS Techniques of Water Resources Investigations, book 4, chapter A3, version 1.1.]
Hirsch, R.M., Slack, J.R., and Smith, R.A., 1982, Techniques of trend analysis for monthly water quality data: Water Resources Research, v. 18, no. 1, p. 107–121. [Also available at https://doi.org/10.1029/WR018i001p00107.]
In-Situ Inc., 2023, Innovations in water monitoring spec sheet: In-Situ Inc. Fort Collins, Colo., , 2 p., accessed February 5, 2023, at https://in-situ.com/pub/media/support/documents/LevelTROLL_Spec-Sheet_ltr_en_0723.pdf.
Kisfalusi, Z.D., Hennessy, E.K., and Sharp, J.B., 2025, Groundwater-level elevations in the Denver Basin bedrock aquifers and Upper Black Squirrel Creek alluvial aquifer, El Paso County, Colorado, 2021–24: U.S. Geological Survey Scientific Investigations Report 2024–5123, 49 p., accessed January 8, 2025, at https://doi.org/10.3133/sir20245123.
Major, T.J., Robson, S.G., Romero, J.C., and Zawistowski, S., 1983, Hydrogeologic data from parts of the Denver Basin, Colorado: U.S. Geological Survey Open-File Report 83–274, 425 p. [Also available at https://doi.org/10.3133/ofr83274.]
Malenda, H.F., and Penn, C.A., 2020, Groundwater levels in the Denver Basin bedrock aquifers of Douglas County, Colorado, 2011–19: U.S. Geological Survey Scientific Investigations Report 2020–5076, 44 p., accessed November 1, 2023, at https://doi.org/10.3133/sir20205076.
Mann, H.B., 1945, Nonparametric tests against trend: Econometrica, v. 13, no. 3, p. 245–259. [Also available at https://doi.org/10.2307/1907187.]
Maupin, M.A., Kenny, J.F., Hutson, S.S., Lovelace, J.K., Barber, N.L., and Linsey, K.S., 2014, Estimated use of water in the United States in 2010: U.S. Geological Survey Circular 1405, 56 p. [Also available at https://doi.org/10.3133/cir1405.]
Millard, S.P., 2013, EnvStats: An R package for environmental statistics: New York, Springer, 291 p., accessed December 1, 2023, at https://link.springer.com/book/10.1007/978-1-4614-8456-1.
Musgrove, M., Beck, J.A., Paschke, S.S., Bauch, N.J., and Mashburn, S.L., 2014, Quality of groundwater in the Denver Basin aquifer system, Colorado, 2003–5: U.S. Geological Survey Scientific Investigations Report 2014–5051, 107 p., accessed December 5, 2023, at https://doi.org/10.3133/sir20145051.
Paschke, S.S. ed., 2011, Groundwater availability of the Denver Basin aquifer system, Colorado: U.S. Geological Survey Professional Paper 1770, 274 p. [Also available at https://doi.org/10.3133/pp1770.]
Penn, C.A., and Everett, R.R., 2019, Groundwater-level elevations in the Denver Basin bedrock aquifers of Elbert County, Colorado, 2015–18: U.S. Geological Survey Scientific Investigations Report 2019–5014, 50 p., accessed January 9, 2024, at https://doi.org/10.3133/sir20195014.
PRISM Climate Group, 2024, Descriptions of PRISM spatial climate datasets for the conterminous United States: Oregon State University, data created February 4, 2014, accessed May 9, 2024, at https://prism.oregonstate.edu.
R Core Team, 2018, R: A language and environment for statistical computing (version 4.1.3): Vienna, Austria, R Foundation for Statistical Computing, accessed December 1, 2023, at https://www.R-project.org/.
Raynolds, R.G., Johnson, K.R., Arnold, L.R., Farnham, T.M., Fleming, R.F., Hicks, J.F., Kelley, S.A., Lapey, L.A., Nichols, D.J., Obradovich, J.D., and Wilson, M.D., 2001, The Kiowa core—A continuous drill core through the Denver Basin bedrock aquifers at Kiowa, Elbert County, Colorado: U.S. Geological Survey Open-File Report 2001–185, 72 p. [Also available at https://doi.org/10.3133/ofr01185.]
Robson, S.G., 1987, Bedrock aquifers in the Denver Basin, Colorado—A quantitative water-resources appraisal: U.S. Geological Survey Professional Paper 1257, 73 p. [Also available at https://doi.org/10.3133/pp1257.]
Robson, S.G., Romero, J.C., and Zawistowski, S., 1981a, Geologic structure, hydrology, and water quality of the Arapahoe aquifer in the Denver Basin, Colorado: U.S. Geological Survey Hydrologic Investigations Atlas HA–646, scale 1:500,000, 3 sheets. [Also available at https://doi.org/10.3133/ha647.]
Robson, S.G., Wacinski, A., Zawistowski, S., and Romero, J.C., 1981b, Geologic structure, hydrology, and water quality of the Laramie–Fox Hills aquifer in the Denver Basin, Colorado: U.S. Geological Survey Hydrologic Investigations Atlas, HA–650, scale 1:500,000, 3 sheets. [Also available at https://doi.org/10.3133/ha650.]
Ruybal, C.J., Hogue, T.S., and McCray, J.E., 2019, Assessment of groundwater depletion and implications for management in the Denver Basin aquifer system: Journal of the American Water Resources Association, v. 55, no. 5, p. 1130–1148. [Also available at https://doi.org/10.1111/1752-1688.12755.]
Rydlund, P.H., Jr., and Densmore, B.K., 2012, Methods of practice and guidelines for using survey-grade global navigation satellite systems (GNSS) to establish vertical datum in the United States Geological Survey: U.S. Geological Survey Techniques and Methods, book 11, chap. D1, 102 p. with appendixes, accessed November 8, 2024, at https://pubs.usgs.gov/tm/11d1/.
Schneider, P.A., Jr., 1980, Water-supply assessment of the Laramie-Fox Hills aquifer in parts of Adams, Boulder, Jefferson, and Weld Counties, Colorado: U.S. Geological Survey Open-File Report 80–327, 21 p. [Also available at https://doi.org/10.3133/ofr80327.]
Sen, P.K., 1968, Estimate of the regression coefficient based on Kendall’s tau: Journal of the American Statistical Association, v. 63, no. 324, p. 1379–1389. [Also available at https://doi.org/10.1080/01621459.1968.10480934.]
U.S. Census Bureau, 2023, Annual estimates of resident population—April 1, 2010 to July 1, 2023, U.S. Census Bureau, accessed February 5, 2024, at https://www.census.gov/quickfacts/fact/table/elbertcountycolorado/PST045217#viewtop.
U.S. Geological Survey [USGS], 2023, USGS water data for the Nation: U.S. Geological Survey National Water Information System database, accessed December 1, 2023, at https://doi.org/10.5066/F7P55KJN.
Winter, T.C., Harvey, J.W., Franke, O.L., and Alley, W.M, 1998, Ground water and surface water—A single resource: U.S. Geological Survey Circular 1139, 79 p. [Also available at https://doi.org/10.3133/cir1139.]
References Cited
Cunningham, W.L., and Schalk, C.W., comps., 2011, Groundwater technical procedures of the U.S. Geological Survey: U.S. Geological Survey Techniques and Methods, book 1, chap. A1, 151 p., accessed November 2023 at https://doi.org/10.3133/tm1A1.
Appendix 1. Groundwater-Well Measurement Diagram
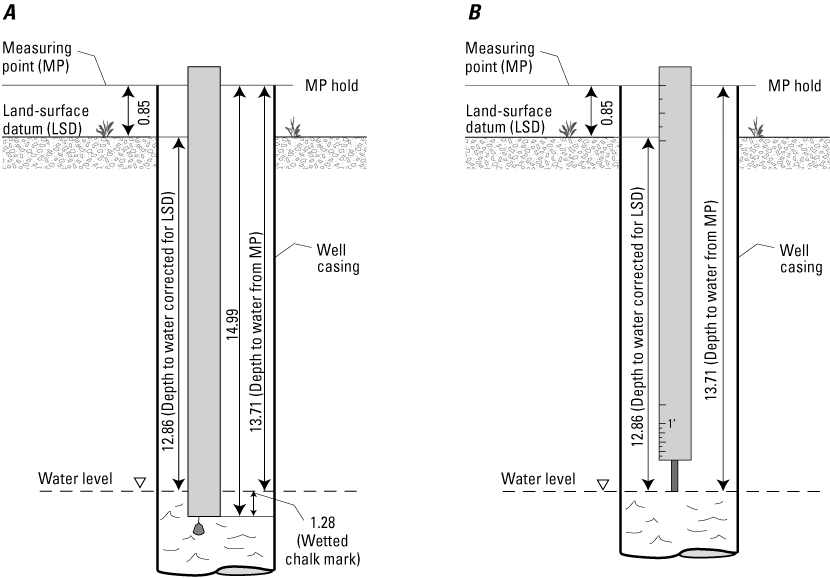
Diagram showing example measurement point and groundwater-level measurement using A, calibrated steel tape with chalk, and B, calibrated electrical tape. Modified from Cunningham and Schalk, 2011 (values are in feet).
Appendix 2. Hydrographs Showing Groundwater-Level Elevation Through Time for Wells in Elbert County Groundwater-Level Monitoring Network
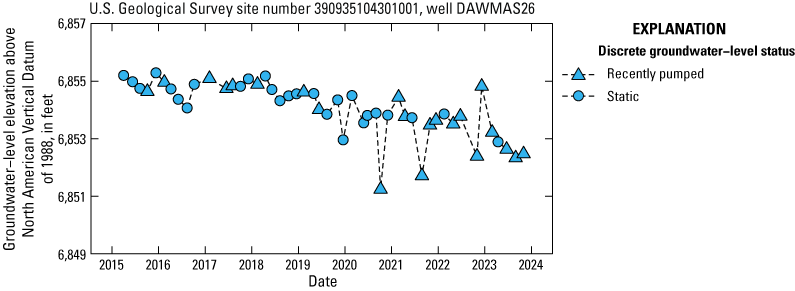
Groundwater-level hydrograph for U.S. Geological Survey site number 390935104301001, well DAWMAS26, Elbert County, Colorado (USGS, 2023). DAWMAS, upper Dawson aquifer well.
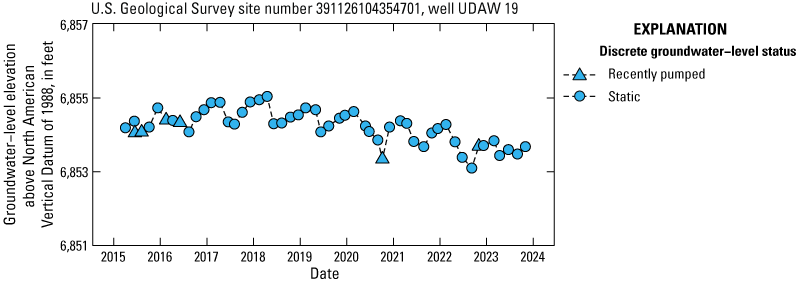
Groundwater-level hydrograph for U.S. Geological Survey site number 391126104354701, well UDAW 19, Elbert County, Colorado (USGS, 2023). UDAW, upper Dawson aquifer well.
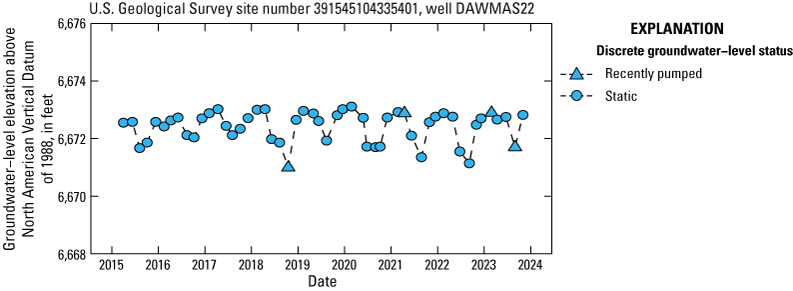
Groundwater-level hydrograph for U.S. Geological Survey site number 391545104335401, well DAWMAS22, Elbert County, Colorado (USGS, 2023). DAWMAS, upper Dawson aquifer well
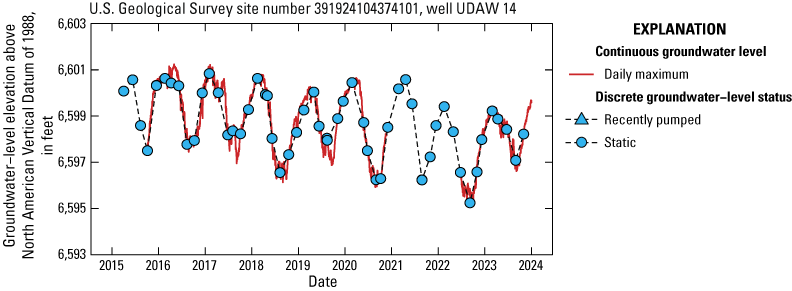
Groundwater-level hydrograph for U.S. Geological Survey site number 391924104374101, well UDAW 14, Elbert County, Colorado (USGS, 2023). UDAW, upper Dawson aquifer well.
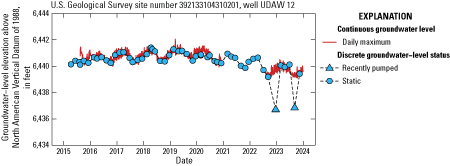
Groundwater-level hydrograph for U.S. Geological Survey site number 392133104310201, well UDAW 12, Elbert County, Colorado (USGS, 2023). UDAW, upper Dawson aquifer well.
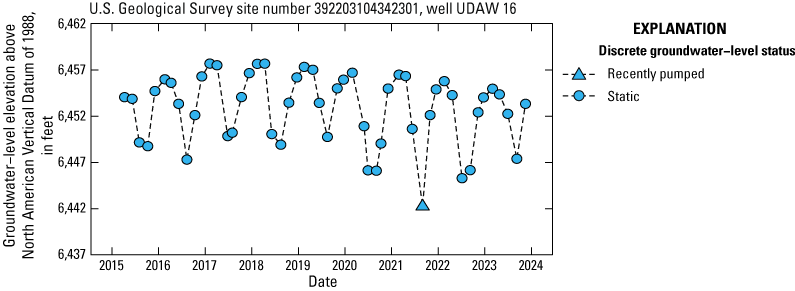
Groundwater-level hydrograph for U.S. Geological Survey site number 392203104342301, well UDAW 16, Elbert County, Colorado (USGS, 2023). UDAW, upper Dawson aquifer well.
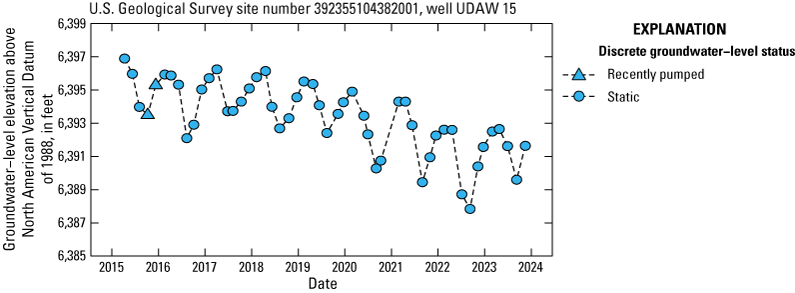
Groundwater-level hydrograph for U.S. Geological Survey site number 392355104382001, well UDAW 15, Elbert County, Colorado (USGS, 2023). UDAW, upper Dawson aquifer well.
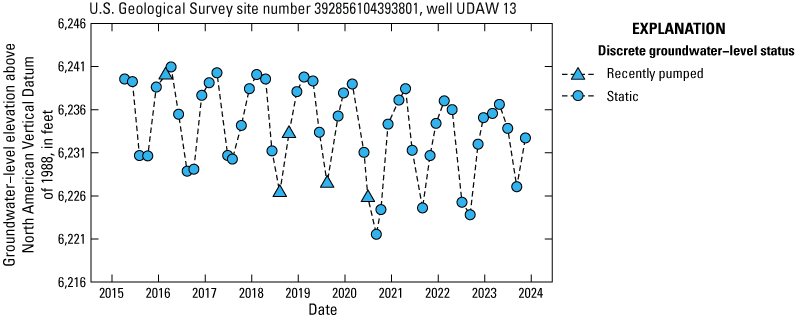
Groundwater-level hydrograph for U.S. Geological Survey site number 392856104393801, well UDAW 13, Elbert County, Colorado (USGS, 2023). UDAW, upper Dawson aquifer well.
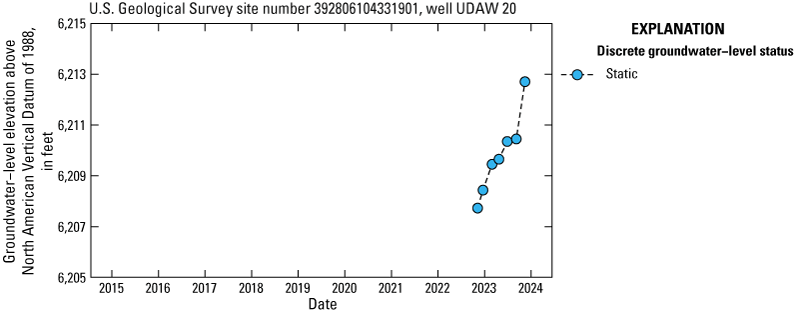
Groundwater-level hydrograph for U.S. Geological Survey site number 392806104331901, well UDAW 20, Elbert County, Colorado (USGS, 2023). UDAW, upper Dawson aquifer well.
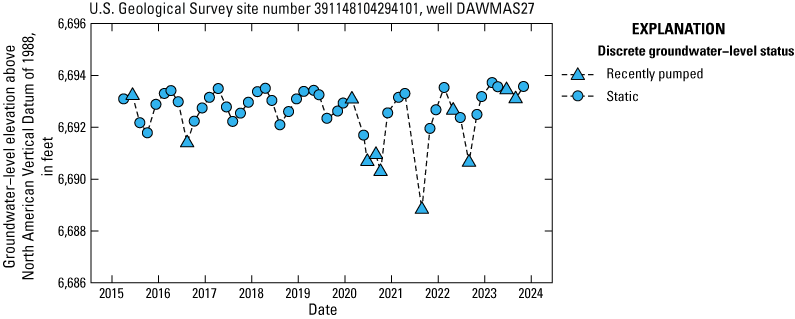
Groundwater-level hydrograph for U.S. Geological Survey site number 391148104294101, well DAWMAS27, Elbert County, Colorado (USGS, 2023). DAWMAS, lower Dawson aquifer well.
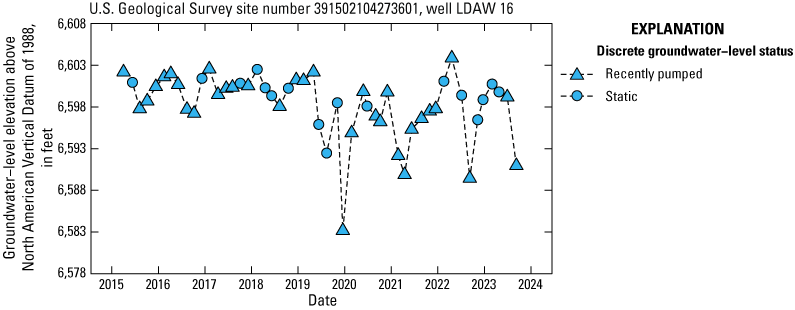
Groundwater-level hydrograph for U.S. Geological Survey site number 391502104273601, well LDAW 16, Elbert County, Colorado (USGS, 2023). LDAW, lower Dawson aquifer well.
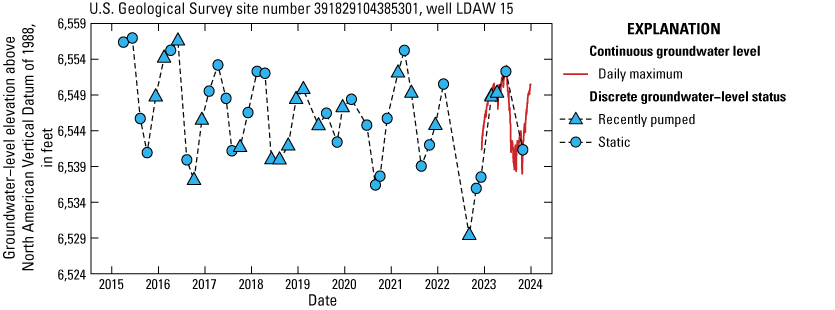
Groundwater-level hydrograph for U.S. Geological Survey site number 391829104385301, well LDAW 15, Elbert County, Colorado (USGS, 2023). LDAW, lower Dawson aquifer well.
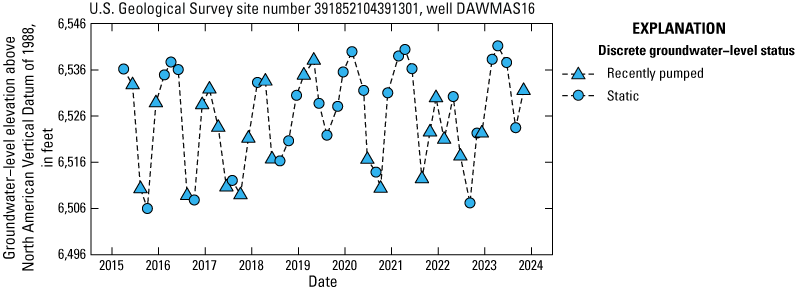
Groundwater-level hydrograph for U.S. Geological Survey site number 391852104391301, well DAWMAS16, Elbert County, Colorado (USGS, 2023). DAWMAS, lower Dawson aquifer well.
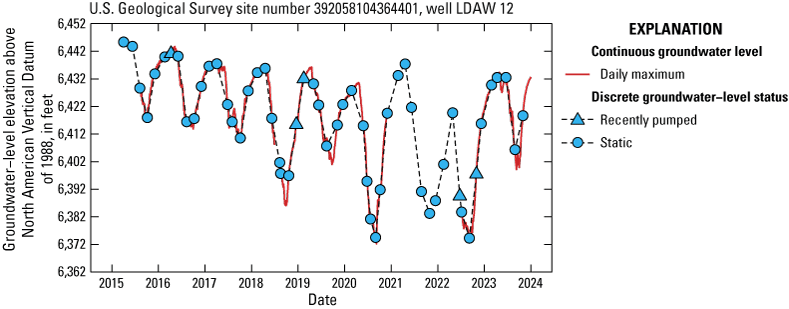
Groundwater-level hydrograph for U.S. Geological Survey site number 392058104364401, well LDAW 12, Elbert County, Colorado (USGS, 2023). LDAW, lower Dawson aquifer well.
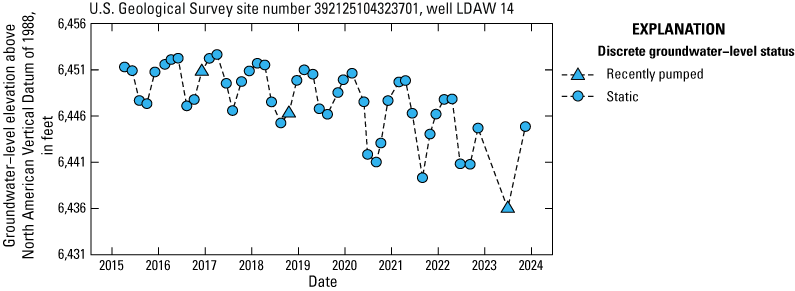
Groundwater-level hydrograph for U.S. Geological Survey site number 392125104323701, well LDAW 14, Elbert County, Colorado (USGS, 2023). LDAW, lower Dawson aquifer well.
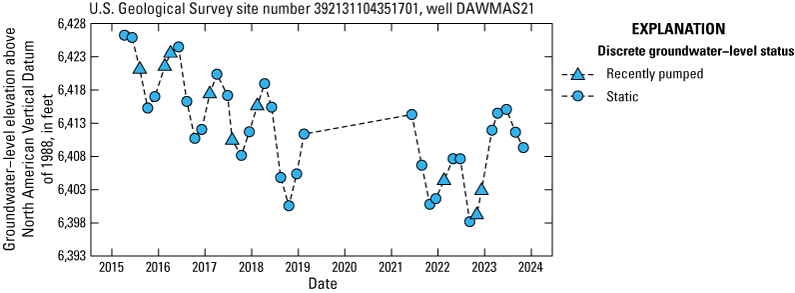
Groundwater-level hydrograph for U.S. Geological Survey site number 392131104351701, well DAWMAS21, Elbert County, Colorado (USGS, 2023). DAWMAS, lower Dawson aquifer well.
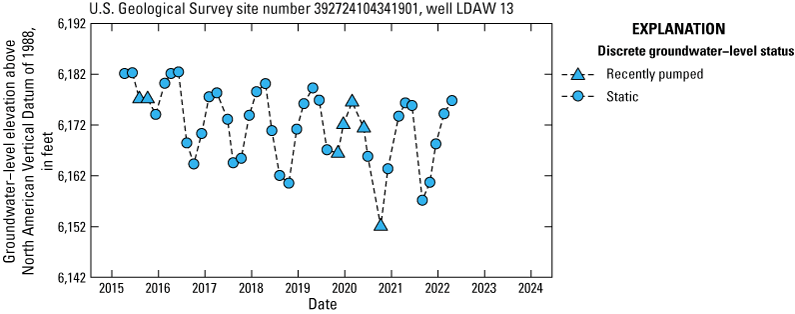
Groundwater-level hydrograph for U.S. Geological Survey site number 392724104341901, well LDAW 13, Elbert County, Colorado (USGS, 2023). LDAW, lower Dawson aquifer well.
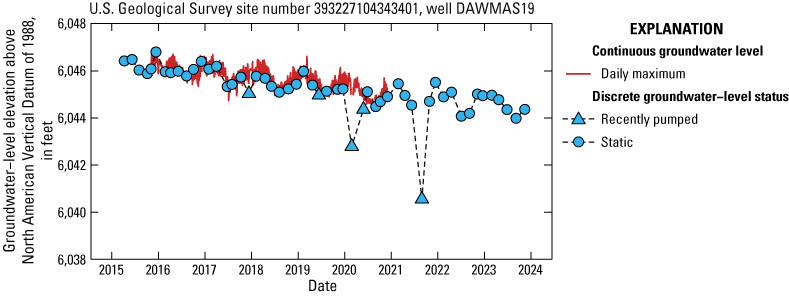
Groundwater-level hydrograph for U.S. Geological Survey site number 393227104343401, well DAWMAS19, Elbert County, Colorado (USGS, 2023). DAWMAS, lower Dawson aquifer well.
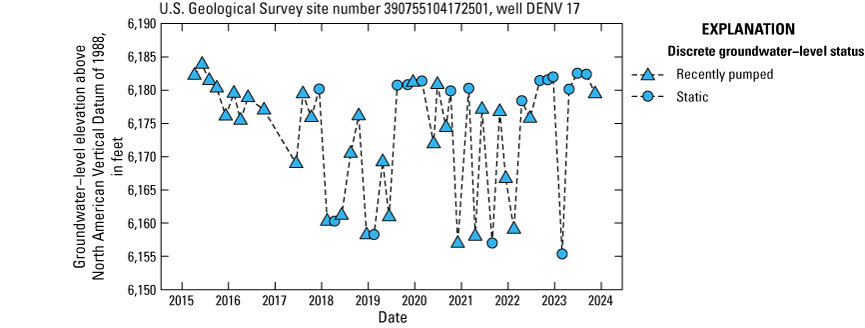
Groundwater-level hydrograph for U.S. Geological Survey site number 390755104172501, well DENV 17, Elbert County, Colorado (USGS, 2023). DENV, Denver aquifer well.
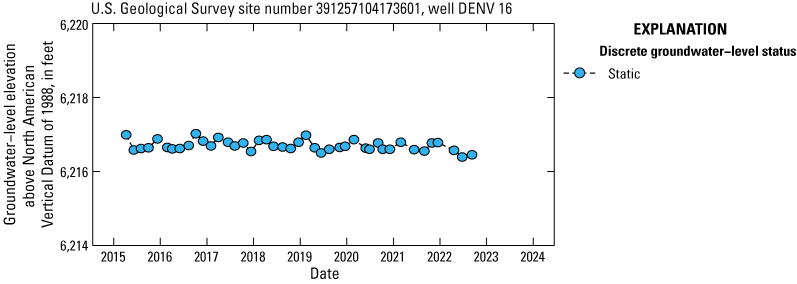
Groundwater-level hydrograph for U.S. Geological Survey site number 391257104173601, well DENV 16, Elbert County, Colorado (USGS, 2023). DENV, Denver aquifer well.
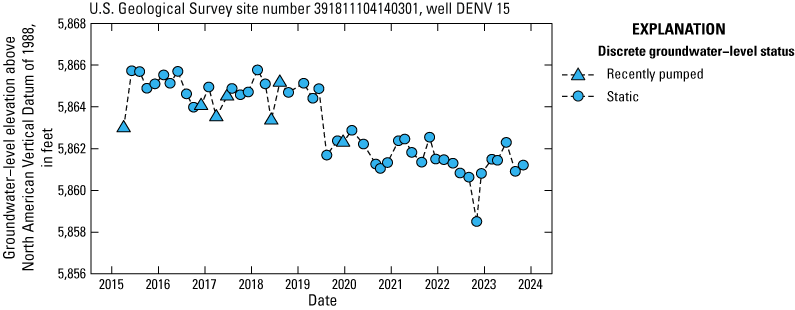
Groundwater-level hydrograph for U.S. Geological Survey site number 391811104140301, well DENV 15,Elbert County, Colorado (USGS, 2023). DENV, Denver aquifer well.
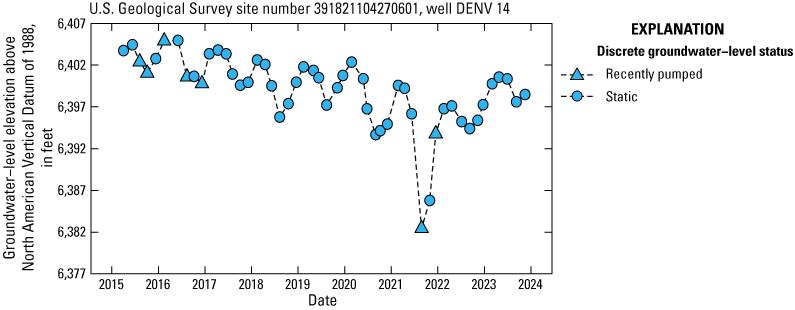
Groundwater-level hydrograph for U.S. Geological Survey site number 391821104270601, well DENV 14, Elbert County, Colorado (USGS, 2023). DENV, Denver aquifer well.
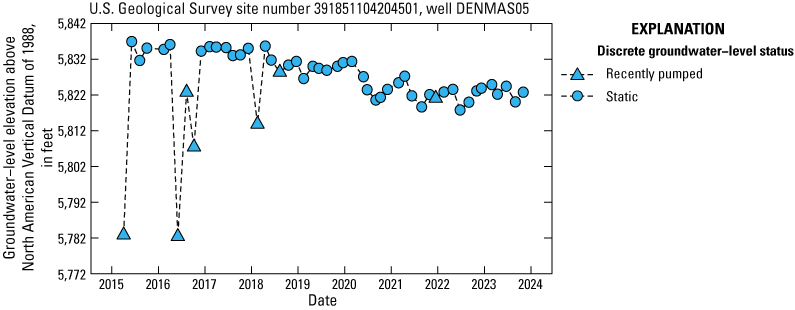
Groundwater-level hydrograph for U.S. Geological Survey site number 391851104204501, well DENMAS05, Elbert County, Colorado (USGS, 2023). DENMAS, Denver aquifer well.
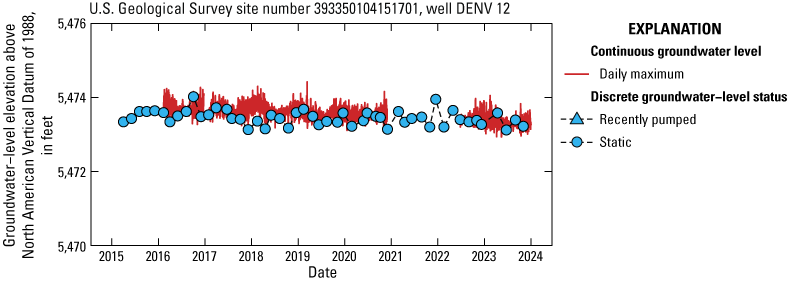
Groundwater-level hydrograph for U.S. Geological Survey site number 393350104151701, well DENV 12, Elbert County, Colorado (USGS, 2023). DENV, Denver aquifer well.
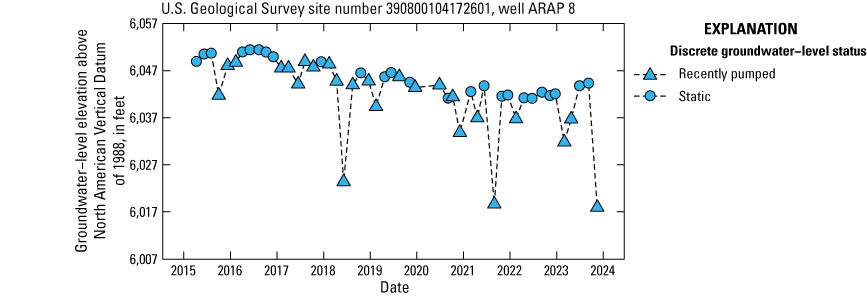
Groundwater-level hydrograph for U.S. Geological Survey site number 390800104172601, well ARAP 8, Elbert County, Colorado (USGS, 2023). ARAP, Arapahoe aquifer well.
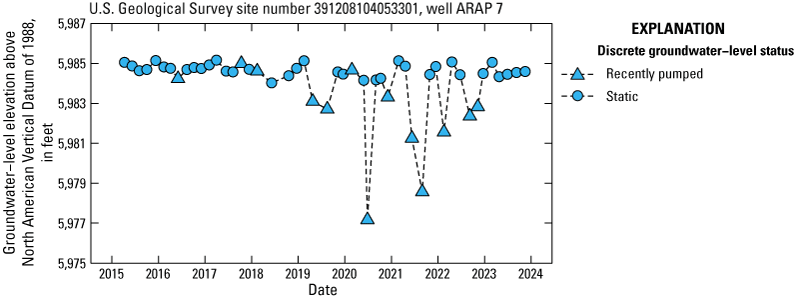
Groundwater-level hydrograph for U.S. Geological Survey site number 391208104053301, well ARAP 7, Elbert County, Colorado (USGS, 2023). ARAP, Arapahoe aquifer well.
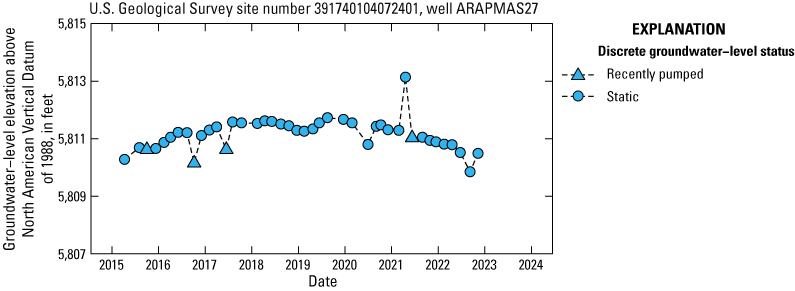
Groundwater-level hydrograph for U.S. Geological Survey site number 391740104072401, well ARAPMAS27, Elbert County, Colorado (USGS, 2023). ARAPMAS, Arapahoe aquifer well.
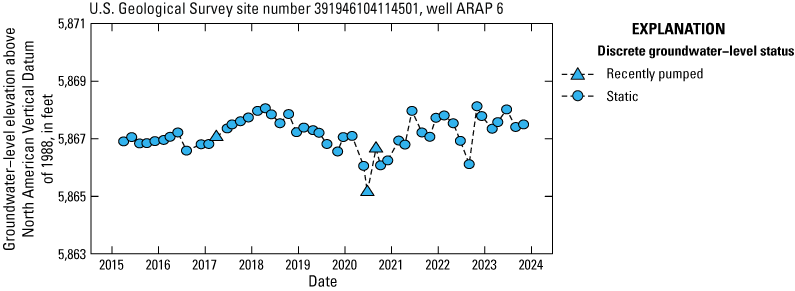
Groundwater-level hydrograph for, U.S. Geological Survey site number 391946104114501, well ARAP 6, Elbert County, Colorado (USGS, 2023). ARAP, Arapahoe aquifer well.
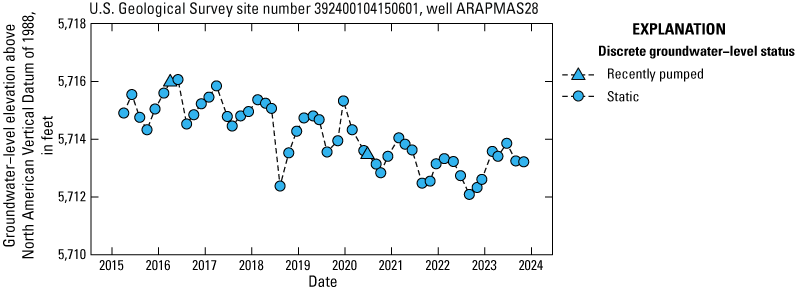
Groundwater-level hydrograph for, U.S. Geological Survey site number 392400104150601, well ARAPMAS28, Elbert County, Colorado (USGS, 2023). ARAPMAS, Arapahoe aquifer well.
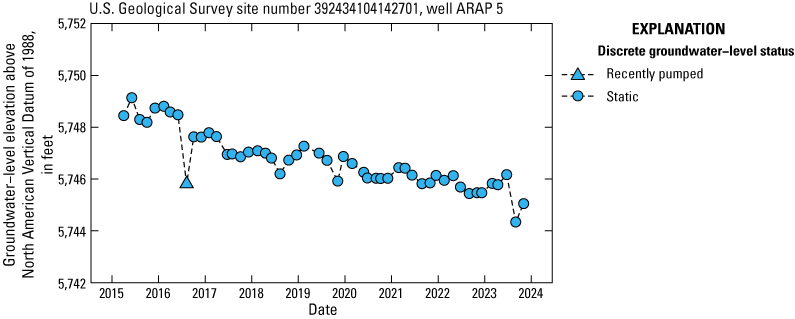
Groundwater-level hydrograph for U.S. Geological Survey site number 392434104142701, well ARAP 5, Elbert County, Colorado (USGS, 2023). ARAP, Arapahoe aquifer well.
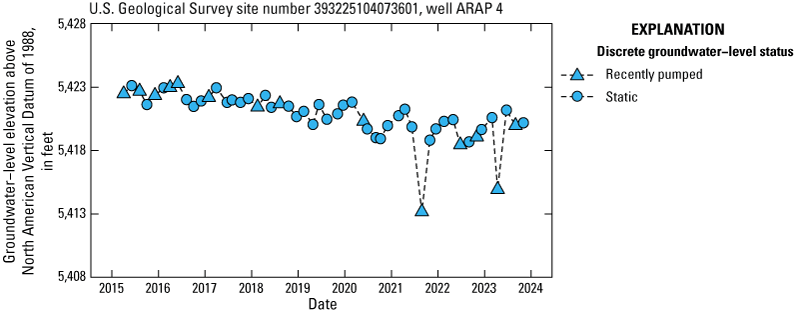
Groundwater-level hydrograph for U.S. Geological Survey site number 393225104073601, well ARAP 4, Elbert County, Colorado (USGS, 2023). ARAP, Arapahoe aquifer well.
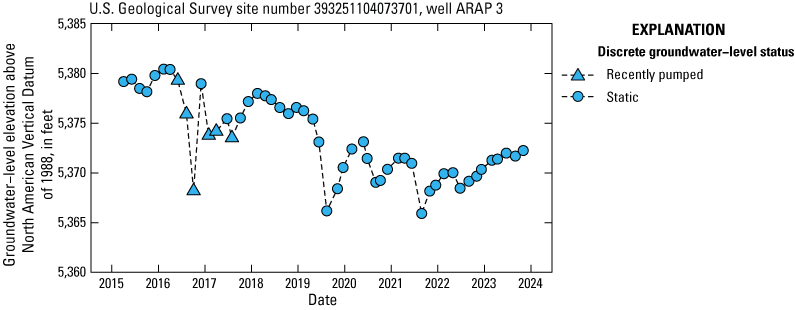
Groundwater-level hydrograph for U.S. Geological Survey site number 393251104073701, well ARAP 3, Elbert County, Colorado (USGS, 2023). ARAP, Arapahoe aquifer well.
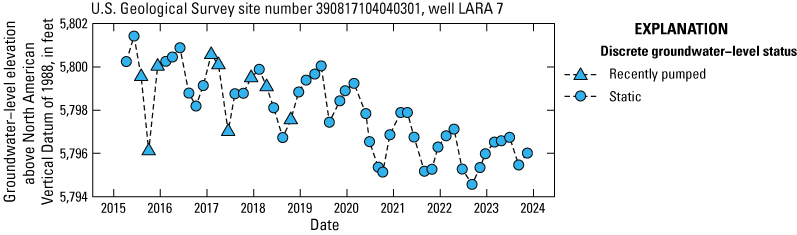
Groundwater-level hydrograph for U.S. Geological Survey site number 390817104040301, well LARA 7, Elbert County, Colorado (USGS, 2023). LARA, Laramie-Fox Hills aquifer well.
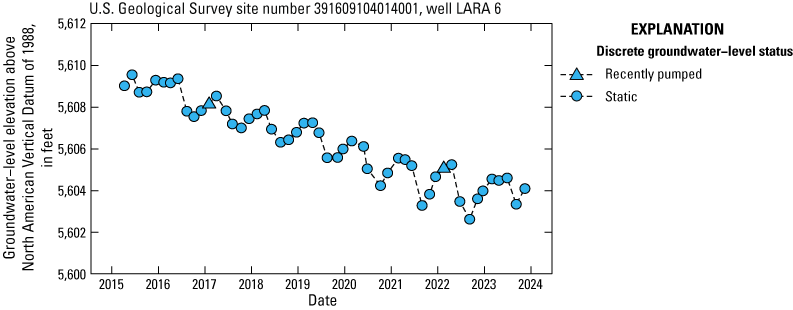
Groundwater-level hydrograph for U.S. Geological Survey site number 391609104014001, well LARA 6, Elbert County, Colorado (USGS, 2023). LARA, Laramie-Fox Hills aquifer well.

Groundwater-level hydrograph for U.S. Geological Survey site number 391621104012001, well LARA 5, Elbert County, Colorado (USGS, 2023). LARA, Laramie-Fox Hills aquifer well.
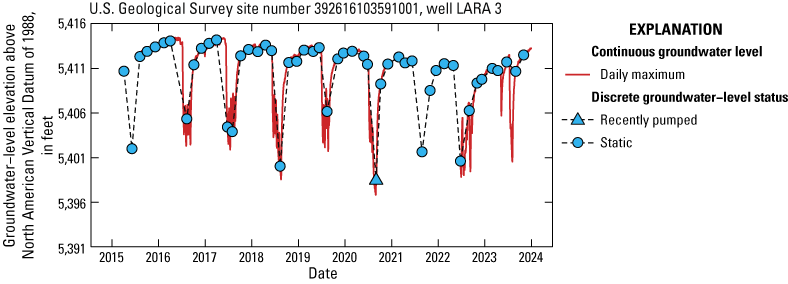
Groundwater-level hydrograph for U.S. Geological Survey site number 392616103591001, well LARA 3, Elbert County, Colorado (USGS, 2023). LARA, Laramie-Fox Hills aquifer well.
References Cited
De Cicco, L.A., Hirsch, R.M., Lorenz, D., Watkins, W.D., Johnson, M., 2024, dataRetrieval: R packages for discovering and retrieving water data available from Federal hydrologic web services, v.2.7.17, accessed January 24, 2024, at https://doi.org/10.5066/P9X4L3GE.
R Core Team, 2018, R: A language and environment for statistical computing (version 4.1.3): Vienna, Austria, R Foundation for Statistical Computing, accessed December 1, 2023, at https://www.R-project.org/.
U.S. Geological Survey [USGS], 2023, USGS water data for the Nation: U.S. Geological Survey National Water Information System database, accessed December 1, 2023, at https://doi.org/10.5066/F7P55KJN.
Appendix 3. Descriptions and Equations of Mann-Kendall Test, Seasonal Mann-Kendall Test, and Theil-Sen Slope Estimate
S
is the test statistic, which estimates the monotonic dependence of y on x;
x
is the rank of time variable, from least to most recent; and
y
is the measured groundwater-level elevation, in feet above North American Vertical Datum of 1988.
References Cited
Helsel, D.R., Hirsch, R.M., Ryberg, K.R., Archfield, S.A., and Gilroy, E.J., 2020, Statistical methods in water resources: U.S. Geological Survey Techniques and Methods, book 4, chapter A3, 458 p., accessed November 2023 at https://doi.org/10.3133/tm4a3. [Supersedes USGS Techniques of Water Resources Investigations, book 4, chapter A3, version 1.1.]
Hirsch, R.M., Alexander, R.B., and Smith, R.A., 1991, Selection of methods for the detection and estimation of trends in water quality: Water Resources Research, v. 27, no. 5, p. 803–813, accessed November 2023 at https://doi.org/10.1029/91WR00259.
Conversion Factors
U.S. customary units to International System of Units
Temperature in degrees Fahrenheit (°F) may be converted to degrees Celsius (°C) as follows:
°C = (°F – 32) / 1.8.
Datums
Vertical coordinate information is referenced to the North American Vertical Datum of 1988 (NAVD 88). Horizontal coordinate information is referenced to the North American Datum of 1983 (NAD 83).
Elevation, as used in this report, refers to distance above the vertical datum.
Abbreviations
α
alpha
ARAP
Arapahoe aquifer well, used in the well common names
ARAPMAS
Arapahoe aquifer well, used in the well common names
bls
below land surface
βss
Theil-Sen slope estimate
CDWR
Colorado Division of Water Resources
DAWMAS
Dawson aquifer well, used in the well common names
DENV
Denver aquifer well, used in the well common names
DENMAS
Denver aquifer well, used in the well common names
LARA
Laramie-Fox Hills aquifer well, used in the well common names
LDAW
Lower Dawson aquifer well, used in the well common names
LSD
land-surface datum
M–K
Mann-Kendall trend test
MP
measuring point NAD 83 North American Datum of 1983
NAVD 88
North American Vertical Datum of 1988
NWIS
National Water Information System
P
pumping affected
p-value
probability value
UDAW
Upper Dawson aquifer well, used in the well common names
USGS
U.S. Geological Survey
x
rank of time variable
y
measured groundwater-level elevation
For more information concerning the research in this report, contact the
Director, USGS Colorado Water Science Center
Box 25046, Mail Stop 415
Denver, CO 80225
(303) 236-4882
Or visit the Colorado Water Science Center website at
https://www.usgs.gov/centers/co-water
Publishing support provided by the Science Publishing Network,
Denver and Reston Publishing Service Centers
Disclaimers
Any use of trade, firm, or product names is for descriptive purposes only and does not imply endorsement by the U.S. Government.
Although this information product, for the most part, is in the public domain, it also may contain copyrighted materials as noted in the text. Permission to reproduce copyrighted items must be secured from the copyright owner.
Suggested Citation
Palko, K.M., Russell, C.A., and Pieseski, N.J., 2026, Groundwater-level elevations in the bedrock aquifers of the Denver Basin aquifer system, Elbert County, Colorado, 2015–23: U.S. Geological Survey Scientific Investigations Report 2026–5115, 41 p., https://doi.org/10.3133/sir20265115.
ISSN: 2328-0328 (online)
Study Area
| Publication type | Report |
|---|---|
| Publication Subtype | USGS Numbered Series |
| Title | Groundwater-level elevations in the bedrock aquifers of the Denver Basin aquifer system, Elbert County, Colorado, 2015–23 |
| Series title | Scientific Investigations Report |
| Series number | 2026-5115 |
| DOI | 10.3133/sir20265115 |
| Publication Date | January 29, 2026 |
| Year Published | 2026 |
| Language | English |
| Publisher | U.S. Geological Survey |
| Publisher location | Reston VA |
| Contributing office(s) | Colorado Water Science Center |
| Description | Report: vii, 41 p.; Database |
| Country | United States |
| State | Colorado |
| County | Elbert County |
| Online Only (Y/N) | Y |