

Erosion Potential and Flood Vulnerability of Streams and Stream Crossings at Acadia National Park, Maine
Links
- Document: Report (7.83 MB pdf) , HTML , XML
- Related Work: Interactive dashboard - Erosion Potential and Flood Vulnerability of Streams and Stream Crossings at Acadia National Park
- Data Release: USGS data release - Data for an erosion potential and flood vulnerability assessment of streams and stream crossings at Acadia National Park, Maine
- NGMDB Index Page: National Geologic Map Database Index Page (html)
- Download citation as: RIS | Dublin Core
Acknowledgments
The authors would like to thank Bill Gawley, Keith Johnston, Karen Anderson, Kathleen Brown, Gail Gladstone, Carriebeth Richards, Marika Savoy, Jason Flynn, Abraham Miller-Rushing, and Chris Barter of Acadia National Park for providing existing data and information and sharing their knowledge during field visits.
The authors would also like to thank Pamela Lombard of the U.S. Geological Survey for her guidance, mentorship, and support.
Abstract
Acadia National Park has had increases in the frequency and magnitude of precipitation in recent years, leading to increased flood flows, stream erosion, and costly infrastructure damage. To improve infrastructure management in a changing climate, the U.S. Geological Survey, in cooperation with the National Park Service, has developed multiple datasets that can help natural resource managers identify stream reaches and stream crossings that have the highest potential for erosion and flood damage within Acadia National Park. To develop these datasets, we first created a lidar-derived hydrography based on a 1-meter digital elevation model and then estimated peak flows at stream crossings and along the stream network using regional regression equations for Maine. We assessed the erosion potential of stream reaches by computing channel morphologic and hydrologic metrics associated with erosive power, such as stream steepness, topographic openness, and percent storage in the contributing watershed. Stream crossing flood vulnerability was assessed by comparing estimated peak flows to stream crossing conveyance capacities. Our results indicate that stream reaches in the headwaters of the Acadia National Park highlands such as Sargent, Penobscot, and Cadillac Mountain, have the highest erosion potential and generally coincide with reaches that have had erosion and infrastructure damage in the past. Stream crossings with the highest flood vulnerability are distributed throughout Mount Desert Island and Acadia National Park, especially south of Jordan Pond, north of Sargent Mountain, and surrounding Eagle Lake. Over a quarter of the total stream crossings have insufficient information to compute flood vulnerability and are often on the parts of the stream with the highest potential for erosion. The datasets allow users to identify stream reaches with the highest erosion potential, stream crossings that are most vulnerable to flood damage, and to highlight areas where supplemental field assessments could most effectively be completed.
Plain Language Summary
The U.S. Geological Survey, in cooperation with the National Park Service, has developed multiple datasets that can help natural resource managers identify stream reaches with the highest potential for erosion and stream crossings most vulnerable to flood damage within Acadia National Park. These datasets allow users to identify areas where supplemental field assessments could be most effectively completed.
Introduction
The magnitude and frequency of extreme rainstorms have increased in the past century throughout the Northeastern United States (Wilks and Cember, 1993; Karl and others, 1995; Groisman and others, 2004; Kunkel and others, 2013; Frei and others, 2015; Hoerling and others, 2016; Collins, 2019), most notably during the past three decades (Huang and others, 2021; Crimmins and others, 2023). Annual rainfall has increased 16 percent in the Northeastern United States from 1895 to 2010 (Gonzalez, 2014), and the recurrence of storm events with precipitation of 8 centimeters or greater over a 24-hour period has increased from once every 2 to 5 years to once per year on average (Wilks and Cember, 1993; Perica and others, 2017). By the end of the century, the Northeastern United States is expected to have a 9.7-percent increase in annual total precipitation (Picard and others, 2023).
Increases in precipitation and subsequent flood flows have exacerbated river erosion and infrastructure damage in Acadia National Park (De Urioste-Stone, 2016; Miller-Rushing and others, 2020). On June 9, 2021, a storm dropped around 13 centimeters of rain in 3 hours in a small area centered on Chasm Brook near Sargent Mountain, which led to erosion and bridge washouts closing 16 kilometers of carriage roads, complete destruction of a segment of the historic Maple Spring Trail, a near total loss of 0.4 kilometers of tread surface materials, and damage to historic stonework (fig. 1; Acadia National Park, 2021). Large quantities of gravel, sand, and cobble eroded from carriage roads were deposited in forests, streams, and wetlands. This storm resulted in $1.5 million in infrastructure repair costs, not including the environmental cost to the surrounding parkland (Acadia National Park, 2021). Although these large storms can result in costly repairs to infrastructure, repairs are often made quickly without time to plan designs that incorporate the best available hydrology from streamflow observations, precipitation data, and models that represent current and future flow scenarios.
The necessity for historic and recently constructed stream crossings to allow stream connectivity, improve passage of aquatic organisms, and provide capacity for increased flows has been identified as a priority by Acadia National Park (2019). Stream crossings refer to the bridges and culverts that allow water to flow underneath trails, roads, and carriage roads. Assessments of stream crossings have been done within park boundaries by Acadia National Park, the State of Maine, and other parties, all collecting different types of data for different purposes, without an overarching, comprehensive database of all stream crossing information (Acadia National Park, 2010, carriage road database by Jeffrey Grey of the National Park Service [Carriage road drainage database can be made available by request from Acadia National Park by contacting the GIS Specialist or Chief of Division of Resource Management at (207) 288-8720.]; Killion, 2025; Killion and Foulds, 2025; Landscape Ecology Lab, 2022; Martin, 2023; Maine Department of Marine Resources, 2023; Navarro, 2008; The Nature Conservancy, 2023; North Atlantic Aquatic Connectivity Collaborative, 2024; Peek and others, 2017; State of Maine, 2023a, 2023b, 2023c7071). Many of these stream crossings are undersized and inadequately accommodate current flow levels, disrupting the natural flow regime and contributing to river instability (Cole-Will, 2015). The clogging of stream crossing inlets with sediment and debris further reduces the conveyance capacity of the crossings, which can lead to the overtopping of flows onto the road and result in washout, road collapse, and complete crossing failure (Gillespie and others, 2014). In addition, inadequate conveyance capacities of stream crossings can increase the outlet stream velocity, causing the outlet to become perched above the water surface through erosion. These mechanisms can cause an environment that is impassable for aquatic organisms (Lehrter and others, 2024) and cause downstream channel instability through incision and bank erosion (Castro, 2003; Nyssen and others, 2002; Olson and others, 2017).
Though localized stream erosion events have been documented in Acadia National Park, no parkwide, comprehensive assessment of the potential for stream erosion or flood damage to infrastructure has been done. This limits the ability of Acadia National Park staff to mitigate future stream erosion, prioritize infrastructure upgrades and repairs, identify anthropogenic drivers of erosion, and anticipate the effects of climate change. Without reliable data, resources, and funding, park managers may resort to replacing infrastructure in kind instead of proactively strengthening or upgrading infrastructure with climate-resilient designs that can both improve passage of aquatic organisms and manage future risk.
Objectives
The purpose of this study is to better understand which stream reaches and associated stream crossings have the potential for erosion and flood damage in Acadia National Park. The study objectives are to (1) assess the relative erosion potential of stream reaches, (2) evaluate the ability of stream crossings to convey estimated peak flows, and (3) evaluate both erosion potential and flood vulnerability at all applicable crossings. An additional objective is to update the existing hydrography from Mount Desert Island using 1-meter resolution lidar. The study results will help Acadia National Park staff prioritize the repair, restoration, or replacement of damaged or failing stream crossings and to develop site-specific management actions for stream reaches affected by extreme storm events (Armstrong and others, 2025).
Study Area
The study area for this project is Acadia National Park on Mount Desert Island. Areas of Mount Desert Island outside of park boundaries were included in some analyses and are indicated in the “Methods” section of this report.
Mount Desert Island is the largest of the islands off the coast of Maine and includes some of the highest mountains on the eastern seaboard of the United States. Acadia National Park encompasses almost 200 square kilometers (km2) of Mount Desert Island, and its glacially sculpted landscape has a unique blend of granitic mountains, forested valleys, lakes, wetlands, and rocky headlands that attract millions of visitors each year (Braun and others, 2016). The park also features a network of historic hiking trails, motor-free carriage roads, scenic roads, and stone culverts and bridges.
The streams in Acadia National Park flow across a landscape that has varying topography, surficial geology (fig. 1), and sediment availability (Braun and others, 2016; National Park Service [NPS] Geologic Resources Inventory [GRI], 2019), and as a result, these streams have variations in channel morphology and fluvial processes. Headwater streams that form in the high-gradient uplands of Mount Desert Island primarily flow across a bedrock streambed bounded by unconsolidated streambanks, where 25 percent or more of the land surface (often composed of soil, glacial, colluvial, or residual materials) is knobs of bare or vegetation-covered bedrock ledge (fig. 1). In the low-gradient valleys and wetlands of Acadia National Park, unconsolidated lithologies increase among the bedrock, and streams often flow across substantial deposits of marine clays, sand, gravel, glacial till, wetland deposits, and alluvium (fig. 1; Braun and others, 2016). However, the exact distribution of consolidated and unconsolidated material along the streams in Acadia National Park is not well constrained because a stream reach could contain a bedrock bed and unconsolidated banks, an unconsolidated bed and bedrock banks, or unconsolidated deposits laden with boulders (Braun and others, 2016; NPS GRI, 2019). Because the morphology, dominant fluvial processes, and pace of erosion can vary substantially between bedrock and alluvial streams (Ferguson and Rennie, 2017; Wohl, 2020), stream reaches in Acadia National Park have a variety of geomorphic, hydraulic, and hydrologic characteristics.
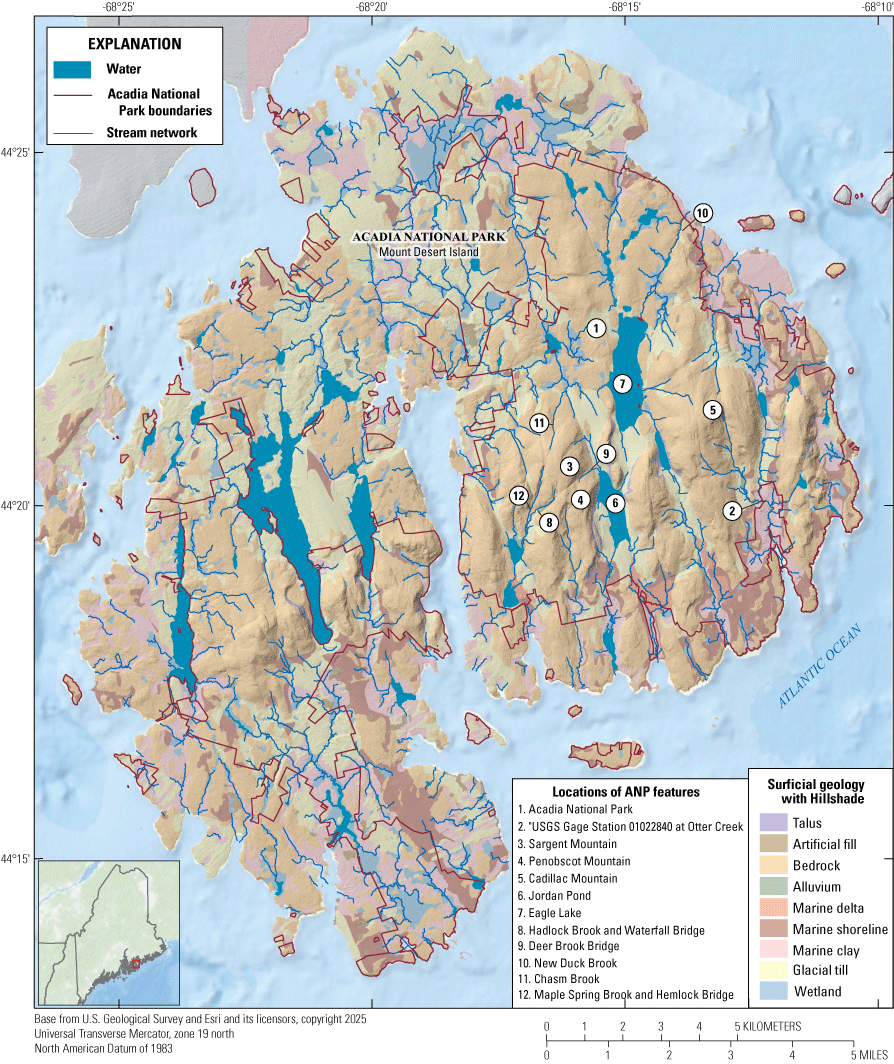
Map showing the stream network, waterbodies, surficial geology (Braun and others, 2016; NPS GRI, 2019), U.S. Geological Survey (USGS) continuous-record streamgaging station Otter Creek near Bar Harbor, Maine (station 01022840) (USGS, 2024), and Acadia National Park boundaries in Mount Desert Island, Maine (Acadia National Park, 2023).
Methods
The methods used to assess erosion potential and flood vulnerability within the park are given in the following sections that cover the development of the hydrography, estimation of peak flows, erosion potential of stream reaches, and flood vulnerability and erosion potential of stream crossings.
Hydrography
The digital elevation model (DEM) used in this study consists of multiple tiles of 3D Elevation Program (3DEP) 1-meter resolution lidar data encompassing the study area and all of Mount Desert Island collected in April of 2022 (U.S. Geological Survey, 2023). A new hydrography dataset was derived from lidar to ensure that the stream network on Mount Desert Island accurately follows the topography and mapped stream crossings (Armstrong and others, 2025).
The DEM was hydrologically enforced (Poppenga and others, 2014) by lowering the DEM elevation along stream centerlines to ensure stream connectivity where the lidar or 2020 orthoimagery indicated a hydraulic connection (for example, through bridges, culverts, beaver dams, weirs) or anywhere where an existing stream crossing was indicated in mapped Acadia National Park stream crossing datasets (Acadia National Park, 2010, carriage road database by Jeffrey Grey of the National Park Service [Carriage road drainage database can be made available by request from Acadia National Park by contacting the GIS Specialist or Chief of Division of Resource Management at (207) 288-8720.]; Killion, 2025; Killion and Foulds, 2025; Landscape Ecology Lab, 2022; Martin, 2023; Maine Department of Marine Resources, 2023; Navarro, 2008; The Nature Conservancy, 2023; North Atlantic Aquatic Connectivity Collaborative, 2024; Peek and others, 2017; State of Maine, 2023a, 2023b, 2023c). The hydrologically enforced DEM was then used to create a flow direction raster (Jenson and Domingue, 1988) and flow accumulation raster using the spatial analysis toolbox in ArcGIS Pro (Esri, 2024). Channel initiation seed points were manually placed at the upstream end of all stream reaches (headwater channels) that had a drainage area equal to or greater than 0.1 km2. These headwater channels, although mostly ephemeral, affect headwater wetland storage and are a major source of sediment and woody debris (Wohl, 2020). Many stream reaches with drainage areas less than 0.1 km2 were not adequately captured by the DEM and, therefore, were not included in this study.
Erosion Potential of Stream Reaches
A stream’s ability to erode and transport sediment is governed, in part, by the amount of energy that flowing water exerts on the bed and banks of a stream, known as stream power (Ω):
where is the density of water in kilograms per cubic meter, is acceleration due to gravity in meters per second squared, is discharge in cubic meters per second, and is the channel slope (unitless) (Bagnold, 1966). Streams are always working to maintain a dynamic equilibrium between stream power and sediment supplied from the landscape (Lane, 1955). Erosion along a stable stream in dynamic equilibrium is accompanied by an equal amount of deposition. Thus, under conditions of a stable hydrologic regime and minimal human activities (such as damming or channelization), the average cross-sectional area of the channel has minimal changes through time (Dunne and Leopold, 1978). However, an increase in stream power resulting from an increase in flood flows () could raise the sediment transport capacity beyond the established sediment load, forcing the stream out of balance. When this happens, the streambed may undergo vertical erosion through channel bed incision, lateral erosion through channel widening, and aggradation until a new equilibrium between stream power and sediment load is established (Lane, 1955; Schumm and others, 1984).
Although the erosive power needed to transport sediment is determined by factors such as sediment load (Lane, 1955; Ferguson and Rennie, 2017), strength, cohesiveness, overall erodibility of the channel bed and bank lithology (Sklar and Dietrich, 2001; Wohl and David, 2008), and bank vegetation (Beeson and Doyle, 1995), measuring these factors across a large study area like Acadia National Park can be labor-intensive and expensive. However, landform-based geomorphic and hydrologic variables related to stream power (eq. 1) can easily be measured through lidar data and leveraged to highlight stream segments with relatively higher erosive power and, therefore, erosion potential. We assessed the relative erosion potential of stream segments by computing the following geomorphic and hydrologic variables: normalized channel steepness (), topographic openness (), and percent storage in the contributing watershed (). We then combined all these metrics from the stream segments into a single ranked Erosion Potential Index (EPI). We applied this methodology to all streams that flow into, out of, and within Acadia National Park boundaries on Mount Desert Island.
To accurately compare the geomorphic characteristics of the streams against the natural variations of the 1-meter DEM, the stream network was split into segments with a maximum length of 10 meters. We defined stream confluences as cutoff points for the stream segments; therefore, stream segments range from 1 meter to 10 meters in length to compensate for uneven distribution of total length in the stream network. We removed stream segments that cross over road decks, embankments, and other infrastructure that does not represent the actual channel elevation in the lidar. We also removed stream segments within ponds, lakes, and tidal reaches because they are non-fluvial; coastal processes are also outside of the scope of this study.
Normalized Channel Steepness
By computing the normalized channel steepness index (), we can infer if a stream segment is unexpectedly steep or gentle when compared to its contributing drainage area. This removes bias towards the naturally steeper headwater streams relative to the more gradual downstream reaches.
Stream power increases with channel slope (eq. 1). The steeper the slope, the higher the erosive energy in the channel. Channel slope, however, decreases as drainage area increases through a power-law relation, which produces the concave nature of a river’s longitudinal profile (Morisawa, 1962). This slope-area relation was normalized with a concavity index (), which describes how quickly channel slope () declines downstream, and a steepness index ( which describes the relative steepness of a stream segment independent of its drainage area ( (Flint, 1974; Howard and Kerby, 1983):
The value of the channel steepness index ( depends on the value chosen for the concavity index (), which has dimensionless units (Gailleton and others, 2021). To compare the steepness index of all stream segments in watersheds of different sizes in Acadia National Park, the steepness index was calculated with a fixed value of , known as the reference concavity index (θref) (Wobus and others, 2006). By using a reference concavity index, the value of the channel steepness index () is normalized with fixed units of . We evaluated the normalized channel steepness at each stream segment by dividing its average channel slope by its drainage area (, in square meters, with an assumed reference concavity (θref) (Wobus and others, 2006):
We assumed a reference concavity (θref) value of 0.425, because this is the median concavity value measured across a wide range of mountainous and upland environments (Gailleton and others, 2021). Therefore, the units of the normalized channel steepness index ( are reported as m0.85, where “m” is meters. We assume that stream segments with higher normalized channel steepness values will also have relatively higher stream power and, therefore, higher erosion potential.
Topographic Openness
The second metric we used to assess the erosion potential of stream segments is topographic openness (), which describes the degree of enclosure of a DEM pixel in a channel (Yokoyama and others, 2002) and has been successfully applied previously to identify potentially eroding channels and those showing characteristics of incision (Metes and others, 2024).
Channels begin to incise (erode vertically into the channel bed) as a response to an increase in stream power (eq. 1) relative to the amount of sediment supplied to the stream. Because of their decreased width/depth ratio and increased hydraulic radius, incised channels are unable to dissipate high-flow energy across the floodplain and thus contain flows of greater recurrence intervals. Furthermore, the vertical incision of incised channel beds results in over-steepened banks prone to collapse (Simon and others, 2000). Therefore, incised channels contain greater shear stress and erosion potential than non-incised channels in similar hydrologic settings (Simon and Rinaldi, 2006; Wyżga and others, 2016). In addition, incised channels with bedrock streambeds cannot further incise vertically and, therefore, must erode laterally into the streambanks to dissipate energy. Eroding banks are a source of sediment loads in streams, which can degrade stream habitat and impair biological and ecological health (Shields and others, 1994; Shields and others, 2010).
We used the “Openness” function from the Whitebox Geospatial Data Analysis Program (Lindsay, 2014) to measure positive topographic openness along channel bottom DEM pixels that intersect with the hydrography-derived stream centerline in each stream segment. We applied a line-of-sight search radius of 50 meters to eight compass directions around each channel bottom DEM pixel. The mean of all eight openness measurements is reported as the value for each DEM pixel. The value for each stream segment is reported as the average value across all intersecting DEM pixels. Topographic openness values greater than 90 degrees represent convex areas that are higher than the surrounding terrain (for example, ridges and peaks), and topographic openness values less than (<) 90 degrees represent concave areas that are lower than the surrounding terrain (for example, valleys and riverbeds). We assumed that positive topographic openness values measured along the stream centerline are constrained by the streambanks. Therefore, topographic openness values will decrease as the degree of channel incision increases. We assumed that stream segments with lower topographic openness values have higher degrees of channel incision, lower width/depth ratios, and contain relatively higher erosion potential.
Percent Storage in the Contributing Watershed
The calculated percent storage in the contributing watershed () was used as the third hydrologic metric to assess the erosion potential of stream segments in Acadia National Park. Drainage basins with higher percentages of storage (wetlands, ponds, and lakes) are associated with smaller flood flows (Lombard and Hodgkins, 2020) and a reduced severity of downstream flooding and erosion through the temporary storage of floodwater (Acreman and Holden, 2013, Lane and others, 2018; Padmanabhan and Bengston, 2001). Because discharge () has a first order control on stream power () (eq. 1), and the percent storage in a contributing watershed () is negatively related to discharge, we assume that stream segments with lower percent storage in their contributing watershed will have relatively higher stream power and therefore higher erosive capability.
The calculated percent storage in the contributing watershed () is based on the U.S. Fish and Wildlife Service National Wetland Inventory geographic information system wetlands coverage (Lombard and Hodgkins, 2020; USFWS, 2019). We computed in watersheds and delineated every 0.1-km2 increase in drainage area along the stream network by dividing the total area of storage (wetlands, ponds, and lakes) by the total drainage area and multiplied the result by 100. Calculated values were then appended to all stream segments within each respective watershed.
Erosion Potential Index
The degree to which each of the three geomorphic and hydrologic metrics (normalized channel steepness (), topographic openness ), percent storage in the contributing watershed affects stream erosion potential is unknown. Therefore, for each stream segment, we applied an equal weight to the values of all three metrics and combined them together into a singular Erosion Potential Index (EPI).
First, we applied a minimum-maximum normalization to each of the three geomorphic metrics, so that the lowest erosion potential value in each metric dataset (lowest value, highest value, and highest value) is assigned a value of 0, the highest erosion potential value in each metric dataset (highest value, lowest value, and lowest value) is assigned a value of 1, and every other value is assigned a proportional decimal value between 0 and 1. The Erosion Potential Index of each stream segment is calculated as the sum of its three normalized geomorphic metrics:
where is the minimum value in each metric dataset, is the maximum value in each metric dataset, is normalized channel steepness, is topographic openness, and is percent storage in the contributing watershed. Stream segments with a higher EPI are expected to have higher erosion potential than segments with a lower EPI.
Flood Vulnerability of Stream Crossings
Undersized stream crossings can result in backwater flooding, erosion of stream banks, overtopping of the crossing, or road failure during a high-flow event. Stream crossings are designed to be able to convey flows of specific recurrence intervals (or annual exceedance probabilities) based on the size and classification of the road. The current (2025) Maine Department of Transportation hydraulic capacity standard is the 100-year flow for stream crossings with spans over 1.5 meters and the 50-year flow for crossings with spans less than 1.5 meters (Maine Department of Transportation, 2024). Before 2015, the hydraulic capacity standard for crossings was the 50-year flow (Hebson, 2015). Some of the crossings within Acadia National Park were constructed in the first half of the 20th century when the roads and carriage roads were originally built, predating any State requirements.
We compiled and used the following published geospatial datasets of stream crossings for this analysis: infrastructure inventories (State of Maine, 2023a, 2023b, 2023c; Acadia National Park, 2010;, carriage road database by Jeffrey Grey of the National Park Service [Carriage road drainage database can be made available by request from Acadia National Park by contacting the GIS Specialist or Chief of Division of Resource Management at (207) 288-8720.]), cultural inventories (Killion, 2025; Killion and Foulds, 2025), climate change vulnerability assessments (Peek and others, 2017), habitat and aquatic organism passage assessments (Navarro, 2008; North Atlantic Aquatic Connectivity Collaborative, 2024; Landscape Ecology Lab, 2022; Martin, 2023; Maine Department of Marine Resources, 2023), and flood risk datasets (The Nature Conservancy, 2023). Each dataset contains attributes specific to the original intended purpose of the dataset. For crossings within the study area and throughout Mount Desert Island, we compiled a subset of these attributes relevant to stream-flood vulnerability, including crossing dimensions, material, condition, and road information.
Duplicate stream crossing point locations were manually merged to ascertain unique crossing locations using site attribute data, and existing data were combined at each point using the “Concatenate” function in the ArcGIS Pro “Calculate Field” tool and the “CONCAT” Excel function, which we then summarized in the output datasets using Excel functions including “MAX” and “IFS” (Esri, 2024). The resulting 1,735 crossings are representative of the stream crossings included in existing datasets and are not comprehensive of all crossings on Mount Desert Island. We manually edited geospatial stream crossing locations to coincide with the intersections of our elevation derived hydrography and Acadia National Park’s roads, carriage roads, or hiking trails within the study area. Across Mount Desert Island, 271 crossings were on the stream network. The remaining 1,464 crossings are not on the stream network because they are on streams outside of the hydrography study area, convey runoff as ditch relief or cross drainage culverts, or convey streams with drainage areas less than 0.1 km2.
Flood Flows
Although precipitation amounts and intensities are increasing at Acadia National Park, little information on how streamflows are responding to changes in precipitation at Acadia National Park is available because Mount Desert Island has only one continuous-record streamgage. To assess the vulnerability of stream crossings to flood flows, peak flows were estimated.
We estimated peak flows for annual exceedance probabilities (AEPs) of 50, 20, 10, 4, 2, 1, 0.5, and 0.2 percent (corresponding to flood recurrence intervals of 2, 5, 10, 25, 50, 100, 200, and 500 years, respectively) at all mapped stream crossings with drainage areas of 0.01 km2 or greater using Maine’s regional hydrological regression equations (Lombard and Hodgkins, 2020). Peaks flows were not computed for the 782 stream crossings with drainage areas less than 0.01 km2 because the hydrography and culvert dynamics are too variable to assess. Flows also were estimated along the stream network at the location of every 0.1 km2 increase in drainage area. The minimum drainage area of the sites used to develop regional regression equations was 0.67 km2; uncertainty of flows estimated at stream crossings and stream segments with drainage areas smaller than 0.67 km2 is unknown.
Statistical peak flows for the U.S. Geological Survey (USGS) continuous-record streamgaging station Otter Creek near Bar Harbor, Maine (station 01022840) (USGS, 2024), were calculated using PeakFQ version 7.5.1 (Flynn and others, 2006) following guidance from England and others (2018) for annual peak discharges from water year 2007 to 2023. The peak flows calculated at the streamgage (01022840; 3.52 square kilometers) were then used to weight the regression-equation derived peak flows for stream crossings and stream segments on Otter Creek that were within 50 percent of the drainage area of the streamgage.
Flood Conveyance Capacity and Flood Vulnerability
To assess the vulnerability of stream crossings to flooding, we compared the stream crossing conveyance capacity to select design flood flows. Crossing attributes were used to compute the cross-sectional area () of the inlet for arch, pipe, and box-shaped crossings. Slopes of the stream crossings were not consistently available, and thus, we assumed that the slope within the crossing structure matched the average stream slope in its vicinity. In these instances, the slope was calculated using the stream segments or areas of highest flow accumulation between 15 and 30 meters from each crossing. A maximum value of 15 percent was used for the slope. Although stream crossing conveyance capacity is governed by multiple complex factors such as the shape, size, and roughness of the structure and its inlet; structure slope; and invert elevations of the inlet and outlet, for this study, we assumed submerged inlet control conditions for all crossings. This simplifying assumption was made due to limited available data from each stream crossing that would be needed for more complex analyses. The submerged inlet control assumption is reasonable because we were particularly concerned with evaluating crossings during high-flow events, where there is a greater likelihood that high head would take place upstream from the crossing and supercritical flow through the crossing. Most stream crossings are designed to operate under inlet control during peak flows (Ballinger and Drake, 1995). To calculate the hydraulic capacity of the stream crossings to convey peak flows, the submerged inlet control capacity equation was rearranged to (Federal Highway Administration, 2012):
where represents the cross-sectional area of the inlet in square meters, represents interior height in meters, represents a unit conversion factor to convert between imperial and metric units, represents the depth from inlet invert to the top of the road in meters, is a slope correction factor (unitless), is the slope (unitless), and and are unitless coefficients based on the inlet type.
We compared the computed conveyance capacity of each stream crossing to peak flows at select recurrence intervals generated for each crossing. The peak flow with the highest recurrence interval able to be passed by the crossing was used to categorize flood vulnerability. Stream crossings able to pass the 100-year peak flow, and thus meet or exceed the MaineDOT hydraulic standard, were designated as “Low” flood vulnerability (Maine Department of Transportation, 2024). Crossings able to pass the 25- to 50-year peak flow were designated as “Medium” flood vulnerability. Crossings able to pass the 5- to 10-year peak flow are designated as “High” flood vulnerability. Crossings unable to pass the 2-year peak flow or only able to pass the 2-year peak flow were designated as “Very High” flood vulnerability.
Erosion Potential at Stream Crossings
Stream crossings along unstable, eroding stream reaches can have additional flood vulnerability. Crossings downstream from reaches with high erosive capacity can have greater risk of bed aggradation from bedload sediment and clogging from wood debris at the upstream end of the crossing, further lowering their conveyance capacity and ability to pass flood flows (Gillespie and others, 2014). These types of obstructions at the upstream end of a stream crossing can raise the upstream water-surface elevation; cause damage and erosion at the structure, road deck, and surrounding embankments; or cause total structure failure. Furthermore, crossings upstream from reaches with high erosive capacity are at greater risk of bed incision and bank erosion at their crossing outlet (Castro, 2003; Nyssen and others, 2002; Olson and others, 2017). Prolonged channel and bank erosion can cause the crossing outlet to become perched over the channel and eventually result in total crossing failure. To account for this additional flood vulnerability, we evaluated the erosion potential of the 271 crossings along the mapped stream network by averaging the EPI of surrounding stream segments within a 100-meter buffer of each stream crossing. The resulting values are reported as the mean EPI at each stream crossing.
Results
Erosion Potential of Stream Reaches
The computed geomorphic and hydrologic variables have a wide range of values across all mapped stream segments in Acadia National Park and Mount Desert Island: drainage areas range from 0.1 to 26.2 km2, channel slope values range from 0 to 82 percent, normalized channel steepness ( values range from 0 to 257 m0.85, topographic openness values range from 55.0 to 91.4 degrees, and percent storage in the contributing watershed values range from 0 to 97.5 percent. Computed peak flows for the 2-year recurrence interval range from <0.1 to 10.6 cubic meters per second, <0.1 to 24.6 cubic meters per second for the 100-year recurrence interval, and <0.1 to 35.1 cubic meters per second for the 500-year recurrence interval.
Erosion Potential Index (EPI) values for the 37,306 stream segments in Acadia National Park range from 0.08 to 2.59 and have an average value of 1.10 and a standard deviation of 0.20. We grouped EPI values into EPI categories based on their deviation from the mean, as shown in table 1.
Table 1.
Erosion Potential Index (EPI) categories and related characteristics for stream segments in Acadia National Park (Armstrong and others, 2025).[%, percent; EPI, Erosion Potential Index; <, less than; >, greater than]
The stream segment with the highest EPI (2.59) is along a waterfall about 20 meters upstream from Chasm Brook Bridge (fig. 2A). Other stream segments in the park with “Very High” EPI values include along a waterfall along Hadlock Brook about 30 meters upstream from Waterfall Bridge (2.38–2.43; fig. 2A), the downstream parts of New Duck Brook (2.18–2.39; fig. 2A), directly downstream from the Sound Drive Bridge over Richardson Book (2.37; fig. 2A, not in Acadia National Park), along the headwaters of Otter Creek along A. Murray Young Path (2.00–2.27; fig. 2A), in the headwaters of Kebo Brook along Gorge Path (2.00–2.17; fig. 2A), along the headwaters of Sargent Brook along Giant Slide Trail (2.16; fig. 2A), and upstream from Hemlock Bridge along Maple Spring Brook and Maple Spring Trail (1.80–2.00; fig. 2D). The stream segment with the lowest EPI (0.08) is in the middle of Big Heath Bog in the southwest part of Mount Desert Island.
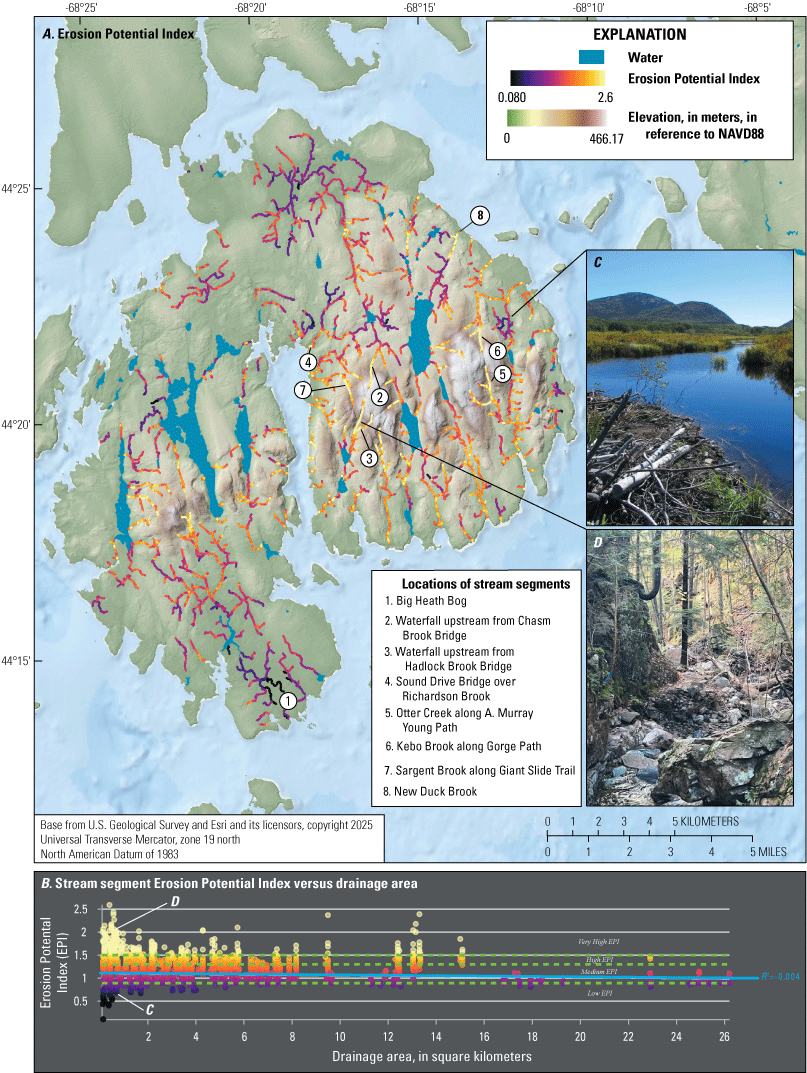
Map showing (A) the computed Erosion Potential Index (EPI) of stream segments in Acadia National Park (Armstrong and others, 2025) and the Erosion Potential Index (EPI) (B) of stream segments compared to their drainage area. Points are colored according to the EPI color scale in figure 2A. Green dashed lines denote the bounds of each EPI category according to table 1. Field photograph (C) along Cromwell Brook in Great Meadow Wetland, Acadia National Park. Photograph courtesy of the National Park Service. Field photograph (D) of Maple Spring Brook and Maple Spring Trail upstream from Hemlock Bridge in Acadia National Park. Photograph courtesy of the National Park Service. R2, coefficient of determination. The elevation of the terrain is in meters, in reference to the North American Vertical Datum of 1988 (NAVD 88).
We assessed the relation between the EPI of the stream segments and the surficial geology of those stream segments (fig. 3; Braun and others, 2016; NPS GRI, 2019). We categorized surficial geology units by substrate characteristics. Stream segments grouped by the “bedrock streambed” category contain bedrock streambeds with streambanks comprised of alluvium, till, or other unconsolidated material. Stream segments with talus contain the highest mean EPI (1.51), followed by artificial fill (1.25; located along roadways and building sites, most likely large stone), bedrock streambed (1.23), and then alluvium (1.20) (fig. 3). Stream segments with a bedrock streambed contain the highest and largest range of EPI values (0.10 to 2.59). The surficial geology categories with the lowest EPI are wetland (ranging from 0.08 to 1.43 and having a mean value of 0.93) and unknown (ranging from 0.06 to 1.57 and having a mean value of 0.93). The unknown geologic category is primarily in the middle of wetland landscapes and is most likely not identified due to limited accessibility in the field.
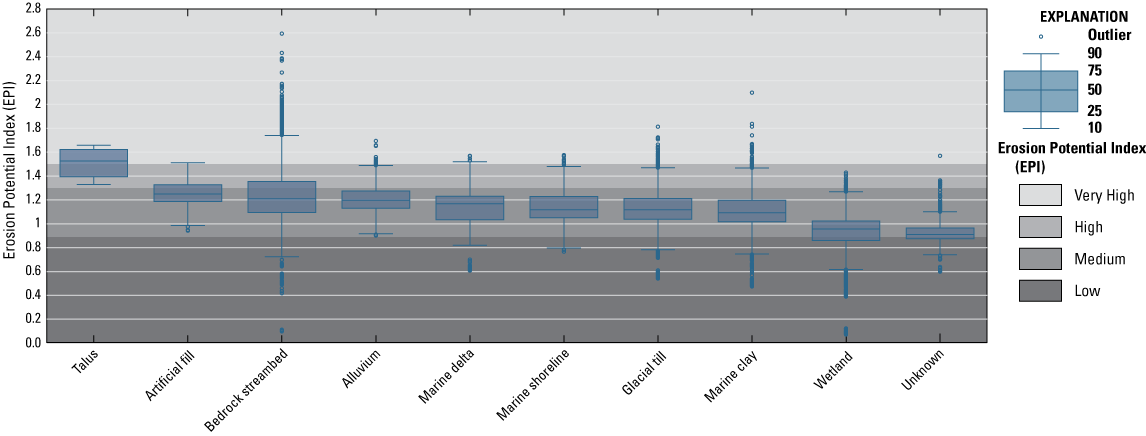
Erosion Potential Index (EPI) of stream segments grouped by surficial geology category (Armstrong and others, 2025; Braun and others, 2016; NPS GRI, 2019). Stream segments grouped under the “bedrock streambed” category contain bedrock streambeds with unconsolidated streambanks. Surficial geology categories are displayed in order of mean EPI, from highest to the left and lowest to the right.
Flood Vulnerability of Stream Crossings
We assessed flood vulnerability at 734 out of 1,735 stream crossings on Mount Desert Island that had sufficient crossing information and drainage areas of 0.01 km2 or greater. Of the 1,001 unassessed crossings, 592 crossings were not assessed because their drainage areas were smaller than 0.01 km2, 219 were not computed due to insufficient information, and 190 were not computed because they did not meet drainage area size and other information criteria. The distribution of crossings by flood vulnerability is represented in figure 4B. Out of the 663 stream crossings computed as “Medium” and “Low” flood vulnerability, 530 of those fall within park boundaries.
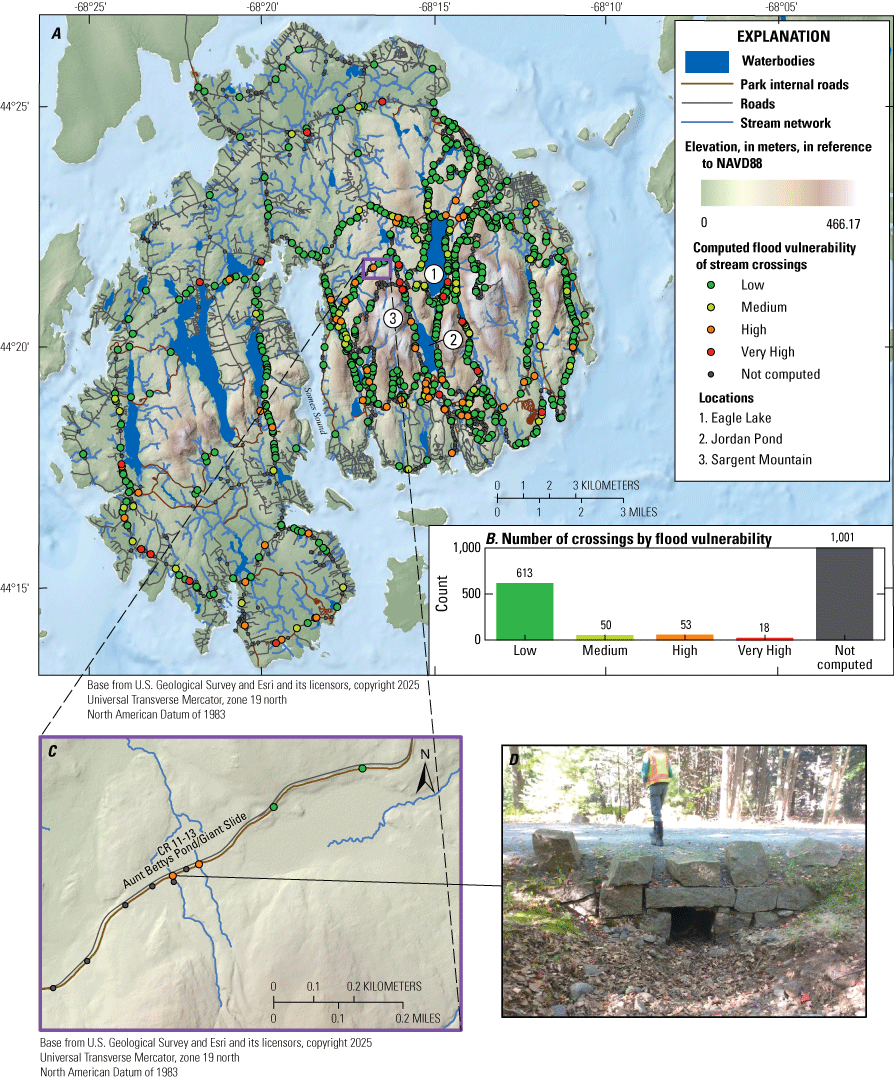
Maps showing the (A) computed flood vulnerability of stream crossings on Mount Desert Island (Armstrong and others, 2025) with roads (U.S. Census Bureau, 2024) and the stream network. (B) Graph showing the distribution of categorized flood vulnerabilities. “Not computed” means stream crossings that were not computed because of insufficient information, small drainage areas, or both. Map showing (C) culverts along Carriage Road 11–13 (CR 11–13), including crossings that are categorized as “Low” and “High” flood vulnerability. Field photograph (D) of the inlet of a small pipe culvert (diameter 0.46 meter) with a stone headwall that was assessed as having “High” flood vulnerability. Photograph courtesy of Maine Department of Marine Resources. The elevation of the terrain is in meters, in reference to the North American Vertical Datum of 1988 (NAVD 88).
Eleven “Very High” vulnerability stream crossings were not able to pass the 2-year recurrence interval peak flow, including four within park boundaries. Figure 4C demonstrates how stream crossing flood vulnerability data can be used. This figure shows a cluster of culverts along Carriage Road 11–13, also referred to as Parkman/Aunt Betty Carriage Road, intersected by unnamed tributaries to Richardson Brook. The two orange stream crossings, indicating a “High” flood vulnerability, are metal pipe culverts with diameters of 0.46 meters, which are only able to pass up to the 10-year and 5-year recurrence interval peak flows, from west to east, respectively. The pipes to the east are the same size; however, because the peak flows are much smaller, they are designated as “Low” vulnerability, demonstrating the need for crossings to be sized according to the flow, rather than constructing them uniformly along a transportation route. As indicated by the attributes derived from the input datasets, these two culverts are captured in an engineering plan set, which could be used by park managers to help determine if planned increases in the size of the “High” vulnerability culverts are sufficient to accommodate the peak flows in that location.
Most mapped stream crossings are on the eastern part of Mount Desert Island. Stream crossings with sufficient information and flows to calculate flood vulnerability are more common on the eastern part of the island. “High” and “Very High” flood vulnerability crossings are common south of Jordan Pond, north of Sargent Mountain, and surrounding Eagle Lake. The average drainage area for stream crossings with “Very High” flood vulnerabilities is 1.85 km2 in comparison with 0.74 km2 for “High,” 0.36 km2 for “Medium,” and 0.49 km2 for “Low” vulnerability stream crossings.
Erosion Potential at Stream Crossings
The distribution of the flood vulnerability and mean EPI of the 271 stream crossings along the mapped stream network is shown on figure 5.
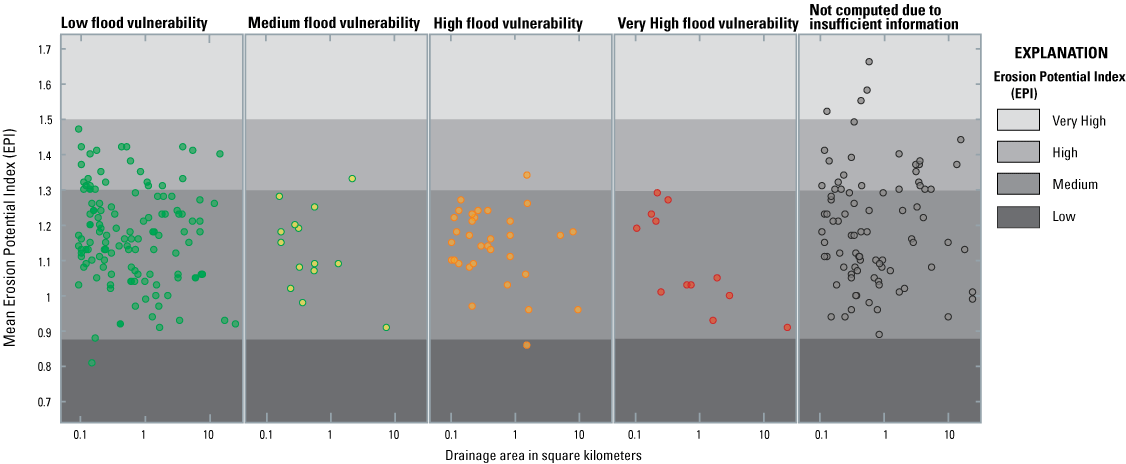
Plots showing the relative mean Erosion Potential Index (EPI) of stream crossings (n=271) in Acadia National Park by flood vulnerability category (Armstrong and others, 2025).
The four stream crossings with “Very High” mean EPI values do not have sufficient information to compute their conveyance capacities and, therefore, flood vulnerability. These stream crossings are Hemlock Bridge along Maple Spring Brook and Maple Spring Trail (mean EPI=1.67), Waterfall Bridge along Hadlock Brook (mean EPI=1.59), Deer Brook Bridge along Deer Brook Trail (mean EPI=1.56), and a stone box culvert on Carriage Road 19–2 (mean EPI=1.53). The masonry carriage road bridges, including Hemlock, Waterfall, and Deer Brook bridges, have unique geometries that require additional information and more complex hydraulic analyses to compute flood vulnerability. Overall, most stream crossings with “High” mean EPI values contain “Low” or unknown flood vulnerability (fig. 5). Although flood vulnerability of stream crossings and mean EPI are not significantly correlated (R2=0.03), most stream crossings, regardless of known or unknown flood vulnerability, contain “Medium” mean EPI values (fig. 5).
Discussion
Our analyses combining lidar-based measurements with existing stream crossing data provide a rapid, cost-effective way of assessing stream reaches for erosion potential and stream crossings for flood vulnerability. Leveraging existing datasets allows the best-available data to be compiled and data gaps to be identified. These datasets allow users to quickly identify stream segments and stream crossings with the highest potential for erosion and flood damage and prioritize locations for additional in-field assessments and infrastructure repair or replacement.
Erosion Potential of Stream Reaches
Whereas most stream segments with “Low” EPI values are in the unconsolidated, low-gradient, unconfined landscapes of Acadia National Park, such as the Great Meadow Wetland (fig. 2C), most stream segments with “Very High” EPI values are in the headwaters of the till-and-bedrock-dominated uplands of Acadia National Park, such as Sargent, Penobscot, and Cadillac Mountains (fig. 2D). These upland reaches of Acadia National Park contain steep channel slopes, high degrees of incision—often down to the bedrock surface, and contributing drainage areas with little to no surface water storage to attenuate flood flows. Many of these stream segments with “Very High” EPI values in the till-and-bedrock-dominated uplands of Acadia National Park, especially those that comprise Maple Spring Brook along Maple Spring Trail, have documented intense stream-bank erosion and infrastructure damage during the June 9, 2021, storm event (Acadia National Park, 2021).
However, sometimes our erosion potential predictions do not represent where erosion took place during recent storm events. For example, some stream segments with “Very High” EPI values, such as those upstream from Chasm Brook Bridge (2.59) and Waterfall Bridge (2.43), are bedrock-dominated waterfalls with near-vertical channel slopes and highly incised banks, yet no erosion has been documented in either of these places during recent storm events. Conversely, downstream along Chasm Brook lies a more gradual stream reach in unconfined alluvium laden with boulders. Here, recent storm events produced substantial erosion even though the reach has “Medium” EPI values (1.16–1.34). These counter examples are expected from our simplified approach to evaluating erosion potential, because the approach excludes important geomorphic considerations to assess erosion vulnerability, such as sediment load, alluvial cover, erodibility of the channel bed and bank lithology, soil cohesion, and bank vegetation. Future efforts could allow for the assessment of erosion vulnerability by including these important characteristics.
In addition, lithology can affect channel geometry because bedrock channels can be naturally steeper and contain lower width/depth ratios than alluvial channels (Buckley and others, 2024; Whitbread and others, 2015) and, therefore, may contain relatively high stream power during a flood event. Because the three geomorphic and hydrologic metrics used in our EPI are primarily associated with stream power, it is reasonable that most stream segments with “Very High” EPI are in steep till-and-bedrock-dominated settings (fig. 3). Furthermore, because the bedrock streambeds in these channels are relatively resistant to erosion, they may limit further incision, forcing the channel to dissipate energy through lateral erosion of the unconsolidated streambanks. Therefore, the potential to erode streambank-sourced sediment and damage infrastructure in these till-and-bedrock dominated reaches is relatively high, making an elevated EPI score worthy of consideration. Although our EPI does not fully assess which locations have a relatively higher tendency to erode, stream segments with “Very High” EPI still contain the highest stream power in Acadia National Park, and any infrastructure in these areas would be relatively more vulnerable.
The geomorphic and hydrologic metrics used to determine the EPI are also not correlated with drainage area (R2 value of −0.004; fig. 2B). Therefore, the three metrics were successful in assessing relative erosive power across a large number of stream reaches with varying drainage areas. Although most stream segments with “Very High” EPI values (average drainage area of 1.1 km2) are in headwater reaches with small drainage areas, segments with similarly “Very High” EPI values are also in downstream reaches with large drainage areas (fig. 2B), such as along Duck Brook (drainage area of 13 km2) and an unnamed stream adjacent to Tremont Road near Seal Cove (drainage area of 12 km2).
Abrupt shifts from relatively low to high normalized channel steepness ( or EPI values may also indicate knickpoints or knickzones (areas along the stream reach with sudden increases in channel slope, such as waterfalls, step pools, alluvial rills, or head cuts) in the stream network. Knickpoints are morphological features formed by changes in factors such as stream power, sediment load, substrate erodibility, or base level, and are particularly unstable and actively incise in the upstream direction until dynamic equilibrium between stream power and sediment load is achieved (Crosby and Whipple, 2006; Whipple and Tucker, 1999; Schumm and others, 1984). A subclass of “knickpoints” in this study is the special case in uplands where the stream has eroded all the unconsolidated material in the channel leaving the stream to flow across a bedrock streambed. Here, the streams can no longer incise, and they must dissipate energy by moving laterally, eroding unconsolidated materials of the streambank. Because of the high channel steepness in these settings, large volumes of material can be eroded quickly (for example, during floods) causing extensive damage to the stream system and infrastructure. Although the pace of upstream incision is largely controlled by the erodibility of the channel bed and bank substrate, infrastructure and natural resources in these unstable bedrock streambed reaches have high potential for erosion and flood damage.
In addition to highlighting stream segments with the highest erosion potential, EPI values can also be used to identify areas of sediment retention in the stream network. For example, stream segments with a relatively lower EPI value may have lower sediment transport capacity than its upstream or downstream counterparts and, therefore, may be more prone to sediment aggradation (Lane, 1955).
Flood Vulnerability of Stream Crossings
The computed flood vulnerabilities of stream crossings on Mount Desert Island can be used to identify what crossings should be prioritized for field assessments, further analyses, and design improvements. Crossings with “Very High,” “High,” and “Medium” flood vulnerabilities may warrant investigation, as do stream crossings that have insufficient information to compute flood vulnerability. To address flood vulnerability, increasing the size of a stream crossing’s opening can increase its capacity to convey flood flows. Increasing crossing openings may also result in additional benefits such as allowing aquatic organisms easier passage through streams.
The results of this study could also be used to prioritize regions or stretches of road to be improved or replaced to enhance stream crossings. Coordinating the replacement of multiple crossings along a road can reduce the costs of design and construction. For instance, Acadia National Park replaced a series of stream crossings on Cadillac Summit Road in 2023 but also made surface improvements to the motor road. Another consideration when evaluating undersized stream crossings is the potential downstream effects of crossing failure, including damage to roads, the waterway, and aquatic and terrestrial ecosystems. Stream crossing attributes compiled as a part of this work can also help inform decision making by park managers.
Erosion Potential at Stream Crossings
Assessing EPI values near stream crossings allows users to consider the flood vulnerability of the stream crossing and the additional erosive capacity risk of the stream. Transportation networks decrease runoff transport time and therefore increase peak discharges (at stream crossings) where stream channels intersect with roads, thus increasing erosive forces at crossings. Stream crossings also constrict flows, which can lead to channel incision downstream and result in sediment deposits upstream. Stream crossings along reaches with relatively high mean EPI values may be more susceptible to floods because of excess aggradation and downstream incision. None of the stream crossings with “Very High” mean EPI values have sufficient information to compute conveyance capacities and associated flood vulnerability. Because of the vulnerability of these structures and the lack of information about them, these crossings could be prioritized for additional data collection and evaluation.
Limitations
The results in this study highlight the relative vulnerability of stream segments and stream crossings in Acadia National Park to erosional processes and flooding using geomorphic and hydrologic variables and publicly available stream crossing data. These results provide a screening-level assessment only—no systematic field verification checks were performed to compare these results with ground conditions. Additional factors that can affect the erosion potential and flood vulnerability of a stream and its stream crossings were not accounted for in this study, including variations in sediment load and alluvial cover (Lane, 1955; Ferguson and Rennie, 2017), erodibility of the channel bed and bank lithology (Sklar and Dietrich, 2001; Wohl and David, 2008), soil cohesion (Lawler and others, 1997), land cover (Hopkins and others, 2019; Liébault and others, 2005), and bank vegetation (Beeson and Doyle, 1995). To determine in situ erosion vulnerability, field data collection of this information would be required. Furthermore, the three geomorphic and hydrologic metrics used to measure the EPI were equally weighted because they are not dependent or derived from each other. To weight these metrics would require calibration from erosion rate measurements, which were not collected. Therefore, our results may not represent the actual contribution that each of the three metrics have on erosion vulnerability; rather, they are more representative of relative erosion potential based on stream power. Overall, this assessment can be used as a first step to identify stream reaches and stream crossings with the highest potential of erosion and flood damage during intense precipitation events.
The methodologies used relied upon existing datasets that are representative of Acadia National Park and Mount Desert Island at the time the data were collected. The lidar data represent the topography of Mount Desert Island at the time it was collected (2021), and the stream crossing datasets represent information collected from 2003 to 2024. Stream crossing datasets were obtained from multiple sources that had varying attributes and precision. Some stream crossings did not have adequate information to compute conveyance capacity, especially crossings on Acadia National Park trails and local roads outside of park boundaries. Some structures, such as the 17 masonry carriage road bridges, have unique geometries that require more complex hydraulic analyses to compute hydraulic capacity and flood vulnerability.
In areas of Mount Desert Island outside of the Acadia National Park study area, hydrography and stream crossing locations were not manually adjusted onto the flow accumulation raster. Hydrography and stream crossings outside of the study area are approximate; and thus, may sometimes appear to have no flow or associated computed flood vulnerability.
Although many streams on Mount Desert Island drain into the ocean, our methodology did not account for the effect of tidal flows or sea level rise on the erosion potential of stream segments and the computed flood vulnerability assessment at stream crossings. Potential effects of climate change, including increases in precipitation frequency, precipitation intensity, and sea level rise were not included in this study.
The study results are also limited by drainage area and the limitations of regional regression equations used to estimate peak flows. Peak flows were not generated for stream crossings with drainage areas less than 0.01 km2, and therefore, flood vulnerability was not computed at these points. The regional regression equations used to generate peak flows were developed using USGS streamgage data for drainage areas greater than 0.67 km2, which should be taken into consideration when evaluating stream segments and stream crossings that have drainage areas below that value. The percentage of storage in the basins used for development of the equations ranges from 0 to 29.4percent, so additional consideration is warranted for watersheds whose percent storage ) values are above this maximum. Furthermore, peak flows estimated for the USGS continuous-record streamgaging station Otter Creek near Bar Harbor, Maine (station 01022840) (USGS, 2024) were around three times larger than peak flows estimated using the regional regression equations for the same location. These regression equations for Maine could underestimate peak flows at other locations in Mount Desert Island; however, additional streamgaging data would be necessary for confirmation.
Conclusions
Streams are dynamic features of the landscape that actively respond to fluctuations in climate through adjustments in their channel morphology and fluvial processes (erosion and aggradation). In contrast, riverine infrastructure, such as culverts, bridges, roads, and trails are static, rigid structures that can affect and be vulnerable to natural stream adjustment processes. In recent years, short-duration, high-volume storms have increasingly resulted in costly emergency repairs to infrastructure and natural resources in Acadia National Park. These repairs, however, often must be done on short notice with little to no time to plan for designs that incorporate best available hydrology to ensure maximum resilience and visitor safety. In this study we assessed the erosion potential of stream reaches by computing channel morphology and hydrology metrics associated with stream power, such as stream steepness, topographic openness, and percent storage in the contributing watershed. Computed peak flows were compared to stream crossing conveyance capacities to assess stream crossing flood vulnerability.
Our results indicate that most stream reaches in the high-gradient, incised headwaters of the Acadia National Park highlands, such as Sargent, Penobscot, and Cadillac Mountains, contain the highest erosion potential. In these reaches, high-gradient streams flowing over bedrock streambeds prevent further incision, causing streams to dissipate energy through lateral erosion of unconsolidated streambanks. These reaches generally have had past erosion, often with associated infrastructure damage. Stream crossings with the highest flood vulnerability are distributed throughout the park and Mount Desert Island, especially south of Jordan Pond, north of Sargent Mountain, and surrounding Eagle Lake. Over a quarter of the stream crossings have insufficient information to compute flood vulnerability, emphasizing the need for additional data. Assessing Erosion Potential Index values near stream crossings highlights infrastructure that is likely undersized on streams with high erosion potential. These areas are the most at risk because of the compounding effects of floods and erosion on infrastructure and ecosystems. Many stream crossings with the highest local mean Erosion Potential Index do not have sufficient information for computing flood vulnerability, which could inform how additional field surveys and data collection are prioritized.
The methodology of combining geomorphic and hydrologic characteristics with existing stream crossing information provides park managers with a cost-effective, park-wide analysis of metrics pertaining to the erosion potential and flood vulnerability of stream reaches and stream crossings in Acadia National Park. The datasets created by following this methodology could help users identify stream reaches and stream crossings with the highest potential for erosion and flood damage and highlight areas where supplemental field assessments could best be used to determine in situ erosion vulnerability and strengthen these results. This methodology can be applied to any region where high-resolution lidar data, flood-flow regional regression equations, and stream crossing data are available.
References Cited
Acadia National Park, 2019, Acadia National Park final transportation plan/environmental impact statement: National Park Service Report, accessed January 17, 2025, at https://parkplanning.nps.gov/document.cfm?documentID=94071.
Acadia National Park, 2021, Road to recovery? Park staff assess and repair storm damaged historic carriage roads and trails (U.S. National Park Service): National Park Service web page, accessed February 11, 2025, at https://www.nps.gov/articles/000/storm-damage-to-roads-and-trails.htm.
Acadia National Park, Pagan, E.S., and Anderson, K., 2023, Park lands & boundary—Acadia National Park: National Park Service webpage, accessed January 5, 2024, at https://irma.nps.gov/DataStore/Reference/Profile/2208300.
Acreman, M., and Holden, J., 2013, How wetlands affect floods: Wetlands, v. 33, no. 5, p. 773–786, accessed November 15, 2024, at https://doi.org/10.1007/s13157-013-0473-2.
Armstrong, I.P., McCallister, M.A., Hyslop, K.M., and Benthem, A.J., 2025, Data for an erosion potential and flood vulnerability assessment of streams and stream crossings at Acadia National Park, Maine: U.S. Geological Survey data release, https://doi.org/10.5066/P1EHZNHN.
Bagnold, R.A., 1966, An approach to the sediment transport problem from general physics: U.S. Geological Survey Professional Paper 422–I, 37 p., accessed November 15, 2024, at https://doi.org/10.3133/pp422I.
Ballinger, C.A., and Drake, P.G., 1995, Culvert repair practices manual—Volume 1: Washington, DC, Federal Highway Administration, accessed March 17, 2025, at https://rosap.ntl.bts.gov/view/dot/58545.
Beeson, C.E., and Doyle, P.F., 1995, Comparison of bank erosion at vegetated and non‐vegetated channel bends: Journal of the American Water Resources Association, v. 31, no. 6, p. 983–990, accessed November 5, 2024, https://onlinelibrary.wiley.com/doi/abs/10.1111/j.1752-1688.1995.tb03414.x.
Braun, D.D., Lowell, T.V., and Weddle, T.K., 2016, Surficial geology of Mount Desert Island: Maine Geological Survey, Open-File Map 16-1, scale 1:30,000, accessed November 1, 2024, at http://digitalmaine.com/mgs_maps/485.
Buckley, J., Hodge, R.A., and Slater, L.J., 2024, Bedrock rivers are steep but not narrow—Hydrological and lithological controls on river geometry across the USA: Geology, v. 52, no. 7, p. 522–526, accessed May 15, 2025, at https://doi.org/10.1130/G51627.1.
Castro, J., 2003, Geomorphic impacts of culvert replacement and removal—Avoiding channel incision: U.S. Fish and Wildlife Service, Portland Office internal guidelines, 19 p., accessed November 1, 2024, at https://www.fs.usda.gov/biology/nsaec/fishxing/fplibrary/USFWS_2003_Geomorphic_impacts_of_culvert_replacement.pdf.
Cole-Will, R., 2015, Rehabilitating stream crossings on historic roads, Acadia National Park, Maine, in Schupp, C.A., Beavers, R.L., and Caffrey, M.A., eds., 2015, Coastal adaptation strategies—Case studies: National Park Service Report 2015, p. 37–38, accessed May 5, 2025, at https://www.nps.gov/subjects/climatechange/upload/Coastal-Adaptation-Case-Studies-508.pdf.
Collins, M.J., 2019, River flood seasonality in the Northeast United States—Characterization and trends: Hydrological Processes, v. 33, no. 5, p. 687–698, accessed November 20, 2014, https://onlinelibrary.wiley.com/doi/epdf/10.1002/hyp.13355.
Crimmins, A.R., Avery, C.W., Easterling, D.R., Kunkel, K.E., Stewart, B.C., and Maycock, T.K., 2023, Fifth National Climate Assessment: Washington, D.C., U.S. Global Change Research Program, accessed April 1, 2025, at https://www.epa.gov/system/files/documents/2023-12/fifth-national-climate-assessment-presentation.pdf.
Crosby, B.T., and Whipple, K.X., 2006, Knickpoint initiation and distribution within fluvial networks—236 waterfalls in the Waipaoa River, North Island, New Zealand: Geomorphology, 82, nos. 1–2, p. 16–38, accessed September 29, 2025, at https://doi.org/10.1016/j.geomorph.2005.08.023.
De Urioste-Stone, S.M., Le, L., Scaccia, M.D., Wilkins, E., 2016, Nature-based tourism and climate change risk—Visitors’ perceptions in mount desert island, Maine: Journal of Outdoor Recreation and Tourism, v. 13, p. 57–65, accessed November 10, 2024, https://www.sciencedirect.com/science/article/abs/pii/S2213078016300032.
Dunne, T., and Leopold, L.B., 1978, Water in environmental planning: Macmillan, 583 p., accessed December 10, 2024, at https://books.google.com/books?hl=en&lr=&id=d7WEkcTNk6EC&oi=fnd&pg=PR13&dq=Dunne+and+Leopold,+1978+water+in+environmental+planning&ots=R9nLrSC2Dt&sig= p9rIkzM83w0-4OtS-KGCTGefi7s#v=onepage&q=Dunne%20and%20Leopold%2C%201978%20water%20in%20environmental%20planning&f=false.
England, J.F., Jr., Cohn, T.A., Faber, B.A., Stedinger, J.R., Thomas, W.O., Jr., Veilleux, A.G., Kiang, J.E., and Mason, R.R., Jr., 2018, Guidelines for determining flood flow frequency—Bulletin 17C (ver. 1.1, May 2019): U.S. Geological Survey Techniques and Methods, book 4, chap. B5, 148 p., accessed February 22, 2025, at https://pubs.usgs.gov/tm/04/b05/tm4b5.pdf.
Esri, 2024, ArcGIS Pro: Esri software release, Version 3.4.3, accessed June 1, 2023, athttps://www.esri.com/en-us/home.
Federal Highway Administration, 2012, Hydraulic design of highway culverts (3d ed.): Hydraulic Design Series No. 5., accessed April 30, 2024, at https://www.fhwa.dot.gov/engineering/hydraulics/pubs/12026/hif12026.pdf.
Ferguson, S.P., and Rennie, C.D., 2017, Influence of alluvial cover and lithology on the adjustment characteristics of semi-alluvial bedrock channels: Geomorphology, v. 285, p. 260–271, accessed October 1, 2014, https://www.sciencedirect.com/science/article/abs/pii/S0169555X16306596?via%3Dihub.
Flint, J.J., 1974, Stream gradient as a function of order, magnitude, and discharge: Water Resources Research, Wiley Online Library, v. 10, no. 5, accessed October 22, 2024, at https://agupubs.onlinelibrary.wiley.com/doi/abs/10.1029/WR010i005p00969.
Flynn, K.M., Kirby, W.H., and Hummel, P.R., 2006, User’s manual for program PeakFQ—Annual flood-frequency analysis using bulletin 17B guidelines: U.S. Geological Survey Techniques and Methods, book 4, chap. B4, 42 p, accessed October 1, 2024, at https://doi.org/10.3133/tm4B4.
Frei, A., Kunkel, K.E., and Adao, M., 2015, The seasonal nature of extreme hydrological events in the northeastern United States: Journal of Hydrometeorology, v. 16, no. 5, p. 2065–2085, accessed November 20, 2024, https://journals.ametsoc.org/view/journals/hydr/16/5/jhm-d-14-0237_1.xml.
Gailleton, B., Mudd, S.M., Clubb, F.J., Grieve, S.W.D., and Hurst, M.D., 2021, Impact of changing concavity indices on channel steepness and divide migration metrics: Journal of Geophysical Research—Earth Surface, v. 126, no. 10, accessed September 9, 2024, at https://agupubs.onlinelibrary.wiley.com/doi/full/10.1029/2020JF006060.
Gillespie, N., Unthank, A., Campbell, L., Anderson, P., Gubernick, R., Weinhold, M., Cenderelli, D., Austin, B., McKinley, D., Wells, S., Rowan, J., Orvis, C., Hudy, M., Bowden, A., Singler, A., Fretz, E., Levine, J., and Kirn, R., 2014, Flood effects on road–Stream crossing infrastructure—Economic and ecological benefits of stream simulation designs: Bethesda, Md., Fisheries, v. 39, p. 62–76, accessed October 25, 2024, at https://doi.org/10.1080/03632415.2013.874527.
Gonzalez, P., 2014, Climate change trends and vulnerabilities in Acadia National Park, Maine: Washington, D.C., National Park Service, accessed on March 18, 2025, at http://www.patrickgonzalez.net/images/Gonzalez_climate_change_Acadia_NP.pdf.
Groisman, P.Y., Knight, R.W., Karl, T.R., Easterling, D.R., Sun, B., and Lawrimore, J.H., 2004, Contemporary changes of the hydrological cycle over the contiguous United States–Trends derived from in situ observations: Journal of Hydrometeorology, v. 5, no.1, p. 64–85, accessed October 15, 2024, at https://doi.org/10.1175/1525-7541(2004)005%3c0064:CCOTHC%E2.0.CO;2.
Hebson, C., 2015, Culvert sizing: Maine Department of Transportation Environmental Office, Design Guidance, accessed March 5, 2025, at https://www.maine.gov/dacf/municipalplanning/docs/TK02A%20MaineDOT-CulvertSizing52115.pdf.
Hoerling, M., Eischeid, J., Perlwitz, J., Quan, X.W., Wolter, K., and Cheng, L., 2016, Characterizing recent trends in U.S. heavy precipitation: Journal of Climate, v. 29, no. 7, p. 2313–2332, accessed November 20, 2024, https://journals.ametsoc.org/view/journals/clim/29/7/jcli-d-15-0441.1.xml.
Hopkins, K.G., Bhaskar, A.S., Woznicki, S.A., and Fanelli, R.M., 2019, Changes in event-based streamflow magnitude and timing after suburban development with infiltration-based stormwater management: Hydrological Processes, v. 34, no. 2, p. 387–403, accessed September 20, 2024, at https://pmc.ncbi.nlm.nih.gov/articles/PMC7006812/.
Howard, A.D., and Kerby, G., 1983, Channel changes in badlands: Geological Society of America Bulletin, v. 94, n. 6, p. 739–752, accessed November 15, 2024, at https://doi.org/10.1130/0016-7606(1983)94%3C739:CCIB%3E2.0.CO;2.
Huang, H., Patricola, C.M., Winter, J.M., Osterber, E.C., and Mankin, J.S., 2021, Rise in Northeast US extreme precipitation caused by Atlantic variability and climate change: Weather and Climate Extremes, v. 33, p. 100351, accessed December 5, 2024, at https://www.sciencedirect.com/science/article/pii/S221209472100044X.
Jenson, S.K., and Domingue, J.O., 1988, Extracting topographic structure from digital elevation data for geographic information system analysis: Photogrammetric Engineering and Remote Sensing, v. 54, no. 11, p. 1593–1600, accessed November 15, 2024, https://citeseerx.ist.psu.edu/document?repid=rep1&type=pdf&doi=06a20725ae38b4dce81951bbb230b197dd346daa.
Karl, T.R., Knight, R.W., and Plummer, N., 1995, Trends in high-frequency climate variability in the twentieth century: Nature, v. 377, no. 6546, p. 217–220, accessed October 15, 2024, https://www.nature.com/articles/377217a0.
Killion, J., 2025, Historic carriage road system: Cultural Landscapes Inventory, Acadia National Park, accessed August 12, 2025, https://irma.nps.gov/DataStore/DownloadFile/733838.
Killion, J., and Foulds, E., 2025, Historic motor road system—Acadia National Park: National Park Service Report, accessed August 12, 2025, at https://irma.nps.gov/DataStore/DownloadFile/739149.
Kunkel, K.E., Karl, T.R., Brooks, H., Kossin, J., Lawrimore, J.H., Arndt, D., Bosart, L., Changnon, D., Cutter, S.L., Doesken, N., and Emanuel, K., Groisman, P.Y., Katz, R.W., Knutson, T., O’Brien, J., Paciorek, C.J., Peterson, T.C., Redmond, K., Robinson, D., Trapp, J., Vose, R., Weaver, S., Wehner, M., Wolter, K., Wuebbles, D., 2013, Monitoring and understanding trends in extreme storms—State of knowledge: Bulletin of the American Meteorological Society, v. 94, no. 4, p. 499–514, accessed December 5, 2024, at https://journals.ametsoc.org/view/journals/bams/94/4/bams-d-11-00262.1.xml.
Landscape Ecology Lab, University of Massachusetts Amherst, 2022, DSL (North Atlantic Region): UMass Amherst web page, accessed September 19, 2023, at http://www.umasscaps.org/data_maps/dsl.html.
Lane, E.W., 1955, Design of stable channels: Transactions of the American Society of Civil Engineers, v. 120, no. 1, p. 1234–1279, accessed November 1, 2024, at https://doi.org/10.1061/TACEAT.0007188.
Lane, C.R., Leibowitz, S.G., Bradley, C.A., LeDuc, S.D., and Alexander, L.C., 2018, Hydrological, physical, and chemical functions and connectivity of non-floodplain wetlands to downstream waters—A review: Journal of the American Water Resources Association, v. 54, no. 2, p. 346–371, accessed November 1, 2024, at https://doi.org/10.1111/1752-1688.12633.
Lawler, D.M., Thorne, C.R., and Hooke, J.M., 1997, Bank erosion and instability, in Thorne, H., Richard, D., and Malcolm, N., Applied fluvial geomorphology for river engineering and management: Singapore, John Wiley & Sons, p. 137–172, accessed June 15, 2025, at http://pascal-francis.inist.fr/vibad/index.php?action=getRecordDetail&idt=6251674.
Lehrter, R.J., Rutherford, T.K., Dunham, J.B., Johnston, A.N., Wood, D.J.A., Haby, T.S., and Carter, S.K., 2024, Effects of culverts on habitat connectivity in streams—A science synthesis to inform National Environmental Policy Act analyses: US Geological Survey Scientific Investigations Report 2023–5132, 21 p., accessed May 1, 2025, at https://doi.org/10.3133/sir20235132.
Lindsay, J.B., 2014, The whitebox geospatial analysis tools project and open-access GIS: Proceedings of the GIS research UK 22nd annual conference, The University of Glasgow, p. 16–18, accessed March 10, 2024, at https://www.researchgate.net/publication/271205138_The_Whitebox_Geospatial_Analysis_Tools_project_and_open-access_GIS.
Liébault, F., Gomez, B., Page, M., Marden, M., Peacock, D., Richard, D., and Trotter, C.M., 2005, Land-use change, sediment production and channel response in upland regions: River Research and Applications, v. 21, no. 7, p. 739–756, accessed January 10, 2025, at https://doi.org/10.1002/rra.880.
Lombard, P.J., and Hodgkins, G.A., 2020, Estimating flood magnitude and frequency on gaged and ungaged streams in Maine: U.S. Geological Survey Scientific Investigations Report 2020-5092, 56 p. [Also available at https://doi.org/10.3133/sir20205092.]
Martin, E., 2023, Aquatic barrier prioritization in the Northeast: The Nature Conservancy web page, accessed September 19, 2023, at https://tnc.maps.arcgis.com/apps/webappviewer/index.html?id=4560e56da44b4095ae45299d37d72993.
Maine Department of Marine Resources, 2023, Maine stream habitat viewer: Maine Department of Natural Resources web page, accessed September 18, 2023, at https://webapps2.cgis-solutions.com/MaineStreamViewer/.
Maine Department of Transportation, 2024, MaineDOT statewide climate change vulnerability assessment: Maine Department of Transportation Summary report, accessed March 5, 2025, at https://climateadvisoryllc.com/wp-content/uploads/2024/10/MaineDOT_Summary-CCVA-Report.pdf.
Metes, M.J., Miller, A.J., Baker, M.E., Hopkins, K.G., and Jones, D.K., 2024, Remotely mapping gullying and incision in Maryland Piedmont headwater streams using repeat airborne lidar: Geomorphology, v. 455, no. 15, accessed September 15, 2024, at https://www.sciencedirect.com/science/article/pii/S0169555X24001557.
Miller-Rushing, A.J., Henkel, B., and Cole-Will, R., 2020, A partnership-based, whole-watershed approach to climate adaptation in Acadia National Park: Parks Stewardship Forum, v. 36, no. 1, accessed June 17, 2024, at https://escholarship.org/uc/item/24p3h7st.
Morisawa, M.E., 1962, Quantitative geomorphology of some watersheds in the Appalachian plateau: Geological Society of America Bulletin, v. 73, no. 9, p. 1025–1046, accessed November 15, 2024, at https://doi.org/10.1130/0016-7606(1962)73[1025:QGOSWI]2.0.CO;2.
National Park Service Geologic Resources Inventory (NPS GRI) Program, 2019, Digital surficial geologic-GIS map of Mount Desert Island and vicinity, Acadia National Park, Maine (NPS, GRD, GRI, ACAD, ACAD digital map) adapted from Maine Geological Survey Open-File Maps by Braun (2016), Braun, Lowell, and Foley (2016), and Braun and Weddle (2016): Lakewood, Colo., National Park Service Geologic Resources Inventory Program, accessed October 1, 2024, at https://irma.nps.gov/DataStore/Reference/Profile/2266084.
North Atlantic Aquatic Connectivity Collaborative, 2024, Stream crossing explorer: North Atlantic Aquatic Connectivity Collaborative web page, accessed December 23, 2024, at https://naacc.org/naacc_search_crossing.cfm.
Nyssen, J., Poeson, J., Moeyersons, J., Luyten, E., Veyret-Picot, M., Deckers, J., Haile, M., and Govers, G., 2002, Impact of road building on gully erosion risk—A case study from the northern Ethiopian highlands: Earth Surface Processes and Landforms, v. 27, no. 12, p. 1267–1283, accessed November 1, 2024, at https://onlinelibrary.wiley.com/doi/10.1002/esp.404.
Olson, J.C., Marcarelli, A.M., Timm, A.L., Eggert, S.L., and Kolka, R.K., 2017, Evaluating the effects of culvert designs on ecosystem processes in northern Wisconsin streams: River Research and Applications, v. 33, no. 5, p. 777–787, accessed January 10, 2025, at https://research.fs.usda.gov/treesearch/54425.
Padmanabhan, G., and Bengtson, M.L., 2001, Assessing the influence of wetlands on flooding: American Society of Civil Engineers web page, p. 1–12, accessed October 20, 2024, at https://doi.org/10.1061/40581(2001)24.
Peek, K., Tormey, B., Thompson, H., Norton, S., and McNamee, J., 2017, Acadia national park coastal hazards & climate change asset vulnerability assessment: Washington D.C., National Park Service, NPS 123/154043, accessed April 17, 2023, at https://irma.nps.gov/DataStore/Reference/Profile/2272110.
Perica, S., Pavlovic, S., St. Laurent, M., Trypaluk, C., Unruh, D., Marting, D., and Wilhite, O., 2017, National Oceanic and Admospheric Administration Atlas 14, Volume 10, Version 3—Point precipitation frequency estimates—Bar Harbon, Maine: National Oceanic and Atmospheric Administration, National Weather Service web page, accessed March 17, 2025, at http://hdsc.nws.noaa.gov/pdfs/pdfs_printpage.html?lat+44.3841&lon=-68.2074&data=depth&units=english&series=pds.
Picard, C.J., Winter, J.M., Cockburn, C., Hanrahan, J., Teale, N.G., Clemins, P.J., and Beckage, B., 2023, Twenty-first century increases in total and extreme precipitation across the Northeastern USA: Climatic Change, v. 176, no. 72, 26 p. 26, accessed September 22, 2024, at https://doi.org/10.1007/s10584-023-03545-w.
Poppenga, S.K., Worstell, B.B., Danielson, J.J., Brock, J., Evans, G.A., and Heidemann, H.K., 2014, Hydrologic enforcement of lidar DEMs: U.S. Geological Survey Fact Sheet 2014–3051, accessed May 1, 2024, at https://doi.org/10.3133/fs20143051.
Schumm, S.A., Harvey, M.D., and Watson, C.C., 1984, Incised channels—Morphology, dynamics, and control: Littleton, Colo., Water Resources Publications, 200 p., accessed November 20, 2024, at https://cir.nii.ac.jp/crid/1130000794023162752.
Shields, F.D., Jr., Knight, S.S., and Cooper, C.M., 1994, Effects of channel incision on base flow stream habitats and fishes: Environmental Management, v. 18, no. 1, p. 43–57, accessed September 25, 2024, at https://link.springer.com/article/10.1007/BF02393749.
Shields, F.D., Jr., Lizotte, R.E., Knight, S.S., Cooper, C.M., and Wilcox, D., 2010, The stream channel incision syndrome and water quality: Ecological Engineering, v. 36, no. 1, p. 78–90, accessed November 20, 2024, at https://doi.org/10.1016/j.ecoleng.2009.09.014.
Simon, A., Curini, A., Darby, S.E., and Langendoen, E.J., 2000, Bank and near-bank processes in an incised channel: Geomorphology, v. 35, nos. 3–4, p. 193–217, accessed on September 26, 2025, at https://doi.org/10.1016/S0169-555X(00)00036-2.
Simon, A., and Rinaldi, M., 2006, Disturbance, stream incision, and channel evolution—The roles of excess transport capacity and boundary materials in controlling channel response: Geomorphology, v. 79, nos. 3–4, p. 361–383, accessed December 15, 2024, at https://doi.org/10.1016/j.geomorph.2006.06.037.
Sklar, L.S., and Dietrich, W.E., 2001, Sediment and rock strength controls on river incision into bedrock: Geology, v. 29, no. 12, p. 1087–1090, accessed October 15, 2024, at https://pubs.geoscienceworld.org/gsa/geology/article-abstract/29/12/1087/191962/Sediment-and-rock-strength-controls-on-river.
State of Maine, 2023a, Locations of bridges along Maine's public roads: Maine Department of Transportation web page, accessed October 23, 2023, at https://www.arcgis.com/home/item.html?id=5c884800d36a44c1872ee7e5f195245f.
State of Maine, 2023b, Smaller culverts that run under state-owned roadways outside State Urban Compact Areas: Maine Department of Transportation web page, accessed October 23, 2023, at https://www.arcgis.com/home/item.html?id=617d6f95e3e947d7a0d8985ddfc028e9.
State of Maine, 2023c, Large culverts that run under state-owned roadways outside State Urban Compact Areas: Maine Department of Transportation web page, accessed October 23, 2023, at https://www.arcgis.com/home/item.html?id=05e65c5a43da4f2ab29b88fb33c20a4b.
The Nature Conservancy, 2023, Culvert flood risk explorer: The Nature Conservancy web page, accessed September 18, 2023, at https://www.maps.tnc.org/maine/culvertfloodriskexplorer/.
U.S. Census Bureau, 2024, Tiger/line shapefiles: United States Bureau web page, accessed July 12, 2024, at https://www.census.gov/geographies/mapping-files/time-series/geo/tiger-line-file.2024.html#form-dropdown-790442341.
U.S. Fish and Wildlife Service [USFWS], 2019, National Wetlands Inventory, accessed October 1, 2024, at https://www.fws.gov/program/national-wetlands-inventory/wetlands-mapper.
U.S. Geological Survey, 2023, USGS 1 meter 19×55y492 ME_MidCoast_2021_B21: U.S. Geological Survey, accessed September 1, 2023, at https://www.sciencebase.gov/catalog/item/6402df2dd34e69298812c3b8.
U.S. Geological Survey, 2024, USGS water data for the Nation: U.S. Geological Survey National Water Information System database, accessed December 2024 at https://doi.org/10.5066/F7P55KJN.
Whitbread, K., Jansen, J., Bishop, P., and Attal, M., 2015, Substrate, sediment, and slope controls on bedrock channel geometry in postglacial streams: Journal of Geophysical Research: Earth Surface, v. 120, no. 5, p.779–798, accessed January 10, 2025, at https://doi.org/10.1002/2014JF003295.
Wilks, D.S., and Cember, R.P., 1993, Atlas of precipitation extremes for the northeastern United States and southeastern Canada: Ithaca, N.Y., Northeast Regional Climate Center, Cornell University Publication no. RR 93–5, 40 p., accessed September 9, 2024, at https://www.nrcc.cornell.edu/services/research/reports/RR_93-5.html.
Whipple, K.X., and Tucker, G.E., 1999, Dynamics of the stream‐power river incision model—Implications for height limits of mountain ranges, landscape response timescales, and research needs: Journal of Geophysical Research: Solid Earth, v. 104, no. B8, p. 17661–17674, accessed September 29, 2025, at https://doi.org/10.1029/1999JB900120.
Wobus, C., Whipple, K.X., Kirby, E., Snyder, N., Johnson, J., Spyropolou, K., Crosby, B., and Sheehan, D., 2006, Tectonics from topography—Procedures, promise, and pitfalls, in Willet, S.D., Hovius, N., Brandon, M.T., Fisher, D.M., eds., Tectonics, climate, and landscape evolution: Geological Society of America, accessed December 5, 2024, at https://doi.org/10.1130/2006.2398(04).
Wohl, E., and David, G.C.L., 2008, Consistency of scaling relations among bedrock and alluvial channels: Journal of Geophysical Research-Earth Surface, v. 113, no. F4, accessed December 10, 2024, at https://agupubs.onlinelibrary.wiley.com/doi/full/10.1029/2008JF000989.
Wohl, E., 2020, Rivers in the landscape: Science and Management, John Wiley & Sons Ltd, accessed September 20, 2024, at https://onlinelibrary.wiley.com/doi/book/10.1002/9781119535409?msockid=24498fafad7464d126cd9a03acf86507.
Wyżga, B., Zawiejska, J., and Radecki-Pawlik, A., 2016, Impact of channel incision on the hydraulics of flood flows—Examples from Polish Carpathian Rivers: Geomorphology—Floods in mountain environments, v. 272, no. 1, p. 10–20, accessed November 15, 2024, at https://doi.org/10.1016/j.geomorph.2015.05.017.
Yokoyama, R., Shirasawa, M., and Pike, R.J., 2002, Visualizing topography by openness—A new application of image processing to digital elevation models: Photogrammetric Engineering & Remote Sensing, accessed May 1, 2024, at https://scholar.google.com/scholar_lookup?title=Visualizing%20topography%20by%20openness%3A%20a%20new%20application%20of%20image%20processing%20to%20d igital%20elevation%20models&publication_year=2002&author=R.%20Yokoyama&author=M.%20Shirasawa&author=R.J.%20Pike.
Datums
Horizontal coordinate information is referenced to the North American Datum of 1983 (NAD 83).
Elevation, as used in this report, refers to distance above the vertical datum.
For information about the research in this report, contact
Disclaimers
Any use of trade, firm, or product names is for descriptive purposes only and does not imply endorsement by the U.S. Government.
Although this information product, for the most part, is in the public domain, it also may contain copyrighted materials as noted in the text. Permission to reproduce copyrighted items must be secured from the copyright owner.
Suggested Citation
Armstrong, I.P., McCallister, M.A., Hyslop, K.M., and Benthem, A.J., 2026, Erosion potential and flood vulnerability of streams and stream crossings at Acadia National Park, Maine: U.S. Geological Survey Scientific Investigations Report 2026–5116, 21 p., https://doi.org/10.3133/sir20265116.
ISSN: 2328-0328 (online)
Study Area
| Publication type | Report |
|---|---|
| Publication Subtype | USGS Numbered Series |
| Title | Erosion potential and flood vulnerability of streams and stream crossings at Acadia National Park, Maine |
| Series title | Scientific Investigations Report |
| Series number | 2026-5116 |
| DOI | 10.3133/sir20265116 |
| Publication Date | February 26, 2026 |
| Year Published | 2026 |
| Language | English |
| Publisher | U.S. Geological Survey |
| Publisher location | Reston, VA |
| Contributing office(s) | New England Water Science Center |
| Description | Report: vii, 21 p.; Data Release |
| Country | United States |
| State | Maine |
| Other Geospatial | Acadia National Park |
| Online Only (Y/N) | Y |
| Additional Online Files (Y/N) | N |