

Stream Sediment Sources in Medicine Creek, Northern Missouri and Southern Iowa
Links
- Document: Report (1.5 MB pdf) , HTML , XML
- Dataset: USGS National Water Information System database - USGS water data for the Nation
- Data Release: USGS data release - Chemical and physical data for sediment source and fluvial target samples for fingerprinting of suspended and bed sediment in Medicine Creek, Missouri and Iowa
- NGMDB Index Page: National Geologic Map Database Index Page (html)
- Download citation as: RIS | Dublin Core
Acknowledgments
The author would like to thank the staff of the U.S. Department of Agriculture Natural Resources Conservation Service who support the farmers of Grundy, Mercer, Putnam, and Sullivan Counties of Missouri. Several of those farmers and landowners provided access for sample collection.
Several U.S. Geological Survey employees provided mentoring or field support, including Allen Gellis and Central Midwest Water Science Center staff in the Lee’s Summit, Rolla, and Iowa City offices. Jennifer Sharpe assisted with report illustrations. Brock Kamrath and Rachel Sortor provided valuable feedback, which improved the report.
Abstract
This report presents the results of a cooperative study by the U.S. Geological Survey and Missouri Department of Natural Resources to quantify sediment transport source contributions in the Medicine Creek drainage basin. Understanding relative source contributions provides valuable information for selecting the conservation practices that may be most effective in reducing sediment and sediment-associated nutrient transport in the Medicine Creek drainage basin and similar areas of the Lower Grand River drainage basin. Sediment samples were collected from potential contributing areas (source samples) and from fluvial-transported samples (target samples). Source sample types included streambanks, row crop fields, and a combined pastures and forests category. Samples were analyzed for particle size and quantity of carbon, nitrogen, stable isotopes of carbon and nitrogen, and 49 mineral elements as potential tracers. Results for the carbon stable isotope ratio of carbon-13/carbon-12 (δ13C) and concentrations of total carbon, total nitrogen, calcium, potassium, and copper were selected by discriminant function analysis as the best combination of multiple tracers to differentiate each source type. The discriminant function analysis poorly differentiated pastures and forests, so these source types were combined. The sources defined by the discriminant function analysis were then used in an unmixing model to apportion sources for each target sample.
In the study area, transported sediment was predominantly bank sediment, with an overall average of 86.9 percent of suspended-sediment samples and depositional streambed samples attributed to bank material. Suspended-sediment samples from the mainstem of Medicine Creek were dominated by bank sediments (average of 95.8 percent), and depositional streambed samples from throughout the drainage basin had more variable source contributions with an average of 71.1 percent attributed to bank material. The relative importance of upland sources (row crop fields and the combined pastures and forests category) varied seasonally and with streamflow but was not related to land use or drainage basin size. Relative contributions from upland sources were greater in the summer through winter rather than spring and during lower streamflow, though this may be driven by the seasonality of streamflow. These results indicate management practices that reduce bank erosion could be effective strategies for managing the dominant source of sediment and sediment-associated phosphorus.
Introduction
Understanding sediment transport in agricultural streams is important because of its ecological effects on stream health and the loss of valuable soil resources from agricultural production. Excess nutrients and sediments in aquatic systems degrade water quality and disrupt aquatic communities and how they function (Rabalais and others, 2002; Bilotta and Brazier, 2008; Femmer, 2011). Nutrient and sediment reduction continues to be a priority within the State of Missouri and nationally because of its effect on local and downstream waters. The Lower Grand River drainage basin (fig. 1) has been identified as a priority for nutrient and sediment reductions by the Natural Resources Conservation Service. Considerable resources are being focused on the drainage basin through the Mississippi River Basin Healthy Watersheds Initiative to reduce nutrient and sediment contributions from agriculture by implementing voluntary conservation practices (Natural Resources Conservation Service, variously dated). These practices aim to protect soils as a valuable resource for crop and animal production while improving the ecological health of streams.
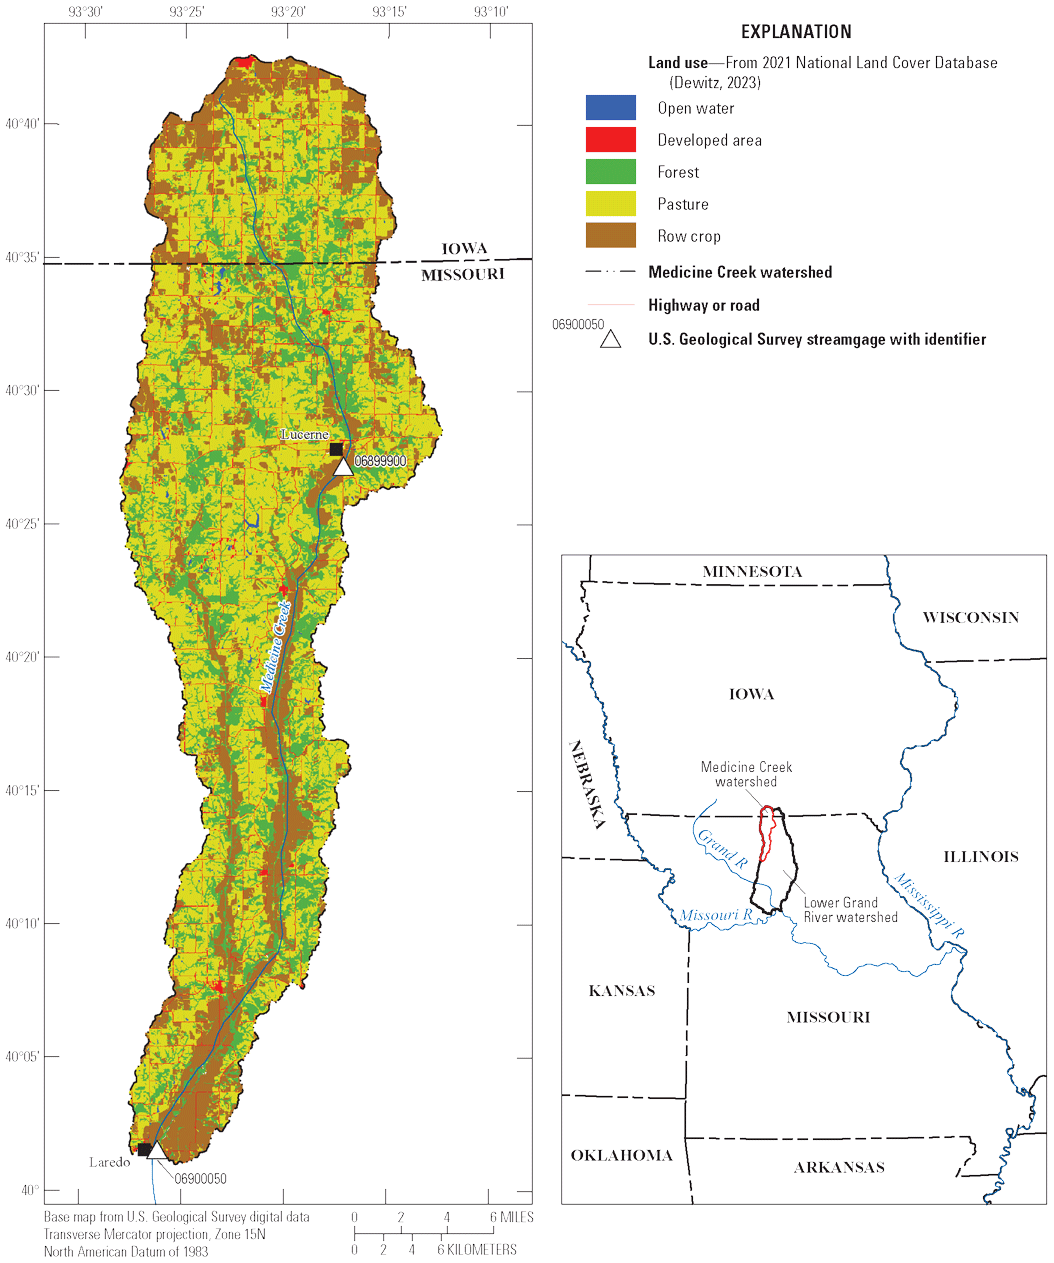
Map showing land use and U.S. Geological Survey streamgages in the Medicine Creek drainage basin.
Agricultural management plans promote a variety of strategies to reduce nutrient and sediment transport in streams across the midwestern United States. However, these strategies are often costly, so identifying the most beneficial management practices to ensure water quality improvements helps inform management decisions. Innovative assessment and monitoring techniques to quantify sources of nutrients and suspended sediment will help to guide management decisions. Identification of the predominate sources of sediment and nutrients, including sediment-associated phosphorus, is important in selecting effective conservation practices. Understanding the proportional contributions of sediment and sediment-associated phosphorus from potential sources, including streambanks, row crop fields, pastures, and forests, would allow land and water managers to select and prioritize management and conservation practices that are effective in reducing nutrients and sediments in waterways. Sediment fingerprinting offers a method of quantifying suspended and depositional sediment sources by identifying a minimal set of properties (or fingerprint) that uniquely defines each source of sediment in the drainage basin (Collins and Walling, 2002; Walling, 2005; Gellis and others, 2016).
Purpose and Scope
The purpose of this report is to describe relative contributions of sediment and sediment-associated phosphorus transported in Medicine Creek, a selected tributary of the Grand River in northern Missouri and southern Iowa, with differentiation among upland and in-stream sources. The study focused on the Medicine Creek drainage basin, which provided a manageable constraint for sediment fingerprinting tools to inform conservation decisions throughout similar areas.
Study Area
The Lower Grand River drainage basin is identified as a priority drainage basin to reduce nutrients and sediment, including sediment-associated phosphorus, as part of the Natural Resources Conservation Service Mississippi River Basin Healthy Watersheds Initiative. In 2010, funding was increased for voluntary conservation practices on agricultural land with the goal of decreasing nutrient and sediment concentrations in the waterways of the Lower Grand River drainage basin while improving infield soil health (Natural Resources Conservation Service, variously dated). The mosaic of mixed land use and topography of this area in northern Missouri and southern Iowa includes pastures, row crops, forests, wetlands, and small developed areas over loess and glacial till with often highly erodible slopes (U.S. Environmental Protection Agency, 2009). The mix of land use in the Lower Grand River drainage basin is highly variable, with, for example, row crops ranging from 4 to 67 percent in individual 12-digit hydrologic unit code (HUC12) drainage basins (Jabbar and Grote, 2019).
This report focuses on the Medicine Creek drainage basin, which includes two U.S. Geological Survey (USGS) streamflow and water-quality streamgages: Medicine Creek at Lucerne, Missouri, (station 06899900) and Medicine Creek near Laredo, Mo. (station 06900050; U.S. Geological Survey, 2024). Streamflow conditions during data collection activities in 2021 and 2022 were somewhat drier than typical, with an average annual runoff of 10.1 and 8.37 inches, respectively, compared to an average annual runoff of 11.4 inches from 2001 to 2020 (U.S. Geological Survey, 2024). Land use in the study area upstream of the sampling site near Laredo, Mo (station 06900050), the more downstream site, is predominantly pastures (50 percent), row crops (23 percent), and forests (19 percent; Dewitz, 2023; table 1). Land-use areas with row crops generally are in valley bottoms or on upland ridges (fig. 1).
Table 1.
Drainage basin characteristics upstream from target sample sites used in sediment fingerprinting model at the Medicine Creek drainage basin in Missouri and Iowa with drainage basin delineation from StreamStats program (U.S. Geological Survey, 2019).[Land use from 2021 National Land Cover Database (Dewitz, 2023); mi2, square mile]
Methods for Data Collection and Computation
Samples were collected in the Medicine Creek drainage basin from March 2021 to June 2022 and were classified as either target or source samples. Target samples were fluvial material representative of sediment transported by streams collected using passive suspended-sediment samplers and from recent depositional streambed areas. Source samples were collected from upland areas with various land uses and from eroding banks along streams. Samples were analyzed for particle size and quantity of carbon, nitrogen, stable isotopes of carbon and nitrogen, and 49 mineral elements (Garrett, 2025). A fingerprint for each source type was identified, and an unmixing model was used to describe the target sample sediment sources by the relative contributions from each source category.
Sediment Sample Collection
Suspended-sediment samples, one type of target samples, were collected using passive-sampler tubes that allow sediment to settle out of the water, accumulating over the deployment period. Passive-sampler tubes (Phillips and others, 2000) were attached to fence posts for typically 6 to 16 days, and material from the 2 to 4 tubes were composited for each site. Passive samplers were deployed near two USGS streamflow and water-quality streamgages at Medicine Creek at Lucerne, Mo. (station 06899900), and Medicine Creek near Laredo, Mo. (station 06900050). Tubes were deployed during a range of streamflow conditions during 2021 and 2022 (fig. 2). The accumulation of material in this type of sampler is time-integrated but also proportional to stream suspended-sediment concentrations and flow velocities. The material in the samplers was much greater if the deployment period included a high-streamflow event and sometimes insufficient for all analyses when no events occurred during the collection period. Passive sampler deployments focused on spring and summer, when streamflow and, consequently, nutrient and suspended-sediment loads are generally higher than the rest of the year (Krempa and Flickinger, 2017). Composited samples were settled, decanted, and transferred to a smaller container for laboratory submission.
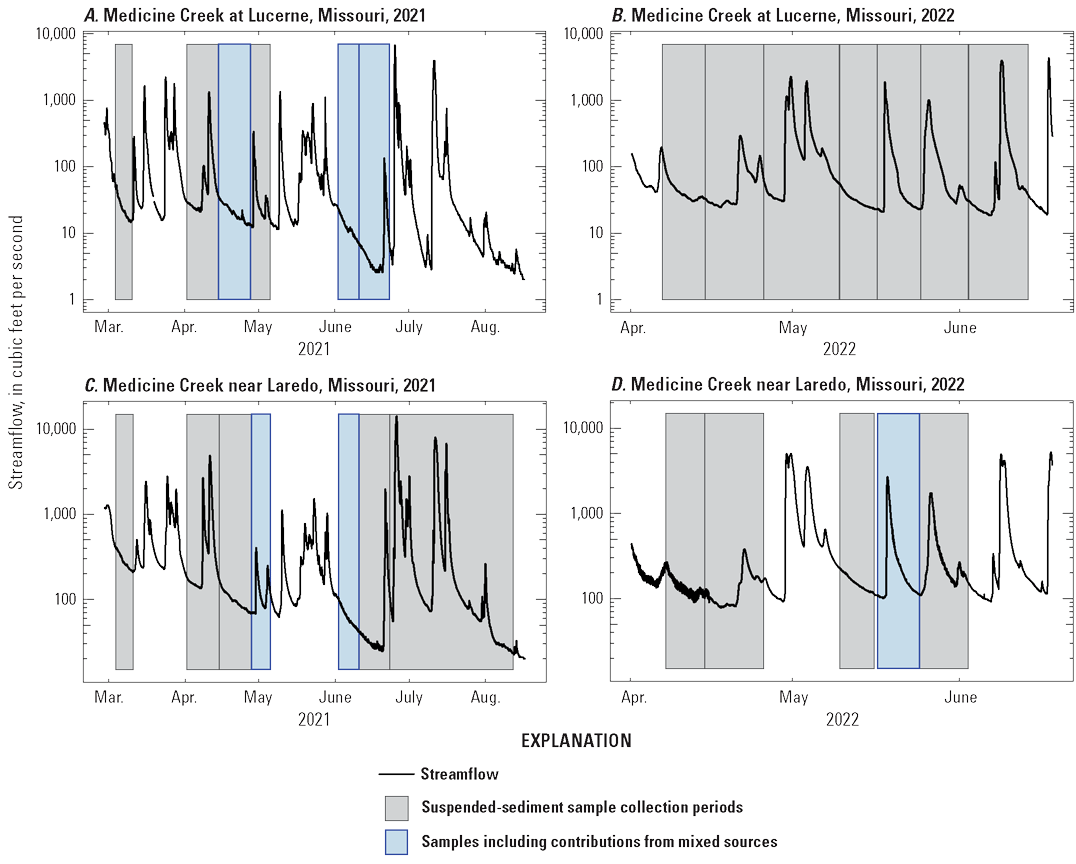
Graphs showing streamflow conditions at the two sampling locations during sediment study sample collection in 2021 and 2022. Collection at Medicine Creek at Lucerne, Missouri (station 06899900) in A, 2021 and B, 2022. Collection at Medicine Creek near Laredo, Missouri (station 06900050) in C, 2021 and D, 2022.
Streambed and bank samples (target and source samples, respectively) were collected as composites along the same stream reach defined as a length 20 times the average wetted width. Stream sites for streambed and bank samples were selected to include reaches near streamgage locations and adjacent to each predominant upland source category: row crop fields, pastures, and forests (McKay and others, 2012; U.S. Environmental Protection Agency, 2012; Dewitz and U.S. Geological Survey, 2021). Streambed samples were collected as a composite of five locations in or adjacent to the wetted stream channel, targeting recent deposition areas of fine-grain material, if present. Though not explicitly suspended-sediment material, the targeted sampling method yields principally recently transported material. Bank samples were collected as scrapes of the outer one-half inch of material from the water to the top of the bank, compositing samples from 3 to 6 bank locations along the reach, including both sides of the stream, avoiding depositional areas, and spacing sample locations at least one average channel width apart. Streambed and bank samples were collected during consistent low flow conditions, needed for wadable access to the stream, from March to December 2021.
Upland source samples were selected from row crop fields, pastures, and forests among participating landowner parcels. The top 1 inch of soil was composited from multiple locations along a linear transect. The transect line was set to exclude areas near the edge of the field or tract, away from edge rows or fence lines, running from uphill to downhill, to intersect potential differences in soil types including ridges, slopes, gullies, and flats. For row crop fields, subsamples were also chosen to include various parts of the crop row, such as the ridge, furrow, or track from seed drilling or fertilizer knifing application, where these features were evident. Upland samples were collected during April, June, November, and December 2021 for ease of access before or after crops were growing.
Samples were kept chilled prior to laboratory analysis for particle size, mineral composition, carbon and nitrogen concentrations, and stable isotopes. Samples were first processed at the USGS Central Midwest Water Science Center Sediment Laboratory, Iowa City, Iowa, by wet sieving using nylon 63-micrometer sieves, separating the fines material from the rest of the sample. The fines material was dried and split by pipette method for further size analysis and submission to other laboratories (Guy, 1969). Elemental analysis at AGAT Laboratories, Mississauga, Canada, included 49 minerals (Taggart, 2002). Carbon and nitrogen analysis at Reston Stable Isotope Laboratory, Reston, Virginia, included total concentrations and stable isotope ratios of carbon and nitrogen (Révész and others, 2012).
Sediment Fingerprinting Unmixing Model
The relative contributions of the sediment derived from different sources in the study area were assessed using the USGS Sediment Source Assessment Tool (Sed_SAT; Gorman Sanisaca and others, 2017). This software tool performs the computational steps required to identify the sediment fingerprint for each source type and then to apportion sediment contributions in target samples.
Identifying the fingerprint for each source type requires evaluation for various corrections and required statistical assumptions before using a linear discriminant function analysis (DFA) to characterize each source type (fig. 3). The model was evaluated for particle size corrections, transformations of individual variables for normality, and outlier effects. Correction for organic content was not used for this study, and imputation for non-detect values was not needed. Outliers greater than three times the standard deviation from the mean were carefully evaluated and only removed if they appeared to bias the model. For example, if removing an outlier resulted in a DFA that no longer included the tracer that was causing the sample to be flagged as an outlier, that outlier was removed. Outliers were retained if they were needed to allow the model to pass the bracket test for that tracer, a rough test for conservative tracer behavior. Overall, four outliers were removed, one outlier was retained, and two additional samples were excluded because they were missing size data. Excluded tracers were either heavily censored (many non-detect values) or the tracer was excluded rather than removing samples identified as outliers for these tracers.
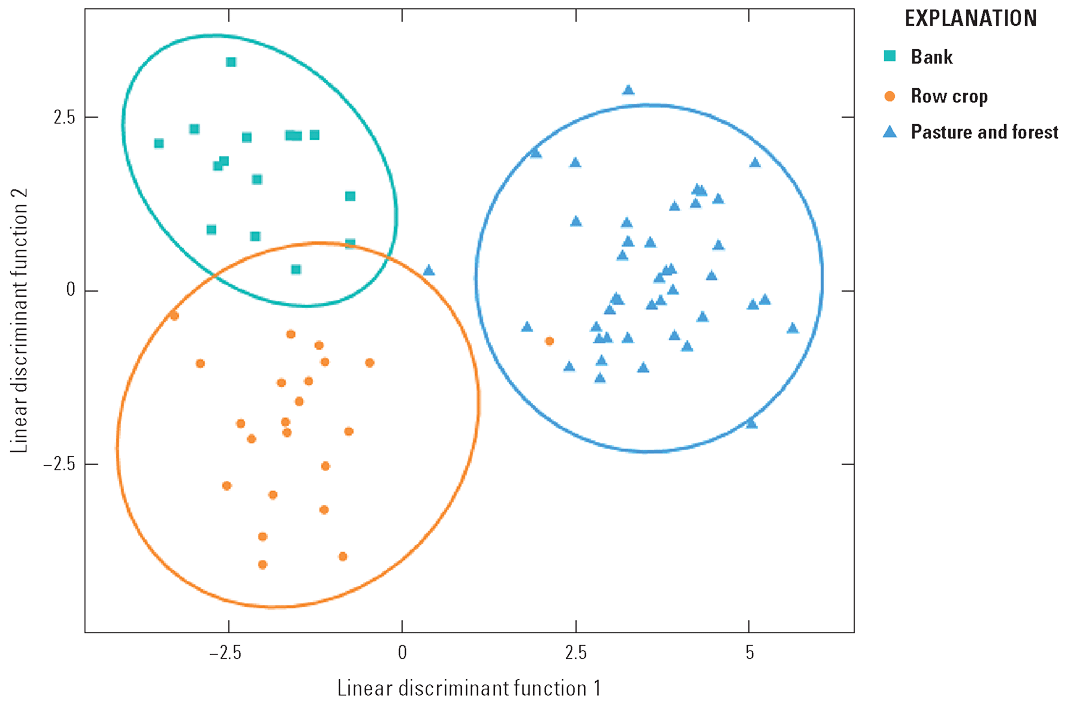
Graph showing linear discriminant function biplot and separation of source categories.
The Sed_SAT software then uses the source characterization from the DFA in an unmixing model to define relative contributions for each source type in target samples. A Monte Carlo simulation, randomly removing one sample from each source group at each iteration, was used to validate the DFA model and to compute model error statistics. The unmixing model was also applied to source samples, to verify the source samples were correctly identified. Sources that were not consistently attributed as the majority of the correct source type were evaluated to reclassify source categories. The final model included a combined category for pasture and forested upland sources because these categories were not well differentiated.
Summary of Sediment Sample Data
The most effective tracers for discriminating among source types were the carbon stable isotope ratio of carbon-13/carbon-12 (δ13C) and concentrations of total carbon, total nitrogen, calcium, potassium, and copper. These tracers along with sediment size and mineral phosphorus concentrations are summarized in table 2. Individual sample results including additional analytes for source and target samples are available in the accompanying data release (Garrett, 2025).
Table 2.
Summary of samples used in sediment fingerprinting model at the Medicine Creek drainage basin in Missouri and Iowa. [—Left][Min, minimum; Max, maximum; D50, median particle size; δ13C, carbon stable isotope ratio of carbon-13/carbon-12]
Fluvial Sediment and Phosphorus Apportioning by Source Type
Sediments transported in Medicine Creek and sampled tributaries were primarily derived from bank erosion, with an average of 86.9 percent of all target samples (suspended and streambed) attributed to bank material (table 3). Of the 25 suspended samples collected near two USGS streamgages, 6 had source contributions other than bank material (figs. 2 and 4). The unmixing model apportioned suspended samples as an average of 95.8 percent from bank material (table 3). The maximum amount of an individual suspended sample apportioned to any upland category was 36.2 percent from the row crop source category (Garrett, 2025; fig. 4). Apportioning of streambed samples was more variable, with an average of 71.1 percent attributed to bank material (table 3). Individual streambed samples were completely apportioned to bank material for 7 of 14 samples, but 3 streambed samples were apportioned to less than 50 percent bank material, with the remaining as at least 50 percent derived from row crop and (or) pasture and forest upland sources (Garrett, 2025; fig. 4). The differences between suspended and streambed source contributions reflects combined differences in methods, sites, and timing of collection. On average, 9.9 and 3.2 percent of all target samples were attributed to row crop or the combined pasture and forested upland sources, respectively (table 3). Apportioning of suspended and streambed samples was also assessed for patterns related to streamflow, season, and land use.
Table 3.
Average source contribution percentage by source type for samples in the Medicine Creek drainage basin in Missouri and Iowa.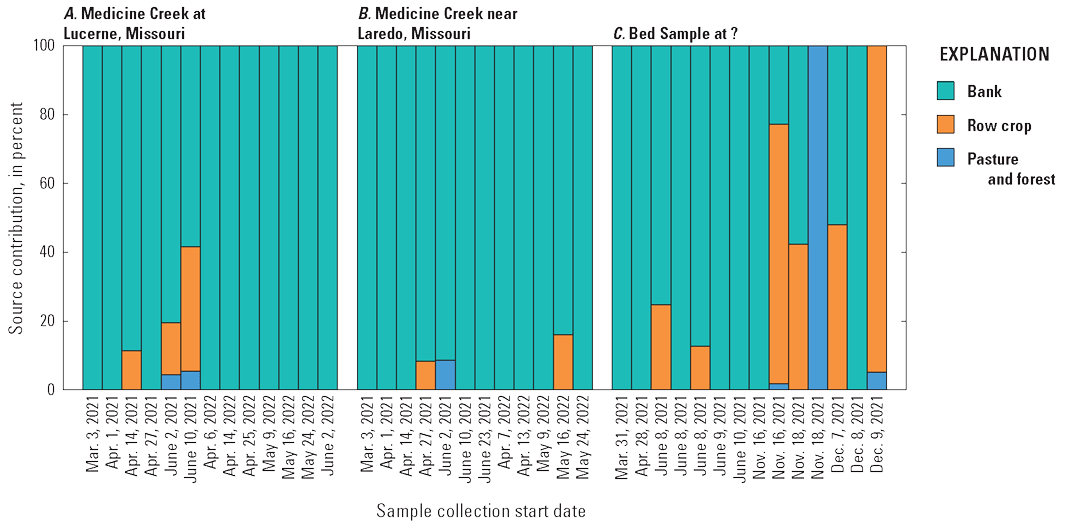
Graph showing source contribution percentage by source type of target samples. A, Suspended-sediment samples from Medicine Creek at Lucerne, Missouri (station 06899900). B, Suspended-sediment samples from Medicine Creek near Laredo, Missouri (06900050). C, Streambed sediment samples collected throughout drainage basin.
Suspended samples collected over a range of streamflow conditions did indicate some patterns related to streamflow. The suspended samples with mixed sources—samples with some upland source contributions rather than entirely bank contributions—tended to have lower streamflow during the collection period than samples attributed entirely to the bank source (figs. 2 and 4). Because material collected in the samplers disproportionately represents material transported during high streamflow events in the deployment period, samples with an event during the deployment generally represent the event. Although the passive samplers aggregate the sample throughout the deployment period, material accumulated is proportional to velocity and to stream suspended-sediment concentrations, which are generally much greater during high streamflow events than during low or falling streamflow conditions not near the event peak; however, the proportion was not quantified. Streamflow statistics for the six suspended samples that included contributions from upland sources were statistically lower than other suspended samples for the minimum, maximum, average, and range (t-test probability values [p-values]=0.039, 0.013, 0.006, and 0.014, respectively; R Core Team, 2023; U.S. Geological Survey, 2024).
Apportioning of suspended and streambed samples also revealed seasonal patterns, though sampling was not distributed through all seasons for a robust assessment of seasonality. Data from suspended samples collected from March through August indicated that mixed-source samples (rather than entirely bank-derived material) tended to be later in the sampled part of the year (t-test on suspended sample start day of year, p-value=0.050). Passive sample collection focused on spring through summer because these seasons generally had greater streamflow, but the covariance between streamflow and seasonality may obscure the importance of both. Of the 14 streambed samples collected from March to December 7 had mixed-source contributions, and 5 of the 7 mixed-source samples were collected in November and December (fig. 4). Comparing differences in streambed samples with seasonality provides context but is not a strong indicator alone because streambed samples were collected once from each location. Contributions to individual streambed samples were up to 94.9 percent from croplands and 100 percent from pastures and forests (fig. 4; Garrett, 2025). Though the bank source dominates overall, the relative contribution of upland sources was increased in summer through winter and during lower streamflow conditions rather than in the spring. Overall suspended-sediment transport is generally related with streamflow, which is typically greatest from March to June in this drainage basin (Krempa and Flickinger, 2017; U.S. Geological Survey, 2024), further emphasizing the importance of bank dominated sediment source contributions.
Streambed samples collected throughout the drainage basin did not show evident patterns relating source characterization to land use or drainage area (table 1; Dewitz, 2023). The strongest correlation between land use and source characterization was weak (coefficient of determination=0.24) and not significant (p-value=0.078) between the relative drainage area percentage of pasture and the percentage of bank source (Garrett, 2025). This relation between pastureland use and percentage of bank source was positive, which is consistent with banks in pasture areas, commonly with animal access to streams, being more erodible than other land-use types. Generally, the differences in source contributions between passive and streambed samples (95.8 versus 71.1 percent bank material, respectively; table 3) may partially reflect site differences in drainage area because passive samplers were deployed at large mainstem sites, but the range of streambed samples included small first-order streams with less mobile banks; however, the strongest correlation between drainage area and source characterization of streambed samples (bank source) was also weak and not significant (coefficient of determination=0.20, p-value=0.11).
To evaluate if the source samples were correctly identified, the unmixing model was also applied to source samples. Though the unmixing model error analysis showed excellent characterization of the bank source samples, the upland source categories were more often confounded with, or partially attributed to, other sources. Pasture and forest sources were poorly differentiated from each other, so samples were combined as a single source category. The average percentage of source contribution for the combined pasture and forest category was 72.0 percent in the final model (table 3), compared to approximately 55 and 48 percent for source contributions individually from pasture and forest, respectively, in a preliminary model without these source types combined. On average 93.2 percent of bank samples were apportioned to bank material. Cropland source samples on average were 59.1 percent characterized as from the row crop source and 30.9 percent from the bank source. Pasture and forest samples were on average 72.0 percent characterized as from the correct source category, but 24.9 percent from the row crop source (table 3). The source sample error analysis indicates that where misclassification errors occur among source categories, the misclassification is generally for land-use categories that are adjacent in the landscape, between bank and row crop, and between row crop and the combined pasture and forest categories (fig. 1). Misclassification errors are least likely between the bank and combined pasture and forest categories. The overlap between source categories is also illustrated by the separation in the DFA (fig. 3). Although the error analysis indicates some uncertainty in differentiating bank and other sources in some target samples, the relatively small misclassification errors would not change the conclusion that stream-transported sediments are primarily derived from bank erosion.
Although the fingerprinting results apportion sediment sources, where phosphorus transport is associated with suspended sediment, some general inferences can also be applied to phosphorus sources. Differences in phosphorus sample collection and analytical methods allow a partial comparison between data from water samples and sediment samples in this study, but the comparison indicates mineral phosphorus—the form described in the sediment samples collected for this study—is an important contribution to particulate phosphorus transport in Medicine Creek. Water samples collected during the study period had an average of 1,140 milligrams per kilogram (mg/kg; particulate phosphorus concentration relative to suspended-sediment concentration) and a maximum water-sample concentration of 3,810 mg/kg (U.S. Geological Survey, 2024) at Medicine Creek at Lucerne, Mo. (station 06899900), and Medicine Creek near Laredo, Mo. (station 06900050). Mineral phosphorus concentrations from this study ranged from 331 to 1,340 mg/kg for all source and target samples. Although the mineral form of phosphorus analyzed for sediment samples in this study is an important component of phosphorus transport, it does not account for dissolved and labile particulate phosphorus, which are additional important components of phosphorus transport in streams.
Similar to other studies (for example, Fitzpatrick and others [2019]), phosphorus concentrations (summarized in table 2) in fluvial-transported target sediments (suspended and streambed samples) were higher than the source material (found to be primarily from banks in this study; table 3). Although phosphorus concentration ranges were similar (table 2), the average concentrations for suspended and streambed samples were 719 and 745 mg/kg, respectively, but the average concentration in bank samples was 538 mg/kg (Garrett, 2025). Additional research has indicated the greater phosphorus concentrations in fluvial-transported sediments can result from dissolved phosphorus sorbing to sediments during transport (Williamson and others, 2024). Although sediment-associated phosphorus in Medicine Creek may be derived from many of the same sources as the sediment, dissolved phosphorus sources and transport may be another important component of sediment-associated phosphorus.
Management practices that reduce bank erosion will likely affect the largest contributing source of sediments and sediment-associated phosphorus transported in the study area. Though management practices designed to limit erosion from upland sources are valuable for in-field effects on soil health for pastures and croplands, they affect a smaller portion of the sediment being transported in streams in the Medicine Creek drainage basin than practices designed to limit bank mobilization. Practices to reduce dissolved phosphorus sources and transport may also affect sediment-associated phosphorus transport. Sediment phosphorus concentrations were greater for upland source categories (row crops, pastures, and forests) than bank sources (table 2); however, with the observed seasonal and streamflow patterns in upland contributions, management practices that control upland erosion particularly in the autumn and during low streamflow conditions may be an important additional component of drainage basin phosphorus management. Overall, practices that focus on reducing bank erosion will affect sources with the greater contributions to stream sediments and particulate phosphorus than practices for managing agricultural fields or forests.
Summary
Conservation practices for managing sediment and sediment-associated nutrients are important tools for protecting soils and managing stream health. To effectively use management practices to reduce suspended sediment in streams, fingerprinting analysis provides an approach for quantifying the proportional contributions of sediment from potential sources in a drainage basin. The results of this study in the Medicine Creek drainage basin in Missouri and Iowa will help land and conservation managers, including the project cooperator, the Missouri Department of Natural Resources, choose the most effective strategies throughout similar areas of the Lower Grand River drainage basin.
Sediment samples from streams and potential upland sources were collected in 2021 and 2022. Samples were analyzed for particle size and quantity of carbon, nitrogen, stable isotopes of carbon and nitrogen, and 49 mineral elements. Suspended sediment was collected using passive sampler tubes deployed during a range of conditions near two streamflow and water-quality streamgages in Medicine Creek at Lucerne, Missouri (U.S. Geological Survey station 06899900), and near Laredo, Mo. (U.S. Geological Survey station 06900050). Streambed and bank samples were collected as composites along the same reaches to represent depositional and erosional areas, respectively. Upland samples were collected from areas of predominant land-use types: row crop fields, pastures, and forests.
The sediment fingerprinting model uses linear discriminant function analysis to identify the best selection of multiple tracers to define the characteristics for each source type. An unmixing model was then used to apportion relative contributions from each source to target samples. The most effective tracers for the discrimination function were the carbon stable isotope ratio of carbon-13/carbon-12 (δ13C) and concentrations of total carbon, total nitrogen, calcium, potassium, and copper.
The results of the discriminant function analysis and unmixing model indicated that the sampled sediments transported in the Medicine Creek drainage basin were predominantly derived from bank sources, with an average of 86.9 percent of suspended-sediment and depositional streambed samples attributed to bank material. Suspended-sediment samples were particularly dominated by bank sources (average of 95.8 percent bank source), and streambed sediment samples averaged 71.1 percent bank source with upland source contributions tending to occur during low streamflow conditions. The seasonal relative importance of upland sources in suspended and streambed samples was increased in summer through winter rather than in the spring, though this may be driven by seasonality of streamflow. Source characterization was not related to land use or size of the drainage basin.
The unmixing model error analysis showed excellent differentiation between bank and upland sources. Upland samples were more often partially attributed to other sources, particularly pasture and forest samples; therefore, these categories were combined into a single category in the model. Though the resulting model could not differentiate between contributions from pastures and forests, it had greater confidence in source characterization for the remaining categories, particularly the bank source, which was identified as the dominant source, regardless of whether upland source categories were combined.
Phosphorus results in samples collected for this study indicate mineral phosphorus is an important component of total particulate phosphorus transport in the study area. Although management practices aiming to reduce upland sediment contributions may be a useful component of an overall nutrient reduction strategy, particularly if controlling phosphorus transport during autumn and low streamflow conditions is a management priority, these upland-focused strategies may have less effect on overall stream phosphorus than controlling bank erosion. Management practices aiming to reduce bank contributions, as the predominant source of stream sediment, could be effective strategies for managing suspended-sediment and phosphorus contributions.
References Cited
Bilotta, G.S., and Brazier, R.E., 2008, Understanding the influence of suspended solids on water quality and aquatic biota: Water Research, v. 42, no. 12, p. 2849–2861. [Also available at https://doi.org/10.1016/j.watres.2008.03.018.]
Collins, A.L., and Walling, D.E., 2002, Selecting fingerprint properties for discriminating potential suspended sediment sources in river basins: Journal of Hydrology, v. 261, no. 1–4, p. 218–244, accessed May 14, 2025, at https://doi.org/10.1016/S0022-1694(02)00011-2.
Dewitz, J., 2023, National Land Cover Database (NLCD) 2021 products: U.S. Geological Survey data release, accessed March 13, 2024, at https://doi.org/10.5066/P9JZ7AO3.
Dewitz, J., and U.S. Geological Survey, 2021, National Land Cover Database (NLCD) 2019 products (ver. 3.0, February 2024): U.S. Geological Survey data release, accessed April 26, 2024, at https://doi.org/10.5066/P9KZCM54.
Femmer, S.R., 2011, Algal community characteristics and response to nitrogen and phosphorus concentrations in streams in the Ozark Plateaus, Southern Missouri, 1993–95 and 2006–07: U.S. Geological Survey Scientific Investigations Report 2011–5209, 25 p. [Also available at https://doi.org/10.3133/sir20115209.]
Fitzpatrick, F.A., Blount, J.D., Kammel, L., Hoover, D.L., Gellis, A.C., and Scudder Eikenberry, B.C., 2019, Stream corridor sources of suspended sediment and phosphorus from an agricultural tributary to the Great Lakes—Proceedings of SEDHYD 2019, Reno, Nev., June 24–28, 2019, [Conference paper]: Federal Interagency Sedimentation and Hydrologic Modeling Conference, v. 4, 15 p., accessed March 28, 2024, at https://pubs.usgs.gov/publication/70217015.
Garrett, J.D., 2025, Chemical and physical data for sediment source and fluvial target samples for fingerprinting of suspended and bed sediment in Medicine Creek, Missouri and Iowa: U.S. Geological Survey data release, https://doi.org/10.5066/P13EN5TA.
Gellis, A.C., Fitzpatrick, F.A., and Schubauer-Berigan, J.P., 2016, A manual to identify sources of fluvial sediment: U.S. Environmental Protection Agency, EPA/600/R-16/210, 137 p., accessed February 5, 2024, at https://cfpub.epa.gov/si/si_public_record_report.cfm?dirEntryId=335394.
Gorman Sanisaca, L.E., Gellis, A.C., and Lorenz, D.L., 2017, Determining the sources of fine-grained sediment using the Sediment Source Assessment Tool (Sed_SAT): U.S. Geological Survey Open-File Report 2017–1062, 104 p., accessed February 5, 2024, at https://doi.org/10.3133/ofr20171062.
Guy, H.P., 1969, Laboratory theory and methods for sediment analysis: U.S. Geological Survey Techniques of Water-Resources Investigations, book 5, chap. Cl, 58 p., accessed April 16, 2024, at https://pubs.usgs.gov/twri/twri5c1/.
Jabbar, F.K., and Grote, K., 2019, Statistical assessment of nonpoint source pollution in agricultural watersheds in the Lower Grand River watershed, MO, USA: Environmental Science and Pollution Research, v. 26, p. 1487–1506. [Also available at https://doi.org/10.1007/s11356-018-3682-7.]
Krempa, H.M., and Flickinger, A.K., 2017, Temporal changes in nitrogen and phosphorus concentrations with comparisons to conservation practices and agricultural activities in the Lower Grand River, Missouri and Iowa, and selected watersheds, 1969–2015: U.S. Geological Survey Scientific Investigations Report 2017–5067, 28 p., accessed February 5, 2024, at https://doi.org/10.3133/sir20175067.
McKay, L., Bondelid, T., Dewald, T., Johnston, J., Moore, R., and Rea, A., 2012, NHDPlus Version 2—User guide: U.S. Environmental Protection Agency, under contract no. CM130105CT0027, ver. 2.1, accessed April 26, 2024, at https://www.epa.gov/system/files/documents/2023-04/NHDPlusV2_User_Guide.pdf.
Natural Resources Conservation Service, [variously dated], Mississippi River Basin healthy watersheds initiative: U.S. Department of Agriculture, Natural Resources Conservation Service web page, accessed July 22, 2024, at https://www.nrcs.usda.gov/programs-initiatives/mississippi-river-basin-healthy-watersheds-initiative.
Phillips, J.M., Russell, M.A., and Walling, D.E., 2000, Time-integrated sampling of fluvial suspended sediment—A simple methodology for small catchments: Hydrological Processes, v. 14, no. 14, p. 2589–2602, accessed February 5, 2024, at https://doi.org/10.1002/1099-1085(20001015)14:14<2589::AID-HYP94>3.0.CO;2-D.
R Core Team, 2023, The R project for statistical computing: Vienna, Austria, R Foundation for Statistical Computing, accessed January 5, 2024, at https://www.R-project.org/.
Rabalais, N.N., Turner, R.E., and Wiseman, W.J., Jr., 2002, Gulf of Mexico hypoxia, a.k.a. “The Dead Zone”: Annual Review of Ecology, Evolution, and Systematics, v. 33, p. 235–263. [Also available at https://doi.org/10.1146/annurev.ecolsys.33.010802.150513.]
Révész, K., Qi, H., and Coplan, T.B., 2012, Determination of the δ15N and δ13C of total nitrogen and carbon in solids; RSIL lab code 1832 (ver. 1.2, September 2012): U.S. Geological Survey Techniques and Methods, book 10, chap. 5, 31 p., accessed April 16, 2024, at https://doi.org/10.3133/tm10C5.
Taggart, J.E., Jr., ed., 2002, Analytical methods for chemical analysis of geologic and other materials, U.S. Geological Survey: U.S. Geological Survey Open-File Report 2002–223, 20 p., accessed April 16, 2024, at https://doi.org/10.3133/ofr02223.
U.S. Environmental Protection Agency, 2009, Ecoregion maps and GIS resources: U.S. Environmental Protection Agency database, accessed April 25, 2019, at https://www.epa.gov/eco-research/ecoregion-download-files-state-region-7.
U.S. Environmental Protection Agency, 2012, National hydrography dataset plus—NHDPlus, version 2: U.S. Environmental Protection Agency database, accessed April 26, 2024, at https://www.epa.gov/waterdata/get-nhdplus-national-hydrography-dataset-plus-data.
U.S. Geological Survey, 2019, StreamStats: U.S. Geological Survey StreamStats program, online, accessed on April 26, 2024, at https://streamstats.usgs.gov/ss/.
U.S. Geological Survey, 2024, USGS water data for the Nation: U.S. Geological Survey National Water Information System database, accessed March 15, 2024, at https://doi.org/10.5066/F7P55KJN.
Walling, D.E., 2005, Tracing suspended sediment sources in catchments and river systems: Science of the Total Environment, v. 344, nos. 1–3, p. 159–184, accessed May 14, 2025, at https://doi.org/10.1016/j.scitotenv.2005.02.011.
Williamson, T.N., Fitzpatrick, F.A., Kreiling, R.M., Blount, J.D., and Karwan, D.L., 2024, Sediment budget of a Maumee River headwater tributary—How streambank erosion, streambed-sediment storage, and streambed-sediment source inform our understanding of legacy phosphorus: Journal of Soils and Sediments, v. 24, p. 1447–1463, accessed November 14, 2024, at https://doi.org/10.1007/s11368-023-03713-6.
Supplemental Information
Results for measurements of stable isotopes of an element (with symbol E) in water, solids, and dissolved constituents commonly are expressed as the relative difference in the ratio of the number of the less abundant isotope (iE) to the number of the more abundant isotope of a sample with respect to a measurement standard.
For more information about this publication, contact:
Director, USGS Central Midwest Water Science Center
400 South Clinton Street, Suite 269
Iowa City, IA 52240
319–337–4191
For additional information, visit: https://www.usgs.gov/centers/cm-water.
Publishing support provided by the
USGS Science Publishing Network,
Rolla Publishing Service Center
Disclaimers
Any use of trade, firm, or product names is for descriptive purposes only and does not imply endorsement by the U.S. Government.
Although this information product, for the most part, is in the public domain, it also may contain copyrighted materials as noted in the text. Permission to reproduce copyrighted items must be secured from the copyright owner.
Suggested Citation
Garrett, J.D., 2026, Stream sediment sources in Medicine Creek, northern Missouri and southern Iowa: U.S. Geological Survey Scientific Investigations Report 2026–5121, 11 p., https://doi.org/10.3133/sir20265121.
ISSN: 2328-0328 (online)
Study Area
| Publication type | Report |
|---|---|
| Publication Subtype | USGS Numbered Series |
| Title | Stream sediment sources in Medicine Creek, northern Missouri and southern Iowa |
| Series title | Scientific Investigations Report |
| Series number | 2026-5121 |
| DOI | 10.3133/sir20265121 |
| Publication Date | March 02, 2026 |
| Year Published | 2026 |
| Language | English |
| Publisher | U.S. Geological Survey |
| Publisher location | Reston, VA |
| Contributing office(s) | Central Midwest Water Science Center |
| Description | Report: vi, 11 p.; Data Release; Dataset |
| Country | United States |
| State | Iowa, Missouri |
| Other Geospatial | Medicine Creek drainage basin |
| Online Only (Y/N) | Y |
| Additional Online Files (Y/N) | N |