

Thickness and Other Characteristics of Overbank Sediment Deposited During an Extreme Flood in May 1978 Along the Powder River, Montana
Links
- Document: Report (24.9 MB pdf) , HTML , XML
- Data Releases:
- USGS data release - Channel Cross-section Data for Powder River between Moorhead and Broadus, Montana from 1975 to 2019 (ver. 3.0, August 2020)
- USGS data release - Thickness and characteristics of overbank sediment deposited during an extreme flood in May 1978 along Powder River, Montana, USA
- NGMDB Index Page: National Geologic Map Database Index Page (html)
- Download citation as: RIS | Dublin Core
Acknowledgments
The local landowners who live next to Powder River and witnessed the flood provided a wealth of observations and in some cases made measurements for us. A long time has passed since the 1978 flood and we recognize the late landowners and residents of Powder River County: George Fulton, Hubert Gay, John Daily, H.R. Cook, J.L. Wilson, Doug and Lucille Randall, Frances Rice, Bill and Shirley Stuver, and Jean Hough, all of whom enriched our observations. Others have taken their place as local observers: Tom Bowers, Jim and Kathy Bowers, Floyd Huckins, Phil Huckins, and Dick and Connie Wilson. We are grateful to the late Bill Woodcock, Aerial Survey, Inc., of Miles City, Montana, for the set of aerial photographs showing the location of each valley transect.
Abstract
An extreme flood on the Powder River in southeastern Montana in May 1978 inundated its valley and deposited sediment on the floodplains and terraces at multiple heights. The recurrence interval for this flood was less than 1 percent in the reach between Moorhead and Broadus, Montana. Peak discharges at the U.S. Geological Survey streamgages at Moorhead and Broadus were 779 and 711 cubic meters per second (m3/s), respectively, the difference reflecting the water and sediment stored on the valley surfaces. Bankfull discharge depended on the height of the bank at the start of the valley transect and varied from 243 to 713 m3/s. Sediment-thickness and particle-size data were collected and analyzed in the autumn of 1978 by U.S. Geological Survey scientists at about 900 sites along 20 valley transects between Moorhead and Broadus, Mont. These transects were approximately orthogonal to the floodflow across the floodplain from near the edge of the channel to the high-water mark. Estimated maximum flood depths along these transects ranged from 0.9 to 4.2 meters.
Contrary to theory and controlled laboratory experiments, the distribution of sediment thickness and particle sizes along valley transects did not decrease systematically with distance from the main channel but were affected by the distribution of vegetation. Additionally, some water and sediment—primarily muds and silts—were conveyed by subsidiary channels (often connected to the main channel downriver from the valley transect) during the early stages of the flood before water overtopped the banks at the start of the valley transect. The vegetation created natural sediment traps in the recirculation and wake zones in the lee of trees and shrubs. Sediment that accumulated in these traps formed dunes and thus an undulating surface with many local maximums and minimums in sediment thicknesses. Sediment in the traps are referred to as lee dunes, which recorded flow conditions and a predominance of coarsening-upward sequence of particle sizes (mud to silt to sands) starting at the preflood surface. These sequences were associated with the rising limb of the hydrograph, and later as the flood began to recede, the lee dunes recorded a fining-upward sequence associated with the falling limb of the hydrograph.
Introduction
Powder River is a perennial, free-flowing, meandering river on the semi-arid northern Great Plains of the Western United States. It is a high-plains reference standard (Stagliano, 2012) with no dams, diversions, or urban effects other than the pumping of water from the river in the spring and summer to irrigate hayfields. The river drains an area of 34,706 km2 (fig. 1), and discharges water into the Yellowstone River at an annual average rate of 15.9 m3/s.
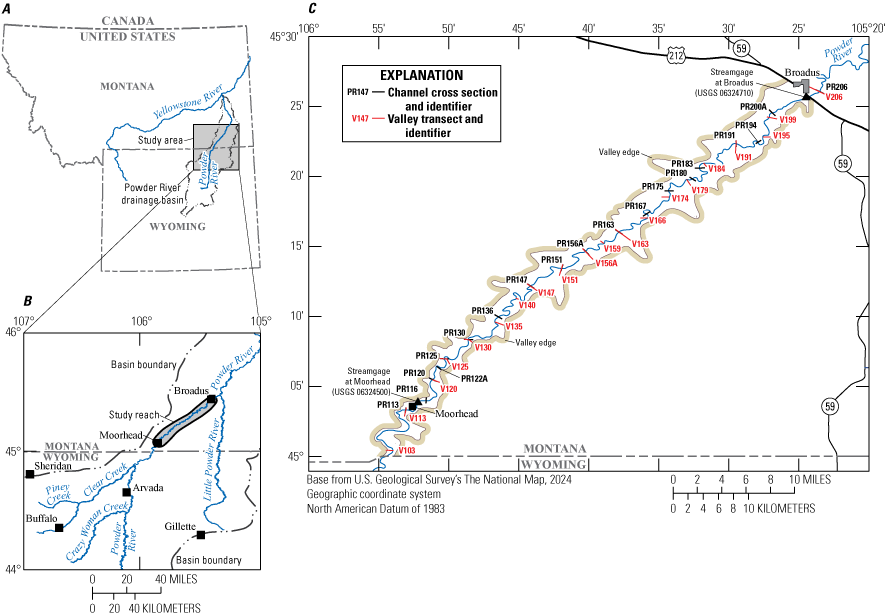
Maps showing study reach within the Powder River Basin in Wyoming and Montana. A, Map showing Powder River Basin spanning north-central Wyoming and southeastern Montana. B, Map showing tributaries and study reach, which had three U.S. Geological Survey (USGS) streamgages in operation at Moorhead (USGS streamgage site 06324500), Broadus (USGS streamgage site 06324710), and Arvada (USGS streamgage site 06317000) measuring discharge and suspended-sediment concentration in 1978. C, Map showing channel cross sections and valley transects. Figure modified from Moody and Meade (2014).
The flood of May 1978 on Powder River along the study reach (fig. 1) had a recurrence interval less than 1 percent, corresponding to a peak daily discharge of 779 m3/s (Parrett and others, 1984). It was an extreme flood that was not part of the normal population of annual snowmelt floods. Snow had been melting in the higher elevations of the Bighorn Mountains in central Wyoming since early May and feeding tributaries of Powder River (fig. 1). Then rain spread over lower elevations during May 3–8 and continued steadily for more than a week, melting any remnants of low-elevation snow in Wyoming and augmenting the snowmelt water in Powder River as it moved northward into Montana (for details refer to Parrett and others, 1984; Meade and Moody, 2013). On April 29, 1978 (fig. 2), the river rose and covered the channel bed to the edge of the bordering vegetation. This level is referred to as bedfull discharge (12.7 m3/s; Moody, 2019), which is essentially equal to the mean daily discharge (12.5 m3/s) measured from 1975 to 2017 at the streamgage site at Moorhead, Montana (U.S. Geological Survey [USGS] station 06324500; USGS, 2017). Bankfull discharge (160–170 m3/s; Martinson, 1984; Moody and Meade, 2008) was surpassed near the Moorhead streamgaging site on May 17, 1978, followed by a rapid rise to the peak discharge on May 20 (779 m3/s) at Moorhead (fig. 2). The flood peaked one day later at Broadus, Montana (USGS streamgage site 06324710; USGS, 2017), but at a lower discharge (711 m3/s) because a large fraction of the floodwater was stored on the floodplain between the streamgage sites at Moorhead and Broadus (Parrett and others, 1984; refer to also inundation map, Meade and Moody, 2013, plate 1). Once the 1978 flood crested the channel banks, the flow was in two layers as a meandering compound channel (Knight and others, 2009). The lower layer followed the relatively well-defined meandering channel, whereas the upper layer that was higher than the channel banks followed the downvalley direction across the floodplain.
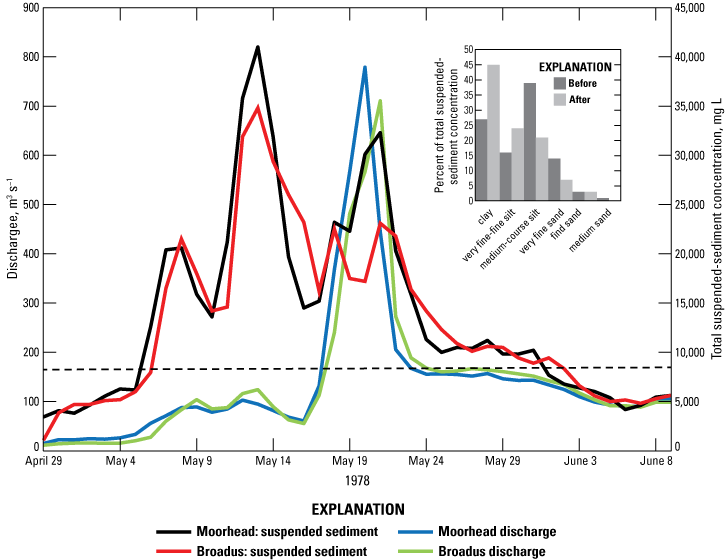
A, Line graph showing discharge and suspended-sediment concentration in Powder River, north-central Wyoming and southeastern Montana, during May 1978 flood. B, Bar graph showing mean daily suspended sediment concentration collected before and after peak discharge from Powder River at Broadus, Montana (USGS station 06324710; refer to fig. 1C). Values are reported by Moody and Meade (2008, table 3). Clay is less than 0.004 millimeters (mm); very fine to fine silt is 0.004 to 0.016 mm; medium to coarse silt is 0.016 to 0.062 mm; very fine sand is 0.062 to 0.125 mm; fine sand is 0.125 to 0.250 mm; and medium sand is 0.250 to 0.500 mm.
Compound Channels
Compound channels have been studied extensively. The large difference in depth of the water in the channel and on the floodplain, in addition to the difference in their bed roughness (Fernandes, 2021), creates a large velocity difference, or shear zone, along the edge of the bank, which generates turbulent vortices (Shiono and Muto, 1998; Knight and others, 2009; Juez and others, 2019). Generally, computational models (Pizzuto, 1987; Lauer and Parker, 2008; Kawahara and others, 2009) and laboratory experiments (Bathurst and others, 2002; Juez and others, 2019) of overbank deposition in compound channels often assume, by necessity, simple topography (straight channels and uniform floodplains) and steady-state conditions (Pizzuto, 1987; Narinesingh and others, 1999; Valentine and others, 2009). Additionally, the focus is often on the long time scale (Lauer and Parker, 2008) representing the aggregate deposition from many floods. Aggregation tends to “smooth” spatial distributions compared to deposition from a single flood characterized by unsteady flow and spatial variability.
Flume experiments have shown that overbank sediment deposition for straight compound channels differs considerably from deposition for meandering compound channels. For straight compound channels, deposition is typically in the form of a levee composed of small dunes along the bank edge and expanded in width depending upon the flow depth over the bank (Bathurst, 2002; Juez and others, 2019). For meandering compound channels, deposition is spread in the form of dunes across the entire meander neck (Bathurst and others, 2002), except where the flow leaves the channel to cross the meander neck. In these places, flow velocities scoured the edge of the bank, leaving no sediment (Bathurst and others, 2002; Knight and others, 2009). These flume studies have limited floodplain widths (generally less than [<] 5 times the channel width) and have not included the effects of vegetation (Knight and others, 2009).
Field studies of overbank deposition have been made on a wide range of rivers, including Brandywine Creek, United States; River Culm, England; Rhine and Meuse Rivers, Netherlands; Vistula River, Poland; and Ping River, Thailand. These waterways have peak discharges as much as 6,000 m3/s, but they typically have suspended-sediment concentrations <1,300 mg/L in the channel and generally have predominantly fine sediment (clayey silts to fine silty sand) deposited on the floodplains, with the thickest deposits (0.05–30 centimeters [cm]) on levees (Pizzuto, 1987; Asselman and Middelkoop, 1995; Nicholas and Walling, 1997; Wyżga, 1999; and Wood and Ziegler, 2008). These studies do not explicitly focus on the effects of vegetation.
Diffusion, advection, and bedload transport are processes that control the deposition of sediment on floodplains. Initially turbulent diffusion was investigated by researchers, who assumed no lateral flow away from the channel and across the floodplain. This produced a levee at the bank edge and an exponential decrease in sediment thickness as distance increased away from the channel (Pizzuto, 1987; Howard, 1992; Asselman and Middelkoop, 1995). The process of diffusion proved inadequate to explain all the sediment distributions, so two other processes were investigated: the advection of sediment by currents (Narinesingh and others, 1999; Lauer and Parker, 2008) and the trapping of sediment (Nicholas and Walling, 1997; Narinesingh and others, 1999; Lauer and Parker, 2008). The latter process requires estimating a trapping efficiency coefficient—an indirect acknowledgment of the role of vegetation as “river system engineers” (Gurnell, 2014). Dense vegetation may reduce suspended-sediment transport, and then sediment may continue as bedload across the floodplain (Pizzuto and others, 2008; Sumaiya and others, 2021).
Vegetation
Once the floodwater and its suspended-sediment load broach the channel banks, the sediment encounters a myriad of vegetative traps, which alter the suspended-sediment concentration. Concentration profiles of suspended sediments are a balance between the downward flux of settling sediment and the upward flux caused by turbulence. A key parameter in this balancing process is the ratio of the particle settling velocity, wp (in centimeters per second), to the turbulent shear velocity, u* (cm/s). This ratio is called the Rouse number (p): p=wp/κu*, where κ is the von Karmen’s constant, which is approximately 0.4 (Rouse, 1950; Middleton and Southard, 1984). Assuming a smooth bottom boundary,
whereg
is acceleration of gravity, in centimeters per second squared,
h
is the water depth, in centimeters, and
S
is the slope of the bed, in meter per meter.
Ca
is a reference concentration near the bed, and
a
is the reference height above the bed and often estimated to be 0.05h (Middleton and Southard, 1984, equation 6.20).
Vegetation stems increase the roughness of the bottom boundary and thus the drag on the flow, which decreases u* and increases the Rouse number (Smith, 2004, 2006; Moody and Meade, 2008). As p increases, the sediment concentration decreases from a vertically well-mixed layer occupying the entire water column with only a small gradient in concentration to a thin layer near the bottom boundary with a large gradient in concentration (Middleton and Southard, 1984).
After the grasses are buried, larger vegetation stems create recirculation zones and steady-wake zones downstream from the trunks of trees and from multi-stemmed bushes growing on the floodplain and low terraces. The average longitudinal velocity is zero in the recirculation zone but positive in the steady-wake zone immediately downstream from the recirculation zone. The magnitude of the decrease in velocity inside these zones depends upon vegetation characteristics such as the drag coefficient, stem density, stem or patch diameter, and projected frontal area (Nepf, 2004; Chen and others, 2012). In addition to these two velocity deficit zones downstream from the vegetation, there is a small deficit zone upstream (Chen and others, 2012). Thus, sediment is trapped upstream and downstream from the vegetation with a planimetric outline resembling a perfoliate leaf enclosing the vegetation stem or stems and a longitudinal outline with the thickest sediment nearest the stem and decreasing in thickness as distance increases in the downstream direction. These sediment structures have been referred to in the fluvial and eolian literature as lee dunes (Moody and Meade, 2008), wake deposits (Miller and Parkinson, 1993), anchor dunes (Cooke and others, 1993), shadow dunes (Hesp, 1981; Gunatilaka and Mwango, 1989), and tail bars (Bywater-Reyes and others, 2017). The length of these zones is a function of the ratio of the ambient velocity and the velocity within the zone (Hesp, 1981; Chen and others, 2012). Flume and field measurements have found lengths on the order of 1–10 times the stem or patch diameter (Chen and others, 2012; Bywater-Reyes and others, 2017) and widths that are 0.3–1 times the length (Bywater-Reyes and others, 2017). Other flume measurements (Liu and Nepf, 2016) recorded decreases in velocity by about 10–30 percent, and a deposition maximum about two patch diameters downstream from vegetation patches. Sediment trapping is amplified within a stand of trees or shrubs where individual recirculation zones merge. This condition creates larger trapping zones that are greater than the total of the individual recirculation zones (Nepf, 2004).
Purpose and Scope
The 1978 flood on Powder River provides a good example of the depositional processes related to compound channels, and it transported sufficient sediment to clearly define the associated depositional features. Data were collected after the flood, in October 1978, along 20 valley transects (fig. 1C) from near the edge of the channel across the flooded areas to the high-water marks. These transects were approximately equally spaced along the approximately 90-km study reach of Powder River valley between the town sites of Moorhead and Broadus, Montana, and represent different topographic conditions—point bars, floodplains, and terraces. The primary purpose of this report is: (1) to describe the depositional features on the floodplain in terms of sediment thickness and particle size, and (2) to show the role of vegetation in controlling the distribution of sediment on the floodplain.
The data provided in this report can be used to develop and verify numerical models of overbank flow on natural rivers with compound channels and vegetation. The data provide a reference guide for understanding the depositional features of other extreme floods, such as the larger 1923 flood (about 2,800 m3/s) on Powder River, whose deposits reside in many places beneath the 1978 flood deposits.
Background
Sediment concentrations in Powder River are 1–2 orders of magnitude greater than those of the Mississippi River. The mean total suspended-sediment concentrations (sand, silt, and clay) during spring snowmelt floods of Powder River range from 1,700 to 20,000 mg/L (Moody and others, 2002, table 1), whereas total concentrations during spring floods of the Mississippi River (at Vicksburg, Mississippi) only range from 200 to 300 mg/L (Moody and Meade, 1993, tables 19–22). During the flood of May 1978, the suspended-sediment concentration peaked 7 days before the water discharge (fig. 2). Measured suspended-sediment concentrations were 41,000 mg/L at Moorhead (USGS streamgage site 06324500; hereinafter referred to as Moorhead) on May 13, 1978 and 22,600 mg/L at Broadus (USGS streamgage site 06324710; hereinafter referred to as Broadus) on May 22, 1978 (Parrett and others, 1984). Powder River transports an annual suspended-sediment load of 2–3 million metric tons per year (Hembree and others, 1952; Moody and Meade, 1990; Moody and others, 2002). Owing to safety and logistic concerns, no suspended-sediment samples were collected at the centroid of flow throughout the entire flood, but samples were collected from the bank.
Sediment transport is episodic in Powder River, but primarily during four types of floods each year: (1) ice-breakup floods from February to April; (2) snowmelt floods in late May and June, often augmented by rain such as during the 1978 flood; (3) summer flash floods spawned by convective rainstorms from July to September; and (4) autumnal floods that occasionally rise in September and October from rain on early snowfall (Moody and others, 2002; Moody and Meade, 2014). The flood of record was an autumnal flood in October 1923 (about 2,800 m3/s). As floods cross the Wyoming-Montana State line (fig. 1C), they are confined between bluffs on each side of the river that form the Pliocene Fort Union Formation, where the valley is narrow and about 500 m wide (just downriver from the site of a formerly proposed earth-filled dam (Simmons, 1949). At Moorhead (fig. 1C) the valley is about 1,000 m wide, and begins to expand so that near Broadus it is about 3,000 m wide (fig. 3). The valley has many small intermittent tributaries draining the rugged hills of the Fort Union Formation in a trellis pattern (Albanese, 1990) but contributing little to widening the valley.
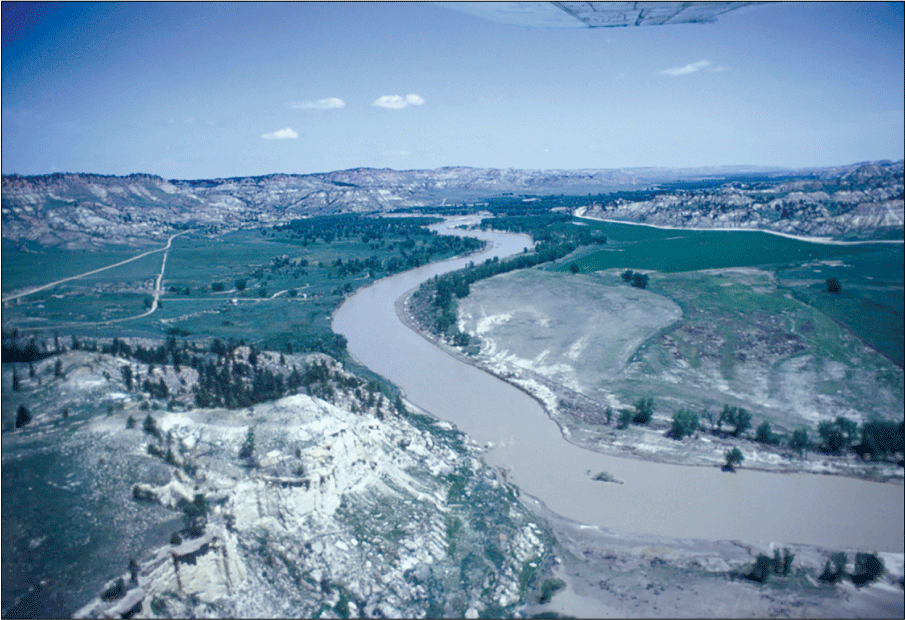
Photograph showing aerial view downriver of the expanding valley of Powder River, southeastern Montana, during the waning stage of the flood of May 1978. The Fort Union Formation (Hospital Bluff) is visible in the bottom left of the photograph and flanking either side of the valley farther downriver. New sediment, consisting of mud (primarily clay with an unknown amount of very fine silt) and sand, is seen deposited on the right bank (relative to facing downriver) of the Lightning terrace. No sediment was deposited on the left bank (relative to facing downriver), which is a Moorcroft terrace. The road on the left side of the photograph cuts across the Kaycee terrace that slopes upward to join the bluffs of the Fort Union Formation. Photograph by Robert H. Meade, U.S. Geological Survey, May 25, 1978.
Within the valley, Powder River has been at work over the course of geological time building and modifying channels, point bars, temporary floodplains, and three semipermanent terraces. Although work began about 2 million years ago (Albanese, 1990), the ages of the terraces are more recent. The age of the highest colluvial Kaycee terrace ranges from 4,500 to 6,000 years before present (yr B.P.), whereas the lower Moorcroft and Lightning terraces are estimated to be 1,000–2,500 yr B.P. and 600–700 yr B.P., respectively (Leopold and Miller, 1954; Huffman and others, 2022). The height of these terraces that form the channel bank controls the bankfull discharge, and there is a range of bankfull discharges, as found on other rivers (Czuba and others, 2019). Bankfull discharge is estimated to be 160–170 m3/s near the streamgage at Moorhead but varies downriver as a seemingly random series of different terraces form the banks alternately on each side of the river, controlling the local estimate of the maximum flood depth above each transect (table 1). During the 1978 flood, channels and point bars represented about 23 percent of the flooded area and floodplains about 10 percent. The Lightning and Moorcroft terraces (about 2.7 and 3.5 m above the river, respectively) represented 47 and 20 percent of the flooded area, respectively. The Kaycee terrace, which is about 15 m above the river, was not flooded; it was only eroded in a few locations by the 1978 flood (Moody and Meade, 2008).
Table 1.
Valley transect information for overbank sediment samples from Powder River, southeastern Montana, collected after the May 1978 flood.[Data from Moody and Meade (2022). Sloping, indicates a transect across a point bar with a gradually sloping surface. Elevated, indicates a transect that starts near an approximately vertical bank. Diked field, indicates a terrace levelled by mechanical means and mostly surrounded by artificial dikes to control the irrigation water. est., estimated; m3/s, cubic meters per second; m, meter; avg., average, max., maximum; cm, centimeter, LB, left bank; RB, right bank; R2, coefficient of determination, negative values represent a decreasing total thickness and positive value represents an increasing total thickness with distance from channel bank; —, no data; NA, not applicable]
A variety of vegetation grows on the point bars, floodplains, and terraces of Powder River valley. Marking the height of bedfull flow is a band of sedges (Scirpus spp.) about 1 m wide on each side of the channel but not along the toe of the point bar, which is an energetic scouring environment. Scattered grasses grow in patches on point bars, and more extensive fields of grasses cover floodplains and the low terraces Often, the first sizeable vegetation on a point bar is the previous year’s crop of cottonwood trees (Populus deltoides ssp. monilifera [Aiton] Eckenw.) and tamarisk (Tamarix spp.), both with diameters of 1–2 millimeters (mm) and standing as much as about 10 cm high above the bare sand if no ice has sheared them off during the late winter and early spring floods. Farther away from the channel, bands of older cottonwood trees, willow trees (Salix exigua Nutt.), and tamarisk grow in arcuate bands roughly parallel to the edge of the water and present a porous stockade of trunks that exert a drag on the overbank water, slowing it down. At this elevation, contour lines on point bars merge with contour lines on floodplains. Farther up the point bar, willow trees and tamarisk begin to decline, leaving bands of increasingly larger cottonwood trees, with fine sand and silt covering their roots ever deeper with each flood to form a ridge with scattered grasses growing between the tree trunks. These arcuate bands of cottonwood trees represent a good recruitment year and are often bordered by open space in between the bands that are at a slightly lower elevation and nearly devoid of trees but have a denser covering of grasses. From the air, these alternate bands of trees and grass are a characteristic signature of the vegetation bordering Powder River (fig. 4). Higher on the terraces, age, beavers, and drier soils have taken their toll and thinned out the bands, leaving scattered elderly cottonwood trees with less grass but more woody sagebrush (Artemisia spp.) filling in the gaps between trees. On the Moorcroft terrace, many of the elderly trees have been removed to create hayfields, and the floodwaters easily spread over a vast area with fewer obstructions.
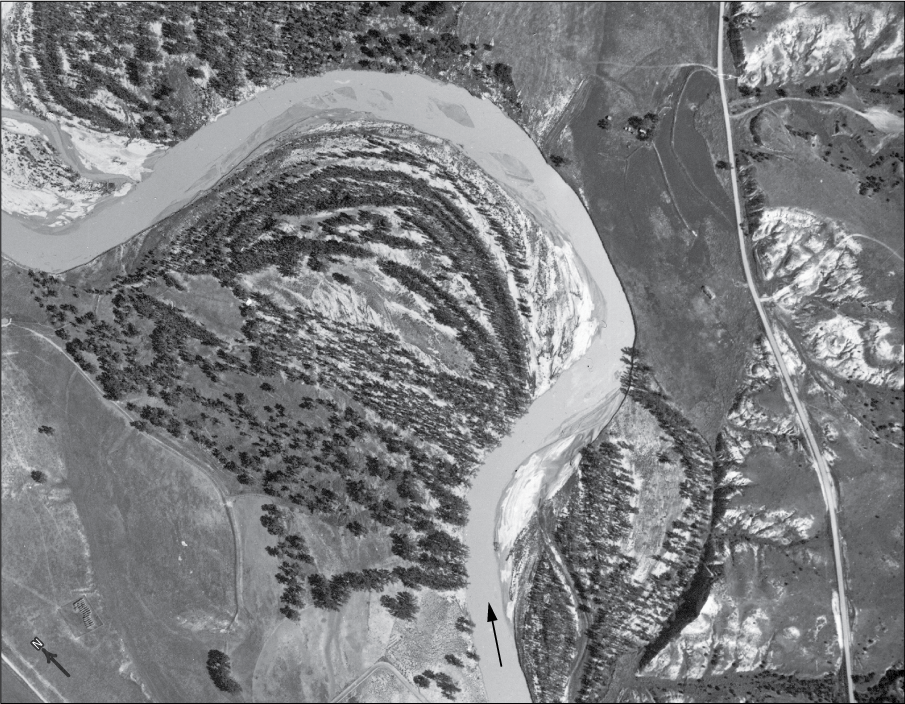
Aerial photograph showing characteristic arcuate bands of cottonwood trees and open spaces on a bend of Powder River, southeastern Montana. Open spaces have a variety of grasses and shrubs. Point bars have narrower and shorter bands of cottonwood tree seedlings, tamarisk, and sandbar willow trees. Flow in the channel is from bottom to top left, shown with arrow. Flow during the overbank stage of the 1978 flood probably was also downvalley across the neck of this bend. Aerial photograph by Bill Woodcock, Aerial Survey, Inc., Miles City, Mont., September 1978.
Several publications have focused on the effects of the 1978 flood. A sediment budget was developed for the flood that estimated the total mass of sediment deposited on floodplains and three neighboring terraces (fig. 5). The flooded planform area of the terraces decreased, but the same terraces, on average, aggraded vertically (Moody and Meade, 2008). Another publication found that the sediment eroded in about two weeks by the 1978 flood was essentially equal to the sediment eroded by subsequent annual floods over two decades (Moody and others 1999; Meade and Moody, 2013; Moody and Meade, 2014). In a collaborative study of sedimentology and sediment transport, Ghinassi and Moody (2021) reconstructed the 1978 flood hydrograph using stratigraphy and particle-size data of the 1978 channel flood deposits at PR163, where the flood had widened and then refilled 65 m of channel, leaving behind a historical sedimentary record of the flood.
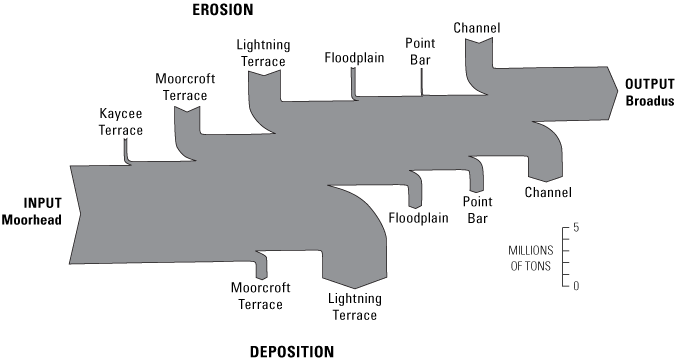
Diagram showing sediment budget for Powder River, southeastern Montana, 1978 flood. The budget is calculated for the 60-kilometer reach of Powder River valley between Moorhead (USGS streamgage site 06324500) and Broadus (USGS streamgage site 06324710) during the 8-day duration of the flood. Width of the arrow is equal to the amount of sediment in metrics tons as shown by the scale. Refer to Moody and Meade (2008, table 1 and fig. 4).
Methods
Sediment samples were collected after the flood, in the autumn of 1978, along valley transects. Some transects were extensions of previously established cross sections of the channel, whereas others were established in between the existing cross sections. Overbank sediment was sampled along each transect, and thickness and particle-size distribution were measured at each sample site.
Cross Sections
Fortuitously, 19 channel cross sections had been established, monumented, and surveyed along the 90-km study reach of Powder River between Moorhead and Broadus (fig. 1), before the 1978 flood. Cross sections are identified by “PR” followed by the distance in river kilometers downriver from Crazy Woman Creek in Wyoming (fig. 1B). The primary purpose of these cross sections was to develop a long-term sediment budget; therefore, the cross sections were selected to provide a representative sampling of different types of river reaches. Details of the survey methods are in a report by Moody and Meade (1990) and all data are available online (Moody and Meade, 2020).
Valley Transects
After the channel cross sections were resurveyed in the summer of 1978, valley transects were laid out on aerial photographs in the autumn of 1978 to measure the thickness and characteristics of the overbank sediment. The same scheme was used for identifying the valley transects, except a “V” was used as the prefix instead of “PR.” Some transects (V113, V120, V147, V151, V156A, V163, V191, and V206, fig. 1C) were extensions of a cross section across the valley if they satisfied the condition of being generally orthogonal to the downvalley, floodflow direction. If not, the direction of the valley transect was changed (for example, V125 and V130, fig. 1C). Other transects (V103, V135, V140, V159, V166, V174, V179, V184, V195, and V199) were established in new locations to fill in gaps and thus provide a relatively uniform sampling of the overbank sediment.
Transects were laid out to be orthogonal to the banks and, thus, parallel to the assumed flow lines emanating from the channel. The beginning and ending points of each transect were marked on a copy of an aerial photograph taken after the 1978 flood. The nominal scale of the aerial photographs was 1:10,000, and the relevant parts of the aerial photographs (cropped from the originals) showing the transect have been reproduced in this report in appendix 1. After marking the beginning point (a pinprick through some visible landmark), a magnetic bearing was followed that was generally perpendicular to the floodflow direction, and the end point was marked (refer to table 2 for Universal Transverse Mercator [UTM] coordinates for end and ancillary points for each transect). Distances were usually measured using a portable metric tagline, and sample holes were dug at regularly spaced intervals of 10 or 20 m. For long, uniform sections of a transect, the distances were measured by paces, which were calibrated and reported in the table of particle-size data for each transect where applicable.
Table 2.
Location of endpoints and ancillary points for valley transects where overbank sediment data were collected on the Powder River floodplain and terraces, southeastern Montana, after the 1978 flood.[Data from Moody and Meade (2022). Where transects are extension of channel cross sections, the cross section are included. Station distance in meters from a zero reference point on the left bank of the channel. m, meter; BM, benchmark consisting of a brass plate embedded in concrete; PR, Powder River; NA, not applicable]
Valley transects were classified into two types: (1) elevated transects, which start near a distinct, nearly vertical bank above the river, and (2) sloping transects, which start at the toe of a point bar near the edge of water and slope gradually upward away from the river (table 1). Three transects had overbank deposits on both banks (V156A, V199, and V206), which gives a total of 23 transects. Seventeen transects were elevated, but one (V135) is listed as a special case called “diked fields.” Five transects were sloping. Previous theoretical studies have focused on the elevated transect type where the adjacent flooded surfaces were assumed to be level. The theory then predicts an exponential decrease in thickness with distance from the channel (Pizzuto, 1987; Howard, 1992; Asselman and Middelkoop, 1995).
Light Detection and Ranging Data
Initially, there were no elevation data for valley transects that were not an extension of channel cross sections. However, light detection and ranging (lidar) data (North American Datum of 1983, North American Vertical Datum of 1988) were collected on September 30, 2016, for part of the study reach (Ackerman, 2016). The data include valley transects V140 through V195. Postflood topographic profiles of the floodplain were extracted from the lidar data using ArcMap (Esri, 2023). Most of the floodplain has not been reflooded since 1978, although bank erosion has trimmed off edges of the channel, and deposition has added new floodplain surfaces adjacent to the channel (Moody and others, 1999). These changes do not affect the valley transects, which generally start some distance (about 10–20 m) beyond the channel banks.
Sediment Sampling
Previous publications have proposed that thickness and particle size of sediment deposited on floodplains should depend on distance from the channel [Pizzuto, 1987]. Data were fit to several different mathematic functions (linear, quadratic, and exponential) to test the theories. The coefficient of determination, R2, was used as a metric to compare the goodness of fit of each function. For some transects, the thickness at the starting point at the edge of the channel was zero. This first zero was not included and only continuous data greater than (>) 0 were included for an exponential fit. Quadratic polynomial fits were used for some transects only to provide a better visualization of the data where there were maximums or minimums and there was no implied theoretical quadratic dependence.
Sediment thickness and particle sizes were measured at each of the 898 sample holes. The bottom of the overbank deposit was usually identified by a bluish-gray layer representing the anoxic decay of the organic vegetation (primarily grass) and some reduced iron. Particle sizes were judged by eye, comparing a sample to a pocket reference card showing grain sizes. Selected samples were sent to the laboratory for particle-size analysis (table 3). Many photographs were taken, and some are included in the description of each valley transect in appendix 1.
Thickness and particle-size data were collected along the transects, but no elevation data were collected. For some transects that were extensions of cross sections, the elevation of the top of the deposited sediment was surveyed in later years (for example, V125 and V156A) and the elevation of the preflood surface was estimated by subtracting the sediment thickness. For some transects (for example, V103 and V135) the preflood elevations were estimated from U.S. Geological Survey 7.5-minute topographic maps, and for other transects (for example, V151, V166, and V184) the 2016 lidar data (Ackerman, 2016) were used to estimate the postflood elevations. Although some post-1978 floods have modified near-bank sediment deposits <20 m away from the bank, most floods did not affect sediment deposited >20 m from the bank along a transect.
Particle-Size Analysis
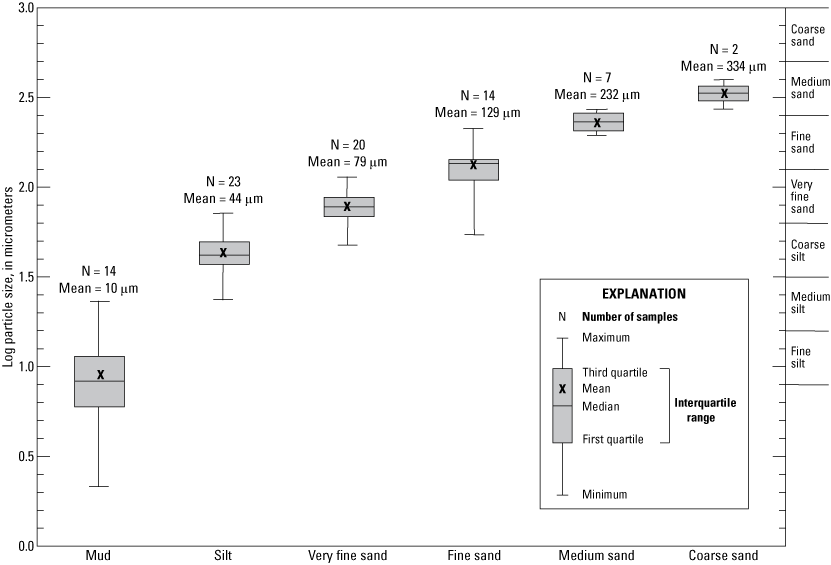
The overbank sediments were initially deposited by settling from the water column. Therefore, two settling methods were used to analyze the particle sizes of the fine and large fraction of each of the selected samples. Samples were first sieved through a 0.063-mm sieve to separate the fine and large fractions. A subsample of the silt and clay fraction (<0.063 mm) was analyzed into whole phi sizes using the pipette method described by Guy (1969). This laboratory analysis separated the clay from the silt. Mud is primarily clay but with an unknown amount of silt, and is used in field descriptions. However, particle-size analysis was not done for all field samples. A subsample (about 5 grams) of the larger sand fraction (>0.063 mm) was analyzed using the Woods Hole Rapid Sediment Analyzer (Zeigler and others, 1960) to determine settling velocities and thus particle diameters. The resulting data were analyzed into one-half phi sizes. The two size fractions were combined to give full-size distributions. All particle sizes were finer than coarse sand (1.00 mm), and for some samples there was not enough sediment to carry out a pipette analysis. Graphs show the percent of sediment finer than the given size on the horizontal axis for each valley transect (app. 1). The mean values for each particle class (mud = 0.010 mm; silt = 0.044 mm; very fine sand = 0.079 mm; fine sand = 0.129 mm; medium sand = 0.232 mm; and coarse sand = 0.334 mm) were used to calculate the mean particle size (weighted by the thickness) for each sample along the transect.
Results and Discussion
Overbank sediment deposits were sampled in the horizontal and vertical dimensions. However, the interpretation of how sediment deposited along these two-dimensional transects is distributed requires the knowledge of the three-dimensional topography surrounding the transect that guides the flow. For this reason, each transect description in appendix 1 of this report contains a copy of the 1978 aerial photograph (scale nominally 1:10,000) showing the location of the transect.
The source of the overbank sediment was the suspended sediment in the channel. The percentages of clay and fine silt composing the suspended sediment increased after the peak discharge, whereas the percentages of medium and coarse silt and sands decreased (refer to inset bar graph in fig. 2).
During the 1978 flood, the bed slope over the study reach was about 0.0011 (Ghinassi and Moody, 2021), and for typical channel depths of 1–2 m during the flood, u* was 10–15 cm/s, which represents more than sufficient turbulence to suspend coarse sand and smaller sediment particles. This magnitude of turbulence creates uniform vertical profiles for fine to very fine silts (orange lines in fig. 6) and a nearly uniform vertical profile for very fine sand (solid black line in fig. 6) as the floodwater leaves the channel. The profile for very fine sand changes substantially as the sediment encounters vegetation (fig. 6). The difference in relative concentration between the profile for no vegetation and the profile for different vegetation size and spacing is proportional to the amount of sediment trapped and deposited. The amount is much greater for very fine sand than for fine to very fine silt.
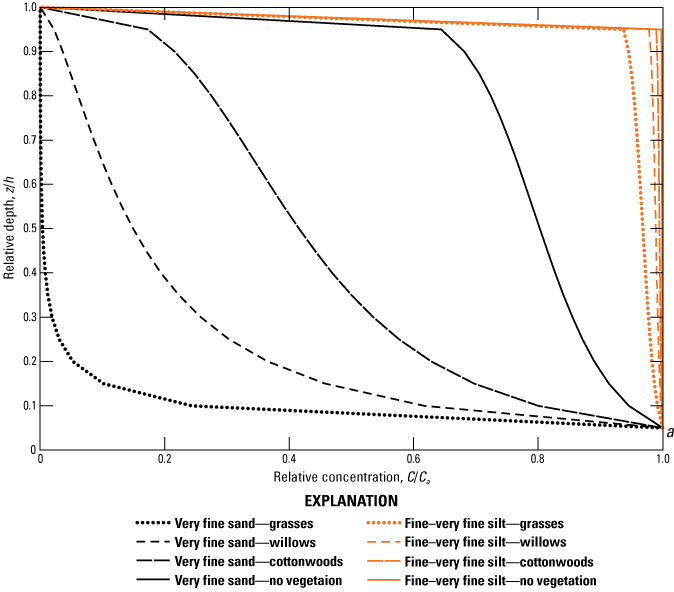
Graph showing theoretical suspended-sediment concentration profiles. Concentration, C, relative to a reference concentration, Ca, at a height a=0.05h from the bottom is plotted compared to the relative height above the bottom z/h, where z is the height and h is the water depth (eq. 2). Water depth is 10 centimeters (cm) for grasses and 100 cm for cottonwood trees, willow trees, or no vegetation. Black lines are calculated for very fine sand (0.063–0.125 millimeter [mm]) with a settling velocity, wp, of 0.31 cm per second (s), and orange lines are calculated for fine to very fine silt (0.004–0.016 mm) with a settling velocity of 0.0018 cm/s (Moody and Meade, 2008, table 3). Cottonwood trees were assumed to be 20 cm in diameter and spaced 200 cm apart; for willow trees to be 1 cm in diameter and spaced 10 cm apart; and for grasses to be 0.5 cm in diameter and 5 cm apart (Moody and Meade, 2008, table 4).
Sediment Thickness
Thickness data were everything but monotonic in contrast to prevailing theory and flume experiments. This pattern is partially explained by the fact that when the floodwaters began to recede, some of the previously deposited sediment was eroded near the channel margins as the water level declined (undermining levees) and as return flow eroded small channels through the levees. Therefore, at some transects the sediment thickness was zero instead of a maximum. Total thickness data that were immediately adjacent to the channel were fit to an exponential distribution. The first zero at the starting point was not included, and only continuous data >0 were included. For 16 transects (12 elevated and 4 sloping), the thickness decreased from the channel bank; however, the exponential fits were not substantially better (average R2=0.25) than linear fits to the data (average R2=0.27). There are three possible reasons for these low R2 values: (1) the spatial variability in thickness around trees and shrubs along the transect (fig. 7A), (2) the decrease in thickness caused by scour from turbulent vortices generated by the shearing of the flow at the channel-floodplain boundary (Bathurst and others, 2002; Knight and others, 2009), or (3) the erosion of the levee deposits during the falling limb of the hydrograph (fig. 7B), which has been observed during other floods. The decrease in thickness can also be the result of an increase in elevation away from the channel (app. 1, figs. 1.1B, 1.13B, and 1.17B). For six transects, the increase in thickness with distance from the channel was sometimes caused by flooding from subsidiary channels (refer to app. 1, figs. 1.11B, 1.14B, and 1.18B).
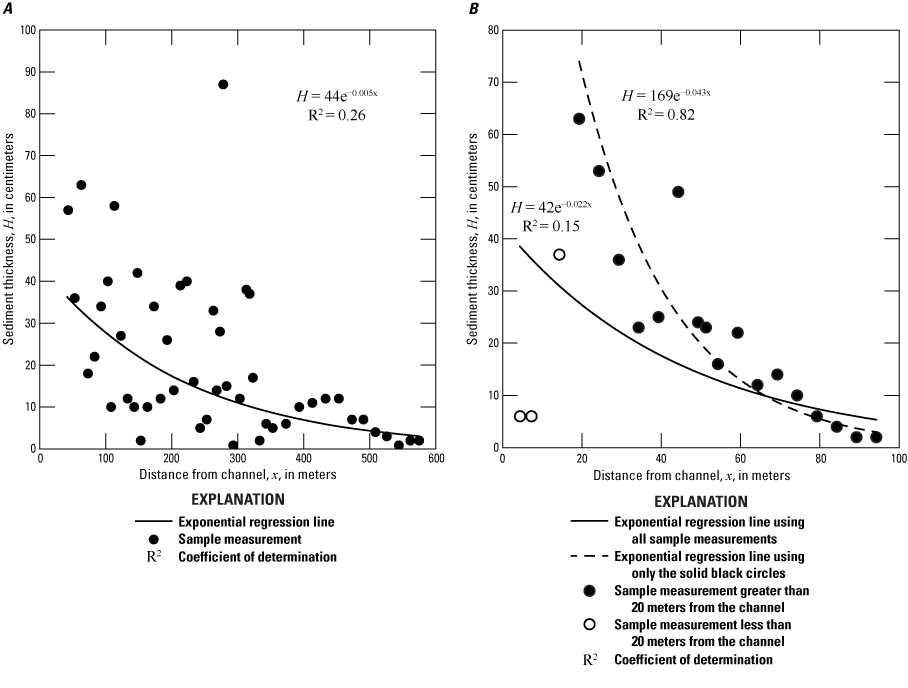
Graphs showing total sediment thickness compared with distance from channel, Powder River, southeastern Montana. A, Valley transect V163 shows the variability caused by many lee dunes of various heights that formed downriver from trees and shrubs. B, Valley transect V113 shows the result when low thicknesses caused by erosion on the falling limb of the flood are not included in the regression of thickness compared with distance from the channel. Refer to figure 1 for location of valley transect V163 and V113.
Muds consisting primarily of clay and an unknown amount of very fine silt, and to a greater degree, silts, showed nearly continuous distributions along the valley transects, but sand sizes did not. The discontinuous character (presence of zero values) ruled out fitting exponential distributions. Linear and quadratic polynomials were fit to the thickness of very fine sand (vfs) and silt. The average R2 values for the linear fits were <0.3, indicating only weak trends to no trends. With one more degree of freedom, the quadratic shows quantitatively the spatial characteristic of either a slight maximum or minimum along the transects. Thickness of vfs and silt decreased with distance from the channel for 71 and 48 percent of the transects, respectively. Minimums of vfs and silt were found for 43 and 48 percent of the transects, respectively. These minimums suggest that there may be two sources of sediment—the main channel and a subsidiary channel (for example, app. 1, figs. 1.7B, 1.11B). Transects with maximums indicate an initial increase in thickness away from the bank, which is contrary to theory. Additionally, the maximums and the lack of a strong negative correlation with distance from the channel indicate that diffusion and advection are not the dominant processes. A similar conclusion was reached for sand deposition on a new inset floodplain at PR120 during a 20-year period after the 1978 flood (Pizzuto and others, 2008).
Particle-Size Characteristics
The particle sizes of the 80 select samples measured in the field and in the laboratory were essentially the same (table 3; fig. 8). The mean of the mud samples measured in the field corresponded to standard Wentworth size class (Wentworth, 1922) of fine silt (0.008–0.016 mm). Similarly, the means of the silt, very fine sand, fine sand samples corresponded to the standard size classes of coarse silt (0.031–0.062 mm), very fine sand (0.062–0.125 mm), and fine sand (0.125–0.250 mm). The means of the medium sand and coarse sand were both slightly less than the standard size classes of medium sand (0.250–0.500 mm) and coarse sand (0.500–1.0 mm) respectively.
Table 3.
Particle-size analysis of 80 select overbank samples from Powder River, southeastern Montana, collected after the 1978 flood.[Modified from Moody and Meade (2022, table 3). m, meter; μm, micrometer; fs, fine sand; vfs, very fine sand; —, no data; cs, coarse sand; ms, medium sand; PR, Powder River]
Particle-size analysis of 80 select overbank samples from Powder River, southeastern Montana, collected after the 1978 flood. Samples were classified in the field and then analyzed in the laboratory.
The flood-deposited sediments had two defining textural characteristics: (1) the lateral fining of sediment particle sizes—in the sequence, fine sand, very fine sand, and silt—with increasing lateral distances away from the main channel; and (2) the coarsening upward of sediment particle sizes, from basal muds into silts and sands.
Lateral
Lateral fining of particle sizes was a more dominant characteristic than changes in sediment thickness. Particle size decreased with distance from the channel for 91 percent of the valley transects. Lee dunes deposited downstream from trees and shrubs created spatial variability (fig. 9A) that produced an average R2 value of 0.31. Subsidiary channels (refer to descriptions for V140, V147, V151, V174, V184, and V195) also increased the spatial variability, and for some transects (V140 and V174) reversed the general lateral-fining trend (fig. 9B), whereas for others the subsidiary channels produced a secondary maximum (V151, V184, and V195; fig. 9C).
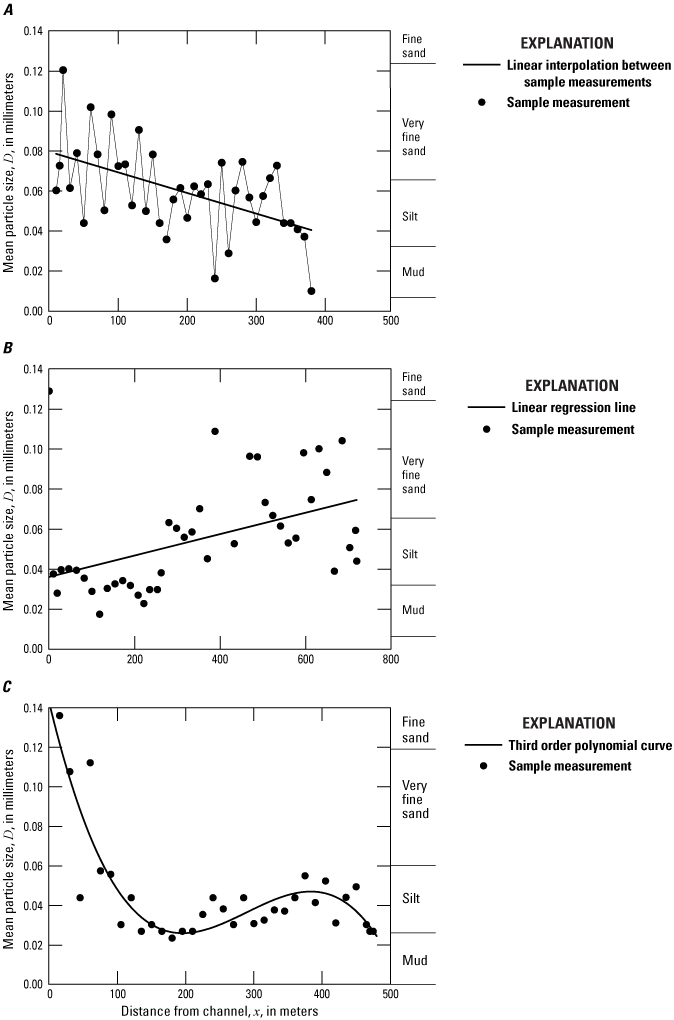
Graphs showing changes in mean particle size (D) of sediments with distance from channel of Powder River, southeastern Montana. A, Valley transect V125 showing the spatial variability in particle size associated with many lee dunes that form downriver from trees and shrubs. Linear relation is D=−0.000103x + 0.080; coefficient of determination (R2)=0.28. B, Valley transect V174 showing the effects of a subsidiary channel, which reverses the trend of decreasing particle size with distance from the channel. Linear relation is D=0.000053x + 0.036; R2=0.19. C, Valley transect V195 showing the secondary maximum caused by a subsidiary channel. Refer to figure 1 for location of valley transects.
Some sources of sediment—especially mud and silt—were transported during the early stages of the flood up swales and headcuts, which are connected to the channel downriver and generally parallel to the main channel. These alternative conveyances or subsidiary channels often cut across the transect and transported water and sediment upriver (for example, refer to short white arrow in app. 1, fig. 1.18A). Other sources may overtop an upriver bank and transport water and sediment downriver across the transect (app. 1, figs. 1.6A, 1.8A).
Vertical
The preponderance of coarsening-upward sequences along almost all valley transects indicates that the dominant particle size in the overbank flow initially increased with time. Coarsening-upward sequences have also been referred to as inverse grading (Fisk, 1974; Iseya, 1989; Rubin and others, 1998). The depletion of fine suspended sediment in the bed material during a flood has been proposed as the primary cause of coarsening-upward sequences (Iseya, 1989), and this can be combined with an increase in suspended concentration of coarse sediment attributed to a concomitant increase of the coarse fraction in the bed material, which was the case in the Grand Canyon during a controlled flood in 1996 (McLean, 1992; Rubin and others, 1998). The Grand Canyon is a supply-limited system (Rubin and others, 1998), but Powder River is not. During the later stages of the 1978 flood after the peak discharge, the concentrations of fine sediment (clays, very fine and fine silts) were actually higher than before the flood peak (fig. 2, inset bar graph). The channel bed is the most likely source of the initial concentration of fine sediment, whereas the eroded banks (Moorcroft and Lightning terraces have 84 and 52 percent silt and clay, respectively, Moody and Meade, 2008, table 2) are the probable source of the fine sediment during later stages of the flood.
The floodwater that first overtopped the channel banks and inundated the floodplain and low terraces probably was a thin layer of water and mud only a few centimeters deep. It represented only a small fraction (< about 2 percent) of the total water depth (about 2 m) at bankfull flow. In May, the early spring grass was only about 3–5 cm tall, but it decreased the flow velocities (fig. 6) and trapped the mud and silt. The upright grass stems that were later observed in the sediment, when the overbank sediment was sampled, indicated weak flow.
The proportion of coarse sediment in the overbank flow increased for two reasons. First, the increased water depth in the channel increased the shear stress, τ (in newtons per square meter), which resuspended coarser sediment and increased the concentration throughout the water column. Second, as the flow depth and velocities increased over the floodplain, the overbank water column could support higher and higher concentrations of coarser particle sizes and represented a larger percentage of the total flow depth in the channel. Initially, some of this coarser sediment—very fine sand and fine sand—may have been trapped by the grass, but the coarser sediment eventually buried the grass, mud, and silt layers, thus protecting these layers from later erosion caused by increasing velocities over the floodplain. Additionally, the higher velocities prevented deposition of finer sizes still being transported by the water column. This process continued as the floodwater further increased in depth, transporting medium sand from the channel. This was not necessarily a discrete process, but rather a continuous process indicated by gradational coarsening-upward sequences observed at sites along all transects (refer to app. 1, tables 1.1–1.20). However, the process was apparently interrupted by erosion at some sites along all transects, for example at 305 m from point 166A (app. 1, table 1.13), where the sequence from bottom upward was 1 cm mud, 3 cm silt, zero very fine sand, zero fine sand, 12 cm medium sand, and 22 cm coarse sand. Most sample sites with coarsening-upward sequences corresponded to lee dunes, which appear as spikes in the plots of the height of the top of each sediment layer above the pre-1978 floodplain surface compared with distance along the valley transect (refer to app. 1).
Vegetation Traps
Lee dunes are the physical manifestation of the hydrodynamic sediment traps created by the recirculation zones and a steady-wake zone downstream from vegetation. The drag of the diverse vegetation extracts energy from the fluid and decreases the velocity and turbulence inside these zones (Nepf, 2004; Smith, 2004, 2006; Chen and others, 2012) such that the suspended-sediment concentration profile decreases (fig. 6) and the excess sediment is deposited.
Lee dunes have a characteristic humped profile (fig. 10A; refer to also Moody and Meade, 2008, fig. 8), and multiple lee dunes can coalesce and form longitudinal stringers, especially among bands of trees (figs. 4, 10B). The height of lee dunes is limited by the maximum depth of flow (fig. 10), which was generally on the order of 0.5–4.2 m above the transects (table 1).
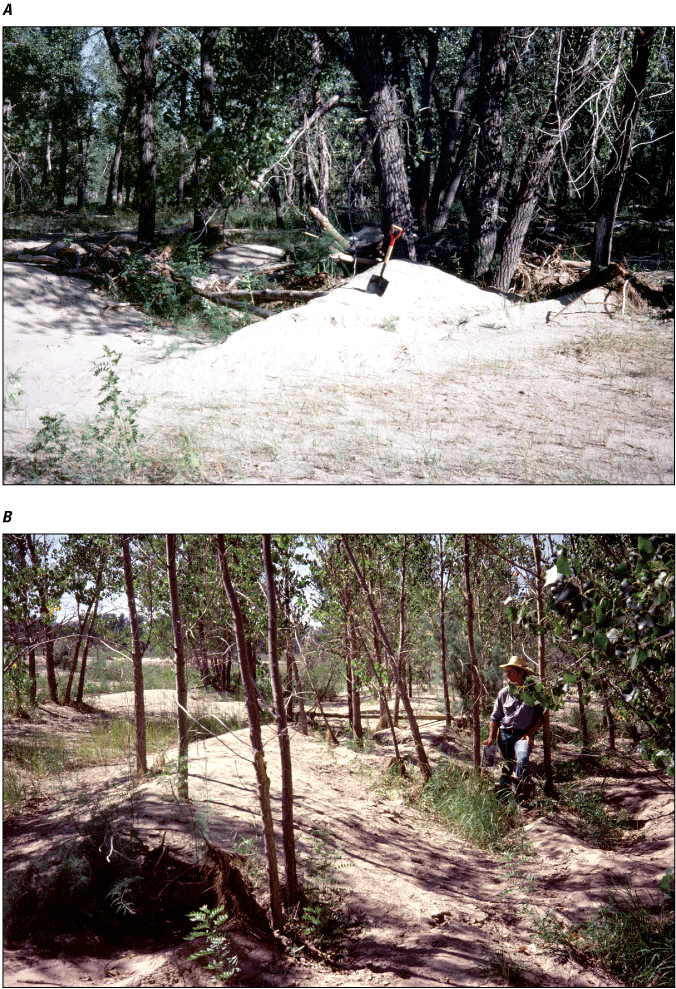
Lee dunes along Powder River looking upriver, southeastern Montana, September 1, 1978. A, Sediment trapped downstream from a cottonwood tree cluster along valley transect V130. Shovel length is about 1 meter (m). B, Multiple lee dunes looking downriver that have coalesced into semicontinuous ridges oriented along the flow direction near valley transect V156A. Person in the photograph is 1.9 m tall, and dunes are about 1 m high. Photographs taken by Robert H. Meade, U.S. Geological Survey. Refer to figure 1 for location of valley transects.
The filling of sediment traps created lee dunes that contained the record of the dominant sediment size during the flood. Although the ambient overbank velocity initially increased with time, the sediment layers were preserved in the lee dunes because of the decrease in velocity in the recirculation and steady-wake zones. The predominant characteristic was the coarsening-upward sequences (fig. 11) reflecting the increase in shear stress and thus the water depth. The largest particle size observed in the coarsening-upward sequence was gravel ranging from 4 to 40 mm (app. 1, table 1.8), which may have been transported as bedload. Surges of overbank velocity possibly may have been sufficient to erode some layers from the traps. In addition to coarsening upward, there were many examples of fining-upward sequences deposited on top of the coarsening-upward sequence, indicating that the dominant particle size in the overbank flow decreased as the flood waned (fig. 11). Most coarsening-upward sequences are associated with lee dunes; however, dike fields also acted as sediment traps. A good example is along valley transect V135 (app. 1, fig. 1.6A), which had coarsening-upward deposits (fig. 11) left on two alfalfa fields (with no trees or shrubs) at about 2 m above the riverbed (Jim and Kathy Bowers, local Powder River landowners, written commun., February 2022).
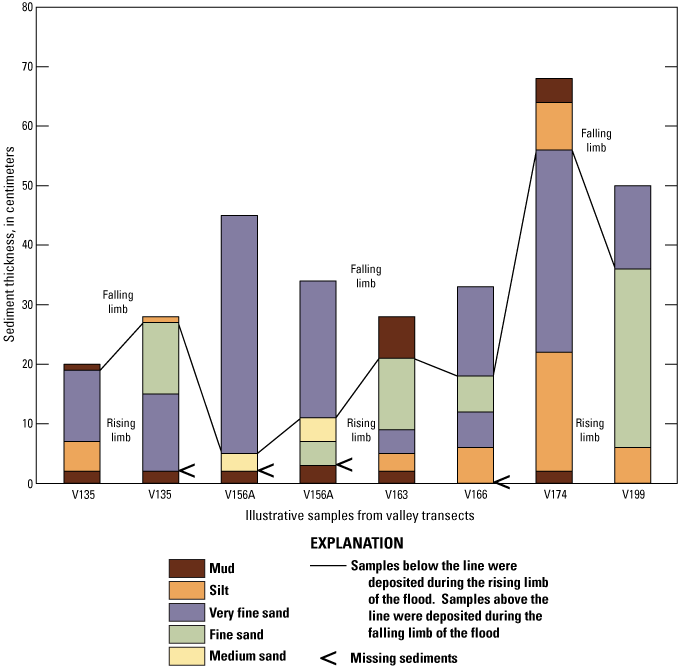
Graph showing selected examples of depositional sequences on rising and falling limbs of the 1978 flood hydrograph, Powder River, southeastern Montana. Coarsening-upward sequences of sediment were collected in vegetation traps downstream from trees and shrubs on the rising limb, and fining-upward sequences were collected on the falling limb. All coarsening-upward sequences are shown as a separate figure in the appendix 1 discussion section for each valley transect. These samples are (from left to right): 375, 395, 11.5, 25.9, 273, 332, 432.9, and 44 meters from the channel bank.
Lee dunes also contained a record of flow conditions. Crossbedding of silt, very fine sand, and fine sand were noted in multiple sites for about one-half the valley transects. Thus, flow conditions on floodplains and terraces were sufficient for the formation of migrating ripples. Additional observations of laminated and finely laminated silts indicate that the overbank water had short pulses of higher suspended-sediment concentrations in between time intervals with lower concentration.
Summary
Vegetation and subsidiary channels on the floodplains were important factors that affected the distribution of overbank sediment from a flood (recurrence interval less than 1 percent) in 1978 on Powder River in southeastern Montana. Lee dunes were a common depositional feature along the valley transects, which were approximately orthogonal to the floodflow across the floodplain from near the edge of the channel to the high-water mark. Dunes were deposited downstream from trees and shrubs in the recirculation zone, which had slower moving water than adjacent water flowing between the vegetation, and were frequently the cause of the deviation of the deposited sediment from a uniform decrease in thickness with distance from the main channel. Subsidiary channels were noted on some of the valley transects. Overbank sediments often invaded the floodplain first as backwater flowing slowly upriver in these subsidiary channels with the deposition of muds and fine silts. Subsidiary channels frequently provided a source of sediment that created local sediment thickness maximums along the valley transects, opposing (and in some cases reversing) the weak trend of decreasing thickness with increasing distance from the channel.
Weak trends (coefficient of determination less than 0.3) of decreasing sediment thickness (total and for individual particle sizes) with increasing distance from the main channel were neither monotonic nor exponential. The gradient in elevation of floodplains and terraces adjacent to the main channel also caused the sediment thickness to decrease. The trends were usually spatially irregular, with multiple local maximums where tree stems and other vegetation trapped sediment in individual lee dunes or in groups of lee dunes that coalesced and formed longitudinal stringers.
Lateral fining of surficial sediment with distance away from the main channel along the 20 valley transects was also a weak trend. Mean particle size decreased along 91 percent of the valley transects, but again the spatial variable caused by vegetation disrupted the weak trend.
Coarsening-upward sequences were a dominant textural characteristic found (1) in lee dunes created by natural sediment traps downstream from trees and shrubs, and (2) artificial sediment traps formed by diked fields. These sequences recorded the hydrodynamics associated with the rising limb of the flood hydrograph. The normal progression of layers was usually from mud to silt to very fine and fine sands, and at some sites these layers were topped by medium sand and coarse sand with gravel. Some layers often were missing, indicating intervening periods of erosion. Fining-upward sequences were less common than coarsening-upward sequences. Fining-upward sequences were stacked atop the coarsening-upward sequences and probably were associated with the falling limb of the flood hydrograph.
Hydrodynamic flow conditions of the flood were recorded in the stratigraphy of the lee dunes. Crossbedding and laminations indicated flow conditions sufficient to form ripples. The stratigraphy also indicated conditions that produced pulses of sediment, which may have been related to the time-varying turbulent vortices that were generated at the edge of the channel bank and pumped sediment out of the channel onto the floodplain. Vegetation controlled the thickness and particle-size distribution of the deposited sediment, which was a record of the temporal variations of sediment transport during the 1978 flood.
References Cited
Ackerman, T., 2016, Powder River, MT 2016 airborne lidar survey: National Center for Airborne Laser Mapping (NCALM), distributed by Open Topography, accessed August 12, 2024, at https://doi.org/10.5069/G93F4MJG.
Asselman, N.E.M., and Middelkoop, H., 1995, Floodplain sedimentation—Quantities, patterns and processes: Earth Surface Processes and Landforms, v. 20, no. 6, p. 481–499, accessed May 2, 2018, at https://doi.org/10.1002/esp.3290200602.
Bathurst, J.C., Benson, I.A., Valentine, E.M., and Nalluri, C., 2002, Overbank sediment deposition patterns for straight and meandering flume channels: Earth Surface Processes and Landforms, v. 27, no. 6, p. 659–665, accessed January 1, 2023, at https://doi.org/10.1002/esp.346.
Bywater-Reyes, S., Wilcox, A.C., and Diehl, R.M., 2017, Multiscale influence of woody riparian vegetation on fluvial topography quantified with ground-based and airborne lidar: Journal of Geophysical Research—Earth Surface, v. 122, no. 6, p. 1218–1235, accessed January 1, 2020, at https://doi.org/10.1002/2016JF004058.
Chen, Z., Ortiz, A., Zong, L., and Nepf, H., 2012, The wake structure behind a porous obstruction and its implications for deposition near a finite patch of emergent vegetation: Water Resources Research, v. 48, no. 9, article W09517, 12 p., accessed November 29, 2017, at https://doi.org/10.1029/2012WR012224.
Cohen, T.J., and Nanson, G.C., 2008, Topographically associated but chronologically disjunct late Quaternary floodplains and terraces in a partly confined valley, south-eastern Australia: Earth Surface Processes and Landforms, v. 33, no. 3, p. 424–443, accessed September 3, 2013, at https://doi.org/10.1002/esp.1565.
Czuba, J.A., David, S.R., Edmonds, D.A., and Ward, A.S., 2019, Dynamics of surface‐water connectivity in a low‐gradient meandering river floodplain: Water Resources Research, v. 55, no. 3, p. 1849–1870, accessed January 27, 2012, at https://doi.org/10.1029/2018WR023527.
Fernandes, J.N., 2021, Apparent roughness coefficient in overbank flows: SN Applied Sciences, v. 3, article 696, 10 p., accessed January 26, 2022, at https://doi.org/10.1007/s42452-021-04677-3.
Fisk, L.H., 1974, Inverse grading as stratigraphic evidence of large floods—Comment: Geology, v. 2, no. 12, p. 613–615, accessed June 1995 at https://doi.org/10.1130/0091-7613(1974)2<613b:IGASEO>2.0.CO;2.
Ghinassi, M., and Moody, J., 2021, Reconstruction of an extreme flood hydrograph and morphodynamics of a meander bend in a high-peak discharge variability river (Powder River, USA): Sedimentology, v. 68, no. 7, p. 3549–3576, accessed October 12, 2023, at https://doi.org/10.1111/sed.12911.
Gunatilaka, A., and Mwango, S.B., 1989, Flow separation and the internal structure of shadow dunes: Sedimentary Geology, v. 61, p. 125–134, accessed June 2007 at https://doi.org/10.1016/0037-0738(89)90045-6.
Gurnell, A., 2014, Plants as river system engineers: Earth Surface Processes and Landforms, v. 39, no. 1, p. 4–25, accessed January 6, 2022, at https://doi.org/10.1002/esp.3397.
Guy, H.P., 1969, Laboratory theory and methods for sediment analysis: U.S. Geological Survey Techniques of Water-Resources Investigations, book 5, chap. C1, 58 p. [Also available at https://pubs.usgs.gov/twri/twri5c1/.]
Hesp, P.A., 1981, The formation of shadow dunes: Journal of Sedimentary Petrology, v. 51, no. 1, p. 101–111, accessed June 2007 at https://doi.org/10.1306/212F7C1B-2B24-11D7-8648000102C1865D.
Hickin, E.J., and Nanson, G.C., 1975, The character of channel migration on the Beatton River, Northeast British Columbia, Canada: Geological Society of America Bulletin, v. 86, p. 487–494, accessed July 29, 2019, at https://doi.org/10.1130/0016-7606(1975)86<487:TCOCMO>2.0.CO;2.
Howard, A.D., 1992, Modeling channel migration and floodplain sedimentation in meandering streams, chap. 1 of Carling, P.A., and Petts, G.E., eds., Lowland floodplain rivers—Geomorphological perspectives: Chichester, United Kingdom, Wiley, British Geomorphological Research Group Symposia Series, p. 1–41.
Huffman, M.E., Pizzuto, J.E., Trampush, S.M., Moody, J.A., Schook, D.M., Gray, H.J., and Mahan, S.A., 2022, Floodplain sediment storage timescales of the laterally confined meandering Powder River, USA: JGR—Earth Surface, v. 127, no. 1, article e2021JF006313, 21 p., accessed January 24, 2022, at https://doi.org/10.1029/2021JF006313.
Juez, C., Schärer, C., Jenny, H., Schleiss, A.J., and Franca, M.J., 2019, Floodplain land cover and flow hydrodynamic control of overbank sedimentation in compound channel flows: Water Resources Research, v. 55, no. 11, p. 9072–9091, accessed January 26, 2022, at https://doi.org/10.1029/2019WR024989.
Kawahara, Y., Fukuoka, S., Ikeda, S., Pender, G., and Shimizu, Y., 2009, Computer simulation, chap. 4 of McEwan, I.K., and Ikeda, S., eds., Flow and sediment transport in compound channels—The experiences of Japanese and UK research: Boca Raton, Florida, CRC Press, International Association of Hydraulic Engineering and Research Monograph Series, p. 167–234.
Knight, D.W., Aya, S., Ikeda, S., Nezu, I., and Shiono, K., 2009, Flow structure, chap. 2 of McEwan, I.K., and Ikeda, S., eds., Flow and sediment transport in compound channels—The experiences of Japanese and UK research: Boca Raton, Florida, CRC Press, International Association of Hydraulic Engineering and Research Monograph Series, p. 5–114.
Lauer, J.W., and Parker, G., 2008, Modeling framework for sediment deposition, storage, and evacuation in the floodplain of a meandering river—Theory: Water Resources Research, v. 44, no. 4, article W04425, 16 p., accessed October 12, 2016, at https://doi.org/10.1029/2006WR005528.
Leopold, L.B., and Miller, J.P., 1954, A postglacial chronology for some alluvial valleys in Wyoming: U.S. Geological Survey Water-Supply Paper 1261, 89 p., accessed May 18, 2014, at https://doi.org/10.3133/wsp1261.
Liu, C., and Nepf, H., 2016, Sediment deposition within and around a finite patch of model vegetation over a range of channel velocity: Water Resources Research, v. 52, no. 1, p. 600–612, accessed February 10, 2022, at https://doi.org/10.1002/2015WR018249.
Martinson, H.A., 1984, Channel changes of Powder River between Moorhead and Broadus, Montana, 1939 to 1978: U.S. Geological Survey Water-Resources Investigations Report 83–4128, 62 p. [Also available at https://doi.org/10.3133/wri834128.]
Martinson, H.A., and Meade, R.H., 1983, Channel changes of Powder River, 1938–78, Powder River County, Montana: U.S. Geological Survey Hydrologic Investigations Atlas HA–661, 3 sheets, scale 1:24,000. [Also available at https://doi.org/10.3133/ha661.]
McLean, S.R., 1992, On the calculation of suspended load for noncohesive sediments: Journal of Geophysical Research, v. 97, no. C4, p. 5759–5770, accessed January 21, 2022, at https://doi.org/10.1029/91JC02933.
Meade, R.H., and Moody, J.A., 2013, Erosional and depositional changes wrought by the flood of May 1978 in the channels of Powder River, southeastern Montana: U.S. Geological Survey Scientific Investigations Report 2013–5035, 29 p., 1 pl., [Also available at https://doi.org/10.3133/sir20135035.]
Miller, A.J., and Parkinson, D.J., 1993, Flood hydrology and geomorphic effects on river channels and flood plains—The flood of November 4–5, 1985, in the South Branch Potomac River basin of West Virginia, chap. E of Jacobson, R.B., ed., Geomorphic studies of the storm and flood of November 3–5, 1985, in the upper Potomac and Cheat River basins in West Virginia and Virginia: U.S. Geological Survey Bulletin 1981, p. E1–E96. [Also available at https://doi.org/10.3133/b1981E.]
Moody, J.A., 2019, Dynamic relations for the deposition of sediment on floodplains and point bars of a freely-meandering river: Geomorphology, v. 327, p. 585–597, accessed December 13, 2018, at https://doi.org/10.1016/j.geomorph.2018.11.032. [Version of record made available December 11, 2018.]
Moody, J.A., and Meade, R.H., 1990, Channel changes at cross sections of Powder River between Moorhead and Broadus, Montana, 1975–88: U.S. Geological Survey Open-File Report 89–407, 252 p. [Also available at https://doi.org/10.3133/ofr89407.]
Moody, J.A., and Meade, R.H., 1993, Hydrologic and sedimentologic data collected during four cruises at high water on the Mississippi River and some of its tributaries, March 1989–June 1990: U.S. Geological Survey Open-File Report 92–651, 227 p. [Also available at https://doi.org/10.3133/ofr92651.]
Moody, J.A., and Meade, R.H., 2008, Terrace aggradation during the 1978 flood on Powder River, Montana, USA: Geomorphology, v. 99, nos. 1–4, p. 387–403, accessed January 17, 2022, at https://doi.org/10.1016/j.geomorph.2007.12.002.
Moody, J.A., and Meade, R.H., 2014, Ontogeny of point bars on a river in a cold semi-arid climate: Geological Society of America Bulletin, v. 126, nos. 9–10, p. 1301–1316, accessed November 8, 2023, at https://doi.org/10.1130/B30992.1.
Moody, J.A., and Meade, R.H., 2020, Channel cross-section data for Powder River between Moorhead and Broadus, Montana from 1975 to 2019 (ver. 3.0, August 2020): U.S. Geological Survey data release, accessed August 12, 2024, at https://doi.org/10.5066/F7TQ5ZRN.
Moody, J.A., Meade, R.H., and Martinson, H.A., 2002, Erosion and deposition of sediment at channel cross sections on Powder River between Moorhead and Broadus, Montana, 1980–98: U.S. Geological Survey Water-Resources Investigations Report 2002–4219, 310 p. [Also available at https://doi.org/10.3133/wri024219.]
Moody, J.A., Pizzuto, J.E., and Meade, R.H., 1999, Ontogeny of a flood plain: Geological Society of America Bulletin, v. 111, no. 2, p. 291–303. [Also available at https://doi.org/10.1130/0016-7606(1999)111<0291:OOAFP>2.3.CO;2.]
Narinesingh, P., Klaassen, G.J., and Ludikhuize, D., 1999, Floodplain sedimentation along extended river reaches: Journal of Hydraulic Research, v. 37, no. 6, p. 827–845, accessed January 3, 2018, at https://doi.org/10.1080/00221689909498514.
Nepf, H.M., 2004, Vegetated flow dynamics, chap. 8, of Fagherazzi, S., Marani, M., and Blum, L.K., eds., The ecogeomorphology of tidal marshes, v. 59 of Coastal and Estuarine Studies: Washington, D.C., American Geophysical Union, p. 137–163, accessed March 6, 2022, at https://doi.org/10.1029/CE059p0137.
Nicholas, A.P., and Walling, D.E., 1997, Modelling flood hydraulics and overbank deposition on river floodplains: Earth Surface Processes and Landforms, v. 22, no. 1, p. 59–77, accessed January 4, 2018, at https://doi.org/10.1002/(SICI)1096-9837(199701)22:1<59::AID-ESP652>3.0.CO;2-R.
Parrett, C., Carlson, D.D., Craig, G.S., Jr., and Chin, E.H., 1984, Floods of May 1978 in southeastern Montana and northeastern Wyoming: U.S. Geological Survey Professional Paper 1244, 74 p. [Also available at https://doi.org/10.3133/pp1244.]
Pizzuto, J.E., 1987, Sediment diffusion during overbank flows: Sedimentology, v. 34, no. 2, p. 301–317, accessed June 2022 at https://doi.org/10.1111/j.1365-3091.1987.tb00779.x.
Pizzuto, J.E., Moody, J.A., and Meade, R.H., 2008, Anatomy and dynamics of a floodplain, Powder River, Montana, USA: Journal of Sedimentary Research, v. 78, p. 16–28, accessed June 2019 at https://doi.org/10.2110/jsr.2008.005.
Rubin, D.M., Nelson, J.M., and Topping, D.J., 1998, Relation of inversely graded deposits to suspended-sediment grain-size evolution during the 1996 flood experiment in Grand Canyon: Geology, v. 26, no. 2, p. 99–102, accessed February 13, 2019, at https://doi.org/10.1130/0091-7613(1998)026<0099:ROIGDT>2.3.CO;2.
Schook, D.M., Rathburn, S.L., Friedman, J.M., and Wolf, J.M., 2017, A 184-year record of river meander migration from tree rings, aerial imagery, and cross sections: Geomorphology, v. 293, part A, p. 227–239, accessed July 30, 2024, at https://doi.org/10.1016/j.geomorph.2017.06.001.
Shiono, K., and Muto, Y., 1998, Complex flow mechanisms in compound meandering channels with overbank flow: Journal of Fluid Mechanics, v. 376, p. 221–261, accessed January 25, 2022, at https://doi.org/10.1017/S0022112098002869.
Simmons, W.P., comp., 1949, Erosion tests on earth samples no. 13P-95, 96, and 97, taken at elevation 3542.0 from two suggested sites for an auxiliary spillway—Moorhead Dam—Missouri River Basin Project: Bureau of Reclamation, Research and Geology Division, Hydraulic Laboratory Report no. Hyd.-269, 12 p.
Smith, J.D., 2004, The role of riparian shrubs in preventing floodplain unraveling along the Clark Fork of the Columbia River in the Deer Lodge Valley, Montana, in Bennett, S.J., and Simon, A., eds., Riparian vegetation and fluvial geomorphology, v. 8 of Water Science and Application: Washington, D.C., American Geophysical Union, p. 71–85, accessed January 21, 2022, at https://doi.org/10.1029/WS008.
Smith, J.D., 2007, Beaver, willow shrubs, and floods, chap. 19 of Johnson, E.A., and Miyanishi, K., eds., Plant disturbance ecology—The process and the response: Burlington, Massachusetts, Academic Press, p. 603–671, accessed December 11, 2013, at https://doi.org/10.1016/B978-012088778-1/50021-2.
Sumaiya, S., Czuba, J.A., Schubert, J.T., David, S.R., Johnston, G.H., and Edmonds, D.A., 2021, Sediment transport potential in a hydraulically connected river and floodplain-channel system: Water Resources Research, v. 57, no. 5, article e2020WR028852, 19 p., accessed April 25, 2023, at https://doi.org/10.1029/2020WR028852.
U.S. Geological Survey [USGS], 2017, USGS water data for the Nation: U.S. Geological Survey National Water Information System database, accessed August 12, 2024, at https://doi.org/10.5066/F7P55KJN.
Valentine, E.M., Ikeda, S., Knight, D.W., McEwan, I.K., Myers, W.R.C., Pender, G., Tsujimoto, T., Willetts, B.B., and Wormleaton, P.R., 2009, Sediment processes, chap. 3 of McEwan, I.K. and Ikeda, S., eds., Flow and sediment transport in compound channels—The experiences of Japanese and UK research: Boca Raton, Florida, CRC Press; International Association of Hydraulic Engineering and Research Monograph Series, p. 115–165.
Wentworth, C.K., 1922, Scale of grade and class terms for clastic sediments: The Journal of Geology, v. 30, no. 5, p. 377–392, accessed October 26, 2024, at https://www.jstor.org/stable/30063207.
Wood, S.H., and Ziegler, A.D., 2008, Floodplain sediment from a 100-year-recurrence flood in 2005 of the Ping River in northern Thailand: Hydrology and Earth System Sciences, v. 12, no. 4, p. 959–973, accessed January 24, 2022, at https://doi.org/10.5194/hess-12-959-2008.
Wyżga, B., 1999, Estimating mean flow velocity in channel and floodplain areas and its use for explaining the pattern of overbank deposition and floodplain retention, Geomorphology, v. 28, nos. 3–4, p. 281–297, accessed June 2022, at https://doi.org/10.1016/S0169-555X(98)00110-X.
Zeigler, J.M., Whitney, G.G., Jr., and Hayes, C.R., 1960, Woods Hole Rapid Sediment Analyzer: Journal of Sedimentary Petrology, v. 30, no. 3, p. 490–495, accessed January 19, 2022, at https://doi.org/10.1306/74D70A79-2B21-11D7-8648000102C1865D.
Appendix 1. Valley Transect Descriptions
Valley Transect V103
Valley transect V103 lies across an about 700-meter- (m) wide constricted reach of Powder River valley in section 36 of township 9S, range 47E (fig. 1.1A). Floodwaters of May 1978 covered the entire valley bottom from the base of the bedrock bluff on the left side of the valley to the base of the Kaycee terrace bluff on the right side of the valley. The transect is one kilometer (km) north (downriver) of the Wyoming-Montana State line (refer to table 2 for Universal Transverse Mercator [UTM] coordinates) and crosses the full extent of a 600-m-wide point bar.
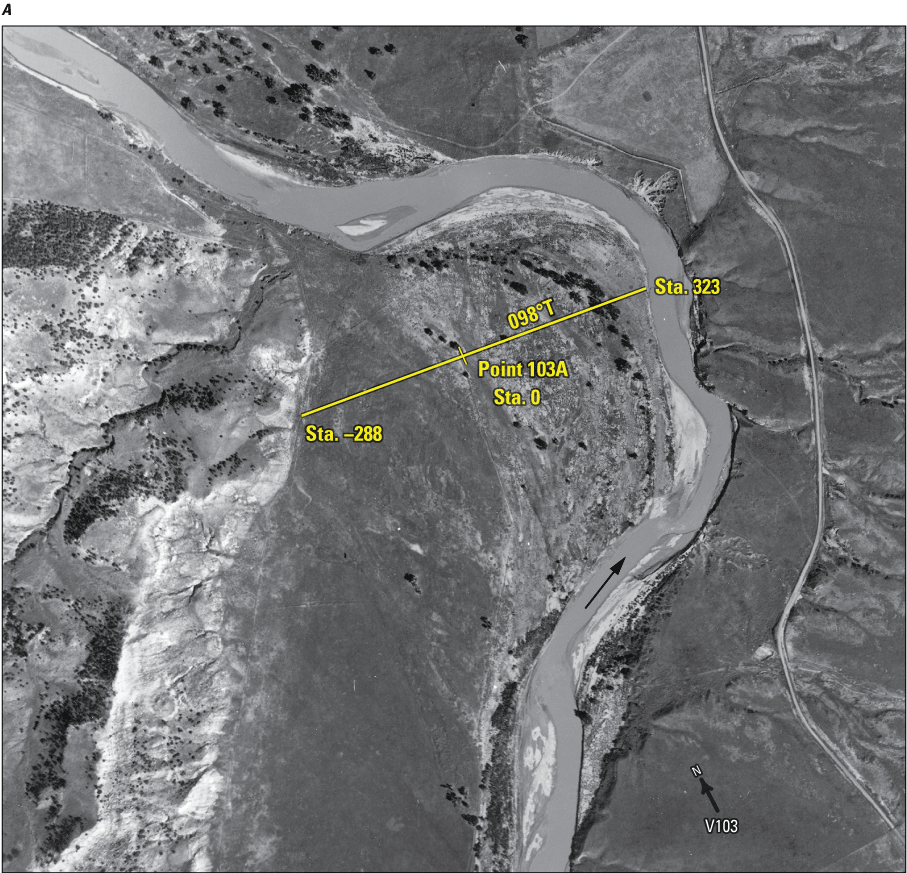
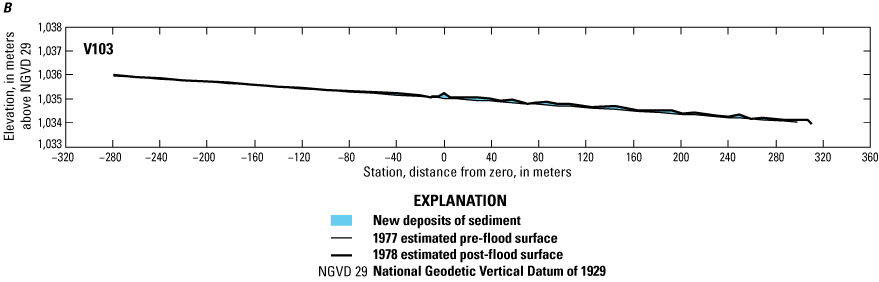
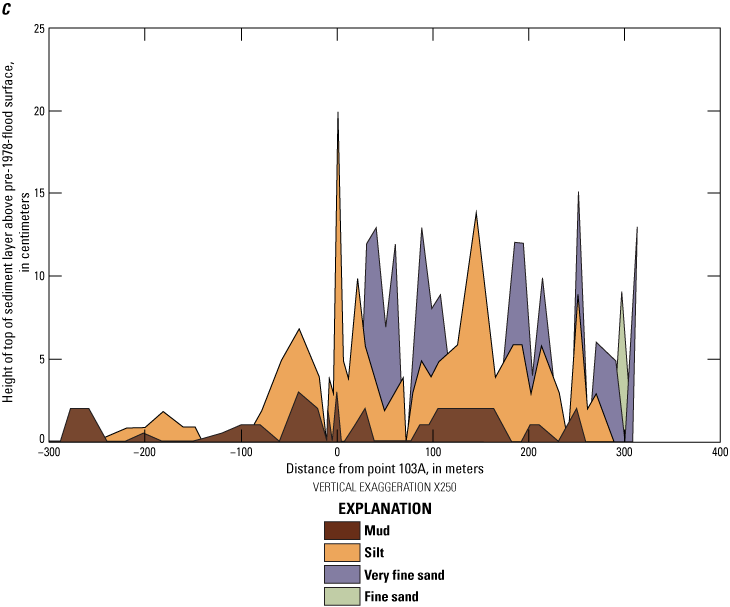
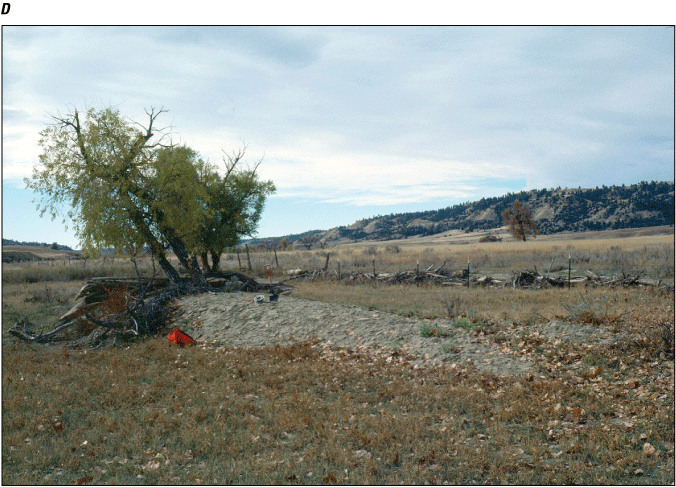
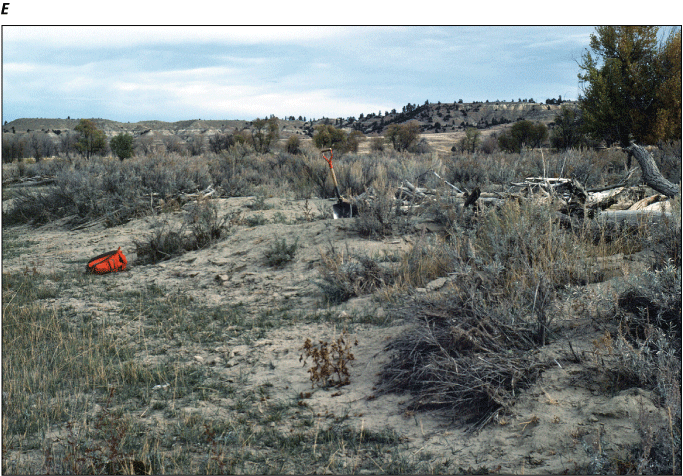
A, Aerial photograph of a bedrock-constricted segment of Powder River valley southeastern Montana, showing location of valley transect V103 (refer to table 2 for Universal Transverse Mercator coordinates), on which small thicknesses (mostly less than 10 centimeters) of sediment were deposited by the flood of May 1978. Arrow indicates direction of flow in the channel. Aerial photograph by Bill Woodcock, Aerial Survey, Inc., Miles City, Mont., September 1978. Sta., station; T, true bearing. B, Transect profile showing the sediment deposited during the flood of May 1978 along valley transect V103. The 1978 surface was estimated from 7.5-minute Bradshaw Creek quadrangle, and the 1977 surface is equal to the 1978 surface minus the sediment thickness. C, Graph showing thickness of sediments deposited by the Powder River flood of May 1978 along valley transect V103. Vertical scale has been exaggerated to show textural details of the lateral fining of sediment particle sizes with increasing distance from the river channel, and details of the upward coarsening of particle sizes from mud to silt and from silt to very fine sand. Spikes represent many lee dunes onto which the sands, and the silts to the east of point 103A, were deposited. D, Photograph showing view southwestward (upvalley) of a lee dune, about 1 meter high, on the downriver side of the willow tree that was designated point 103A in valley transect V103. Photograph by Robert H. Meade, U.S. Geological Survey (USGS), October 24, 1978. Only the topmost 20 centimeters of this lee dune were deposited by the May 1978 floodwaters; most of this lee dune was in place (for years, presumably) before 1978. Also note, the flood debris entangled in the fence line in the middle distance. E, Photograph showing view northeastward (downvalley) of very fine sand deposited by 1978 floodwaters among sagebrush plants, approximately 30 meters east of point 103A. Photograph by Robert H. Meade, USGS, October 24, 1978. Refer to figure 1 for location of valley transect.
Sediments deposited by the 1978 flood along transect V103 averaged less than 10 centimeters (cm) in thickness (table 1.1; fig. 1.1B,C), owing probably to the high velocities that must have accompanied the peak floodflows that swept through this narrowly constricted segment of the valley. Even so, these sediments had the two general textural characteristics—lateral fining with distance away from the main channel, and upward coarsening from muds to silts to very fine sands (fig. 1.1C)—that also are typical of the flood-deposited sediments in wider segments of the valley.
Table 1.1.
Thickness and lithology of sediment deposited along valley transect V103 during the May 1978 flood on Powder River, southeastern Montana, measured on October 24, 1978.[Modified from Moody and Meade (2022, V103_V2). The number of sample sites is 46. Transect is on a bearing of 084 degrees magnetic from point 103A. 1 pace equals 0.96 meter. Refer to table 2 for Universal Transverse Mercator coordinates of point 103A. m, meter; cm, centimeter; cs, coarse sand; ms, medium sand; fs, fine sand; vfs, very fine sand; —, no data; np, size fraction not present in coarsening-upward sequence; n, number sample sites]
Silts were predominant among the particle sizes deposited by the 1978 flood (fig. 1.1C). Basal muds, mostly 1–2 cm in thickness, were deposited sporadically (or sporadically survived post-depositional episodes of resuspension by accelerating floodwaters) at about one-half the stations that were sampled. The flood-deposited sands were generally very fine in texture and were deposited mostly in natural sediment traps, which became lee dunes downriver from willow trees (fig. 1.1D) or from sagebrush bushes (fig. 1.1E). Complete data on thickness and lithology are listed in table 1.1.
Valley Transect V113
Valley transect V113 crossed the fragments of a Lightning terrace. These terrace surfaces bounded a cross-valley-oriented segment of the channel of Powder River that flows eastward along the northern edge of section 18 of township 9S, range 48E (fig. 1.2A). Floodwaters inundated the right-bank terrace (elevation 1,023.2 m) but not the slightly higher left-bank terrace (elevation 1,023.9 m at station −83.9). This transect lies along the same surveyed line as main channel cross section PR113, whose history is discussed in more detail in previous reports by Moody and Meade (2018, p. 9–14) and by Meade and Moody (2013, especially fig. 17). (Refer to table 2 for UTM coordinates.)
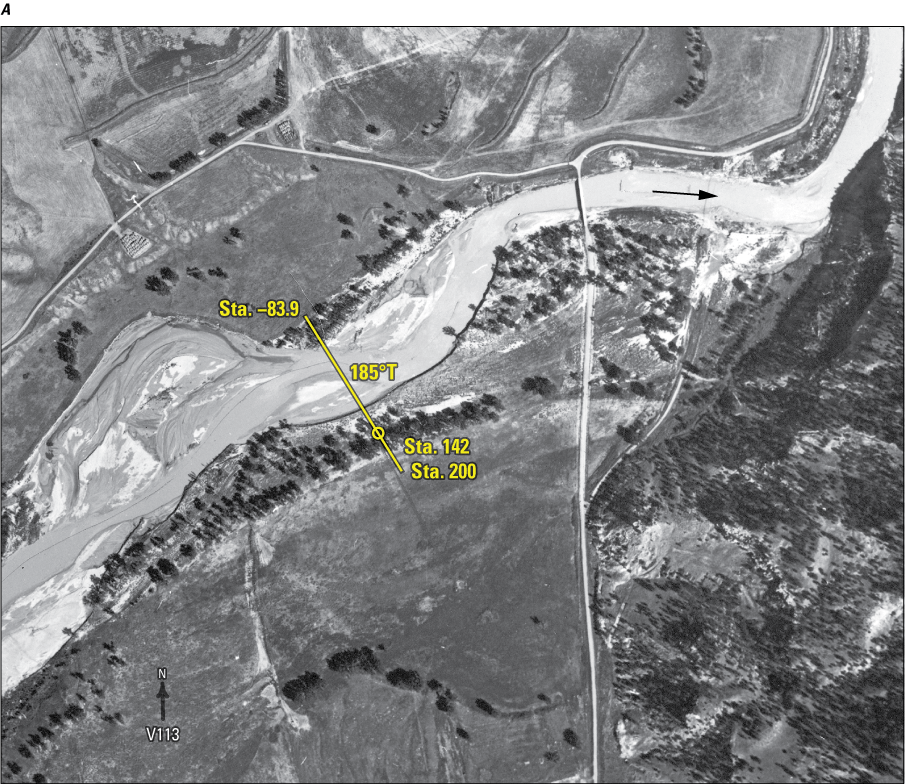
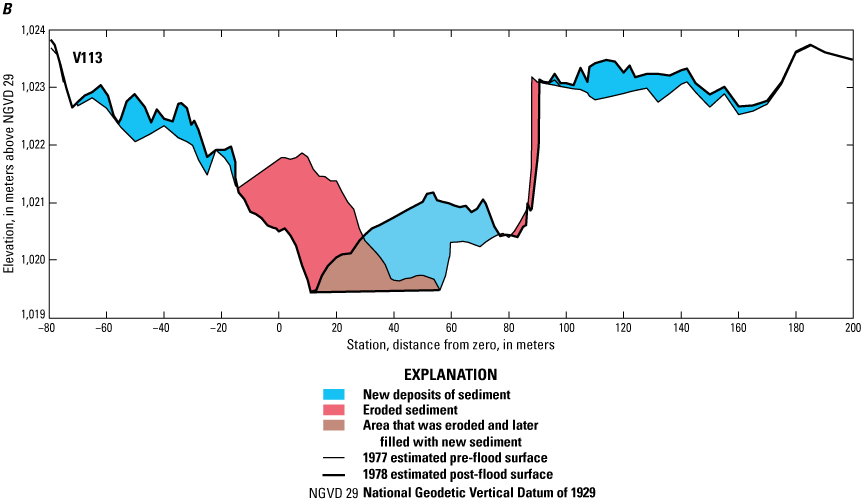

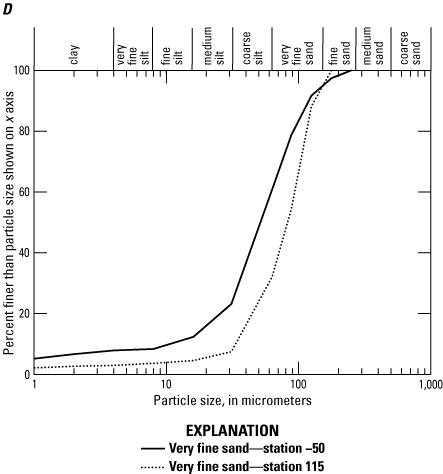
A, Aerial photograph showing valley transect V113 and channel cross section PR113 traversing cross-valley-flowing reach of Powder River at Moorhead (USGS streamgage site 06324500), southeastern Montana (refer to table 2 for Universal Transverse Mercator coordinates). Arrow indicates direction of flow in the channel. Aerial photograph by Bill Woodcock, Aerial Survey, Inc., Miles City, Mont., September 1978. Sta., station; T, true bearing. B, Transect profile showing thicknesses of sediment eroded from and deposited along cross section PR113 and valley transect V113 (which starts at station 100) during the flood of May 1978. C, Graph showing thicknesses of sediments for different particle-size classes deposited by the Powder River flood of May 1978 along valley transect V113 as a function of horizontal distance. Large thicknesses of very fine sand at cross-channel distances of 110 and 135 meters likely represent lee dunes that formed downriver from trees growing on the right-bank terrace. D, Graph showing particle-size distributions of selected samples of overbank sands deposited by the Powder River flood of May 1978 along valley transect V113. (Refer to samples listed in table 3 and footnote in table 1.2.)
At this location in Powder River valley, most of the deposition was within the main river channel and on the channel-adjacent floodplain. The point bar on the left side was eroded and redeposited on the right side of the channel during the flood (fig. 1.2B). Flood-deposited sediments on the right-bank terrace were predominantly very fine sands, and those deposited on the left bank were mostly fine sands and medium sands (fig. 1.2C; table 1.2). The sediments deposited by the 1978 flood on the Lightning terrace of transect V113 did not provide clear examples of coarsening-upward textures or of progressive fining of particle sizes with increasing distances landward from the channel banks. The mud most likely was deposited by backwater moving slowly upriver, following the swale (between stations 150 and 170, fig. 1.2B) that was connected to the main channel downriver. This mud was trapped within the grass, which prevented erosion as the water level rose and deposited the very fine sand at high water. Later, the flow in the swale reversed and flowed back downriver.
Table 1.2.
Thickness and lithology of overbank sediment deposited along cross section PR113 and valley transect V113 during the May 1978 flood on Powder River, southeastern Montana, measured on September 21 (stations 90.7 to 185), and October 22 (stations −83 to −15), 1978.[Modified from Moody and Meade (2022, V113_V2). The number of sample sites is 37. Transect includes cross section PR113 and an extension starting at station 100 on a magnetic bearing of 171 degreesStations are horizontal distance in meters; . Refer to table 2 for Universal Transverse Mercator coordinates of stations −83.9, 142, and 200. m, meter; cm, centimeter; cs, coarse sand; ms, medium sand; fs, fine sand; vfs, very fine sand; gray shading indicates particle-size analysis—refer to table 3; np, indicated size fraction not present in coarsening-upward sequence; —, no data; n, number sample sites; refer to table 2 for Universal Transverse Mercator coordinates of stations −83.9, 142, and 200]
Indicates particle-size analysis (refer to table 3 and figure 1.2D).
Average sediment thickness on the right-bank terrace was 21 cm from station 90.7 to station 185, and 23 cm on the left-bank terrace between station −15 and −83. The maximum thickness was 83 cm. Complete data on thickness and lithology are listed in table 1.2. Particle sizes of selected sand samples are listed in table 3 and graphed in figure 1.2D.
Valley Transect V120
Valley transect V120 was on a segment of Lightning-level terrace adjoining the right bank of a stabilized reach of Powder River in section 33 of township 8S, range 48E. This reach of the river had been stabilized for at least 70–80 years (Martinson and Meade, 1983, sheet 1) by a bedrock bluff, 1 km upriver from transect V120.
At the location of transect V120 (fig. 1.3A; refer to table 2 for UTM coordinates), the 1978 floodwaters topped the bank and moved onto the right-bank terrace until their lateral progress was halted by a ranch dike (station 240) that had been constructed about 150 m from the right edge of the channel. The left-bank terrace, which was not overtopped by the floodwaters, received no new overbank sediment during May 1978.
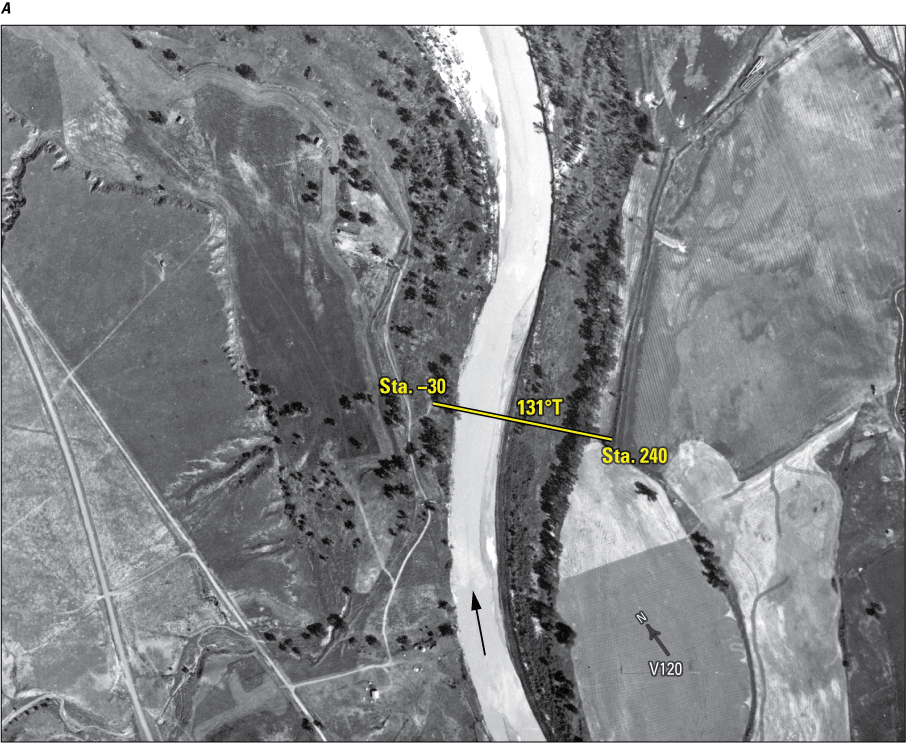
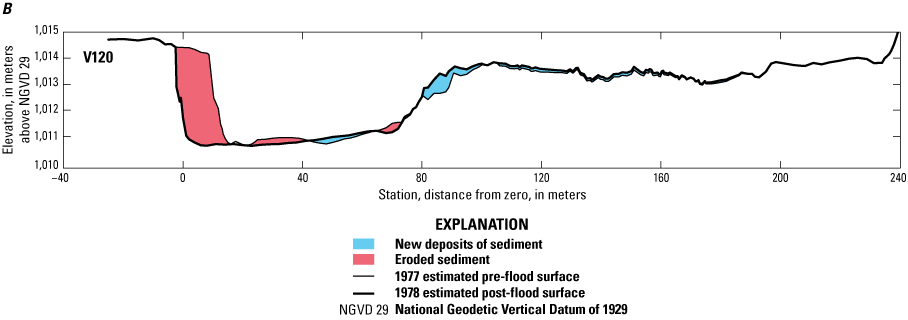
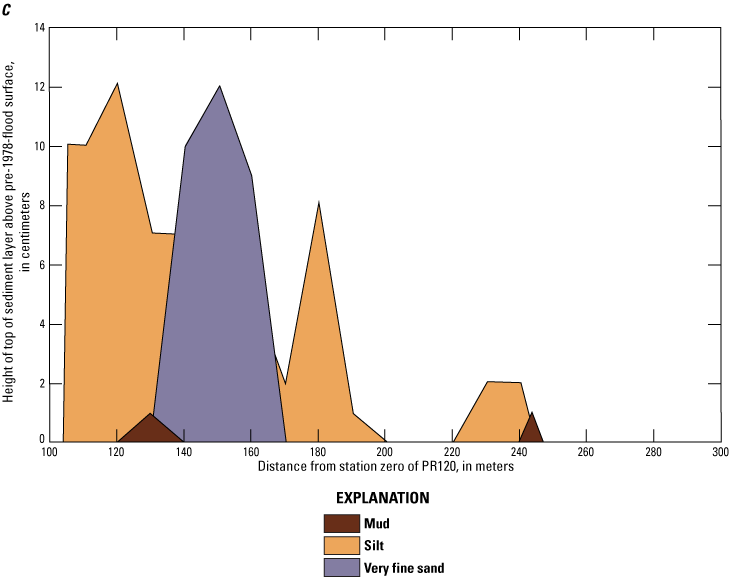
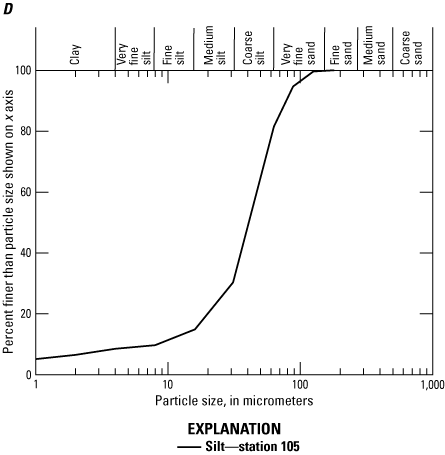
A, Aerial photograph showing segment of Powder River, southeastern Montana, showing location of valley transect V120, on which overbank sediments were deposited on the right-bank terrace by the flood of May 1978 (refer to table 2 for Universal Transverse Mercator coordinates). Arrow indicates direction of flow in the channel. Aerial photograph by Bill Woodcock, Aerial Survey, Inc., Miles City, Mont., September 1978. Sta., station; T, true bearing. B, Transect profile showing thicknesses of sediment eroded from and deposited in channel cross section PR120 and along valley transect V120 (which starts at station 105) during the flood of May 1978. The 1978 surface greater than station 104 was assumed equal to the surface surveyed in 2000, and the 1977 surface is equal to the 1978 surface minus the sediment thickness. C, Graph showing thicknesses of sediments for different particle-size classes deposited by the Powder River flood of May 1978 along valley transect V120 as a function of horizontal distance. D, Graph showing particle-size distribution of a typical silt deposited by the Powder River flood of May 1978 along valley transect V120. (Refer to samples listed in table 3 and footnote in table 1.3.)
Valley transect V120 lies along the same line as channel cross-section PR120 but is extended 135 m across the valley. The history of PR120 (1975–2015) is described in some detail by Moody and Meade (2018, p. 18–24). Post-1978 floodplain deposits at this cross section on the right bank (fig. 1.3B) have been discussed by Moody and others (1999) and described in detail by Pizzuto and others (2008).
Silts constitute most of the overbank sediments deposited by the flood of May 1978 along transect V120. Muds probably were deposited when backwater moved up the swale between stations 170 and 190. Very fine sands were deposited, most likely as lee dunes downriver from low-level vegetation (stations 104–180). Field notes refer to them as “sand stringers” because no obvious vegetation was present in 2000 when the surface was surveyed. Trees were noted between stations 180 and 201. Particle-size classes are listed in table 1.3 and shown in figure 1.3C.
Table 1.3.
Thickness and lithology of sediment deposited along valley transect V120 during the May 1978 flood on Powder River, southeastern Montana, measured on October 22, 1978.[Modified from Moody and Meade (2022, V120_V2). The number of sample sites is 17. Transect is an extension of cross section PR120 starting at station 105 on a magnetic bearing of 117 degrees. stations are horizontal distance in meters. Refer to table 2 for Universal Transverse Mercator coordinates stations −30.0 and 240. m, meter; cm, centimeter; cs, coarse sand; ms, medium sand; fs, fine sand; vfs, very fine sand; np, size fraction not present in coarsening-upward sequence; —, no data]
Indicates particle-size analysis (refer to table 3 and figure 1.3D).
Average sediment thickness across the Lightning terrace from stations 105 to 244 was 5 cm with a maximum of 12 cm. Complete data on thickness and lithology are listed in table 1.3. Particle-size analysis of a typical silt sample is listed in table 3 and shown in figure 1.3D.
Valley Transect V125
Valley transect V125 was across a segment of Lightning-level terrace. This segment of terrace had remained mostly stable for at least 50–60 years (Martinson and Meade, 1983, sheet 1) inside a large meander loop of Powder River in sections 22 and 27 of township 8S, range 48E. The transect was an extension of channel cross section PR125 (Moody and Meade, 2018, p. 34–38) starting at station 110. It changed direction at station 260 to become more transverse to the valley axis, and thus, more orthogonal to the apparent direction of the sediment-depositing overbank flows of the flood of May 1978 (fig. 1.4A, B; refer to table 2 for UTM coordinates).
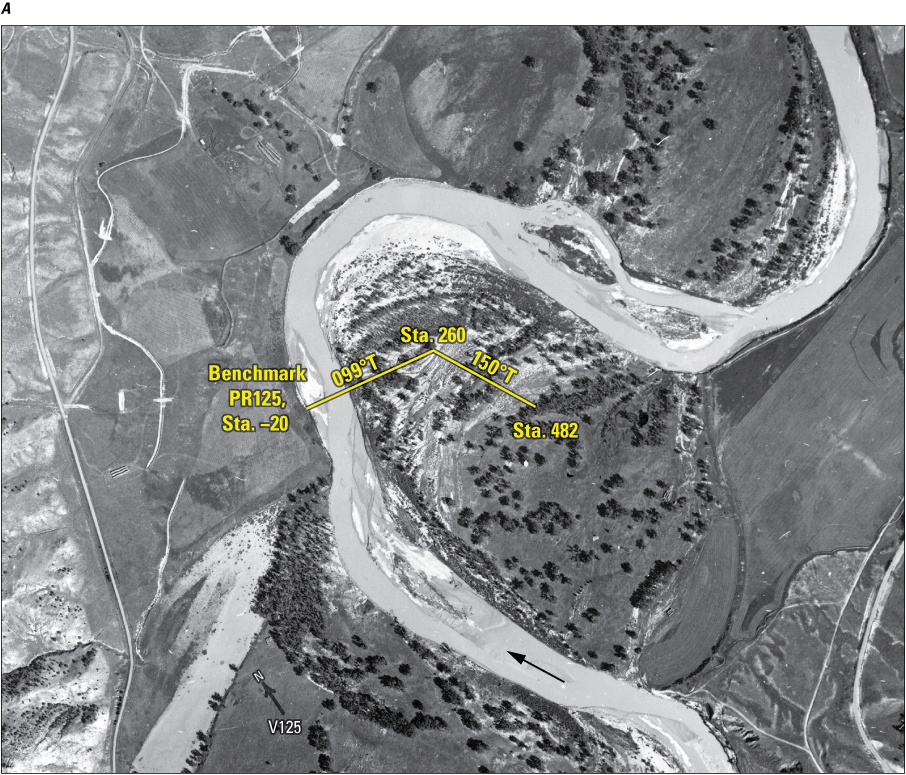
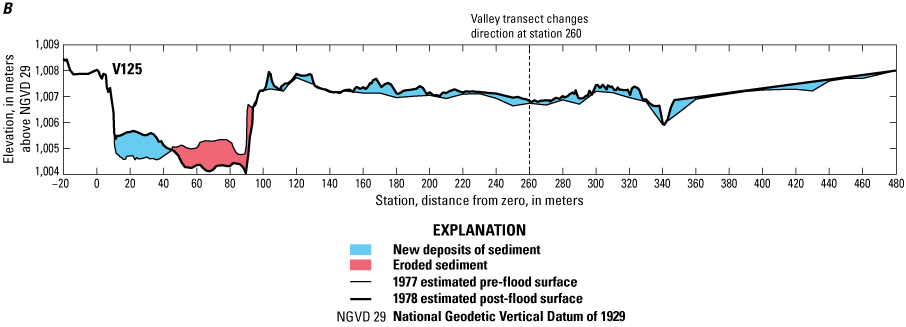
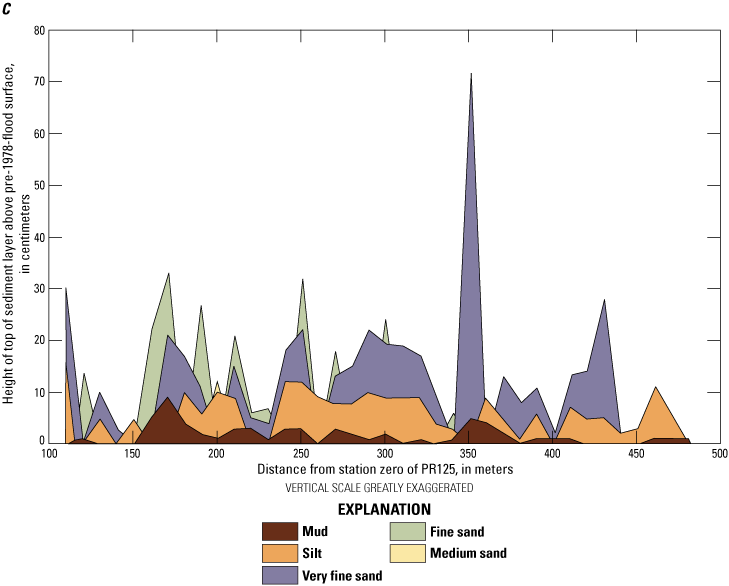
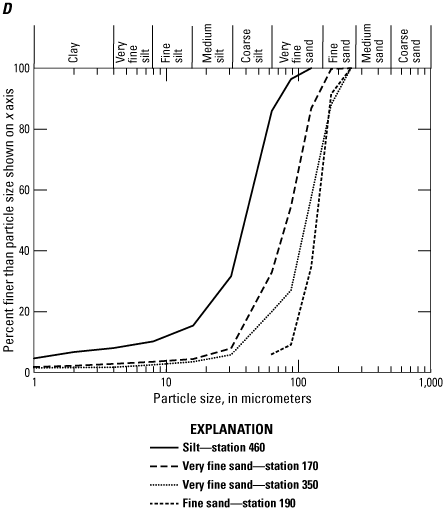
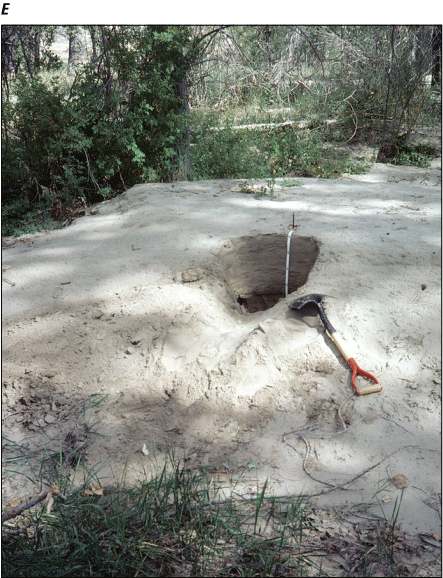
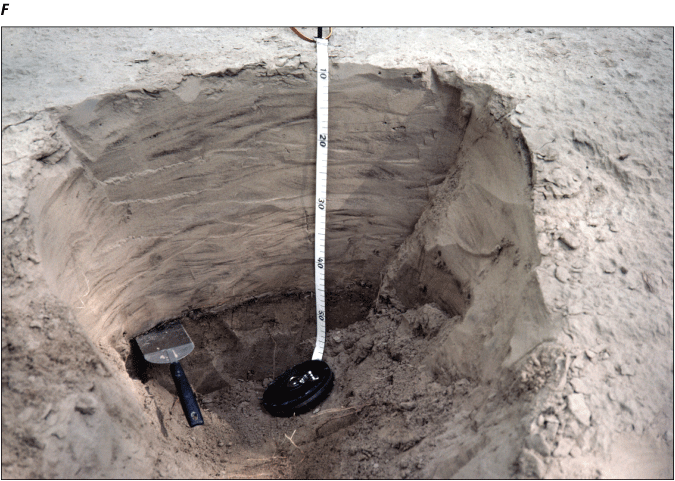
A, Aerial photograph showing reach of Powder River, southeastern Montana, location of valley transect V125 and PR125 inside the loop of a stable meander on which overbank sediments were deposited by the flood of May 1978 (refer to table 2 for Universal Transverse Mercator coordinates). Arrow indicates direction of flow in the channel. Aerial photograph by Bill Woodcock, Aerial Survey, Inc., Miles City, Mont., September 1978. Sta., station; T, true bearing. B, Transect profile showing thicknesses of sediment eroded from and deposited along cross section PR125 and valley transect V125 during the flood of May 1978. Valley transect V125 starts at station 110, and the 1978 surface eastward from station 110 was assumed equal to the surface surveyed in 2018, and the 1977 surface is equal to the 1978 surface minus the sediment thickness. C, Graph showing thicknesses of sediments for different particle-size classes deposited by the Powder River flood of May 1978 along valley transect V125 as a function of the horizontal distance. Vertical scale has been exaggerated to show details of lateral textural fining and upward coarsening. D, Graph showing particle-size distributions of selected samples of overbank sediments deposited by the Powder River flood of May 1978 along valley transect V125. (Refer to samples listed in table 3 and footnote in table 1.4.) E, Photograph showing lee dune (downvalley) deposited on low terrace of Powder River by the flood of May 1978. View is toward station 170 of valley transect V125. Photograph by Robert H. Meade, U.S. Geological Survey (USGS), September 2, 1978. F, Photograph showing excavation of lee dune (downvalley) about 10 meters upriver from station 170, along valley transect V125. Spatula indicates the preflood ground-level surface. Tape units are centimeters. Photograph by Robert H. Meade, USGS, September 2, 1978. Refer to figure 1 for location of valley transect.
The flood-deposited sediments that were measured along transect V125 showed the two most defining textural features of the assemblage of overbank sediments deposited by the Powder River flood of May 1978: (1) the lateral fining of sediment particle sizes—in the sequence of fine sand, very fine sand, and silt—with increasing lateral distances away from the main channel of Powder River; and (2) the coarsening upward of sediment particle sizes, from basal muds into silts and sands. Both textural features are portrayed in figure 1.4C. Some of the mud in the swale (stations 330–360, fig. 1.4B) may be backwater deposits as floodwaters early in the flood moved upriver in the swale.
Much of the flood-deposited sand along transect V125 was in the form of lee dunes, which are longitudinal sand bodies that form in the wakes of floodflows around the trunks of cottonwood trees and other standing vegetation (Moody and Meade, 2008, p. 395–397). Most of the spiky-looking accumulations of fine sand and very fine sand in figure 1.4C indicate the locations where the transect crosses lee dunes. Parts of the lee dune that was crossed at transect station 170 are shown in figures 1.4E and F. This dune is part of a collection of lee dunes just south of transect stations 160–180. Judging from their orientation in figure 1.4A, these lee dunes were deposited when the overflowing floodwaters were being directed eastward across the neck of the meander in a downvalley direction. The change in particle size along this transect shows the variability caused by lee dunes (created by vegetation traps downstream from trees and shrubs) on the general trend of decreasing particle size with distance from the channel (fig. 9A).
Average sediment thickness adjacent to the channel (stations 110–260) was 16 cm, and the average thickness approximately orthogonal to the downvalley flow across the neck of the meander (stations 260–482) was 14 cm. Maximum thickness was 72 cm. Complete data on thickness and lithology are listed in table 1.4. Particle sizes of selected samples are listed in table 3 and graphed in figure 1.4D.
Table 1.4.
Thickness and lithology of sediment deposited along valley transect V125 during the May 1978 flood on Powder River, southeastern Montana, measured on October 20, 1978.[Modified from Moody and Meade (2022, V125_V2). The number of sample sites is 40. Transect is an extension of cross section PR125 starting at station 110 on an azimuth of 84.5 degrees magnetic. Stations are horizontal distance in meters. Distances from station 260 are on an azimuth of 135 degrees magnetic. Refer to table 2 for Universal Transverse Mercator coordinates for station −20, 260, and 482. m, meter; cm, centimeter; cs, coarse sand; ms, medium sand; fs, fine sand; vfs, very fine sand; np, size fraction not present in coarsening-upward sequence; —, no data]
Indicates particle-size analysis (refer to table 3 and figure 1.4D).
Valley Transect V130
Valley transect V130 crosses a river bend near the left edge of the Powder River valley in section 14 of township 8S, range 48E. This channel segment had been fairly stable for many years (Martinson and Meade, 1983, sheet 1), presumably owing to its location near the bedrock wall of the valley, and to the bedrock layers of sandstone and coal that are visible in the channel bottom just upriver from channel cross section PR130 (Moody and Meade, 2018, p. 39–41). Floodwaters of May 1978 did not overflow the left bank but spread across about three-quarters of the valley on the right bank. Valley transect V130 was an extension of the channel cross-section PR130 starting at station 115. It changed direction at station 335 to become more transverse to the valley axis and, thus, more orthogonal to the apparent direction of the sediment-depositing overbank flows of the flood of May 1978 (fig. 1.5A; refer to table 2 for UTM coordinates).
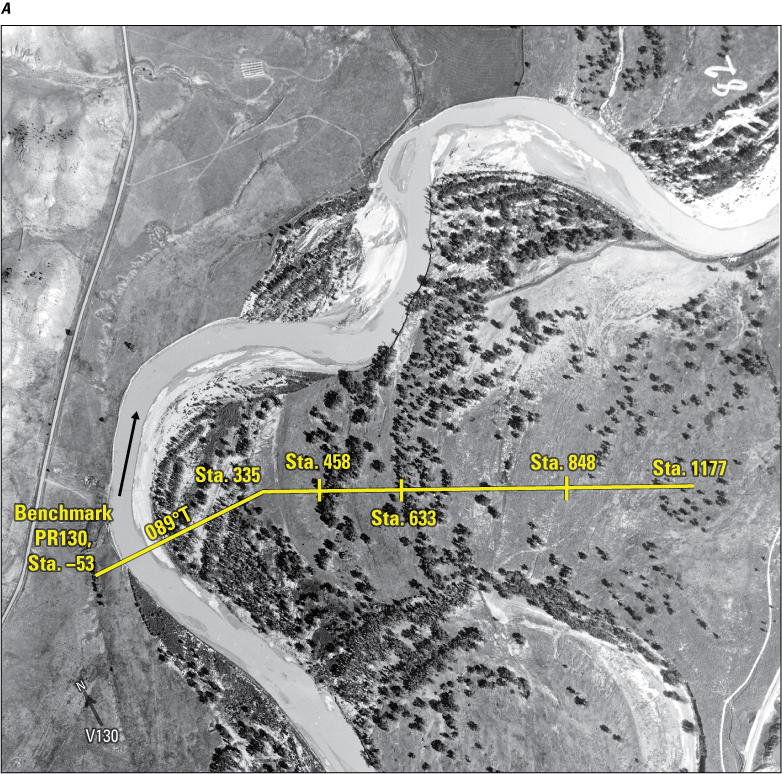
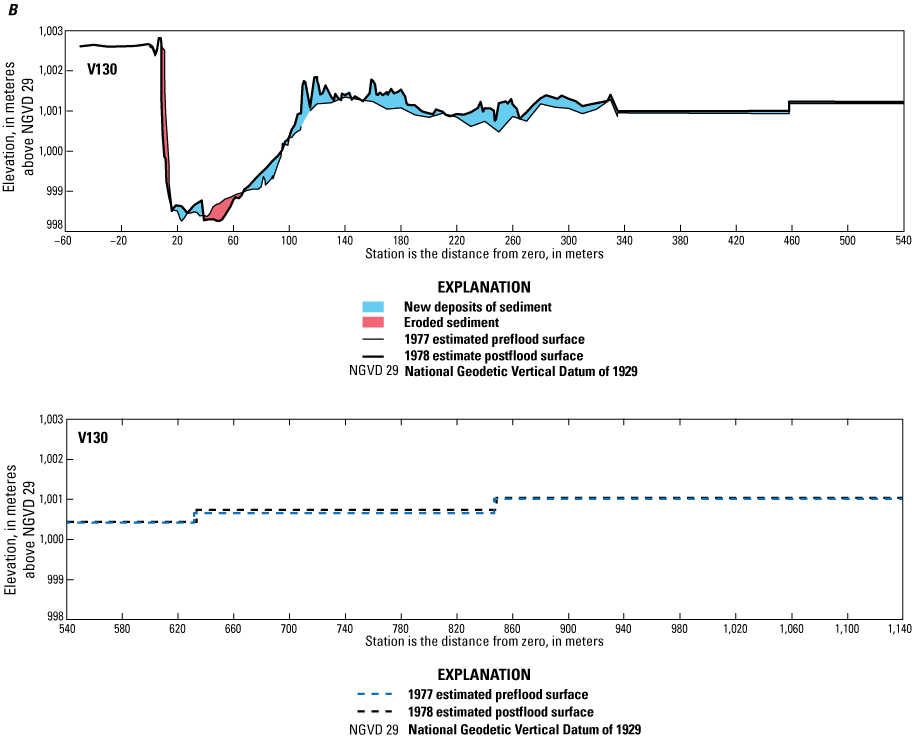
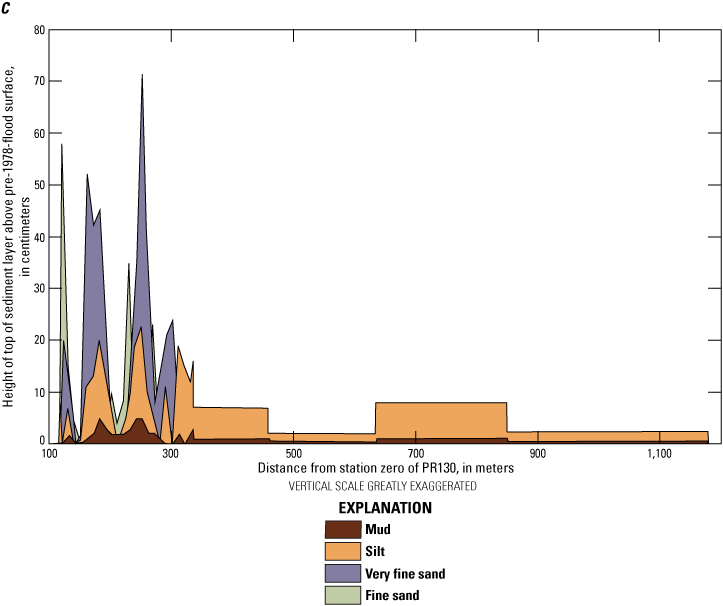
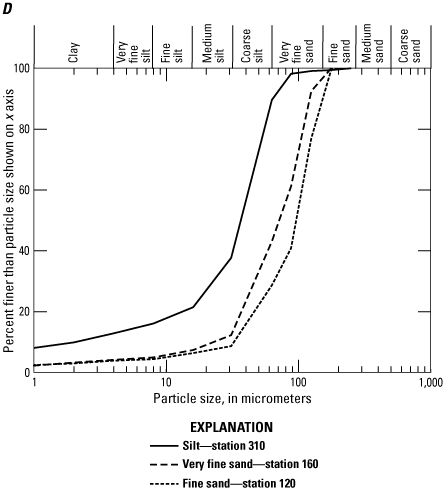
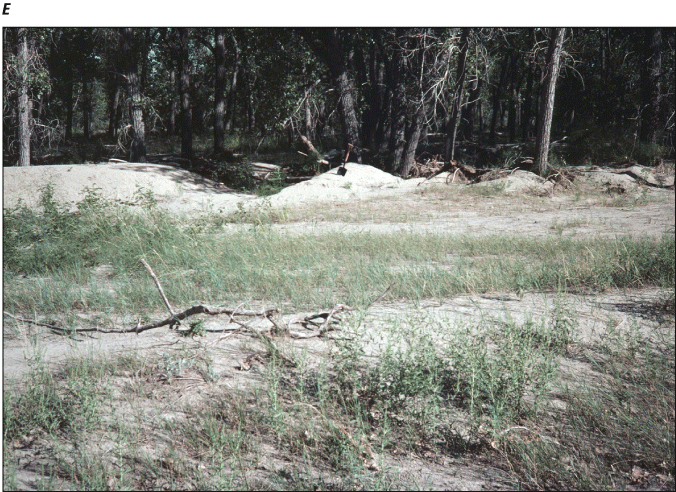
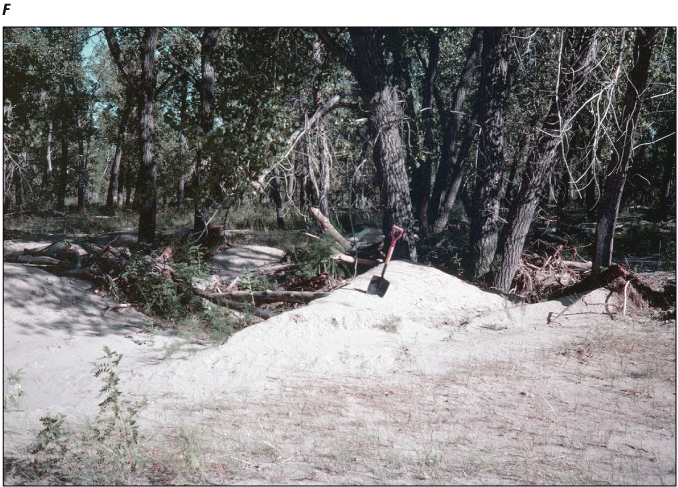
A, Photograph showing reach of Powder River, southeastern Montana, location of valley transect V130 inside a double-looped meander upon which overbank sediments were deposited by the flood of May 1978 (refer to table 2 for Universal Transverse Mercator coordinates). Arrow indicates direction of flow in the channel. Aerial photograph by Bill Woodcock, Aerial Survey, Inc., Miles City, Mont., September 1978. Sta., station; T, true bearing. B, Transect profile in two segments showing the thicknesses of eroded and deposited sediment along the cross section PR130 and valley transect V130 during the flood of May 1978. Valley transect V130 starts at station 115. The 1978 surface, greater than station 108 but less than station 335, was assumed equal to the surface surveyed in 2000, and the 1978 surface, greater than station 335, was estimated from the 7.5-minute Bloom Creek quadrangle. The 1977 surface is equal to the 1978 surface minus the sediment thickness. C, Graph showing thicknesses of sediments deposited for different particle-size classes by the Powder River flood of May 1978 along valley transect V130 as a function of the horizontal distance. Lee dunes (spikes in plot) have particle-size distributions that coarsen upward between stations 120 and 330. Thicknesses of silt shown between station 335 and 1177 are based on averaged measurements (refer to table 1.5). D, Graph showing particle-size distributions of selected samples of overbank sediments deposited by the Powder River flood of May 1978 along valley transect V130. (Refer to samples listed in table 3 for valley transect V130 and footnote in table 1.5.) E, Photograph showing south–southwest (upvalley) of lee dunes deposited by 1978 floodwaters on the downriver sides of trees near stations 210–240 of valley transect V130. Lee dunes show as thin white streaks in figure 1.5A. Photograph by Robert H. Meade, U.S. Geological Survey (USGS), September 1, 1978. F, Photograph showing south–southwest (upvalley) view of lee dune deposited by 1978 floodwaters near station 230 of valley transect V130. Length of shovel is approximately 1 meter. The interior of this lee dune shows particle-size distributions that coarsen upward (table 1.5). Photograph by Robert H. Meade, USGS, September 1, 1978.
Sediment thicknesses ranged from 2 to 52 cm (average 24 cm) through the bands of cottonwood trees starting near station 115 and ending near station 335 (table 1.5), and then became a thin veneer (2–8 cm; average 5 cm) of basal mud and silt across the slightly sloping surface of the upper part of the point-bar neck to station 1177. The maximum total sediment thickness was 72 cm. Between the channel and station 335, the 1978 floodwaters deposited sediments mostly in the form of lee dunes (fig. 1.5E, F). Within each accumulating lee dune, the coarsening-upward sequence apparently developed as basal muds were overtopped by silts that, later in the flooding, were themselves overtopped by sands (table 1.5; fig. 1.5C). Particle sizes of selected samples are listed in table 3 and graphed in figure 1.5D.
Table 1.5.
Thickness and lithology of sediment deposited along valley transect V130 during the May 1978 flood on Powder River, southeastern Montana, measured on October 20, 1978.[Modified from Moody and Meade (2022, V130_V2). The number of sample sites is 28. Transect is on the line of section (075 degrees magnetic) of cross section PR130. Stations are horizontal distance in meters. 1 pace equals 1 meter. At station 335 the magnetic bearing of the transect changes to 100 degrees, and distances thereafter are based on a scale of 1 mm equals 10.26 m. Refer to table 2 for Universal Transverse Mercator coordinates of station −53, 355, and 1177. m, meter; cm, centimeter; cs, coarse sand; ms, medium sand; fs, fine sand; vfs, very fine sand; np, size fraction not present in coarsening upward sequence; —, no data]
Indicates particle-size analysis (refer to table 3 and figure 1.5D).
Valley Transect V135
Valley transect V135 traversed a floodplain and two diked alfalfa fields atop a right-bank Moorcroft terrace. This transect is in the converging corners of sections 6 and 7 of township 8S, range 49E, and section 1 of township 8S, range 48E (refer to table 2 for UTM coordinates). Overbank sediments deposited by the May 1978 flood on the diked alfalfa fields had remained undisturbed when samples were collected on October 13, 1978 (fig. 1.6A, B). Although all the diked fields were inundated and had sediment from the May 1978 flood, all but the two southernmost diked fields had been recultivated and releveled by the local landowner by the time of the measurements. Because both these activities significantly rearranged the physical attributes of the flood deposits, we were obliged to confine the measurements to the uncultivated pair of diked fields. These fields were not flooded from the channel at the start of the transect but from upriver about 1 km along line A–A′ in figure 1.6A, which is 1.9 m above bedfull flow (Jim and Kathy Bowers, landowners, written commun., February 2022).
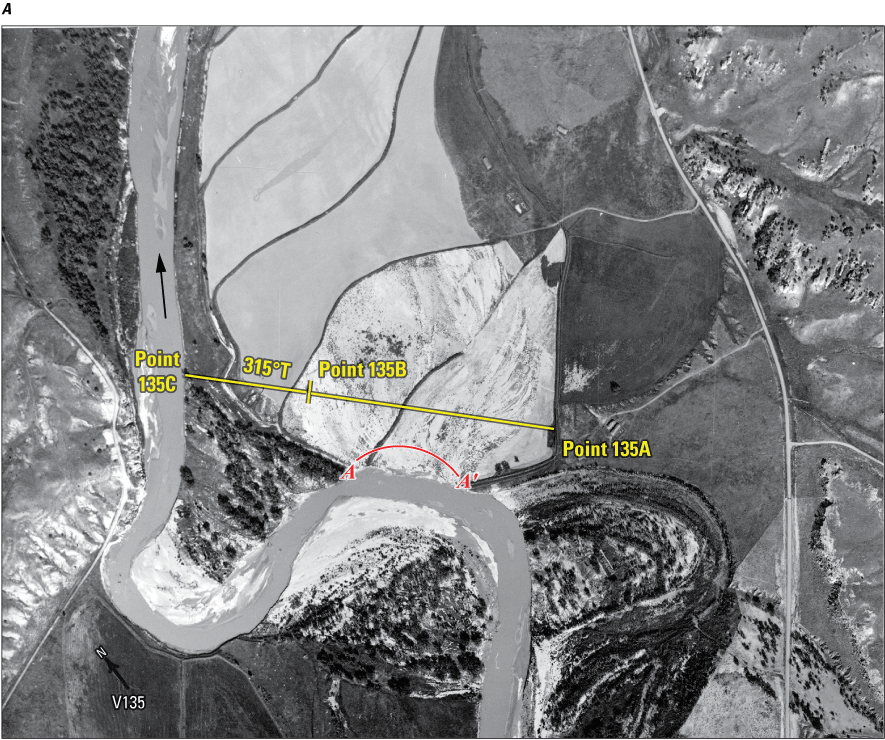
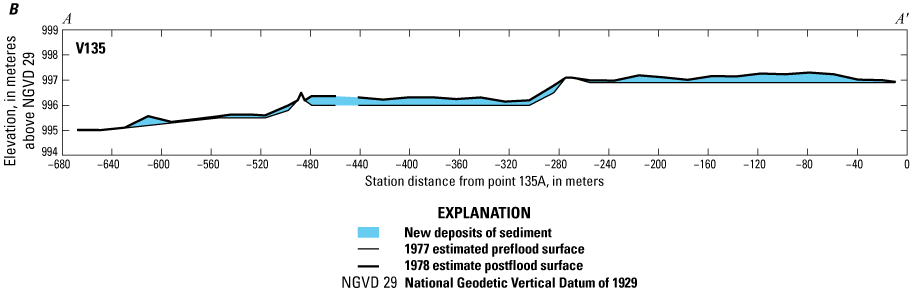
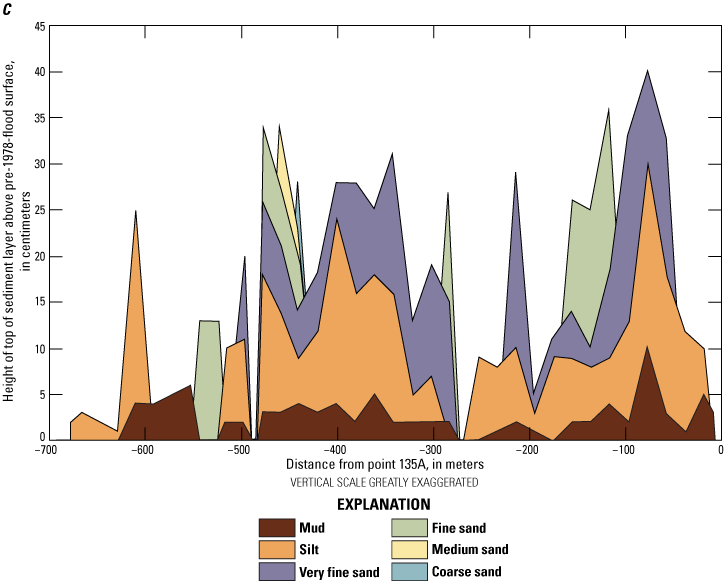
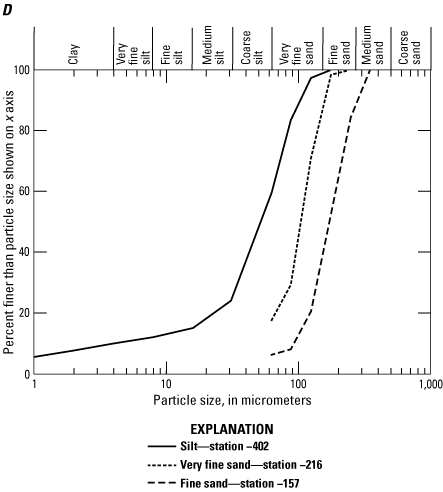
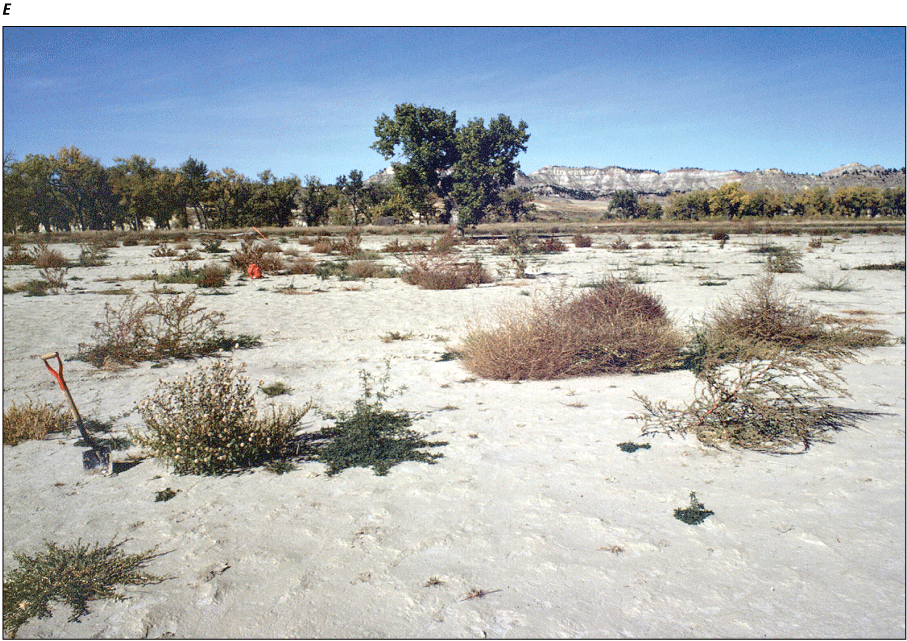
A, Aerial photograph showing reach of Powder River, southeastern Montana, location of valley transect V135 across a segment of Moorcroft-level terrace on which overbank sediments were deposited by the flood of May 1978. The two southernmost diked fields probably were inundated along curved line A–A′. The small, abandoned meander shown in the lower right of the photograph was not cut off by the 1978 flood; it had been cut off sometime from 1954 to 1967 (Martinson and Meade, 1983, sheet 1; Gay and others, 1998, p. 654–657). Arrow indicates direction of flow in the channel. Aerial photograph by Bill Woodcock, Aerial Survey, Inc., Miles City, Mont., September 1978. Sta., station; T, true bearing. B, Transect profile showing thicknesses of sediments deposited along valley transect V135 during the flood of May 1978. The 1977 surface was estimated from the 7.5-minute Bloom Creek quadrangle; the 1978 surface was equal to the 1977 surface plus the sediment thickness. C, Graph showing thicknesses of sediments for different particle-size classes deposited by the Powder River flood of May 1978 along valley transect V135 as a function of the horizontal distance. Vertical scale has been exaggerated to show details of upward coarsening of particle sizes. D, Graph showing particle-size distributions of selected samples of overbank sediments deposited by the Powder River flood of May 1978 along valley transect V135. (Refer to samples listed in table 3 and footnote in table 1.6.) E, Photograph showing northwestward view across valley of overbank sediments deposited by the flood of May 1978 on valley transect V135. Point 135B of transect V135 is a large, solitary tree, which is in the upper middle of the photograph. Red rucksack (left center of photograph) is 402 meters from point 135A. Photograph by Robert H. Meade, U.S. Geological Survey, October 13, 1978.
The transect has three distinct sections, each at a different elevation above the channel, and each section has an example of upward-coarsening vertical sequence (fig. 1.6C) with mostly muds to fine and medium sands (fig. 1.6D). Other than the tree at point 135B, there were no trees or shrubs on these sections and thus no lee dunes (fig. 1.6E).
Sediment thickness across the two diked fields was quasi-uniform, averaging 26 cm in one field between two points that are −441 m and −284 m from point 135A, and 21 cm in the higher field between two points that are −225 m and −10 m from point 135A. Average for entire transect was 18 cm with a maximum of 40 cm. Complete data on thickness and lithology are listed in table 1.6. Particle sizes of selected samples are listed in table 3 and graphed in figure 1.6D.
Table 1.6.
Thickness and lithology of sediment deposited along valley transect V135 during the May 1978 flood on Powder River, southeastern Montana, measured on October 13, 1978.[Modified from Moody and Meade (2022, V135_V2). The number of sample sites is 41. Transect is on a magnetic bearing of 301 degrees between points 135C and 135A. 1 pace between point 135A and 135B equals 0.98 meter. 1 pace between 135B and 135C equals 0.94 meter. Refer to table 2 for Universal Transverse Mercator coordinates for points 135A and 135C. m, meter; cm, centimeter; cs, coarse sand; ms, medium sand; fs, fine sand; vfs, very fine sand; np, size fraction not present in coarsening-upward sequence; —, no data]
Valley Transect V140
Valley transect V140 crossed a small point bar on the right side of the Powder River valley, in the northwest corner of section 32 of township 7S, range 49E (refer to table 2 for UTM coordinates). The point bar had grown eastward about 0.5 kilometer in the 6–7 decades since the original land surveys were made here (Martinson and Meade, 1983, sheet 2). Overbank sediments were being deposited on the point bar (fig. 1.7A, B), even as a much larger meander was being cut off, about 1 km downstream (Meade and Moody, 2013, figs. 9, 10), and the thalweg of the adjacent river channel was being deepened by 1 or 2 m (Gay and others, 1998, fig. 7).
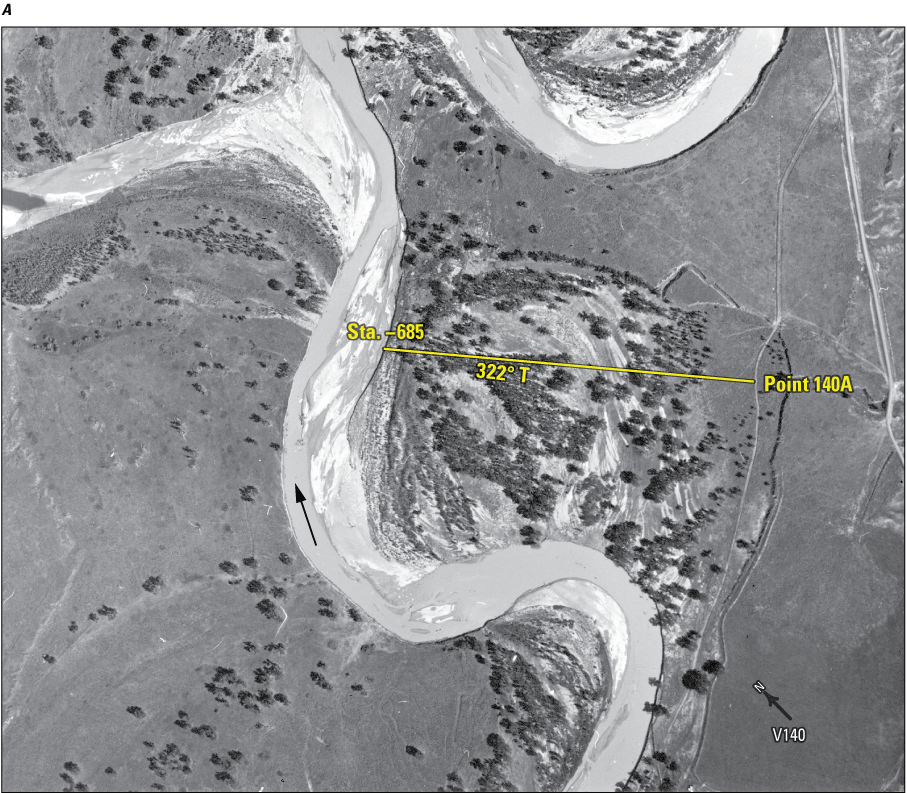
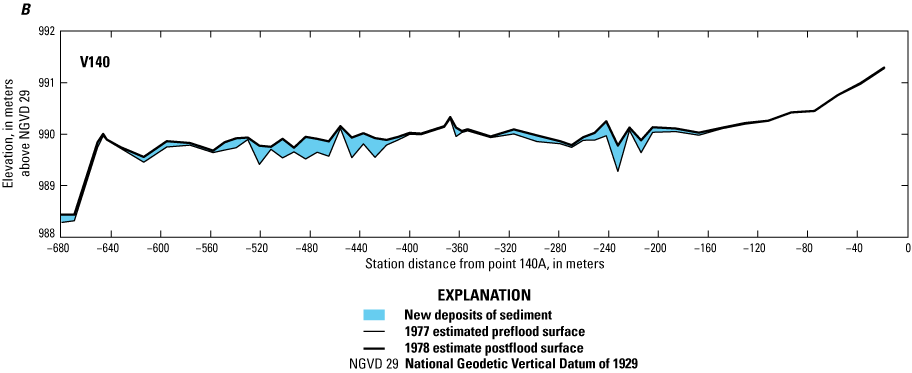
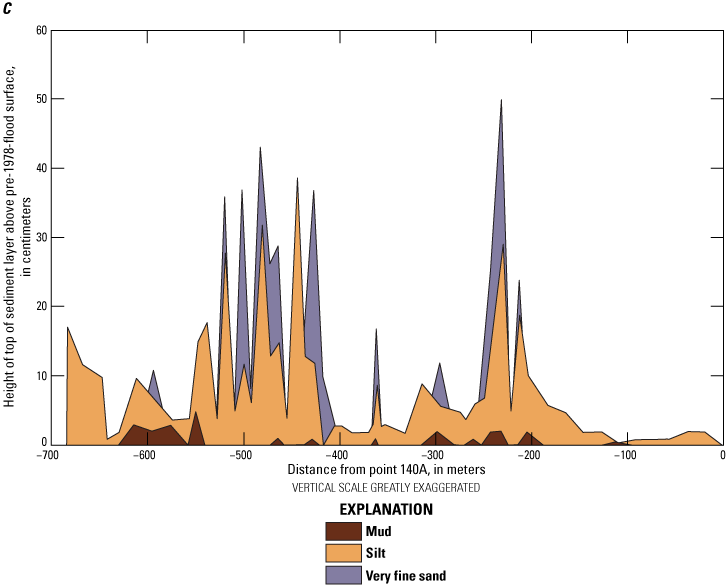
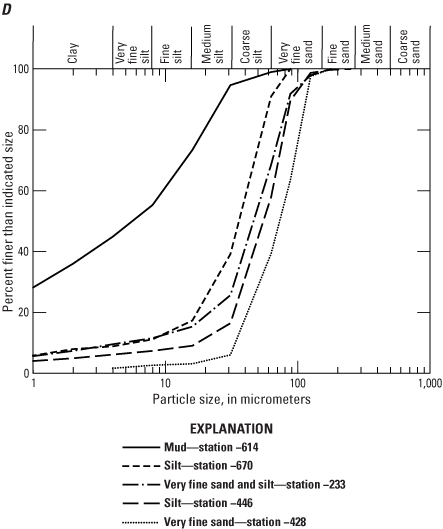
A, Aerial photograph showing reach of Powder River, southeastern Montana, location of valley transect V140 across a point bar on the right bank (refer to table 2 for Universal Transverse Mercator coordinates). Arrow indicates direction of flow in the channel. Aerial photograph by Bill Woodcock, Aerial Survey, Inc., Miles City, Mont., September 1978. Sta., station; T, true bearing. B, Transect profile showing thicknesses of sediments deposited along valley transect V140 during the flood of May 1978. The 1978 surface was assumed equal to the 2016 light detection and ranging surface, and the 1977 surface was equal to the 1978 surface minus the sediment thickness. C, Graph showing thicknesses of sediments for different particle-size classes deposited by the Powder River flood of May 1978 along valley transect V140 as a function of horizontal distance. Vertical scale has been exaggerated to show details of upward coarsening of particle sizes. D, Graph showing particle-size distributions of selected samples of overbank sediments deposited by the Powder River flood of May 1978 along valley transect V140. (Refer to samples listed in table 3 and footnote in table 1.7.)
Silts constituted more than one-half the sediments deposited on transect V140 by the flood of May 1978. Only a few deposits of mud were detected below some of the silts. Fine sands were deposited, in coarsening-upward sequence, atop the silts in a series of lee dunes within a band of cottonwood trees (fig. 1.7C).
Floodwaters moved across the nearly flat (elevation 990 m) point bar, depositing a layer of sediment with a thickness averaging 11.4 cm. The transect profile (fig. 1.7B) shows several locations with thick sediment deposits that are old channels or an area of ridges and swales on the point bar. At these locations, the average thickness was 19.6 cm (−200 to −260 m from point 140A) and 24.6 cm (−420 and −520 m from point 140A). Maximum thickness along the transect was 50 cm. The thickness thins out rapidly as the elevation at the distal end of the transect increases rapidly toward the edge of a terrace. Complete data on thickness and lithology are listed in table 1.7. Particle sizes of selected samples are listed in table 3 and graphed in figure 1.7D.
Table 1.7.
Thickness and lithology of sediment deposited along valley transect V140 during the May 1978 flood on Powder River, southeastern Montana, measured on October 13, 1978.[Modified from Moody and Meade (2022, V140_V2). The number of sample sites is 56. Transect is on a magnetic bearing of 308 degrees from point 140A. 1 pace equals 0.93 meters. Refer to table 2 for Universal Transverse Mercator coordinates for point 140A and station −685; m, meter; cm, centimeter; cs, coarse sand; ms, medium sand; fs, fine sand; vfs, very fine sand; np, size fraction not present in coarsening-upward sequence; n, number of sample sites]
Valley Transect V147
Valley transect V147 crossed a segment of terraced ranchland on the right side of Powder River, in the southwest corner of section 21 and the northwest corner of section 28 of township 7S, range 49E (refer to table 2 for UTM coordinates; fig. 1.8A). There was no evidence that water had inundated station −2.0 (elevation 983.9 m) on the left bank. Flooding appears to have started first along the right bank formed by a low Lightning terrace at the start of the transect near station 100.0 where the bank elevation is 983.4 m. Floodwater probably reached the upper (Moorcroft) terrace on the right bank by alternate routes. One possibility is that floodwater overtopped the bank upriver of the bend, along the line A–A′ in figure 1.8A, where the bank elevations decreased from 985.7 at A to 985.2 at A′.
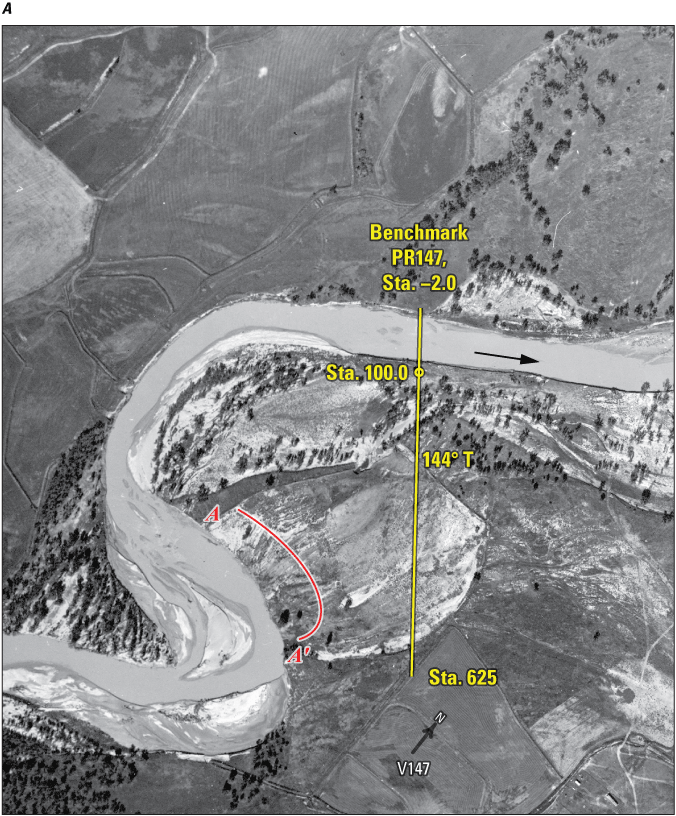
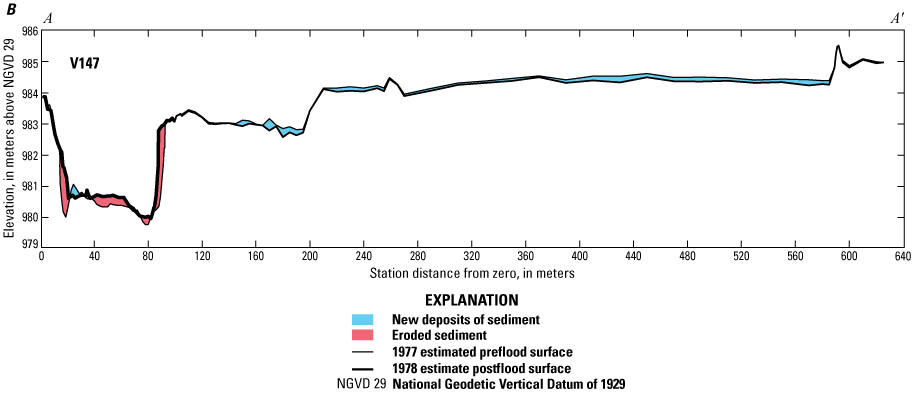
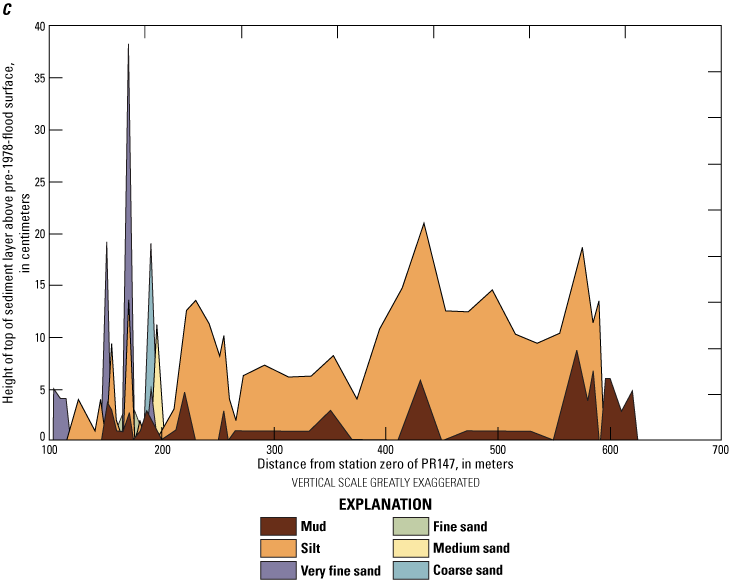
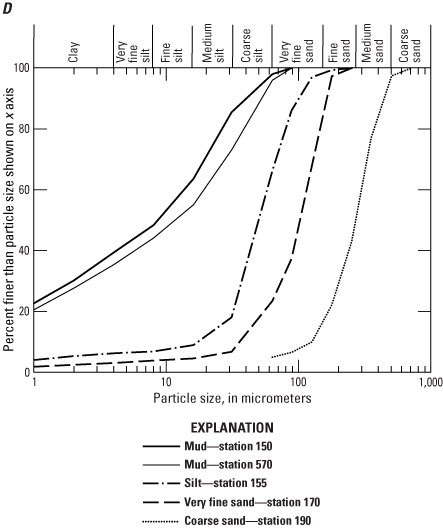
A, Aerial photograph showing reach of Powder River, southeastern Montana, location of valley transect V147 across a two-terraced segment of the right side of Powder River valley that received new deposits of overbank sediment during the flood of May 1978. Floodwater may have overtopped the bank along the line labeled A–A′ during a later part of the flood (refer to table 2 for Universal Transverse Mercator coordinates). Arrow indicates direction of flow in the channel. Aerial photograph by Bill Woodcock, Aerial Survey, Inc., Miles City, Mont., September 1978. Sta., station; T, true bearing. B, Transect profile showing thicknesses of sediment deposited along valley transect V147 during the flood of May 1978. The 1978 surface from station 100 to 625 was assumed equal to the 2016 light detection and ranging surface, and the 1977 surface was equal to the 1978 surface minus the sediment thickness. C, Graph showing thicknesses of sediments for different particle-size classes deposited by the Powder River flood of May 1978 along valley transect V147 as a function of horizontal distance. Vertical scale has been exaggerated to show details of upward coarsening of particle sizes. D, Graph showing particle-size distributions of selected samples of overbank sediments deposited by the Powder River flood of May 1978 along valley transect V147. (Refer to samples listed in table 3 and footnote in table 1.8.)
Overbank sediments deposited on transect V147 by the 1978 flood showed coarsening upward and fining outward. Muds probably were deposited by backwater that moved upriver in the swale between stations 170 and 200 (fig. 1.8B), which on light detection and ranging (lidar) images are shown connected to the main channel downriver but not upriver. Sands probably were deposited later during the flood on top of the mud as flow reversed and moved downriver in the swale. These sands and some gravels mostly were in the upper layers of the lee dunes that formed on the downriver sides of cottonwood trees that ended near station 210 (fig. 1.8B). The mud and relatively large thickness of silt on the upper Moorcroft terrace (fig. 1.8C) between stations 280 and 580 (fig. 1.8B) likely were deposited by flow that inundated the terrace gradually near point A′ (fig. 1.8A), forming a pool enclosed by the dikes visible in figure 1.8A.
The average sediment thickness across the lower Lightning terrace was 8.9 cm but was thickest (11–28 cm) in the swale between stations 170 and 200 (fig. 1.8B). Average thickness of mud and silt on the upper Moorcroft terrace was 7.9 cm. Maximum thickness was 38 cm. Complete data on thickness and lithology are listed in table 1.8. Particle sizes of selected samples are listed in table 3 and graphed in figure 1.8D.
Table 1.8.
Thickness and lithology of sediment deposited along valley transect V147 during the May 1978 flood on Powder River, southeastern Montana, measured on October 14, 1978.[Modified from Moody and Meade (2022, V147_V2). The number of sample sites is 55. Transect is an extension of the right bank of cross section PR147 starting at station 105 on bearing of 130 degrees magnetic; stations are horizontal distance in meters. Refer to table 2 for Universal Transverse Mercator coordinates for stations −2.0 and 625. m, meter; cm, centimeter; cs, coarse sand; ms, medium sand; fs, fine sand; vfs, very fine sand. np, size fraction not present in coarsening-upward sequence; n, number of sample sites]
Valley Transect V151
Valley transect V151 crosses the top of an approximately 400-m wide Lightning terrace (Martinson and Meade, 1983, sheet 2A) that adjoins the right bank of Powder River in section 15 of township 7S, range 49E (fig. 1.9A, B; refer to table 2 for UTM coordinates). Several hundred meters (m) downvalley of the transect is a high sandstone bluff that forced the 1978 overbank floodflows off the right-bank Lightning terrace and across the main channel of Powder River (fig. 1.9A). Valley transect V151 is a landward extension of channel cross section PR151 starting at station 105. At about station 370, the transect crosses a subsidiary channel, which probably was also a conduit for flow and sediment. The postflood history of PR151 has been previously narrated by Moody and Meade (2018, p. 63–66).
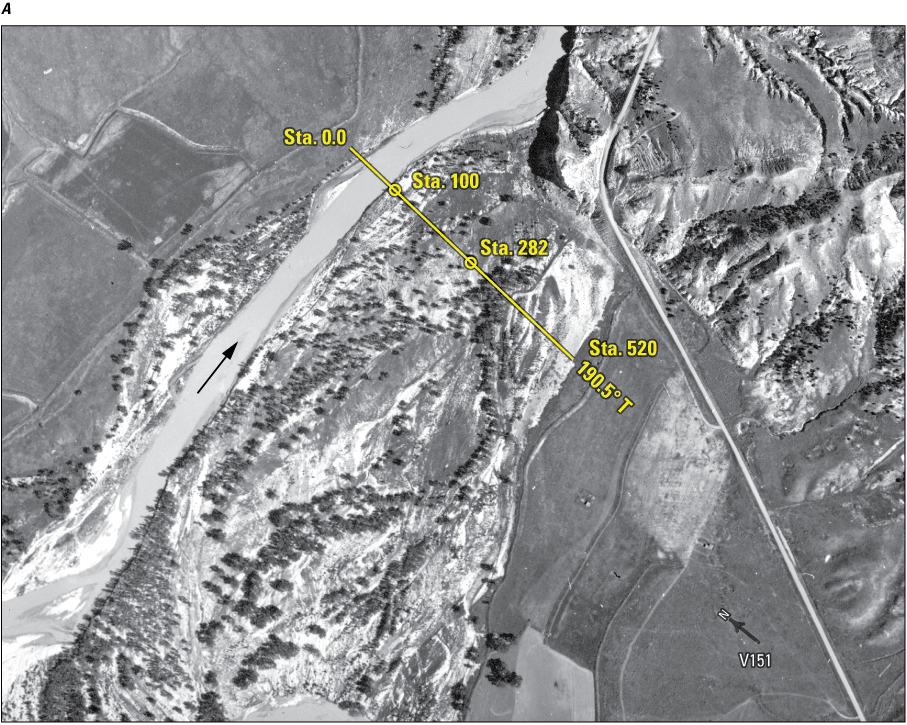
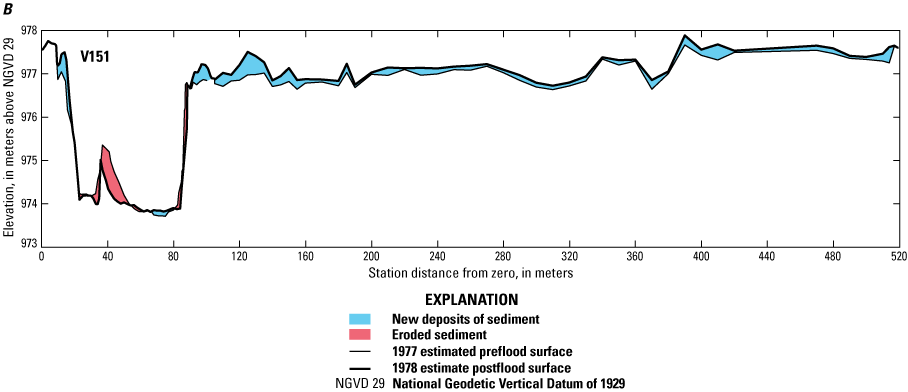
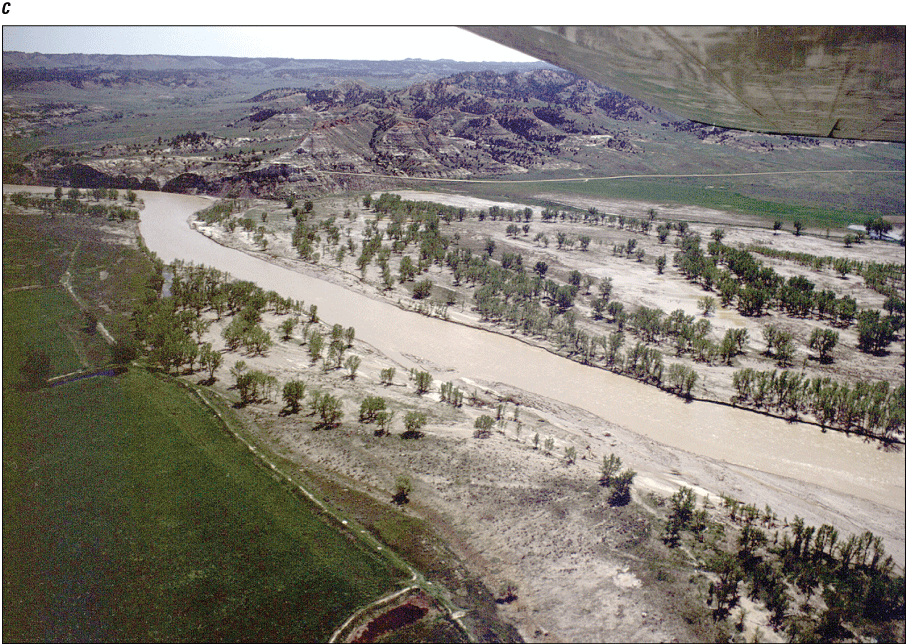
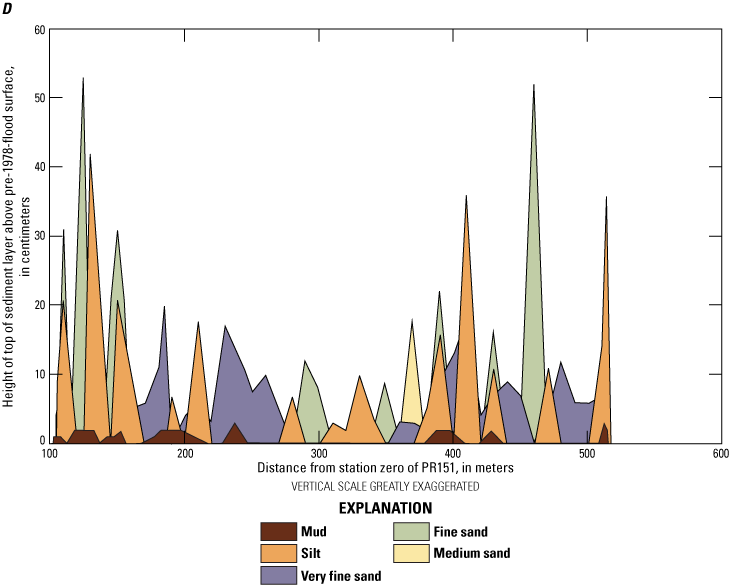
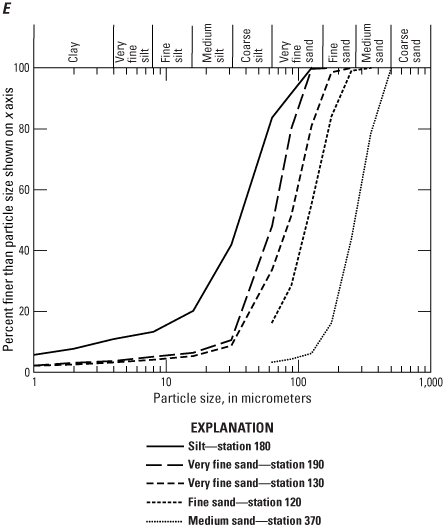
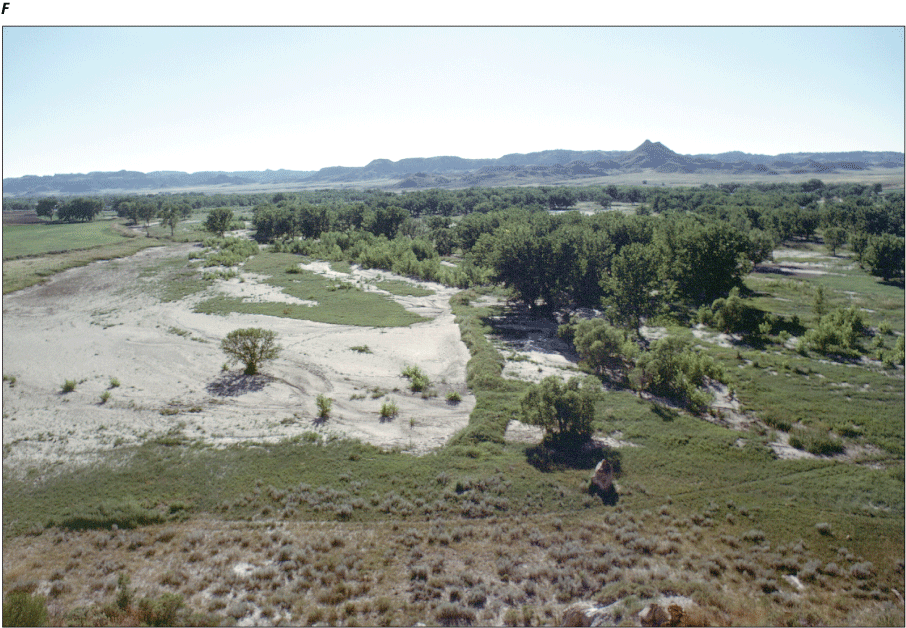
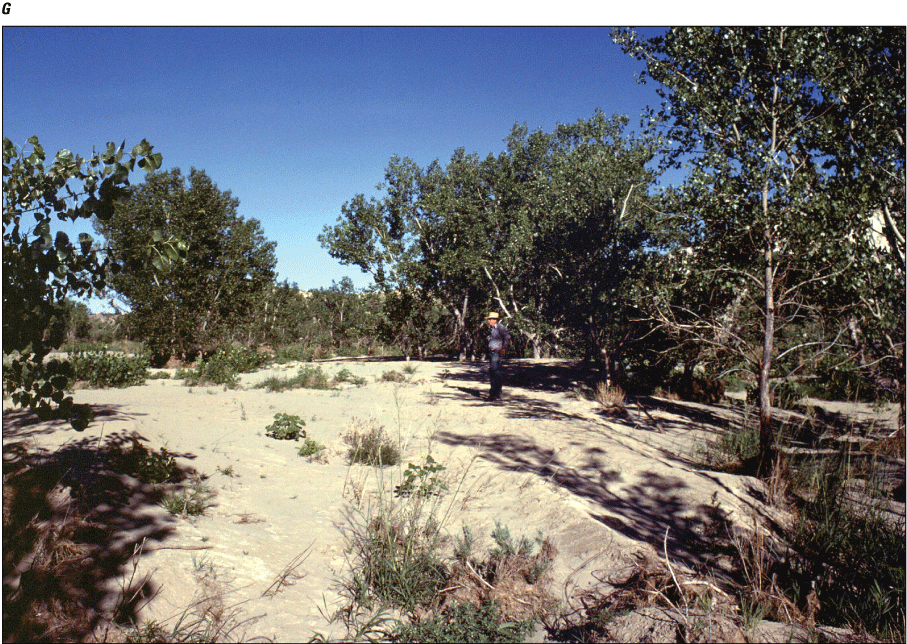
A, Aerial photograph showing segment of Powder River, southeastern Montana, location of valley transect V151 across a Lightning terrace on which overbank sediments were deposited by the flood of May 1978 (refer to table 2 for Universal Transverse Mercator coordinates). Arrow indicates direction of flow in the channel. Aerial photograph by Bill Woodcock, Aerial Survey, Inc., Miles City, Mont., September 1978. Sta., station; T, true bearing. B, Transect profile showing thicknesses of sediment eroded from and deposited along channel cross section PR151 and valley transect V151 (which starts at station 105) during the flood of May 1978. The 1978 surface from stations 90 to 520 was assumed equal to the 2016 light detection and ranging surface, and the 1977 surface was equal to the 1978 surface minus the sediment thickness. C, Photograph showing eastward (downvalley) Powder River, southeastern Mont., across the site of valley transect V151 on May 25, 1978, during falling stage of the flood of May 1978. Areas of the Lightning terrace that had been inundated by floodwaters a few days earlier are shown in the right center. The sandstone bluff that shunted floodwaters off the right-bank terraces and back into and across the main river channel is shown in the upper left corner. Photograph by Robert H. Meade, U.S. Geological Survey (USGS). D, Graph showing thicknesses of sediments for different particle-size classes deposited by the Powder River flood of May 1978 along valley transect V151 as a function of the horizontal distance. Vertical scale has been exaggerated to show details and to accentuate the distribution of lee dunes in the topography of the transect. E, Graph showing particle-size distributions of selected samples of overbank sediment deposited by the Powder River flood of May 1978 along valley transect V151. (Refer to samples listed in table 3 and footnote in table 1.9.) F, Photograph showing west–southwestward (upvalley) from sandstone bluff of sediment deposited by May 1978 flood on Lightning terrace at and near valley transect V151. Photograph by Robert H. Meade, USGS, August 2, 1978. G, Photograph showing eastward (downvalley) a group of lee dunes that cross valley transect V151 at stations 120–130 (fig. 1.9B). A thickness of about 50 centimeters of new sand was deposited here by the flood of May 1978. Photograph by Robert H. Meade, USGS, August 3, 1978.
Sediments deposited by the flood of May 1978 along transect V151 consisted mostly of silt and fine to very fine sands (fig. 1.9D, E), much of which were in lee dunes downriver from cottonwood trees and other vegetative obstructions. Medium sand that was in the subsidiary channel (station 370) had 3 cm of mud on top, suggesting that the channel may have retained water even after the overbank flow had receded back into the main channel.
Average thickness of sediment was 15 cm across the 415-m-wide transect, with the thickest deposits (53 cm) near the channel between stations 105 and 160. The open area adjacent to the grass on left side of figure 1.9F includes transect stations 370–500, where the average thicknesses of new sediment was 15 cm with a maximum of 52 cm (table 1.9; fig. 1.9B). Complete data on thickness and lithology are listed in table 1.9. Particle sizes of typical flood-deposited sediments are listed in table 3 and graphed in figure 1.9E.
Table 1.9.
Thickness and lithology of sediment deposited along valley transect V151 during the May 1978 flood on Powder River, southeastern Montana, measured on October 14, 1978.[Modified from Moody and Meade (2022, V151_V2). The number of sample sites is 50. Transect is an extension of cross section PR151 starting at station 105 on a magnetic bearing of 176.5 degrees. Stations are horizontal distance in meters. Refer to table 2 for Universal Transverse Mercator coordinates for stations −2.0 and 520. m, meter; cm, centimeter; cs, coarse sand; ms, medium sand; fs, fine sand; vfs, very fine sand; np, size fraction not present in coarsening-upward sequence; n, number of sample sites]
Indicates particle-size analysis (refer to table 3 and fig. 1.9E).
Valley Transect V156A
Valley transect V156A consisted of a short transect on the left side of Powder River and a long transect on the right side of the river (fig. 1.10A). The transect was located in the north central part of section 12 of township 7S, range 49E (fig. 1.10A; refer to table 2 for UTM coordinates). Three subsidiary channels crossed this transect. One was on the left bank at about station −100; one was on the right bank at about station 150; and one (shown by the thick white arrow in figure 1.10A) was upriver from the transect and its channel skirted flow around the elevated, treeless Moorcroft terrace between stations 158 and 324. Transect V156A is an extension of channel cross section PR156A, which is described elsewhere by Moody and Meade (2018, p. 70–73).
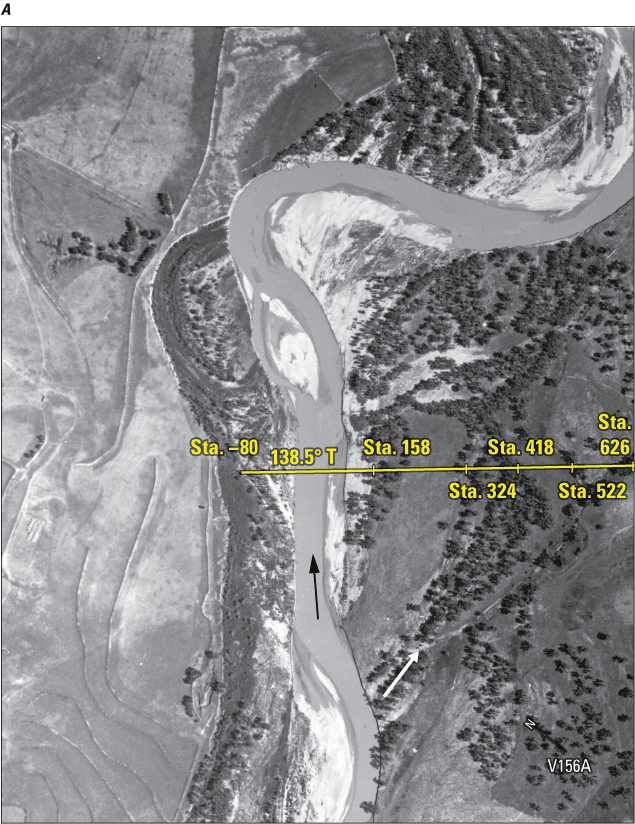
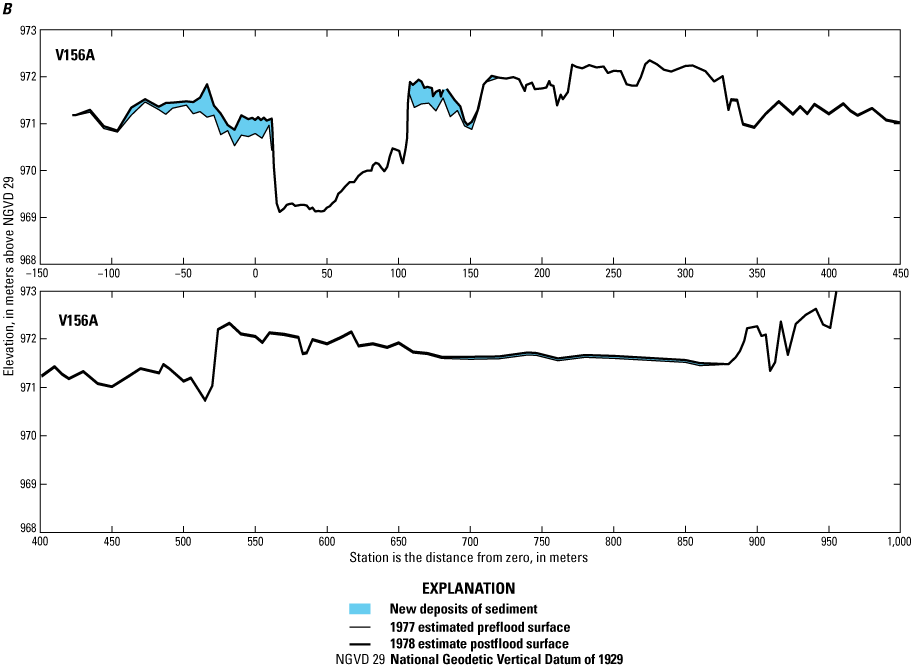
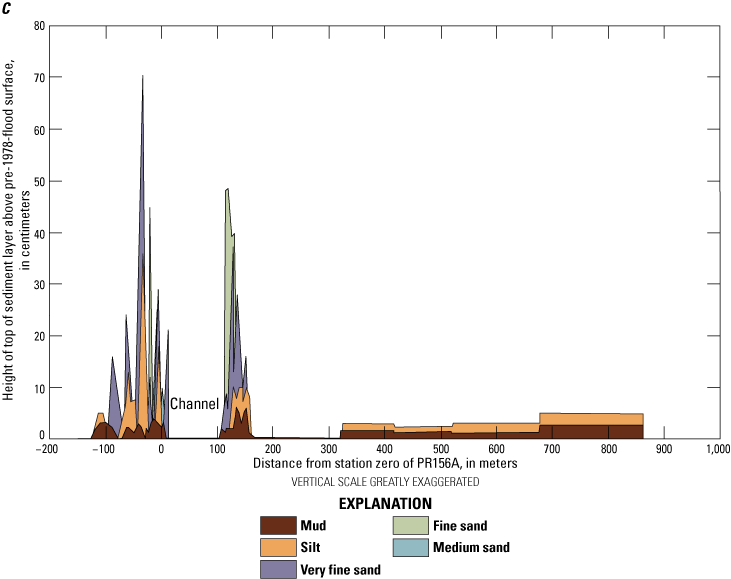
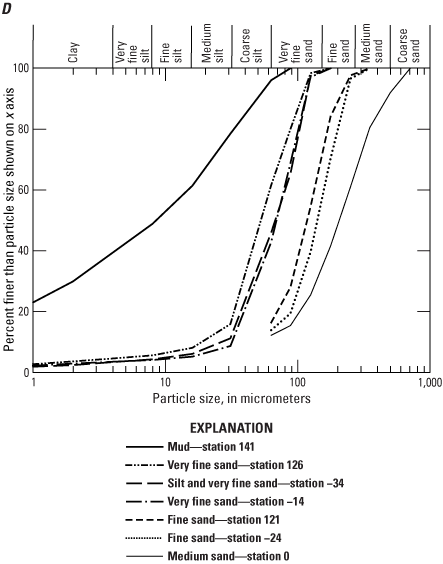
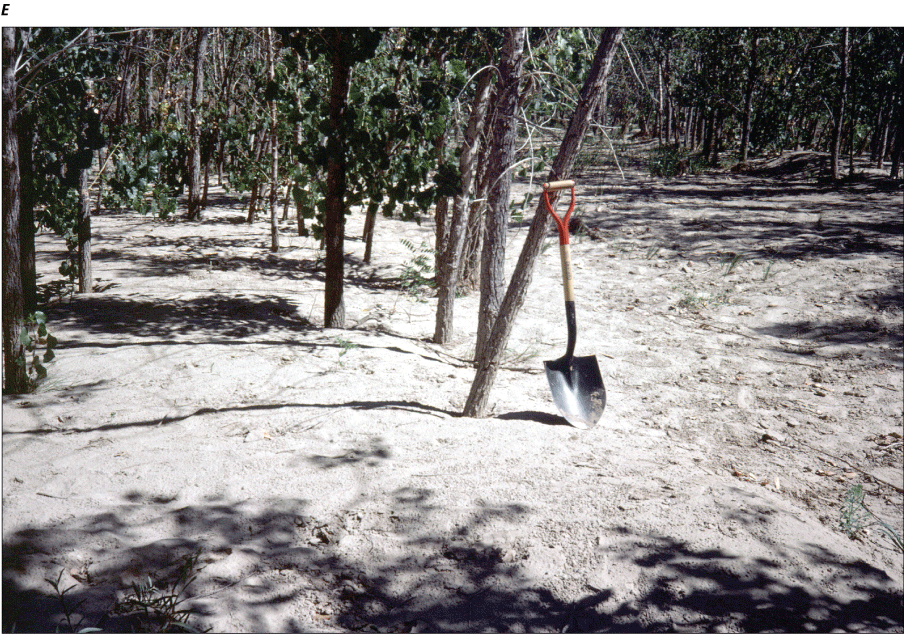
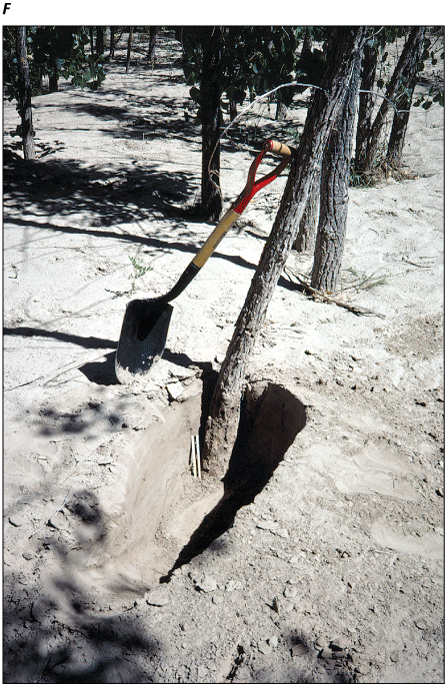
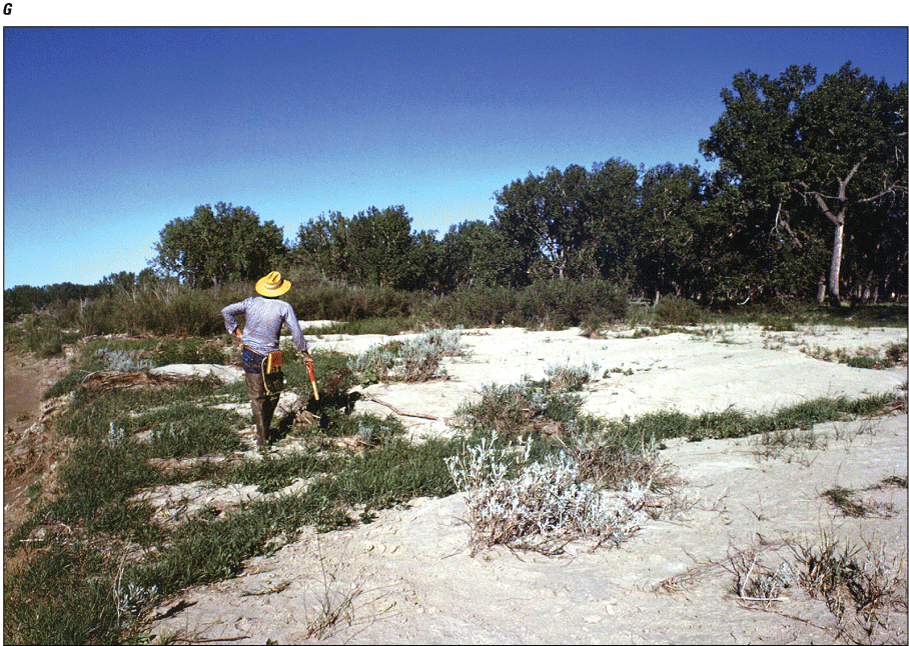
A, Aerial photograph showing reach of Powder River valley, southeastern Montana, in which the flood of May 1978 deposited overbank sediments on terrace levels on both sides of the Powder River. Photograph does not show the most distant 239 meters (m; stations 626–865) of the transect (refer to table 2 for Universal Transverse Mercator coordinates). Black arrow indicates direction of flow in the channel. White arrow indicates overbank flow direction. Aerial photograph by Bill Woodcock, Aerial Survey, Inc., Miles City, Mont., September 1978. Sta., station; T, true bearing. B, Transect profile showing thicknesses of sediment deposited along valley transect V156A during the flood of May 1978. The 1978 surface was assumed equal to the 2016 light detection and ranging surface, and the 1977 surface was equal to the 1978 surface minus the sediment thickness. C, Graph showing thicknesses of sediments for different particle-size classes deposited by the Powder River flood of May 1978 along valley transect V156A as a function of the horizontal distance. Vertical scale has been exaggerated to show details of the structure of lee dunes on terrace levels on both sides of the channel. D, Graph showing particle-size distributions of selected samples of overbank sediment deposited by the Powder River flood of May 1978 along valley transect V156A. (Refer to samples listed in table 3 and footnote in table 1.10.) E, Photograph showing southwestward (downvalley) view of overbank sediment deposited, mostly as lee dunes, on Lightning terrace, on left side of Powder River, about 50 m downriver from valley transect V156A. Length of shovel is approximately 1 m. Photograph by Robert H. Meade, U.S. Geological Survey (USGS), September 1, 1978. F, Photograph showing at same locality as in figure 1.10E, showing a trench dug through 38 centimeters (cm) of fine sand deposited above the preflood ground level in May 1978. Length of ruler at base of tree in the trench is 16 cm. Photograph by Robert H. Meade, USGS, September 1, 1978. G, Photograph showing wide-angle view northeastward (downriver) of new sand deposited by the May 1978 flood on right side of valley transect V156A. Photograph by Robert H. Meade, USGS, August 4, 1978.
On the floodplains and low-lying Lightning terraces that flank both sides of the river channel at valley transect V156A, the overflowing floodwaters of May 1978 deposited mostly sands. In vegetated areas, these sand deposits were predominantly lee dunes in which the particle sizes coarsened upward. On the more elevated Moorcroft terrace levels on the right side of the valley, which were flooded in May 1978, the floodwaters deposited an irregularly spaced assemblage of muds and silts.
The average thickness of sediment deposited on the Lightning terrace on the left bank was 21 cm with a maximum of 70 cm. On the Lightning terrace on the right side (stations 107–160), the average thickness was 24 cm with a maximum of 49 cm, and this new overbank sediment elevated the height of the Lightning terrace to almost the height of the neighboring Moorcroft terrace farther landward (stations 160–200, fig. 1.10B). This is an example of an incremental increase in terrace height that produces “topographically associated but chronologically disjunct” terraces (Cohen and Nanson, 2008, p. 424). The average thickness across the higher Moorcroft terrace was 3 cm with a maximum of 5 cm. Complete data on the thickness and lithology of flood-deposited sediments along valley transect V156A are recorded in table 1.10. Particle-size analyses of typical sediments are listed in table 3 and graphed in fig. 1.10D, and the sediments deposited are shown in figures 1.10E, F, G.
Table 1.10.
Thickness and lithology of sediment deposited along valley transect V156A during the May 1978 flood on Powder River, southeastern Montana, measured on October 15, 1978.[Modified from Moody and Meade (2022, V156_V2). The number of sample sites is 45. Valley transect V156A is on the line of cross section PR156A on a magnetic bearing of 124.5 degrees. Stations are horizontal distance in meters. 1 pace equals 0.96 m. m, meter; cm, centimeter; cs, coarse sand; ms, medium sand; fs, fine sand; vfs, very fine sand; Refer to table 2 for Universal Transverse Mercator coordinates for stations −141.6, 130.8, and 626. np, size fraction not present in coarsening-upward sequence; between stations 170 and 865 a map scale was determined equal to 1 mm equals 10,400 mm; n, number of sample sites]
Indicates particle-size analysis (refer to table 3 and fig. 1.10D).
Valley Transect V159
Valley transect V159 crossed a 600-m-wide floodplain containing several meander cutoffs of Powder River in section 6 of township 7S, range 50E (fig. 1.11A, B). The transect begins at the base of the Kaycee terrace, crosses a subsidiary channel, increases in elevation to the center at about station 380, decreases gradually, and ends on the upper edge of a point bar at station 600. It lies along the axis of a formerly northwestward-bending meander loop ( table 2 for UTM coordinates) that had been cut off at some time from 1954 to 1967 (Martinson and Meade, 1983, sheet 2A) and had been bending in the opposite direction (southeastward) since the time of the cutoff. Edges of some of the pre-1967 channels are highlighted by almost continuous arcs of cottonwood trees such as those shown crossing the transect between stations 0 and 150 in figure 1.11A, B.
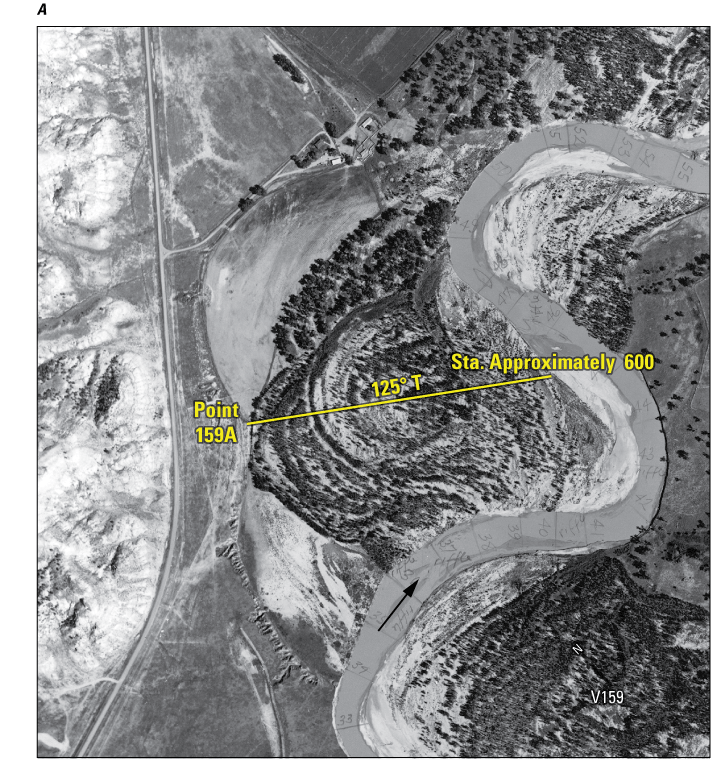
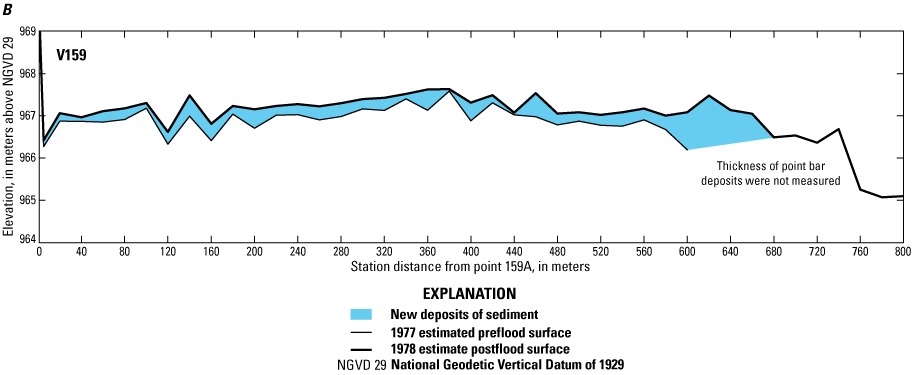
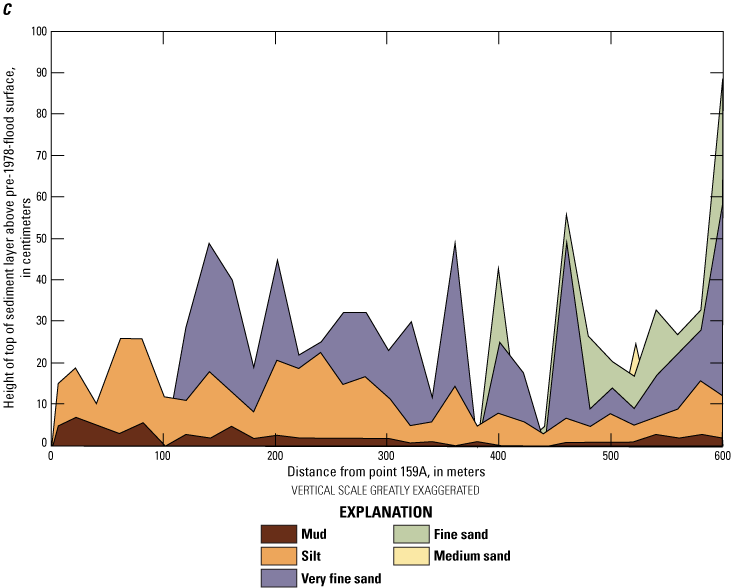
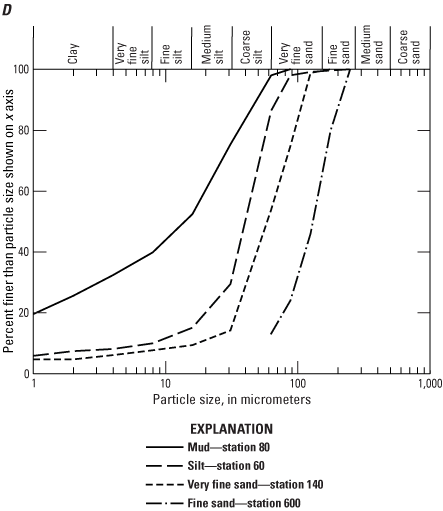
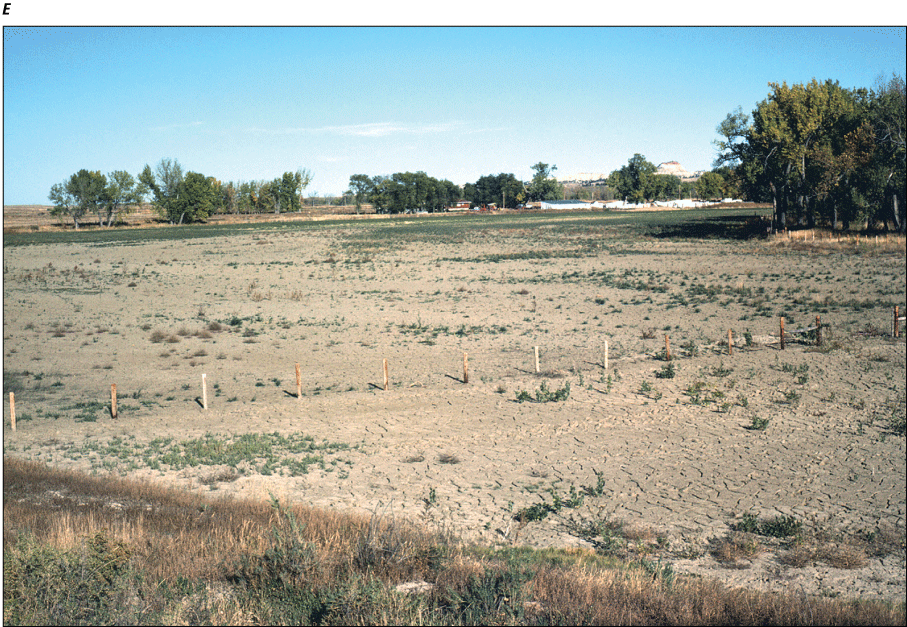
A, Aerial photograph showing reach of Powder River, southeastern Montana, location of valley transect V159, which was an axial crossing of an older meander scar on which overbank sediments were deposited during the flood of May 1978 (refer to table 2 for Universal Transverse Mercator coordinates). This photograph also shows the crescent-shaped area of sediment accumulation on an alfalfa field at a higher (Moorcroft) terrace level laying between Point 159A and the ranch houses at the end of the ranch road that branches off Moorhead Road. Arrow indicates direction of flow in the channel. Aerial photograph by Bill Woodcock, Aerial Survey, Inc., Miles City, Mont., September 1978. Sta., station; T, true bearing. B, Transect profile showing thicknesses of sediments deposited along valley transect V159 during the flood of May 1978. The 1978 surface was assumed equal to the 2016 light detection and ranging surface, and the 1977 surface was equal to the 1978 surface minus the sediment thickness. C, Graph showing thicknesses of sediments for different particle-size classes deposited by the Powder River flood of May 1978 along valley transect V159 as a function of the horizontal distance. Vertical scale has been exaggerated to show details. D, Graph showing particle-size distributions of selected samples of overbank sediment deposited by the Powder River flood of May 1978 along valley transect V159. (Refer to samples listed in table 3 and footnote in table 1.11.) E, Photograph showing northeastward view of sediment deposited by the May 1978 flood on an alfalfa field on Moorcroft terrace immediately downvalley of Point 159A of valley transect V159. Thicknesses of new flood-deposited sediment on this field were not measured directly. Photograph by Robert H. Meade, U.S. Geological Survey, October 19, 1978.
Valley transect V159 showed, perhaps more distinctly and consistently than most of the other valley transects we surveyed, the two most defining textural features of the assemblage of overbank sediments deposited by the flood of May 1978 (fig. 1.11C):
-
1. The lateral fining of surficial sediment-particle diameter, D (in millimeters [mm]), with increasing distance x (in meters [m]) from the main river channel is given by D = −9.9 x 10⁻⁵ mm/m x + 0.094 mm (coefficient of determination [R2]=0.58), from fine sand to very fine sand to silt (note that increasing distance from the channel is measured from station 600 to station 0 in fig. 1.11A, B); and
-
2. The coarsening upward of sediment-particle sizes from basal muds into silts, and the continued upward coarsening of silts into fine sands and, in places near the main channel, coarsening further into medium sands.
Average thickness of flood-deposited sediment across the entire transect with many bands of trees was 28 cm with a maximum of 89 cm nearest the channel. Complete data on the thickness and lithology of flood-deposited sediments along valley transect V159 are recorded in table 1.11. Particle-size analyses of typical sediments are listed in table 3 and graphed in figure 1.11D, and some of the sediments deposited on the Moorcroft terrace are shown in the figure 1.11E photograph.
Table 1.11.
Thickness and lithology of sediment deposited along valley transect V159 during the May 1978 flood on Powder River, southeastern Montana, measured on October 19 and 21, 1978.[Modified from Moody and Meade (2022, V159_V2). The number of sample sites is 32. Transect is on a magnetic bearing of 110 degrees beginning at point 159A. Refer to table 2 for Universal Transverse Mercator coordinates for point 159A and distance 600 m from point 159A. m, meter; cm, centimeter; cs, coarse sand; ms, medium sand; fs, fine sand; vfs, very fine sand; np, size fraction not present in coarsening-upward sequence; n, number of sample sites]
Indicates particle-size analysis (refer to table 3 and fig. 1.11D).
Valley Transect V163
Valley transect V163 was a southward extension of cross section PR163 across a point bar on a meander bend in the southwest quarter of section 32 of township 6S, range 50E (fig. 1.12A). The 1978 floodwaters at PR163, in 2 weeks’ time, eroded the left-side cutbank of the channel 65 m laterally (Meade and Moody, 2013, fig. 19) and laid extensive sand onto a rapidly growing point bar (Ghinassi and Moody, 2021). Transect V163 begins at station 110 of cross section PR163 and proceeds 547 m south-southeastward to a terrace bank that defined the right edge of the 1978 flooding of this segment of Powder River valley. It follows a magnetic bearing of 140 degrees instead of 151 degrees, which is the bearing of the cross section. It crosses three terrace segments, a lower Lightning terrace (stations 110–175) with an elevation of approximately 964.5 m, a slightly higher (Lightning/Moorcroft) terrace (stations 190–380) with an elevation of 965.0 m, and an upper Moorcroft terrace (stations 410–650) with an elevation of approximately 965.5 m (fig. 1.12B). The terrace segments are bounded by three subsidiary channels that cross the transect at approximately stations 175, 280, and 395. Cottonwood trees along this transect have been dated (Schook and others, 2017); trees on the upper Moorcroft terrace germinated in the 1860s.
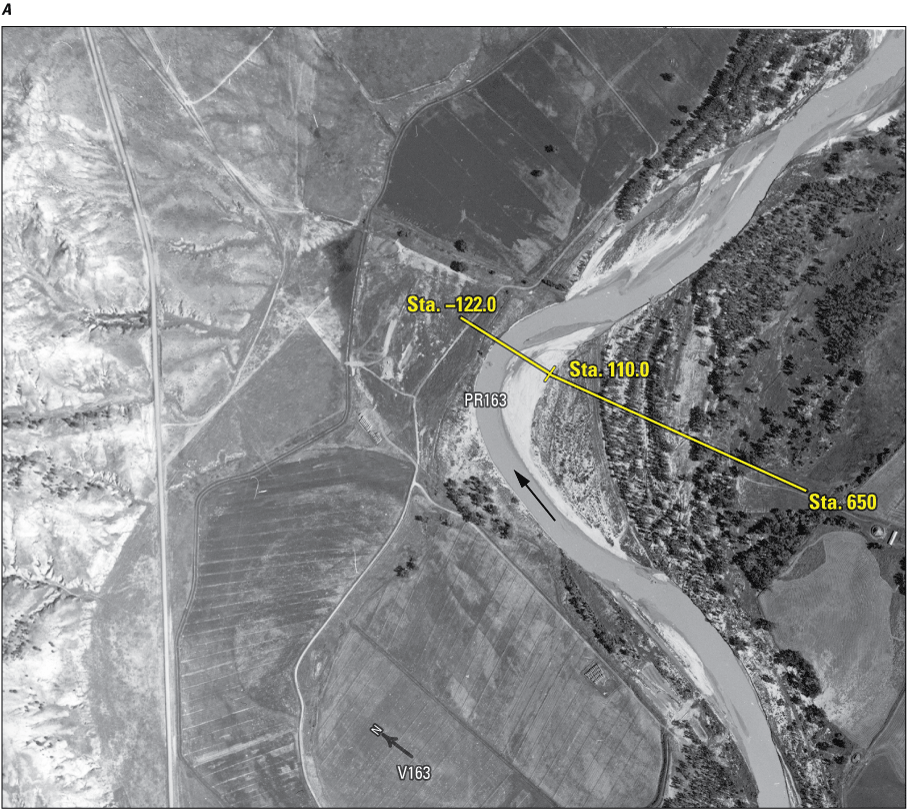
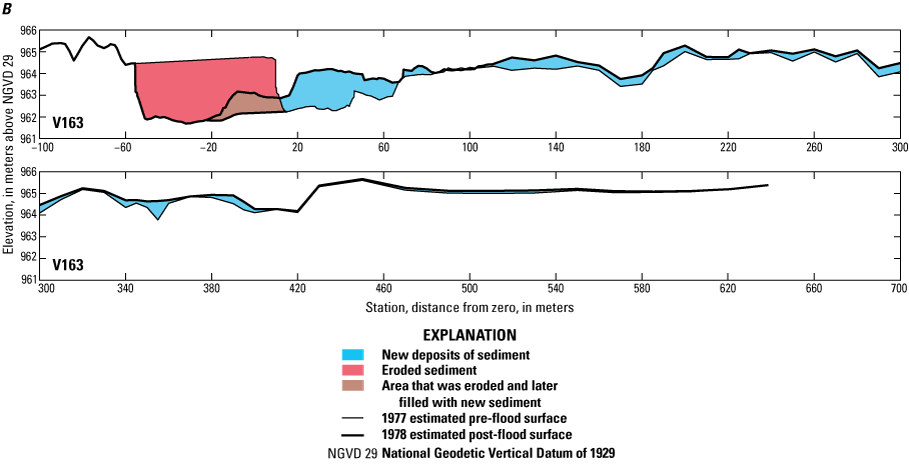
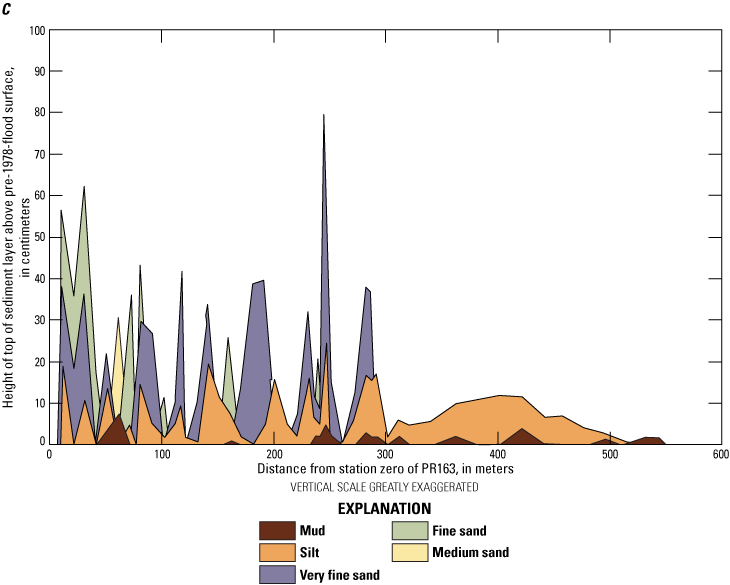
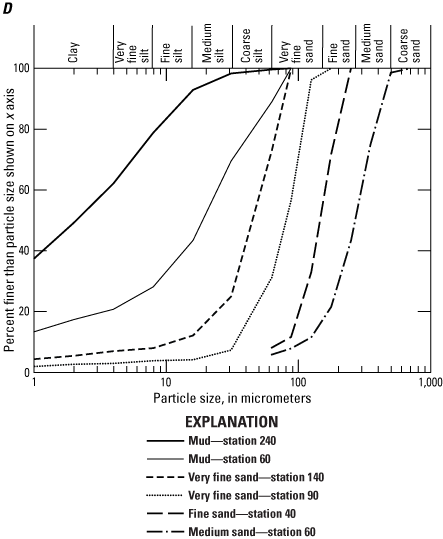
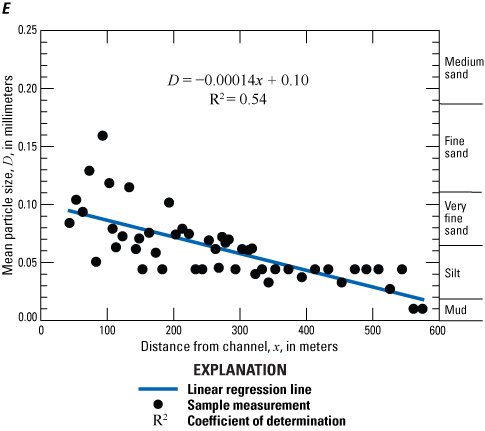
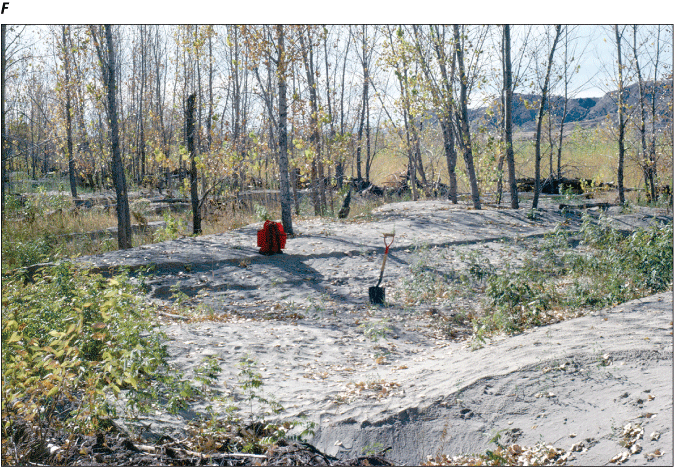
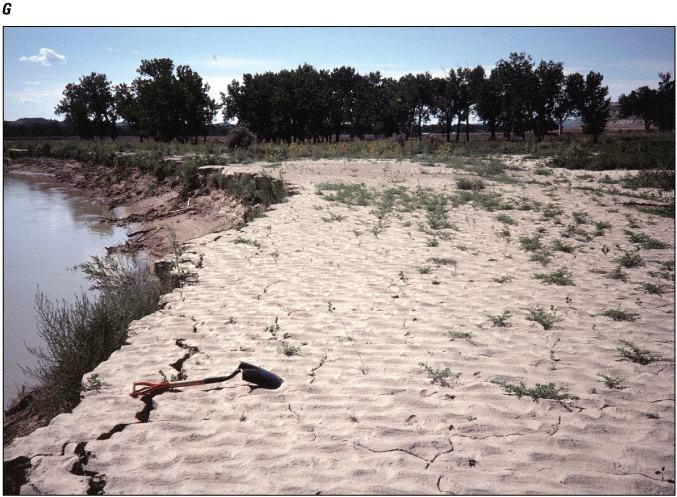
A, Aerial photograph showing reach of Powder River, southeastern Montana, location of valley transect V163 (refer to table 2 for Universal Transverse Mercator coordinates) on which overbank sediments were deposited during the flood of May 1978. Arrow indicates direction of flow in the channel. Aerial photograph by Bill Woodcock, Aerial Survey, Inc., Miles City, Mont., September 1978. Sta., station; T, true bearing. B, Transect profile showing thicknesses of sediments deposited along valley transect V163 during the flood of May 1978. The 1978 surfaces from stations 110.9 to 650 were approximated by a survey done in 1996, and the 1977 surface was equal to the 1978 surface minus the sediment thickness. C, Graph showing thicknesses of sediments for different particle-size classes deposited by the Powder River flood of May 1978 along valley transect V163 as a function of horizontal distance. Vertical scale exaggerated to show details of upward coarsening and lateral fining of particle sizes. D, Graph showing particle-size distributions of selected samples of overbank sediment deposited by the Powder River flood of May 1978 along valley transect V163. (Refer to samples listed in table 3 and footnote in table 1.12.) E, Graph showing change in mean particle size with distance from the channel along transect V163. F, Photograph showing southwestward view (upvalley) across valley transect V163 showing dunes of sand and silt. Dunes are located at lateral distances of about 100 meters (m) from station 110 of cross section PR163 and were deposited in a grove of small cottonwood trees in Powder River valley by the floodwaters of May 1978. Red rucksack marks the approximate location of transect V163. Photograph by Robert H. Meade, U.S. Geological Survey (USGS), October 16,1978. G, Photograph showing southwestward view (upriver) of sand deposited by May 1978 flood on a hectare-size area of terrace at distances 80–200 m upriver from Powder River cross section PR163. Observed thicknesses of sand in this overbank deposit ranged mostly from 10 to 45 centimeters. Photograph by Robert H. Meade, USGS, August 30,1978.
This transect is a good example of the decrease in particle size with distance from the channel (fig. 1.12C, E). This pattern has been preserved by the many sediment traps created by the stands of cottonwood trees from station 110 to about station 400 (fig. 1.12B). These traps, once filled, become the lee dunes shown as spikes in the plot of sediment thickness in figure 1.12C. Complete data on the thickness and lithology of overbank sediments deposited on transect V163 by the flood of May 1978 are listed in table 1.12. Particle sizes of selected samples are listed in table 3, graphed in figure 1.12D. Examples of the sediment are shown in figure 1.12F and G.
Table 1.12.
Thickness and lithology of sediment deposited along valley transect V163 during the May 1978 flood on Powder River, southeastern Montana, measured on October 16, 1978.[Modified from Moody and Meade (2022, V163_V2). The number of sample sites is 50. Line of section PR163 has magnetic bearing of 151o. Valley transect V163 starts at station 110 on magnetic bearing of 140o. Stations are horizontal distance in meters; distance from 10 to 440 were measured with metric tagline. Stations beyond 440 were paced. 1 pace equals 0.96 meter. Refer to table 2 for Universal Transverse Mercator coordinates for station −122.0, 110, and 547 m from station 110. m, meter; cm, centimeter; cs, coarse sand; ms, medium sand; fs, fine sand; vfs, very fine sand np, size fraction not present in coarsening-upward sequence; n, number sample sites]
Indicates particle-size analysis (table 3 and figure 1.12D).
The average thickness was 20 cm with a maximum of 87 cm, and the thickness generally decreased with distance from the channel; however, the effect of numerous lee dunes at distances of 20–300 m increased the variability of the thicknesses (fig. 7A). Average deposition on the Lightning terrace was 39 cm, which raised it to nearly the elevation of the slightly higher (Lightning/Moorcroft) terrace, an example of an incremental increase in terrace height that produces “topographically associated but chronologically disjunct” terraces (Cohen and Nanson, 2008, p. 424). Additionally, the incremental deposition (average of 24 cm) on the (Lightning/Moorcroft) terrace raises it up toward the level of the upper Moorcroft terrace, which only received an average deposition of 6 cm.
Valley Transect V166
Valley transect V166 closely followed the centerline of a point bar in the northeast quarter of section 28 of township 6S, range 50E (fig. 1.13A, B). Germination years for the cottonwood trees on the landward half of the transect are in the 1920s and 1930s (Schook and others, 2017).
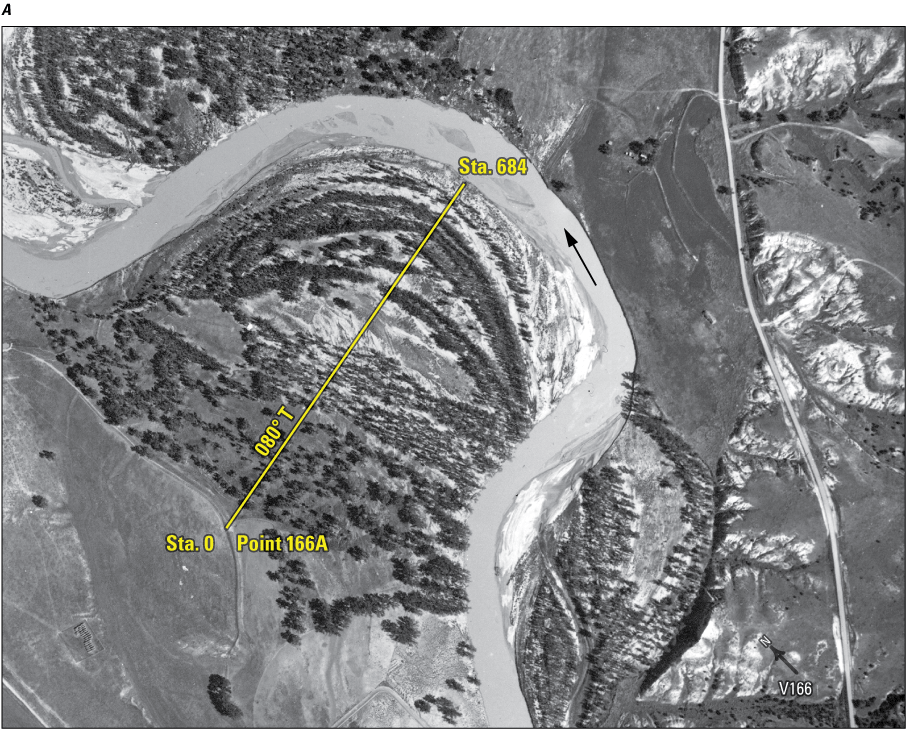
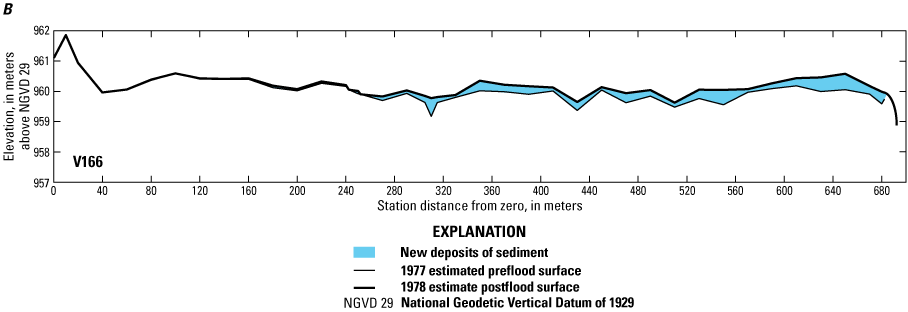
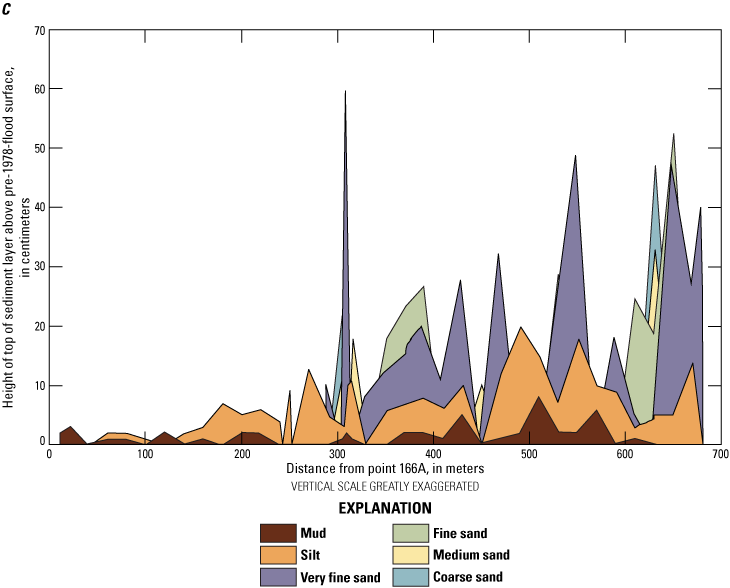
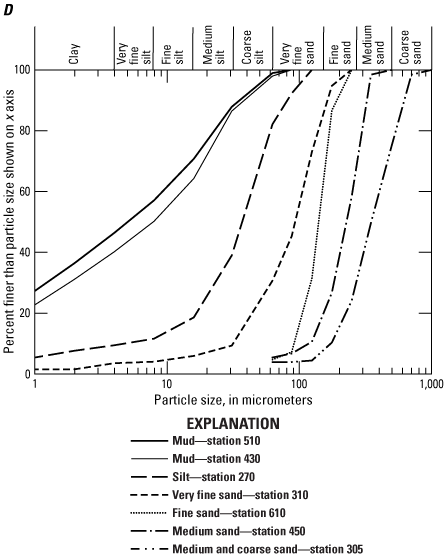
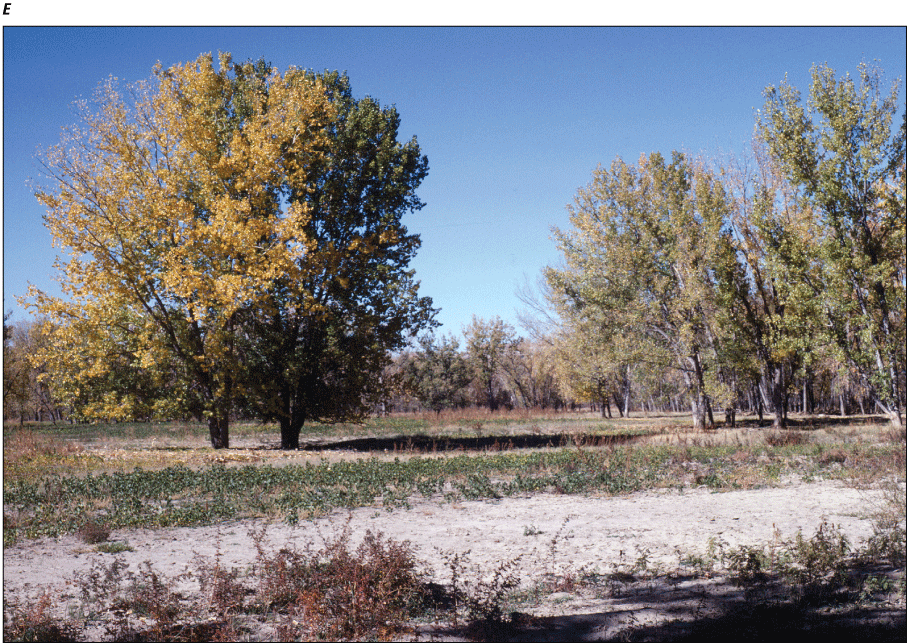
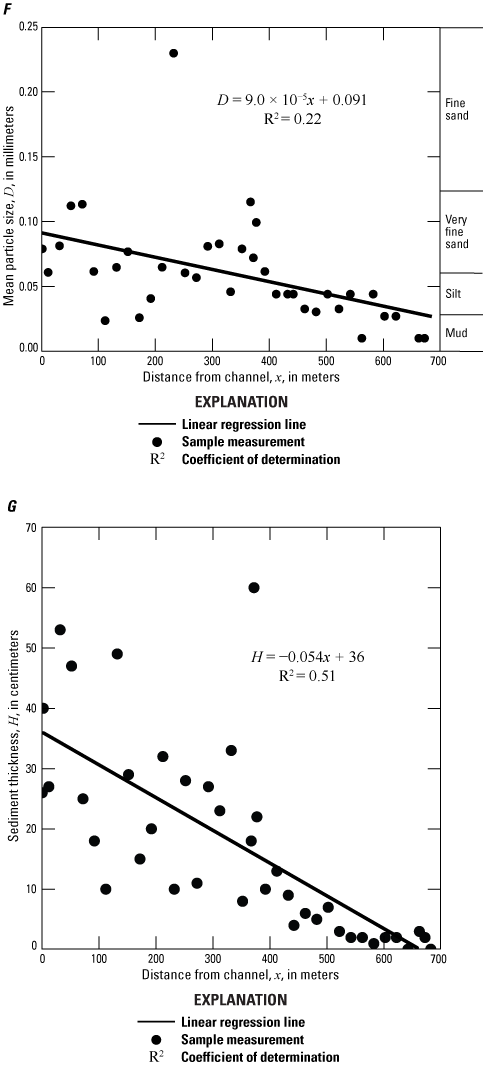
A, Aerial photograph showing reach of Powder River, southeastern Montana, location of valley transect V166 (refer to table 2 for Universal Transverse Mercator coordinates), on which overbank sediments were deposited during the flood of May 1978. Arrow indicates direction of flow in the channel. Aerial photograph by Bill Woodcock, Aerial Survey, Inc., Miles City, Mont., September 1978. Sta., station; T, true bearing. B, Transect profile showing thicknesses of sediments deposited along valley transect V166 during the flood of May 1978. The 1978 surface was assumed to be equal to the 2016 light detection and ranging surface, and the 1977 surface was assumed to be equal to the 1978 surface minus the sediment thickness. C, Graph showing thicknesses of sediments for different particle-size classes deposited by the Powder River flood of May 1978 along valley transect V166 as a function of the horizontal distance. Vertical scale has been exaggerated to show details of upward coarsening of particle sizes. D, Graph showing particle-size distributions of selected samples of overbank sediment deposited by the Powder River flood of May 1978 along valley transect V166. (Refer to samples listed in table 3 and footnote in table 1.13.) E, Photograph showing northward view from a location about 450 meters upvalley from point 166A, across leftward edge of valley transect V166. Photograph by Robert H. Meade, U.S. Geological Survey, October 19, 1978. F, Graph showing particle size compared with distance from channel along valley transect V166. G, Graph showing overbank sediment thickness as a function of distance from channel along valley transect V166.
Sediments deposited by the flood of May 1978 along valley transect V166 consisted of muds and silts, which coarsened upward to sands between 300 and 684 m from point 166A (fig. 1.13C, D, E). Most of the sands appear to have been deposited as lee dunes in the segments of the transect that had cottonwood trees. This transect is one of the better examples of the trend of decreasing mean particle size, D (in mm), with distance from the channel, x (in m) (fig. 1.13F).
The average thickness was 18 cm, and the maximum thickness was 60 cm. This transect is an example of the trend of decreasing thickness with distance from the channel (fig. 1.13G). Variability in thickness created by the many lee dunes (fig. 1.13C) resulted in a low R2 value.
Complete data on thickness and lithology are listed in table 1.13. Particle sizes of selected samples are listed in table 3 and graphed in figure 1.13D.
Table 1.13.
Thickness and lithology of sediment deposited along valley transect V166 during the May 1978 flood on Powder River, southeastern Montana, measured on October 19, 1978.[Modified from Moody and Meade (2022, V166_V2). The number of sample sites is 39. Valley transect is on a magnetic bearing of 066 degrees beginning at point 166A. Refer to table 2 for Universal Transverse Mercator coordinates for point 166A and distance from point 166A of 682 meters. m, meter; cm, centimeter; cs, coarse sand; ms, medium sand; fs, fine sand; vfs, very fine sand; np, size fraction not present in coarsening-upward sequence; n, number of sample sites]
Indicates particle-size analysis ( refer to table 3 and fig. 1.13D).
Valley Transect V174
Valley transect V174 is an east-west line that bisects the eastern half of section 15 of township 6S, range 50E. More than one-half (stations −170 to 250) of the 726-m-long transect lies in an older meander depression that was abandoned by Powder River following an artificial cutoff made at some time during 1944–54 (Martinson and Meade, 1983, sheet 2). Thus, the transect slopes down away from the active channel to the old channel (fig. 1.14B). A small meander that was cut off during the flood of May 1978 is about 0.6 kilometer downriver from valley transect V174, and is described further by Meade and Moody (2013, p. 11–13).
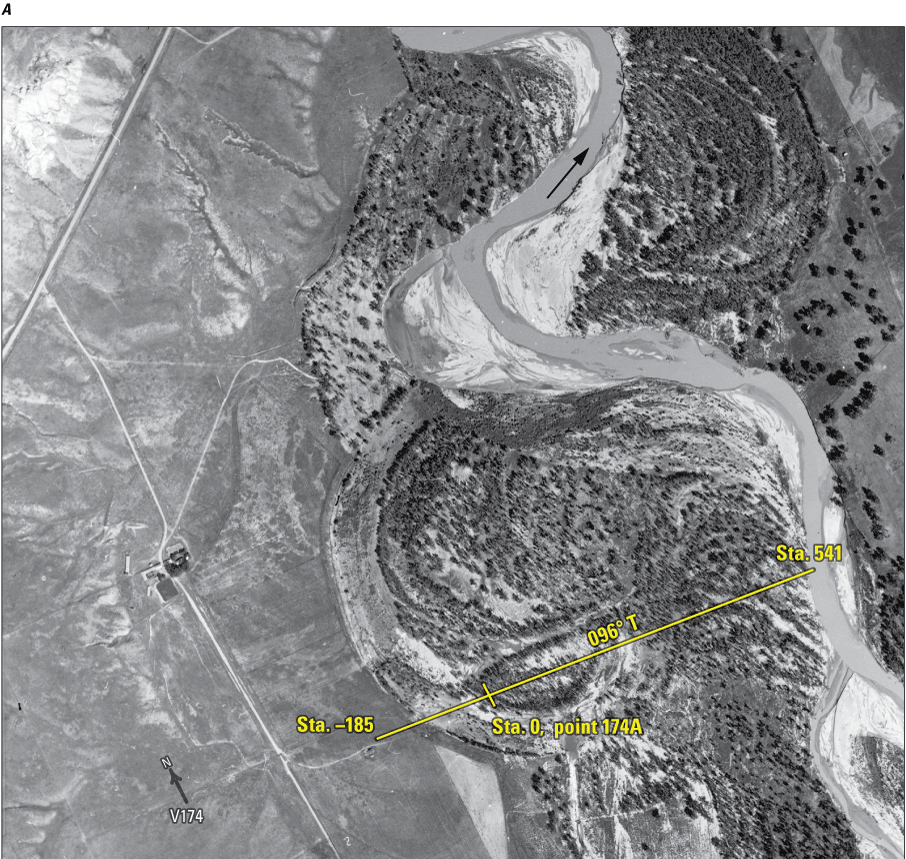
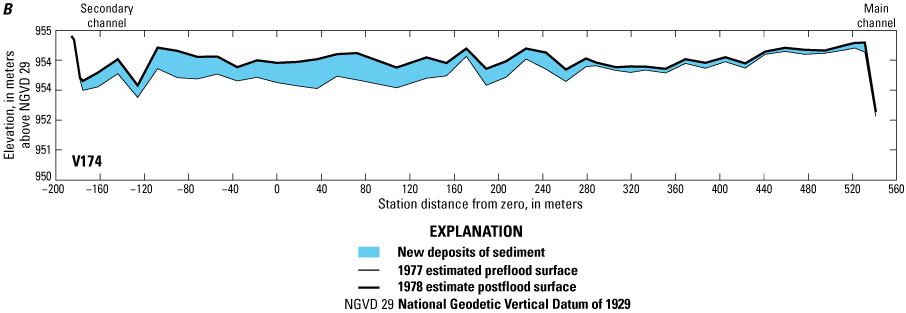
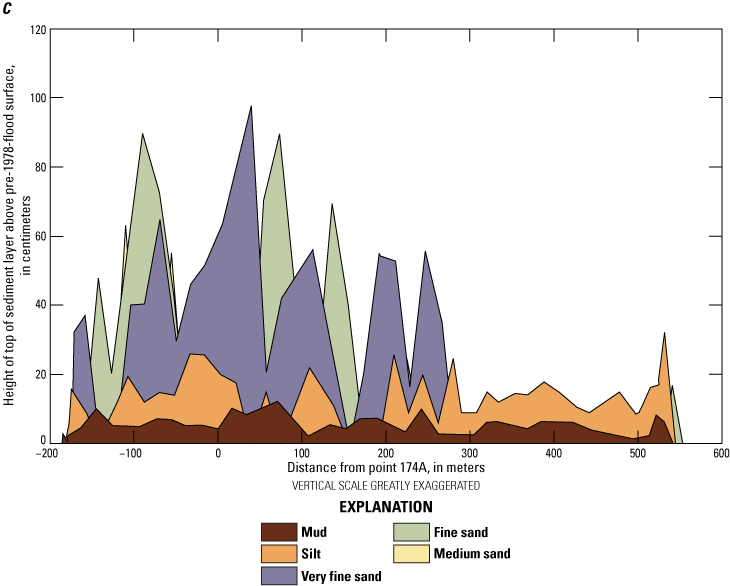
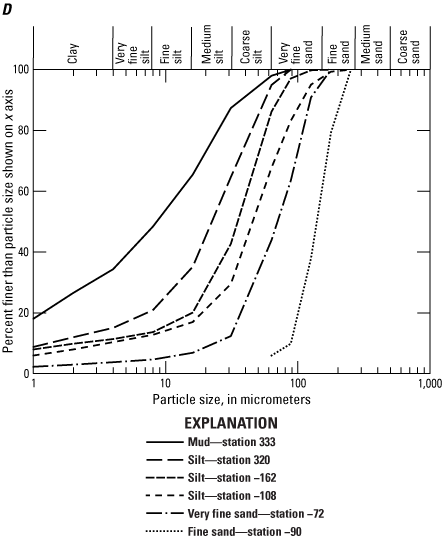
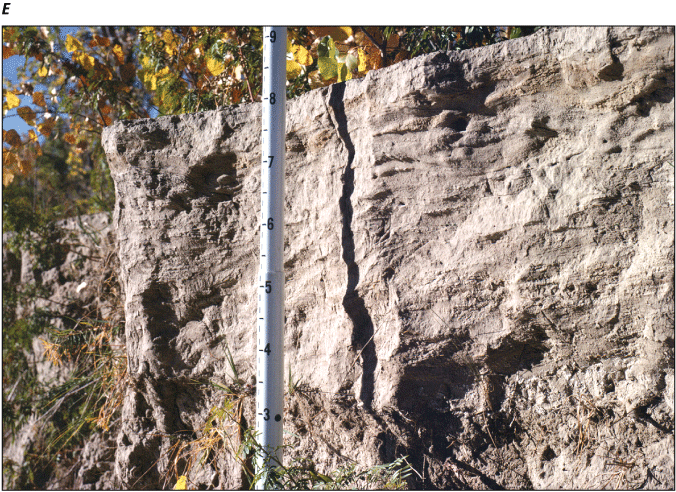
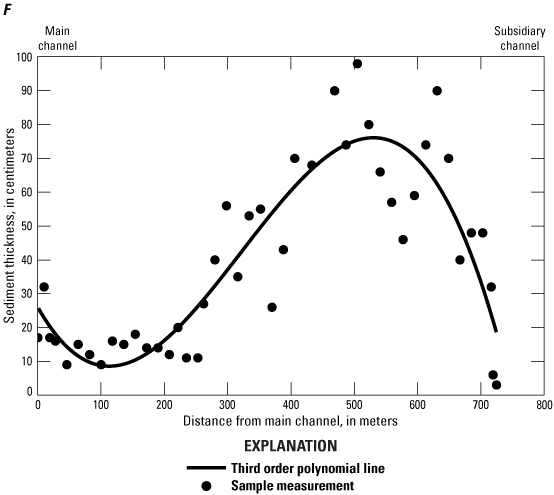
A, Aerial photograph showing reach of Powder River, southeastern Montana, location of valley transect V174 across a low-lying complex of previously abandoned channels (refer to table 2 for Universal Transverse Mercator coordinates). Arrow indicates direction of flow in the channel. Aerial photograph by Bill Woodcock, Aerial Survey, Inc., Miles City, Mont., September 1978. Sta., station; T, true bearing. B, Transect profile showing thicknesses of sediments deposited by the flood of May 1978 along valley transect V174. The 1978 surface was assumed to be equal to the 2016 light detection and ranging (lidar) surface, and the 1977 surface was equal to the 1978 surface minus the sediment thickness. C, Graph showing thicknesses of sediments for different particle-size classes deposited by the Powder River flood of May 1978 along valley transect V174 as a function of the horizontal distance. Vertical scale has been exaggerated to show details. D, Graph showing particle-size distributions of selected samples of sediment deposited by the Powder River flood of May 1978 along valley transect V174. (Refer to samples listed in table 3 and footnote in table 1.14.) E, Photograph showing southwestward view (upriver) of 0.5-meter (m) thickness of sand deposited by the flood of May 1978 near the beginning of valley transect V174. Location is atop the left bank of Powder River 10 m upriver from station 541. Numbered horizontal black lines on the leveling rod are 0.1 m apart. Photograph by Robert H. Meade, U.S. Geological Survey, October 18, 1978. F, Graph showing sediment thickness as a function of the distance from the active main channel along valley transect V174. Third-order polynomial was fit to the data to aid in visualization.
This site was sampled specially to record a maximum of accumulation of flood-deposited sediment in the Moorhead-to-Broadus reach of Powder River valley. It is a clear example of the reversal of the trend of particle size decreasing with distance from the main channel. It appears that once the major floodwaters were high enough, they followed the abandoned channel (between station −170 to 250, fig. 1.14B), and the overbank flow spread outward from this channel (fig. 9B). The basal materials that were mapped (and sampled for particle-size analysis) as “muds” (fig. 1.14C) were variable in their textural characteristics—depending perhaps on the receptive qualities of the surface on which they had been deposited by the flood. Particle-size analysis of six samples collected from this transect are listed in table 3 and shown in figure 1.14D.
This transect also exemplifies the reversal of the trend of decreasing thickness with distance from the main channel; however, the thick sands deposited by the flood in the abandoned channel might not be considered, in the strictest sense, overbank sediments. This reversal was caused by the presence of the abandoned or subsidiary channel. Thicknesses of new sand were exceptionally large, owing to the vacant depths of the abandoned channel (fig. 1.14E). Although the thickness in general increases with distance from the main channel, the pattern is more complex (fig. 1.14F). Initially, muds and silts may have been deposited in the subsidiary channel as backwater flowed upriver from the confluence of the subsidiary channel with the main channel downriver. Later, at higher discharge and higher concentration of medium and coarse sand, the primary flow may have been downriver through the subsidiary channel, and thickness decreased with distance away from the subsidiary channel (from 600 to 100 m, fig. 1.14F). Near the peak discharge, flow may have overtopped the bank of the main channel, leaving a short segment of sediment deposits that decrease in thickness with distance away from the main channel (from 0 to 100 m in fig. 1.14F). The decrease in thickness from the subsidiary channel toward the main channel may also be due in part to the increase in elevation from 953.0 m in the subsidiary channel to 953.3 m at the edge of the main channel (fig. 1.14B). The average thickness along this transect was 38 cm, and the maximum thickness was 98 cm. Complete data on thickness and lithology are listed in table 1.14.
Table 1.14.
Thickness and lithology of sediment deposited along valley transect V174 during the May 1978 flood on Powder River, northeastern Montana, measured on October 18, 1978.[Modified from Moody and Meade (2022, V174_V2). The number of sample sites is 45. Valley transect V174 is on a magnetic bearing of 082 degrees through point 174A. 1 pace equals 0.90 meter. Refer to table 2 for Universal Transverse Mercator coordinates of station −185, station 0, point 174A, and station 541. m, meter; cm, centimeter; cs, coarse sand; ms, medium sand; fs, fine sand; vfs, very fine sand; np, size fraction not present in coarsening-upward sequence]
Indicates particle-size analysis (refer to table 3 and fig. 1.14D).
Valley Transect V179
Valley transect V179 follows the axis of a prominent point bar of Powder River that lies across the boundary between sections 11 and 12 of township 6S, range 50E (fig. 1.15A). The transect begins at the top of the point bar (distal end) and crosses the point bar, which has a slope of approximately 0.002 with undulations that have wavelengths of 20–40 m and amplitudes of 0.3–0.5 m (fig. 1.15B). These are probably ridge and swale features left by the migrating point bar that formed the meander neck (Hickin and Nanson, 1975). The 1978 floodwaters were confined between the left bank of the river channel and the terrace edge that we have designated as station 0, point 179A (fig. 1.15A). As the flood proceeded downriver, the rising floodwaters crossed the abundantly wooded core of the point bar in such a manner that left only a few deposits of basal mud and a large preponderance of fine-to-medium sands in the form of lee dunes.
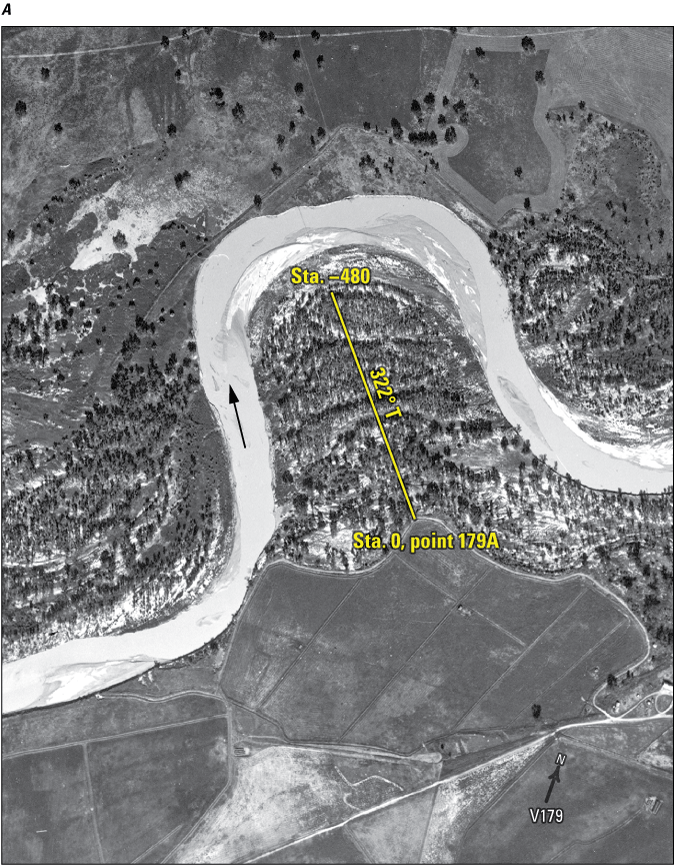
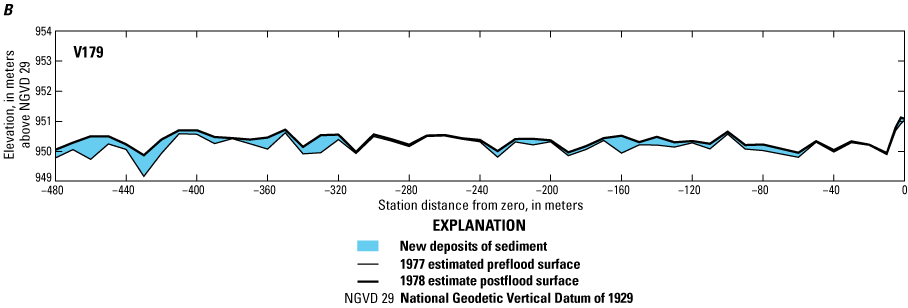
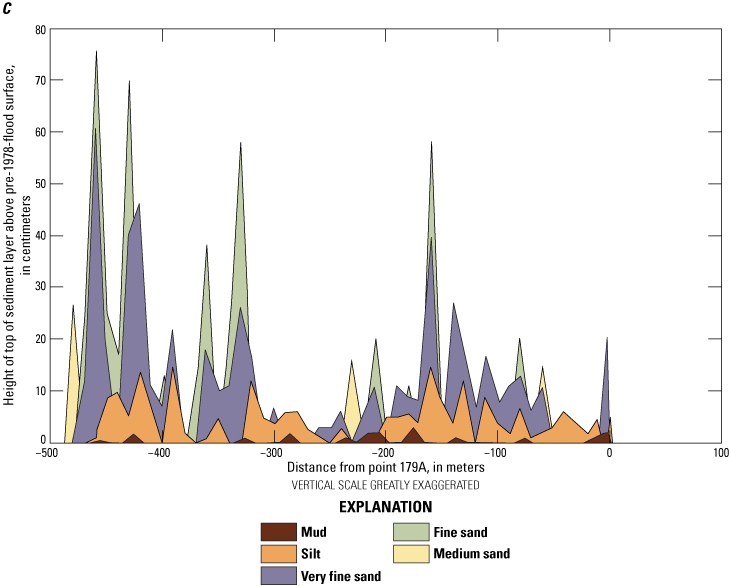
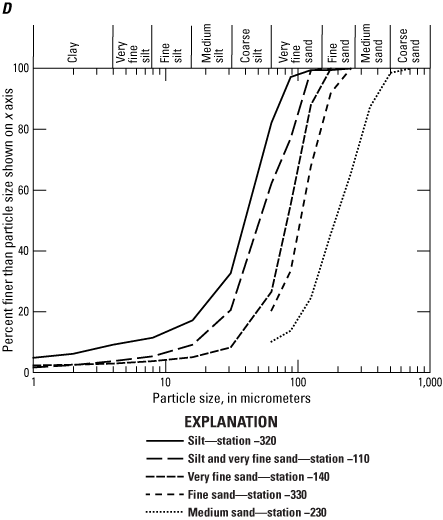
A, Aerial photograph showing reach of Powder River, southeastern Montana, showing location of valley transect V179 (refer to table 2 for Universal Transverse Mercator coordinates). Arrow indicates direction of flow in the channel. Aerial photograph by Bill Woodcock, Aerial Survey, Inc., Miles City, Mont., September 1978. Sta., station; T, true bearing. B, Transect profile showing thicknesses of sediments deposited along valley transect V179 during the flood of May 1978. The 1978 surface was assumed to be equal to the 2016 light detection and ranging (lidar) surface, and the estimated 1977 surface was equal to the 1978 surface minus the sediment thickness. C, Graph showing thicknesses of sediments for different particle-size classes deposited by the Powder River flood of May 1978 along valley transect V179 as a function of the horizontal distance. Vertical scale has been exaggerated to show details. D, Graph showing particle-size distributions of selected samples of overbank sediment deposited by the Powder River flood of May 1978 along valley transect V179. (Refer to samples listed in table 3 and footnote in table 1.15.)
The particle sizes coarsened upward in these lee dunes in a band of 1.0-to-1.5-m tall willows and 1.0-to-4.0-m tall cottonwood trees that grew at distances of 75 m to 135 m from the edge of water (−480 to −420 m from point 179A) (fig. 1.15C). At −220 to −230 m from point 179A, the coarsening-upward sequence was capped by 5 and 4 cm of finer silt, respectively, probably deposited on the falling limb of the hydrograph in sediment traps downstream from the trees. A particle-size analysis of six samples collected from this transect is listed in table 3 and shown in figure 1.15D. The average thickness of flood-deposited overbank sediment in transect V179 was 17 cm, and the maximum thickness was 76 cm. Complete data on thickness and lithology are listed in table 1.15.
Table 1.15.
Thickness and lithology of sediment deposited along valley transect V179 during the May 1978 flood on Powder River, southeastern Montana, measured on October 17, 1978.[Modified from Moody and Meade (2022, V179_V2). The number of sample sites is 51. Valley transect is on a magnetic bearing of 308 degrees from point 179A. Refer to table 2 for Universal Transverse Mercator coordinates for station 0, point 179A and station −480. m, meter; cm, centimeter; cs, coarse sand; ms, medium sand; fs, fine sand; vfs, very fine sand; np, size fraction not present in coarsening-upward sequence; n, number of sample sites]
Indicates particle-size analysis (refer to table 3 and fig. 1.15D).
Valley Transect V184
Valley transect V184 crossed an abundantly wooded expanse of low terrace on the right bank of Powder River in the northwest quarter of section 6 of township 6S, range 51E (fig. 1.16A). The terrace is separated into two parts by a subsidiary channel (fig. 1.16B), and the bend containing the terrace is restricted from migrating northwestward by upland hills (upper right corner of fig. 1.16A) mixed with fragments of the Kaycee terrace (greater than 10 m high) along the left bank. A subsidiary channel crosses approximately perpendicular to the transect at about the halfway point (station −380 m from point 184A). The lack of sediment deposits and the relative thinness of sediment adjacent to this subsidiary channel suggest that it did not play a major role in transporting overbank sediment.
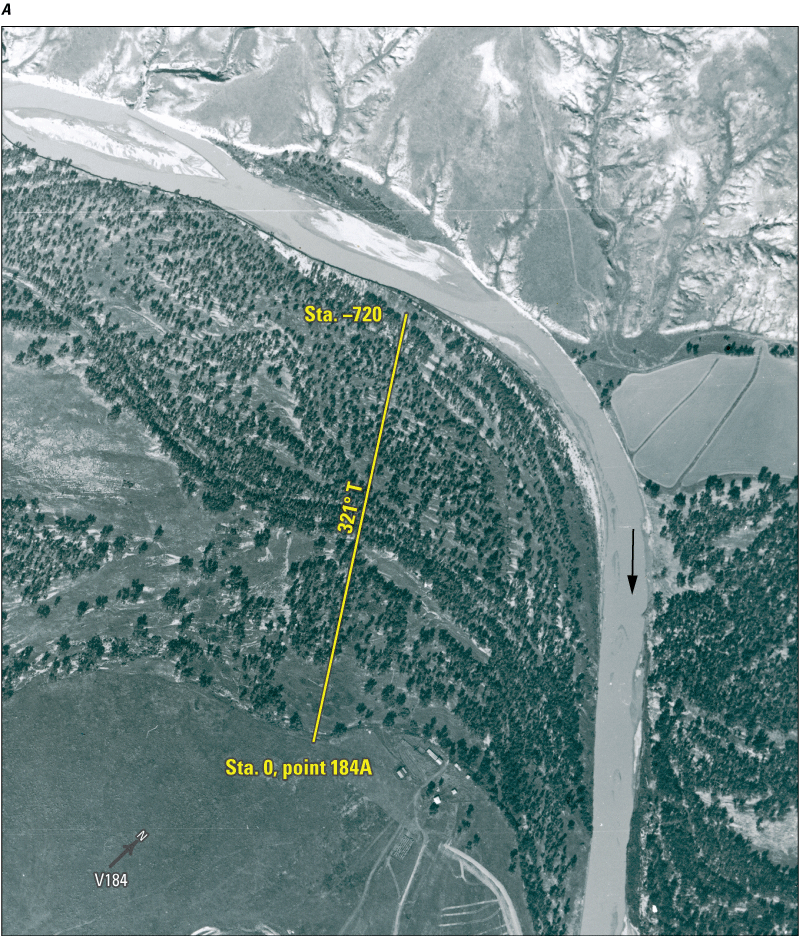
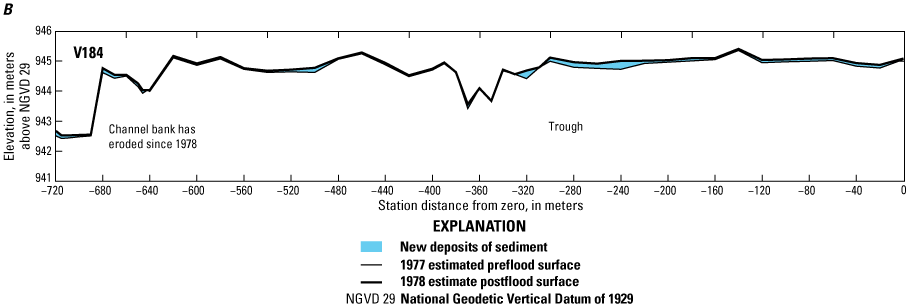
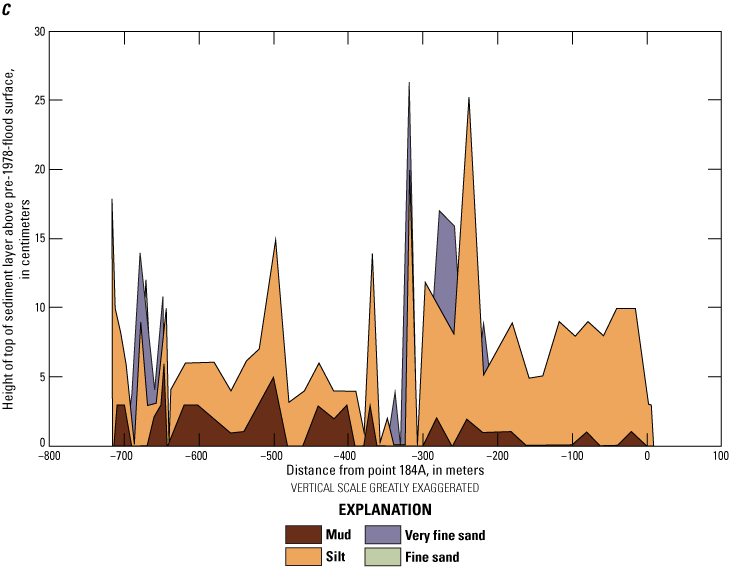
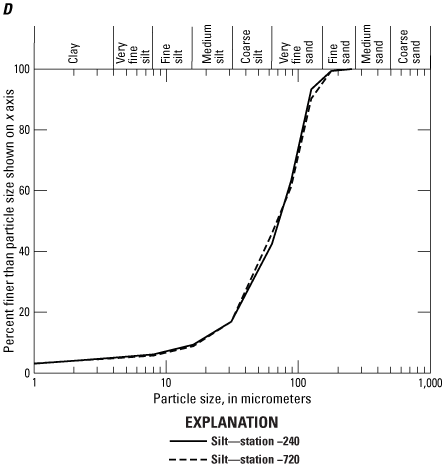
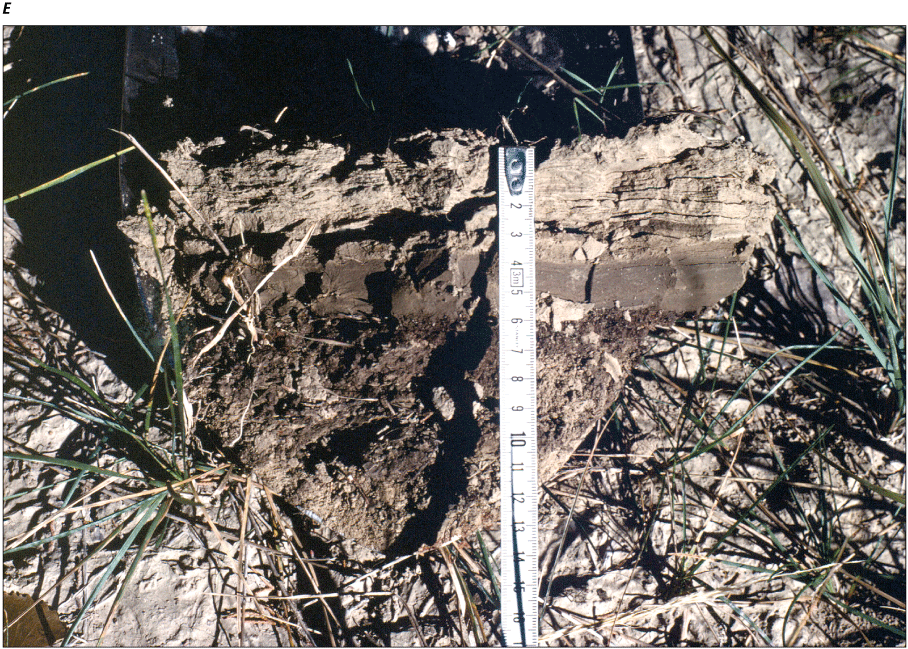
A, Aerial photograph showing reach of Powder River, southeastern Montana, location of valley transect V184 (refer to table 2 for Universal Transverse Mercator coordinates) on which overbank sediments were deposited during the flood of May 1978. Arrow indicates direction of flow in the channel. Aerial photograph by Bill Woodcock, Aerial Survey, Inc., Miles City, Mont., September 1978. Sta., station; T, true bearing. B, Transect profile showing thicknesses of sediments deposited along valley transect V184 during the flood of May 1978. The 1978 surface was assumed to be equal to the 2016 light detection and ranging surface, and the 1977 estimated surface was equal to the 1978 surface minus the sediment thickness. C, Graph showing thicknesses of sediments for different particle-size classes deposited by the Powder River flood of May 1978 along valley transect V184 as a function of the horizontal distance. Vertical scale has been exaggerated to show details of upward coarsening of particle sizes. D, Graph showing particle-size distributions of selected samples of silts deposited by the Powder River flood of May 1978 along valley transect V184. (Refer to samples listed in table 3 and footnote in table 1.16.) E, Photograph showing newly deposited overbank sediments atop older preflood sediment at station −540 of valley transect V184. Measuring tape reads 0 centimeter (cm) at the top of silt deposited by the flood of May 1978, 6 cm at the top of flood-deposited mud, and 7 cm at the preflood ground surface. Photograph by Robert H. Meade, U.S. Geological Survey, October 12, 1978.
Overbank sediment deposited on valley transect V184 consisted mostly of silts (fig. 1.16C) with an average size of about 0.042 mm, with lesser quantities of basal muds, and even lesser quantities of fine sand. Particle-size analyses of two silt samples collected from this transect were essentially identical (fig. 1.16D) and are listed in table 3. Many of these silt samples were recorded as “finely laminated” in the field notes, suggesting multiple pulses of overbank flow with higher concentrations, which may be related to the time-varying planiform vortices generated by the shear flow at the boundary between the channel bank and floodplain (Knight and others, 2009).
The average sediment thickness was 8 cm, and the maximum thickness was 28 cm. The average thickness was comprised of 1 cm of very fine sand, 6 cm of silt, and 1 cm of mud. Complete data on the thickness and lithology of the flood-deposited sediment are listed in table 1.16. Selected samples are graphed in figure 1.16D and shown in figure 1.16E.
Table 1.16.
Thickness and lithology of sediment deposited along valley transect V184 during the May 1978 flood on Powder River, southeastern Montana, measured on October 12, 1978.[Modified from Moody and Meade (2022, V184_V2). The number of sample sites is 48. Valley transect is on a magnetic bearing of 307 degrees from point 184A. Refer to table 2 for Universal Transverse Mercator coordinates for station −720 and station 0, point 184A. m, meter; cm, centimeter; cs, coarse sand; ms, medium sand; fs, fine sand; vfs, very fine sand; np, size fraction not present in coarsening-upward sequence; n, number of sample sites]
Indicates particle-size analysis (refer to table 3 and fig. 1.16D).
Valley Transect V191
Valley transect V191 crossed an extended axis of a prominent bend on the right bank in section 25 of township 5S, range 50E (fig. 1.17A, B). The left bank at cross section PR191 was not inundated. Valley transect 191 includes cross section PR191. The additional sediment measurements start at station 145 and extend to station 533 (fig. 1.17B). Details of sediment deposition at PR191 are described and discussed in a previous report (Moody and Meade, 2018, p. 100–104).
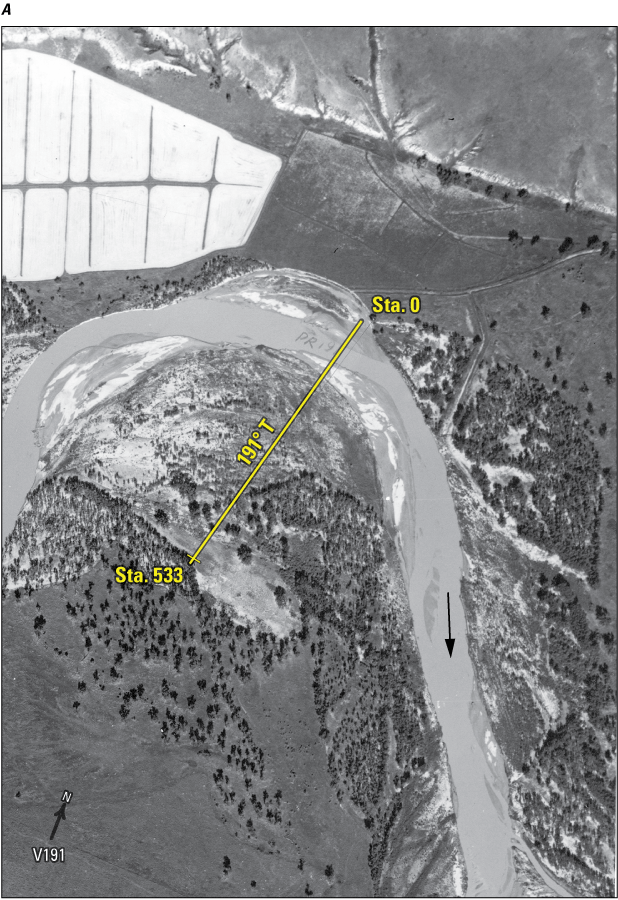
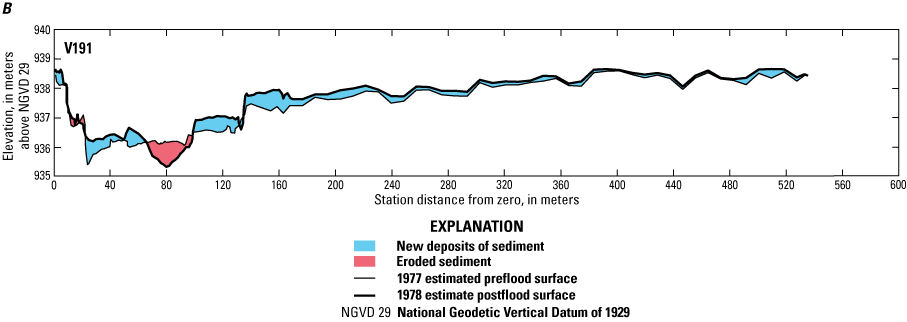
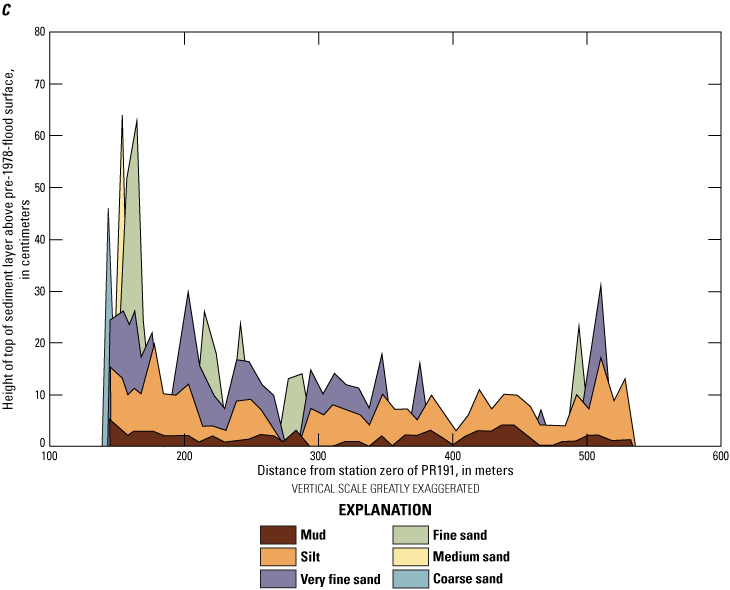
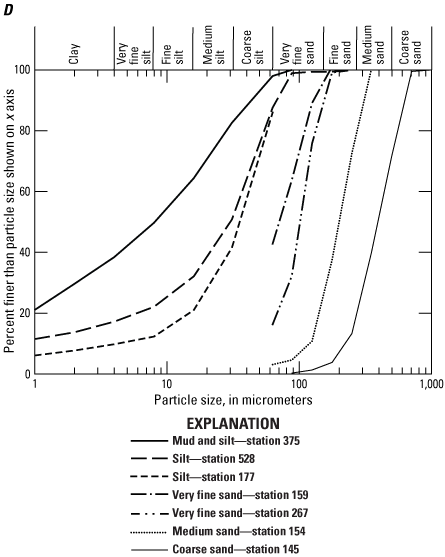
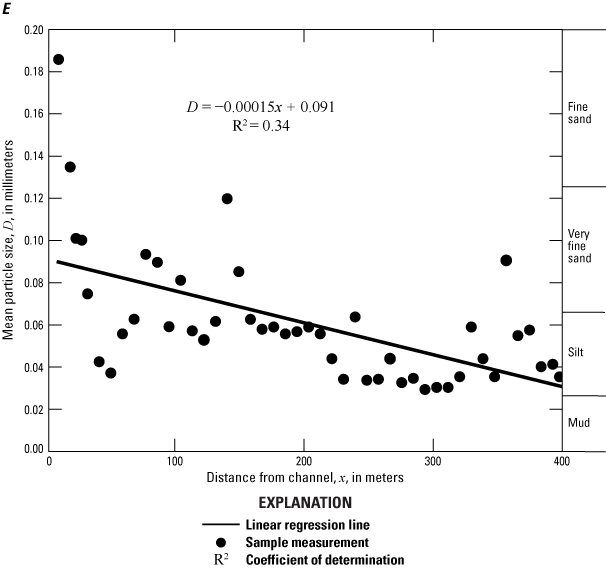
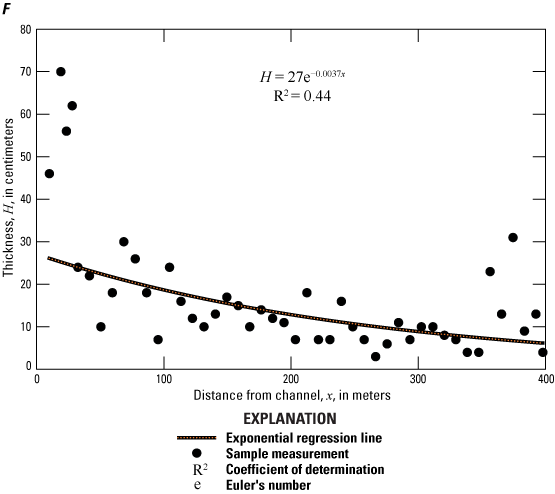
A, Aerial photograph showing curving reach of Powder River, northeastern Montana, location of valley transect V191 (refer to table 2 for Universal Transverse Mercator coordinates) and channel cross section PR191, on which overbank sediments were deposited during the flood of May 1978. Arrow indicates direction of flow in the channel. Aerial photograph by Bill Woodcock, Aerial Survey, Inc., Miles City, Mont., September 1978. Sta., station; T, true bearing. B, Transect profile showing thicknesses of sediments deposited along valley transect V191 during the flood of May 1978. The 1978 surface beyond station 150 was estimated using the 2016 light detection and ranging surface, and the 1977 surface was estimated by subtracting the sediment thickness from the 1978 surface. C, Graph showing thicknesses of sediments for different particle-size classes deposited by the Powder River flood of May 1978 along valley transect V191 as a function of the horizontal distance. Vertical scale has been exaggerated to show details of upward coarsening and lateral fining of particle sizes. D, Graph showing particle-size distributions of selected samples of overbank sediment deposited by the Powder River flood of May 1978 along valley transect V191. (Refer to samples listed in table 3 and footnote in table 1.17.) E, Graph showing mean particle size of overbank sediment deposited by the flood of May 1978 along valley transect V191 as a function of the distance from the channel. Zero distance on the graph corresponds to station 145 of cross section PR191. F, Graph showing thickness of overbank sediment deposited by the flood of May 1978 along valley transect V191 as a function of the distance from the channel. Zero distance on the graph corresponds to station 145 of cross section PR191.
Upward-coarsening sequence of sediment was seen along the entire transect. The basal layer of sediment was usually mud, at some sampling sites it was silt, and the top layer was usually either very fine sand or fine sand (fig.1.17C). The particle-size analysis of seven samples (table 3) is an example of the different degree of sorting for various particle sizes (Inman, 1949). Muds and silts are generally less well sorted than very fine and fine sands, which are better sorted than the coarser sands (fig. 1.17D). This transect is one of the best (R2=0.36) examples of lateral fining with distance from the main channel (fig. 1.17E). Particle sizes of selected samples are listed in table 3 and graphed in figure 1.17D.
Table 1.17.
Thickness and lithology of sediment deposited along valley transect V191 during the May 1978 flood on Powder River, southeastern Montana, measured on October 21, 1978.[Modified from Moody and Meade (2022, V191_V2). Transect is an extension of cross section PR191 on the right bank. 1 pace equals 0.90 meters. Refer to table 2 for Universal Transverse Mercator coordinates of station −0.4 and 186. m, meter; cm, centimeters, coarse sand; ms, medium sand; fs, fine sand; vfs, very fine sand; np, size fraction not present in coarsening-upward sequence]
Indicates particle-size analysis ( refer to table 3 and fig. 1.17D).
Average thickness of sediment from station 145 to 533 was 17 cm and the maximum thickness was 70 cm. This thick layer was deposited on the edge of a terrace near the river along with a similarly thick layer (about 50 cm) deposited on a different and lower terrace nearer to the river (fig. 1.17B). These deposited layers may be the result of helical flow in the meander bend during the flood of May 1978 that transported sediment up the point bar slope and deposited it on the terraces at different times during the flood (Dietrich and others, 1979).
This transect is one of the best (R2=0.44) examples of the exponential decrease in thickness with distance from the channel (fig. 1.17F). However, there are two groups of outliers at either end of the transect, suggesting that additional deposition processes other than diffusion may have been at work or that the sediments could have been deposited at different times during the flood hydrograph. Complete data on thickness and lithology are listed in table 1.17.
Valley Transect V195
Valley transect V195 crossed the downriver end of a segment of floodplain and wooded low terrace in the southwest quarter of section 20 of township 5S, range 51E (fig. 1.18A). The right side of this segment of wooded low (Lightning) terrace is constrained by the edge of a bluff formed by an older (Kaycee) terrace. A broad (approximately 100 m) subsidiary channel parallels the bluff and crosses the transect near the landward end of the transect at point 195A (station 0; fig. 1.18A, B). The mouth of this broad subsidiary channel is approximately 100 m from the main channel, near the arrow labeled B in figure 1.18A.
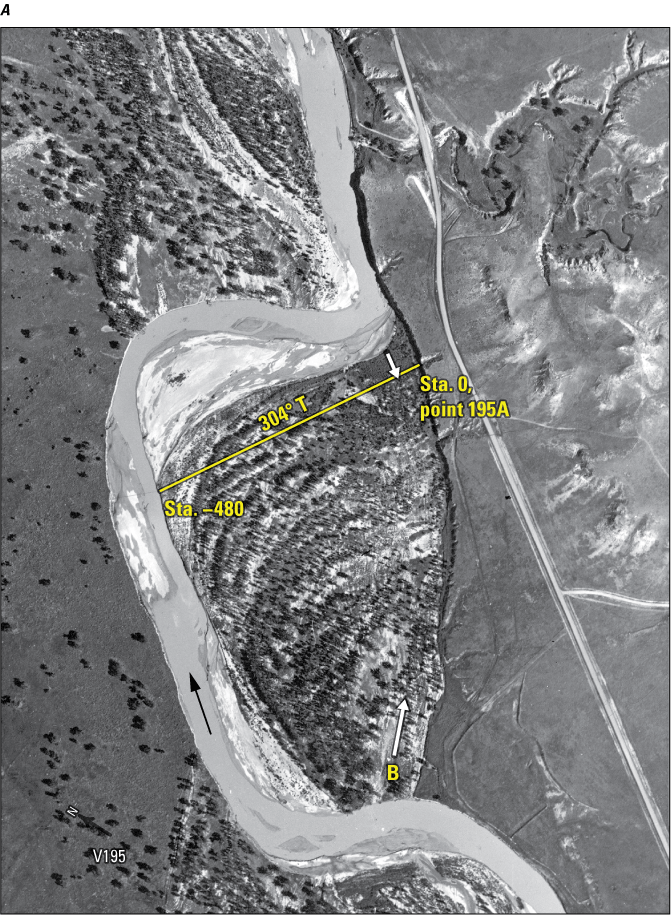
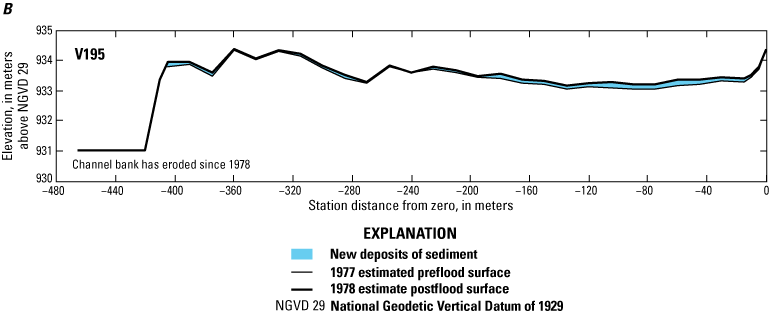
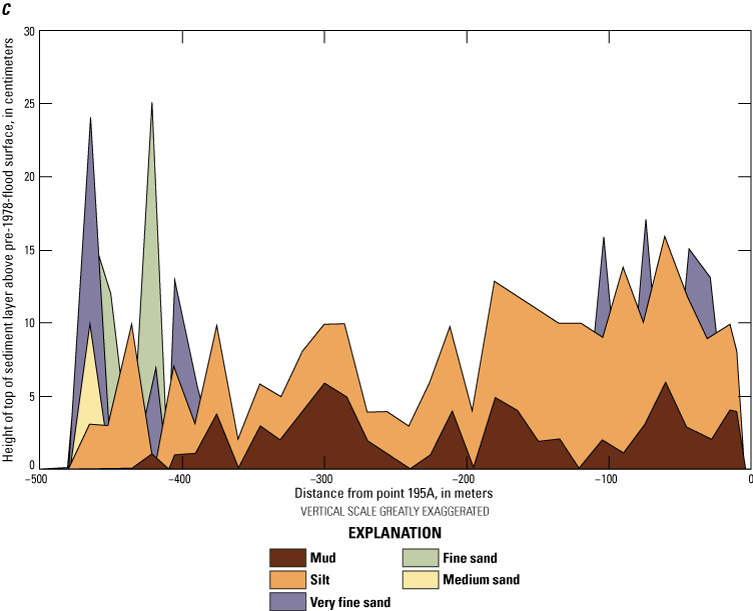
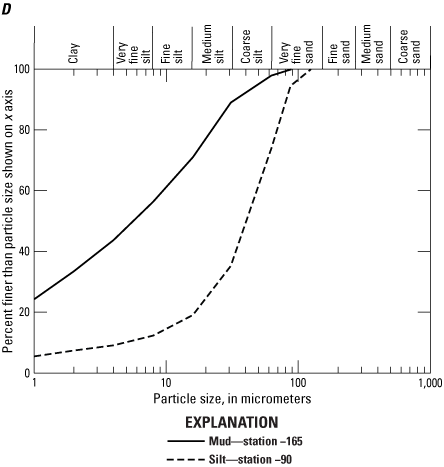
A, Aerial photograph showing reach of Powder River, southeastern Montana, location of valley transect V195 (refer to table 2 for Universal Transverse Mercator coordinates). The white arrow near station zero indicates the possible direction of backwater flow during the early stage of the flood, and the white arrow near B indicates the possible direction of flow near the peak stage of the flood. Black arrow indicates direction of flow in the channel. Aerial photograph by Bill Woodcock, Aerial Survey, Inc., Miles City, Mont., September 1978. Sta., station; T, true bearing. B, Transect profile showing thicknesses of sediments deposited along valley transect V195 during the flood of May 1978. The 1978 surface was assumed to be the same as the 2016 light detection and ranging surface, and the 1977 surface was estimated by subtracting the sediment thickness from the 1978 surface. C, Graph showing thicknesses of sediments for different particle-size classes deposited by the Powder River flood of May 1978 along valley transect V195 as a function of the horizontal distance. Vertical scale has been exaggerated to show details of upward coarsening of particle sizes. D, Graph showing particle-size distributions of selected samples of overbank sediment deposited by the Powder River flood of May 1978 along valley transect V195. (Refer to samples listed in table 3 and footnote in table 1.18.)
The bulk of the overbank sediment deposited on valley transect V195 by the 1978 flood comprises silts and basal muds. Sands were deposited nearer to the ends of the transect, with fine and medium sand at the end adjacent to the river channel (fig. 1.18A, C). The predominant mud and silt in the subsidiary channel probably were deposited during the early stages of the flood, as water backed into the channel, moved upriver, and spread laterally to perhaps a width of 200 m (fig. 1.18A). Later, the very fine sand likely was deposited from overbank flow coming down the subsidiary channel from upriver, where the subsidiary channel connects to the main channel at point B (fig. 1.18A). Based on the 2016 lidar, the height of the sill of the subsidiary channel at point B is approximately 2.3 m above bedfull flow, whereas the height of the bank where the transect begins is approximately 3.3 m above bedfull flow. Because of this height difference, the fine and medium sands near the edge of the main channel at station −480 (fig. 1.18A, C) probably were deposited later as the water overtopped the bank and spread laterally. The effect of these two sources of sediment on the particle-size distribution as a function of distance from the channel is shown in figure 9C. Particle-size distribution for two selected samples of mud and silt is shown in figure 1.18D and listed in table 3.
The average thickness of the layers of mud (3 cm) and silt (10 cm) deposited in the subsidiary channel (distances 0–195 m from point 195A) was thicker than that of the layers deposited along the rest of the transect (mud = 2 cm, silt = 6 cm). The average thickness across the entire transect was 10 cm, and maximum thickness was 25 cm. Complete data on thickness and lithology are listed in table 1.18.
Table 1.18.
Thickness and lithology of sediment deposited along valley transect V195 during the May 1978 flood on Powder River, southeastern Montana, measured on October 12, 1978.[Modified from Moody and Meade (2022, V195_V2). The number of sample sites is 34. Valley transect is on a magnetic bearing of 290 degrees from point 195A. Refer to table 2 for Universal Transverse Mercator coordinates for station 0, point 195A and station −480 m from point 195A. m, meter; cm, centimeter; cs, coarse sand; ms, medium sand; fs, fine sand; vfs, very fine sand; np, size fraction not present in coarsening-upward sequence; n, number of sample sites]
Indicates particle-size analysis ( refer to table 3 and fig. 1.18D).
Valley Transect V199
Valley transect V199 follows the near axis of an abandoned small meander bend of Powder River in the northeast quarter of section 17 of township 5S, range 51E (fig. 1.19A). This small meander bend was cut off artificially at some point in time during 1967–73 and remains so (Martinson and Meade, 1983, sheet 2); its axis lies athwart the flow direction of the 1978 channel of this reach of Powder River. This bend has a substantial subsidiary channel with an elevation about 1.5 m higher than that of the main channel. The transect is separated into left-bank and right-bank segments (fig. 1.19A–C).
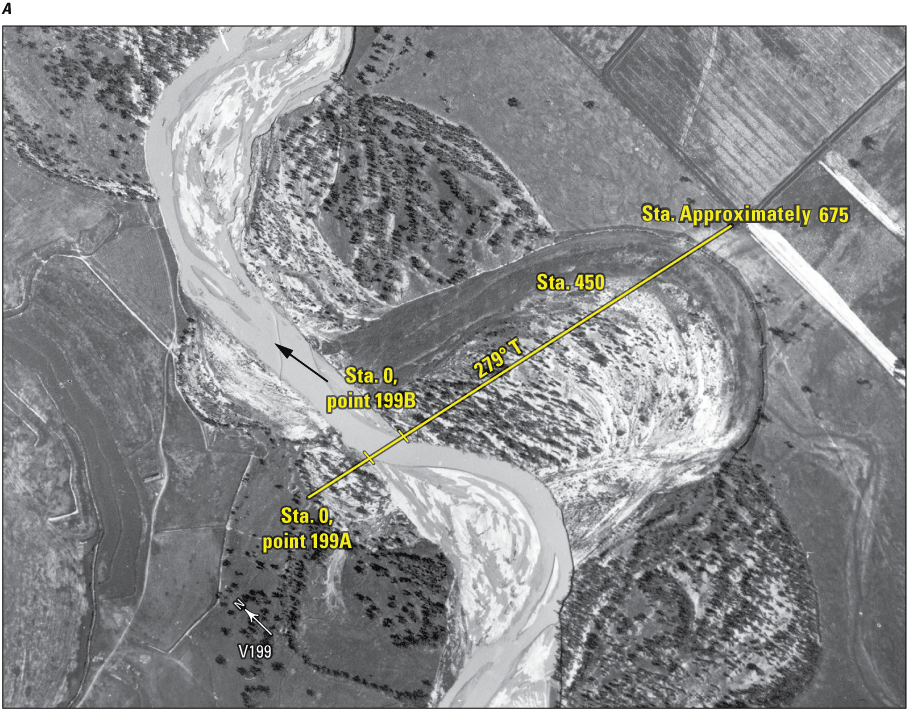
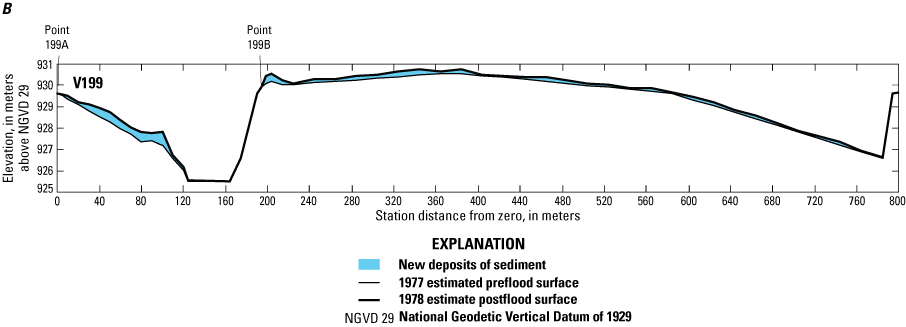
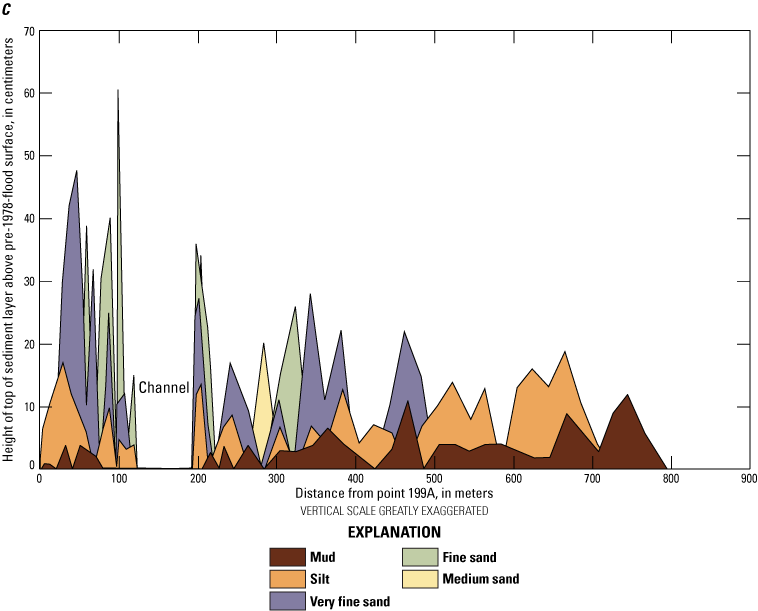
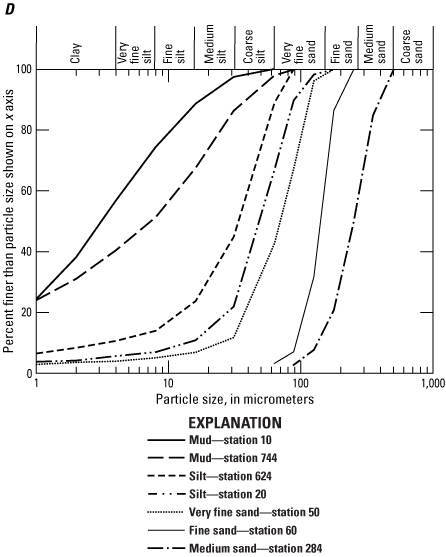
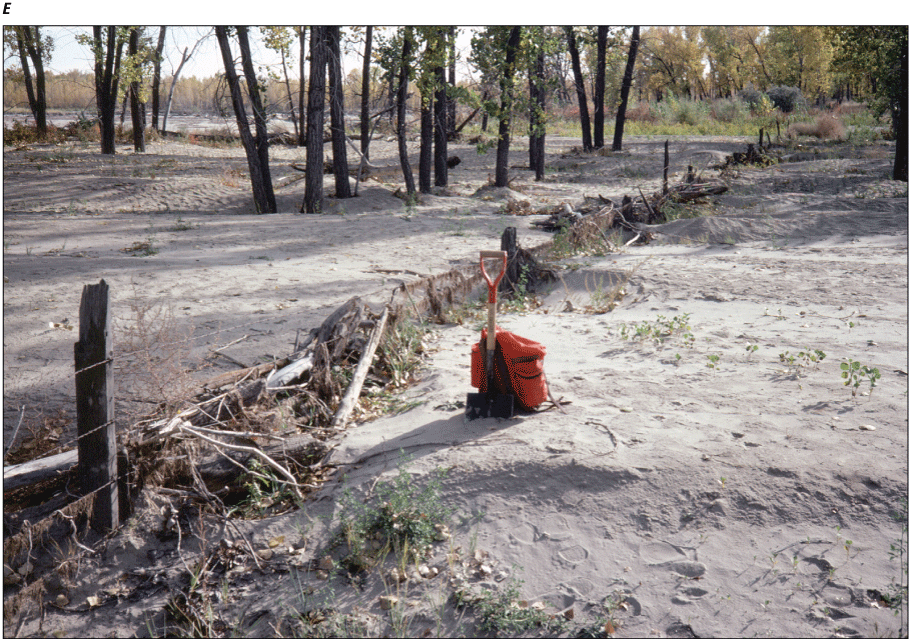
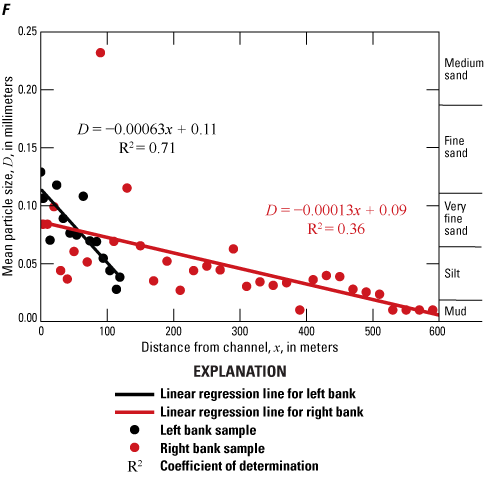
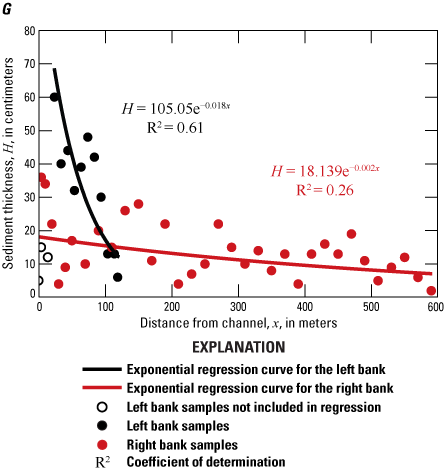
A, Aerial photograph showing reach of Powder River, southeastern Montana, showing location of valley transect V199 (refer to table 2 for Universal Transverse Mercator coordinates). Arrow indicates direction of flow in the channel. Aerial photograph by Bill Woodcock, Aerial Survey, Inc., Miles City, Mont., September 1978. Sta., station; T, true bearing. B, Transect profile showing thicknesses of sediments deposited along valley transect V199 during the flood of May 1978. The 1977 surface was estimated from the Broadus 7.5-minute topographic quadrangle, and the 1978 surface was estimated by adding the sediment thickness to the 1977 surface. C, Graph showing thicknesses of sediments for different particle-size classes deposited by the Powder River flood of May 1978 along valley transect V199 as a function of the horizontal distance. Vertical scale has been exaggerated to show details of upward coarsening within the complex mixture of particle sizes. D, Graph showing particle-size distributions of selected samples of overbank sediment deposited by the Powder River flood of May 1978 along valley transect V199. (Refer to samples listed in table 3 and footnote in table 1.19.) E, Photograph showing south–southeastward view (upvalley) of sand with a thickness of 0.5 meter (m) deposited by the flood of May 1978 on the left-bank floodplain of Powder River between stations 97 and 105 of valley transect V199. North–south fence line crosses transect V199 at 99 m from point 199A. Photograph by Robert H. Meade, U.S. Geological Survey, October 11, 1978. F, Graph showing particle size of overbank sediment deposited by the flood of May 1978 along valley transect V199 as a function of the distance from the channel. G, Graph showing thickness of overbank sediment deposited by the flood of May 1978 along valley transect V199 as a function of the distance from channel. Right bank is approximately 3 m higher than the left bank.
The flood deposited a complex mixture of muds, silts, and sands on the floodplains and low terraces on both sides of the active river channel (fig. 1.19C−E). On the left bank, the decrease in particle size with distance from the channel is significant (R2=0.71; fig. 1.19F). This trend may be aided by a substantial increase in elevation of approximately 2.5 m from the left bank edge of the channel. The edge of the right bank is approximately 3 m higher than the edge of the left bank, and the particle sizes on the right bank are generally smaller than those on the left bank (fig. 1.19C, D). Particle-size distributions for seven selected samples are shown in figure 1.19D and listed in table 3.
Total thickness on the left bank decreased exponentially (R2=0.61) with distance from the channel if the first three data points are not included (fig. 1.19G). The substantial decrease in thickness for these three data points may be the result of erosion on the falling limb of the flood hydrograph or by scour from planimetric or streamwise vortices at the edge of the bank (Knight and others, 2009). The average thickness on the left bank was 27 cm, with a maximum thickness of 60 cm, whereas the average thickness on the right bank was 13 cm, with a maximum thickness of 36 cm. The difference in thickness may be a function of the difference in elevation of the right and left banks. Complete data on thickness and lithology are listed in table 1.19.
Table 1.19.
Thickness and lithology of sediment deposited along valley transect V199 during the May 1978 flood on Powder River, southeastern Montana, measured on October 11, 1978.[Modified from Moody and Meade (2022, V199_V2). The number of sample sites on the left bank (LB) is 16, and on the right bank (RB) is 36.Valley transect is on a magnetic bearing of 085 degrees beginning at point 199A. Refer to table 2 for Universal Transverse Mercator coordinates for station 0, point 199A; station 0, point 199B; and station approximately 675 m from point 199B. m, meter; cm, centimeter; cs, coarse sand; ms, medium sand; fs, fine sand; vfs, very fine sand; np, size fraction not present in coarsening-upward sequence; n, number of sample sites; LB, left bank; RB, right bank]
Indicates particle-size analysis (refer to table 3 and fig. 1.19D).
Valley Transect V206
Valley transect V206 crosses the floodplain and low terraces along Powder River near Broadus, Montana, in the northern edges of sections 2 and 3 of township 5S, range 51E (fig. 1.20A). The transect is the extension—to the right and left of cross section PR206—on both sides of the channel. The extension on the left bank is 1,045 m long and crosses a subsidiary channel. The extension of the right bank is 155 m long. Both extensions are at approximately the same elevation (921 m), which is approximately 3 m above the bed of Powder River (fig. 1.20B). Owing to the extension of the transect along the azimuth of channel cross section PR206, the alignment of valley transect V206, relative to the downvalley direction of the 1978 flow of floodwater, is more diagonal than orthogonal.
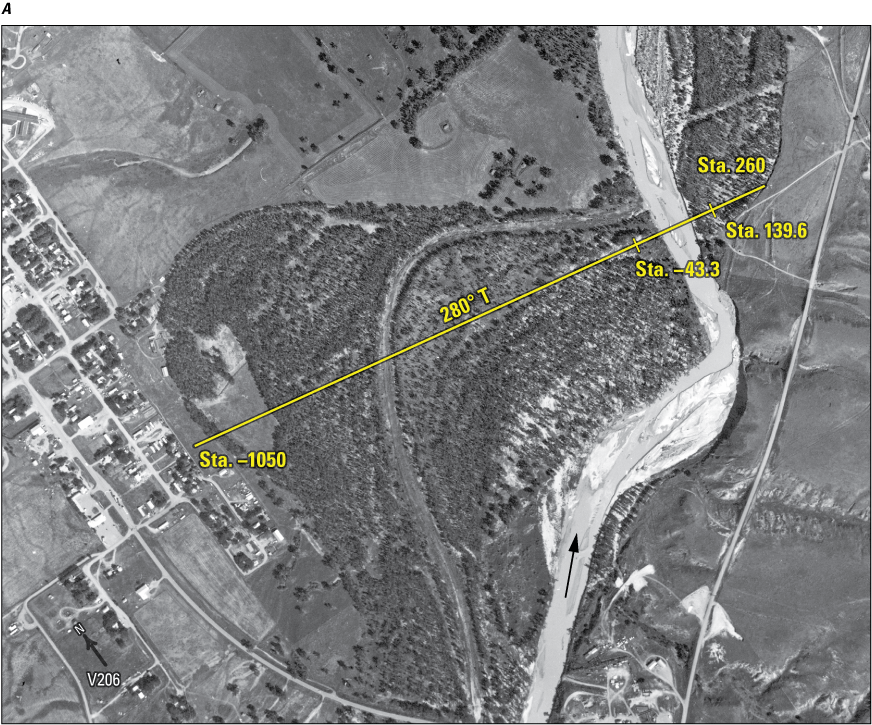
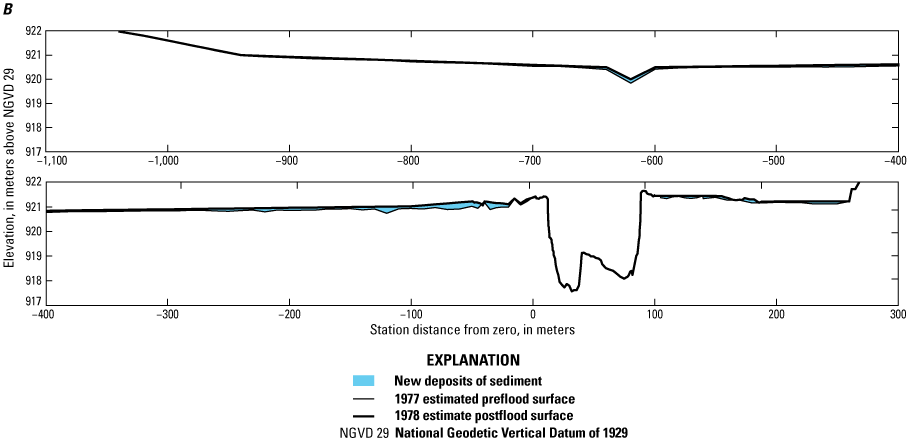
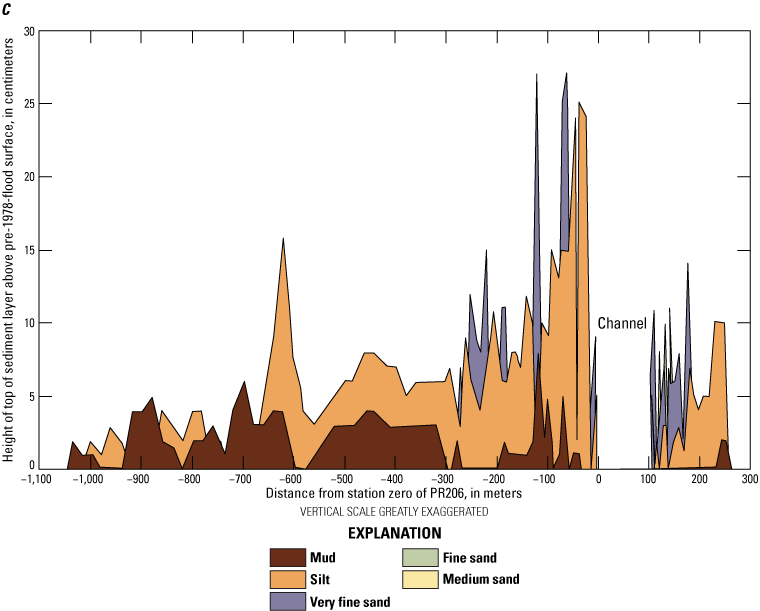
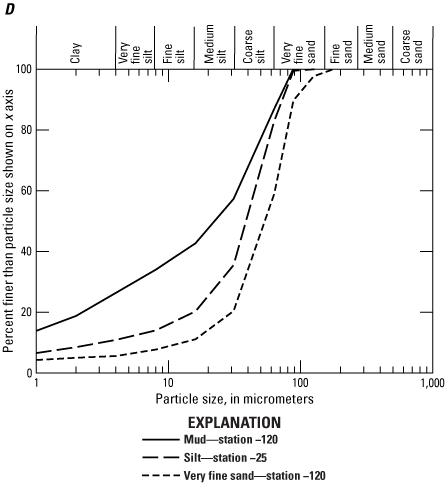
A, Aerial photograph showing reach of Powder River near Broadus, southeastern Montana, location of valley transect V206 (refer to table 2 for Universal Transverse Mercator coordinates) on which overbank sediments were deposited during the flood of May 1978. Arrow indicates direction of flow in the channel. Aerial photograph by Bill Woodcock, Aerial Survey, Inc., Miles City, Mont., September 1978. Sta., station; T, true bearing. B, Transect profile showing the thicknesses of sediments deposited along valley transect V206 during the flood of May 1978. Stations 1–100 were resurveyed in 1977 and 1978. Remaining stations in 1978 were either surveyed in 1984, 1991, 2014, or extracted from the Broadus 7.5-minute quadrangle. The 1977 surface was equal to the 1978 surface minus the sediment thickness. C, Graph showing thicknesses of sediments for different particle-size classes deposited by the Powder River flood of May 1978 along valley transect V206 as a function of the horizontal distance. Vertical scale has been exaggerated to show details of lateral fining and upward coarsening of particle sizes. D, Graph showing particle-size distributions of selected samples of overbank sediment deposited by the Powder River flood of May 1978 along valley transect V206. (Refer to samples listed in table 3 and footnote in table 1.20.)
On both extensions of the transect, particle size decreases with distance away from the channel. The right bank had a little stronger trend (R2=0.54) than the left bank (R2=0.37). Silt was the predominant particle size along both extensions of the transect (fig. 1.20C). Particle-size distributions for three selected samples are shown in figure 1.20D and listed in table 3.
The average thickness on the left-bank extension was 8 cm, with a maximum thickness of 27 cm, whereas the average thickness on the right-bank extension was 7 cm, with a maximum thickness of 14 cm. Silt was the predominant particle size and averaged 5 cm thick on the left-bank extension and 4 cm thick on the right-bank extension. Complete data on thickness and lithology are listed in table 1.20.
Table 1.20.
Thickness and lithology of sediment deposited along valley transect V206 during the May 1978 flood on Powder River, southeastern Montana, measured on October 9, 1978.[Modified from Moody and Meade (2022, V206_V2). The number of sample sites on the left bank (LB) is 73, and on the right bank (RB) is 20. Valley transect V206 is an extension of the cross section PR206 on the left and right banks. Refer to table 2 for Universal Transverse Mercator coordinates for stations −1050, 260, and −43.3. m, meter; cm, centimeters, coarse sand; ms, medium sand; fs, fine sand; vfs, very fine sand; np, size fraction not present in coarsening-upward sequence; n, number of sample sites]
Indicates particle-size analysis (refer to table 3 and fig. 1.20D).
References Cited
Cohen, T.J., and Nanson, G.C., 2008, Topographically associated but chronologically disjunct late Quaternary floodplains and terraces in a partly confined valley, south-eastern Australia: Earth Surface Processes and Landforms, v. 33, no. 3, p. 424–443, accessed September 3, 2013, at https://doi.org/10.1002/esp.1565.
Gay, G.R., Gay, H.H., Gay, W.H., Martinson, H.A., Meade, R.H., and Moody, J.A., 1998, Evolution of cutoffs across meander necks in Powder River, Montana, USA: Earth Surface Processes and Landforms, v. 23, p. 651–662. [Also available at https://doi.org/10.1002/(SICI)1096-9837(199807)23:7<651::AID-ESP891>3.0.CO;2-V.]
Hickin, E.J., and Nanson, G.C., 1975, The character of channel migration on the Beatton River, Northeast British Columbia, Canada: Geological Society of America Bulletin, v. 86, p. 487–494, accessed July 29, 2019, at https://doi.org/10.1130/0016-7606(1975)86<487:TCOCMO>2.0.CO;2.
Inman, D.L., 1949, Sorting of sediments in the light of fluid mechanics: Journal of Sedimentary Petrology, v. 19, no. 2, p. 51–70. [Also available at https://doi.org/10.1306/d426934b-2b26-11d7-8648000102c1865d.]
Knight, D.W., Aya, S., Ikeda, S., Nezu, I., and Shiono, K., 2009, Flow structure, chap. 2 of McEwan, I.K., and Ikeda, S., eds., Flow and sediment transport in compound channels—The experiences of Japanese and UK research: Boca Raton, Florida, CRC Press; International Association of Hydraulic Engineering and Research Monograph Series, p. 5–114.
Martinson, H.A., and Meade, R.H., 1983, Channel changes of Powder River, 1938–78, Powder River County, Montana: U.S. Geological Survey Hydrologic Investigations Atlas HA–661, 3 sheets, scale 1:24,000, https://doi.org/10.3133/ha661.
Moody, J.A., and Meade, R.H., 2018, Decadal changes in channel morphology of a freely meandering river—Powder River, Montana, 1975–2016: U.S. Geological Survey Open-File Report 2018–1012, 143 p. [Also available at https://doi.org/10.3133/ofr20121012.]
Moody, J.A., and Meade, R.H., 2022, Thickness and characteristics of overbank sediment deposited during an extreme flood in May 1978 along Powder River, Montana, USA: U.S. Geological Survey data release, accessed July 5, 2025, at https://doi.org/10.5066/P9FW7BV0.
Schook, D.M., Rathburn, S.L., Friedman, J.M., and Wolf, J.M., 2017, A 184-year record of river meander migration from tree rings, aerial imagery, and cross sections: Geomorphology, v. 293, part A, p. 227–239, accessed July 30, 2024, at https://doi.org/10.1016/j.geomorph.2017.06.001.
Conversion Factors
International System of Units to U.S. customary units
Datums
Vertical coordinate information is referenced to the National Geodetic Vertical Datum of 1929 (NGVD 29) unless otherwise stated.
Horizontal coordinate information is referenced to the North American Datum of 1983 (NAD 83).
Elevation, as used in this report, refers to distance above the vertical datum.
Supplemental Information
Concentrations of suspended sediments in water are given in milligrams per liter (mg/L).
For more information about this publication, contact
U.S. Geological Survey
Water Mission Area
https://www.usgs.gov/mission-areas/water-resources
Publishing support provided by
U.S. Geological Survey Science Publishing Network,
Denver and Lafayette Publishing Service Centers
Disclaimers
Any use of trade, firm, or product names is for descriptive purposes only and does not imply endorsement by the U.S. Government.
Although this information product, for the most part, is in the public domain, it also may contain copyrighted materials as noted in the text. Permission to reproduce copyrighted items must be secured from the copyright owner.
Suggested Citation
Moody, J.A., and Meade, R.H., 2026, Thickness and other characteristics of overbank sediment deposited during an extreme flood in May 1978 along the Powder River, Montana: U.S. Geological Survey Scientific Investigations Report 2026–5122, 171 p., https://doi.org/10.3133/sir20265122.
ISSN: 2328-0328 (online)
Study Area
| Publication type | Report |
|---|---|
| Publication Subtype | USGS Numbered Series |
| Title | Thickness and other characteristics of overbank sediment deposited during an extreme flood in May 1978 along the Powder River, Montana |
| Series title | Scientific Investigations Report |
| Series number | 2026-5122 |
| DOI | 10.3133/sir20265122 |
| Publication Date | April 01, 2026 |
| Year Published | 2026 |
| Language | English |
| Publisher | U.S. Geological Survey |
| Publisher location | Reston VA |
| Contributing office(s) | WMA - Earth System Processes Division |
| Description | Report: vii, 171 p.; 2 Data Releases |
| Country | United States |
| State | Montana |
| Other Geospatial | Powder River |
| Online Only (Y/N) | Y |