

Estimation of Impounded Sediment Volume in the Similkameen River upstream of Enloe Dam, Okanogan County, Washington
Links
- Document: Report (10 MB pdf) , HTML , XML
- Data Releases:
- USGS data release - Sediment volume and bedrock of the Similkameen River above Enloe Dam near Oroville, Washington
- USGS data release - Continuous resistivity profiling (CRP) in the Similkameen River above Enloe Dam, Okanogan County, Washington
- NGMDB Index Page: National Geologic Map Database Index Page (html)
- Download citation as: RIS | Dublin Core
Acknowledgments
Thanks to the Confederated Tribes of the Colville Reservation, Arnold Abrahamson and Chris Fisher of Colville Fisheries for their support and cooperation on this project. An additional thanks to Carole Johnson and Eric White from the U.S. Geological Survey for their support.
Abstract
The Enloe Dam was built in 1920 for hydropower generation and impounds a steep-banked, narrow reach of the Similkameen River in north-central Washington. During the subsequent century, sediment from the Similkameen River watershed, which includes historical mining operations, accumulated within Enloe Dam’s impoundment. Enloe Dam ceased hydropower production in 1958 and is currently under consideration for removal, but there are concerns that the remobilization of sediments may have harmful impacts on downstream water quality. To complement previously published analyses of heavy metal concentrations within sediments and assess the total volume that may be transported following dam removal, this report presents estimates of the volume of sediment trapped behind Enloe Dam which was measured in 2020. The volume of sediment was estimated by comparing a bathymetric survey, collected using an acoustic Doppler continuous profiler, and a survey of the bedrock-sediment interface, collected using a continuous resistivity profiler.
The study area spanned a 2.6-kilometer reach of the Similkameen River upstream from Enloe Dam. The volume of impounded sediment was calculated in 2020 by subtracting the elevation of the bedrock-sediment interface measured using the continuous resistivity profiler from a bathymetric surface measured by the acoustic Doppler current profiler. In 2020, the estimated volume of sediment impounded by Enloe Dam was 2.17±0.04 million cubic meters (Mm3) compared to 1.37 Mm3 measured in 1971. This equates to a deposition rate of approximately 16,300 cubic meters per year from 1971 to 2020. Continuous resistivity profiles revealed that bedrock within Enloe Dam’s impoundment was deepest (about 20 m) in the southern, downstream end of the profiles and shallowest (less than 5 m) in the northern upstream end of the profiles.
Introduction
The Similkameen River flows 116 kilometers (km) from its headwaters on the eastern slopes of the Cascade Range along the international border between British Columbia, Canada and Washington State, USA to its confluence with the Okanogan River near Oroville, Washington (fig. 1). Enloe Dam is a run-of-the-river dam with no appreciable water storage. It was constructed in 1920 just upstream from Similkameen Falls on the Similkameen River for hydroelectric power generation. By 1958, hydroelectric power generation at the Enloe Dam became uneconomical, and the dam’s powerhouse was decommissioned, but the dam structure remained in place. In subsequent decades, several attempts to restart power generation at Enloe Dam were unsuccessful, and the Board of Commissioners of the Okanogan County Public Utility District (PUD), which owns Enloe Dam, decided to stop pursuing electrification in 2018, allowing the Federal Energy Regulation Commission license for Enloe Dam to expire the following year. At the time of writing, the Okanogan County PUD and various stakeholders are exploring options for the future of Enloe Dam, including its potential removal. Over the past 2 decades, several dams throughout the Pacific Northwest have been removed to support ecological restoration including the reconnection of upstream habitat for anadromous salmonids, including the Elwha, Glines Canyon, Marmot, and Pilchuck River Diversion Dams (Major and others, 2012; Warrick and others, 2019; Anderson and others, 2024). In addition, because the Enloe Dam lacks fish ladders and blocks upstream migration of anadromous salmonids, its removal has the potential to connect upstream habitat that may be used by anadromous salmonids.
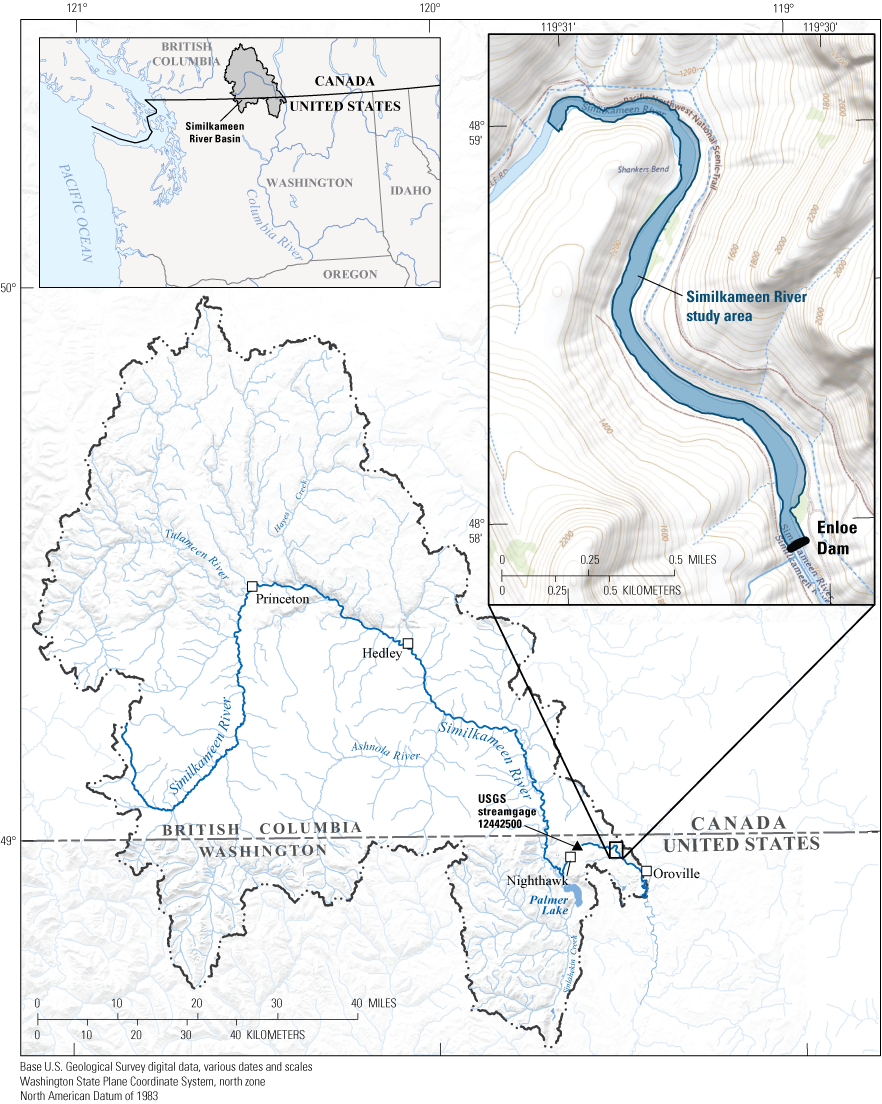
Study area in the lower Similkameen River upstream from Enloe Dam near Oroville within the Similkameen River Basin in British Columbia, Canada, and Washington State. The location of the Similkameen River Near Nighthawk, WA U.S. Geological Survey Station (12442500) is shown upstream of Enloe Dam (U.S. Geological Survey, 2016).
Among the considerations for dam removal is the fate of sediments accumulated in the 2.6-km reach of the Similkameen River upstream of Enloe Dam. To assess the potential effects of the remobilization of these sediments on the Similkameen and Okanogan Rivers downstream, dam-removal planning requires information about the composition and volume of sediment within the impoundment. The volume of sediment underlying Enloe Dam’s impoundment was previously measured in 1971 to be approximately 1.37 million cubic meters (Mm3; Nelson, 1972). The 1971 estimate was based on the difference between 1971 bathymetric surveys and a pre-dam longitudinal streambed profile conducted by the U.S. Geological Survey (USGS) in 1934 and by the Okanogan Valley Power Co. in 1916 (Nelson, 1972). Sediments deposited within the impoundment are predominantly within the sand fraction (greater than [>] 63 micrometers and less than [<] 2 millimeters; Nelson, 1972; Johnson and Plotnikoff, 2000; Cox and others, 2022). Current and historical mining in the Similkameen River basin led to concerns that concentrations of heavy metals may be elevated within these sediments.
Mine exploration, development, and extraction of commodities including gold, silver, platinum, copper, zinc, cobalt, molybdenum, and coal have occurred along the American and Canadian parts of the Similkameen River Basin since the late 19th century (Umpleby, 1911; Dolmage, 1934; Rinehart and Fox, 1972; Ray and others, 1992; Cox, 1997; Woodhouse and others, 2011; Britton, 2016). Although small-scale recreational placer mining for gold still occurs, commercial mining operations have decreased within the Similkameen River Basin during the past 50 years and are currently limited to the Copper Mountain Mine near Princeton, British Columbia. Mine tailings from the Copper Mountain Mine, which consist of finely ground rock waste from the ore extraction process that may contain trace metals, are contained within a modern tailing-containment facility; however, historical mining practices in the United States and Canada did not necessarily regulate the discharge of mine tailings to downstream receiving waters (Cox and others, 2022). Historical mining operations created a legacy of trace-metal contamination in many rivers, streams, and lakes throughout western North America (U.S. Environmental Protection Agency 1995, 2001; National Research Council, 2005; Sims and others 2013, Wentz and others, 2014).
In the Similkameen River, previous studies of trace metal concentrations in water and sediment have reported elevated concentrations of arsenic and copper, but levels of mercury, which was used extensively in the recovery of gold, were not elevated (Johnson and Plotnikoff, 2000; Johnson, 2002; Hurst, 2003; Peterschmidt, 2005; Public Utility District No. 1 of Okanogan County, 2012). In the Enloe Dam impoundment, Cox and others (2022) reported that sediment was not enriched in mercury or lead, but elemental concentrations of some trace metals within sediment were elevated above average upper continental-crustal concentrations. Trace element analyses, including those such as arsenic, copper, and mercury, of sediment within the Enloe Dam impoundment suggests association with geologic material mined near Hedley, British Columbia (Cox and others, 2022), where seasonal flooding of mine-tailings ponds could potentially transport mine tailings into tributaries of the Similkameen River (Cox, 1997; Sahota and others, 1999; Horton and Kemp, 2001; Johnson, 2002).
Proposals for the removal of Enloe Dam have considered the concentration of trace metals within sediment impounded behind the dam as well as the total volume of accumulated sediment that may be remobilized after dam removal (Normand, 2021). The remobilization of potentially contaminated sediments could have adverse effects throughout a large portion of the Columbia River Basin. Cox and others (2022) reported trace metal concentrations and particle-size data for cores collected from the Enloe Dam’s impoundment, but the volume of sediment within the Enloe Dam impoundment has not been measured since 1971. In autumn 2020, the USGS, in cooperation with the Fish and Wildlife Department of the Confederated Tribes of the Colville Reservation, measured the bathymetry of the Enloe Dam impoundment using an acoustic Doppler continuous profiler (ADCP) and a continuous resistivity profiling meter to survey the elevation of the bedrock-sediment interface. These data were analyzed to provide updated estimates of the volume of sediment within the Enloe Dam impoundment.
Purpose and Scope
The purpose of this report is to present an estimate of the volume of sediment in the Enloe Dam impoundment. Estimated sediment volume was computed from surveys of the thickness of unconsolidated sediments, which was determined by subtracting the elevation of bedrock from the bathymetric surface within a 2.6-km reach of the Similkameen River impounded by Enloe Dam east of Oroville, Washington (fig. 1). Results may inform removal strategies of the Enloe Dam to restore the Similkameen River to its pre-dam condition and assess downstream flood risks and impacts to water and sediment quality in the Similkameen and Okanogan Rivers.
Geographic Setting
The Similkameen River drains a 9,270 km2 area of the Columbia River Basin. About 82 percent of the Similkameen River’s contributing area is located within southern British Columbia, Canada, with the rest located in north-central Washington State (fig. 1). The Similkameen River flows north through Princeton, Canada and then southeast into the United States near Nighthawk, Washington about 26 km upstream from its confluence with the Okanogan River. Predominant land cover within the Similkameen River Basin includes forested lands in the uplands and undeveloped range, grazing lands, and orchards in the main valleys. Residential development is largely limited to the main river valley of the Similkameen River; the largest town in the Similkameen River Basin, Princeton, British Columbia, had a population of about 2,900 in 2021 (Statistics Canada, 2022).
Unlike the nearby Okanogan River, which is regulated by a series of dams and impoundments in the United States and Canada, the Similkameen River has no large impoundments with appreciable water-storage capacity, and discharge is not regulated. Enloe Dam, which impounds the Similkameen River about 14.2 km upstream from its confluence with the Okanogan River, is a run-off the river dam and has a negligible effect on the discharge of the Similkameen River. Similkameen River discharge has been measured since 1928 at U.S. Geological Survey streamgage station 12442500 near Nighthawk, about 11.2 km upstream from Enloe Dam. On an annual basis, the Similkameen River accounts for approximately 75 percent of the Okanogan River discharge at its confluence with the Similkameen River (U.S. Geological Survey, 2016).
The climate of the Similkameen River Basin is semi-arid with higher amounts of precipitation in the western part of the basin within higher elevations of the eastern slopes of the Cascade Range. Most precipitation falls as snow within the higher elevations (above 1,000 m) of the basin in the winter months and most runoff to the Similkameen River occurs from snowmelt during the spring freshet in May and June when discharge measured at the USGS streamgage, Similkameen River near Nighthawk (12442500) averaged 233 cubic meters per second (m3/s) between water years 1928 and 2023, respectively (U.S. Geological Survey, 2016). Average discharge at this streamgage during this period was at its annual minimum, 16.3 m3/s, during late summer base flow in September when runoff from precipitation and snowmelt was minimal and discharge was primarily sustained by groundwater contributions (U.S. Geological Survey, 2016).
The Similkameen River upstream from Enloe Dam is a single threaded meandering stream confined within a bedrock canyon with alternate and medial bars (fig. 1). These bars consist mostly of finer grain sediments, such as silts and sands, with cobbles also present, but in lower numbers. The surface geology of the valley upstream from Enloe Dam is composed of Pleistocene till and outwash clay, silt, sand, gravel, cobbles, and boulders (Washington Geological Survey, 2024). Channel width upstream from the impoundment area is generally between 50–100 meters (m). Turbidity within the channel is generally low, ranging from <0.5 to 8 formazin nephelometric units (FNU). Occasional events, such as flooding or wildland fires within the basin, can caused short lived increases in turbidity between approximately 40 FNU to over 100 FNU (U.S. Geological Survey, 2016).
Methods
The volume of sediment deposited in the Enloe Dam’s 2.6-km impoundment was determined by subtracting the elevation of the bedrock-unconsolidated sediment interface from the elevation of the bathymetric surface. The elevation of the bedrock-unconsolidated sediment interface was interpreted from eight longitudinal continuous resistivity profiles (CRPs) surveyed within Enloe Dam’s impoundment in December 2020 (Headman and others, 2023a). Bathymetry of Enloe Dam’s impoundment was surveyed at 23 cross sections with an ADCP (RiverPro ADCP by Teledyne Marine Inc.) in September 2020, which was referenced to the North American Vertical Datum of 1988 (NAVD 88) by measuring the elevation of the water surface using real-time kinematic global positioning system (RTK-GPS) surveys (Headman and others, 2021). Three methods were used to generate a digital surface model, and the mean of those three methods was used as the estimated the volume of sediment deposited behind Enloe Dam. Methods used different splining routines and interpolator approaches. Digital surface models were interpolated for the bedrock-unconsolidated sediment interface and the bathymetric surface. These digital surface models were then differenced to estimate the thickness of sediment within each 3×3 m cell of the study area. These thicknesses were then summed to estimate the total volume of sediment deposited within Enloe Dam’s impoundment (Headman and others, 2023b). Cross sections of Enloe Dam’s impoundment were also computed at the locations surveyed by Nelson (1972) and at coring points described in Cox and others (2022).
Bathymetric Survey
Bathymetry of the reservoir floor was mapped for the 256,000-square-meter area that stretches from Enloe Dam to 2.6 km upstream from Enloe Dam (fig 1.). Bathymetry was surveyed using a Q-boat-mounted ADCP (RiverPro ADCP by Teledyne Marine Inc.) in September 2020 at 23 cross-section locations (Headman and others, 2021; fig. 2). Water-surface elevations were surveyed with RTK-GPS using Trimble R8 global navigation satellite system (GNSS) receivers according to procedures described in Rydlund and Densmore (2012). The survey measured at an estimated 2-m spacing along the impoundment’s shoreline for the entire survey area. Control points for the survey were established and occupied during the water-surface elevation survey and used to correct the RTK-GPS measured elevations. Survey points unable to be corrected to less than 0.5 m were removed from the analysis. In some locations, the RTK-GPS survey was not able to be completed due to safety concerns or inaccessible terrain (for example, protruding bedrock cliffs). At these locations, shoreline elevations were determined from aerial LiDAR collected in 2015 (Quantum Spatial Inc., 2016). ADCP data were post-processed using a computed average of four-beam depths in the USGS Velocity Mapping Toolbox software (Parsons and others, 2013) and geo-referenced with concurrently measured GPS coordinates. A bathymetric surface model of the reservoir floor was generated in ESRI ArcGIS Pro version 2.7.1 (Esri, Inc., 2020) using the ADCP-measured water depths, RTK-GPS survey points of the water-surface elevation along the shoreline, and lidar shoreline elevations using spline interpolation (Amante and Eakins, 2016). The bathymetric surface model represents the sediment surface below the water within the impoundment area.
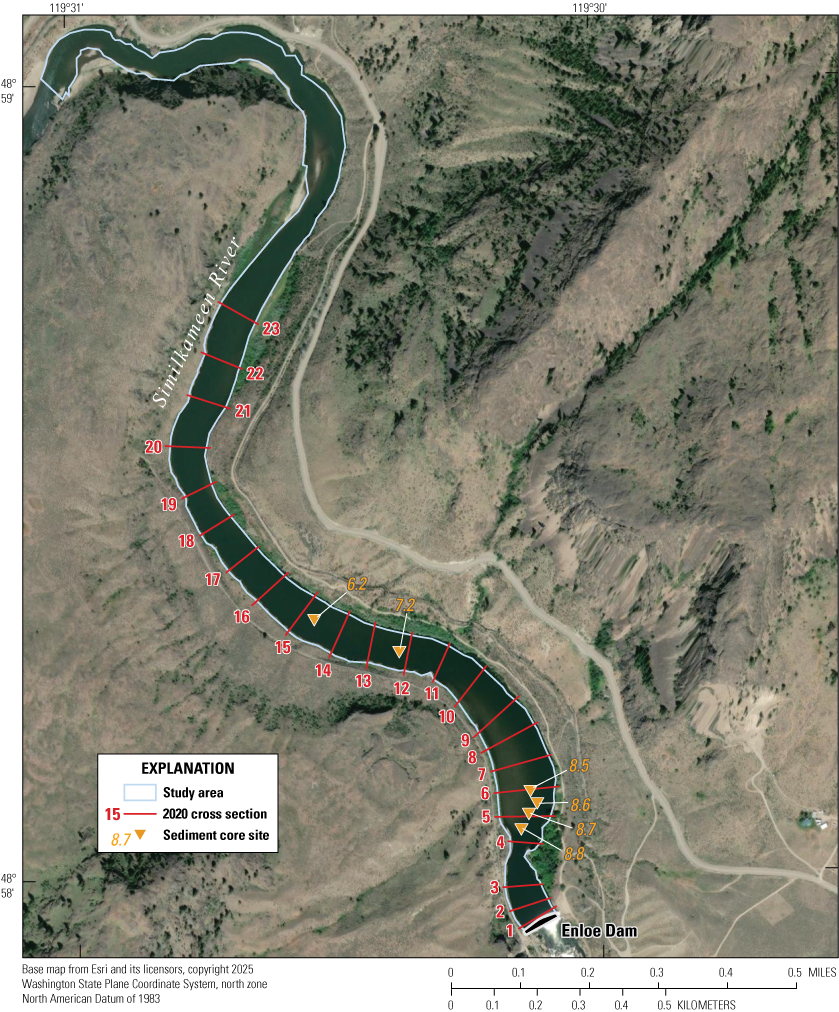
The location of cross sections measured using an acoustic Doppler continuous profiler (ADCP) and sediment cores from Cox and others (2022) within the Enloe Dam impoundment area of the Similkameen River, Washington State.
Determination of Bedrock Depth with Continuous Resistivity Profiling
The depth of sediment (to bedrock) was measured using electrical resistivity tomography (ERT; Binley, 2015). In a typical ERT survey application, current is directly injected into the ground through electrodes implanted into the ground or deployed within boreholes, and the electrical potential of subsurface material is measured between the implanted electrodes and other electrodes arranged at known distances. An ERT survey may also be conducted from a mobile, waterborne platform to generate a CRP in which electrodes are towed behind a survey boat that concurrently tracks its position (Day-Lewis and others, 2006). This second method (in other words, the boat-based method) was used for the Enloe Dam impoundment survey. Apparent resistivity of the subsurface measured from the ERT survey undergoes an inversion process to calculate a model of the true resistivity of a two-dimensional section from which subsurface features are interpreted (Loke and Lane, 2004).
The bedrock-unconsolidated sediment interface was interpreted from CRPs comprising a total length of 21.3 km of longitudinal transects along the Similkameen River within Enloe Dam’s impoundment (Headman and others 2023b; fig. 3). CRP data were not collected between the dam and the constriction 400 feet upstream from the spillway because of hazardous conditions for boat operation in this area. The survey included 10 longitudinal profiles roughly equivalent in length (2,050–2,154 m) and conducted in the right, left and center of the channel, which are labeled as profiles “Enloe” 5–12 in table 1 and figure 3. Two of the 10 current resistivity profiles were excluded from analysis due to data-collection errors where the electrodes were not maintained in sufficiently straight line, or speed to eliminate interference. Three profiles (Enloe 7, Enloe 10, and Enloe 12) were surveyed along the river left side of the impoundment, three profiles (Enloe 5, Enloe 8, and Enloe 11) were surveyed along the center of the impoundment, and two profiles (Enloe 6 and Enloe 9) were surveyed along the river right side of the impoundment (fig. 3). Continuous resistivity profile data are presented along a north-south (upstream-to-downstream) axis within this report such that meter 0 is at the north (upstream) end of the transect and increases to the south (downstream); however, the direction of data collection in the field was in north-south (upstream-to-downstream) and south-north (downstream-to-upstream) orientations.
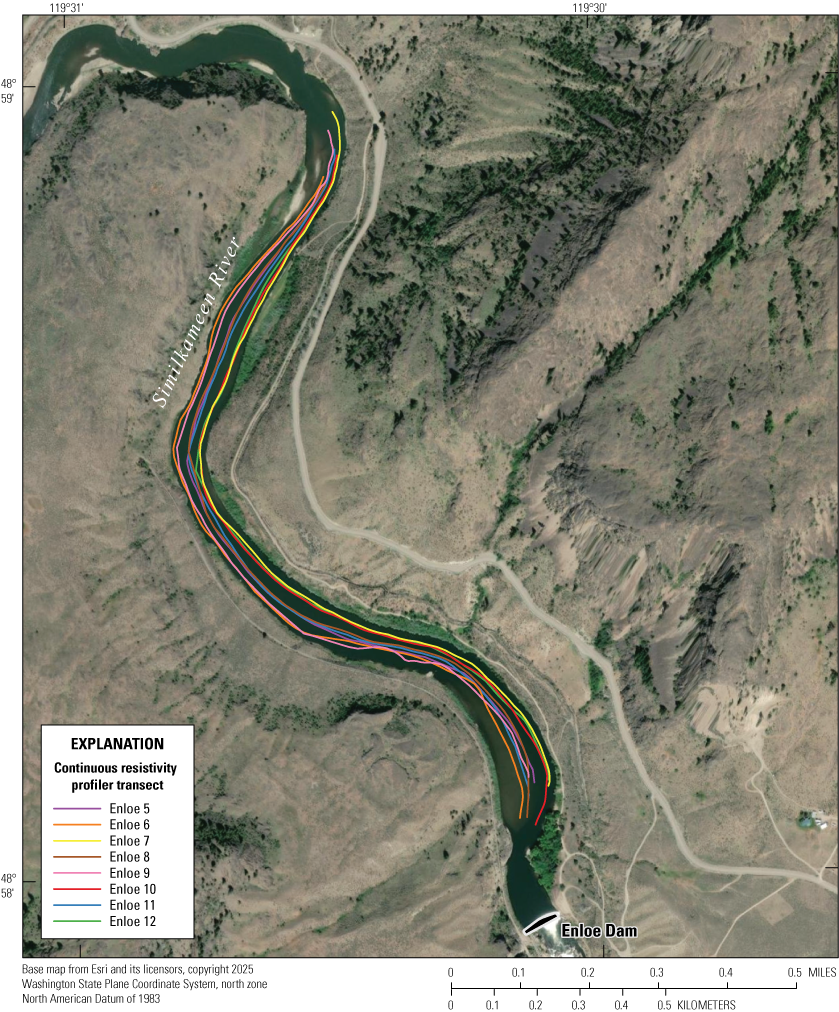
Location of longitudinal continuous resistivity profile (CRP) transects within the Enloe Dam impoundment area of the Similkameen River, Washington State.
CRPs were surveyed using an Advanced Geosciences Inc. SuperSting R8 8-channel resistivity meter (Advanced Geosciences Inc., 2025) with a streamer containing a 100-m long array of 11 electrodes spaced at 10 m (Headman and others, 2023b). A dipole-dipole configuration for the survey of Enloe Dam’s impoundment was used in which current was emitted from two fixed-current electrodes closest to the survey boat and voltage was measured between electrode pairs in the remaining nine electrodes with measurements recorded every 0.8 seconds. The speed of the survey boat was maintained at an average of 0.95 meters per second; thus, the mean spacing of measurements was 1.2 m. Water depth and position were concurrently collected from the survey boat using an echosounder and global positioning system (GPS), respectively. Reported longitudinal profiles begin at number 5; profiles 1–4 were testing setup of the string array and equipment functionality in the field (table 1).
Electrical resistivity measured by the resistivity meter depends on physical properties of geologic materials and the fluids that flow through them including porosity, saturation, and permeability of geologic materials, as well as the ionic strength of pore fluids (Palacky, 1988). The relation of these four parameters to the electrical resistivity of subsurface material was first documented by Archie (1942) to describe the electrical properties of subsurface geologic materials. This dependence can be used to determine the depth and thickness of contrasting layers of subsurface material. In near-surface rocks, the conductivity of pore fluid exerts a primary control on the bulk electrical resistivity of subsurface material especially within rocks comprised of insulating minerals such as silicates: whereas the resistivity of porous media saturated with fresh water is 10–1,000 ohm-meter (ohm-m) (Day-Lewis and others, 2006). Conduction through rocks and sediments occurs largely through the movement of charged ions because the conductivity of water, even fresh water, is orders of magnitudes higher than the surrounding rock; therefore, the connectivity of pore fluids, which depends on porosity, permeability (in other words, the connectivity of electrical pathways through subsurface material), and the saturation of the subsurface material itself determines the electrical properties of the material resulting in a wide range of electrical resistivities within geological materials (Glover, 2015). In unconsolidated sediments, such as alluvial deposits, the proportion of clay minerals also influences bulk resistivity with increasing clay content corresponding to decreases in resistivity (Chambers and others, 2012). In Enloe Dam’s impoundment, high resistivities of bedrock contrast with lower resistivities of unconsolidated alluvial sediments characterized by higher porosity and clay lenses. A threshold of 200 ohm-m was defined to differentiate between high-resistivity bedrock and low-resistivity unconsolidated sediments based on measured resistivities at observed bedrock outcrops within the ERT survey (Cardarelli and De Donno, 2017; Medler and Anderson, 2021).
Interpolation of the Bedrock Surface
The CRPs were georeferenced using concurrently collected GPS coordinates, merged, and linearized for input into Res2Dinv software (Aarhus Geosoftware, 2022), which was used to develop a two-dimensional model of the true subsurface resistivity within Enloe Dam’s impoundment from the apparent resistivity collected during survey. Sections of the transect where turns were necessary to avoid obstacles or follow the river source within the CRPs were filtered out, and noise in the apparent resistivity data was addressed by removing data with poor signal-to-noise ratios, low applied current, or large geometric factors. Filtered CRP data were then constrained using measured bathymetry and water-resistivity data from the CRPs. The constrained data were then inverted using Res2Dinv to generate a model of the true resistivity for each profile (Aarhus Geosoftware, 2022). Points were generated at 200 ohm-m and connected to represent the bedrock surface unconsolidated sediment within the profiles (fig. 4). A continuous surface raster of the depth to bedrock (in other words, bedrock basement) was generated using points from the CRPs and a spline interpolation (Amante and Eakins, 2016).
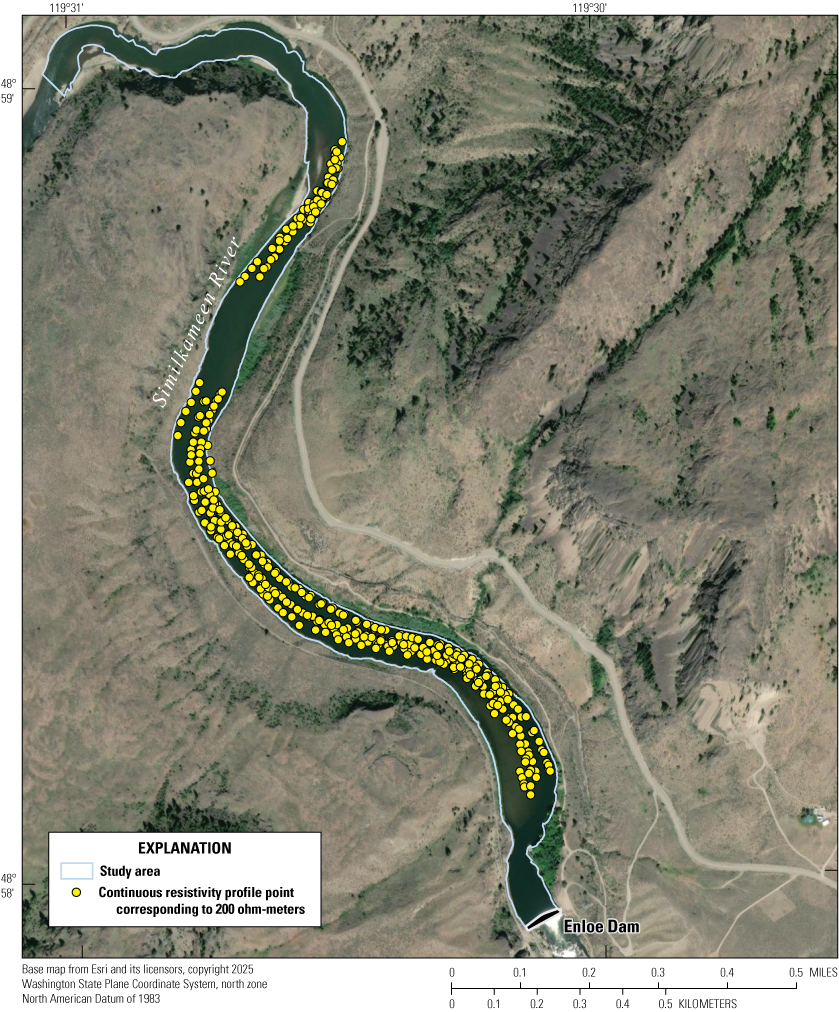
Selection of continuous resistivity profile (CRP) points which correspond to 200 ohm-meters within the Enloe Dam impoundment area of the Similkameen River, Washington State.
Table 1.
Continuous resistivity profiles used to identify the depth of the bedrock (Headman and others. 2023b).[Abbreviations: m, meter; ohm-m, ohm-meter]
Three methods were used to generate a raster representing the depth to bedrock. Method A used bedrock points based on the CRPs without an elevation correction to surveyed elevation data collected during the bathymetric survey and a spline barrier representing the entire impoundment area represented in the bathymetric survey. Method B used bedrock points from the CRPs with an elevation correction to collected survey data but only included the area within the CRP survey to minimize interpolation. Method C used bedrock points from the CRPs with an elevation correction and included the entire reservoir area represented in the bathymetric survey.
Data from six sediment coring locations collected in November 14–17 and December 10–14, 2019, by Cox and others (2022) were used to verify the depth to bedrock estimated from the CRPs for any core within 10 m of a CRP (fig. 2). The sediment cores were collected using a VibeCore-D coring device (Specialty Devices Inc., 2025), which was driven to the point of refusal. The targeted core depth was the interface between accumulating sediment and the pre-dam surface of bedrock or coarse-grained alluvium, which was previously estimated to be 9–12 m by Nelson (1972) and Public Utility District No. 1 of Okanogan County (2012). These core depths were considered to be the minimum bounds of the depth-to-bedrock estimates from CRPs. Additionally, information about sediment sized observed in the cores was used to inform the interpretation of the subsurface sediment.
Approach to Estimate Sediment Volume within Enloe Dam’s Impoundment
An assessment of the total and spatially distributed volume was calculated using raster calculator in ArcGIS to subtract the depth to bedrock from the depth to the bathymetric sediment surface and then multiplying the depth of sediment in meters by the area of each raster cell (9 m2) to compute a volume for each individual raster cell. There were several raster cells where the calculated depth to bedrock was above the bathymetric sediment surface resulting in negative sediment values. These negative values were exclusively located in interpolated reaches where depth to bedrock as measured by ERT was less than 3 m below the bathymetric sediment surface and was mostly confined to areas 11.2 km upstream from the dam where ERT survey transects had to be terminated due to river conditions. Negative sediment volume estimates were adjusted to zero prior to calculating total sediment volume.
The volume of sediment within Enloe Dam’s impoundment was estimated by subtracting the raster of the depth to bedrock surface from the bathymetric surface. A volume of sediment was estimated using three separate methods for the same area (table 2). Method A and method C consider the entire study area. Method A does not correct depth to bedrock to the bathymetric survey and relies solely on the ERT survey data. Method B applies elevation corrections for depth to bedrock based on elevation data collected during the bathymetric survey but only included the area within the CRP survey. Method C corrected the depth to bedrock based on survey data. Where interpolation errors resulted in the elevation of the bedrock surface exceeding the bathymetric surface, bedrock was considered to be at the surface of the impoundment, and no sediment was inferred to be at these locations.
Results
Enloe Dam Impoundment Bathymetry
Mean water depth to the sediment surface of the impoundment was 2.49 m, and the impoundment reached its maximum depth of 17.5 m at the bedrock constriction 150 m upstream from Enloe Dam (fig. 5). In addition, the impoundment was deepest within the former channel of the Similkameen River, particularly at the outside of meanders where pools were likely to have occurred prior to dam construction. Conversely, the shallowest parts of the impoundment occur within the inside of meander bends. Impoundment width averaged 79 m and ranged from 40 m at its narrowest point at a bedrock constriction 150 m upstream from Enloe Dam to 130 m at its widest extent.
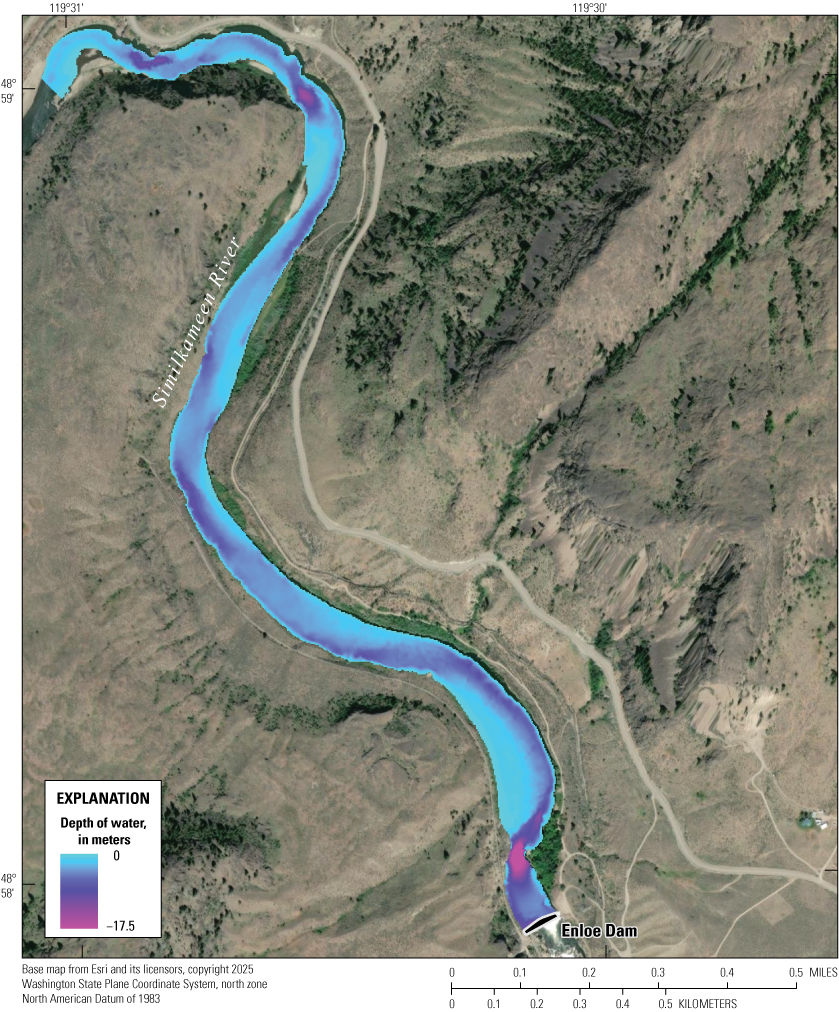
The depth of water within the Enloe Dam impoundment area of the Similkameen River, Washington State.
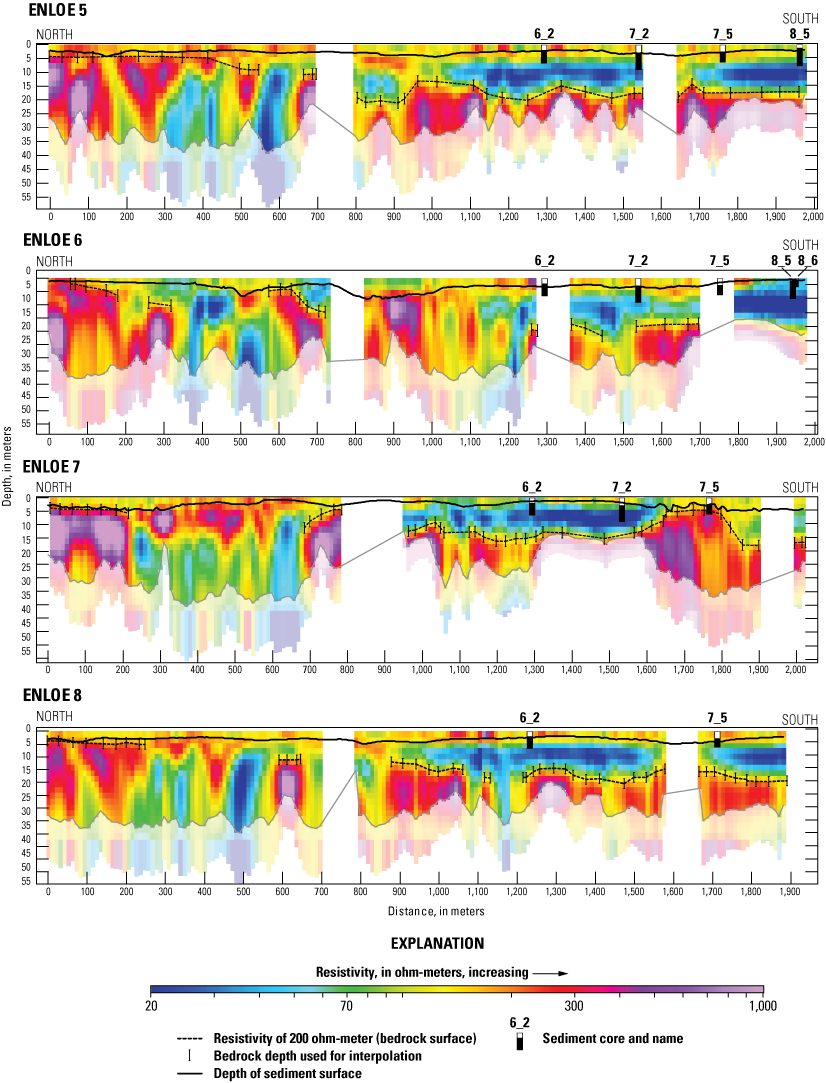
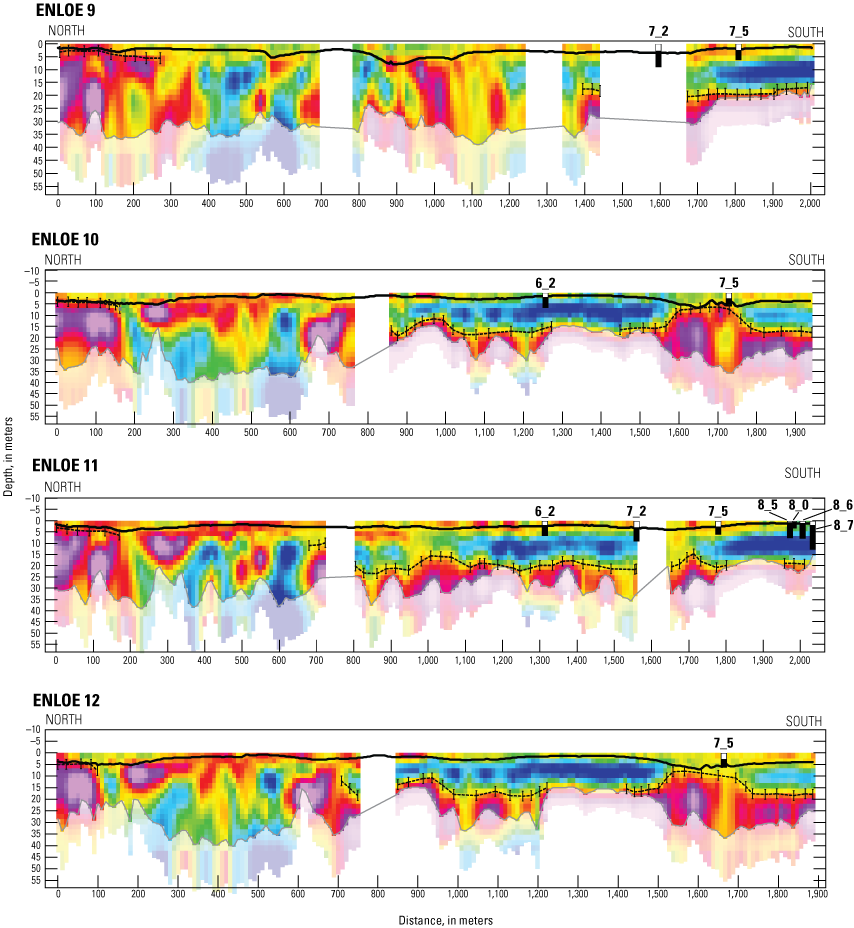
Longitudinal cross sections showing results from the continuous resistivity profiles. A resistivity of 200 ohm-meter is symbolized with a dashed line and represented the bedrock surface. Vertical lines along the dashed line show the location of bedrock depths used for interpolation. The solid black line shows the depth of the sediment surface. The location of nearby (less than 10 meters) sediment cores are shown as solid white and black bars, with labels for the core name as reported in Cox and others (2022). Transect locations are shown in figure 3.
Depth to Bedrock
Continuous resistivity profiles collected along the left side of Enloe Dam’s impoundment (Enloe 7, Enloe 10, and Enloe 12) were mostly continuous except for gaps corresponding to bends in the impoundment that precluded the continuous resistivity profiler from maintaining a straight line (figs. 3, 6). Additionally, gaps within these profiles occurred where water depths were shallower than 1 m. Convergence of the inversion process for the 3 left-side profiles occurred within 5 iterations resulting in a model of true resistivity where the 200-ohm-m surface was largely continuous. Depth of the bedrock surface along the left profiles (Enloe 7, 10, and 12) was estimated to be between 5–20 m below the water-surface with elevated bedrock within the northernmost (upstream) 200 m of the and a 150-m long zone within the southern (downstream) part of these profiles, corresponding with observed bedrock along the shore.
Depth to bedrock within the center of Enloe Dam’s impoundment was characterized by three continuous resistivity profiles: Enloe 5, Enloe 8, and Enloe 11 (fig. 6). Convergence of the inversion model for these profiles occurred within 5 iterations resulting in largely continuous 200-ohm-m surface interpreted to be the top of bedrock. The top of the bedrock was deepest in the southern, downstream part of the impoundment reaching about 20 m below the impoundment bed surface and shallowest in the northern, upstream part of the impoundment reaching depths of <5 m below the impoundment bed surface.
Two profiles, Enloe 6 and Enloe 9, were collected along the right side of Enloe Dam’s impoundment (fig. 3). Convergence of the inversion model occurred within five iterations for these profiles. Large gaps in the longitudinal resistivity profiles occurred because the continuous resistivity profiler was not able to remain straight, similar to the three profiles collected along the left side of the impoundment, and the section contained shallow depths, which precluded the collection of continuous resistivity profiler data. Five sediment cores (6_2, 7_1, 7_5, 8_5, and 8_0) collected by Cox and others (2022) nearby the right CPRs did not reach the bedrock-sediment interface (fig. 6).
Sediment Volume within Enloe Dam’s Impoundment
The volume of sediment within Enloe Dam’s impoundment in 2020 was estimated to be between 2.12 and 2.25 Mm3 with a mean estimate of 2.17±0.04 Mm3 (table 2). This volume was estimated by subtracting the elevation of the bedrock surface interpolated from CRPs from the bathymetric sediment surface (Headman and others, 2023a, 2023b). The estimated sediment volume includes all sediment underlying Enloe Dam’s impoundment regardless of whether it was deposited before or after the construction of Enloe Dam. Figure 7 shows most of the sediment is stored in the 1 km area upstream from the dam with the most significant amount of sediment stored within the first 500–600 m.
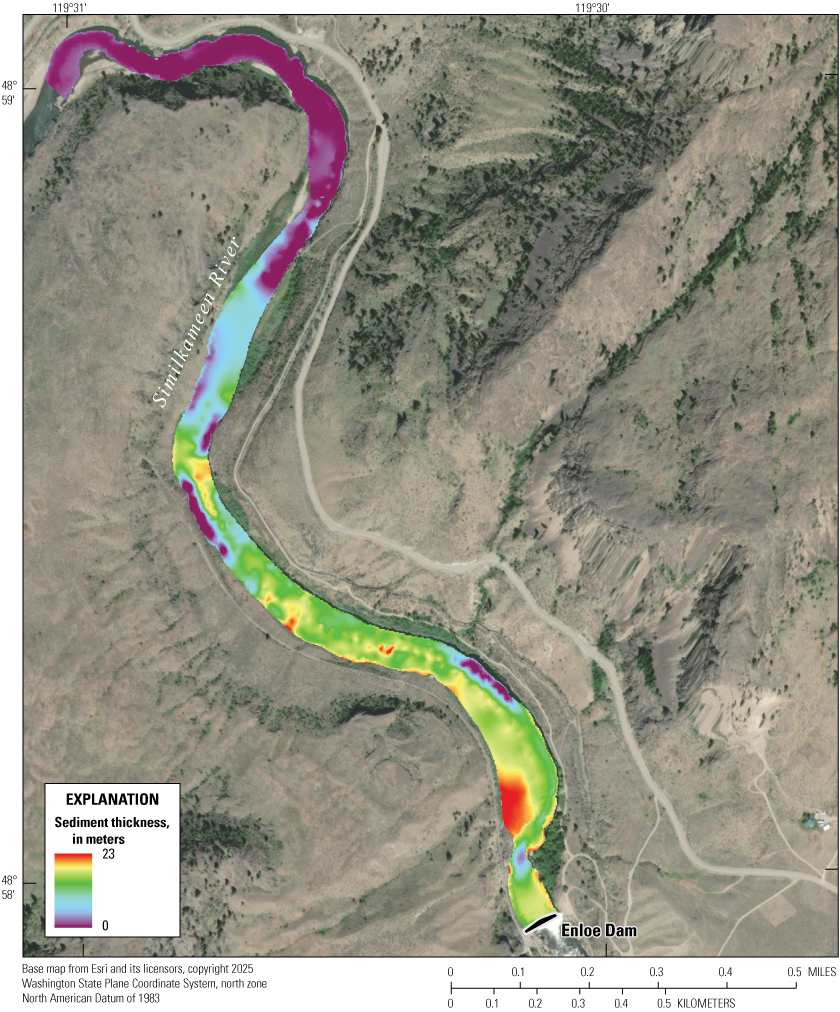
Calculated thickness of sediment between interpolated bathymetric and bedrock surfaces within the Enloe Dam impoundment area of the Similkameen River, Washington State.
Uncertainty was not formally quantified with a systemic coring during this study; however, areas with large amount of interpolation for bedrock depth and the bathymetric surface would have higher uncertainty. Spline interpolation of bathymetric and subsurface data is common practice, and several assumptions associated with using splines introduce potential errors into volume estimates, including the assumption of a parabolic relationship between points (Amante and Eakins, 2016). If points are spaced closely together, this error is ameliorated as a parabolic relationship between two closely spaced points results in a nearly flat curve. However, if data density is low, interpolation between points may introduce error that increases the possible depth and (or) creates a smooth transition to the spline barrier where one does not exist. In this study, the northern upstream end of the study area includes a section where point density of the interpolated bedrock surface lacks an appropriate density (fig. 8). We assume that little fine-sediment deposition has occurred here since the construction of the dam because the bathymetry is considerably shallow, and bedrock is visible. An additional area where the lack of point density is notable is between 700 and 800 m upstream from the dam (fig. 4). In this area, the interpolated surface showed a flat trend across the interpolation gap in the depth to bedrock.
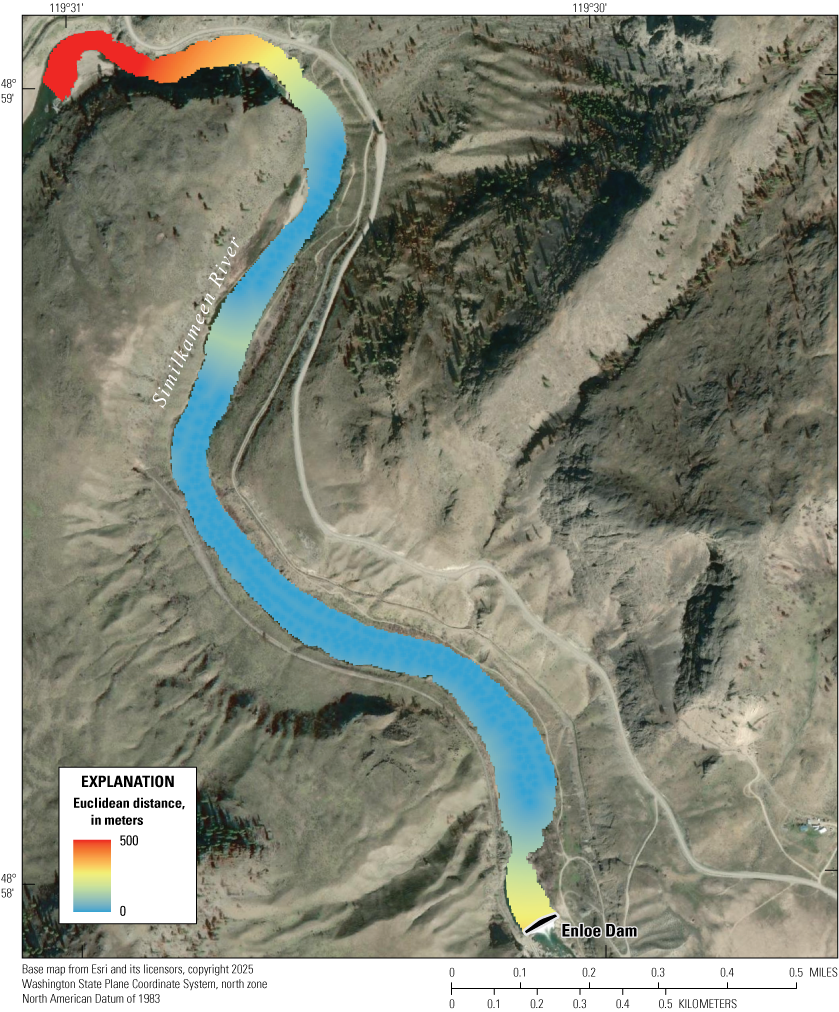
Euclidean distance between selected 200 ohm-meter points to show interpolation distances within the Enloe Dam impoundment area of the Similkameen River, Washington State.
Table 2.
Comparison of sediment volume estimates for the three interpolation methods used for generating the bedrock surface.[Abbreviations: ±, plus or minus; CRP, continuous resistivity profile]
Discussion
The downstream transport of sediment from reservoirs following dam removal and its impact on channel morphology, aquatic habitat, and channel-conveyance capacity has been an important consideration for the removal of several dams throughout the Pacific Northwest including the Elwha and Glines Canyon Dams on the Elwha River from 2010 to 2013 (Warrick and others, 2019), the Marmot Dam on the Sandy River in 2007 (Major and others, 2012), and the Pilchuck River Diversion Dam on the Pilchuck River in 2021 (Anderson and others, 2024). Like the proposed removal of Enloe Dam on the Similkameen River, reconnection of upstream habitat for anadromous salmonids was an important consideration for the removal of each of these dams. An additional intended benefit of the removals of the Elwha and Glines Canyon Dams, which were estimated to have held a combined 3.6 Mm3 (Warrick and others, 2019), was to increase downstream sediment transport to nourish coastal sediment supply and limit coastal erosion near the outlet of the Elwha River. Deleterious effects of sediment accumulated within the impoundments of Marmot and Pilchuck River Dams, which held 730,000 m3 and 4,000–7,500 m3 of sediment respectively (Major and others, 2012; Anderson and others, 2024), were focused on downstream habitat and channel-conveyance capacity in the Sandy and Pilchuck Rivers. Similar concerns about downstream sediment impacts on habitat, as well as channel conveyance capacity following the removal of Enloe Dam, were discussed for the Similkameen River by Nelson (1972). In addition, the legacy of historical mining operations within the Similkameen River Basin upstream from Enloe Dam contributed to concerns that contaminated sediments may be remobilized following dam removal (Cox and others, 2022). Consequently, the volume and potential water-quality impacts of sediment accumulated upstream from a dam are important considerations for evaluating the potential downstream effects of dam removal and to inform dam-removal strategies.
The volume of sediment accumulated within Enloe Dam’s impoundment was first estimated by Nelson (1972) to increase understanding of the potential effects of the removal of Enloe Dam. To estimate sediment volume within Enloe Dam’s impoundment, Nelson (1972) measured the bathymetry of 41 cross sections using an echosounder and assumed a bedrock surface interpolated through the impoundment from the base of Enloe Dam to bedrock exposed at a cross section within the upstream end of the impoundment. Nelson (1972) estimated the volume of sediment in the Enloe Dam impoundment was 1.37 Mm3 (about 2.4 million tons) in 1971 and that this sediment was predominantly sand. Estimates of sediment volume within Enloe Dam in 2020 presented within this report were developed by differencing the bathymetric surfaces measured by ADCPs and a bedrock surface interpreted from electrical resistivity tomography surveys to measure continuous bathymetric and bedrock surfaces within Enloe Dam’s impoundment. We estimate 2.17 Mm3 of sediment in the Enloe Dam impoundment in 2020. This represents an increase of 800,000 cubic meters compared to the estimate of Nelson (1972) inferring an average accumulation rate of about 16,000 cubic meters per year from 1971 to 2020. Continuous resistivity profiles surveyed in 2020 also revealed more details in the bedrock-unconsolidated sediment interface within Enloe Dam’s impoundment compared with the echosounder survey in Nelson (1972).
The continuous resistivity profile-derived bedrock surface allowed more detailed estimates of the volume and the ability to map the spatial distribution of sediment deposited within Enloe Dam’s impoundment. Interpolated sediment thickness from continuous resistivity profiles surveyed in 2020 was consistent with parts of the interpolated bedrock surface estimated by Nelson (1972) in terms of estimated depth and morphology, and field observations including near-surface bedrock in the upstream (northern) part of the Enloe Dam impoundment and correspondingly thin sediment (fig. 7). Sediment distribution, as observed in ERT survey data show lower resistivity value, indicating probable finer grain clay, silt, and sand sized sediment closer to the dam. These fine sediments are of particular concern because finer sediments accumulate a greater concentration of heavy metals when compared with coarser grain sediments (Horowitz, 1985). The underlying pre-dam legacy sediments are assumed to be similar unconsolidated alluvial sediments observed upstream and downstream from the study area.
Total sediment volumes presented within this report for 2020 and by Nelson (1972) for 1971 are based on interpreted bedrock surfaces within the Enloe Dam impoundment; however, some sediments may have underlain the reach of the Similkameen River inundated by the impoundment prior to the construction of Enloe Dam. Pre-dam sediments would likely account for a less significant portion of sediments which would be mobilized should the Enloe Dam impoundment be removed, but all sediments accumulated within the impoundment may be subject to mobilization. Water quality, sediment, and associated downstream contamination issues may still exist in this portion of the sediment, but examining these issues was beyond the scope of this study. Additional studies would be needed to better understand the potential effects of these issues if dam removal is considered further.
Twenty-three cross sections developed from the 2020 ADCP survey were constructed at the same locations as cross sections reported by Nelson (1972; figs. 2, 9) to compare changes in the distribution of unconsolidated sediments between 1971 and 2020 (fig. 7). A naming convention crosswalk was developed to link cross sections reported by Nelson (1972) to the cross sections from the 2020 resistivity data (table 3). Only 7 of the 23 cross sections reported by Nelson (1972) were published, of which 4 were contained within the study area where bedrock interpolation via CRP was made with high confidence. These four cross sections are equivalent to cross sections 2, 7, 11, and 14 developed from the 2020 CRPs (table 3). The elevation difference of the sediment-water interface in these cross sections is approximately +6 m, +3 m, +1.5 m, and +3 m in the 2020 survey compared to the 1971 survey at the respective cross-sections. In cross-section 2, although the bathymetric surface difference is about 6 m greater in 2020, the topography of the 1971 and 2020 bathymetric surfaces were similar.
Sediment cores collected by Cox and others (2022) show the grain size of sediment deposited decreases medium to coarse grain sand at the top of the core to sand to silt at the bottom of the core. This indicates that most of the sediment accumulated in recent years is larger in size, whereas most of the silt-clay particle sizes were impounded during the years immediately following the construction of the Enloe Dam impoundment.
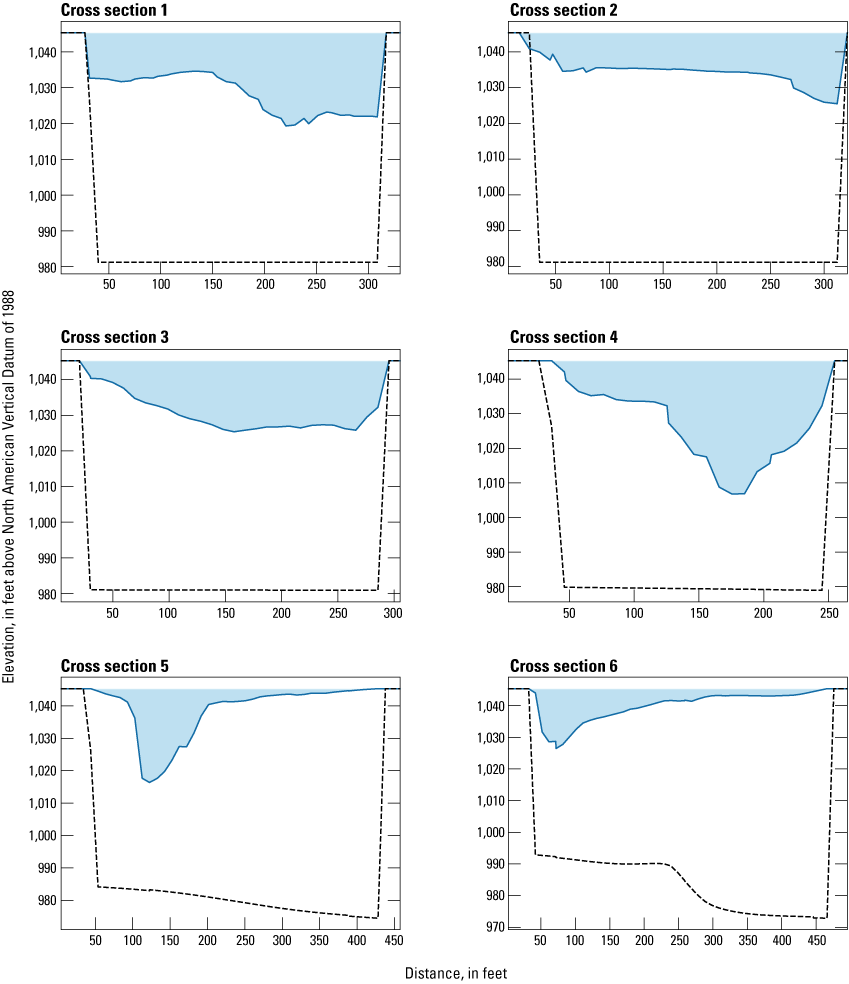
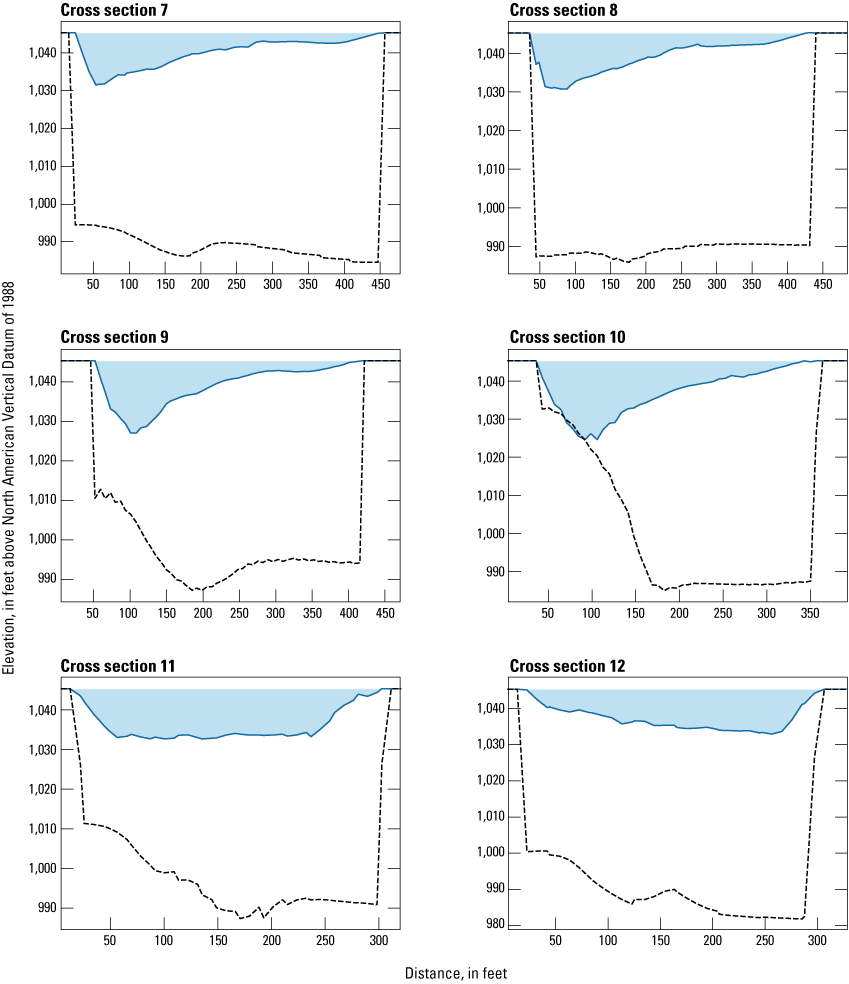
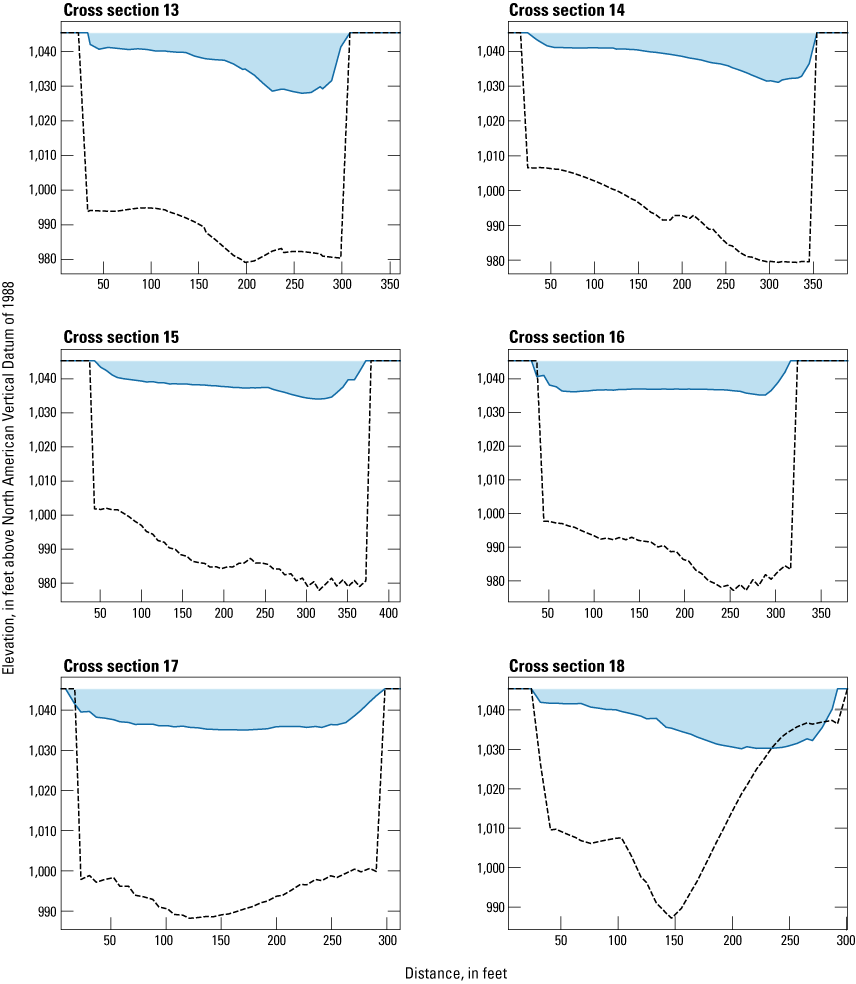

Cross-section profiles showing results from the 2020 acoustic doppler continuous profiler (ADCP) survey at 25 sites representing the same locations from Nelson (1972) within the Enloe Dam impoundment area of the Similkameen River. Cross section locations are shown in figure 2. The blue line indicates the bathymetric surface, the dashed black line indicates the interpolated depth to bedrock from continuous resistivity profile (CRP) survey results.
Table 3.
Cross-section label equivalents between this study and Nelson (1972).| 2020 cross section label | Nelson (1972) equivalent cross section |
|---|---|
| 1 | A |
| 2 | 24 |
| 3 | 23 |
| 4 | 22 |
| 5 | 21 |
| 6 | C |
| 7 | 20 |
| 8 | 19 |
| 9 | D |
| 10 | 18 |
| 11 | E |
| 12 | 17 |
| 13 | 16 |
| 14 | 15 |
| 15 | F |
| 16 | 14 |
| 17 | 13 |
| 18 | 12 |
| 19 | G |
| 20 | 11 |
| 21 | H |
| 22 | 10 |
| 23 | 9 |
Sediment deposited within the Enloe Dam impoundment was dominated by sand and silt-sized particles (Cox and others, 2022). Nelson (1972) also measured the predominance of sand-sized sediment within the Enloe Dam impoundment, but he noted the predominance of larger sediment including boulders, cobbles, and gravel within the Similkameen River upstream from the impoundment. Only one core (8_6) collected by Cox and others (2022) was inferred to reach similar large sediment or bedrock within the Enloe Dam impoundment; all other sediment cores described by Cox and others (2022) remained within predominantly sand-sized or finer sediment. Continuous resistivity profiles revealed heterogeneity of sediments that occur within the Enloe Dam impoundment. These include lenses of low resistivity of about 20 ohm-m within the continuous resistivity profiles, which occur approximately 1,200 m upstream from Enloe Dam. These areas of low resistivity may correspond to wet clay and other fine sediments (Abidin and others, 2014; Chik and Islam, 2012), which extend from the inferred bedrock surface to less than 5 m below the bathymetry surface. Higher resistivity zones, corresponding with coarser sands and gravel, occur between these low-resistivity lenses and the bathymetric surface within the continuous resistivity profiles, which indicate less permeable layers above fine sediments.
Depth to bedrock interpreted from CRPs was consistent with the depth of unconsolidated sediment measured within cores collected by Cox and others (2022). CRPs collected within the center of the Enloe Dam impoundment (Enloe 5, Enloe 8, and Enloe 11) corresponded with sediment cores, which mostly terminated within silty sediments corresponding to lenses of low resistivity. The depth of core 7_2, however, was limited due to refusal of the coring device by a gravel layer, which was likely deposited from failure of colluvial deposits at the margins of the Enloe Dam impoundment. Based on the bathymetric survey, river right CRPs corresponded to the Similkameen River’s channel before the construction of the Enloe Dam impoundment. Although only one core intersected bedrock, bedrock was interpolated where the relic channel crosses the channel to river left, which corresponds to high resistivities within the CRPs. Some high-resistivity lenses within the CRPs occur not due to bedrock, but rather hard rock stacked during the construction of a railroad grade leading into a tunnel next to the impoundment. The railroad is no longer in use and has been repurposed as a recreational use trail, which is visible on imagery to the west of the study area (fig. 2). Towards the southern edge of the profiles a shallow bar prevented navigation to continue river right and both profiles are essentially the same path as centerline profiles. Sediment profiles within the Cox and others (2022) cores provide information that can be combined with CRP data to generate a synoptic picture of possible size, depth, and location of material likely to be mobilized in the event of the dam’s removal. Surface observations of sediment along bars within the river and the basin and resistivity profiles indicate a significant quantity of fine sediment. In the event of the removal of the Enloe Dam impoundment, these sediments may have similar fluvial responses to those seen on the Sandy River with the removal of Marmot Dam (Major and others, 2012) with a significant spike in fine sediment transport within the first year of removal. Larger sediments and bed movement are likely to be higher than normal during flood events, snowmelt events, or wildfires within the basin.
Conclusions
The volume of sediment deposited upstream from the Enloe Dam impoundment on the Similkameen River, Washington, as determined from electric resistivity tomography (ERT) and acoustic doppler profile surveys estimate 2.17±0.04 million cubic meters (Mm3) of impounded sediment, versus a 1971 measurement of 1.37 Mm3. This implies an accumulation of approximately 800,000±40,000 cubic meters of sediment between 1971 and 2020. The CRP data showed an accumulation of fine sediments in the unconsolidated layer; however, field confirmation of the ERT survey data was limited only to a small area where cores were available. Ground truthing of bedrock was also limited to areas where bedrock was visibly above the surrounding sediment-water interface. Future studies could focus on a more systematic coring campaign, to validate sediment size interpretations and provide additional insights into possible errors within the current geophysical data throughout the reservoir. Total volume of sediment, grain size distribution, and potential downstream effects could be considered further to help inform the decision to either keep or remove the dam.
References Cited
Aarhus Geosoftware, 2022, RES2DINVx64 ver. 4.10 with multi-core and 64-bit support: Aarhus Geosoftware software release, accessed September 27, 2023, at https://www.aarhusgeosoftware.dk/.
Advanced Geosciences Inc., 2025, SuperSting R8 8-channel resistivity meter, accessed September 12, 2025, at https://www.agiusa.com/supersting-wifi.
Archie, G.E., 1942, The electrical resistivity log as an aid in determining some reservoir characteristics: Petroleum Technology, v. 146, p. 54–62, accessed August 12, 2025, at https://doi.org/10.2118/942054-G.
Binley, A., 2015, Tools and techniques—DC electrical methods, in Schubert, G., ed., Treatise on geophysics, (2nd ed.): Cambridge, Massachusetts, Elsevier Science, p. 233–259, accessed July 1, 2018, at https://doi.org/10.1016/B978-0-444-53802-4.00192-5.
Britton, J., 2016, Exploration and mining in the Thompson Okanagan-Cariboo region, British Columbia, in Provincial overview of exploration and mining in British Columbia, 2015: British Columbia Ministry of Energy and Mines, British Columbia Geological Survey, Informational Circular 2016-1, p. 89–105.
Chambers, J.E., Wilkinson, P.B., Wardrop, D., Hameed, A., Hill, I., Jeffrey, C., Loke, M.H., Meldrum, P.I., Kuras, O., Cave, M. and Gunn, D.A., 2012, Bedrock detection beneath river terrace deposits using three-dimensional electrical resistivity tomography, Geomorphology, v. 177–178, p. 17–25, accessed April 30, 2025, at https://doi.org/10.1016/j.geomorph.2012.03.034.
Cox, S.E., Curran, C.A., Spanjer, A.R., Opatz, C.C., Takesue, R.K., and Bell, J.L., 2022, Element concentrations and grain size of sediment from the Similkameen River above Enloe Dam (Enloe Reservoir) near Oroville, Washington, 2019: U.S. Geological Survey Scientific Investigations Report 2022–5073, 47 p., accessed April 30, 2025, at https://doi.org/10.3133/sir20225073.
Glover, P.W., 2015, Geophysical properties of the near surface earth: Electrical properties, Treatise on Geophysics 2nd Edition, v. 11, p. 89–137, accessed August 12, 2025, at http://dx.doi.org/10.1016/B978-0-444-53802-4.00189-5.
Headman, A., Mclean, J., Boucher, C., Tecca, A., and Wilkerson, O., 2021, Bathymetry of Similkameen River above Enloe Dam near Oroville, Washington: U.S. Geological Survey data release, https://doi.org/10.5066/P9KHMU8P.
Headman, A.O., Wilkerson, O.A., Curran, C.A., and White, E.A., 2023a, Sediment volume and bedrock of the Similkameen River above Enloe Dam near Oroville, Washington: U.S. Geological Survey data release, https://doi.org/10.5066/P9VI2ZIX.
Headman, A.O., Wilkerson, O.A., Curran, C.A., Johnson, C.D., and White, E.A., 2023b, Continuous resistivity profiling (CRP) in the Similkameen River above Enloe Dam, Okanogan County, Washington: U.S. Geological Survey data release, https://doi.org/10.5066/P93NUBE8.
Horowitz, A.J., 1985, A primer on trace metal-sediment chemistry: U.S. Geological Survey Open-File Report 84–709, 90 p., accessed April 30, 2025, at https://doi.org/10.3133/wsp2277.
Major, J.J., O’Connor, J.E., Podolak, C.J., Keith, M.K., Grant, G.E., Spicer, K.R., Pittman, S., Bragg, H.M., Wallick, J.R., Tanner, D.Q., Rhode, A., and Wilcock, P.R., 2012, Geomorphic response of the Sandy River, Oregon, to removal of Marmot Dam: U.S. Geological Survey Professional Paper 1792, 64 p. and data tables. [Also available at https://pubs.usgs.gov/pp/1792/.]
Medler, C.J., and Anderson, T.M., 2021, Delineating the Pierre Shale from geophysical surveys within and near Ellsworth Air Force Base, South Dakota, 2019: U.S. Geological Survey Scientific Investigations Map 3474, 3 sheets, 16 p. pamphlet, accessed April 30, 2025, at https://doi.org/10.3133/sim3474.
Nelson, L.M., 1972, Potential transport of sediment from Enloe Reservoir by the Similkameen and Okanogan Rivers, Washington: U.S. Geological Survey Open-File Report 97–0492, 21 p., accessed April 30, 2025, at https://doi.org/10.3133/ofr72269.
Normand, A.E., 2021, Dam removal and the Federal role (CRS Report #R46946): Retrieved from Congressional Research Service website, accessed August 21, 2025, at https://www.congress.gov/crs_external_products/R/PDF/R46946/R46946.3.pdf.
Palacky, G.J., 1988, 3. Resistivity characteristics of geologic targets—Electromagnetic methods in applied geophysics: Society of Exploration Geophysicists, p. 52–129, accessed April 30, 2025, at https://doi.org/10.1190/1.9781560802631.ch3.
Parsons, D.R., Jackson, P.R., Czuba, J.A., Engel, F., Rhoads, B., Oberg, K.A., Best, J.L., Mueller, D.S., Johnson, K.K., and Riley, J., 2013, Velocity Mapping Toolbox (VMT)—A processing and visualization suite for moving-vessel ADCP measurements: Earth Surface Processes and Landforms, v. 38, no. 11, p. 1244–1260.
Quantum Spatial Inc., 2016, Technical data report “OLC Okanogan FEMA”: Oregon Lidar Consortium Okanogan Federal Emergency Management Agency, 15 p., available under Okanogan 2015 metadata, accessed December 20, 2022, at https://lidarportal.dnr.wa.gov/.
Ray, G.E., Dawson, G.L., and Ettlinger, A.D., 1992, A geological overview of the Hedley gold skarn district, southern British Columbia (92H), in Grant, B., and Newell, J.M., Geological fieldwork 1992—A summary of field activities and current research—British Columbia Geological Survey, Ministry of Energy: Mines and Petroleum Resource Paper, v. 92H, p. 269–279.
Rydlund, Jr., P.H., and Densmore, B.K., 2012, Methods of practice and guidelines for using survey-grade global navigation satellite systems (GNSS) to establish vertical datum in the United States Geological Survey: U.S. Geological Survey Techniques and Methods 11–D1, 102 p. accessed April 30, 2025, at https://doi.org/10.3133/tm11D1.
Sahota, S.M., Greenway, G.R., and Brown, B.S., 1999, Reclamation activities at the Nickle Plate Mine tailing facility—Proceedings of the 23rd Annual British Columbia Mine Reclamation Symposium in Kamloops, British Columbia—The Technical and Research Committee on Reclamation: Vancouver, British Columbia, Canada, Knight Piésold Ltd., 82 p.
Specialty Devices Inc., 2025, VibeCore-D, accessed September 12, 2025, at https://specialtydevices.com/product/vibecore-d/.
Statistics Canada, 2022, 2021 Census of population: Statistics Canada Catalogue no. 98-316-X2021001, accessed September 29, 2022, at https://www12.statcan.gc.ca/census-recensement/2021/dp-pd/prof/index.cfm?Lang=E.
Umpleby, J.B., 1911, Geology of ore deposits of the Oroville-Nighthawk mining district: Olympia, Washington, Washington Geological Survey, Bulletin No. 5, Part II, 111 p. [Also available at https://www.dnr.wa.gov/publications/ger_b5_mining_districts_okanogan_co.pdf.]
U.S. Geological Survey, 2016, National Water Information System data available on the World Wide Web (USGS Water Data for the Nation), accessed October 1, 2023, at https://waterdata.usgs.gov/nwis/.
Warrick, J. A., Stevens, A. W., Miller, I. M., Harrison, S. R., Ritchie, A. C., and Gelfenbaum, G., 2019, World’s largest dam removal reverses coastal erosion: Scientific Reports, v. 9, no. 1, 12 p., accessed April 30, 2025, at https://doi.org/10.1038/s41598-019-50387-7.
Washington Geological Survey, 2024, Surface geology, 1:500,000 scale-GIS data, March 2024: Washington Geological Survey Digital Data Series 25, version 6.0, previously released February 2022, accessed August 12, 2025, at https://fortress.wa.gov/dnr/geologydata/publications/data_download/ger_portal_surface_geology_500k.zip.
Conversion Factors
International System of Units to U.S. customary units
Temperature in degrees Celsius (°C) may be converted to degrees Fahrenheit (°F) as follows:
°F = (1.8 × °C) + 32.
Datums
Vertical coordinate information is referenced to the North American Vertical Datum of 1988 (NAVD 88)
Horizontal coordinate information is referenced to the North American Datum of 1983 (NAD 83).
Elevation, as used in this report, refers to distance above the vertical datum.
For information about the research in this report, contact the
Director, Washington Water Science Center
U.S. Geological Survey
934 Broadway, Suite 300
Tacoma, Washington 98402
https://www.usgs.gov/centers/washington-water-science-center
Manuscript approved on February 2, 2026
Publishing support provided by the U.S. Geological Survey
Science Publishing Network, Tacoma Publishing Service Center
Edited by Vanessa Ball
Layout and design by Teresa A. Lewis
Illustration support by Luis Menoyo
Disclaimers
Any use of trade, firm, or product names is for descriptive purposes only and does not imply endorsement by the U.S. Government.
Although this information product, for the most part, is in the public domain, it also may contain copyrighted materials as noted in the text. Permission to reproduce copyrighted items must be secured from the copyright owner.
Suggested Citation
Headman, A.O., Wilkerson, O.A., Curran, C.A., and Gendaszek, A.S., 2026, Estimation of impounded sediment volume in the Similkameen River upstream of Enloe Dam, Okanogan County, Washington: U.S. Geological Survey Scientific Investigations Report 2026–5126, 24 p., https://doi.org/10.3133/sir20265126.
ISSN: 2328-0328 (online)
Study Area
| Publication type | Report |
|---|---|
| Publication Subtype | USGS Numbered Series |
| Title | Estimation of impounded sediment volume in the Similkameen River upstream of Enloe Dam, Okanogan County, Washington |
| Series title | Scientific Investigations Report |
| Series number | 2026-5126 |
| DOI | 10.3133/sir20265126 |
| Publication Date | March 20, 2026 |
| Year Published | 2026 |
| Language | English |
| Publisher | U.S. Geological Survey |
| Publisher location | Reston, VA |
| Contributing office(s) | Washington Water Science Center |
| Description | Report: v, 24 p.; 2 Data Releases |
| Country | United States |
| State | Washington |
| County | Okanogan County |
| Other Geospatial | lower Similkameen River upstream from Enloe Dam |
| Online Only (Y/N) | Y |
| Additional Online Files (Y/N) | N |