

Shallow Hydrogeologic Framework of the Tully Valley Mudboil Area, Onondaga County, New York
Links
- Document: Report (21.5 MB pdf) , HTML , XML
- Data Release: USGS data release - Surface-geophysical, geotechnical, hydraulic-slug test, specific conductance, and geospatial data for shallow hydrogeologic investigations of the Tully Valley mudboil area, Onondaga County, New York
- NGMDB Index Page: National Geologic Map Database Index Page (html)
- Download citation as: RIS | Dublin Core
Acknowledgments
The authors thank the farmers and landowners of the Tully Valley for graciously granting access to their fields and property to collect the surface-geophysical survey data and install wells. Without their cooperation, this investigation would not have been possible.
We also acknowledge the guidance and support of the Mudboil Technical Advisory Group engineering design team: Ed Michalenko and Stephanie Johnson of the Onondaga Environmental Institute, Kyle Thomas of Natural Systems Engineering, Theodore Endreny of the State University of New York College of Environmental Science and Forestry, Donald Lake of Dulac Engineering, Tim Seeler of Seeler Engineers, and Jock Conyngham of River Research and Restoration. The support provided by Gregory Nelson of Seeler Engineering in the test-pit sediment characterization is gratefully acknowledged.
The authors thank Koichi Hayashi of Geometrics, Inc., for his help in processing the shear-wave velocity datasets collected during the investigation. His guidance during this effort is greatly appreciated.
The able support of Alton Anderson and Laura DeMott of the U.S. Geological Survey during field-data collection is appreciated. Special thanks to Eric White of the U.S Geological Survey, who provided onsite geophysical training.
Abstract
Mudboils have been documented in the Tully Valley in southern Onondaga County, New York, since the late 1890s. Sediment-laden water from the mudboils flows into Onondaga Creek, which empties into Onondaga Lake at Syracuse 15 miles to the north. Turbidity from the mudboils has degraded the water quality of Onondaga Creek despite a series of mitigation efforts that began in the early 1990s. Turbidity mitigation actions presently (2025) being considered include creek relocation and offline sediment settling. In support of these proposed actions during 2021–23, the U.S. Geological Survey, in cooperation with the New York State Department of Environmental Conservation, U.S. Environmental Protection Agency, Onondaga Nation, Onondaga Environmental Institute, and Central New York Regional Planning and Development Board, collected and analyzed geologic, hydrologic, geophysical, and geotechnical data to characterize the shallow hydrogeology along four proposed creek-relocation paths and in the proposed offline settling basin area.
The investigation indicated that the four proposed creek-relocation paths, two east of Onondaga Creek and two west of Onondaga Creek, are underlain by sediments including muck, alluvium, mudboil deposits, alluvial-fan sand and gravel, and lacustrine fines. The proposed excavations would penetrate partially to fully saturated conditions: generally, the water table is shallow near the creek and deep on the alluvial fans. The shallowest excavation, about 5 feet below land surface, would be near the creek and primarily in alluvium, and the deepest excavation, as much as 30 feet below land surface, would be in the alluvial-fan deposits. Brackish waters would be penetrated by proposed channel excavations on the eastern side of Onondaga Creek in an area downgradient from a potentially leaking historical salt-exploration borehole and near the main mudboil area. Excavation in these areas likely would provide a continuous source of brackish groundwater to the relocated creek. Proposed channel excavations of muck, soft to very soft lacustrine fines, and mudboil-type sediments in mudboil and suspected mudboil areas would pose an excavation and slope stability challenge and would have the greatest potential to create new mudboils. Proposed channel excavations below the water table on the Rattlesnake Gulf and Rainbow Creek alluvial fans would intercept groundwater and make the constructed streambank susceptible to seepage-induced slope instability. The substantial water-level fluctuation in the sediments of both alluvial fans would aggravate the stability condition. In addition, excavation on the Rattlesnake Gulf alluvial fan would have the potential to affect water-supply springs at the toe of the fan.
The proposed offline settling basin area is in the northern part of the Rattlesnake Gulf alluvial fan. Natural and human-made diversions of Rattlesnake Gulf have resulted in saturated conditions in the general area of the proposed basin. The proposed offline settling basin would be excavated in, and berms would be constructed on, alluvial-fan deposits and lacustrine fines. In the proposed basin area, the alluvial deposits overlying the lacustrine fines are less than 10 feet thick. Excavation, berm construction, and loading of the saturated, soft to very soft lacustrine fines may be problematic and require soil strengthening.
Introduction
Mudboils have been documented in the Tully Valley in southern Onondaga County, New York, since the late 1890s. Sediment-laden water from the mudboils flows into Onondaga Creek, which empties into Onondaga Lake at Syracuse 15 miles (mi) to the north (fig. 1). Turbidity from the mudboils has degraded the water quality of Onondaga Creek despite a series of mitigation efforts that began in the early 1990s. Proposed turbidity mitigation actions presently (2025) being considered by the Mudboil Technical Advisory Group are creek relocation and offline or out-of-channel sediment settling (Mudboil Alternative Design Team, 2021).
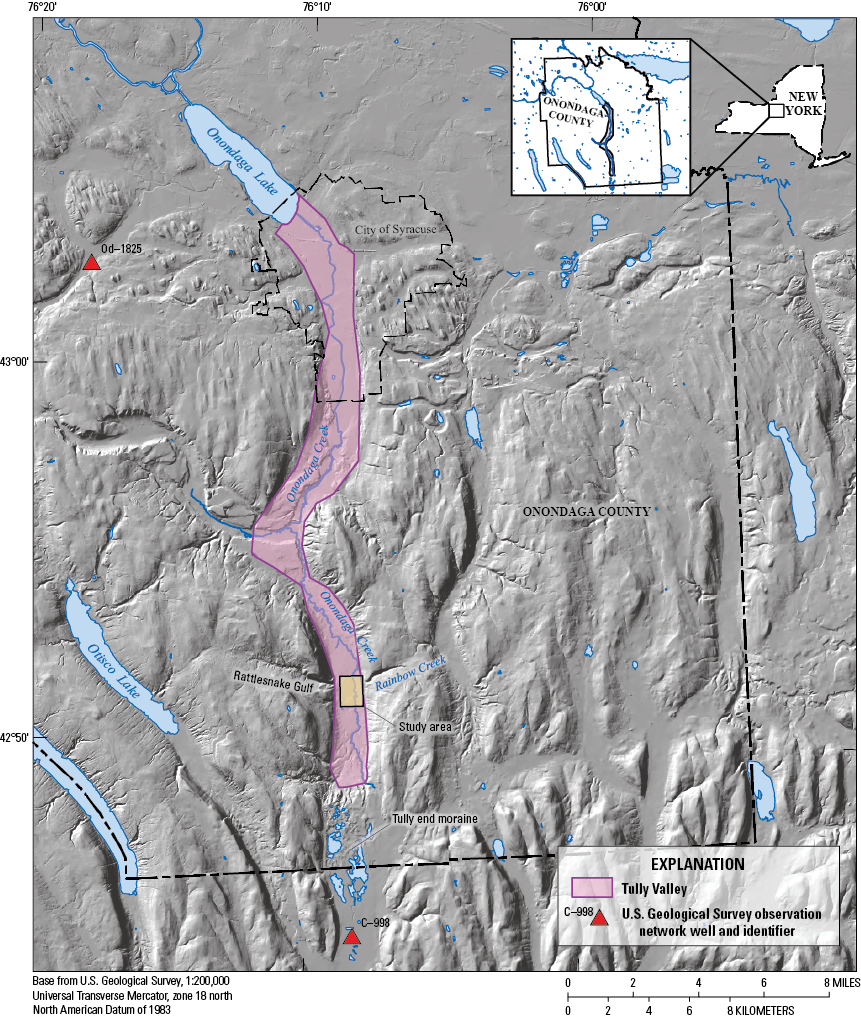
Map showing location of Onondaga County, Onondaga Lake, City of Syracuse, Onondaga Creek, Rattlesnake Gulf, Rainbow Creek, Tully Valley, Tully moraine, U.S. Geological Survey observation network wells, and mudboil and suspected mudboil areas in central New York. Well information from U.S. Geological Survey (2024b).
The U.S. Geological Survey (USGS), in cooperation with the New York State Department of Environmental Conservation, U.S. Environmental Protection Agency, Onondaga Nation, Onondaga Environmental Institute, and Central New York Regional Planning and Development Board, collected information about the near-surface sediments and groundwater conditions of the proposed creek-relocation paths and offline settling basin area to help evaluate the mitigation options. Hydrogeologic characteristics of the shallow subsurface that may affect mitigation efforts include saturated soft to very soft sediments (Terzaghi and others, 1996; Tonks and Antonopoulos, 2015), artesian-pressured sand (Ferris and others, 1962), seepage-induced slope instability (Midgley and others, 2013), and brackish groundwater.
The objective of this study was to characterize the hydrogeology in the proposed creek-relocation paths and offline settling basin area (fig. 2). This report describes the investigative methods and the geologic, hydrologic, geophysical, and geotechnical data that were collected and analyzed for the study. The results define the shallow hydrogeologic framework in the areas of interest for the proposed mitigation actions. Possible consequences of the proposed mitigation actions are also discussed.
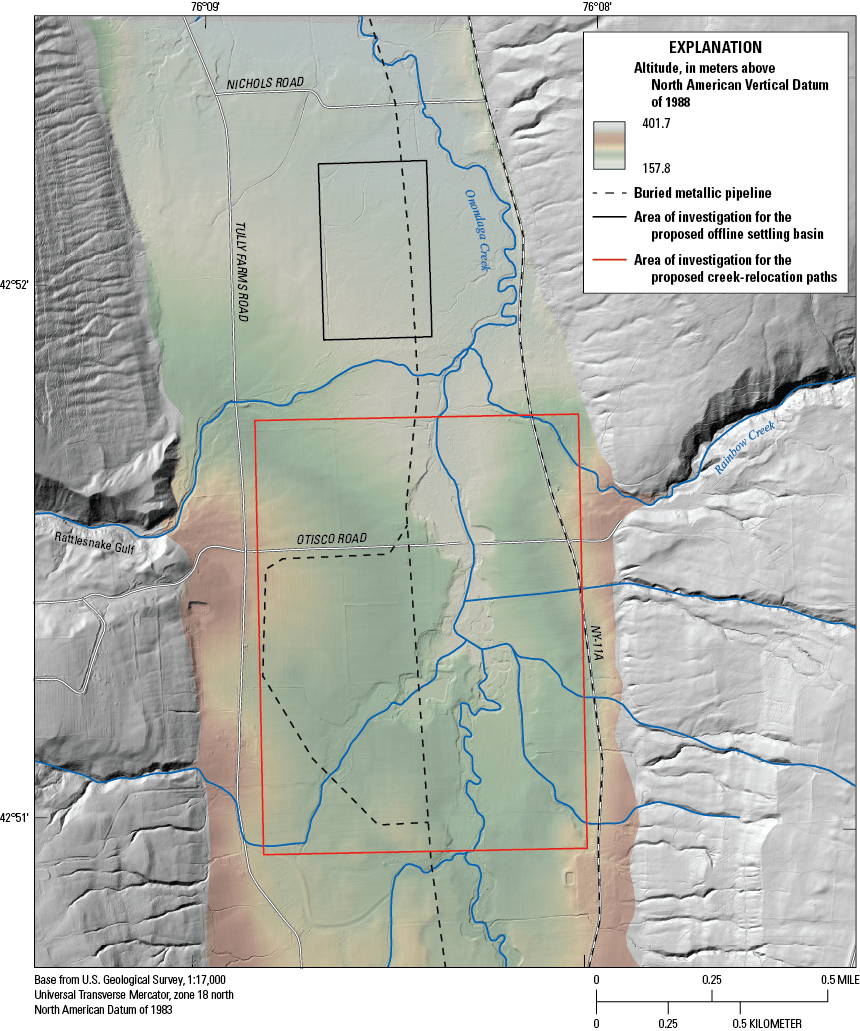
Map showing location of investigation areas for the proposed stream-relocation paths and offline settling basin area in the Tully Valley, Onondaga County, New York. Data from Mudboil Alternative Design Team (2021).
Geologic Setting
The Tully Valley is underlain by Silurian and Devonian clastic, carbonate, and evaporite bedrock and thick unconsolidated deposits of clay, silt, sand, and gravel. The evaporite halite beds, which were solution mined for saturated brine, are within the upper Silurian Syracuse Formation of the Salina Group at depths of 1,200 to 1,400 feet (ft) below land surface (bls) at the southern end of the Tully Valley. Upper Silurian and Lower to Middle Devonian carbonates underlie the lower part of the bedrock valley floor. Middle Devonian shales of the Hamilton Group underlie the upper part of the bedrock valley floor and the steep valley walls, which rise as much as 1,200 ft above the valley floor.
Multiple glacial advances and retreats during the Pleistocene Epoch widened and deepened the bedrock valley and deposited till and stratified drift (Kappel and Miller, 2005). During the last glacial period, ice overrode the glacial valley fill and advanced over the end moraine at the southern end of the Tully Valley before retreating (fig. 1). During this last retreat, a series of proglacial lakes existed in the Tully Valley (Grasso, 1970), which resulted in deposition of about 60 to 80 ft of lacustrine fines on the underlying 300 to 350 ft of glacial drift. The lacustrine fines were capped by Holocene floodplain alluvium, alluvial-fan deposits, and wetland organic-rich sediments or muck.
Mudboils
The Tully Valley mudboils are springs fed by two confined aquifers with high artesian pressures at a location where the confining layers have been breached. The mudboils are created by artesian-pressured water that flows upward along discontinuities in the confining layers of silt and clay and discharge water with high dissolved solids and fine-grained sediment at the land surface. The description of mudboils in this section is modified from Kappel (2014).
The typical mudboil vent carries very fine to fine sand, silt, and clay from depths of 60 ft or more to the land surface, where the sand and some silt settles out almost immediately and forms a volcano-like cone around the mudboil vent. Clay and some silt entrained within this discharge enters Onondaga Creek. Depending on the velocity of the receiving water, the coarser fraction of these fine-grained sediments either remains in suspension or settle out during low Onondaga Creek flows. The sand and silt are commonly deposited along the creek in the vicinity of the vent nearest the mudboils and are subsequently transported farther downstream during high stream flows. The clay fraction typically remains in suspension along the length of the creek and discharges to Onondaga Lake, where it settles to the lake bottom near the mouth of Onondaga Creek (fig. 1). In an active mudboil area, the removal of sediment at depth below the upper confining layer causes the overlying sediments to slowly sag into the underlying void, which causes subsidence of the land surface. The subsidence creates a series of circular ring-fracture scarps in the sediments around the discharging mudboil area. As more sediment is removed at depth, additional subsidence and scarps occur. If, during subsidence, the vent is closed off or otherwise blocked, artesian pressure will increase until the water finds a new outlet, typically along one of the ring fractures. Once initiated, mudboil activity is a self-perpetuating process due to the driving force of flowing artesian conditions at depth.
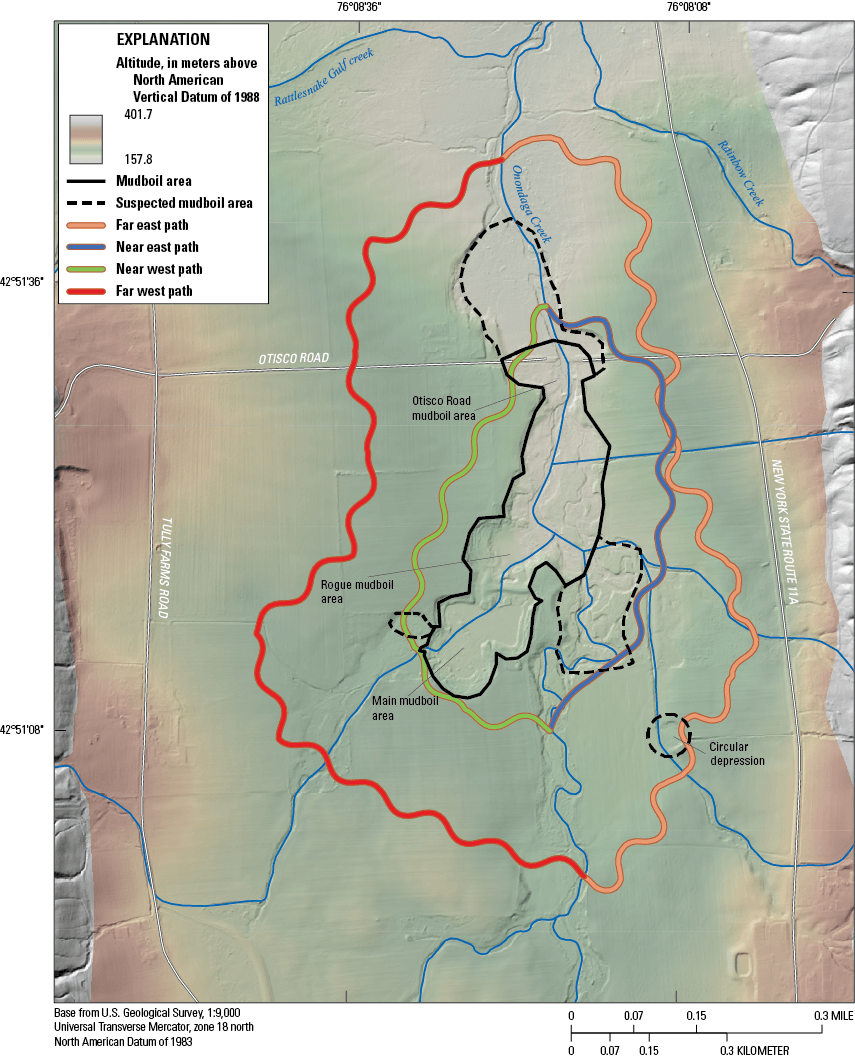
Most mudboil activity in the Tully Valley has occurred within the mudboil corridor (Kappel, 2014), a 300 ft-wide strip of land along Onondaga Creek that extends from just north of Otisco Road to 1,800 ft south of the former Otisco Road bridge (fig. 3). Mudboil activity and subsidence within the mudboil corridor includes but is not limited to the Otisco Road bridge mudboil area, the main mudboil area (hereafter referred to as the “Main Mudboil Area”), and the rogue mudboil area (hereafter referred to as the “Rogue Mudboil Area”). Mudboil activity in the Otisco Road bridge area was first documented in an 1899 newspaper article (Syracuse Post Standard, 1899, as cited in Kappel [2014]). The subsidence in the area resulted in the eventual collapse of the bridge in 1991. The Main Mudboil Area is a large depression at the southwestern end of the corridor in which mudboils have been active since the 1960s. The Rogue Mudboil Area, which is just north of the Main Mudboil Area, has been most active from the late 1990s to the present (2024).
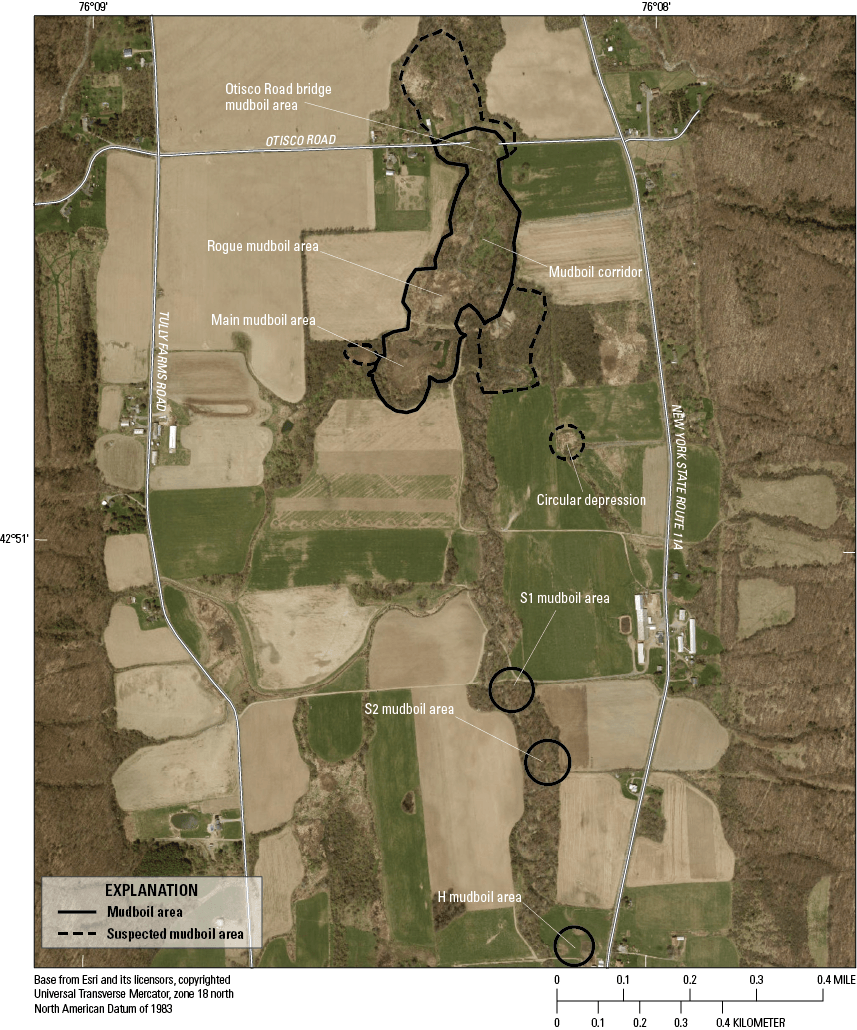
Map showing location of mudboil and suspected mudboil areas in the Tully Valley, Onondaga County, New York.
A circular depression with wetland vegetation and sediment 510 ft southeast of the corridor is possible evidence of previous mudboil activity in that area (fig. 3). The wetland depression is visible on aerial photography from 1951 but not on images from 1938 (Cornell University Library, 2025). These observations suggest that the feature appeared sometime during that time frame.
Minor mudboil areas S1, S2, and H are located about 5,800, 6,700, and 8,700 ft south of Otisco Road, respectively, and just east of Onondaga Creek (fig. 3). Interviews of the landowners in 1990 indicated mudboil activity started in the 1950s (Kappel and others, 1996), although a recent recollection indicates at least some mudboil activity at the southernmost site (H) did not start until the 1980s (S. Haynes, Onondaga County, New York, oral commun., 2022). Discharge from these southern mudboil areas as of 2024 is minimal, and no effect on turbidity in Onondaga Creek has been observed. However, turbid discharge, albeit minor, was reported to reach Onondaga Creek in 1990 (Kappel and others, 1996). No obvious subsidence has been observed at these southern mudboil locations.
Previous Investigations of the Mudboil Area
This section describes results of drilling programs to characterize the valley-fill sediments and measurement of groundwater level and quality from monitoring and depressurizing wells, infiltration from Rattlesnake Gulf creek and Rainbow Creek, and flow and water quality from the Main Mudboil Area relevant to the current shallow hydrogeologic investigations. An overview of USGS hydrogeologic investigations in the Tully Valley from 1991 to 2012—including mitigation efforts—is presented by Kappel (2014).
In 1991–95, the USGS, as part of a multifaceted study in cooperation with the Onondaga Lake Management Conference and the U.S. Environmental Protection Agency, investigated the hydrogeologic framework in and near the Tully Valley mudboils (Kappel and others, 1996). Substantially adding to the limited subsurface information from a single existing well (OD79) drilled in the late 1970s, a total of 25 test holes (well numbers in the 400s) were drilled to depths of about 25 to 100 ft bls (Kappel and others, 1996). Split-spoon samples were collected, and hammer-blow counts were recorded for selected depths during drilling. The penetrated sediments in descending order were Onondaga Creek floodplain alluvium and Rattlesnake Gulf and Rainbow Creek alluvial-fan silty sand and gravel, lacustrine silt and clay, deltaic sand and silt, and till. Saturated alluvial deposits form a water-table (unconfined) aquifer, the lacustrine deposits form a confining unit, and the sand and silt form a confined aquifer, in which sediments are discharged at land surface to form the mudboil sediment cones.
Wells were completed and screened in the water-table aquifer and in the upper part of the underlying confined aquifer (Kappel and others, 1996). Monthly to semimonthly water levels were collected in five water-table wells along Otisco Road, two confined wells to the north, and five confined wells to the south from 1992 to 2012 when they were decommissioned (plugged and abandoned) (USGS, 2024b). The potentiometric surface of the confined aquifer was 20–30 ft above land surface (als). The water table was as deep as 25–30 ft bls in the upper parts of the Rattlesnake Gulf and Rainbow Creek alluvial fans and shallowed downgradient to near land surface by Onondaga Creek. Heavy rain and snowmelt in January 1996, which caused widespread flooding throughout New York State (Lumia, 1998), resulted in 20 ft of water-level rise in the wells in the upper part of the fans, indicating substantial amounts of recharge from infiltration of precipitation and snowmelt on the fans and from infiltration of channeled and unchanneled upland runoff. A series of discharge measurements made during 1993 at the bedrock valley wall and at a site in the valley about 1,400 ft downstream indicated that during low-flow periods Rattlesnake Gulf creek loses water to the sediments at a rate of nearly 250 gallons per minute (gal/min). Discharge measurements on Rainbow Creek during 1993 indicated that the stream loses as much as 45 gal/min along a 1,200-ft reach.
A series of springs discharge freshwater at the toe of the Rattlesnake Gulf alluvial fan just north of Otisco Road and west of Onondaga Creek (fig. 4). Springs such as these are sources of water for some residences in the Tully Valley (Kappel and others, 1996).
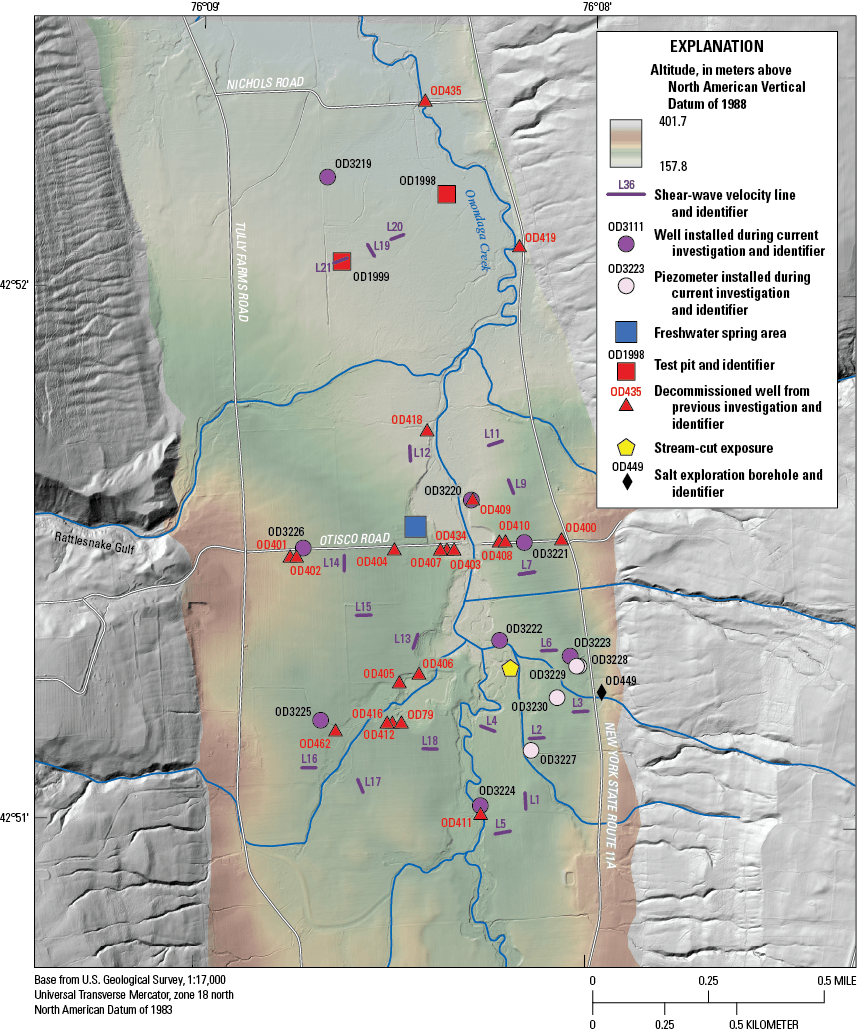
Map showing location of seismic lines, selected wells and piezometers, freshwater springs, test pits, and salt exploration borehole in the investigation areas in the Tully Valley, Onondaga County, New York.
As part of a mitigation effort, depressurizing wells were drilled in 1995–96 and completed in the upper confined aquifer on both sides of the former Otisco Road bridge and around the Main Mudboil Area. Split-spoon samples were collected, and hammer-blow counts were recorded for selected depths during drilling. Depending on the season, the depressurizing wells discharged from 5 to about 100 gal/min at land surface. The average discharge rate at the wells declined over time because of physical and (or) chemical plugging of the screened zones, and at some locations, the discharge eventually stopped. Hydraulic head, flow rate, and water quality from the wells were measured monthly to seasonally until the wells were decommissioned in 2011 (USGS, 2024b). The depressurizing wells were sampled as frequently as monthly for specific conductance and on a rotating basis once every 2 to 3 years for major cations and anions. The salinity of the well discharges increased during the 15 years of monitoring, and specific conductance increased by several hundred microsiemens per centimeter at 25 degrees Celsius (μS/cm at 25 °C) in the fresher discharges and by several thousand μS/cm at 25 °C in the more brackish discharges (Kappel, 2014).
Deep exploratory boreholes (wells OD412 and OD416) (fig. 4) were drilled to characterize the thickness of valley-fill sediments and the underlying bedrock (Kappel and others, 1996). Beneath the upper confined aquifer, the wells penetrated a thin till confining unit that was underlain by mixed but generally coarse-grained ice contact or subaquatic fan deposits that form a lower confined aquifer. This aquifer is underlain by another till unit (at least locally) just above bedrock. This aquifer has hydraulic heads about 15 ft higher than in the upper confined aquifer at this location. The carbonate bedrock that underlies the lower till unit has water-bearing zones with hydraulic heads about 75 ft higher than those of the lower confined aquifer.
Flow measurements of water entering and leaving the Main Mudboil Area collected quarterly in the 1990s indicated that the discharge from these mudboils averaged about 335 gal/min. Discharge from the Main Mudboil Area varied seasonally and year to year from 45 gal/min during fall of dry years to 450 gal/min during the spring of wet years. As with the depressurizing wells, the specific conductance of the Main Mudboil Area discharge trended upward during the monitoring period. Sediment discharge from the Main Mudboil Area in the early 1990s, prior to any remedial efforts, averaged about 30 tons per day to Onondaga Creek, ranging from more than 100 tons per day during storms to less than 10 tons per day during dry summer periods (Kappel and others, 1996).
Data Sources and Methods
Geologic, hydrologic, geophysical, and geotechnical data were collected and analyzed with previous data to characterize the shallow sediments and groundwater conditions in the study area. The investigation methods included surficial geologic mapping; seismic and electromagnetic surveys; well drilling and standard penetration testing; test-pit excavation; field descriptions and laboratory analysis of sampled sediments; piezometer and well installation; gamma and electromagnetic-induction logging; surface-drainage observations; hydraulic-slug testing; and monitoring of groundwater levels, temperature, and specific conductance.
Surficial Geologic Map
The surficial geology of the study area was mapped through analysis of (1) borehole lithologic logs and field observation from Kappel and others (1996); (2) borehole and test-pit lithologic logs, field observations, and electromagnetic and seismic data collected during this study; (3) light detection and ranging (lidar) imagery; (4) data from the digital Soil Survey Geographic Database (U.S. Department of Agriculture, 2019); and (5) previous surficial mapping by Pair and others (2007a, b).
Shear-Wave Velocity Lines
The multichannel analysis of surface waves seismic method was applied to determine the shear-wave velocity of the shallow sediments (Park and others, 1999). Shear-wave velocity is a measure of the rigidity or stiffness of a sediment and is related to the grain-size distribution, density, and geotechnical properties (such as liquefaction potential) of that sediment (Hussien and Karray, 2015). For example, soft, liquefiable clayey silt has low shear-wave velocities, and stiff, sandy gravel has high shear-wave velocities. Shear-wave velocity helped distinguish between the effects of lithologic texture and salinity on subsurface electrical conductivity. Shear-wave velocity data were collected on November 16–18, 2021, at 18 sites along the proposed stream-relocation paths and at 3 sites in the offline settling basin area (fig. 4).
The shear-wave velocity data were collected using a single channel seismograph and an array of as many as 14 Atom vertical-component geophones. At each data-collection site, the geophones were spaced in a line 2 meters (m) apart for an initial survey length of 26 m. At the end of each line, strike plates were placed at an offset of 8 m from the first and last geophone. Anthropogenic sources of noise were minimized by waiting for vehicle traffic to pass before starting data collection and standing still during data collection. Starting at the near end of the array, a sledgehammer was used to strike the plate at least three times. Each sledgehammer impact (shot) was separated by at least 5 seconds. Shots were stacked in postprocessing. Shots were repeated at the far end of the line. A roll-along geometry was used to extend the survey by relocating the first two geophones and attached seismographs to the far end of the line with the same 2-m spacing. With this geometry, two new sets of shots were taken by maintaining the 8-m offset from the new positions of the first and last geophones. The roll-along process was repeated a total of eight times for all seismic lines for a total profile length of 58 m.
Raw data from the Atom units were processed by using the Seisimager/SW software suite version 1.27.0 from Geometrics, Inc. The common midpoint cross correlation method (Hayashi and Suzuki, 2004) was used to group correlated traces that have a common midpoint from each shot gather within the Pickwin software module version 7.1.0.0 of Seisimager/SW. Each common midpoint cross correlation gather was combined to generate a phase-velocity diagram where surface-wave phase velocities were plotted against their corresponding frequencies. For each wave frequency, there are multiple possible velocities. The slowest velocity, called the fundamental mode, was identified for each phase-velocity diagram by using automated picking in the Pickwin module. The picks were then manually corrected, cleaned, and exported to the WaveEQ module version 7.1.0.0 of Seisimager/SW as a fundamental mode dispersion curve.
Data were inverted by using the least squares method with five to eight iterations, guided by a horizontal regularization constant of 0.3. Higher regularization values cause more horizontal smoothing in the final model, and the value of 0.3 was chosen to balance smoothing with horizontal variations in shear-wave velocity. Final model plots represent the modeled shear-wave velocity structure across the length of each line. Data were recorded at a 4-m horizontal resolution and varying vertical resolution, from about 0.5 m in the shallow parts to a 5-m vertical resolution in the deep parts of the model. The shear-wave velocity data and models are available from the associated USGS data release (Terry and others, 2026).
Frequency-Domain Electromagnetic Surveys
Frequency-domain electromagnetic surveys provide a nearly continuous measurement of electrical conductivity in the shallow subsurface. The major factors affecting electrical conductivity in sediments are their silt and clay content, their saturated porosity, and the salinity of the groundwater. Frequency-domain electromagnetic surveys were conducted by using GEM–2 and DUALEM–421 surface-geophysical instruments. The GEM–2 is a multiband electromagnetic instrument consisting of a Global Positioning System (GPS) receiver, electronics, and a battery mounted to a rigid ski about 6 ft in length in which a transmitter and receiver coil are embedded at a fixed offset (5.45 ft). The transmitter emits an electromagnetic field at multiple frequencies that induces eddy currents in subsurface conductors, such as groundwater with elevated salinity, which produces secondary electromagnetic fields that are measured by the receiver. The instrument was carried flat (horizontal coplanar) at waist height (about 3.3 ft) at a comfortable walking speed (about 3 miles per hour). Data were logged in real time every 0.1 second and uploaded via Bluetooth connection to a Trimble Nomad by using Geophex WinGEM2 software. Raw binary data were exported to comma separated value format by using the Geophex EMExport software. About 57 linear mi of GEM–2 data were collected in the study area during May 24, 2018, September 27–30, 2021, and November 15–17, 2021 (fig. 5). The GEM–2 data and inversions are available from the associated USGS data release (Terry and others, 2026).
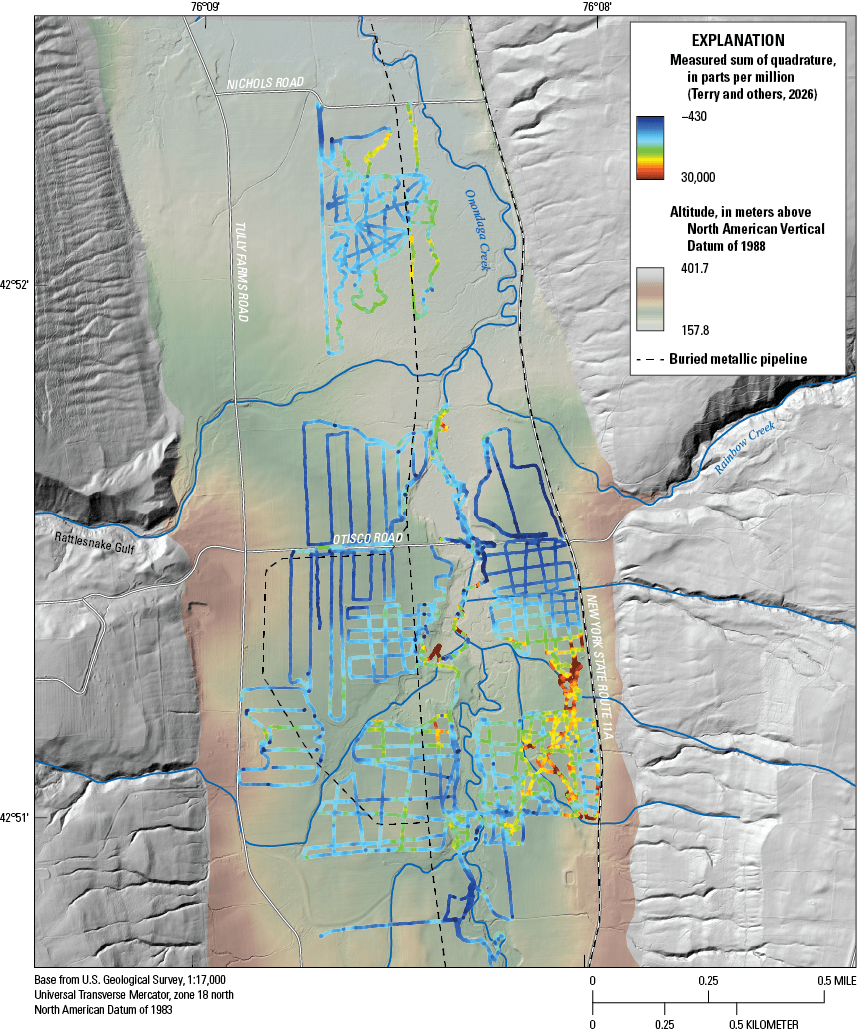
Map showing paths of frequency-domain electromagnetic survey collected with a GEM–2 surface-geophysical instrument and measured sum of quadrature values in the investigation areas in the Tully Valley, Onondaga County, New York.
The DUALEM–421 is a multioffset electromagnetic instrument consisting of electronics and batteries mounted in a tubular mast with a total length of about 15 ft. In this study, the instrument was carried by two people to maintain a constant ground offset and orientation. This system consists of three receivers offset from the transmitter by 4 m, 2 m, and 1 m, each with two receiver coil orientations (in plane with the transmitter coil and perpendicular to the transmitter coil) that operate at a fixed frequency of 9 kilohertz. Data and GPS information were logged at a comfortable walking speed (about 3 miles per hour) with a Bluetooth-connected Android mobile device (Android LG Phoenix 5) running the DUALEM application. Raw data were exported to comma separated value format by using the application. About 19 linear mi of DUALEM–421 data were collected in the study area during November 15–18, 2021 (fig. 6). The DUALEM–421 data and inversions are available from the associated USGS data release (Terry and others, 2026).
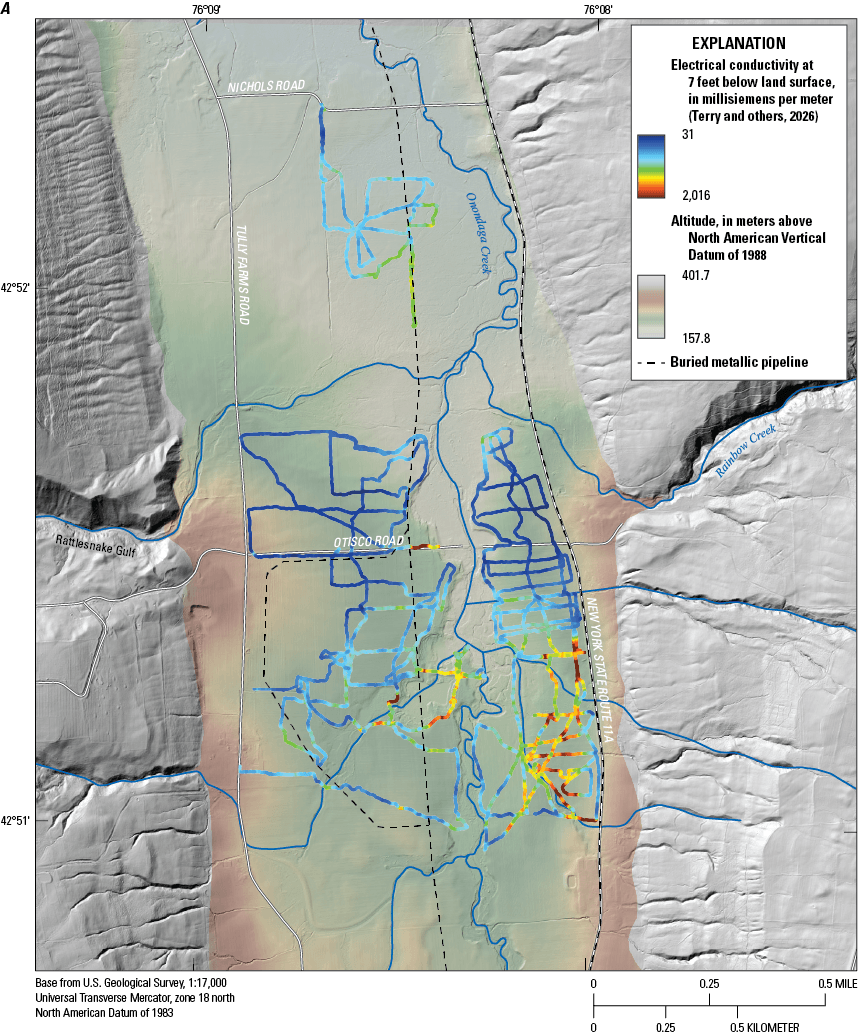
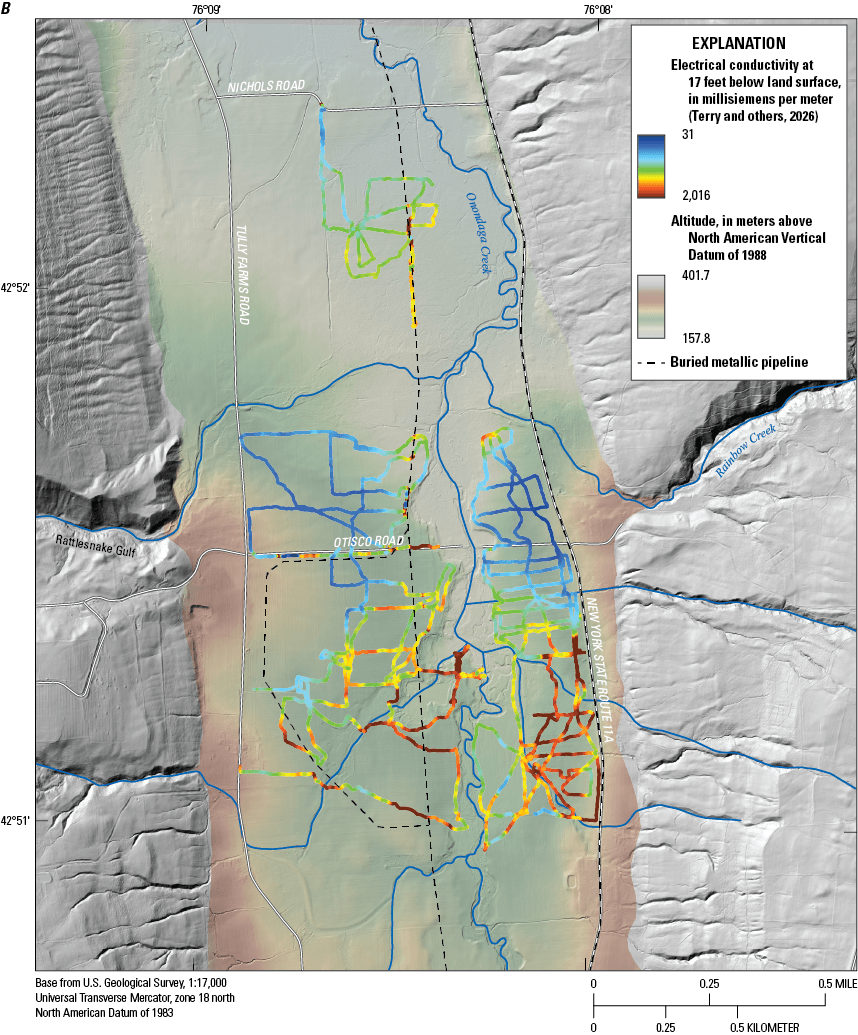
Map showing paths of frequency-domain electromagnetic survey paths collected with a DUALEM–421 surface-geophysical instrument and modeled electrical conductivity at depths of A, 7 and B, 17 feet below land surface in the investigation areas in the Tully Valley, Onondaga County, New York.
Raw electromagnetic geophysical data are sensitive to subsurface bulk electrical conductivity, and the different frequencies and transmitter-receiver separations and orientations effectively sense different volumes of the subsurface; however, data points are not uniquely associated with a specific depth. To obtain depth-dependent electrical conductivity images, the process of geophysical inversion (iterative, numerical model-fitting approach) is required. The electromagnetic data were inverted in Aarhus Workbench version 6.5.1.0 by using appropriate import configuration and processing settings for each instrument. Terry and others (2026) provide further details of the import, processing, and inversion settings used and output as georeferenced models of subsurface earth conductivity to a depth of 49 ft bls. Due to the inherent physical limitations of the instruments, the electrical conductivity contrasts within the subsurface itself, and necessary constraints applied in the inversion, these conductivity models are blurry (smooth) and only interpretable to some fraction of the total 49 ft bls. Workbench performs a sensitivity analysis during the inversion to provide an estimate of this maximum interpretable depth at each location, known as the depth of investigation. In general, the depth of investigation was about 15 to 25 ft for the DUALEM–421 instrument, and about 10 to 20 ft for the GEM–2 instrument. Inversion results from the DUALEM–421 instrument are presented in this report as specific depth-slice maps and vertical sections of electrical conductivity. Owing to the shallow depth of investigation of the GEM–2 survey, only the cumulative instrument response (measured sum of quadrature values) is presented in this report. The GEM–2 survey provided an independent check of the shallow DUALEM–421 response and an increased areal coverage for surficial geologic mapping purposes.
Well Drilling, Sediment Sampling, and Standard Penetration Testing
Well drilling, sediment sampling, and standard penetration tests (SPTs) were completed at eight sites during April 11–14, 2022, to help characterize subsurface lithologic texture and stiffness of the sediments in the study area (fig. 4). Seven of the sites were along or near the proposed stream-relocation paths, and the eighth site was at the northwestern edge of the proposed offline settling basin area. The wells were drilled with 8-inch (in) diameter hollow-stem augers. Sediment sampling and SPTs were completed in accordance with standard procedures and equipment described by ASTM International (2022): a 2-in diameter, 1.5-ft long split-spoon sampler and 140-pound automatic hammer are used to obtain nearly continuous sediment samples and measure the resistance of the sediments to the penetration of the sampler. During each test, the number of hammer blows were recorded for three 0.5 ft intervals. The standard penetration test number of blows (SPT–N) value was calculated as the number of hammer blows for the second and third 0.5 ft intervals of penetration. SPT–N values were used to classify fine-grained sediments as very soft (< 2), soft (2–4), medium stiff (5–8), stiff (9–15), very stiff (16–30), or hard (>30) (ASTM International, 2022) and coarse-grained sediments as very loose (<4), loose (4–10), compact (10–30), and dense (>30) (Meyerhof, 1956). In very soft sediments, sampler penetration commonly required no hammer blows, and the sampler advanced under the weight of the hammer.
Penetration-test data collected during investigations in the 1990s were also included in the analysis. Although a similar method to that described by ASTM International (2022) was used, the data do not meet the ASTM International standard for calculation of SPT–N values. The 1990s penetration test results, which are reported in blow counts per foot of penetration, were collected by using a rotating cathead and rope to raise and drop a weight rather than an automatic hammer. The data are more varied but are roughly comparable to the SPT results. In this report, data collected for this study in accordance with ASTM International (2022) are recorded as SPT–N values and historical data collected during investigations in the 1990s are referred to as “hammer blows per foot.”
For depth intervals not sampled on a continuous basis, split-spoon samples were collected when the auger drilling indicated a probable change in lithology. The split-spoon samples were described in the field by texture (very fine to very coarse), sorting, color, and presence of laminations and moisture. Split-spoon samples collected from wells OD3221 and OD3226 at depths of 30 to 32 ft bls were placed in plastic bags and submitted to Kenney Geotechnical Services of Syracuse, New York, for laboratory analysis of moisture content and grain size. Two Shelby-tube samples were collected from well OD3219 at depths from 12.5 to 16 ft bls and submitted for laboratory analysis of moisture content and unconfined compressive strength in accordance with procedures and equipment described by ASTM International (2015; 2016). Very soft soils have unconfined compressive strength values less than 500 pounds per square foot (lb/ft2); soft soils have unconfined compressive strength values from 500 to 1,000 lb/ft2; and stiff soils more than 1,000 lb/ft2 (Singh, 2020). Split-spoon sample descriptions and drilling notes, SPT data, and soil geotechnical properties from the wells from this study and previous studies are available from the associated USGS data release (Terry and others, 2026) and USGS GeoLog Locator (USGS, 2024a).
Test-Pit Excavation and Sediment Sampling
On May 5, 2022, test pits OD1998 and OD1999 were excavated with a backhoe to depths of 10 ft bls for field observations of sediment types and for sediment sampling in the proposed offline settling basin area (fig. 4). Sediment samples were collected in plastic bags from both test pits at a depth of 9.5 ft bls and submitted for laboratory analysis of grain size and moisture content. Sediment samples were collected in plastic bags from test pit OD1998 at a depth of 2.5 ft bls and test pit OD1999 at a depth of 5.5 ft bls and submitted for laboratory analysis of moisture content and Atterberg Limits. Atterberg Limits establish the moisture content at which fine-grained sediments transition between solid, semisolid, plastic, and liquid states (ASTM International, 2018b; Andrews and Martin, 2000; O’Kelly, 2021). Fine-grained sediments are considered liquifiable where they contain less than 15 percent clay, have a liquid limit of less than 35 percent and plasticity index (liquid limit minus plastic limit) less than 12, and their water content is more than 90 percent of the liquid limit (Seed and Idriss, 1982; Bray and Sancio, 2006; and Bennett and others, 2011). The liquidity index, which is the moisture content minus the plastic limit divided by plasticity index, can be used to classify the consistency of fine-grained sediments as very brittle (<0.00), brittle (0.00–0.25), medium soft (0.26–0.50), soft (0.51–0.75), very soft (0.76–1.00), and liquid (>1.00) (Venkatramaiah, 2006). Descriptions and geotechnical properties of the sediment samples from the test pits are available from the associated USGS data release (Terry and others, 2026).
Piezometer and Well Installation
Four piezometers and eight wells were installed as part of the study (fig. 4; table 1). The piezometers were installed by the drive-point method (Waller, 1994) along the southern reach of the proposed far east stream relocation path and provided access for groundwater level and specific conductance measurements (fig. 2). Piezometer OD3227 was installed on October 1, 2020, and piezometers OD3228, OD3229, and OD3230 were installed on November 18, 2021. The piezometers were constructed with 3/4-in diameter steel casing and 1-ft long screens.
Table 1.
Construction information, hydraulic-conductivity estimates, and water-level and specific-conductance data for wells and piezometers installed for this study in Tully Valley, Onondaga County, New York.[Data from Terry and others (2026) and U.S. Geological Survey (2024b). Location of wells and piezometers shown on figure 4. Hydraulic conductivity was estimated from analysis of slug tests on May 24, 2022. Maximum and minimum water-level depths and maximum specific conductance for wells measured from April 23, 2022, to April 25, 2023, and maximum specific conductance for piezometers from construction date to August 8, 2022. Dates shown as month/day/year. ft NAVD 88, foot above North American Vertical Datum of 1988; ft bls, foot below land surface; ft/d, foot per day; μS/cm, microsiemens per centimeter at 25 degrees Celsius; NT, not tested; Fw, freshwater but not quantified; Als, above land surface but not quantified]
Seven wells were installed along and near the proposed creek-relocation paths on April 11–14, 2022 (table 1). A single well (OD3219) was installed at the northwestern edge of the offline settling basin area on April 13, 2022. The wells, which provided access for geophysical logging, hydraulic-slug testing, and groundwater monitoring, were constructed with 2-in diameter polyvinyl chloride (PVC) pipe, 5- to 10-ft long screens, and as much as 10-ft long sumps. The annular space surrounding the screens were filled with sand, and the space above the screens was filled with bentonite.
Gamma and Electromagnetic-Induction Logging
Gamma and electromagnetic-induction (EMI) logs were collected from the eight wells on May 24, 2022, to provide information on grain size and groundwater salinity. The gamma and EMI logs of the wells are available in Log ASCII Standard format (LAS 2.0) from USGS GeoLog Locator (USGS, 2024a). Gamma logs measure the total gamma emission produced by naturally occurring isotopes of potassium, thorium, and uranium in sediments surrounding the well. Gamma logs were collected from the wells with a Mount Sopris Instruments gamma probe by using logging procedures described by ASTM International (2018a). Gamma activity is generally assumed to be related to grain size: gamma emissions (recorded in counts per second) increase with clay content. However, sediments that contain sand- to clay-sized grains that are dominated by quartz mineralogy with negligible clay alteration minerals, as is the case in the study area, have a reduced range of gamma response and overlap for the different grain sizes (Crow and others, 2017).
EMI logging provides a nearly continuous vertical profile of electrical conductivity of the sediments and pore water surrounding the well. The major factors affecting electrical conductivity in unconsolidated deposits is their silt and clay content, their saturated porosity, and the salinity of the groundwater. A W&R instruments three-coil induction probe that has intercoil spacings of 0.5 m and 0.8 m and operates at a frequency of 100 kilohertz was used for EMI log-data collection. The conductivity readings from the two intercoil spacings tracked each other and only that from the 0.5 m is presented. EMI logs were collected from the wells by using logging and calibration procedures as described by ASTM International (2017). The EMI probe was lowered to the bottom of the well and the probe electronics were allowed to equilibrate with the groundwater temperature (10 to 20 minutes depending on the outside air temperature). After equilibration, EMI data were collected at 0.1 ft deep intervals with the probe moving in an upward direction at a rate of 10 ft/min. Probe calibration checks were made after logging and removal of the probe from the well, during which the temperature of the probe electronics was assumed to be close to the groundwater temperature. Probe readings were recorded while holding the probe away from any metal in free air with an assumed electrical conductivity of 0 millisiemens per meter (mS/m) and while a plastic ring with an embedded wire loop that has a factory-calibrated electrical conductivity of 100 mS/m was placed at the midpoint of the intercoil spacing. Check measurements were within the accuracy range of the probe, which is ±5 mS/m.
Hydraulic-Slug Testing
Hydraulic-slug tests were completed in the eight wells on May 24, 2022, to estimate the horizontal hydraulic conductivity of the screened sediments. Slug-test design, procedures, and equipment are described by Cunningham and Schalk (2011). A Midwest Geoscience Solid H(o) Slug was used for the study tests. The slug has tapered ends to minimize the pressure wave and is designed to displace 1 ft of water in a 2-in diameter well. The slug was inserted for slug-in tests and removed for slug-out tests rapidly and smoothly. A Solinst levelogger nonvented pressure transducer with a 33-ft range was used to record water-level displacement at 1-second intervals. Three sets of manual measurements were made with a Solinst water-level meter referenced to top of casing to ensure static water-level conditions prior to slug insertion, to check transducer readings during the tests, and to determine when the tests could be ended.
The slug-test datasets were analyzed by using the Bouwer and Rice solution method (Bouwer and Rice, 1976; Bouwer, 1989) in AQTESOLV software (Duffield, 2007) to estimate hydraulic conductivity of the tested sediments. A 10:1 ratio of horizontal to vertical hydraulic conductivity was assumed for the analysis. The thickness of the tested aquifer was approximated as the difference between the top of screen depth and the water-level depth. The slug test for well OD3219 provides a representative example of the displacement data and match fit of the Bouwer and Rice analytical solution (fig. 7).
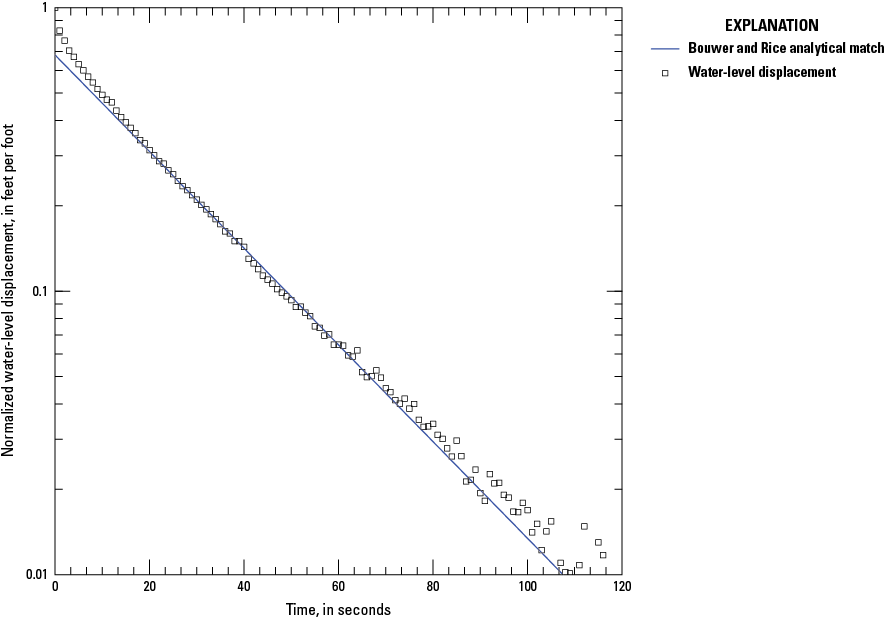
Graph showing normalized transient water-level displacement and Bouwer and Rice analytical match (Bouwer and Rice, 1976; Bouwer, 1989) for hydraulic-slug test of well OD3219 in the study area in the Tully Valley, Onondaga County, New York. Data from Terry and others (2026).
The resulting hydraulic-conductivity estimates for the wells are in table 1 and the time-displacement data are published in the associated USGS data release (Terry and others, 2026).
Monitoring of Groundwater Levels and Specific Conductance
Groundwater-level and specific-conductance data were periodically collected from the piezometers and wells after their completion. Water levels in piezometers that were above the top of casing were measured by using clear plastic tubing connected to the casing and a calibrated measuring rod. Water levels below top of casing in piezometers and wells were measured by using a Solinst water-level meter. Water samples were collected directly from the piezometers with flowing artesian conditions for field measurement of specific conductance with a YSI Incorporated conductivity meter. A bailer was used to purge and collect water samples from the wells and nonflowing piezometers for field measurement of specific conductance with a YSI Incorporated conductivity meter (USGS, variously dated).
Groundwater levels were continuously monitored in the eight wells from April 23, 2022, to April 25, 2023. Specific conductance and temperature also were continuously monitored during the same period in the screen zones of wells OD3221, OD3222, and OD3223. Solinst Levelogger sensors were used to record pressure and temperature, and Solinst Levelogger LTC sensors were used to record pressure and specific conductance. A Solinst Barologger installed in well OD1932 in the southern end of the Tully Valley was used to compensate all water-level readings for atmospheric pressure fluctuations. Pressure, barometric-pressure, and specific-conductance data were recorded at 15-minute intervals. Periodic discrete water-level measurements were made in the wells and compared with that measured by the vendor-calibrated pressure transducers. The vendor calibration of the specific conductance sensors was checked with standards from the National Water Quality Laboratory after removal from the wells and corrected using standard procedures (USGS, 2019).
Water levels measured in wells OD400, OD401, OD404, OD407, and OD408 during 1995–2010 as part of a previous investigation provided some historical long-term information on groundwater conditions in the study area, including information from an extreme flooding event in January 1996 (Lumia, 1998). The discrete and continuous groundwater-level data collected as part of previous and current investigations are available from the USGS National Water Information System (USGS, 2024b). The specific-conductance and temperature data collected as part of the current investigations are published in the associated USGS data release (Terry and others, 2026).
Surficial Geology
The major surficial geologic deposits in the area surrounding the mudboils (fig. 8) are (1) alluvial-fan deposits, (2) recent alluvium, and (3) lacustrine silt and clay. The alluvial-fan deposits from Rattlesnake Gulf creek and Rainbow Creek and from smaller tributaries along the valley walls consist of clayey and silty sand and gravel. Alluvial fans have low electrical conductivity (figs. 5 and 6) because of their coarse-grained content and thicker unsaturated zone. The fan deposits are almost 50 ft thick near the heads of the fans but taper outward into the valley, where they have a typical thickness of about 20 ft (Kappel and others, 1996). Alluvium in the floodplain of Onondaga Creek is generally thin (less than 10 ft thick) and fine grained near the surface, although it becomes coarser with depth. Underlying the alluvium are lacustrine silt and clay as much as 80 ft thick. Lacustrine silt and clay are locally exposed between alluvial-fan deposits and alluvium south of the mudboil area. The lacustrine deposits have high electrical conductivity (figs. 5 and 6) because of their fine-grained content and near-surface saturation. Stratified sand and gravel with low electrical conductivity overlie the lacustrine deposits south and southwest of the mudboils.
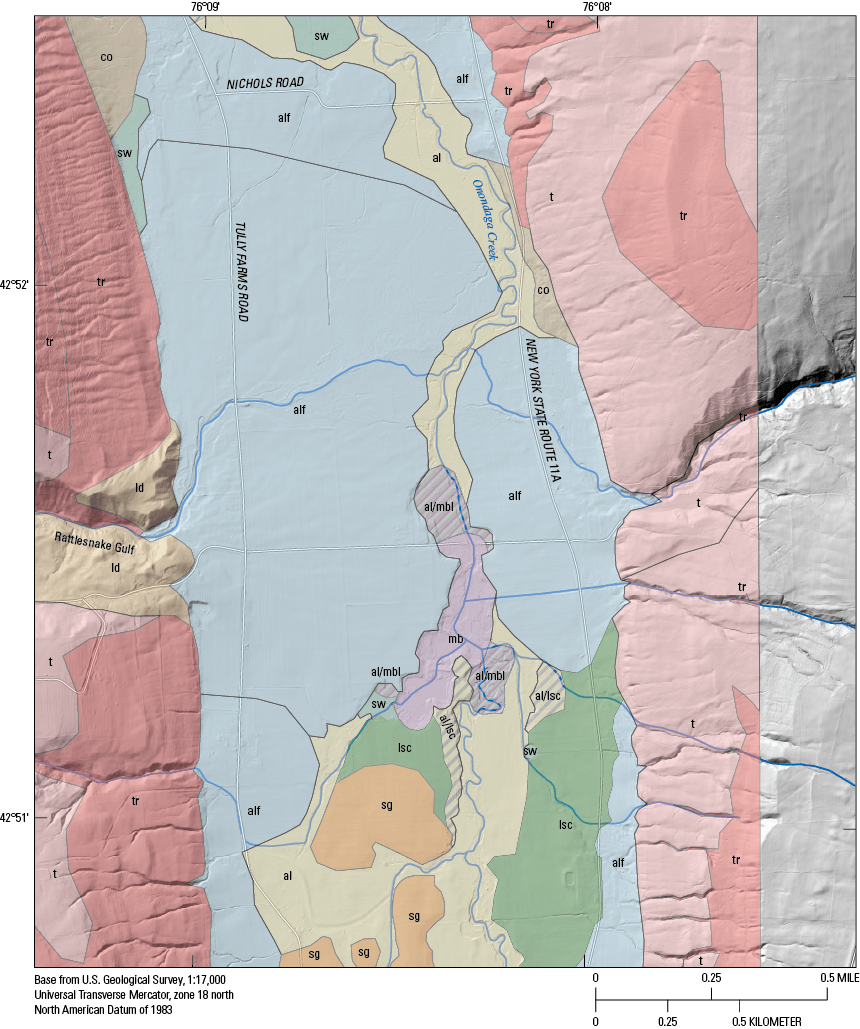
Map showing surficial geology of the mudboil deposits and surrounding area in the Tully Valley, Onondaga County, New York.
The lacustrine deposits overlie the upper confined aquifer (Kappel and others, 1996), which together are the source of sediments discharged in the mudboil area. Mudboil discharge consists of silt and fine sand with some clay; the coarser fraction comprises the surficial deposits in the mapped mudboil area, whereas suspended sediments in the outflow ultimately discharge to Onondaga Creek. Subsidence of the land surface along with the occurrence of mudboils define the mapped extent of mudboil and related slumped deposits.
Just north of the mudboil deposits (and Otisco Road), there is an anomalously wide and low Onondaga Creek floodplain area bounded on the west and east by scarps that mark the abrupt end of the alluvial-fan deposits. The scarps are similar to those in the mudboil area. On the basis of this similarity, this area is mapped as alluvium over mudboil-like deposits. Minor mudboil areas to the south shown in figure 3 are limited and were not delineated as mappable mudboil deposits.
Precipitation
Precipitation, snowpack, and air temperature data were collected at the town of Tully station of the New York State Mesonet from April 23, 2022, to April 18, 2023 (New York State Mesonet, 2024; fig. 9). The Tully station is a standard New York State Mesonet station and is 4 mi south of the study area. Total precipitation for the year-long period was 38.51 in. Monthly precipitation ranged from 5.03 in in November 2023 to 0.95 in during October 2023. Compared with long-term precipitation averages (2006–20) for the greater Syracuse area (National Oceanic and Atmospheric Administration station USW00014771; National Oceanic and Atmospheric Administration, 2024), the annual average for precipitation was slightly below average. The monthly precipitation during the monitoring period for this investigation varied more than precipitation during the earlier period of record.
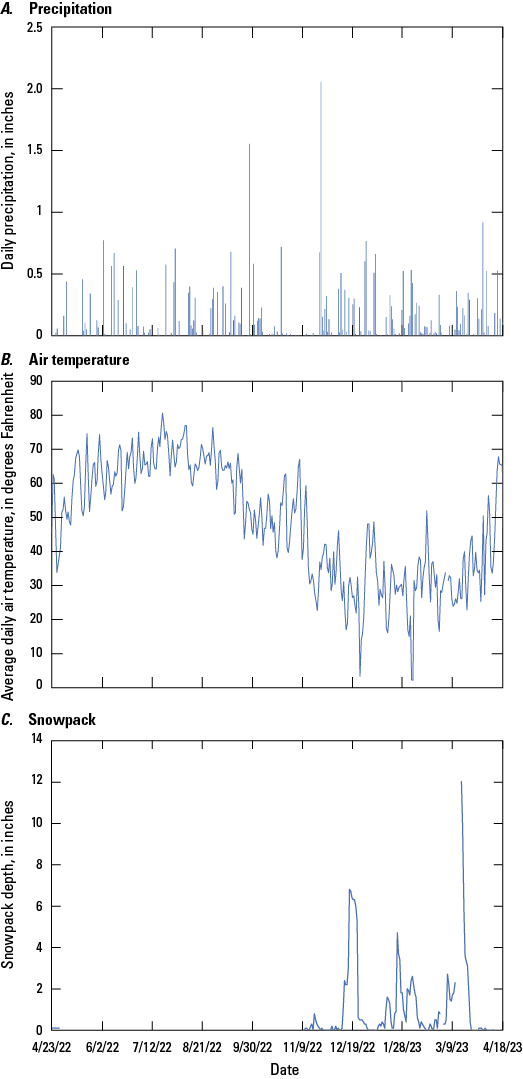
Graphs showing A, precipitation, B, air temperature, and C, snowpack data from April 23, 2022, to April 18, 2023, from the New York State Mesonet weather station at the town of Tully, New York. Data from New York State Mesonet (2024).
Groundwater Levels and Specific Conductance
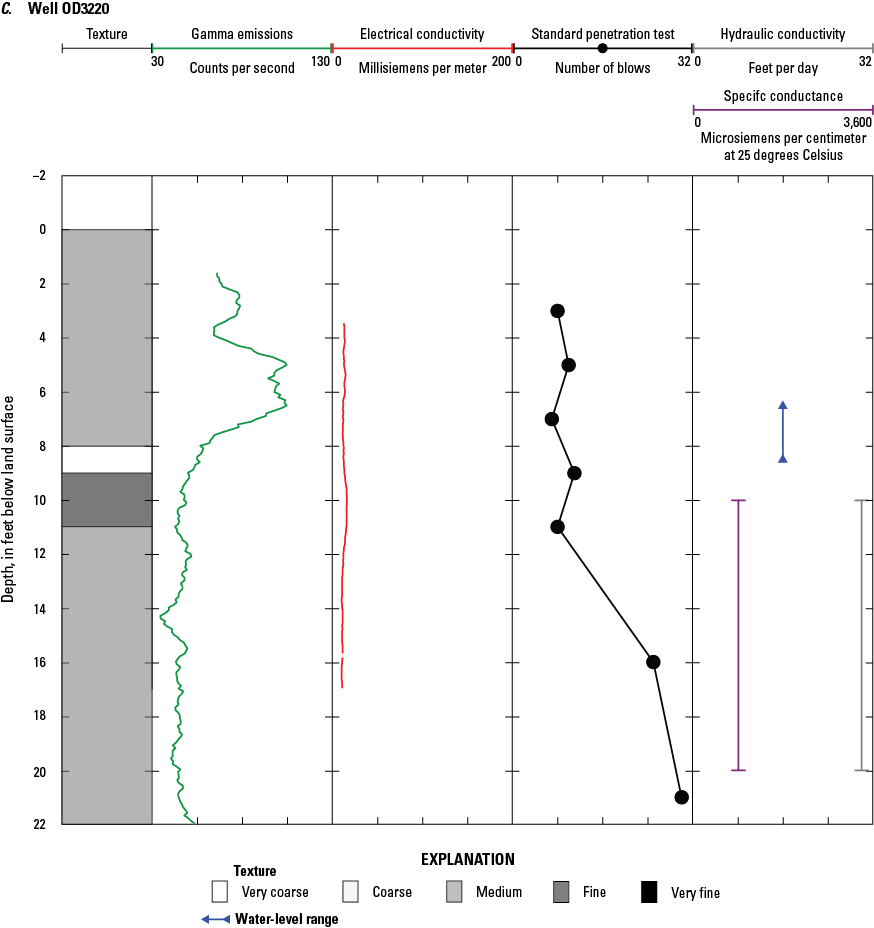
Groundwater conditions in the Tully Valley during the monitoring period were near median conditions as indicated by long-term water levels measured in USGS observation wells C–998 and Od–1825 (fig. 10). Well C–998 is 6 mi south of the Tully Valley and has 20 years of record (2003–23), and well Od–1825 is 17 mi northwest of the valley and has 18 years of record (2005–23) (fig. 1). The water-level hydrographs of the wells installed for this investigation showed the typical seasonal trends during the monitoring period (figs. 4 and 11). Water levels generally rose to their highest levels in early spring after snowmelt and precipitation events, declined during late spring and summer with maximum evapotranspiration losses, reached their lowest levels in late summer and early fall, rose again in late fall as evapotranspiration losses decreased, and stabilized or slightly declined with freezing temperatures during winter. Water levels in wells drilled near Onondaga Creek or its tributaries seem to have been affected by stage changes in these adjacent waterways: some water levels were just below or above land surface during spring and high-runoff periods at wells OD3223, OD3224, and OD3225. Well OD3219, although not as close to the historical Rattlesnake Gulf creek channel, exhibited a similar response, which is attributable to the aggraded alluvial fan associated with the current channel discharging from Rattlesnake Gulf. Streamflow discharges off the aggraded streambed into adjacent farm fields and travels just to the west of this well. The two deep alluvial-fan wells (OD3221 and OD3226) had the greatest water-level change, which was due to recharge from the bedrock-lined side valley stream channels (Rainbow Creek and Rattlesnake Gulf creek) that then flow to and recharge their respective alluvial fans.
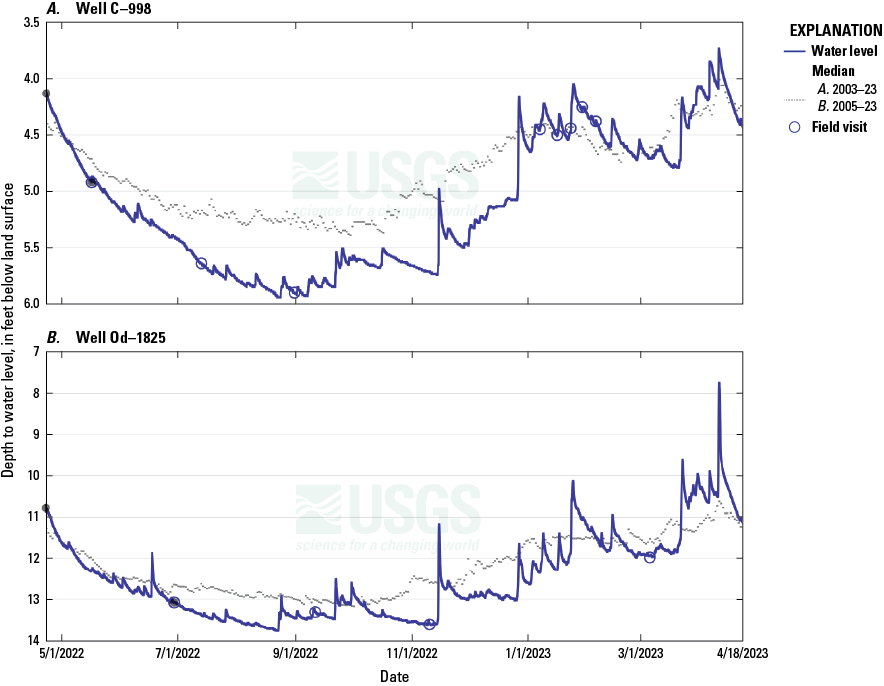
Graphs showing groundwater levels measured from April 23, 2022, to April 18, 2023, and period of record daily medians for U.S. Geological Survey observation network wells A, C–998 and B, Od–1825. Data from U.S. Geological Survey (2024b). (Location of wells shown on figure 1.)
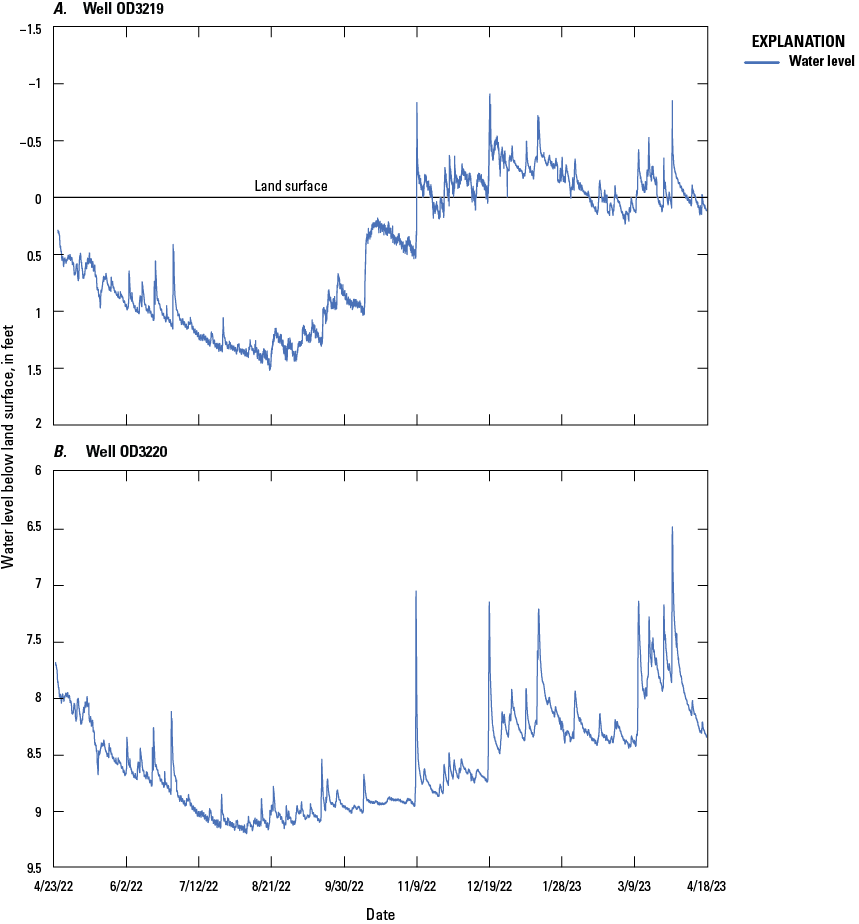
Graphs showing groundwater levels measured in wells A, OD3219, B, OD3220, C, OD3221, D, OD3222, E, OD3223, F, OD3224, G, OD3225, and H, OD3226 from April 23, 2022, to April 18, 2023, in the Tully Valley, Onondaga County, New York. Data from U.S. Geological Survey (2024b). (Location of wells shown on figure 4.)
Specific conductance measured in wells OD3221, OD3222, and OD3223 varied between wells and temporarily because of natural and anthropogenic sources of salinity that flow into the wells and the effects of seasonal recharge on groundwater salinity (fig. 12). The specific conductance measured in well OD3221 (installed on the Rainbow Creek alluvial fan) indicated the effect of recharge from road salt runoff: the highest values occurred during late winter and spring, and the lowest values occurred in fall to midwinter. The specific conductance measured in well OD3222 (near a tributary to Onondaga Creek) showed the opposite trend: spring recharge diluted the ambient high-salinity groundwater that possibly was affected by infiltration of agricultural runoff. The specific conductance measured in well OD3223 was two to four times higher than that measured in wells OD3221 and OD3222 and showed a seasonal trend related to the effect of spring recharge diluting the ambient high-salinity groundwater. The discrete samples from nearby piezometers OD3228 and OD3229 had specific conductance values consistent with those measured in well OD3223, which suggests a localized area of high-salinity groundwater (table 1). The area may receive some road salt runoff from New York State Route 11A, but the higher baseline and seasonal trend in specific conductance suggests a continuous source of salinity. A 1,000-ft deep salt-exploration borehole (OD449) was drilled upgradient and slightly south from well OD3223 by a salt solution-mining company in 1934 (fig. 4). The borehole was sealed to a reported depth of 213 ft bls in the 1960s (New York State Museum, 2024; API 31-067-52996). The partial sealing of the borehole left brackish water-bearing zones in the underlying carbonate units unsealed. Water-level measurements from these zones in nearby well OD416 showed hydraulic heads of as high as 67 ft als (USGS, 2024b). This suggests that there are probably similarly high heads in borehole OD449 and that upward flow in the unsealed part of the borehole may be the source of salinity in this area. Further assessment of this situation was beyond the scope of this study.
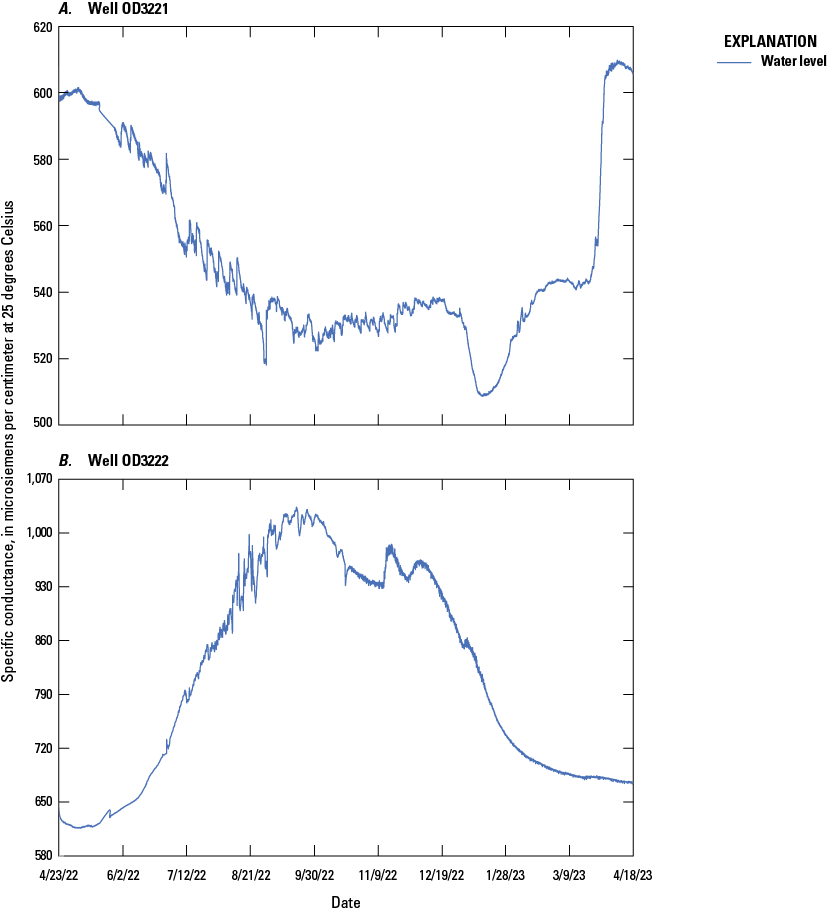
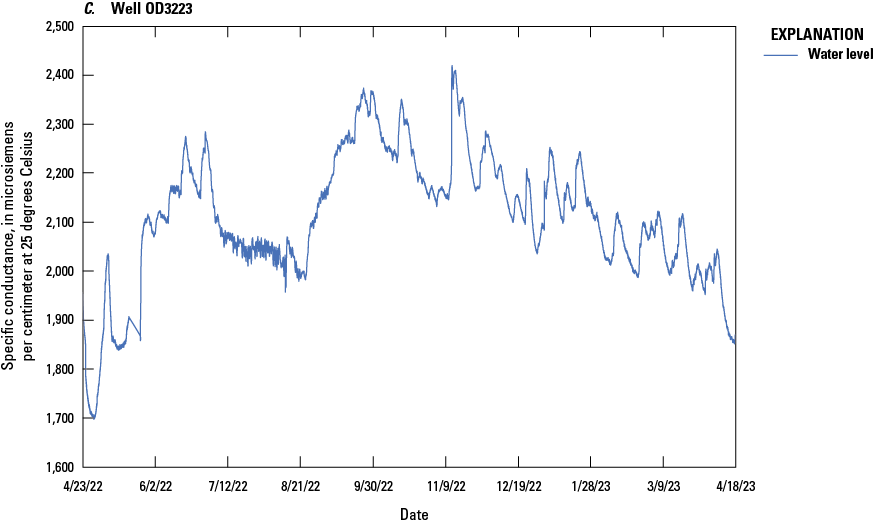
Graphs showing specific conductance of groundwater measured in wells A, OD3221, B, OD3222, and C, OD3223 from April 23, 2022, to April 18, 2023, in the Tully Valley, Onondaga County, New York. Data from Terry and others (2026). (Location of wells shown on figure 4.)
Shallow Hydrogeologic Framework of Proposed Creek Relocation Paths and Offline Basin Settling Area
The surficial-geologic, geophysical, geotechnical, hydraulic, and lithologic information were interpreted as an integrated dataset to characterize the shallow hydrogeologic framework along the proposed creek-relocation paths and near the proposed offline settling basin. Unsaturated sediments were indicated by electrical conductivity values of as much as 10 mS/m. The electrical conductivity of coarse-grained sand and gravel deposits saturated with freshwater was about 15–20 mS/m and that of the fine-grained fine sand, silt, and clay sediments saturated with freshwater was about 25–35 mS/m. The electrical conductivity of sediments with brackish water was as much as or exceeded 100 mS/m. Shear-wave velocity of about 150 meters per second and SPT–N values fewer than 2 indicated very soft liquifiable silty fines. Higher shear-wave velocity and SPT–N values in fine-grained deposits indicated the presence of stiffer clays. Shear-wave velocity of about 250 meters per second and SPT–N values of greater than 10 indicated compact to dense coarse-grained sediments. Buried metallic pipelines, whose approximate locations are shown on figure 2, produced localized, anonymously high electrical conductivity values overwhelming the signal from the underlying sediments.
The shallow sediments and hydrologic conditions along the proposed creek-relocation path and settling basin area are discussed and displayed on hydrogeologic sections with electrical conductivity profiles and supporting shear-wave velocity, lithologic texture, and hydraulic-head data. Gamma, electrical conductivity, and penetration logs from wells and results of laboratory analysis of selected soil samples from the wells and test pits are also discussed.
Proposed Creek-Relocation Paths
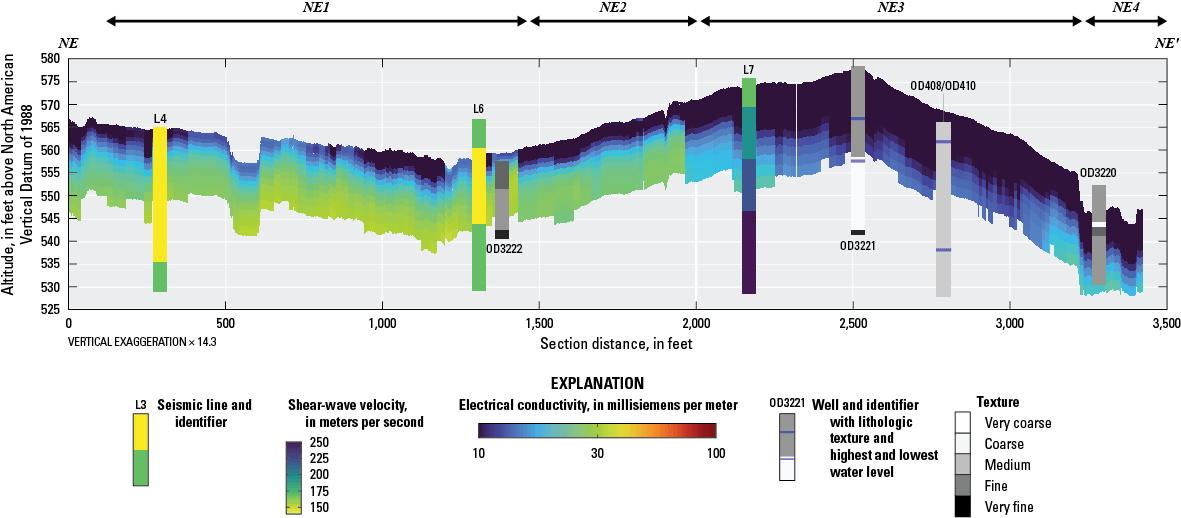
Four proposed creek-relocation paths were targeted for investigation, each named for its location in relation to Onondaga Creek: far east (FE), near east (NE), near west (NW), and far west (FW) (fig. 13). The shallow hydrogeologic frameworks along each of the four proposed creek relocation paths are discussed on a reach-by-reach basis (fig. 14).
Map showing location of the proposed far east, near east, near west, and far west creek-relocation paths in the Tully Valley, Onondaga County, New York.
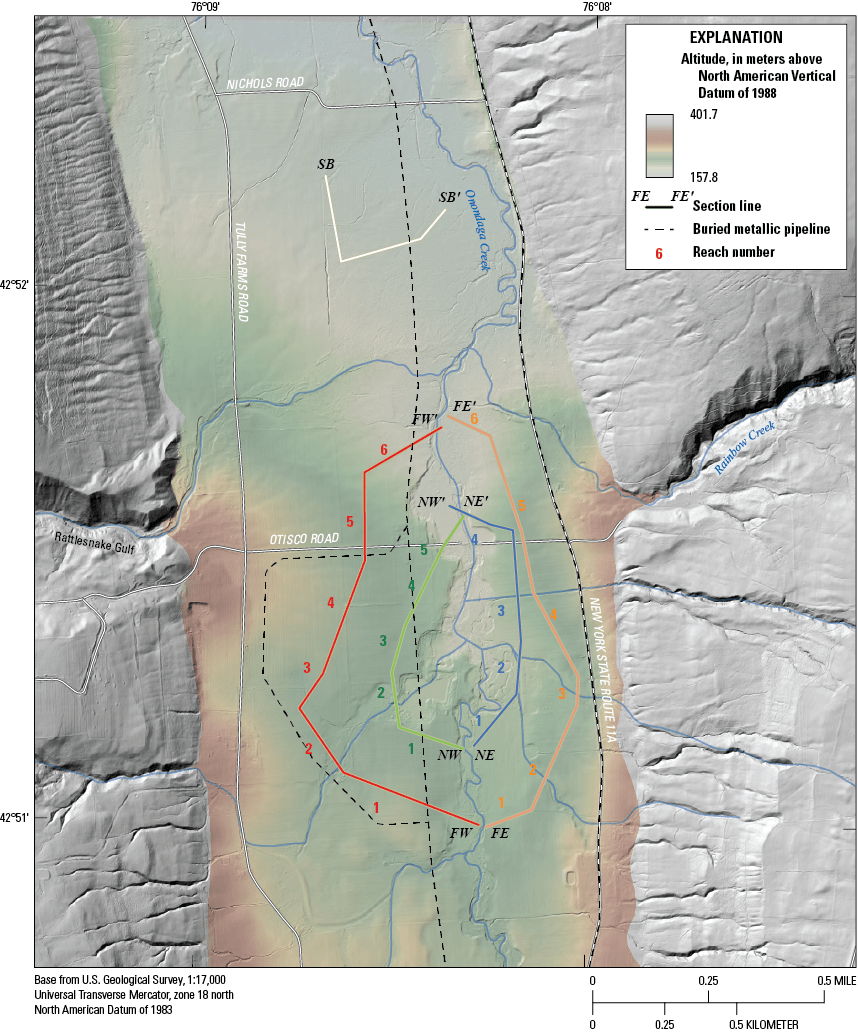
Map showing locations of shallow hydrogeologic section traces along the proposed far east, near east, near west, and far west creek-relocation paths and section trace that transects the proposed offline settling basin area in the Tully Valley, Onondaga County, New York.
Far East Path
The line of the FE path starts in the Onondaga Creek floodplain at an altitude of 570 ft, ascends the Rainbow Creek alluvial fan to an altitude of 585 ft, and descends back to the creek floodplain to an altitude of 540 ft (fig. 13).
Field observation indicates that the takeoff point for the proposed FE path from Onondaga Creek is coincident with the location where the creek overtops its banks during flooding and flood waters flow across the farm field to the ditched tributary channel (fig. 15). However, the proposed FE path takes a more easterly line from the creek and would not benefit from this natural diversion.
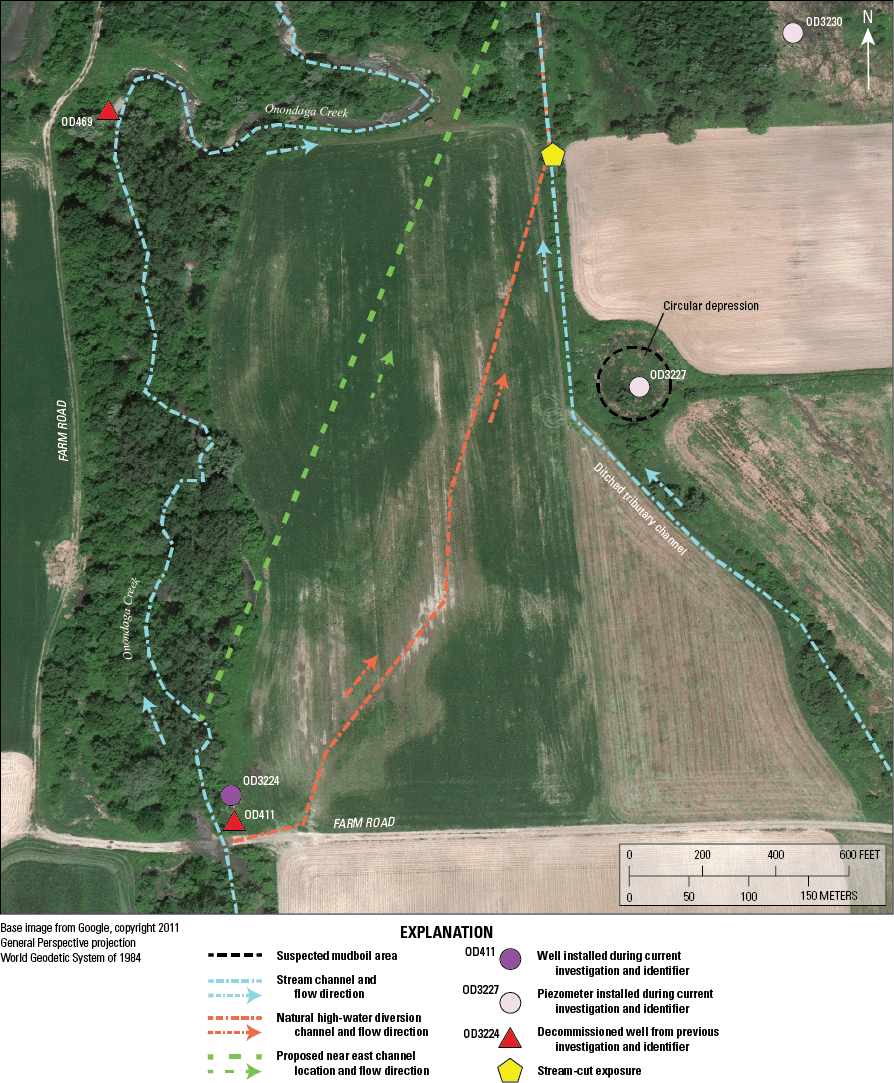
Map showing natural diversion of flood waters from Onondaga Creek and selected features in the southern part of the creek relocation investigation area in the Tully Valley, Onondaga County, New York.
The first reach of the FE path (FE1) would be excavated into floodplain alluvium to a depth of 5 ft bls (figs. 8 and 16). The electrical conductivity along the reach and shear-wave velocity at seismic lines L5 and L1 indicate that the alluvium is as much as 10 ft thick, is partially to fully saturated with freshwater, consists of coarse- and fine-grained sediments, and is underlain by lacustrine fines. The shear-wave velocity at seismic line L5 indicates that the lacustrine fines are less dense than the alluvium but denser than the fines at seismic line L1, where shear-wave velocities are more typical for that type of deposit. Electrical conductivities along FE1 indicate that the shallow groundwater is fresh.
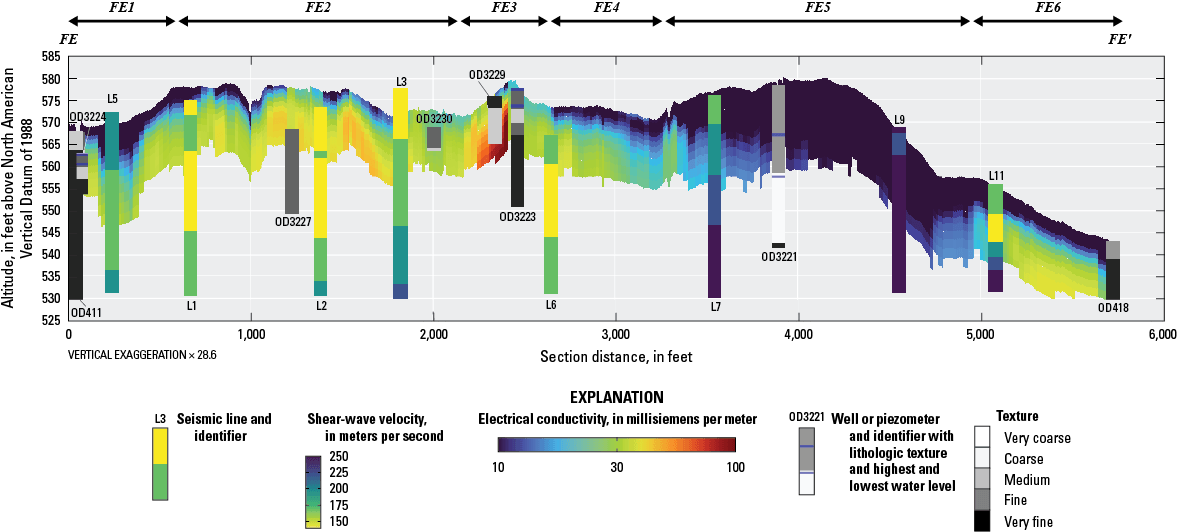
Graph of shallow hydrogeologic section FE–FE' along proposed far east creek-relocation path showing electrical conductivity, shear-wave velocity, lithologic texture, and highest and lowest measured water levels in the Tully Valley, Onondaga County, New York. Data from Terry and others (2026) and U.S. Geological Survey (2024b). (Location of section trace shown on fig. 14.)
In FE1, well OD411 penetrated sand and gravel from 0 to 4.5 ft bls and massive lacustrine gray and red clay and silt from 4.5 to 57 ft bls. Well OD3224 penetrated overbank silt and clay from 0 to 2 ft bls, silty sand and gravel from 2 to 8 ft, and lacustrine clay and silt from 8 to 13 ft bls that increased in density with depth. The SPT–N values at the well indicate that the overbank fines were medium stiff and the lacustrine fines were stiff to very stiff (fig. 17A). The highest SPT–N value measured at the well site was in the lower part of the alluvium. During 2022–23, the hydraulic head measured in the well, which was screened from 3 to 8 ft bls, was influenced by the stage of the adjacent Onondaga Creek and ranged from 0.4 ft als to 2.9 ft bls. Maximum specific conductance of groundwater sampled from the well was 1,010 µS/cm. The source of the specific conductance may be due to infiltration of road-salt and (or) agricultural runoff. The estimated hydraulic conductivity of the screened alluvium was 5 feet squared per day (ft2/d).
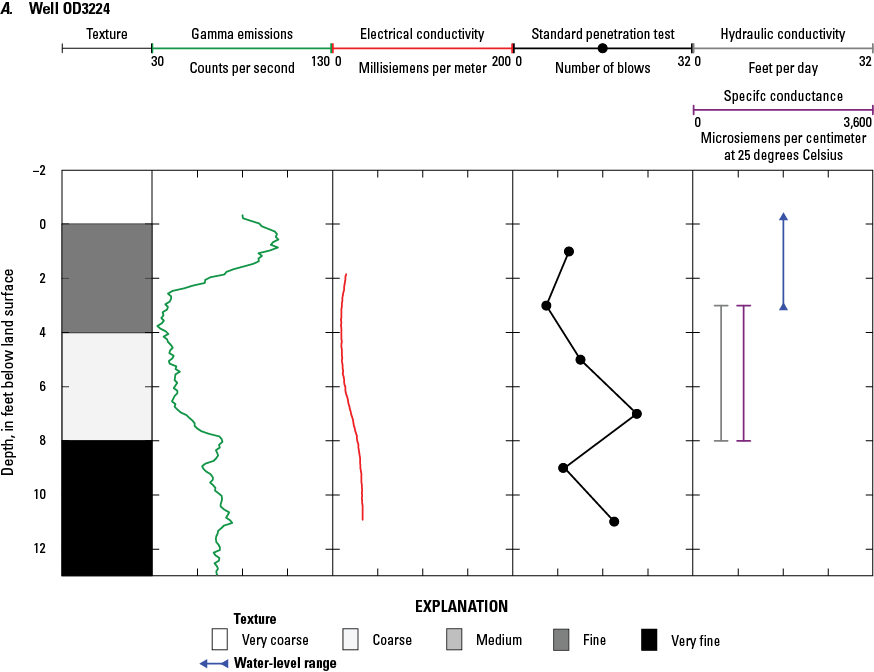
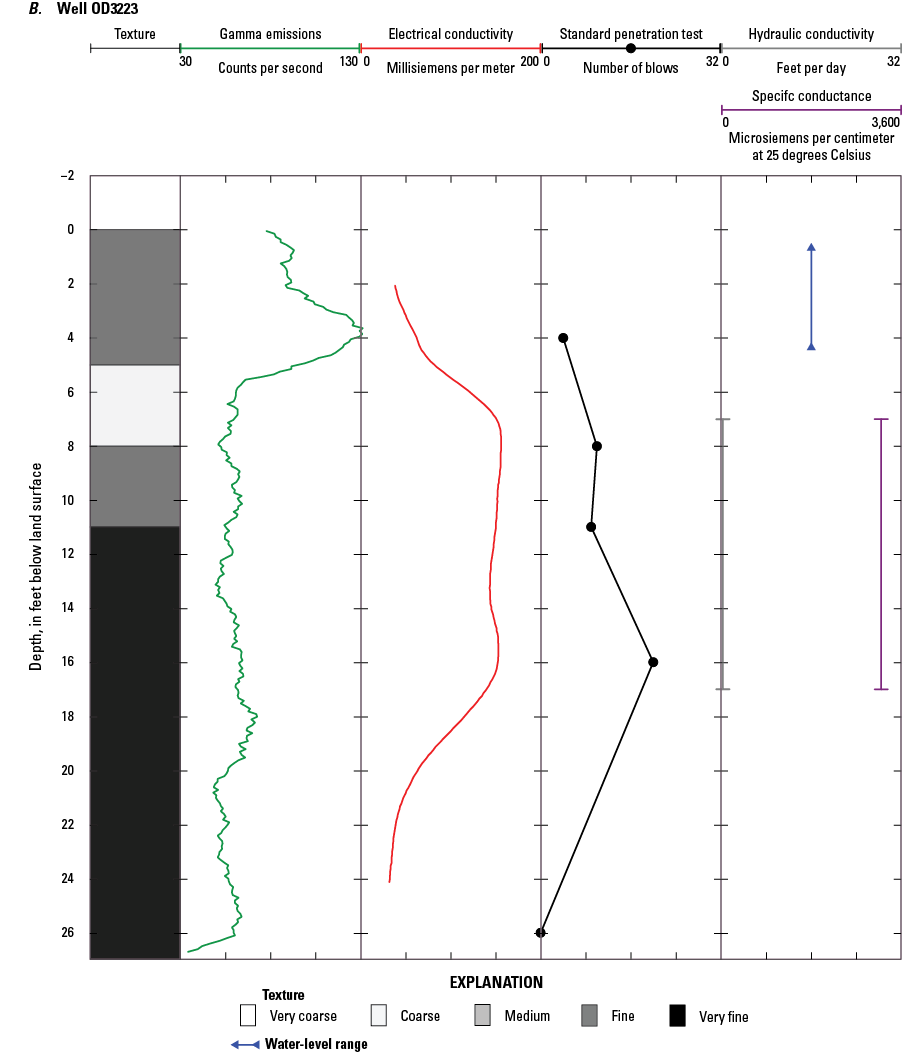
Graphs showing electrical conductivity, gamma, sediment-texture, and penetration logs; estimated hydraulic conductivity; highest and lowest measured water levels; and specific conductance of groundwater for wells A, OD3224, B, OD3223, and C, OD3221 in the Tully Valley, Onondaga County, New York. Data from Terry and others (2026). (Location of wells shown on fig. 4.)
The second reach of the proposed path (FE2) would be excavated into alluvium and lacustrine fines to a depth of 5 to 15 ft bls. (figs. 8 and 16). The electrical conductivity along the reach and shear-wave velocity at seismic lines L2 and L3 indicate the sediments are nearly fully saturated and loose near the surface and become denser with depth. Estimated electrical conductivity along FE2 may relate to increased clay content or a slight increase in salinity. Piezometer OD3227, which was installed in a circular wetland depression near FE2, penetrated organic material from 0 to 4 ft bls and clayey silt with minor fine sand from 4 to 19 ft bls. During 2022–23, the hydraulic head measured in the piezometer was from 0.8 to 7.4 ft als. The artesian flow from the piezometer was fresh. The high hydraulic head in this area may cause construction and maintenance issues during and after creek relocation. Piezometer OD3230 was installed in a wetland area and penetrated muck from 0 to 1 ft bls, silt with little clay from 1 to 5 ft bls, and gravel from 5 to 5.5 ft bls. When installed in November 2021, hydraulic head at the site was 0.40 ft bls and the specific conductance of the groundwater was 713 µS/cm.
The third reach of the FE path (FE3) would be excavated into an area with alluvium, alluvial-fan deposits, and lacustrine fines to a depth of 10 ft bls (figs. 8 and 16). This section of the electrical conductivity profile has the highest values along the proposed path and indicates the sediments are nearly fully saturated and contain brackish groundwater. As discussed in the report section “Groundwater Levels and Specific Conductance,” the source of the salinity may be upward leakage via the partially sealed salt-exploration borehole OD449 (fig. 4). Excavation below the water table would intercept groundwater and provide a continuous source of salinity to the relocated creek.
Piezometer OD3229, which was installed along reach FE3, penetrated silty clay from 0 to 2 ft bls and interbedded gravel and silt from 2 to 10 ft. During 2021–22, hydraulic heads at the site ranged from 0.75 ft als to 0.40 ft bls, and the maximum measured specific conductance of the groundwater was 2,700 µS/cm. Nearby piezometer OD3228 penetrated silty clay from 0 to 2 ft bls and silty water-bearing gravel from 2 to 2.5 ft bls. When installed in November 2021, hydraulic head at the site was above land surface, and the specific conductance of the groundwater was 2,475 µS/cm. Well OD3223 penetrated pebbly silt and clay from 0 to 5 ft bls, silty gravel from 5 to 8 ft bls, silty clay from 8 to 11 ft bls, laminated silt and clay from 11 to 27 ft bls, and very fine sand stringers at depth. The electrical conductivity log shows values (150 mS/m) from 6 to 18 ft bls, indicating the presence of brackish groundwater (fig. 17B). The SPT–N values at the well site indicate that the fines at shallow depths below land surface were soft, those at intermediate depths were stiff to very stiff, and those at the greatest depths were very soft. During 2022–23, the hydraulic head measured in well OD3223, which was screened from 7 to 17 ft bls, ranged from 0.6 to 4.2 ft bls. Maximum specific conductance of groundwater sampled from the well was 3,200 µS/cm. The estimated hydraulic conductivity of the screened sediments was 0.3 ft2/d.
The fourth reach of the FE path (FE4) would be excavated into the southern toe of the Rainbow Creek alluvial fan to a depth of about 10 ft bls (figs. 8 and 16). The electrical conductivity along the reach and shear-wave velocity at seismic line L6 indicates the presence of coarse-grained sediments that overlie lacustrine fines. These alluvial-fan deposits are unsaturated to thinly saturated with freshwater and are denser than the underlying loose lacustrine fines that become denser with depth.
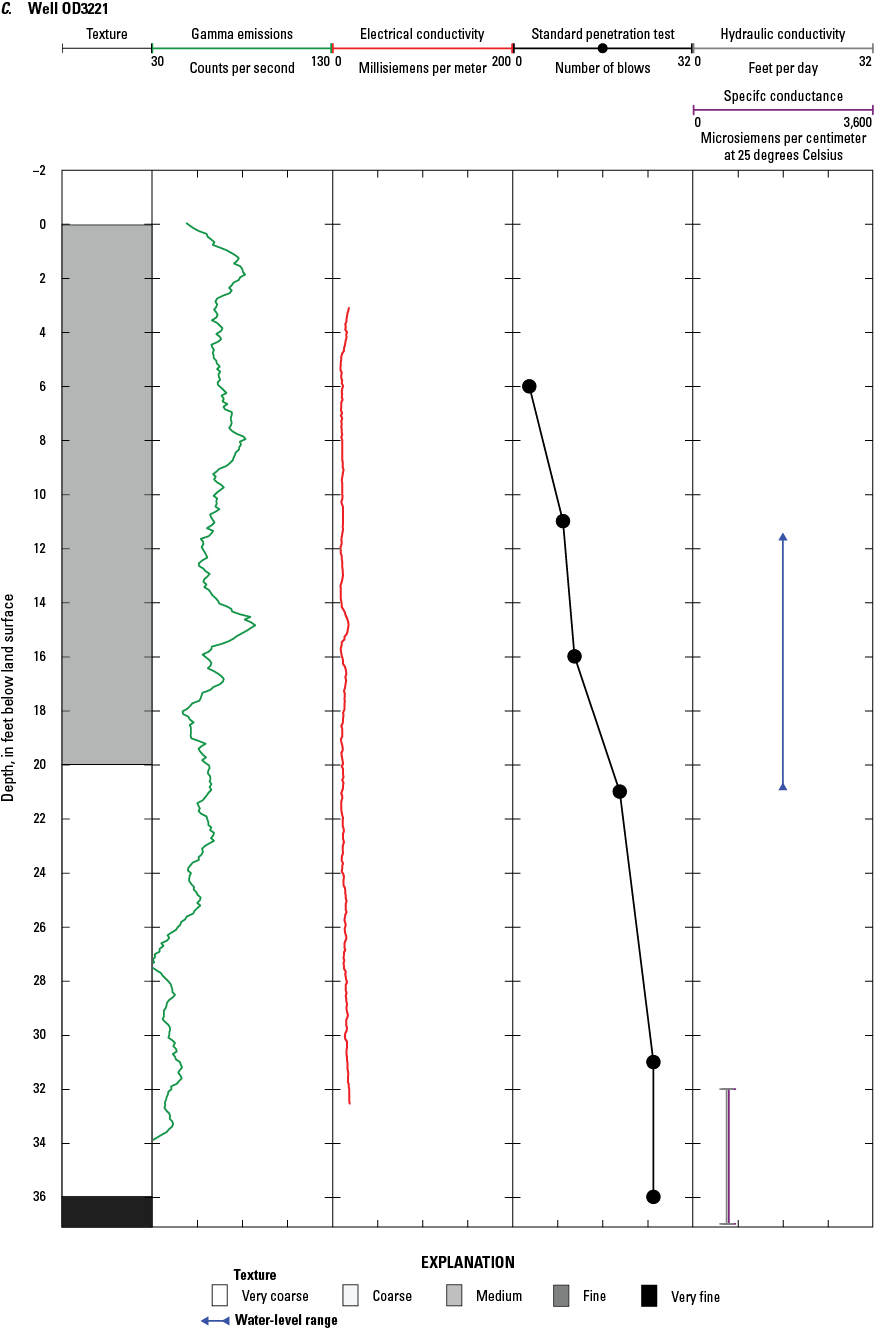
The fifth reach of the FE path (FE5) would be excavated on the southern and northern slopes of the Rainbow Creek alluvial fan to a maximum depth of about 30 ft bls (figs. 8 and 16). The low electrical conductivity along the reach and high shear-wave velocity at seismic lines L7 and L9 indicated the presence of a thick sequence of relatively dense, mostly coarse-grained sediments that are unsaturated to partially saturated with freshwater. Well OD3221 penetrated clayey gravel from 0 to 7 ft bls; gravelly clay with scattered cobbles from 7 to 20 ft bls; sand, gravel, and cobbles from 20 to 36 ft bls; and dense silty clay from 36 to 37 ft bls. Sieve analysis of the split-spoon sample from 30 to 32 ft bls indicates that the sediment was a silty sand with gravel consisting of 13 percent coarse gravel, 25.4 percent fine gravel, 9.5 percent coarse sand, 15 percent medium sand, 16.1 percent fine sand, 14.9 percent silt, and 6.1 percent clay (table 2). These results are consistent with the coarse-grained nature of the alluvial-fan deposits and their observed low electrical conductivity and high shear-wave velocity The SPT–N values at the well site indicate that sediment density increased with depth from very loose to compact (fig. 17C). During 2022–23, the hydraulic head measured in the well, which was screened from 32 to 37 ft bls, ranged from 11.6 to 20.9 ft bls. During 1996–98, the hydraulic head measured in well OD 400, 420 ft upgradient from well OD3221, fluctuated almost 30 ft and rose to within 6 ft of land surface at its highest. Maximum specific conductance of groundwater sampled from well OD3221 was 720 µS/cm, which is consistent with observed electrical conductivity values. The estimated hydraulic conductivity of the screened sediments was 6 ft2/d.
Table 2.
Laboratory analysis of sediment moisture content and compressive strength or grain size for sediment sampled from selected depths at wells OD3219, OD3221, and OD3226 and test pits OD1998 and OD1999 in the Tully Valley, Onondaga County, New York.[Data from Terry and others (2026). Locations of wells and test pits shown on figure 4. Dates shown as month/day/year. ft NAVD 88, foot above North American Vertical Datum of 1988; ft bls, foot below land surface; MC, moisture content; %, percent; CS, compressive strength; lb/ft2, pound per square foot; —, no data]
Channel excavation along FE5 below the water table in the Rainbow Creek alluvial-fan deposits would intercept groundwater and make the constructed streambank susceptible to seepage-induced slope instability. The substantial water-level fluctuation in the alluvial sediments would aggravate stability conditions.
The sixth reach of the FE path (FE6) would be excavated into the northern toe of the alluvial fan and floodplain of Onondaga Creek to a depth of 5 to 10 ft bls. The electrical conductivity along the reach and shear-wave velocity at seismic line L11 indicates that the alluvial-fan deposits and alluvium are unsaturated to partially saturated with freshwater and underlain by soft lacustrine fines that become denser with depth. Well OD418 penetrated fine to medium sand from 0 to 4 ft bls, red and gray clay and silt from 4 to 30 ft bls, and massive red clay from 30 to 50 ft bls.
Near East Path
The line of the NE path starts in the Onondaga Creek floodplain at an altitude of 565 ft, crosses the toe and lower slope of the Rainbow Creek alluvial fan and reaches an altitude of 578 ft, and crosses the lower slope and toe and descending back to the creek floodplain to an altitude of 547 ft (fig. 13).
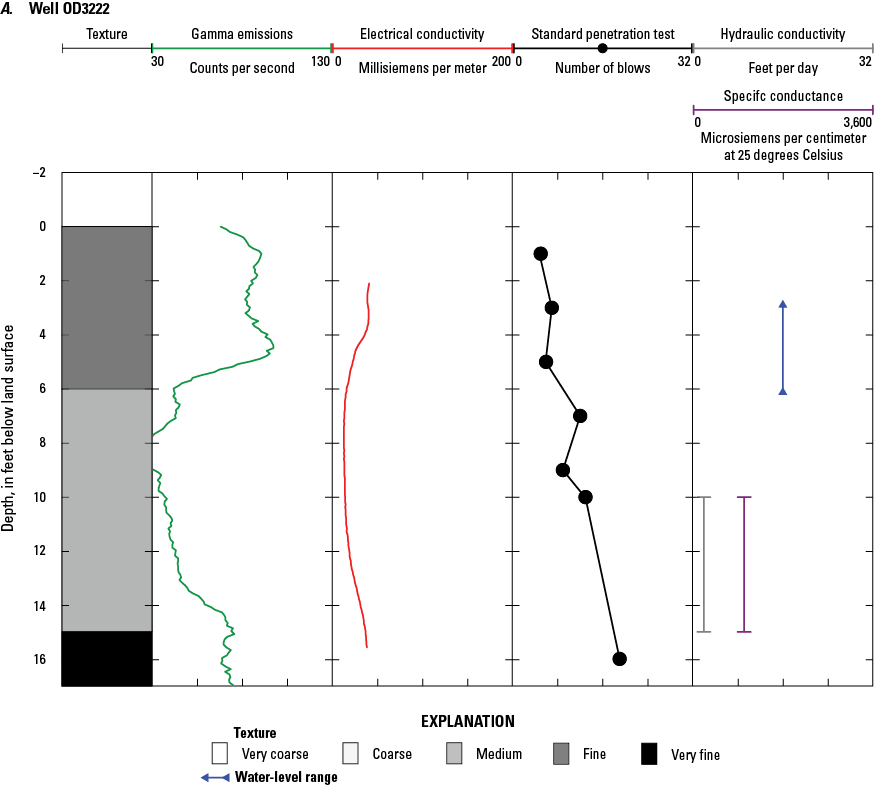
The first reach of the NE path (NE1) would be excavated into floodplain alluvium and lacustrine fines to a depth of about 5 ft bls (figs. 8 and 18). The electrical conductivity along the reach indicates that the alluvium was less than 5 ft thick, unsaturated to partially saturated, and underlain by lacustrine fines. Although the NE1 skirts the suspected mudboil area just southeast of the mudboil corridor, the electrical conductivity did not indicate brackish water (fig. 6). The shear-wave velocity at seismic lines L4 and L6 indicates that the lacustrine fines were soft at shallow depths but more compact with depth. A stream-cut exposure near NE1 shows alluvium consisting of channel sand and gravel with a buried log overlain by overbank fines (figs. 4 and 19). Well OD3222 penetrated silty clay from 0 to 6 ft bls, sandy and gravelly clay with cobbles from 6 to 15 ft bls, and laminated silt and clay from 15 to 17 ft bls. The SPT–N values at the well site indicate that the sediments were stiffer with depth (fig. 20A). During 2022–23, the hydraulic head measured in well OD3222, which was screened from 10 to 15 ft bls, ranged from 2.9 ft to 6.1 ft bls. Maximum specific conductance of groundwater sampled from the well was 1,030 µS/cm. The specific conductance may be due to infiltration of road-salt and (or) agricultural runoff. The estimated hydraulic conductivity of the screened sediments was 2 ft2/d.
Graph of shallow hydrogeologic section NE–NE' along proposed near east creek-relocation path showing electrical conductivity, shear-wave velocity, lithologic texture, and highest and lowest measured water levels in the Tully Valley, Onondaga County, New York. Data from Terry and others (2026) and U.S. Geological Survey (2024b). (Location of section trace shown on fig. 14.)
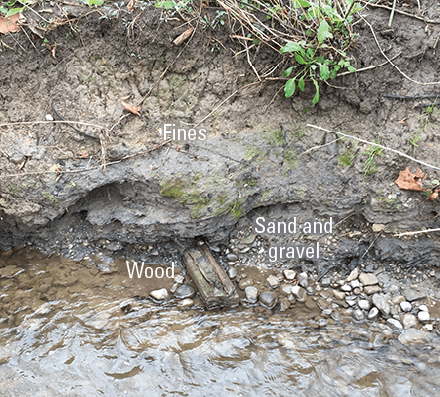
Photograph showing stream cut that exposes channel sand and gravel with buried log overlain by overbank fines. Log sticks out about 1 foot from the sediment. Photograph by John H. Williams, U.S. Geological Survey. (Location of exposure shown on figs. 4 and 15.)
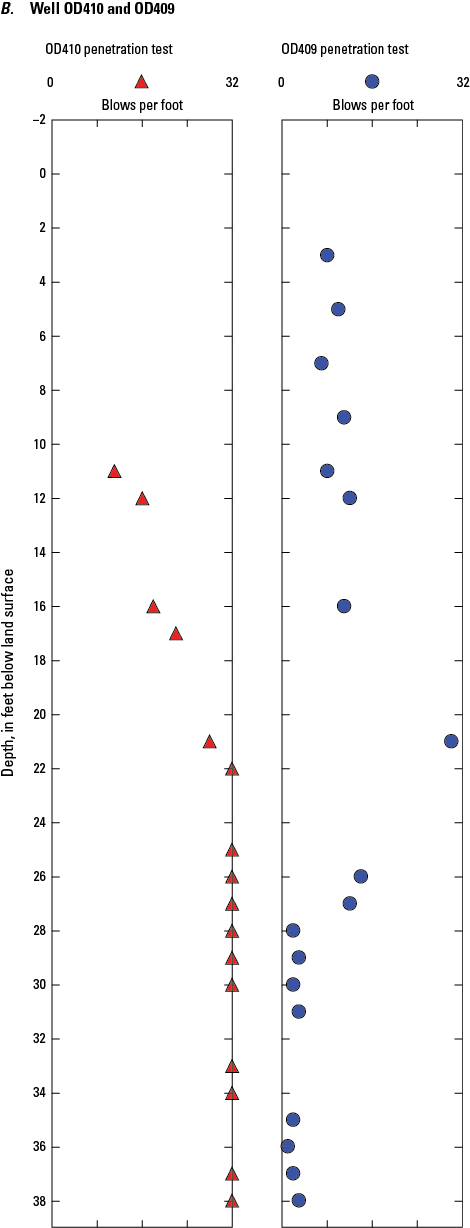
Graph showing electrical conductivity, gamma, sediment-texture, and penetration logs, estimated hydraulic conductivity, highest and lowest measured water levels, and specific conductance of groundwater for wells A, OD3222 B, OD410 and OD409, and C, OD3220 in the Tully Valley, Onondaga County, New York. Data from Terry and others (2026) and U.S. Geological Survey (2024a, b). (Location of wells shown on fig. 4.)
The second reach of the near east path (NE2) would be excavated into the southern toe of the alluvial fan to a depth of 5 to 15 ft bls (fig. 8). The electrical conductivity along the reach indicates the presence of coarse-grained sediments that overlie lacustrine fines. These alluvial-fan deposits are unsaturated to thinly saturated with freshwater.
The third reach of the NE path (NE3) would be excavated into the southern slope, crown, and northern slope of the Rainbow Creek alluvial fan to a maximum depth of 30 ft bls. The electrical conductivity along the reach and shear-wave velocity at seismic line L7 indicate the presence of a thick sequence of relatively dense, coarse-grained sediments that are unsaturated to partially saturated with freshwater. The penetrated lithologies, penetration results, and groundwater conditions monitored at well OD3221 were described in the report section “Far East” (refer to FE5). Well OD410 penetrated road fill from 0 to 6 ft bls, sand with black organics from 6 to 8 ft bls, brown sandy gravel from 8 to 22 ft bls, silty sand and gravel with possibly some red clay layers from 22 to 26 ft bls, and brown silty sand with some gravel from 26 to 42 ft bls. The hammer-blow counts at the well site indicate that the sediments were compact between 10 and 20 ft of land surface and dense below (fig. 20B). Well OD408 penetrated sand and gravel from 0 to 52 ft bls and varved silt and clay from 52 to 55 ft bls. During 1995–2008, water levels measured in 38-ft deep well OD408 generally were between 15 to 25 ft bls. A water-level high for the well of 4.5 ft bls was measured in January 1995.
The fourth reach of the NE path (NE4) would be excavated into the toe of the Rainbow Creek alluvial fan and the Onondaga Creek floodplain to a depth of 5–10 ft bls (figs. 8 and 18). The electrical conductivity along the reach indicates that the alluvial-fan deposits and alluvium are partially saturated with freshwater. Although NE4 skirts the northeastern suspected mudboil area, the electrical conductivity gives no indication of salinity (fig. 6). Well OD409 penetrated sandy, silty, and clayey gravel from 0 to 32 ft bls and massive red clay from 32 to 69 ft bls. Well OD3220 penetrated sandy silt with some gravel and cobbles from 0 to 8 ft bls, sandy gravel from 8 to 9 ft bls, silty clay from 9 to 11 ft bls, and silty gravel with some sand and few cobbles from 11 to 22 ft bls. The hammer-blow counts and SPT–N values at the well sites indicate that the sediments were medium stiff above 15 ft bls, compact at 20 ft bls, and loose and soft below 28 ft bls (fig. 20B and C). These loose and soft sediments would provide an excavation and slope-stability challenge if they extend under the floodplain at a shallow depth.
Near West Path
The line of the NW path starts in the Onondaga Creek floodplain at an altitude of 565 ft, ascends upslope to a local high of an altitude of 580 ft, descends downslope to an altitude of 570 ft in the wetlands bordering the Main Mudboil Area, crosses the toe of the Rattlesnake Gulf creek alluvial fan, reaches an altitude of 580 ft, and descends across the mudboil corridor to the Onondaga Creek floodplain at an altitude of 547 ft (fig. 13 and 21).
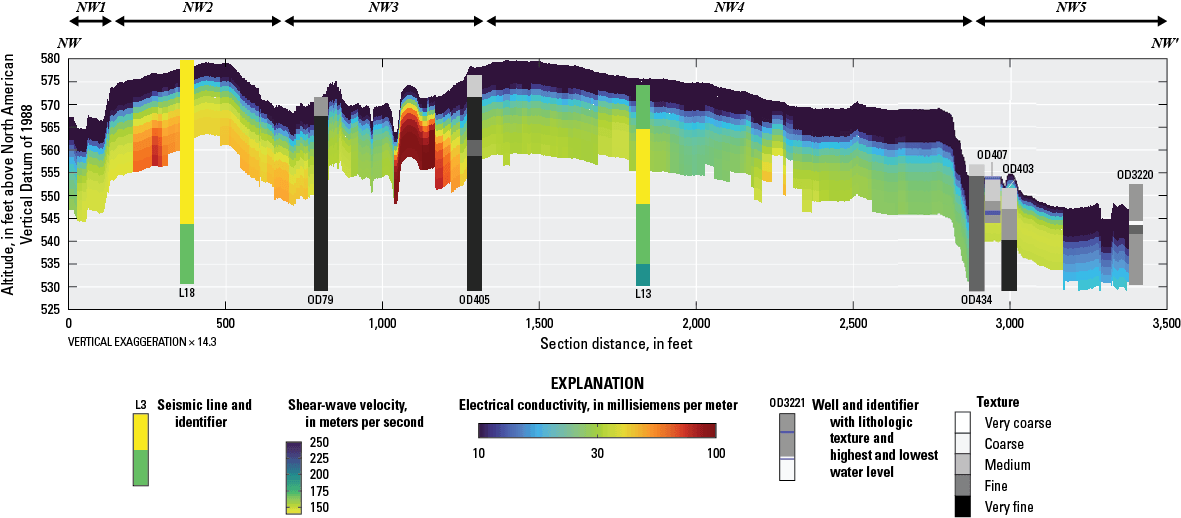
Graph of shallow hydrogeologic section NW–NW' along proposed near west creek-relocation path showing electrical conductivity, shear-wave velocity, lithologic texture, and highest and lowest measured water levels in the Tully Valley, Onondaga County, New York. Data from Terry and others (2026) and U.S. Geological Survey (2024a, b). (Location of section trace shown on fig. 14.)
The first reach of the NW path (NW1) would be excavated in floodplain alluvium to a depth of about 5 ft bls (fig. 8). The electrical conductivity profile indicates that the alluvium is partially saturated with freshwater, thins to the west, and is underlain by lacustrine fines. The second reach of the NW path (NW2) would be excavated in lacustrine fines to a depth of 5 to 10 ft bls. The electrical conductivity profile and shear-wave velocity at seismic line L18 indicates the lacustrine fines would be saturated and loose. The electrical conductivity measured in this reach is probably related to the pipeline that crosses the path.
The third reach of the NW path (NW3) skirts the Main Mudboil Area and transects a suspected mudboil area (fig. 3); NW3 would be excavated into lacustrine fines and wetland deposits to a depth of 5–15 ft bls. The electrical conductivity profile indicates the presence of brackish groundwater. Salinity is likely associated with the presence of brackish water discharged from mudboils. Excavation below the water table would intercept groundwater and provide a continuous source of salinity to the relocated creek. Wells OD79, OD412, OD405, and OD406 all penetrated 5 ft or less of sand and gravel over thick lacustrine fines. Penetration logs of wells OD405, OD406, and OD412 indicate that the lacustrine fines were very soft below a depth of 13 ft bls (fig. 22A). These very soft sediments would provide a challenge to excavation and maintenance of slope stability.
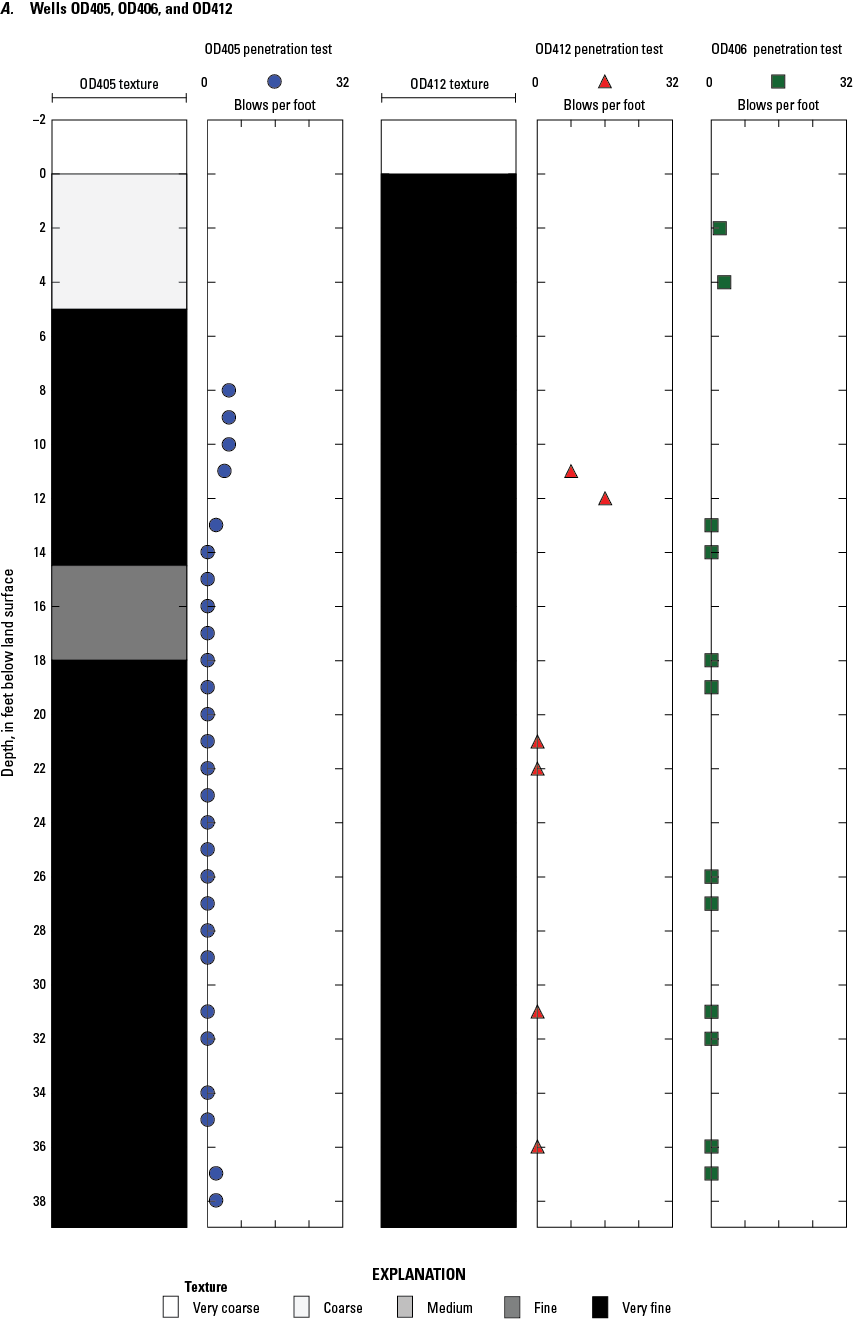
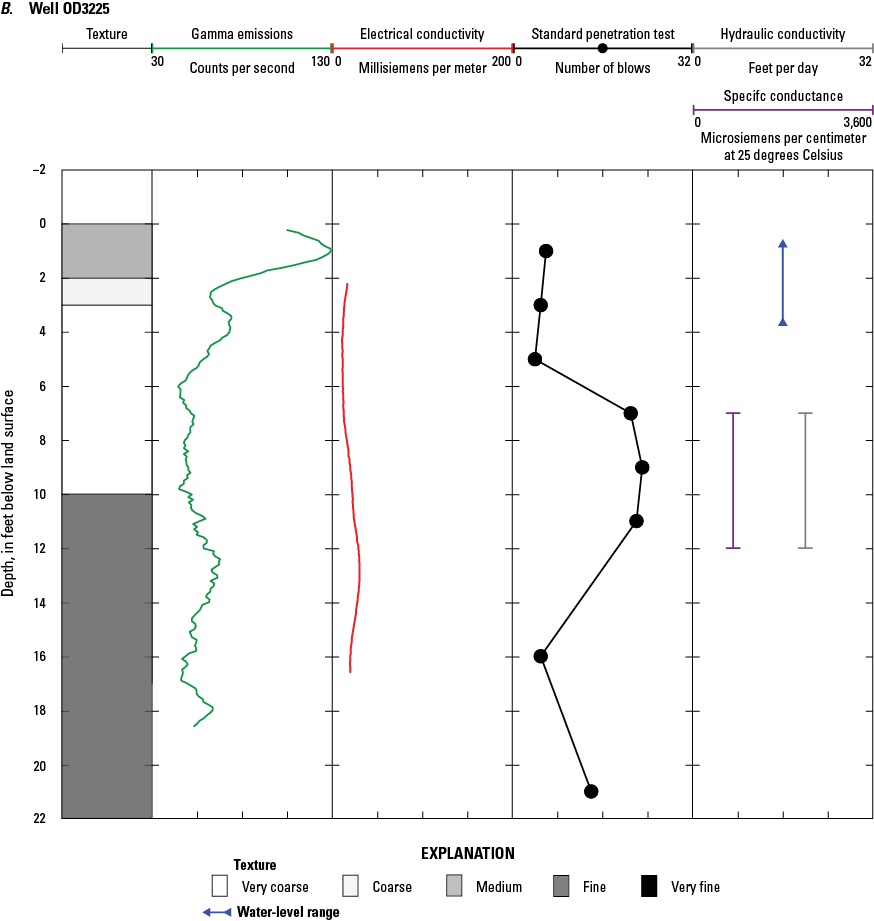
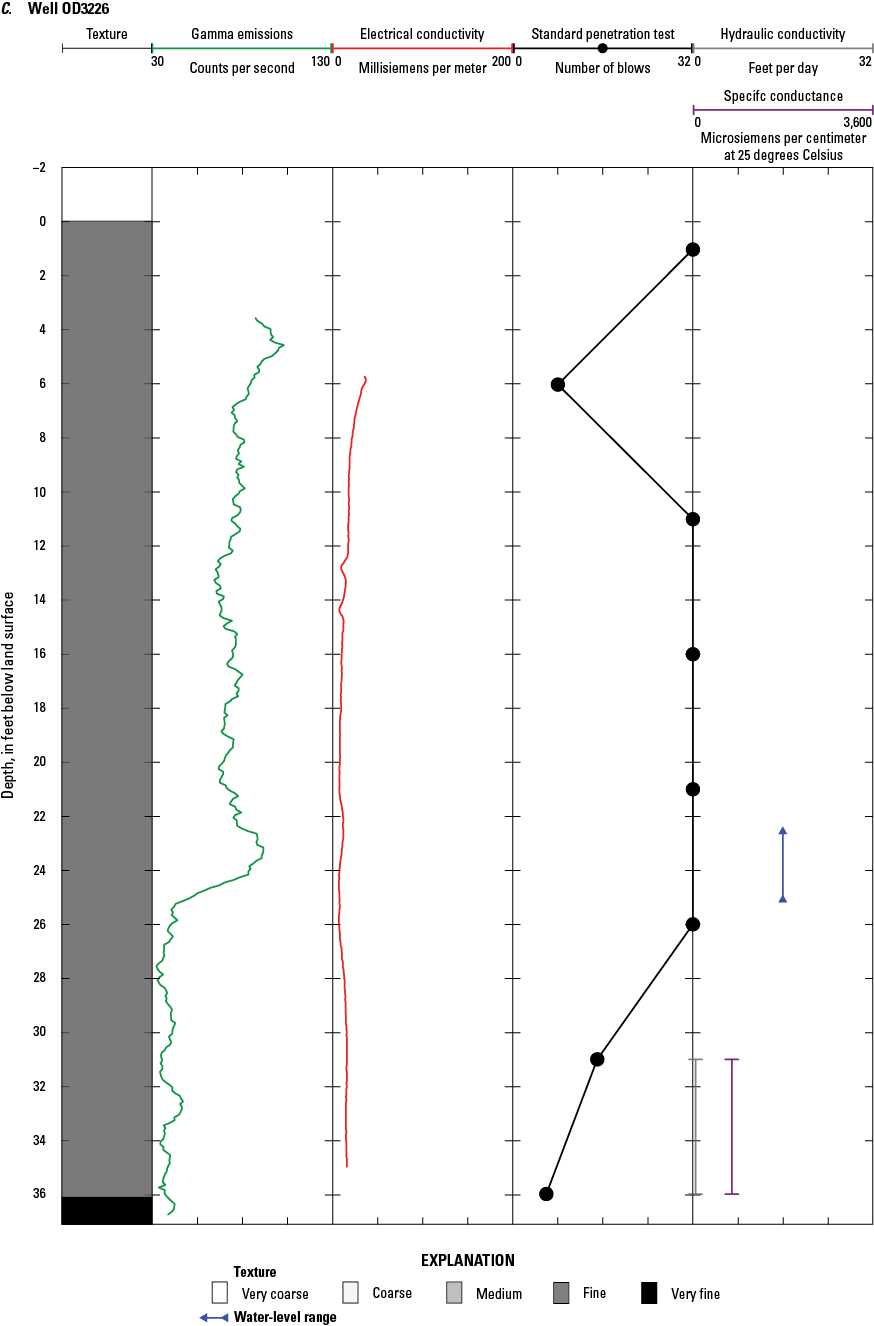
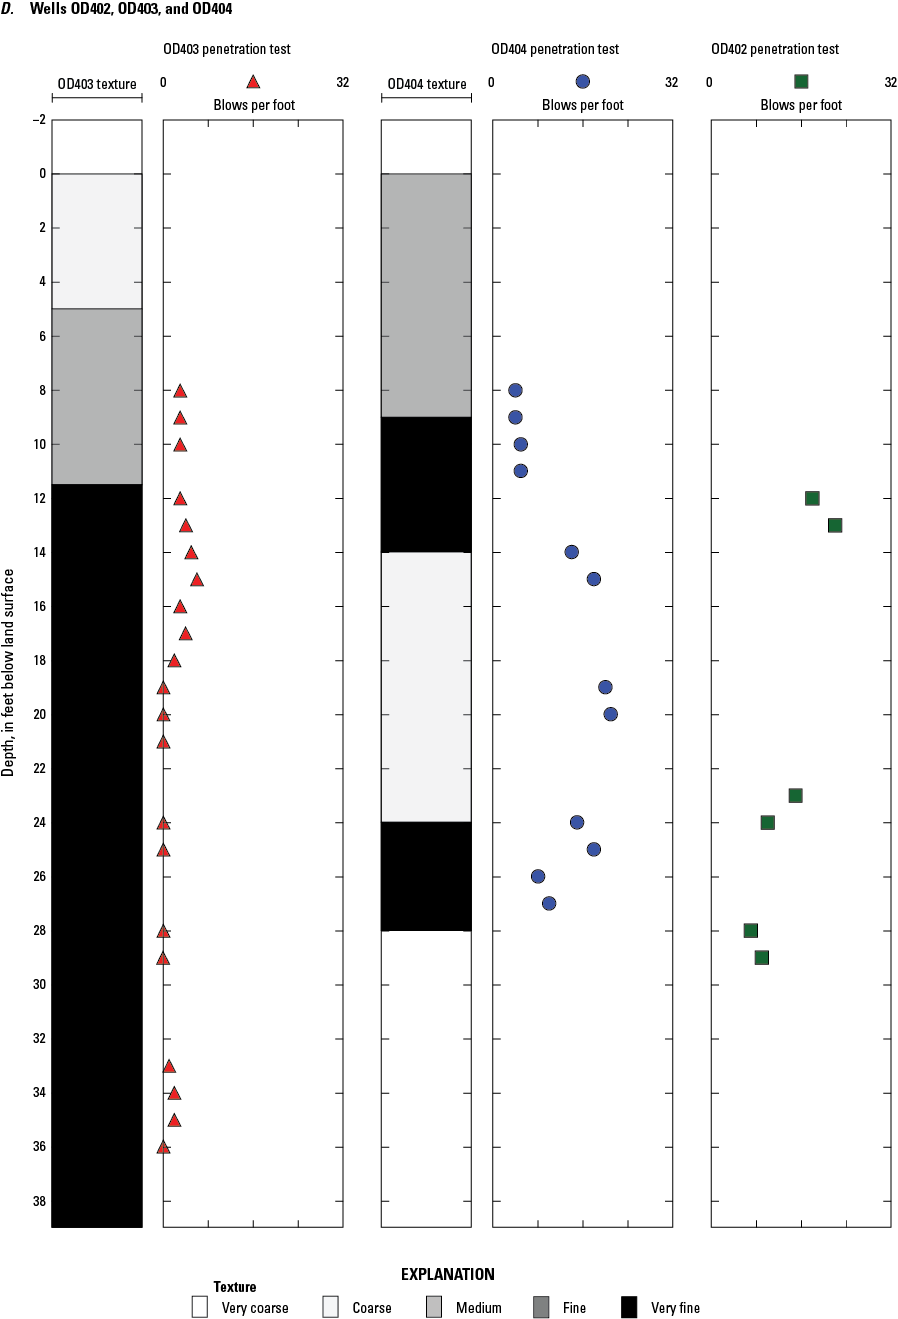
Graphs showing electrical conductivity, gamma, sediment-texture, and penetration logs; estimated hydraulic conductivity; highest and lowest measured water level; and specific conductance of groundwater for wells A, OD405, OD406, and OD412; B, OD3225; C, OD3226; and D, OD403 and OD404 in the Tully Valley, Onondaga County, New York. Data from Terry and others (2026) and U.S. Geological Survey (2024a, b). (Locations of wells shown on figure 4.)
The fourth reach of the NW path (NW4) would be excavated into the toe of the Rattlesnake Gulf alluvial fan to a maximum depth of about 20 ft bls. The electrical conductivity profile and shear-wave velocity at seismic line L13 indicate the presence of about 10 ft of thinly saturated alluvial-fan deposits over loose lacustrine fines that become denser with depth. The localized anonymously high electrical conductivity is probably related to the pipeline that crosses the path and not due to the presence of brackish groundwater.
The fifth reach of the NW path (NW5) would be excavated in mudboil-corridor sediments and floodplain alluvium to a depth of 5 to 10 ft bls (fig. 8 and 21). The electrical conductivity along the reach indicates the presence of nearly fully saturated fine-grained sediments in the mudboil corridor and partially saturated alluvium in the floodplain. In the mudboil corridor, well OD434 penetrated fill from 0 to 3 ft bls; gray and red silt with some sand from 3 to 9 ft bls; mudboil-type sediments (auger flights sunk under their own weight during drilling) from 9 to 15 ft bls; soft red and gray laminated fines from 15 to 46 ft bls; and soft red and gray laminated fines with greater density and thicker laminations from 46 to 71 ft bls. The penetration log of well OD403 indicates that the sediments were soft from 6 to 18 ft bls and very soft from 18 to 48 ft bls (fig. 22D). The soft to very soft mudboil-type sediments would provide an excavation and slope stability challenge. During 1995–2010, water levels measured in 10-ft deep well OD407 generally were 2 to 4 ft bls. A water-level high for the well of 0.1 ft als was measured in June 1995. The lithology and SPT–N values of the alluvium penetrated at well OD3220 were described in the report section “Near East Path” (refer to NE4).
Far West Path
The line of the FW path starts in the Onondaga Creek floodplain at an altitude of 570 ft, ascends upslope to a local high of an altitude of 590 ft, descends downslope to an altitude of 580 ft in the floodplain of the tributary stream that flows into the Main Mudboil Area, ascends upslope and crosses the lower slope of the Rattlesnake Gulf alluvial fan to an altitude of 590 ft, and descends across the toe of the fan and to the Onondaga Creek floodplain at an altitude of 540 ft (fig. 13).
The first reach of the FW path (FW1) would be excavated into floodplain alluvium to a depth of about 5 ft bls (figs. 8 and 23). The electrical conductivity along the reach indicates that the alluvial deposits are thin, consist of coarse- and fine-grained sediments that are partially to fully saturated with freshwater, and are underlain by lacustrine fines (fig. 20). The penetrated lithologies, penetration logs, and groundwater conditions at wells OD411 and OD3224 were described in the report section “Far East Path” (refer to FE1).
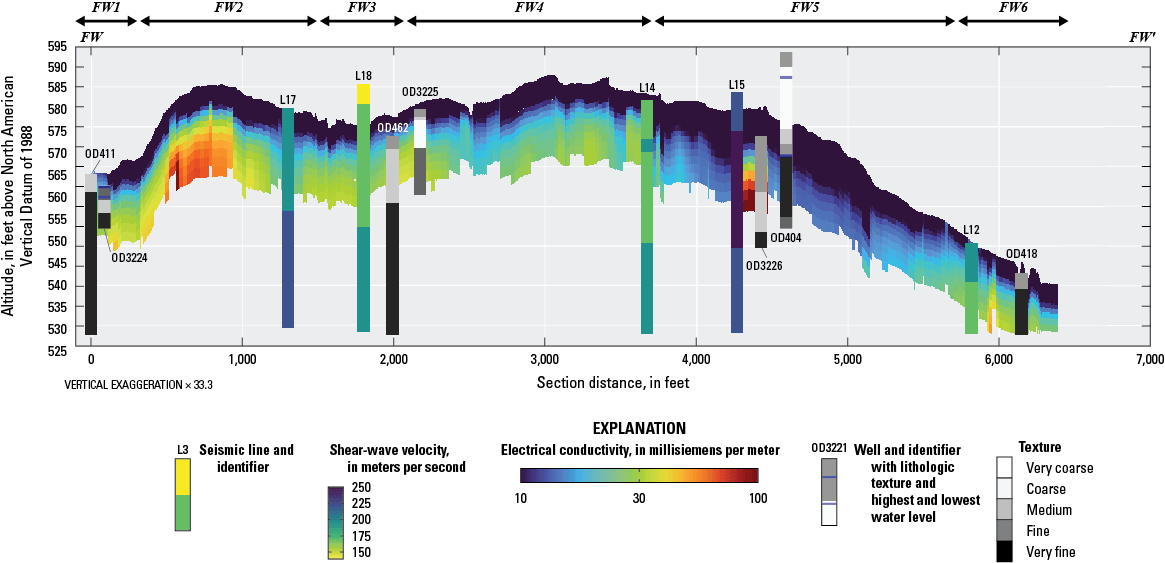
Graph of shallow hydrogeologic section FW–FW' along proposed far west creek-relocation path showing electrical conductivity, shear-wave velocity, lithologic texture, and highest and lowest measured water levels in the Tully Valley, Onondaga County, New York. Data from Terry and others (2026) and U.S. Geological Survey (2024a, b). (Location of section trace shown on figure 14.)
The second reach of the FW path (FW2) would be excavated in alluvial-fan sand and gravel and lacustrine fines to a depth of 25 ft bls (fig. 8). The electrical conductivity profile and shear-wave velocity at seismic line L17 indicate as much as 20 ft of partially saturated, coarse-grained sediment (fig. 20). The electrical conductivity in this reach is probably related to the pipeline and not the presence of brackish groundwater. The third section of the FW path (FW3) would be excavated in alluvium and lacustrine fines to a depth of about 20 ft bls, and the fourth (FW4) would be excavated in alluvial-fan and lacustrine fines to a depth of about 30 ft bls (fig. 8). The electrical conductivity profile and shear-wave velocity at seismic lines L18 and L14 indicate a similar framework along FW3 and FW4 as present along FW2. Well OD462 penetrated 20 ft of sand and gravel above red and gray clay and silt. Well OD3225 penetrated silty sand from 0 to 2 ft bls; wet medium to coarse sand with some pebbles from 2 to 10 ft bls; and red and gray clay with silty and sandy partings from 10 to 22 ft bls. The SPT–N values at the well site indicate the sediments were soft and loose in the upper 5 ft, compact from 8 to 12 ft bls, soft at 16 ft bls, and stiff at 20 ft bls (fig. 22B). During 2022–23, the water level measured in the well, which was screened from 7 to 12 ft bls, ranged from 0.7 ft to 3.7 ft bls. Maximum specific conductance of groundwater sampled from the well was 810 µS/cm. The estimated hydraulic conductivity of the screened sediments at well OD3225 was 20 ft2/d, the second highest of the estimated values for the wells.
The fifth reach of the FW path (FW5) would be excavated into Rattlesnake Gulf alluvial-fan deposits to a depth of 10 to 20 ft bls (figs. 8 and 23). The electrical conductivity along the reach and shear-wave velocity at seismic line L15 indicates the alluvial-fan deposits are partially saturated with fresh water and consist of primarily coarse-grained sediments. The localized anomalously high electrical conductivity in this section is probably related to the pipeline and not the presence of brackish groundwater. Well OD404, located about 470 ft east and 10 ft downslope of FW5, penetrated gravelly loam from 0 to 9 ft bls; clay from 9 to 14 ft bls; sand and gravel from 14 to 24 ft bls; red clay from 24 to 26 ft bls; and clay from 26 to 28 ft bls. The penetration log at the well site indicates that the sediments increased in stiffness with depth (fig. 22D). Wells OD401 and OD402, located about 650 ft west of and 14 ft higher than FW5, penetrated gravelly silt loam from 0 to 4 ft bls; gravel from 4 to 20 ft bls; pebbly sand from 20 to 24 ft bls; sand from 24 to 27 ft bls; interbedded sand and red clay from 27 to 43 ft bls; and “heaving” sand from 43 to 50 ft bls. “Heaving” sand is fine sand that flows into the augers under artesian pressure (Hackett, 1987). Nearby well OD3226 penetrated sand and gravel with clay and some cobbles from 0 to 20 ft bls; sand and gravel with clay, some cobbles, and sand and silt beds from 20 to 36 ft bls; and silty clay from 36 to 37 ft bls. Sieve analysis of the split-spoon sample from 30 to 32 ft bls indicates that the sediment was a silty sand with clay consisting of 3.9 percent fine gravel, 5.4 percent coarse sand, 14.6 percent medium sand, 28.5 percent fine sand, 34.5 percent silt, and 13.1 percent clay (table 2). The penetration logs at wells OD402 and OD3226 indicate the sediments were soft to very soft below a depth of 35 ft (fig. 22C and D). During 2022–23, the water level measured in well OD3226, which was screened from 31 to 36 ft bls, ranged from 22.5 to 25.0 ft bls. During 1996–2009, the hydraulic heads measured in 23-ft deep well OD404 and 40-ft deep well OD401 fluctuated more than 15 ft and rose to within 7 ft of land surface. Maximum specific conductance of groundwater sampled from the well OD3226 was 780 µS/cm, and the estimated hydraulic conductivity of the screened sediments was 0.5 ft2/d.
Channel excavation along FW4 and FW5 below the water table in the Rattlesnake Gulf alluvial-fan deposits would intercept groundwater and make the constructed streambank susceptible to seepage-induced slope instability. The substantial water-level fluctuation would aggravate the stability condition. In addition, excavation along FE5 would have the potential of intercepting groundwater that currently discharges to water-supply springs at the toe of the Rattlesnake Gulf alluvial fan just north of Otisco Road and west of Onondaga Creek (fig. 4).
The sixth reach of the FW path (FW6) crosses the toe of the Rattlesnake Gulf alluvial fan and Onondaga Creek floodplain and would be excavated into fan and floodplain alluvium and lacustrine fines to a depth of 5 to 10 ft bls (figs. 8 and 23). The electrical conductivity along the reach and shear-wave velocity at seismic line L12 indicates that the alluvium is partially saturated with fresh water and consists of coarse- and fine-grained sediments. The observed electrical conductivity in this section is probably related to the pipeline and not the presence of brackish groundwater. Well OD418 penetrated fine to medium sand from 0 to 4 ft bls; red and gray clay and silt from 4 to 30 ft bls; and massive red clay from 30 to 50 ft bls.
Proposed Offline Settling Basin Area
The proposed offline settling basin area is in the northern part of the Rattlesnake Gulf alluvial fan and would be about 4,500 ft long and 1,300 ft wide (figs. 2 and 8). The center of this rectangular area is about 3,300 ft north of Otisco Road, 1,700 ft south of Nichols Road, 1,700 ft east of Tully Farms Road, and 1,600 ft west of Onondaga Creek and New York State Route 11A. The southeastern corner of the area is about 1,500 ft north of the mudboil corridor and 500 ft west of where Rattlesnake Gulf and Rainbow Creek flow into Onondaga Creek.
Natural and human-made diversions of Rattlesnake Gulf have resulted in saturated conditions in the general area of the proposed offline settling basin (fig. 24). The Rattlesnake Gulf channel has aggraded during flooding raising the channel about 3 ft and causing the creek to flow off the aggraded channel to the south and north. The northern diversion flows along the southern and then eastern edge of a farm field and flows north to the area of the proposed settling basins. A human-made diversion of this flow channels the water toward Onondaga Creek just north of the proposed basin area, but varied topography allows some of the water to flow in an easterly direction across this area prior to this diversion. A recent attempt to rechannel Rattlesnake Gulf creek on the valley floor might help reduce the formerly diverted flow from the creek, but the aggradation process will likely continue with sand and gravel infilling the channel, and the flow returning to the north and south diversion channels unless the newly excavated channel is maintained.
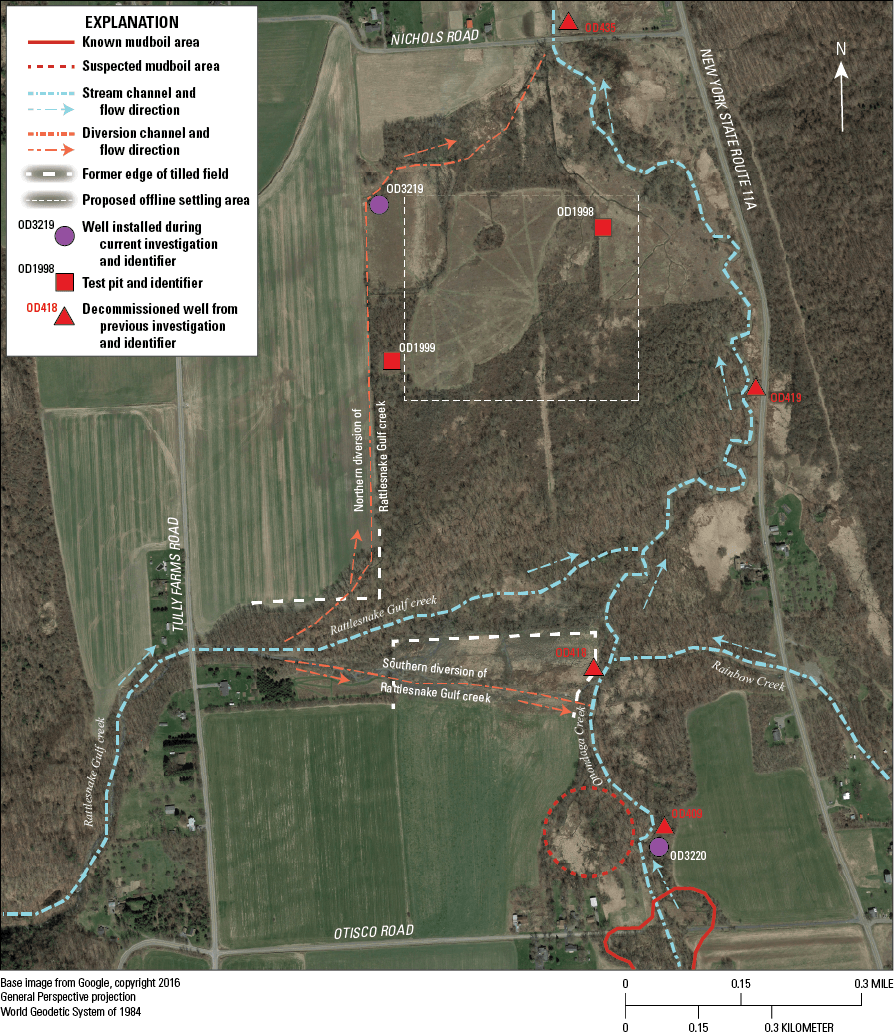
Map showing natural and human-made diversions of Rattlesnake Gulf creek and selected features in the offline settling basin investigation area in the Tully Valley, Onondaga County, New York. Data from Mudboil Alternative Design Team (2021).
The proposed offline settling basin would be excavated in, and the berms would be constructed on, alluvial-fan deposits and lacustrine fines. The electrical conductivity profile indicates that alluvial deposits are thick and saturated with freshwater below about 10 ft bls near Nichols Road (fig. 25). To the northeast of the section by Nichols Road, well OD435 penetrated brown alluvial gravel from 0 to 30 ft bls and massive red clay grading to silt from 30 to 104 ft bls. Eight split-spoon samples of the lacustrine fines collected from 30 to 46.9 ft bls had moisture contents from 26.8 to 44.6 percent, liquid limits from 28.8 to 45.3 percent, plastic limits from 16.2 to 27.4 percent, plasticity indexes from 10.5 to 23.4, and liquidity indexes from 0.8 to 1.2 (table 3).
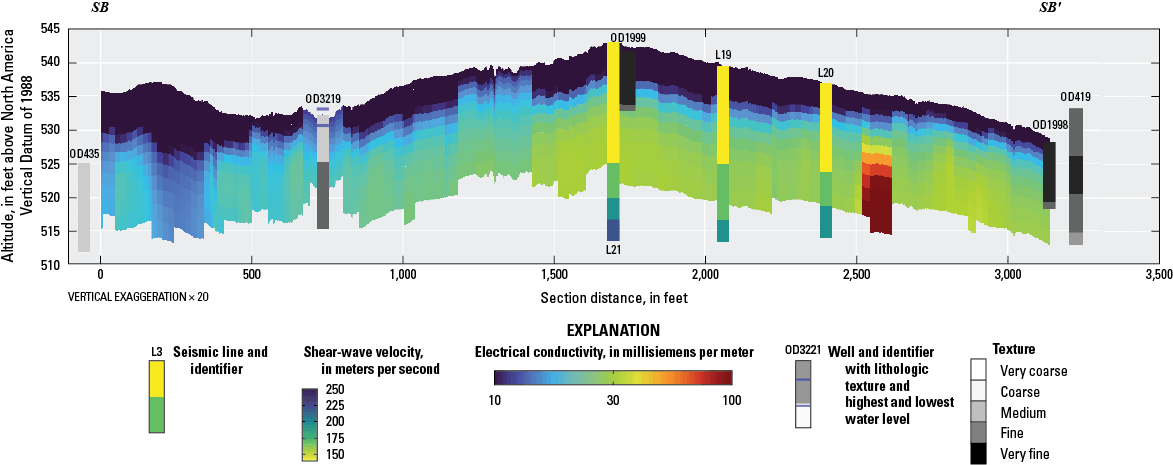
Graph of shallow hydrogeologic section SB–SB' of the proposed offline settling basin area showing electrical conductivity, shear-wave velocity, lithologic texture, and highest and lowest measured water levels in the Tully Valley, Onondaga County, New York. Data from Terry and others (2026) and U.S. Geological Survey (2024b). (Location of section shown on fig. 14.)
Table 3.
Laboratory analysis of sediment moisture content and Atterberg Limits for sediment sampled from selected depths at wells OD435 and test pits OD1998 and OD1999 in the Tully Valley, Onondaga County, New York.[Data from Terry and others (2026). Additional well site information from U.S. Geological Survey (2024b). Location of wells and test pits shown on figure 4. Dates shown as month/day/year. ft NVGD 88, foot above North American Vertical Datum of 1988; ft bls, foot below land surface; %, percent; —, no data]
The thickness of the alluvial deposits decreases to the south, and at the northern border of the proposed area, there is less than 10 ft of sand and gravel overlying the lacustrine fines. Well OD3219 at the northwestern corner of the proposed area penetrated sand and gravel with silt from 0 to 7 ft bls; silt with many sand stringers from 7 to 10 ft bls; and massive silt with some sand and gravel stringers from 10 to 17 ft bls. The SPT–N values at the well site indicate that the lacustrine fines were soft to very soft (fig. 26). The unconfined compressive strength of the sediments at 12.5 to 14 ft bls was 481.5 lb/ft2 and that at 14.5 to 16 ft bls was 905.7 lb/ft2 indicating very soft to soft soils. During 2022–23, the hydraulic head measured in the well, which was screened from 2 to 7 ft bls, ranged from 0.9 ft als to 1.5 bls. Maximum specific conductance of groundwater sampled from the well was 680 µS/cm. The estimated hydraulic conductivity of the screened sediments was 10 ft2/d.
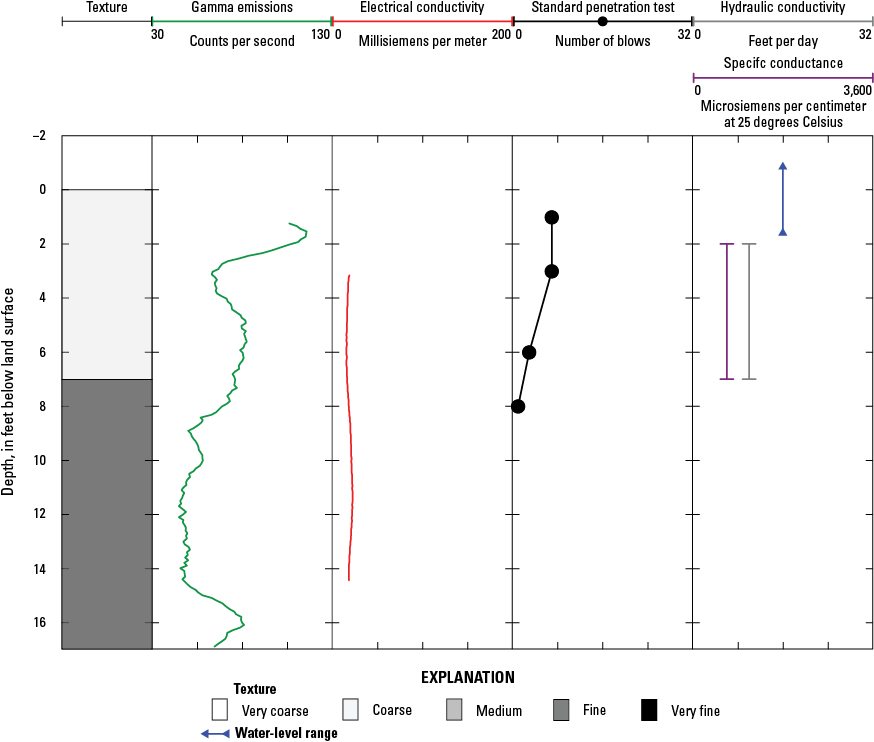
Graph of electrical conductivity, gamma, and standard penetration test logs; estimated hydraulic conductivity; highest and lowest measured water levels; and specific conductance of groundwater for well OD3219. Data from Terry and others (2026). (Location shown on fig. 4.)
The electrical conductivity along the western border of the proposed basin indicates that the alluvial deposits become thinner and finer grained between well OD3219 and test pit OD1999, and that the maximum depth to freshwater saturation is about 5 ft bls. Test pit OD1999 was excavated into topsoil from 0 to 2 ft bls; brown silty clay with small pebbles from 2 to 4 ft bls; wet brown silty clay with rounded pebbles and cobbles from 4 to 5 ft bls; gray silty clay from 5 to 7 ft bls; gray silty clay with trace pebbles from 7 to 9 ft bls; and gray clayey silt with very fine to fine sand (appears to be liquefiable) from 9 to 10 ft bls (fig. 27). A grab sample of the lacustrine fines from 5.5 ft bls had a moisture content of 52.3 percent, liquid limit of 51 percent, plastic limit of 32 percent, plasticity index of 19, and liquidity index of 1.1 (table 3).
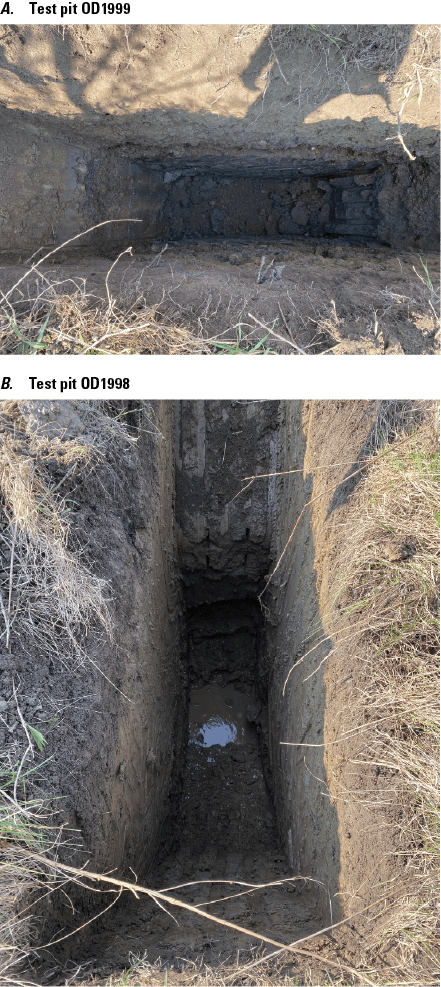
Photographs showing test pits in the proposed offline settling basin area in the Tully Valley, Onondaga County, New York: A, contact between brown silty clay with pebbles and cobbles and gray silty clay at 5 feet (ft) below land surface in test pit OD1999 and B, groundwater seepage pooling in bottom of test pit OD1998. The test pits at their maximum depth (10 ft) were about 3 ft long and 1 ft wide. Photographs by William M. Kappel, U.S. Geological Survey. (Location of test pits shown on fig. 4.)
The electrical conductivity along the middle part of the proposed area from test pit OD1999 to test pit OD1998 indicates (1) the presence of only very thin alluvial deposits, which are primarily fine grained, overlying the lacustrine fines and (2) the depth to freshwater saturation shallows from west to east. The localized electrical conductivity in this section is probably related to the pipeline and not due to the presence of brackish groundwater. Shear-wave velocities determined from seismic lines L21, L19, and L20 are consistent with the fine-grained character of the sediments. Test pit OD1999 was excavated into topsoil from 0 to 1 ft bls; brown clay from 1 to 6 ft bls; saturated gray silty clay and gravel with rounded small pebbles from 6 to 7 ft bls; gray silty clay with trace pebbles from 7 to 9 ft bls; and gray clayey silt with very fine to fine sand (appears liquefiable) from 9 to 10 ft bls (fig. 25). Grab samples of the fines from 2.5 ft bls had a moisture content of 17.5 percent, liquid limit of 34 percent, plastic limit of 22 percent, and plasticity index of 12. Well OD419 near New York State Route 11A penetrated silt from 0 to 7.5 ft bls; clay from 7.5 to 13.5 ft bls; silt from 13.5 to 19.5 ft bls; sand from 19.5 to 25 ft bls; gravel from 25 to 26.5 ft bls; sand from 26.5 to 31.5 ft bls; silt from 31.5 to 36 ft bls; and grayish bedrock from 36 to 42 ft bls. The well was difficult to grout up when it was decommissioned because of flowing artesian conditions.
Excavation, berm construction, and loading of the saturated, soft to very soft deposits underlying the proposed offline settling basin area may be problematic. Soil strengthening may be needed during the construction of the proposed basin.
Summary
Sediment discharge from the Tully Valley mudboils has degraded the water quality of Onondaga Creek. Proposed turbidity mitigation actions presently (2025) being considered include creek relocation and offline sediment settling. The objective of this study was to characterize the shallow hydrogeology along the proposed creek-relocation paths and in the proposed offline settling basin area. This report describes the shallow hydrogeologic framework in the investigation areas for the proposed mitigation actions.
The four proposed creek-relocation paths are the far east, near east, near west, and far west. The far east and near east paths are east of Onondaga Creek: the two near paths are close to the creek, and the two far paths are close to the eastern and western valley walls. Proposed creek relocation channels would be excavated in sediments including muck, alluvium, mudboil deposits, alluvial-fan sand and gravel, and lacustrine fines. Proposed excavations would penetrate partially to fully saturated conditions; generally, the water table is shallow near the creek and deep on the Rainbow Creek and Rattlesnake Gulf alluvial fans. The shallowest excavation, about 5 feet below land surface, would be near Onondaga creek and primarily in alluvium, and the deepest excavation, as much as 30 feet below land surface, would be on the alluvial fans.
The takeoff point for the proposed far east path from Onondaga Creek is coincident with the point where during flooding the creek overtops its banks, resulting in flood waters flowing across the farm field. The proposed far east path takes a more easterly line from the creek takeoff point and would not take advantage of this natural diversion. Excavation of muck and lacustrine fines along the far east path near the circular depression may be challenging. The high artesian head in this area would aggravate potential construction problems.
Brackish waters would be penetrated by proposed channel excavation along the far east path downgradient from a potentially leaking historical salt-exploration borehole and along the near east path where it skirts the Mudboil Depression Area and crosses the adjacent suspected mudboil area. Excavation in these areas would provide a continuous source of brackish groundwater to the relocated creek.
Excavation of muck, soft to very soft lacustrine fines, and mudboil-type sediments along the near west path that skirt the Mudboil Depression Area and that cross the Otisco Road mudboil area and adjacent suspected mudboil areas would pose an excavation and slope stability challenge. Excavation in these areas would have the greatest potential to create new mudboils.
A zone of “heaving” sand (fine sand under artesian pressure) was penetrated in one well at a depth of more than 40 feet below land surface on the Rattlesnake Gulf alluvial fan. Penetration of such a zone elsewhere on either fan within the excavation depth would cause a problem with excavation-wall stability.
Proposed channel excavations below the water table on the Rainbow Creek and Rattlesnake Gulf alluvial fans would intercept groundwater and make the constructed streambank susceptible to seepage-induced slope instability. The substantial water-level fluctuation in the fan sediments would aggravate the stability condition. In addition, excavation on the Rattlesnake Gulf alluvial fan would have the potential of intercepting groundwater that currently discharges to water-supply springs at the toe of the alluvial fan just north of Otisco Road and west of Onondaga Creek.
The proposed offline settling basin area is in the northern part of the Rattlesnake Gulf alluvial fan. Natural and human-made diversions of Rattlesnake Gulf creek have resulted in saturated conditions in the general area of the proposed basin. The proposed offline settling basin would be excavated in, and the berms would be constructed on, alluvial-fan deposits and lacustrine fines. In the proposed basin area, the alluvial deposits overlying the lacustrine fines are less than 10 feet thick. Excavation, berm construction, and loading of the saturated, soft to very soft lacustrine fines may be problematic and require soil strengthening.
References Cited
Andrews, D.C., and Martin, G.R., 2000, Criteria for liquefaction of silty soils—Proceedings of the 12th World Conference on Earthquake Engineering: Upper Hutt, N.Z., New Zealand Society for Earthquake Engineering, accessed October 28, 2024, at https://www.iitk.ac.in/nicee/wcee/article/0312.pdf.
ASTM International, 2015, Standard practice for thin-walled tube sampling of fine-grained soils for geotechnical purposes [ASTM D1587/D1587M-15]: ASTM International, 10 p., accessed October 28, 2024, at https://www.scribd.com/document/738666622/ASTM-d1587-standard-practice-for-thin-walled-tube-sampling-of-fine-grained-soils-for-geotechnical-purpose-pd f-free-0043.
ASTM International, 2016, Standard test method for unconfined compressive strength of cohesive soil [ASTM D2166/D2166M]: ASTM International, 7 p., accessed October 28, 2024, at https://www.astm.org/d2166_d2166m-16.html.
ASTM International, 2017, Standard guide for conducting borehole geophysical logging—Electromagnetic induction [ASTM D6726-01]: ASTM International, 7 p., accessed October 28, 2024, at https://www.astm.org/d6726-01.html.
Bennett, M.J., Noce, T.E., and Lienkaemper, J.J., 2011, Cone penetration tests and soil borings at the Mason Road site in Green Valley, Solano County, California: U.S. Geological Survey Open-File Report 2011–1281, 52 p., accessed October 28, 2024, at https://doi.org/10.3133/ofr20111281.
Bouwer, H., 1989, The Bouwer and Rice slug test—An update: Ground Water, v. 27, no. 3, p. 304–309, accessed October 28, 2024, at https://doi.org/10.1111/j.1745-6584.1989.tb00453.x.
Bouwer, H., and Rice, R.C., 1976, A slug test for determining hydraulic conductivity of unconfined aquifers with completely or partially penetrating wells: Water Resources Research, v. 12, no. 3, p. 423–428, accessed October 28, 2024, at https://doi.org/10.1029/WR012i003p00423.
Bray, J.D., and Sancio, R.B., 2006, Assessment of the liquefaction susceptibility of fine-grained soils: Journal of Geotechnical and Geoenvironmental Engineering, v. 132, no. 9, p. 1165–1177. [Also available at https://doi.org/10.1061/(ASCE)1090-0241(2006)132:9(1165).]
Cornell University Library, 2025, New York State aerial photographs: Cornell University Library database, accessed March 3, 2025, at https://digital.library.cornell.edu/collections/aerialny.
Crow, H.L., Hunter, J.A., Olson, L.C., Pugin, A., and Russell, H., 2017, Borehole geophysical log signatures and stratigraphic assessment in a glacial basin, southern Ontario: Canadian Journal of Earth Sciences, v. 55, no. 7, p. 829–845, accessed October 28, 2024, at https://doi.org/10.1139/cjes-2017-0016.
Cunningham, W.L., and Schalk, C.W., comps., 2011, Groundwater technical procedures of the U.S. Geological Survey: U.S. Geological Survey Techniques and Methods, book 1, chap. A1, 151 p., accessed October 28, 2024, at https://doi.org/10.3133/tm1a1.
Ferris, J.G., Knowles, D.B., Brown, R.H., and Stallman, R.W., 1962, Theory of aquifer tests: U.S. Geological Survey Water-Supply Paper 1536–E, p. 69–174. [Also available at https://doi.org/10.3133/wsp1536E.]
Hackett, G., 1987, Drilling and constructing monitoring wells with hollow-stem augers part 1—Drilling considerations: Ground Water, v. 7, no. 4, p. 51–62, accessed October 28, 2024, at https://doi.org/10.1111/j.1745-6592.1987.tb00963.x.
Hayashi, K., and Suzuki, H., 2004, CMP cross-correlation analysis of multi-channel surface-wave data: Exploration Geophysics, v. 35, no. 1, p.7–13. [Also available at https://doi.org/10.1071/EG04007.]
Hussien, M.N., and Karray, M., 2015, Shear wave velocity as a geotechnical parameter—An overview: Canadian Geotechnical Journal, v. 53, no. 2, p. 252–272, accessed October 28, 2024, at https://doi.org/10.1139/cgj-2014-0524.
Kappel, W.M., 2014, The hydrogeology of the Tully Valley, Onondaga County, New York—An overview of research, 1992–2012: U.S. Geological Survey Open-File Report 2014–1076, 28 p., 3 app., accessed October 28, 2024, at http://doi.org/10.3133/ofr20141076.
Kappel, W.M., and Miller, T.S., 2005, Hydrogeology of the valley-fill aquifer in the Onondaga Trough, Onondaga County, New York: U.S. Geological Survey Scientific Investigations Report 2005–5007, 13 p., accessed October 28, 2024, at https://doi.org/10.3133/sir20055007.
Kappel, W.M., Sherwood, D.A., and Johnston, W.H., 1996, Hydrogeology of the Tully Valley and characterization of mudboil activity, Onondaga County, New York: U.S. Geological Survey Water-Resources Investigations Report 96–4043, 71 p., accessed October 28, 2024, at https://doi.org/10.3133/wri964043.
Lumia, R., 1998, Flood of January 19–20, 1996, in New York State: U.S. Geological Survey Water-Resources Investigations Report 97–4252, 61 p., accessed October 28, 2024, at http://doi.org/10.3133/wri974252.
Meyerhof, G.G., 1956, Penetration tests and the bearing capacity of cohesionless soils: Journal of the Soil Mechanics and Foundations Division, v. 82, no. 1, 866–1 to 866–19. [Also available at https://doi.org/10.1061/JSFEAQ.0000001.]
Midgley, T.L., Fox, G.A., Wilson, G.V., Heeren, D.M., Langendoen, E.J., and Simon, A., 2013, Seepage-induced streambank erosion and instability—In situ constant-head experiments: Journal of Hydrologic Engineering, v. 18, no. 10, p. 1200–1210, accessed October 28, 2024, at https://doi.org/10.1061/(ASCE)HE.1943-5584.0000685.
National Oceanic and Atmospheric Administration, 2024, NOWData—NOAA online weather data [Syracuse Hancock Internation Airport, New York, Global Historical Climatology Network daily, station USW00014771, 2006 through 2020]: National Oceanic and Atmospheric Administration database, accessed June 3, 2024, at https://www.weather.gov/wrh/Climate?wfo=bgm.
New York State Mesonet, 2024, Tully station: New York State Mesonet dataset, accessed March 23, 2024, at http://nysmesonet.org/about/sites#network=nysm&stid=tull.
New York State Museum, 2024, Empire State Organized Geologic Information System database, accessed October 28, 2024, at https://esogis.nysm.nysed.gov/.
Mudboil Alternative Design Team, 2021, Tully Valley mudboil mitigation alternative analysis—Selection criteria and potential actions: Syracuse, N.Y., Onondaga Environmental Institute, prepared by the Mudboil Alternative Design Team, 47 p., accessed October 22, 2025, at https://www.oei2.org/wp-content/uploads/2021/09/01-Mudboil-Alternatives-Analysis-Final-Report.pdf.
O’Kelly, B.C., 2021, Review of recent developments and understanding of Atterberg limits determinations: Geotechnics, v. 1, no. 1, p. 59–75., accessed October 28, 2024, at https://doi.org/10.3390/geotechnics1010004.
Pair, D.L., Backhaus, K.B., and Manchester, J., 2007a, Surficial geology of the Otisco Valley 7.5-minute quadrangle, Cortland and Onondaga Counties, New York: New York State Museum Map and Chart 48, 1:24,000 scale. [Also available at https://www.nysm.nysed.gov/sites/default/files/mc48.1_otiscovalley.pdf.]
Pair, D.L., Backhaus, K.B., and Manchester, J., 2007b, Surficial geology of the South Onondaga 7.5-minute quadrangle, Onondaga County, New York: New York State Museum Map and Chart 47, 1:24,000 scale. [Also available at https://www.nysm.nysed.gov/sites/default/files/mc47.1_southonondaga.pdf.]
Park, C.B., Miller, R.D., and Xia, J., 1999, Multichannel analysis of surface waves: Geophysics, v. 64, no. 3, p. 800–808, accessed October 28, 2024, at https://doi.org/10.1190/1.1444590.
Singh, K., 2020, Unconfined compressive strength test: Civil Engineering Portal website, accessed October 28, 2024, at https://www.engineeringcivil.com/unconfined-compressive-strength-test.html.
Terry, N., Heisig, P., Anderson, A., White, E.A., Woda, J., Glas, R., Demott, L., Lucia, I., Trottier, B., Mason, J., and Williams, J., 2026, Surface-geophysical, geotechnical, hydraulic-slug test, specific conductance, and geospatial data for shallow hydrogeologic investigations of the Tully Valley mudboil area, Onondaga County, New York: U.S. Geological Survey data release, https://doi.org/10.5066/P149P35X.
Tonks, D.M., and Antonopoulos, I.K., 2015, Construction risks on soft ground—Some recent cases, in Ramsey, G., ed., 12th Australia New Zealand Conference on Geomechanics, Wellington, New Zealand, February 22–25, 2015: International Society for Soil Mechanics and Geotechnical Engineering, 9 p., accessed June 26, 2024, at https://www.issmge.org/uploads/publications/89/100/12ANZ_031.pdf.
U.S. Department of Agriculture, 2019, Onondaga County, New York: U.S. Department of Agriculture Soil Survey Geographic database, accessed March 23, 2024, at https://cugir.library.cornell.edu/catalog/cugir-007760.
U.S. Geological Survey [USGS], [variously dated], National field manual for the collection of water-quality data: U.S. Geological Survey Techniques of Water-Resources Investigations, book 9, 10 chap. (A0–A8, A10), accessed October 20, 2016, at https://water.usgs.gov/owq/FieldManual/.
U.S. Geological Survey [USGS], 2019, Specific conductance: U.S. Geological Survey Techniques and Methods, book 9, chap. A6.3, 15 p., accessed October 28, 2024, at https://doi.org/10.3133/tm9A6.3.
U.S. Geological Survey [USGS], 2024a, GeoLog locator: U.S. Geological Survey database, accessed June 26, 2024, at https://webapps.usgs.gov/GeoLogLocator.
Waller, R.M., 1994, Ground water and the rural homeowner: U.S. Geological Survey General Interest Publication, accessed June 26, 2024, at https://doi.org/10.3133/7000054.
Conversion Factors
U.S. customary units to International System of Units
Temperature in degrees Celsius (°C) may be converted to degrees Fahrenheit (°F) as follows:
°F = (1.8 × °C) + 32.
Datums
Vertical coordinate information is referenced to the North American Vertical Datum of 1988 (NAVD 88).
Horizontal coordinate information is referenced to the North American Datum of 1983 (NAD 83).
Altitude, as used in this report, refers to distance above the vertical datum.
Supplemental Information
Specific conductance is in microsiemens per centimeter at 25 degrees Celsius (µS/cm at 25 °C).
Electrical conductivity is in millisiemens per meter (mS/m).
For more information, contact:
Director, New York Water Science Center
U.S. Geological Survey
425 Jordan Road
Troy, NY 12180–8349
dc_ny@usgs.gov
or visit our website at
https://www.usgs.gov/centers/ny-water
Publishing support provided by the
USGS Science Publishing Network,
Pembroke Publishing Service Center
Disclaimers
Any use of trade, firm, or product names is for descriptive purposes only and does not imply endorsement by the U.S. Government.
Although this information product, for the most part, is in the public domain, it also may contain copyrighted materials as noted in the text. Permission to reproduce copyrighted items must be secured from the copyright owner.
Suggested Citation
Williams, J.H., Terry, N.C., Kappel, W.M., Heisig, P.M., Glas, R.L., and Woda, J.C., 2026, Shallow hydrogeologic framework of the Tully Valley mudboil area, Onondaga County, New York: U.S. Geological Survey Scientific Investigations Report 2026–5129, 58 p., https://doi.org/10.3133/sir20265129.
ISSN: 2328-0328 (online)
Study Area
| Publication type | Report |
|---|---|
| Publication Subtype | USGS Numbered Series |
| Title | Shallow hydrogeologic framework of the Tully Valley mudboil area, Onondaga County, New York |
| Series title | Scientific Investigations Report |
| Series number | 2026-5129 |
| DOI | 10.3133/sir20265129 |
| Publication Date | April 29, 2026 |
| Year Published | 2026 |
| Language | English |
| Publisher | U.S. Geological Survey |
| Publisher location | Reston VA |
| Contributing office(s) | New York Water Science Center |
| Description | Report: ix, 58 p.; Data Release |
| Country | United States |
| State | New York |
| County | Onondaga County |
| Other Geospatial | Tully Valley Mudboil Area |
| Online Only (Y/N) | Y |
| Additional Online Files (Y/N) | N |