

Evaluation of a Eutrophication Beneficial Use Impairment in the Grand Calumet River Area of Concern in Northwest Indiana, 2021–22
Links
- Document: Report (29.58 MB pdf) , HTML , XML
- Dataset: USGS dataset - USGS water data for the nation
- Data Releases:
- USGS data release - Grand Calumet River Area of Concern metabarcoding data
- USGS data release - Eutrophication and plankton communities (cyanobacteria and eukaryotic algae) in the Grand Calumet River Area of Concern, Indiana, 2021
- USGS data release - Nuisance algae—Planktonic communities in the Grand Calumet River Area of Concern, Indiana, 2021
- NGMDB Index Page: National Geologic Map Database Index Page (html)
- Download citation as: RIS | Dublin Core
Acknowledgments
The authors would like to acknowledge assistance from Paul Buszka, of the U.S. Geological Survey (USGS; retired) and Michael Spinar, of the Indiana Department of Environmental Management, who helped authors understand the historical work and restoration activities completed within the Grand Calumet River Area of Concern. The authors also acknowledge Caleb Artz and Moriah Greenwell of the USGS for assistance with field work and the installation of monitoring equipment, and Katarzyna Przybyla-Kelly, Ashley Spoljaric, and Danielle Vespo of the USGS for assistance with algal data collection. Katie Owens of the USGS is acknowledged for assistance with continuous water-quality data records review.
Abstract
Eutrophication has been regularly documented in the Grand Calumet River and Indiana Harbor Canal in northwest Indiana. The area has undergone various remediation efforts since the development of a Remedial Action Plan for the area in response to a 1987 amendment to the Great Lakes Water Quality Agreement of 1978 between the United States and Canada and the designation of the Grand Calumet River Area of Concern by the U.S. Environmental Protection Agency. To address concerns of eutrophication and its effects, the U.S. Geological Survey, in cooperation with the U.S. Environmental Protection Agency and the Indiana Department of Environmental Management, collected data from the Grand Calumet River and Indiana Harbor Canal in 2021 and 2022 to document the effects of remediation and combined sewer overflow releases on water quality.
This study used continuous monitors to collect data for dissolved oxygen, water temperature, chlorophyll fluorescence, specific conductance, and pH. Discrete sample analysis included biological oxygen demand, chemical oxygen demand, nutrients, nitrogen and oxygen isotopes in nitrate, nitrogen isotopes in ammonia, hydrogen and oxygen isotopes in water, and identification of algal communities (cyanobacteria and eukaryotic algae) by metabarcoding.
Eutrophic conditions were found throughout the area. Isotopic results indicated the source of nitrate in samples was either from soil organic nitrogen or combined sewer overflows. Combined sewer overflows were shown to have considerable effects on the sites, and remediation status did not have a great effect. Algal community results identified several taxa capable of becoming nuisance species, including Microcystaceae (cyanobacteria) and Chrysophyceae, Cryptophyceae, and Bacillariophyceae (all eukaryotic algae). When sites with irregular flow patterns were excluded from datasets, minimum dissolved oxygen concentrations were often higher downstream from remediated sites than from unremediated sites. This study shows the potential for further and more targeted exploration into the unusual conditions found throughout the Grand Calumet River and Indiana Harbor Canal area.
Introduction
In 1987, an amendment to the Great Lakes Water Quality Agreement of 1978 between the United States and Canada was accepted (International Joint Commission United States and Canada, 1987), which caused the development of Remedial Action Plans to address poor water quality in the Great Lakes. Remedial Action Plans were created for 43 Areas of Concern within the Great Lakes Basin, including the Grand Calumet River Area of Concern, comprising the Grand Calumet River and Indiana Harbor Canal in northwest Indiana (Snyder, 2012). These Areas of Concern in the Great Lakes ecosystem were identified as having at least 1 impairment of 14 beneficial uses (hereafter referred to as “Beneficial Use Impairments” [BUIs]). According to the Agreement, a BUI is a chemical, physical, or biological change to water in the Great Lakes system that can cause degradation or negative effects on aquatic life, habitat, recreational enjoyment, water quality, or costs to industry. BUIs are applied as a status to an Area of Concern and may be removed if the condition improves. Before 2011, all 14 BUIs defined in the revised 1978 Agreement (International Joint Commission United States and Canada, 1987, p. 24) were present in the Grand Calumet River Area of Concern (fig. 1), including “eutrophication or undesirable algae” (U.S. Environmental Protection Agency, 2023c). The Remedial Action Plan developed for the Grand Calumet River Area of Concern includes management actions necessary for addressing the BUIs and ultimately delisting the Area of Concern (Snyder, 2012). The Stage 2.5 Remedial Action Plan states that dissolved oxygen, nutrient, and algae monitoring are needed to evaluate eutrophic conditions, which will allow the Indiana Department of Environmental Management to assess whether the removal of the eutrophication BUI is appropriate (Snyder, 2012).
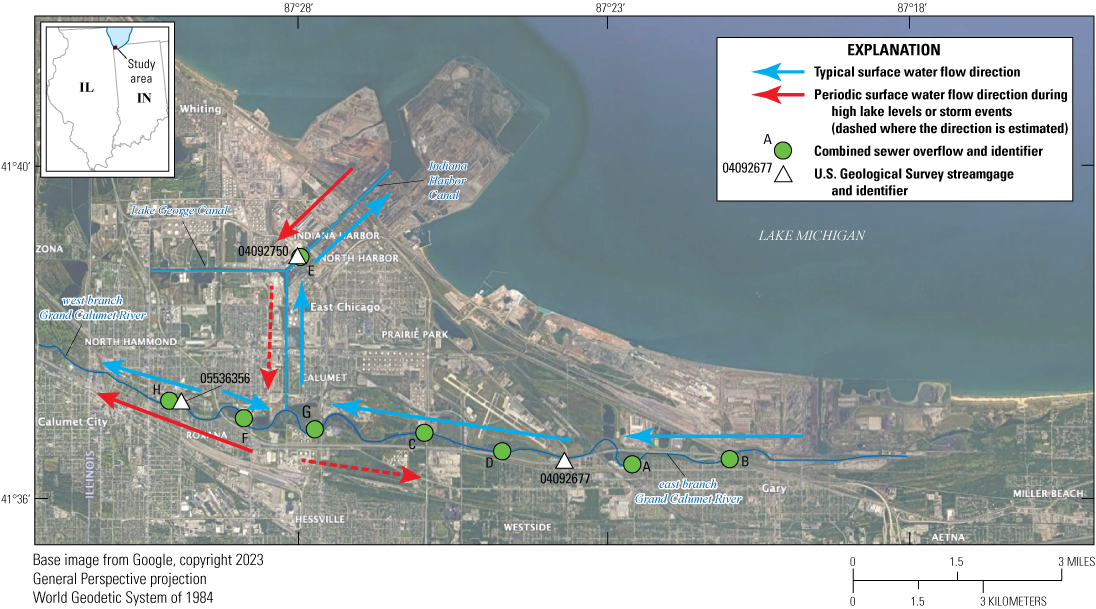
Map showing the east and west branches of the Grand Calumet River, Lake George Canal, and Indiana Harbor Canal, surface water flow directions, U.S. Geological Survey streamgages, and locations of combined sewer overflows within the Area of Concern. Combined sewer overflow identification labels shown in table 2.
In 2021, the Indiana water-quality standard stated that “for the maintenance of a well-balanced aquatic community...concentrations of dissolved oxygen shall (A) average at least five (5.0) milligrams per liter per calendar day; and (B) not be less than four (4.0) milligrams per liter at any time” (Indiana General Assembly, 2020, p. 77). The removal target for the eutrophication or undesirable algae BUI was revised in January 2024 and states the BUI can be considered for removal when the following conditions are met: (1) community outreach activities specifically designed to reduce nonpoint source and stormwater contributions of nutrients to Area of Concern waters have been conducted within the Area of Concern, (2) biological controls on nutrients or excess algal growth have been implemented, and (3) all approved contaminated sediment management projects have been completed or planned (Michael Spinar, Indiana Department of Environmental Management, written commun., 2024).
Eutrophication, or undesirable algae and aquatic plant growth caused by excess nutrients, occurs throughout the Grand Calumet River and Indiana Harbor Canal. Algal growths are prominent in shallow or low-flow locations near bridges, culverts, or other infrastructure designed to control water in the basin. These structures are common because of the high density of industrial development within the Area of Concern (fig. 2; Snyder, 2012). There are many sources of contamination in the Grand Calumet River watershed, including landfills, urban runoff, dumpsites, sewage treatment plants, combined sewer overflows (CSOs), and industrial effluent (Nevers and others, 2002).
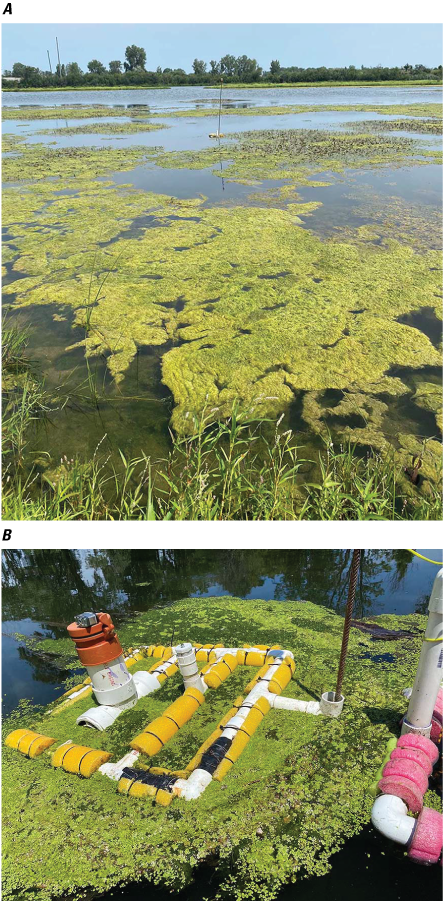
Photographs of algal blooms at the monitoring sites near A, EB7, and B, WB2, Grand Calumet River Area of Concern, northwest Indiana, June 27, 2022. Sites described in table 1 and shown in figure 3. Photographs by Rebecca Hammer-Lester, U.S. Geological Survey.
A combined sewer system collects rainwater runoff, domestic sewage, and industrial wastewater into one pipe (U.S. Environmental Protection Agency, 2023b). Under normal circumstances, the sewer can transport all wastewater to a treatment plant, but sometimes the amount of runoff exceeds the capacity of the system. When the capacity is exceeded, untreated stormwater and wastewater is released, flowing into nearby waterbodies through permitted outfalls (CSOs) that act as relief points during wet weather. These events, referred to as CSO events, occur within the Grand Calumet River watershed in the cities of Gary, East Chicago, and Hammond, Indiana, and discharge into the Grand Calumet River or Indiana Harbor Canal (fig. 1; U.S. Environmental Protection Agency, 2023b).
CSO events can negatively affect surface water quality and ecosystem health by causing beach closures, shellfish bed closures, algal growth, reduced oxygen levels in waterways, and aesthetic effects from floating debris or oil slicks (U.S. Environmental Protection Agency, 2023a). Nutrients in legacy streambed sediments and nutrients released during CSO events influence the growth of algae throughout the water column (Crawford and others, 1995; Nie and others, 2018). The life cycle of algae affects the concentrations of dissolved oxygen and may impair the ecosystem, especially when excess nutrients cause expansive growth of algal colonies (Klose and others, 2012). CSO releases can push large quantities of sewage, sludge, and runoff materials into the water, which can cause a spike in nutrient availability, especially ammonia (Atauzzaman and Ali, 2022). Increased ammonia availability can lead to increased nitrification rates, which can decrease dissolved oxygen concentrations when dissolved oxygen is used by microorganisms during the conversion of ammonia into nitrate (Sliekers and others, 2002).
The growth of algae, duckweed, and other aquatic plants is affected by nutrient availability and is also a factor for oxygen concentrations; algae and aquatic plant growth increases with elevated nutrient concentrations, and their metabolic processes then increase dissolved oxygen levels in water bodies during the day. The dissolved oxygen levels decrease at night when the photosynthetic rates decrease (Gasith and Resh, 1999). Algal overgrowth leads to the microbial decay of excess algae and plant matter, which produces large amounts of carbon dioxide and depletes dissolved oxygen, creating a hypoxic environment (National Oceanic and Atmospheric Administration, 2023). All these factors show how CSO events may ultimately lead to hypoxic conditions that can kill fish and other aquatic animal species and reduce the amount of riverine habitat. Reduction of nutrient sources through contaminated-sediment management projects (dredging or dredging and capping of legacy sediment) and the reduction of CSO events may improve conditions (Nevers and others, 2002).
Sediment management projects in the Grand Calumet River Area of Concern have been undertaken by Federal, State, and responsible parties as part of a regulatory enforcement action or as part of a nonregulatory action related to the Great Lakes Legacy Act of 2002 (Public Law 107–303, 116 Stat. 2355; Indiana Department of Environmental Management, 2023a). Remediation projects typically use dredging or dredging and capping as the primary methods of cleanup. During dredging, the contaminated sediment is removed with excavating equipment, and care is taken to reduce mixing of the sediment with the water column. Dredging methods include using a bucket to scoop sediment or a suction-controlled system to remove it. At some locations, water is diverted from the river and dry excavation methods are used. Removed sediment is disposed of as solid waste in a permitted landfill or as hazardous waste in a containment area. For projects where the removal of all contaminated sediment from the riverbed is not possible, a cap is applied after the top layer is dredged. The cap is designed to prevent the river from leaching contaminants or transporting contaminated sediments downstream while bacteria and other organisms in the polluted sediment bed naturally decompose pollutants (Hupfer and Hilt, 2008; U.S. Environmental Protection Agency, 2023c).
To address concerns of eutrophication and its effects on the Area of Concern, the U.S. Geological Survey (USGS), in cooperation with the U.S. Environmental Protection Agency (EPA) and the Indiana Department of Environmental Management, collected data in 2021 and 2022 to document the effects of remediation processes and CSO releases on nutrient and dissolved oxygen concentrations in relation to eutrophic conditions. Sampling for algal community structure analysis occurred concurrently with measurements of dissolved oxygen and clarity of the water to evaluate river conditions.
The goals of this study were as follows:
-
1. to describe the effect of CSO releases on surface water quality and ecosystem health, specifically cyanobacteria and eukaryotic algae communities,
-
2. to describe the relationship between dissolved oxygen concentration and nutrient concentrations and how CSO systems affect these relationships, and
-
3. to describe how different remediation processes (dredging or dredging and capping) along the Grand Calumet River influence water-quality conditions related to eutrophication.
Data were collected from April through October 2021 and May through November 2022 and provide a snapshot of the eutrophic conditions during the peak photosynthetic period of the year. In 2021, an initial selection of 13 sites was made throughout the Area of Concern to assess whether the current environmental conditions of the watershed are consistent with the conditions needed for persistent eutrophication or hazardous algal blooms to occur. In 2022, a subset of 5 of the 13 sites were selected that would target locations affected by eutrophication during the 2021 monitoring period and allow for comparison of data from unremediated and remediated reaches.
Study Area
The Grand Calumet River and Indiana Harbor Canal in Lake County in northwest Indiana consists of the east and west branches of the Grand Calumet River divided by (and including) the Indiana Harbor Canal and the surrounding shoreline of Lake Michigan (fig. 1). This area is coterminous with the Grand Calumet River Area of Concern (Crawford and Wangsness, 1987; Snyder 2012). The east branch Grand Calumet River starts in Marquette Park, flows west, and discharges to the Indiana Harbor Canal, which typically flows to Lake Michigan (Renn, 2000). Streamflow in the west branch Grand Calumet River divides at a topographic high about 1.5 miles west of the confluence with the Indiana Harbor Canal near Columbia Avenue in Hammond, Ind. East of the divide, the west branch flows toward the Indiana Harbor Canal; west of the divide, the west branch flows toward Illinois (fig. 1). The location of the divide in the west branch can vary on the basis of changing conditions in the area, including Lake Michigan water levels, wind direction, and discharges to the Grand Calumet River.
Urban development has brought notable changes to the study area since 1900. Marshlands that formed because of the poor drainage to the Grand Calumet River were drained (Moore, 1959). Canals dug from Lake Michigan to the Grand Calumet River for shipping caused changes in the local direction of flow in the river. As a result of the change in flow direction, the former mouth of the Grand Calumet River at Lake Michigan was closed off by decreased streamflow and sand-dune migration. The course of the river was locally altered to accommodate harbors and highway construction. In 1907, the Indiana General Assembly passed legislation that allowed the building of artificial land in Lake Michigan by use of slag, a byproduct of the steel-making industry. Many industries are currently located on such land north of the study area. Additionally, slag has been used extensively as fill material in depressions and marshes throughout the study area.
Almost all the flow in the Grand Calumet River and Indiana Harbor Canal results from industrial and municipal discharges, and substantial flow variations have occurred in the east and west branches of the Grand Calumet River and in the Indiana Harbor Canal (Crawford and Wangsness, 1987). Changes in Lake Michigan water levels can temporarily reverse the direction of flow in the Indiana Harbor Canal and parts of the east and west branches of the Grand Calumet River (fig. 1). Parts of the Grand Calumet River and Indiana Harbor Canal have been dredged, channelized, and lined with metal sheet pile. Ultimately, the contribution to the Grand Calumet River and Indiana Harbor Canal from surface water runoff is small. The drainage area of the Grand Calumet River Basin is indeterminate (Stewart and others, 1999) but is estimated to be less than 50 square miles (Renn, 2000). Fenelon and Watson (1993) reported that model-estimated groundwater discharges to the Grand Calumet River and Indiana Harbor Canal were minimal (10 cubic feet per second).
Remediation Efforts
The Indiana Department of Environmental Management, the Indiana Department of Natural Resources, the EPA, the U.S. Army Corps of Engineers, the U.S. Fish and Wildlife Service, and other parties have worked to manage contaminated sediment in the Area of Concern. The resulting sediment management projects were carried out with the aim of reducing the effects contaminants had on human health and the environment. Projects have either been undertaken by a responsible party or by the EPA and various federal and nonfederal partners as part of a nonregulatory Great Lakes Legacy Act action (Indiana Department of Environmental Management, 2023a).
Through 2022, the following sediment remediation actions have been completed (fig. 3):
-
1. Dredging of the east branch Grand Calumet River from the eastern headwaters by U.S. Steel Gary Works manufacturing plant west to Airport Road in Gary, Indiana, (hereafter referred to as the “U.S. Steel remediation area”) was completed in December 2007.
-
2. Dredging and capping of the east branch Grand Calumet River between Kennedy and Cline Avenues, in East Chicago, Indiana, (hereafter referred to as the “east branch remediation area”) was completed in September 2015.
-
3. Dredging and capping of the west branch Grand Calumet River from the Illinois State line to Indianapolis Boulevard, in East Chicago, Indiana, (hereafter referred to as the “west branch remediation area”) was completed in December 2016.
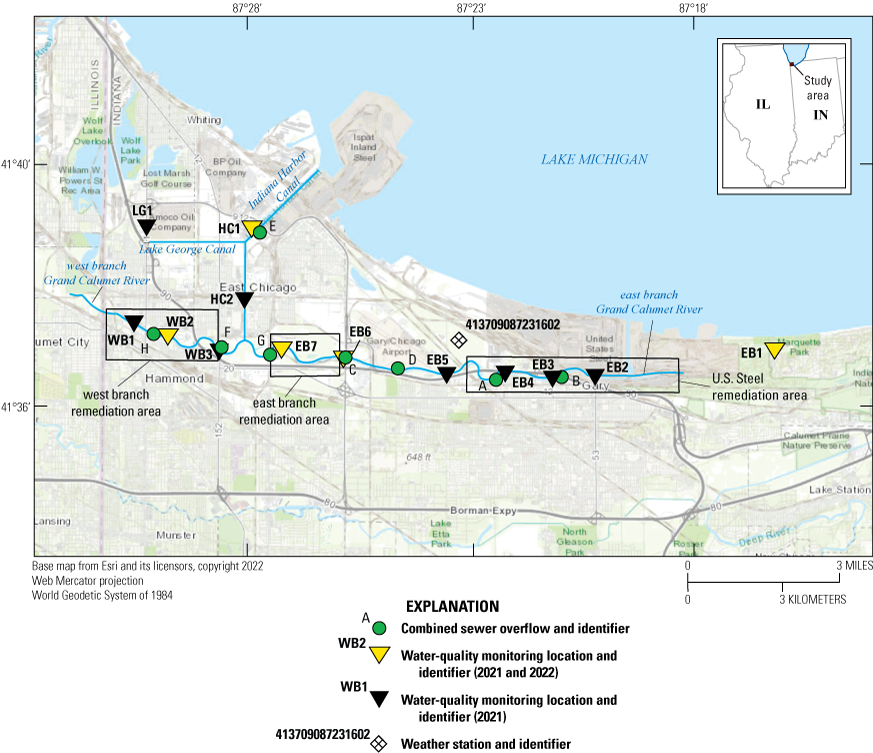
Map showing remediation areas, combined sewer overflows, and monitoring locations in 2021 and 2022, in the Grand Calumet River Area of Concern, northwest Indiana.
The dredging of the U.S. Steel remediation area has created greater depths of water in that reach than the rest of the east branch Grand Calumet River (Sediment Management Working Group, 2004). The responsibility of the U.S. Army Corps of Engineers for maintaining navigational waterways, such as the Indiana Harbor Canal, includes periodically dredging and deepening channels to remove contaminated sediment and improve ship navigation.
Methods for Data Collection and Analysis
Site selection, data collection (including continuous water-quality parameters, algal community analysis by metabarcoding, and discrete water-quality sampling), and the analytical methods used to interpret data were chosen to assess if CSOs and differing remediation conditions throughout the Area of Concern influence factors that contribute to eutrophic conditions on the Grand Calumet River and Indiana Harbor Canal. The algal community analysis for cyanobacteria and eukaryotic algae community data collected for this project are available through three USGS data releases (Aunins and others, 2023; Byappanahalli and others, 2023; Byappanahalli and others, 2025). All water-quality data (continuous and discrete) collected as part of this study are published in the National Water Information System (U.S. Geological Survey, 2023).
Monitoring Site Selection
In 2021, 13 sites were chosen (fig. 3; table 1) to assess whether the existing environmental conditions of the Grand Calumet River Area of Concern were consistent with conditions needed for persistent eutrophication or hazardous algal blooms. Considerations for site selection included safety; accessibility; whether there was an active USGS gaging station; locations of outfalls and discharges (CSO, industrial, and storm) and urban runoff; previous mitigation efforts completed within the reach (none, dredged, dredged and capped; fig. 3; table 1); stream characteristics (bank type, bed type, marsh, average depth, and flow velocity); and aquatic and terrestrial vegetation and wildlife. Study site identifiers were assigned in each remediation area (table 1). These site identifiers are used when discussing each site throughout the report.
Table 1.
Monitoring locations and available data types for the study area, Grand Calumet River Area of Concern, northwest Indiana, 2021–22.[Data from U.S. Geological Survey (2023). Site identifiers were assigned on the basis of geographical reach. WB, west branch; AV, avenue; IN, Indiana; DO, dissolved oxygen; WT, water temperature; NM, not monitored; —, not applicable; Q, discharge; GH, gage height; SC, specific conductance; fChl, chlorophyll fluorescence; Turb, turbidity; Comm, discrete algal community information; NH3, ammonia; NO2, nitrite; NO3, nitrate; PO4, orthophosphate; P, phosphorus; COD, chemical oxygen demand; BOD, biological oxygen demand; δ2H, stable isotopic composition of hydrogen; H2O, water; δ18O, stable isotopic composition of oxygen; δ15N, stable isotopic composition of nitrogen; R, river; Blvd, boulevard; LG, Lake George; HC, harbor canal; IHC, Indiana Harbor Canal; EB, east branch; NR, near; ST, street]
EB1 was selected as the reference site because it did not include any CSOs or industrial outfalls and therefore had the least altered hydrology of all the sites during the study (Kay and others, 1997). LG1 was chosen to represent shallow, stagnant drainage ditches throughout the study area designed to dewater nearby land. Two sites were located at preexisting USGS streamgages along the Grand Calumet River (WB2 and EB5; fig. 3; table 1), and one site was located at a pre-existing USGS streamgage on the Indiana Harbor Canal (HC1). Complementary continuous data from other USGS operated sensors at these sites were used as comparison datasets for this study.
In 2022, sites where eutrophic conditions were observed in 2021 were targeted to identify contributory factors to eutrophication. Continuous water-quality parameters collected in 2022 included continuous dissolved oxygen and water temperature at five sites and chlorophyll fluorescence (fChl) at four sites (table 1; YSI Incorporated, 2024). Additionally, water-quality sampling for eutrophication-related nutrients and stable isotopic compositions of nitrate and water were collected monthly and during one storm event from three sites. Samples were collected from two sites where possible relationships with CSO releases were observed and varied remediation efforts had or had not occurred (WB2 and EB6) and from EB1, which again served as a reference site (table 1).
Combined Sewer Overflows
Within the study area, eight CSOs were active during the 2021 and 2022 periods of study (fig. 3; table 2). Two CSOs are in the U.S. Steel Remediation area (Chase and Polk) and two are in the east branch remediation area (Alder and Kennedy). One CSO is in the west branch remediation area (CSO Storage Basin). One CSO is located just east of the west branch remediation area (Magoun), one is between the U.S. Steel remediation area and the east branch remediation area (Colfax), and one is in the Indiana Harbor Canal (Michigan).
Table 2.
Combined sewer overflow site names, remediation area locations, and nearest U.S. Geological Survey water-quality monitoring sites, Grand Calumet River Area of Concern, northwest Indiana.[Data from Indiana Department of Environmental Management (2025). U.S. Geological Survey (USGS) monitoring sites shown in figure 1. ID, identification; NPDES, National Pollutant Discharge Elimination System; km, kilometer]
USGS Water-Quality Streamgages and Precipitation Gages
In 2021 and 2022, stage and discharge data from current USGS streamgages at monitoring sites were used in this study (figs. 1 and 3; table 1). Stage data are stored in the National Water Information System database (U.S. Geological Survey, 2023). Stream discharge was calculated at WB2 and HC1 by developing a stage-area rating and an index-velocity rating. The index-velocity rating was developed by using the relation between the measured mean cross-sectional velocity at the surveyed cross section and the simultaneous index velocity measured with the permanently site-mounted acoustic Doppler velocimeter (Ruhl and Simpson, 2005). The velocimeter also provided information specific to the gage location about the direction of surface-water flow and the times that temporary flow reversals occurred. The streamgages at HC1 and WB2 continuously monitored water temperature, dissolved oxygen, specific conductance (SC), fChl, and pH with a YSI EXO multiparameter sonde (YSI Incorporated, 2024). The streamgage at WB2 also monitored nitrate plus nitrite as nitrogen with a Hach Nitratax specific conductance monitor (Hach, 2022). Precipitation data were collected from the USGS-operated weather station (station 413709087231602; fig. 3).
Continuous Water-Quality Monitoring
Continuous water-quality monitoring was performed in both years of this study. In 2021, continuous water-quality monitors were used to measure dissolved oxygen and water temperature at all 13 sites. Four of those sites (WB2, HC1, EB5, and EB1) also measured continuous fChl (table 1). In 2022, data were collected at five sites (WB2, HC1, EB7, EB6, and EB1; table 1). Continuous fChl was also monitored at four of the five sites (WB2, HC1, EB1, EB6) in 2022. Additionally, site WB2 monitored specific conductance, which describes the water’s ability to conduct electricity and is related to the number of ions present in the water (U.S. Geological Survey, variously dated).
Instruments used to collect continuous water-quality data included Onset HOBO model U26–001 dissolved oxygen loggers (HOBOs; Onset, 2020), which were used to measure dissolved oxygen and water temperature, and multiparameter sondes equipped with water temperature and specific conductance sensors, dissolved oxygen sensors, and, at select sites, fChl sensors. Water-quality instrumentation was deployed by using floats constructed with polyvinyl chloride (PVC) pipe and polyethylene foam material (fig. 4). Data were collected at 5-minute intervals, internally logged, and downloaded during field visits. In 2021, dissolved oxygen loggers were deployed at all 13 sites and multiparameter sondes were deployed alongside the dissolved oxygen loggers at 4 sites (WB2, HC1, EB5, and EB1) to monitor additional water-quality parameters and to verify readings from dissolved oxygen loggers. Continuous monitors were used following USGS operation and calibration protocols (Wagner and others, 2006; Foster and others, 2022).
Photographs showing examples of how instruments were deployed at monitoring locations in the Grand Calumet River Area of Concern, northwest Indiana, June 3, 2022: A, large float with deployment tubes for a multiparameter sonde and a dissolved oxygen logger at site EB1. B, small float with an dissolved oxygen logger deployed at HC2. Photographs by Rebecca Hammer-Lester, U.S. Geological Survey.
Continuous monitoring from April to November 2021 and May to November 2022 allowed for the capture of a wide range of data for each water-quality parameter, most notably for dissolved oxygen and water temperature, which show changes in seasonality and differences caused by varying conditions among sites. Typically, continuous dissolved oxygen and water temperature values show diurnal patterns that can be caused by photosynthesis and respiration or air temperature and sun exposure, respectively. These values can also have a daily inverse relation that can be due to temperature flux limiting the amount of oxygen dissolved in the water (Marzadri and others, 2013). To de-emphasize daily data variation of dissolved oxygen caused by diurnal fluctuation patterns, daily mean values and instantaneous minimum values were used. These data allowed for a better understanding of potential long-term patterns among other parameters as they relate to Indiana Department of Environmental Management’s BUI removal criteria in place prior to modification in January 2024.
Sites WB2, EB1, and HC1 were monitored for fChl in 2021 and 2022. Additionally, EB5 was monitored in 2021 and EB6 was monitored in 2022. Results for fChl measurements are reported as an estimated concentration of chlorophyll (chlorophyll concentration). Chlorophyll concentration was used as a proxy for algal pigment concentration in the stream but is not precisely equivalent. It is a tool used to observe likely periods of increases and decreases in photosynthetic activity, leading to increased chlorophyll, related to changing conditions in the stream and differing algal communities during varied conditions. Differing responses from the sensor can be an indicator of changing algal communities (Foster and others, 2022). Data above the upper limit of the sensor range (100 micrograms per liter [µg/L]) were removed from the dataset to ensure fouled data were not used (Booth and others, 2023).
Cyanobacteria and Eukaryotic Algae Community Sampling
A coordinated genomic-based assessment was completed for a subset of five sites to characterize algal communities related to eutrophic conditions, including species associated with hazardous and nuisance algal blooms (Piredda and others, 2018; Wolf and Vis, 2020).
Collection Sites and Sampling Regime for Metabarcoding
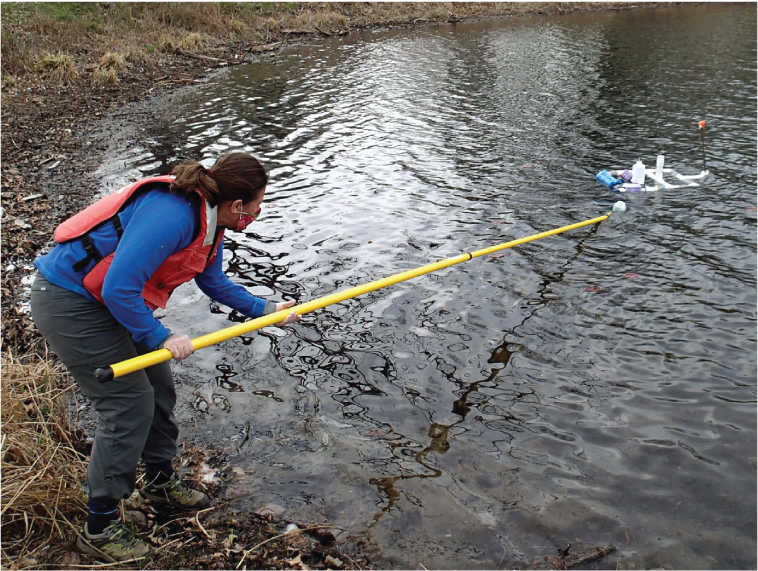
Water samples used to identify cyanobacteria and eukaryotic algae were collected at five sites within the study area (LG1, WB2, HC1, EB5, and EB1). Water samples were collected in triplicate from each site during three independent sampling events. The first sampling event occurred on April 19–20, 2021, the second on July 7, 2021, and the third on September 15, 2021, for a total of 45 samples. At each location, 1-liter (L) samples were collected with a bleach-sterilized bottle attached to a sampling pole (fig. 5). All samples were stored on ice after collection and processed at the USGS Lake Michigan Ecological Research Station within 6 hours of collection.
Photograph of algal community analysis sampling at site EB1, Grand Calumet River Area of Concern, northwest Indiana, April 19, 2021. Photograph by Danielle Szymkowski, U.S. Geological Survey contractor.
Sample Processing
To prevent filter clogging from suspended solids during filtration of algal community samples, all water samples (930–1000 milliliters [mL]) were first filtered (prefiltration) through a 0.8 micrometer (µm) GE Healthcare Life Sciences glass fiber filter into a 1 L side-armed flask. After the prefiltration step, the sample water was further filtered (final filtration) through a 0.22 µm MilliporeSigma mixed cellulose esters filter. If filters became clogged, either during prefiltration or final filtration, the filter was removed and stored, and another filter (duplicate) was used to complete filtration. During the September sampling event, the 0.8 µm prefilter for the LG1 sample clogged and stalled because of a high volume of suspended particles, so the remaining sample filtration was completed through a 1.5 µm filter. All filters (prefilters and final filters, including duplicates) were placed in separate, sterile 7 mL screw-cap tubes containing beads transferred from QIAGEN DNeasy PowerSoil Pro kit bead tubes and held at −80 degrees Celsius (°C) until deoxyribonucleic acid (DNA) extractions took place.
DNA Extractions
Environmental DNA was extracted from all filters by using the QIAGEN PowerSoil Pro kit according to instructions provided by the manufacturer with two exceptions: (1) to promote the release of DNA from the filter, the 7 mL tubes containing sample filters and lysis buffer (CD1) were placed into a 60 °C preheated heat block and incubated for 15 minutes; and (2) the final DNA elution step was performed twice by using 50 microliters (µL) of DNA elution buffer for a final extraction volume of 100 µL (QIAGEN, 2023). For duplicate filters, both filters were initially processed separately during the lysis steps. The lysate was then combined by transferring to the same spin column, resulting in a single DNA extract per sample. After DNA extractions were complete, an equal aliquot (65 µL) of DNA extracted from the prefilters and final filters for a given sample were combined in a 2 mL tube for metabarcoding analysis. DNA concentration for all samples was measured by fluorometric quantification with a Qubit high sensitivity double-stranded DNA quantification assay kit, and DNA quality (260/280 ratio) was measured by using an Implen NanoPhotometer Pearl. All DNA extracts were stored at −80 °C; extracts for metabarcoding analysis were shipped on dry ice to the USGS Eastern Ecological Science Center.
Quality Control for DNA Sampling and Processing
Several controls were used during the sample collection and processing steps. A field blank was collected during each sampling event, method blanks were processed in parallel with filtrations, and an extraction blank was processed in parallel with each extraction set. All control blanks were found to be free of DNA according to DNA concentrations measured by Qubit fluorometric quantification. Triplicate water samples were collected individually and analyzed separately.
High-Throughput DNA Metabarcoding Library Preparation and Sequencing
A DNA metabarcoding technique was employed to describe both eukaryotic and prokaryotic communities in water samples (Keck and others, 2017). One metabarcoding primer pair targeting eukaryotic 18S ribosomal RNA (Stoeck and others, 2010), and one metabarcoding primer pair targeting bacterial 16S ribosomal RNA (Caporaso, and others, 2011) were selected (table 3). To generate DNA metabarcoding libraries compatible with DNA sequencing on the Illumina MiSeq sequencing platform, the Illumina 16S metagenomics sequencing protocol was followed (Illumina, 2013). Each metabarcoding primer was ordered with an adapter sequence attached to the 5 prime end of the primers for the incorporation of Nextera DNA indexes and flow cell adapters (table 3). Reaction conditions consisted of 1 µL undiluted DNA template, 2.5 µL forward primer at 1 micromole stock concentration, 2.5 µL reverse primer at 1 micromole stock concentration, and 6.25 µL KAPA HiFi HotStart ReadyMix in a total volume of 12.25 µL. Three replicate polymerase chain reactions were set up for each individual sample.
Thermal cycling conditions for the 18S marker were as follows:
-
• 95 °C for 3 minutes;
-
• 30 cycles of 95 °C for 30 seconds, 63 °C for 30 seconds, and 72 °C for 30 seconds;
-
• 72 °C for 5 minutes; and
-
• hold at 12 °C for infinity.
Thermal cycling conditions for the 16S marker were as follows:
-
• 95 °C for 3 minutes;
-
• 25 cycles of 95 °C for 30 seconds, 55 °C for 30 seconds, and 72 °C for 30 seconds;
-
• 72 °C for 5 min; and
-
• hold at 12 °C for infinity.
Table 3.
Deoxyribonucleic acid (DNA) primers used for algal DNA metabarcoding.[The section of each sequence before the space written in italics on the 5 prime(′) ends is an adapter synthesized on the primer to allow for the incorporation of DNA indexes and flowcell adapters (Illumina, 2013). The tags 5′ and 3′ refer to the carbon number and indicate the directionality of the DNA sequence. 16S ribosomal ribonucleic acid (RNA) gene sequencing, component of the small prokaryotic ribosomal subunit; F, forward primer; R, reverse primer; 18S ribosomal RNA gene sequencing, component of the small eukaryotic (EUK or Euk) ribosomal subunit]
Dual indexing of all amplicons (DNA copies) was performed with Nextera DNA indexes by following the Illumina instructions with no changes (Illumina, 2013). All amplicons were sequenced on an Illumina MiSeq with MiSeq V3 600 cycle cartridges. The 16S and 18S amplicons were run on independent cartridges at a loading concentration of 8 parts per million with 10 percent PhiX spike in.
Bioinformatic Analyses
Demultiplexed samples were downloaded in FASTQ format from Illumina’s BaseSpace. The 16S and 18S data were processed separately. Primers were trimmed from samples by using the script “bbduk.sh” of BBMap version 38.90 (Bushnell, 2014). Primer trimmed reads (DNA fragments corresponding to 16S for cyanobacteria and 18S for eukaryotic algae) were imported into QIIME 2 (Bolyen and others, 2019). Sequence data were denoised into amplicon sequence variants with DADA2 (Callahan and others, 2016) in QIIME 2 by using the script “qiime dada2 denoise-paired,” which denoises and dereplicates paired-end sequences (QIIME 2 development team, 2024).
Taxonomic assignment of the 16S ASV sequences was performed by using the QIIME 2 compatible and formatted Silva 132 database (Leibniz Institute DSMZ-German Collection of Microorganisms and Cell Cultures GmbH, 2018). The reference sequences were trimmed to regions amplified by the primers used in this study by using the script “bbduk.sh.” A naive Bayes classifier was constructed from these trimmed reference sequences within QIIME 2 by using the scripts “qiime feature-classifier fit-classifier-naïve-bayes” and “qiime feature-classifier classify-sklearn.”
Taxonomic assignment of the 18S ASV sequences was performed by first using blastn search of the 18S ASVs with default output format (Altschul and others, 1990) against the National Center for Biotechnology Information nucleotide database (National Center for Biotechnology Information, 2021). The blastn output file was imported into MEGAN Community Edition (version 6.20.19) for taxonomic annotation based on the National Center for Biotechnology Information taxonomy (Huson and others, 2016). Settings for the least common ancestor parameters in MEGAN were as follows:
-
• Minimum score: 150;
-
• Maximum expected: 0.01;
-
• Minimum percent identity: 85.0;
-
• Top percent: 10.0;
-
• Minimum support percent: 0.0;
-
• Minimum support: 1.0;
-
• Use minimum complexity filter: 0;
-
• Least common ancestor algorithm: weighted;
-
• Percent to cover: 80.0;
-
• Assignment mode: readcount.
All nodes with a taxonomy assigned in MEGAN were selected and the taxonomy in the seven level format “Kingdom;Phylum;Class;Order;Family;Genus;Species” (KPCOFGS) was exported, including ASVs with no taxonomic assignment (“Unassigned”) or no hit (“No_hit”) to the nucleotide database. These taxonomies were then imported into QIIME 2 for additional analysis by using the command “qiime tools import --type ‘FeatureData[Taxonomy]’”. Owing to constant revisions of the taxonomy within multiple eukaryotic lineages, exported levels of taxonomy often did not match KPCOFGS, though there were still seven levels of taxonomy for these taxa; thus, levels 1–7 (ordered from the broadest to most specific category) were used as a reference for the data rather than taxonomic ranks. Any reads detected in the control samples in both the 16S and 18S datasets (extraction blanks and polymerase chain reaction controls) were deducted from the environmental DNA samples by taking the sum across all control samples for each ASV and subtracting this sum from each sample where it was present. Negative values were adjusted to zero. Additional filtering of the 16S dataset included removal of ASVs with a taxonomic assignment including “mitochondria” or “chloroplast” and any taxonomic assignments to “Mammalia” or “Bacteria” were removed from the datasets. These filtered ASV tables were used for all subsequent analyses.
Environmental DNA Data Analysis Methods
The R packages (R Core Team, 2022), Phyloseq (McMurdie and Holmes, 2013) and qiime2R (Bisanz, 2018) were used to format the 16S and 18S datasets separately to exclude laboratory controls, merge sample replicates collected within the same month, and calculate relative abundances and obtain number of reads (reads). The 16S dataset was further formatted prior to calculating relative abundance and obtaining reads: (1) data were filtered to remove cyanobacteria and (2) similar taxonomic assignments were collapsed down to the family level. The 18S dataset was further formatted prior to calculating relative abundance and obtaining reads: (1) data were filtered to eukaryotic algae and (2) like taxa were merged at the second level (level 2). Additionally, the number of reads for cyanobacteria and eukaryotic algae were merged, and relative abundances were calculated. Applicable data were then assigned to some of the major algal groups: cyanobacteria, diatoms and dinoflagellates, Chrysophyta (golden-brown algae), Chlorophyta (green algae), and Xanthophyta (yellow-green algae). Taxa that could not be assigned to any of these five groups were categorized as “other.”
Generated data were used to identify cyanobacteria and eukaryotic algae at four of the monitoring sites in the Grand Calumet River and the reference site EB1 to (1) characterize the spatiotemporal differences in algal communities between spring and summer (April, July, and September 2021) and (2) examine whether communities capable of becoming nuisance species were found during the study period. These data were also compared with the continuous water-quality data (water temperature, dissolved oxygen, specific conductance, and fChl) to understand which conditions are favorable for certain cyanobacteria and eukaryotic algae taxa to grow and how this could affect nutrient cycling.
Discrete Water-Quality Sampling
In 2022, discrete samples were collected for ammonia, nitrite, nitrate, organic nitrogen, total nitrogen, orthophosphate, phosphorus, biological oxygen demand, chemical oxygen demand, and oxygen, hydrogen, and nitrogen stable isotopic compositions in water, nitrate, and ammonia. Discrete water samples for nutrients and isotopes were collected at least monthly from May through October 2022. Biological and chemical oxygen demand samples were collected from July 2022 through October 2022. Additionally, one series of storm samples (rising, peak, and falling) was collected August 7–9, 2022, at WB2, EB6, and EB1. For quality control purposes, one replicate sample was collected at each site and one blank sample was collected at EB1 (U.S. Geological Survey, variously dated).
A DH-81 wading rod, a weighted bottle sampler, or an open mouth bottle was used to collect nonisokinetic samples in accordance with USGS sampling protocols (U.S. Geological Survey, variously dated). At each site, three 1-L samples were collected and composited in a single 3-L container before processing (U.S. Geological Survey, variously dated). Samples at WB2 and EB6 were collected downstream from the Area of Concern monitoring sites where strong flow was expected to result in a well-mixed sample, whereas EB1 was slow moving or stagnant throughout the site and sampling area.
Once collected, raw samples were processed in the field in preparation for shipment to corresponding laboratories. Sample processing was completed by following USGS methods (U.S. Geological Survey, variously dated). Three liters of sample water were collected for whole water (unfiltered) nutrient (total nitrogen and phosphorus) concentrations, and biological and chemical oxygen demand and then the remaining water was filtered through a 0.45-µm capsule filter for dissolved nutrient (ammonia, nitrite, nitrate, and orthophosphate) concentrations, hydrogen and oxygen isotopic composition in water, and oxygen and nitrogen isotopic composition in nitrate and ammonia. The whole water nutrient sample bottle and chemical oxygen demand sample bottle were acidified for preservation by using 1 mL and 2 mL of 4.5 normality (1:7 water) sulfuric acid, respectively, and a 1-L bottle for nitrogen isotopes of ammonia analysis was acidified by using 4 mL of 4.5 normality sulfuric acid (U.S. Geological Survey, variously dated).
Laboratory Analysis
After sample collection and processing, sample bottles were organized for shipment for laboratory analysis. Nutrient samples were sent to the USGS National Water Quality Laboratory on ice to ensure preservation. Biological and chemical oxygen demand samples were shipped on ice to Research Technologies International Laboratories, a USGS contract laboratory, and analysis was conducted per EPA methodologies (table 4; U.S. Environmental Protection Agency, 1971; 1993). Samples of water, nitrate dissolved in water, and ammonia dissolved in water were collected for isotope analysis. The samples were stored in a refrigerator until nutrient sample concentration results were available (because results were required for isotope sample processing) and then shipped to the Reston Stable Isotope Laboratory for analysis (Révész and Casciotti, 2007; Révész and Coplen, 2008a, b). Dual-isotope sampling was performed on both water and nitrate. Dual-isotope sampling is the process for determining the composition of stable isotopes in a molecule. Water samples were analyzed for the isotopic composition of hydrogen and of oxygen; nitrate samples were analyzed for the isotopic composition of nitrogen and of oxygen; and one ammonia sample was analyzed for the isotopic concentration of nitrogen. Isotopic analysis of nitrogen and oxygen in nitrate requires that a minimum concentration of 0.002 milligram per liter (mg/L) of nitrate as nitrogen is present in the sample for the laboratory analysis to be performed. If this much nitrate is not present in a sample, then this analysis cannot be performed. All discrete samples except those collected at site EB1 met this requirement. Samples for nitrogen isotopes in ammonia were collected at all sites; however, only one sample from WB2 met ammonia concentration requirements for analysis.
The isotopic compositions are expressed as the difference of a specific isotope ratio in the sample in comparison to the ratio of the same isotopes in a standard, in parts per thousand (δ). Thus, δ shows the isotope composition relative to a standard. The standard for the isotopic composition for oxygen and hydrogen measurements is Vienna Standard Mean Ocean Water (VSMOW; Coplen, 1995; Brand and others, 2014). The standard for the isotopic composition for nitrogen is AIR (Brand and others, 2014). The equations to determine relative isotopic composition are as follows:
whereTable 4.
Water-quality constituents, reporting levels, and required concentrations for isotope analyses for discrete sampling.[Data from U.S. Geological Survey (2024). USGS, U.S. Geological Survey; mg/L, milligrams per liter; NWQL, National Water Quality Laboratory; δ2H, stable isotopic composition of hydrogen; —, not applicable; ‰; parts per thousand or per mil; RSIL, Reston Stable Isotope Laboratory; δ18O, stable isotopic composition of oxygen; δ15N, stable isotopic composition of nitrogen; NA, sample requirements not met; RTI, Research Technologies International].
| Constituent | Reporting level | Reporting unit | Analyzing laboratory |
|---|---|---|---|
| Ammonia, water, filtered | 0.04 | mg/L as nitrogen | USGS NWQL |
| Nitrite, water, filtered | 0.002 | mg/L as nitrogen | USGS NWQL |
| Nitrate plus nitrite, water, filtered | 0.08 | mg/L as nitrogen | USGS NWQL |
| Organic nitrogen, unfiltered | — | mg/L as nitrogen | USGS NWQL |
| Total nitrogen (nitrate + nitrite + ammonia + organic nitrogen), water, unfiltered, analytically determined | 0.1 | mg/L as nitrogen | USGS NWQL |
| Orthophosphate, water, filtered | 0.008 | mg/L as phosphorus | USGS NWQL |
| Phosphorus, water, unfiltered | 0.006 | mg/L | USGS NWQL |
| δ2H in water (eq. 2) | — | ‰ | USGS RSIL |
| δ18O in water (eq. 1) | — | ‰ | USGS RSIL |
| δ15N in nitrate (eq. 3) | NA1 | ‰ | USGS RSIL |
| δ18O in nitrate (eq. 3) | NA1 | ‰ | USGS RSIL |
| δ15N in ammonia (eq. 3) | NA2 | ‰ | USGS RSIL |
| Chemical oxygen demand | 9 | mg/L | RTI |
| Biological oxygen demand | 2 | mg/L | RTI |
Methods of Quality Control for Discrete Water-Quality Samples
Quality-control samples included a single field blank collected at site EB1 and a concurrent replicate sample collected from each sampling location (WB2, EB6, and EB1) following the same sampling and processing protocols as the environmental samples. Field blank and replicate samples are used to determine the amount of bias and variability during sample collection, processing, storage, and shipping (Mueller and others, 2015). Nutrient concentrations in blanks and replicates that were lower than method detection limits were qualified as “not detected” and were not reported. The methodology used for biological oxygen demand analysis allowed for a relative percent difference of 20 percent (U.S. Environmental Protection Agency, 1993). Replicates and blank samples were not collected for isotopes, and a blank sample was not collected for biological or chemical oxygen demand. Additional information on quality control sampling methods can be found in U.S. Geological Survey (variously dated).
Statistical Analysis of Water-Quality Data
The Spearman rank correlation (r) and the two-tailed probability values (p) were calculated by using Microsoft Excel functions to compare water-quality data. Data that were below minimum detection limits were excluded from the statistical analyses. For example, all 11 nitrate samples collected at site EB1 were below the minimum detection limit, so only nitrate data from sites EB6 and WB2 were used in the statistical analyses.
For the purposes of this study, a strong correlation between two parameters has an r value greater than 0.5 or less then –0.5, a moderate correlation has an r value of 0.3 to 0.5 or –0.3 to –0.5, and a weak correlation has an r value of 0.2 to 0.3 or –0.2 to –0.3. The alpha value for statistical comparisons is 0.05, which means that a comparison between two parameters is statistically significant if p <0.05. The r and p values are included in scatter plots to show how well correlated two water-quality parameters are to one another (the r value) and how statistically significant the comparison is (the p value).
Results
Results are presented from the wide variety of data collected in the Grand Calumet River and Indiana Harbor Canal for this study. Water chemistry and biological data were collected including continuous dissolved oxygen, water temperature, and fChl (reported as chlorophyll), environmental DNA algal community analysis, discrete water-quality samples of nutrients, and stable isotopic compositions of nitrogen in ammonia, nitrogen and oxygen isotopic composition in nitrate and hydrogen and oxygen isotopic composition in water. Additionally, CSO releases, stream discharge, and precipitation are presented in reference to the continuous and discrete water-quality data.
Combined Sewer Overflows and Storm Events
CSO discharge volumes were compiled for 2021 and 2022 by using discharge reports filed by the sanitary districts of the cities of East Chicago, Gary, and Hammond to the Indiana Department of Environmental Management Virtual File Cabinet after CSO releases (Indiana Department of Environmental Management, 2023b; fig. 1; table 2). During the 2021 and 2022 monitoring periods, 8 CSOs discharged for 146 days in 2021 and 6 CSOs discharged for 104 days in 2022 (table 2; Indiana Department of Environmental Management, 2023b). These releases were triggered by 46 precipitation events in 2021 and 40 precipitation events plus 1 sinkhole in 2022. An event was counted only once, even if the CSO release or rain continued for several days. CSO discharges varied greatly in size. The smallest CSO release reported was 500 gallons and the largest was 91.53 million gallons (Mgal) in a single day.
Because of the low gradient and altered nature of the Grand Calumet River and the Indiana Harbor Canal, flow reversals can alter which CSO releases affect which sites. Flow reversals were common during the study periods and can be driven by Lake Michigan stage, wind magnitude and direction, and effluent discharges, as well as ship traffic on the Indiana Harbor Canal near site HC1 causing water to flow south away from Lake Michigan (Andrew Gorman, USGS, written commun., 2023). Stream discharge data from the USGS streamgage at WB2 were used to determine when flow reversals occurred and how these reversals related to CSO releases (fig. 6). Depending on flow direction, WB2 can receive water from CSO events from the east (Magoun CSO) when discharge values at the gage are positive or the west (CSO Storage Basin) when discharge values are negative (table 2; fig. 1). Although most flow was westward during June 2021, releases from the CSO Storage Basin occurred from June 25 through July 2, 2021, and coincided with a periodic flow reversal from June 26 through June 29 at the streamgage at WB2. These releases and concurrent flow reversals occurred during a period of multiple rain events totaling about 2 inches of precipitation. These reversals coincided with the first 6 of 11 consecutive days of CSO release from the CSO Storage Basin. Magoun CSO also had releases from June 26 through July 6, 2021. No flow reversals were documented at site WB2 during the data collection period in 2022.
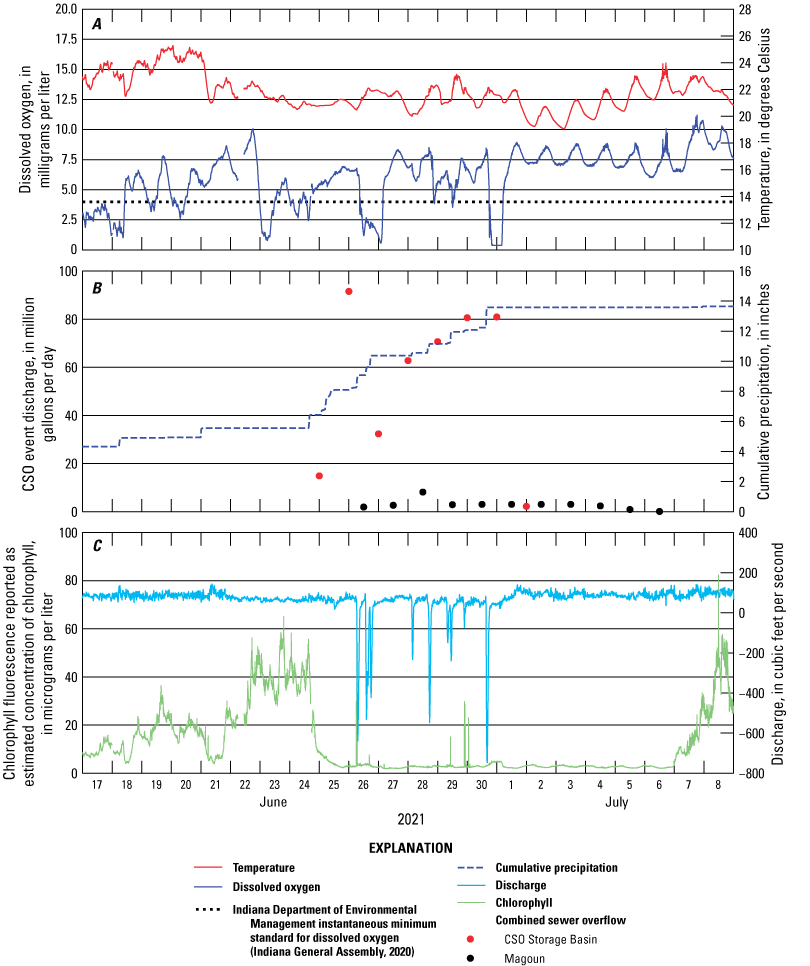
Graphs showing A, dissolved oxygen concentration and water temperature; B, cumulative precipitation and discharge from combined sewer overflow (CSO) events; and C, chlorophyll concentration and discharge from site WB2 from June 17 to July 9, 2021, Grand Calumet River Area of Concern, northwest Indiana. Data from U.S. Geological Survey (2023).
Continuous Water-Quality Monitoring
Continuous water-quality monitoring was completed from April to November 2021 and May to November 2022 (table 5). The dissolved oxygen and water temperature measurements were key in understanding the eutrophication BUI, and additional parameters provided insight to other stream conditions at the sites during the study period.
Table 5.
Ranges in instantaneous values of water temperature and dissolved oxygen as well as minimum daily values of dissolved oxygen by date, Grand Calumet River Area of Concern, northwest Indiana, 2021–22.[Data from U.S. Geological Survey (2023). Site information is in table 1 and figure 1. The Indiana General Assembly (2020) established a 5.0 milligram per liter (mg/L) daily mean standard and a 4.0 mg/L instantaneous minimum standard for dissolved oxygen. Dissolved oxygen concentrations greater than 15 mg/L indicate supersaturation, which is an indicator of eutrophic conditions (Wetzel, 2001). Sites WB1, WB2, EB7, EB4, EB3, and EB2 are in remediated reaches. °C, degree Celsius; <, less than; > greater than; —, not applicable]
Dissolved Oxygen and Water Temperature
Dissolved oxygen concentrations were collected (table 5) to compare to the daily mean (5.0 mg/L) and instantaneous (4.0 mg/L) minimum standards “for the maintenance of a well-balanced aquatic community” (Indiana General Assembly, 2020, p. 77). In 2021, all 13 sites except EB2 had a daily mean dissolved oxygen value below 5.0 mg/L and an instantaneous minimum dissolved oxygen concentration below the 4.0 mg/L minimum standard (table 5; U.S. Geological Survey, 2023). In 2022, of the five sites monitored, only WB2 did not have daily mean dissolved oxygen values below 5.0 mg/L and instantaneous minimums below 4.0 mg/L. Although most sites had dissolved oxygen concentrations below 4.0 mg/L, the persistence and frequency varied (table 5); for example, in the east branch Grand Calumet River in 2021, there were few instantaneous values below 4.0 mg/L at all sites except EB6 and EB7, where dissolved oxygen concentrations below 4.0 mg/L persisted for 62 and 46 percent of monitored days, respectively (U.S. Geological Survey, 2023).
In 2021, sites WB3, EB6, HC2, and HC1 had more than 80 occurrences of dissolved oxygen concentrations below 4.0 mg/L and more than 60 days where the daily mean dissolved oxygen concentrations were below 5.0 mg/L (table 5). This represented 34 to 47 percent of monitored days with mean dissolved oxygen below 5.0 mg/L. The remaining nine sites varied in occurrence of low dissolved oxygen concentrations in 2021. In 2022, sites EB1, HC1, EB6, and EB7 had instantaneous values below 4.0 mg/L on 37, 13, 24, and 31 percent of days monitored, respectively, and occurrences of daily mean dissolved oxygen concentrations below 5.0 mg/L on 38, 5, 3.8, and 2.3 percent of days monitored, respectively (table 5). Site WB2 had no instances of daily mean dissolved oxygen below 5.0 mg/L, and no instantaneous values fell below 4.0 mg/L in 2022. The percent of low dissolved oxygen occurrences at sites monitored in 2022 was lower than the percent of low dissolved oxygen occurrences in 2021.
Dissolved oxygen concentrations exceeded 15 mg/L at 6 of the 13 sites in 2021 and 4 of the 5 sites in 2022; the highest exceedances were at WB3, which reached concentrations of 25.5 mg/L in 2021, and EB7, which reached a concentration of 22.8 mg/L in 2022 (table 5). These values represent dissolved oxygen supersaturation, because within the range of temperatures and atmospheric pressures at these sites dissolved oxygen saturation would not typically exceed 15.0 mg/L. However, because of nonequilibrium conditions such as more photosynthetic activity in the water column, more oxygen can become dissolved in the water, which is evidence of eutrophication (table 5; U.S. Geological Survey, 2020). Other conditions at the sites varied between years. For example, most sites had greater water temperature and discharge ranges in 2021 compared with 2022 (tables 5 and 6).
Table 6.
Ranges of instantaneous values of discharge, specific conductance, pH, chlorophyll concentration, nitrate plus nitrite, and turbidity at selected sites, 2021–22.[Data from U.S. Geological Survey (2023). Site information is in table 1 and figure 1. ft3/s, cubic foot per second; µS/cm, microsiemens per centimeter at 25 degrees Celsius; µg/L, microgram per liter; mg/L, milligram per liter; FNU, formazin nephelometric unit; —, not applicable; NM, not monitored]
Dissolved oxygen concentrations often decreased after CSO releases (fig. 7). For example, at EB4, a 19.6 Mgal CSO release on June 26, 2021, was followed by a decrease in dissolved oxygen concentrations to below 4.0 mg/L that persisted for about 8 hours on June 27, 2021, and brought dissolved oxygen concentrations below the 5.0 mg/L daily mean dissolved oxygen threshold (figs. 7A and B). Small CSO releases also may have affected dissolved oxygen levels: at EB3, a CSO release of less than 0.2 Mgal preceded a decrease in dissolved oxygen concentrations from about 6 to 3 mg/L in late October 2021 (figs. 7C and D).
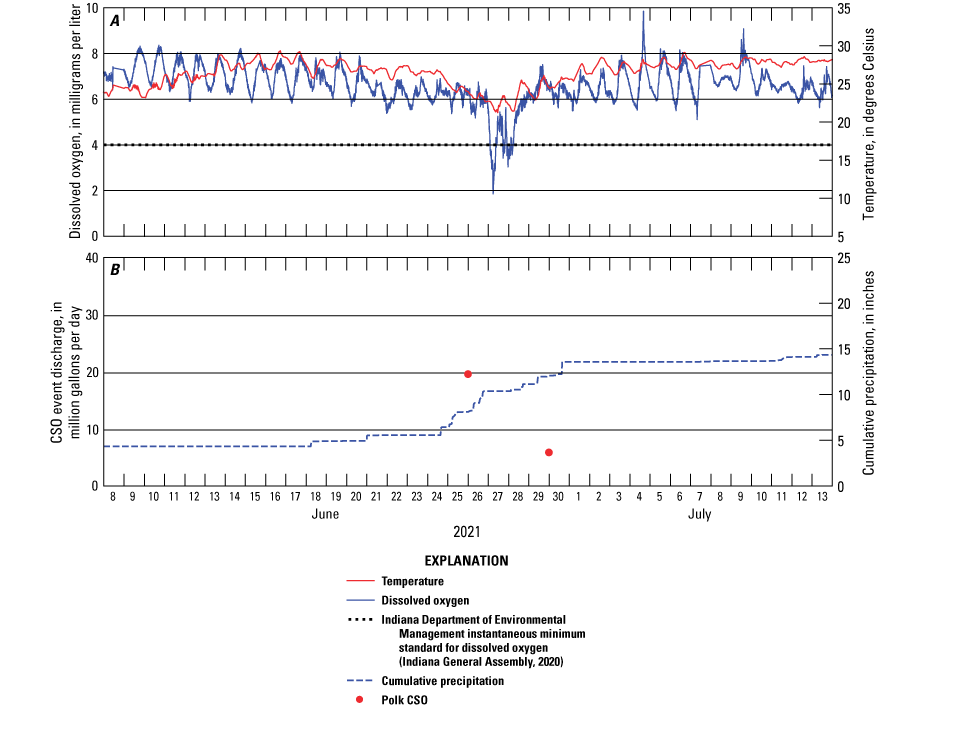
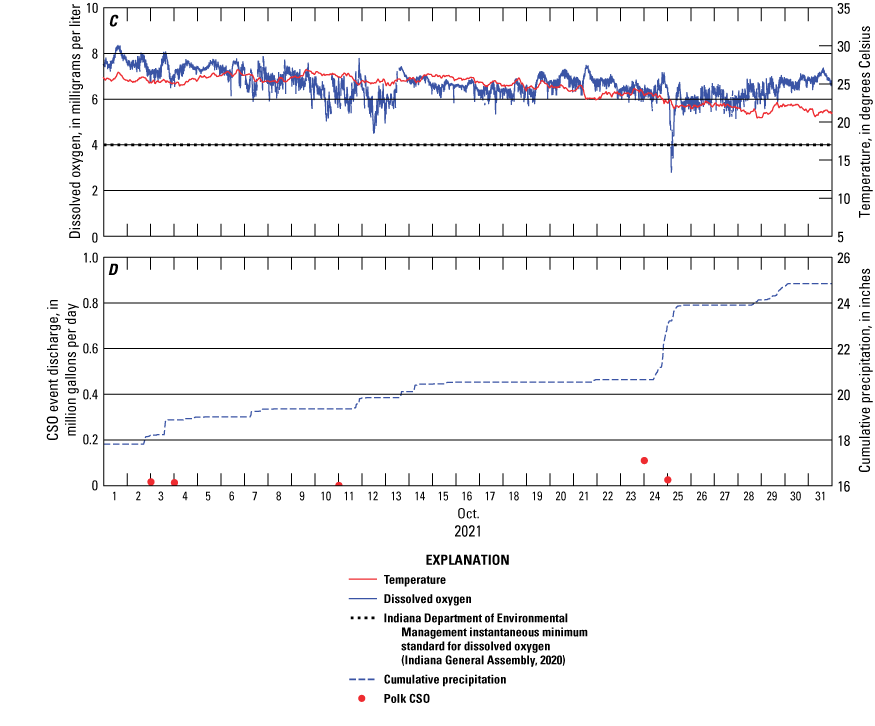
Graphs showing continuous water-quality parameters, combined sewer overflow (CSO) events, and trends during storm events at A, B, EB4 from June 8 through July 13, 2021, and at C, D, EB3 from October 2 through October 31, 2021, Grand Calumet River Area of Concern, northwest Indiana. Data from U.S. Geological Survey (2023).
Chlorophyll Concentrations
Daily mean chlorophyll concentrations at WB2, EB1, and HC1 in 2021 and at WB2, EB1, EB6, and HC1 in 2022 varied across the season and among sites (table 6; figs. 8 and 9). WB2 had the highest daily mean chlorophyll concentrations and had the greatest range of daily mean chlorophyll concentrations from 0.66 to 63.9 µg/L. At WB2, high chlorophyll concentrations also persisted for longer periods of time than it did at other sites. Site HC1 had the second highest chlorophyll concentrations, with peaks in July 2021 and June 2022. EB1 had a lower range and duration of increased chlorophyll concentrations than WB2 and HC1; the only notable rises occurred in early May 2021, on a single day in late September 2021, and during a period of late May 2022. Chlorophyll concentration at EB6 was only monitored in 2022, and chlorophyll concentrations ranged from 0.53 to 7.7 µg/L.
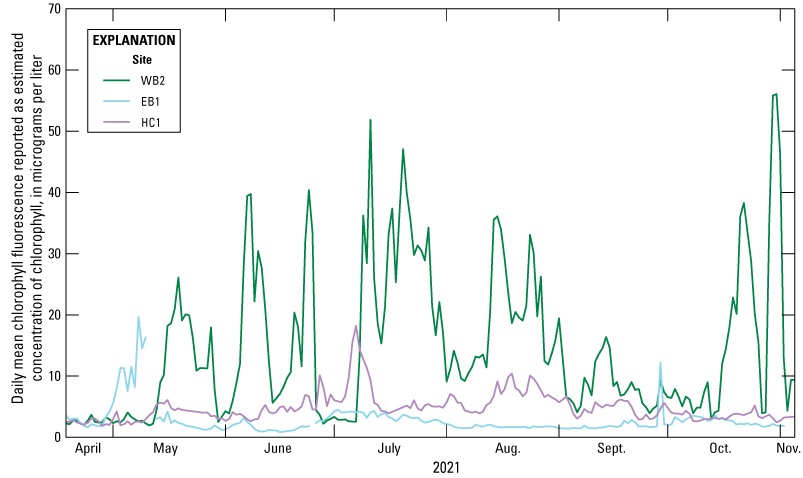
Graph showing daily mean chlorophyll concentrations at sites WB2, EB1, and HC1, May–November 2021, Grand Calumet River Area of Concern, northwest Indiana. Data from U.S. Geological Survey (2023).
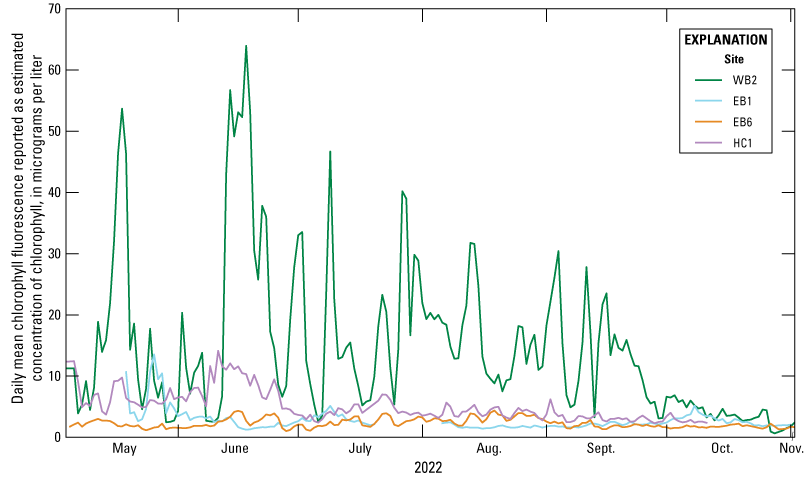
Graph showing daily mean chlorophyll concentrations at sites WB2, EB1, EB6, and HC1, May–November 2022, Grand Calumet River Area of Concern, northwest Indiana. Data from U.S. Geological Survey (2023).
Cyanobacteria and Eukaryotic Algae Communities Data
Environmental DNA Extractions
For cyanobacteria, there were a total of 277,523 reads (DNA fragments corresponding to cyanobacteria). Total cyanobacterial reads per site ranged from 3,037 in site WB2 samples to 187,763 in site LG1 samples (Aunins and others, 2023). Cyanobacterial reads by 2021 sampling event (month) at each of the sites can be seen in figure 10A and ranged from 36 in site EB1 samples in April to 109,234 in site LG1 samples in September. For eukaryotic algae, there were a total of 1,561,210 reads, and overall sample site eukaryotic reads ranged from 45,913 in site EB1 samples to 443,570 in site HC1 samples. Eukaryotic reads by sampling event (month) at each of the sites can be seen in figure 10B and ranged from 9,293 at EB1 in July to 209,317 at HC1 in July (Aunins and others, 2023).
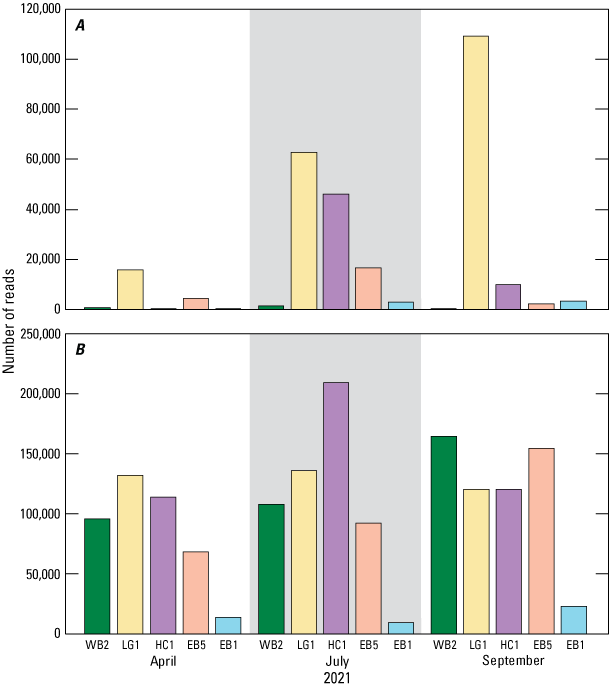
Graphs showing the number of environmental deoxyribonucleic acid (DNA) reads corresponding to A, cyanobacteria and B, eukaryotic algae by sampling month for sites WB2, LG1, HC1, EB5, and EB1 in 2021, Grand Calumet River Area of Concern, northwest Indiana. Data from Aunins and others (2023).
Relative Abundance of Cyanobacteria Taxa
Cyanobiaceae (37.5 percent), Microcystaceae (18.9 percent), and Phormidiaceae (15.9 percent) were the three most common and abundant (percent relative abundance) cyanobacteria families in the samples (sites and seasons combined; Anagnostidis and Komárek 1988; Salazar and others, 2020). Other common taxa were Oscillatoriaceae (10.7 percent), Pseudanabaenaceae (3.9 percent), and Nodosilineaceae (0.8 percent). Cyanobacteria differed among sites over time, with EB1 having different communities but less diversity than sites WB2, LG1, HC1, and EB5 (fig. 11). The April and September 2021 communities were more diverse among sites than those in July 2021. In April, Phormidiaceae at sites EB5 and HC1 and Cyanobiaceae at site LG1 were predominant. In July 2021, there was a large shift in communities at sites WB2, LG1, HC1, and EB5 where Cyanobiaceae generally became the most abundant taxa. In comparison, site EB1 was predominantly Microcystaceae. In September, community diversity at these sites was again greater, excluding EB1. However, dominant taxa and abundance at sites WB2, LG1, HC1, and EB5 differed from those in July, with Oscillatoriaceae being most common at sites HC1 and EB5 and Cyanobiaceae being most common at sites WB2 and LG1. The reference site EB1 was dissimilar to other sites, with Microcystaceae being the most dominant taxa in all sampling months.
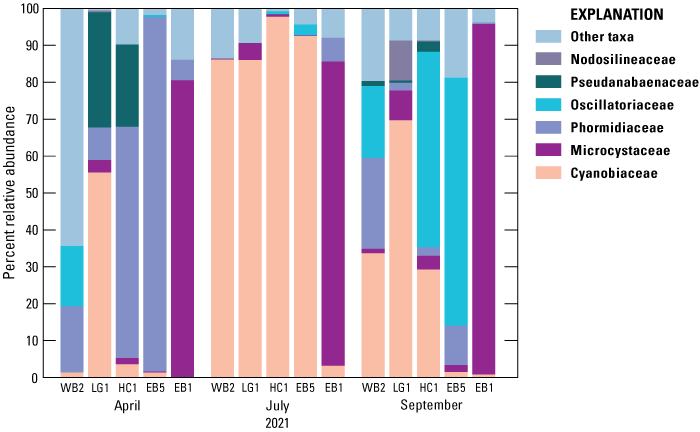
Graph showing the percent relative abundance of cyanobacteria taxa identified at sites WB2, LG1, HC1, EB5, and EB1 in 2021, Grand Calumet River Area of Concern, northwest Indiana. Data from Byappanahalli and others (2023).
Relative Abundance of Eukaryotic Algae Taxa
Across all sites and seasons, the subkingdom Viridiplantae (green algae, 38.8 percent), the class Cryptophyceae (18.3 percent), and the class Bacillariophyceae (diatoms, 14.3 percent) were the three most abundant (percent relative abundance) eukaryotic algae in the samples. The class Chrysophyceae (golden algae, 4.2 percent), the class Dinophyceae (dinoflagellates, 2.2 percent), and the class Bigyra (1.2 percent) were also common taxa across sites (fig. 12). The eukaryotic algal communities were generally diverse at all sites, and like the cyanobacteria results, communities differed both within and among sites over time.
Eukaryotic algae had greater community diversity compared with the cyanobacteria during the sampling period, though spatial variance was less prominent. Temporal shifts were noted, particularly from April to July and September, because Chrysophyceae was largely more abundant in April compared with other months. In July, the population was relatively stable compared with the other months because there was not one community that was most abundant among all sites, and from July to September there was a community shift toward Viridiplantae. Similar to the cyanobacterial algae results, the eukaryotic algae community at reference site EB1 was again dissimilar to other sites, with Cryptophyceae being the most abundant taxa in April and September and Viridiplantae in July.
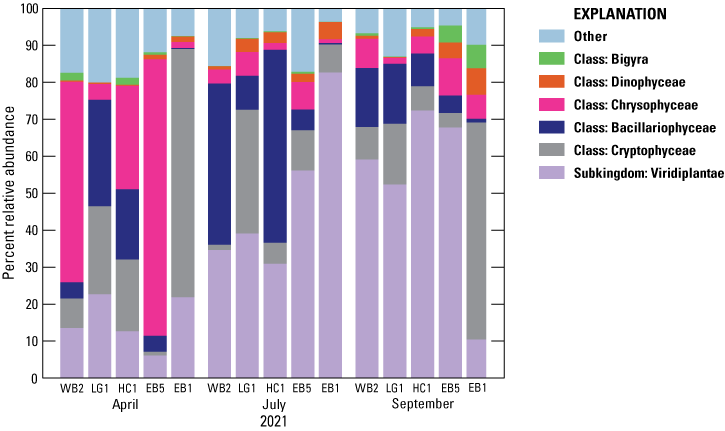
Graph showing the percent relative abundance of eukaryotic algae taxa identified at WB2, LG1, HC1, EB5, and EB1 in 2021, Grand Calumet River Area of Concern, northwest Indiana. Data from Byappanahalli and others (2023).
Overall Abundance of Algae Identified
In addition to identifying and comparing relative abundance of eukaryotic algae and cyanobacteria, analysis of all algal communities (cyanobacteria, diatoms and dinoflagellates, golden algae, green algae, yellow-green algae, and other) was performed. The five major algal groups that were defined in the dataset were generally present at all sites in each month; the exception was yellow-green algae, which was not found at site EB1 in July (table 7; fig. 13). Overall, green algae (33.0 percent) were the most abundant group among the samples. Cyanobacteria were most abundant at sites LG1 (29.9 percent) and EB1 (12.6 percent); diatoms and dinoflagellates were most abundant at sites HC1 (24.8 percent) and WB2 (21.7 percent); golden algae were most abundant at sites EB5 (28.8 percent) and WB2 (21.7 percent); green algae were also most abundant at sites EB5 (40.0 percent) and WB2 (35.4 percent); and yellow-green algae were most abundant at sites HC1 (0.98 percent) and WB2 (0.81 percent). By month, golden algae were the most abundant in April (31.4 percent) and green algae were the most abundant in July and September (39.2 percent and 45.8 percent, respectively). There were clear seasonal community shifts in algal groups at each of the sites (table 7; fig. 13). Relative algal abundance at sites WB2, HC1, and EB5 changed in similar ways, whereas LG1 and EB1 had distinct relative algal abundances and seasonal community shifts.
Table 7.
Algal groups and their relative abundances from 2021 discrete sampling at selected sites.[Data from Byappanahalli and others (2023). Relative abundance is given in percent. Other, taxa that do not fall into one of the assigned taxonomic groupings]
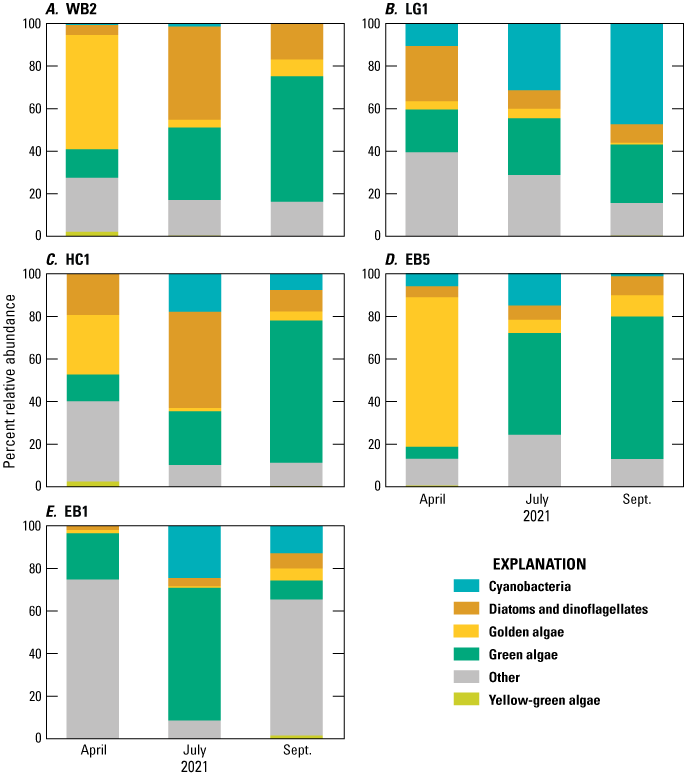
Graphs showing percent relative abundance of the main algal groups at sites A, WB2, B, LG1, C, HC1, D, EB5, and E, EB1 in 2021. Site information in table 1 and figure 1. Data from Byappanahalli and others (2023).
Maximum, average, and minimum continuous water-quality data for water temperature, dissolved oxygen, SC, and chlorophyll concentrations from one week before through one week after cyanobacteria and eukaryotic algae sampling events are presented in table 8. Table 8 also shows the most abundant cyanobacteria, eukaryotic algae, and algal groups for each metagenomics sampling event.
Table 8.
Summary statistics of temperature, dissolved oxygen, specific conductance, and chlorophyll concentration 1 week before and 1 week after three cyanobacterial and eukaryotic algae community sampling events at selected study area sites in 2021.[Data from Byappanahalli and others (2023) and U.S. Geological Survey (2023). Site location information is in table 1 and figure 1. °C, degrees Celsius; mg/L, milligrams per liter; µS/cm, microsiemens per centimeter at 25 degrees Celsius; µg/L, micrograms per liter; max, maximum; avg, average; min, minimum; —, not applicable]
Site LG1 had both the coolest and warmest water temperature readings of all the algal sampling event sites, most likely because of its shallow depth and stagnant water condition (fig. 14A). Site WB2 had the largest range of dissolved oxygen concentration during all periods of algal sampling of all five sites, but site HC1 had greater than 10 mg/L variance for two of the three sampling events that included dissolved oxygen measurements below the Indiana Department of Environmental Management community standard of 4.0 mg/L. Sites HC1 and EB1 also had two sampling events with dissolved oxygen concentrations less than 4.0 mg/L. Dissolved oxygen concentrations at site EB5 were the most stable during the algal sampling period, and concentrations remained greater than 4.0 mg/L. Sites WB2 and HC1 had high overall chlorophyll concentrations that increased over the three algal sampling events, whereas sites EB5 and EB1 had chlorophyll concentrations that decreased between the July and September sampling events.
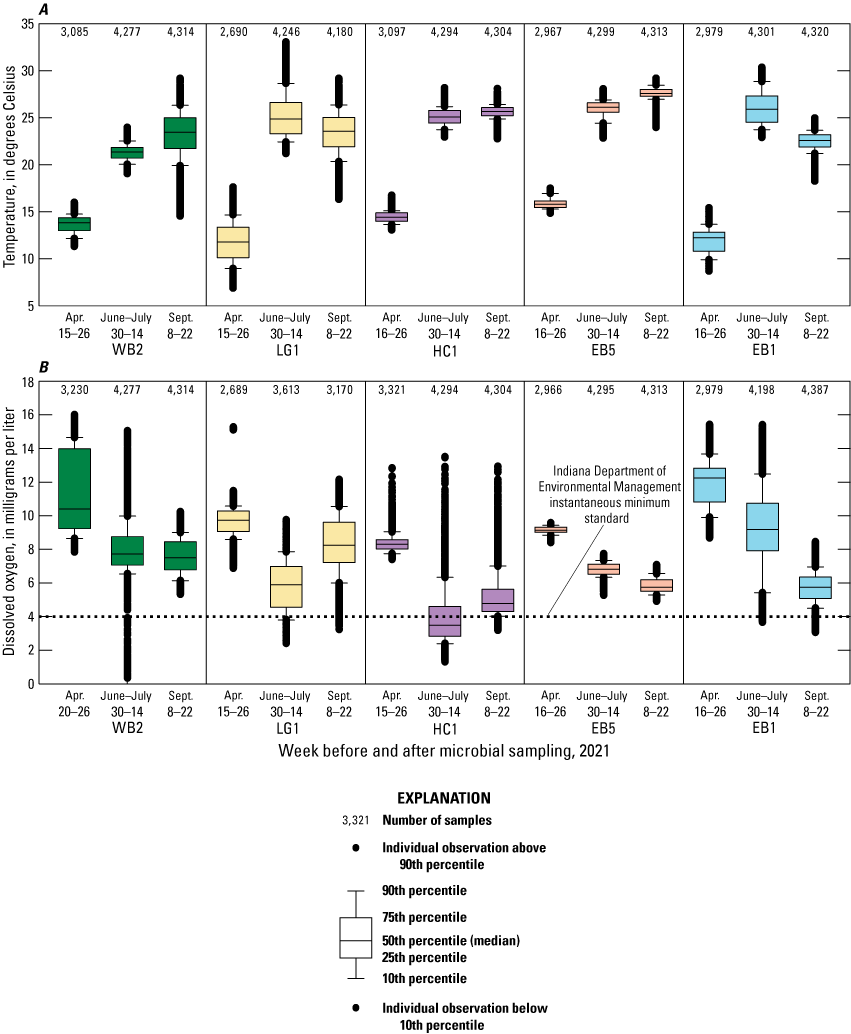
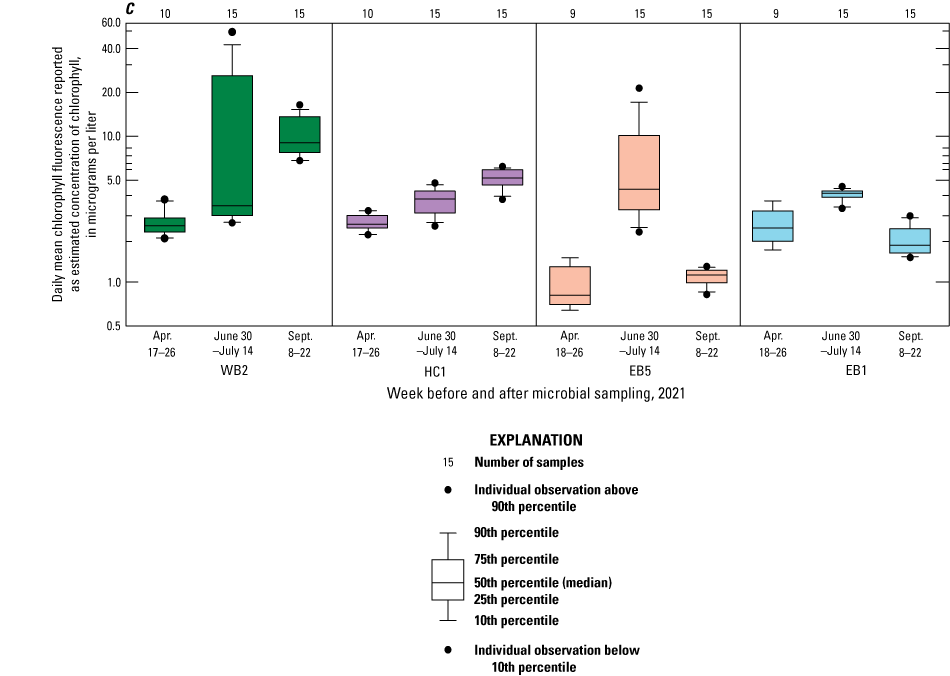
Box-and-whisker plots showing continuously collected A, water temperature, B, dissolved oxygen, and C, chlorophyll concentration in water at sites WB2, LG1, HC1, EB5, and EB1 from one week before and one week after the April 19–20, July 7, and September 15, 2021, cyanobacteria and eukaryotic algae sampling events, Grand Calumet River Area of Concern, northwest Indiana. Data from U.S. Geological Survey (2023).
Discrete Water-Quality Data
Discrete water samples were collected for ammonia, nitrite, nitrate, orthophosphate, and phosphorous concentrations at sites WB2, EB6, and EB1 in 2022 (fig. 3; table 1). Additionally, water samples were collected for biological and chemical oxygen demand and for isotopic compositions of nitrate and water (table 9).
Table 9.
Water-quality parameters, nutrient concentrations, and stable isotopic compositions of nitrate and water for discrete samples collected in 2022.[Data from U.S. Geological Survey (2023). Dates are shown as month/day. Time is shown as hour:minute. WT, water temperature; °C, degrees Celsius; SC, specific conductance; µS/cm, microsiemens per centimeter at 25 degrees Celsius; DO, dissolved oxygen; mg/L, milligrams per liter; NH3, ammonia; NO2 ,nitrite; NO3, nitrate; Org. N, organic nitrogen; N, total nitrogen; P, phosphorus; PO4, orthophosphate; δ15N, stable isotopic composition of nitrogen; ‰, parts per thousand or per mil; δ18O, stable isotopic composition of oxygen; δ2H, stable isotopic composition of hydrogen; COD, chemical oxygen demand; BOD, biological oxygen demand; <, less than; NM, not measured; NA, nitrate values below required limit for analysis]
Observed Conditions During Discrete Sampling
The range of values for water temperature, pH, and dissolved oxygen recorded during sampling events overlapped at WB2, EB6, and EB1 (tables 9 and 10). At these sites, the value ranges of specific conductance at EB6 and EB1 were similar, but did not overlap with WB2. Specifically, the minimum specific conductance recorded at WB2 was greater than the maximum specific conductance values at EB6 and EB1. Though they overlapped, the range and maximum values of instantaneous dissolved oxygen concentrations observed during the sampling events at WB2 were greater than those at EB6 and EB1 (table 10).
Table 10.
Ranges and average instantaneous values of specific conductance and dissolved oxygen during discrete sampling at selected sites, Grand Calumet River Area of Concern, northwest Indiana, 2022.[Data from U.S. Geological Survey (2023). ID, identification; µS/cm, microsiemens per centimeter at 25 degrees Celsius; mg/L, milligrams per liter]
Nutrients
Nutrient samples were collected monthly during the 2022 study period and during a storm event from August 3 through 8, 2022, at WB2, EB6, and EB1 (fig. 15; table 9). WB2 had the highest average concentrations of nitrate, phosphorus, and orthophosphate and EB6 had the highest average concentrations of ammonia and nitrite. EB1 had the lowest nutrient concentrations, with nondetections for all nutrient concentrations except for phosphorous. Water samples collected from site WB2 had lower concentrations of ammonia and nitrite than the ammonia and nitrite concentrations in samples collected at EB6 (table 11; fig. 15).
Table 11.
Ranges and average instantaneous values of nutrients during discrete sampling at selected sites, Grand Calumet River Area of Concern, northwest Indiana, 2022.[Data from U.S. Geological Survey (2023). ID, identification; mg/L, milligrams per liter; Avg., average; <, less than]
Graph showing nitrate and dissolved oxygen concentrations at A, B, site WB2 and C, D, site EB6 by 2022 sampling date, Grand Calumet River Area of Concern, northwest Indiana.
Stable Isotopic Composition
Isotopic compositions of nitrate and water can determine the source of nitrate, and if the water has undergone evaporation or mixing (tables 9 and 12; fig. 16C). All dual-nitrate isotope sample (18O and 15N isotopes) results from sites WB2 and EB6 were within either the isotopic range of nitrate from soil organic nitrogen and CSO (figs. 16A and 16B) or nitrate solely from CSO (fig. 16B) for values of δ15N in nitrate and δ18O in nitrate (Xue and others, 2012; Divers and others, 2014; and Zhang and others, 2018). All δ15N in nitrate values at EB6 were less than the 8 per mil threshold corresponding to soil organic nitrogen and CSO events (fig. 17). Values from samples collected at WB2 in May, June, and July 2022 were less than 8 per mil, but results for the rest of the sampling period through October were greater than the 8 per mil threshold.
Table 12.
Ranges and average instantaneous values of dual-water isotopes during discrete sampling at selected sites, Grand Calumet River Area of Concern, northwest Indiana, 2022.[Data from U.S. Geological Survey (2023). ID, identification; δ2H, stable isotopic composition of hydrogen; δ18O, stable isotopic composition of oxygen; δ15N, stable isotopic composition of nitrogen; Avg., average]
Graphs showing A, nitrate as nitrogen concentration compared with the isotopic composition of nitrogen in nitrate, B, oxygen and nitrate isotopic composition in nitrate from various sources, and C, hydrogen versus oxygen isotopic composition in water samples collected at sites WB2, EB6, and EB1 in 2022, Grand Calumet River Area of Concern, northwest Indiana. Data from U.S. Geological Survey (2023).
Graph showing nitrogen isotopic composition in nitrate and dissolved oxygen concentrations at A, B, site WB2, and C, D, site EB6 by sampling date, May through October 2022, Grand Calumet River Area of Concern, northwest Indiana. Data from U.S. Geological Survey (2023).
Chemical and Biological Oxygen Demand
Chemical and biological oxygen demand results can help indicate potential eutrophication or hypoxic conditions in water bodies (Wetzel, 2001). Biological oxygen demand values above 5 mg/L may indicate elevated levels of organic matter, which can deplete oxygen and contribute to hypoxia, especially in stagnant waters. Chemical oxygen demand values above 100 mg/L indicate elevated conditions that can lead to eutrophication or hypoxic conditions. The highest chemical and biological oxygen demand values were found, in descending order, in water samples collected at WB2, EB1, and EB6 (fig. 18). At WB2, biological oxygen demand ranged from 2.00 to 5.30 mg/L, with an average of 3.43 mg/L; at EB1 it ranged from less than 2.00 to 4.00 mg/L, with an average of 2.80 mg/L; and at EB6, biological oxygen demand ranged from less than 2.00 to 2.90 mg/L, with an average of 2.32 mg/L. Chemical oxygen demand had trends similar to biological oxygen demand: chemical oxygen demand was highest at WB2 (26–44 mg/L, with an average of 33 mg/L), second highest at EB1 (less than 20–39 mg/L, with an average of 31 mg/L), and lowest at EB6 (16–29 mg/L, with an average of 22 mg/L). The largest variability in chemical and biological oxygen demand occurred at site WB2, followed by EB1. EB6 varied the least of the three sites.
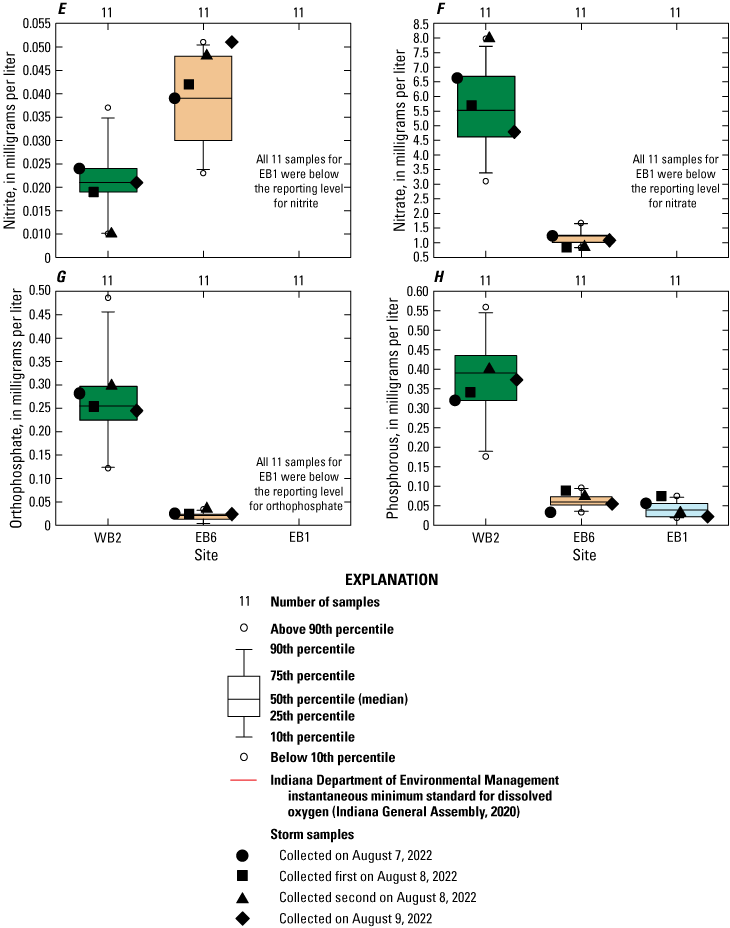
Box-and-whisker plots showing A, biological oxygen demand concentrations, B, chemical oxygen demand concentrations, C, dissolved oxygen concentrations, D, ammonia concentrations, E, nitrite concentrations, F, nitrate concentrations, G, orthophosphate concentrations, and H, phosphorous concentrations for samples collected at sites WB2, EB6, and EB1 in 2022, Grand Calumet River Area of Concern, northwest Indiana. Overlaid black shapes corresponding to specific dates refer to storm samples collected at every sample site. Data that were below the reporting limit were included in the box plot by multiplying the reporting limit by 0.5 for a given constituent. Data from U.S. Geological Survey (2023).
Results of Quality Control for Discrete Water-Quality Samples
The field blank at EB1 had no detects when analyzed for ammonia, nitrite, nitrite plus nitrate, total nitrogen, orthophosphate, and phosphorus (U.S. Geological Survey, 2023). All nutrient replicate samples at EB1 were below the detection limit, with the exception of phosphorus and total nitrogen. For phosphorus and total nitrogen, the relative percent difference between the quality assurance and discrete, study samples were above the 10 percent limit, and therefore those results were rejected. The replicate at EB1 had low nutrient levels that were qualified as not detected, which resulted in rejection of the EB1 quality assurance and quality control sample data. Except for biological oxygen demand and site EB1 nutrients results, the results of all other replicate samples had relative percent differences less than 10 percent. The methodology used for biological oxygen demand analysis allowed for a relative percent difference of 20 percent between a sample and the replicate for the sample to be verified as valid (U.S. Environmental Protection Agency, 1993). At EB1 the biological oxygen demand relative percent difference was 14.6 percent and at EB6 the replicate samples were below the minimum reporting limit of 1.9 mg/L. At WB2 the relative percent difference limit of 20 percent between the sample and replicate was exceeded (31.6 percent), which may have been a result of natural variation in the water column due to a combination of changing conditions in the water column at this site.
Water-Quality Conditions by Remediation Status
Continuous water-quality monitoring was used to assess conditions between remediated and unremediated sites. Data from upstream and downstream sites were compared where flow and sampling regimes permitted. A description of the flow dynamics is available in the “Study Area” section of this report, and flow dynamics are shown in figure 1. A description of the remediation statuses is available in the “Remediation Efforts” section of this report. The remediated condition of each of the 13 monitoring locations is available in table 1.
In both the east and west branches of the Grand Calumet River, there was not a strong correlation in how the remediation status affected dissolved oxygen concentrations. Regardless of remediation status, 7 of the 13 sites had more than 10 percent of monitored days when instantaneous minimum dissolved oxygen concentration decreased to less than the 4.0 mg/L threshold. Dissolved oxygen concentrations at the most upstream site in the east branch Grand Calumet River (EB1, the reference site) ranged from 0.0 to 21.3 mg/L during the 2021 and 2022 study periods. For comparison, in unaffected freshwater at 1 atmosphere of pressure, dissolved oxygen concentrations should range from 7.43 mg/L at 14 °C to 10.31 mg/L at 31 °C (U.S. Geological Survey, 2020).
Instantaneous minimum dissolved oxygen concentrations recorded for sites in each remediation condition were grouped to help identify any differences in dissolved oxygen range for the different remediated conditions in 2021 while all sites were being monitored (table 1; fig. 19). Sites with a dredged remediated condition (sites EB4, EB3, and EB2) had the smallest range of dissolved oxygen concentrations (about 2–10 mg/L), whereas sites with an unremediated condition (sites WB3, LG1, HC1, HC2, EB6, and EB5) had the largest ranges (about 0–16 mg/L). Sites with a dredged and capped condition (sites WB1, WB2, and EB7) ranged from 0 to about 13 mg/L dissolved oxygen. Dissolved oxygen concentrations at the background, unremediated site (EB1) ranged from about 2 to 16 mg/L.

Box-and-whisker plot showing instantaneous minimum dissolved oxygen concentrations measured in 2021 for each of the remediation statuses, Grand Calumet River Area of Concern, northwest Indiana. Data from U.S. Geological Survey (2023).
Daily dissolved oxygen flux was calculated for each monitoring location during the 2021 monitoring period by subtracting the daily minimum recorded dissolved oxygen concentration from the daily maximum concentration (fig. 20). Site WB3 (unremediated) had the largest daily dissolved oxygen flux at 21.61 mg/L. Site EB2 (remediated) had the lowest range in daily dissolved oxygen flux at 4.03 mg/L. Sites in the U.S. Steel remediation area with a dredged remediated condition (EB2, EB3, and EB4) and the next downstream site in the east branch Grand Calumet River (EB5) had lower daily dissolved oxygen flux values than the other monitored locations. Site EB7 (east branch Grand Calumet River; dredged and capped) had the largest daily dissolved oxygen fluxes. Large daily differences in dissolved oxygen may indicate increased periods of photosynthesis during the day and increased respiration at night (Wetzel, 2001).
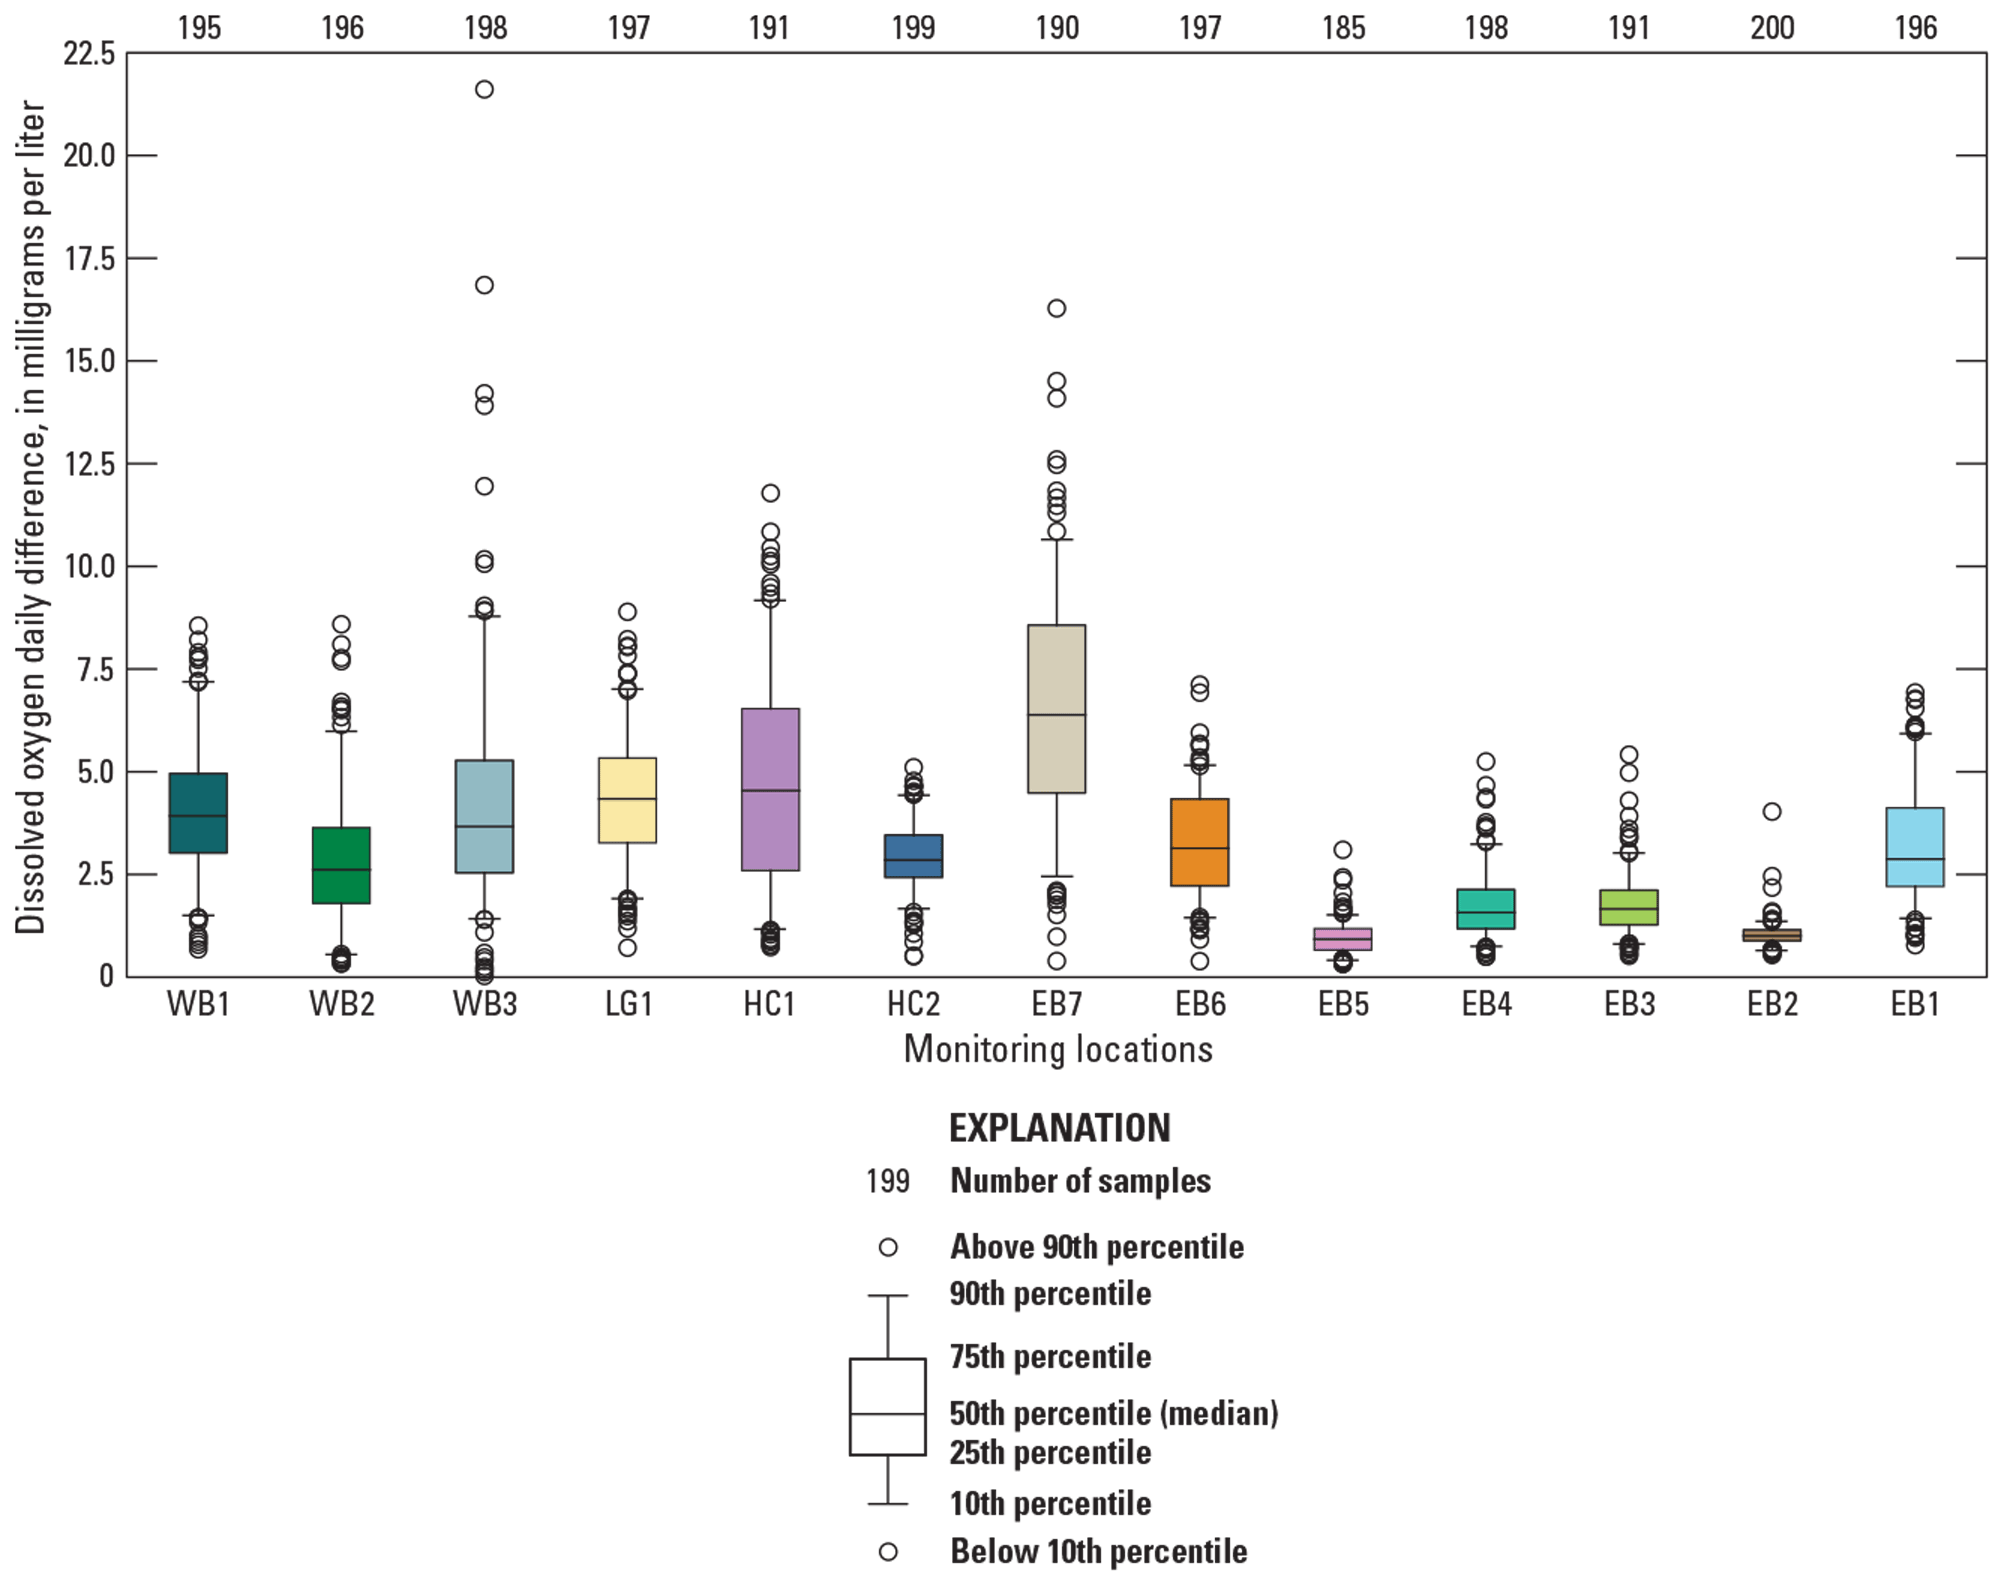
Box-and-whisker plots showing the daily difference in dissolved oxygen concentrations for each monitoring location measured in 2021, Grand Calumet River Area of Concern, northwest Indiana. Data from U.S. Geological Survey (2023).
In the U.S. Steel remediation area, downstream from the reference site, the river has been dredged, leading to greater stream depths, which may affect eutrophication processes and water quality. For example, as depth increases, light penetration decreases, especially if the water is not clear. This decreases photosynthetic activity, regardless of nutrient availability. There are three monitoring locations (EB2, EB3, and EB4) and two active CSOs (Chase and Polk) in this remediation area (fig. 3; table 2). Dissolved oxygen concentrations were generally higher and less varied at EB2 (0 days of dissolved oxygen daily mean values below 5.0 mg/L in 2021; table 5) than at the reference site EB1 (29 days of dissolved oxygen instantaneous minimum values below 4.0 mg/L in 2021; table 5), possibly due to better mixing of the water column or increased water column depth and lower water temperature at EB2. Downstream from the U.S. Steel remediation area at EB5, dissolved oxygen remained primarily above 4.0 mg/L, except for one occurrence on June 25, 2021. The monitoring site EB6 is just upstream from the east branch remediation area and receives water from an about 2 mile long unremediated reach with two active CSOs (Alder and Colfax; fig. 3; table 2). The instantaneous minimum dissolved oxygen concentrations remained below 4.0 mg/L from June 24 to August 22, 2021, and again from August 31 to September 24, 2021 (the daily mean was below 5.0 mg/L for 93 days; table 5). Similar results were seen at site EB7 within the east branch remediation area.
The highest dissolved oxygen concentrations within the east branch Grand Calumet River, including supersaturated conditions, were measured at site EB7 and could be caused by high rates of photosynthesis during periods of high algal productivity (U.S. Geological Survey, 2020). Supersaturated conditions occurred periodically at 7 of the 13 sites monitored in 2021 (EB1, EB4, EB7, LG1, WB1, WB2, and HC1) and at all 5 sites monitored in 2022 (EB1, EB7, WB1, WB2, and HC1). The supersaturated dissolved oxygen conditions indicate that eutrophic conditions were present in both the east and west branches of the Grand Calumet River during 2021 and 2022 and occurred regardless of remediation status (table 5; Wetzel, 2001). This result indicates that elevated levels of some contaminants remain, despite remediation efforts in both branches of the Grand Calumet River and the findings of Steevens and others (2020) and despite the hydraulic dredging that occurred from December 2002 through November 2003 in the U.S. Steel remediation area.
Mean and minimum daily dissolved oxygen concentrations were compared for two site pairs each consisting of one site receiving waters from a remediated reach and one site receiving waters from an unremediated reach. The east branch remediation area sites, EB6 and EB7, and the U.S. Steel remediation area sites, EB2 and EB5, showed few similarities in changing dissolved oxygen concentrations. Between EB6 and EB7, minimum dissolved oxygen was lower at the remediated site (EB7) than the unremediated site (EB6) on about 62 percent of days when minimum dissolved oxygen was calculated at both sites. Between EB2 and EB5, minimum dissolved oxygen was lower at the remediated site (EB2) than the unremediated site (EB5) on about 95 percent of days when minimum dissolved oxygen was available at both sites, and of the days when it was lower at EB5 it was below the Indiana Department of Environmental Management threshold of 5.0 mg/L on about 5 percent of days. This complicates the expectation that remediation should cause dissolved oxygen values to be higher on average.
The west branch Grand Calumet River experiences flow reversals and CSO releases, both of which affect dissolved oxygen levels at west branch sites (figs. 1 and 3). The waters received by WB1 and WB2 vary as a result of the flow reversals. During normal flow conditions water flows from just east of WB2 to WB1, but during flow reversals waters from Lake Michigan flow back up the Indiana Harbor Canal and push Grand Calumet River waters east from the confluences of the Indiana Harbor Canal and Grand Calumet River past all west branch sites (fig. 1). These flow reversals also change which CSOs affect sites in the west branch. During normal flow conditions the CSO Storage Basin flows reach WB1 and no CSOs affect WB2. During flow reversals the Magoun CSO affects WB1 and WB2, whereas the CSO Storage Basin continues to exclusively affect WB1. WB1 was below the Indiana Department of Environmental Management daily mean and instantaneous minimum thresholds for dissolved oxygen on a larger number of days than WB2 in 2021 (table 5). In addition, WB1 had more supersaturation events than WB2. These extremes are evidence of eutrophic conditions occurring at WB1, despite the water having flowed through a remediated reach. This could relate to the CSO events that affect waters at WB1. At both WB2 and WB1, dissolved oxygen concentrations decreased in June and July 2021. At WB1, during one CSO event dissolved oxygen reached about 4.0 mg/L in July 2021. Dissolved oxygen concentrations at WB2 fluctuated with instantaneous dissolved oxygen concentration transitioning quickly from nearly 0 mg/L to close to 5.0 mg/L three times in June and July 2021 (fig. 6). These transitions all occurred on days when the CSO Storage Basin was releasing, suggesting that CSOs can have a strong effect on dissolved oxygen concentrations that overrides the effect of temperature or remediation status. After July 2021, dissolved oxygen concentrations increased to above 5.0 mg/L and remained between 5.0 and 10 mg/L for the rest of the 2021 monitoring season (U.S. Geological Survey, 2023).
Combined Sewer Overflow Events and Water-Quality Changes
Eight CSOs were active within the monitored reaches of the Grand Calumet River and Indiana Harbor Canal during the monitoring periods within and outside of remediated areas (figs. 1 and 3; table 2). The remediated reach monitoring sites subject to potential CSO effects were WB2, EB4, EB3, and EB2 (table 2). The remaining sites, EB6, EB5, WB3 and HC1, were in unremediated reaches and received water from nearby CSOs. There was a CSO near EB7, a remediated site, but it was downstream from the monitoring site and therefore was not expected to affect water quality at the site (fig. 3). CSO releases can push large quantities of sewage, sludge, and runoff materials into the water, which can cause a spike in nutrient availability, especially ammonia, and can increase nitrification rates and decrease dissolved oxygen (Atauzzaman and Ali, 2022). Storms can also resuspend sediment from the bottom of rivers which could change nutrient concentrations regardless of CSO proximity or releases. Discrete sampling results reflect monthly sampling and sampling before, during, and after one storm event. The following descriptions are what was noticed for this specific sampling. Selected monitoring periods were graphically analyzed to determine the effect of storm events and CSOs on receiving waters (figs. 6 and 7).
Dissolved Oxygen Response to CSO Events
The effects of CSOs were muted at unremediated sites compared with effects at remediated sites when comparing continuous water-quality parameters associated with storms. For example, dredged sites and dredged and capped sites had a lower proportion of days below 5.0 mg/L of dissolved oxygen concentrations than unremediated sites (table 5) in 2021. The dredged and dredged and capped sites had an average of 11.5 days in which the daily mean of dissolved oxygen fell below 5.0 mg/L, whereas the unremediated sites for the same time period had an average of 47.9 days in which the daily mean fell below 5.0 mg/L (fig. 19). This may be because levels of nutrients released from unremediated sediments led to growth of organic matter that caused increased use of oxygen (resulting in lower dissolved oxygen concentrations) during decomposition as shown by the fact that the lowest dissolved oxygen concentrations often occurred at unremediated sites (table 5). Monitoring locations in unremediated reaches had the largest daily differences in dissolved oxygen concentrations, indicating that more algal growth and decomposition could be taking place at these locations (fig. 20).
Low dissolved oxygen events often followed CSO releases at EB4 (fig. 7A). At EB4, a 19.6 Mgal CSO release from the Chase CSO on June 26, 2021, was followed by a drop in dissolved oxygen below 4.0 mg/L that persisted for about half of June 27, 2021, and decreased dissolved oxygen below the 5.0 mg/L daily mean dissolved oxygen threshold. During the weeks before the June 26 CSO release, dissolved oxygen at EB4 showed a typical diurnal pattern. By June 30, dissolved oxygen had returned to a more typical pattern until a subsequent 5.87 Mgal CSO release resulted in only a very slight decline but remained above the 5.0 mg/L dissolved oxygen threshold.
At EB3, noticeable dissolved oxygen concentration responses can be seen from small CSO releases (fig. 7B). From June 24 to 26, 2021, the Chase CSO (table 2; fig. 3) discharged a total release of no greater than 0.45 million gallons per day (Mgal/d). On the third day, dissolved oxygen concentrations decreased sharply from 8.19 to 5.34 mg/L. Similarly, on October 3, 2021, a release of less than 0.2 Mgal coincided with a decrease of about 1.5 mg/L in dissolved oxygen concentration. Finally, from October 24 to 25, 2021, concurrent with a 0.14 Mgal of discharge, dissolved oxygen fell from 7.14 to 2.80 mg/L over 8 hours. It is unclear why CSO releases had such a strong effect at EB3. During a storm event from August 3 to 9, 2022, the typical diurnal cycle of dissolved oxygen was broken at site WB2, when on August 6 dissolved oxygen concentrations fell from more than 12.52 mg/L to 6.95 mg/L in about 32 hours after a CSO event at Magoun of 1.19 Mgal/d (about 1 mile east of WB2; fig. 3; fig. 21).
In addition to storm-related CSO releases, in September 2022 a sinkhole developed in East Chicago, breaking a sewage main that led to uncontrolled releases at the Alder CSO (figs. 1 and 3; Pete, 2022) from September 28 through October 10. The uncontrolled CSO release discharged a total of 111.8 Mgal of effluent into the east branch Grand Calumet River about 300 feet upstream from EB6 and approximately 1.5 river miles above EB7 (Pete, 2022). At EB6, the dissolved oxygen concentration patterns continued to be dominated by the typical diurnal signal. However, over the days of releases there was an increase in the daily high and low dissolved oxygen concentrations for each daily cycle. On September 28, the minimum and maximum were 5.1 and 7.04 mg/L, respectively, whereas on October 10, the minimum and maximum were 6.1 and 8.6 mg/L, respectively. During this time, chlorophyll concentrations decreased slightly but, overall, showed the normal diurnal variation (fig. 21).
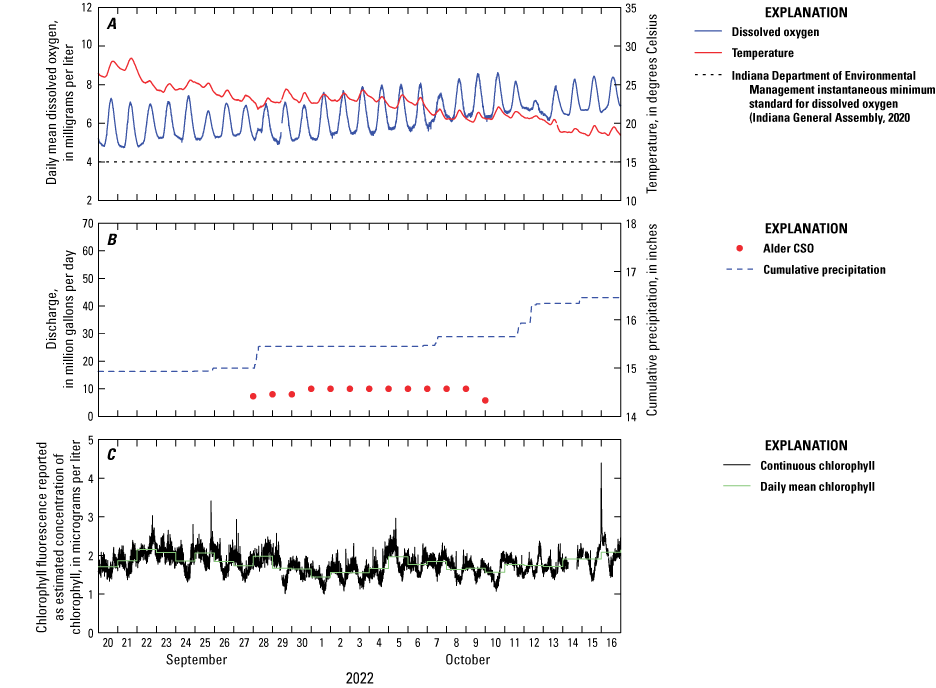
Graphs showing A, dissolved oxygen and water temperature, B, cumulative precipitation and discharge from the Alder CSO, and C, chlorophyll concentrations at monitoring location EB6, September 20 through October 16, 2022, Grand Calumet River Area of Concern, northwest Indiana. Data from U.S. Geological Survey (2023).
Chlorophyll Concentration Response to CSO Events
In addition to affecting dissolved oxygen concentrations, changing conditions from CSO releases also seemed to affect chlorophyll concentrations. At site WB2, chlorophyll concentrations had been increasing from approximately 12.5 to 58.5 µg/L for a week prior to the CSO Storage Basin and Magoun CSO releases from June 25 through July 5, 2021 (about 467 Mgal in 12 days; fig. 6). The Magoun CSO affected the site during times of flow reversal, which are indicated by negative discharge readings at the site. On June 25, chlorophyll concentrations dropped to less than 5 µg/L and remained low. The mean concentration remained between 2 and 4 µg/L until after releases from the CSO storage basin and Magoon CSO ended on July 6, by July 8 chlorophyll concentrations recovered to similar levels to those recorded prior to rain and releases.
In September and October 2022, chlorophyll concentration was also recorded at EB6, where there were 13 consecutive days of CSO releases from Alder CSO (fig. 21). Similar to chlorophyll concentrations at WB2, concentrations at EB6 increased after the first day of the CSO release, then fell over the following 3 days. It spiked again on day 8 of the release, then once again fell. Observed decreases in chlorophyll concentrations could be the result of dilution related to the influx of stormwater from the event.
Other Water-Quality Parameter Responses to CSO Events
Storm events caused CSO releases on August 6 and 7, 2022, at Magoun (about 1 mile east of WB2; fig. 3) of 0.28 and 0.91 Mgal/d, respectively. At WB2, prior to the storm, continuous nitrate plus nitrite values fluctuated between about 4 and 7 mg/L. After the storm, instantaneous nitrate plus nitrite concentration went through two cycles of rapid rise and rapid fall with changes of as much as 6 mg/L over less than 24 hours (fig. 22). The storm also caused increased concentrations of nitrate (4.62 mg/L on August 3, 6.63 mg/L on August 7, and 5.69 mg/L on August 8; table 9; fig. 18A) and of biological oxygen demand at WB2 (3.90 mg/L on August 3, 4.20 mg/L on August 7, and 5.30 mg/L on August 8; table 9), likely caused by bacteria oxidizing waste products (Bernhard, 2010). This storm sampling also showed a slight increase in ammonia concentrations at WB2 (less than 0.04 mg/L on August 3, and 0.06 mg/L on August 7 and 8; table 9). Although these ammonia concentrations were small increases compared to the reporting limit of 0.04 mg/L, all the other monthly sampling events at WB2 (aside from July 7, 2022) showed ammonia concentrations below the reporting limit.
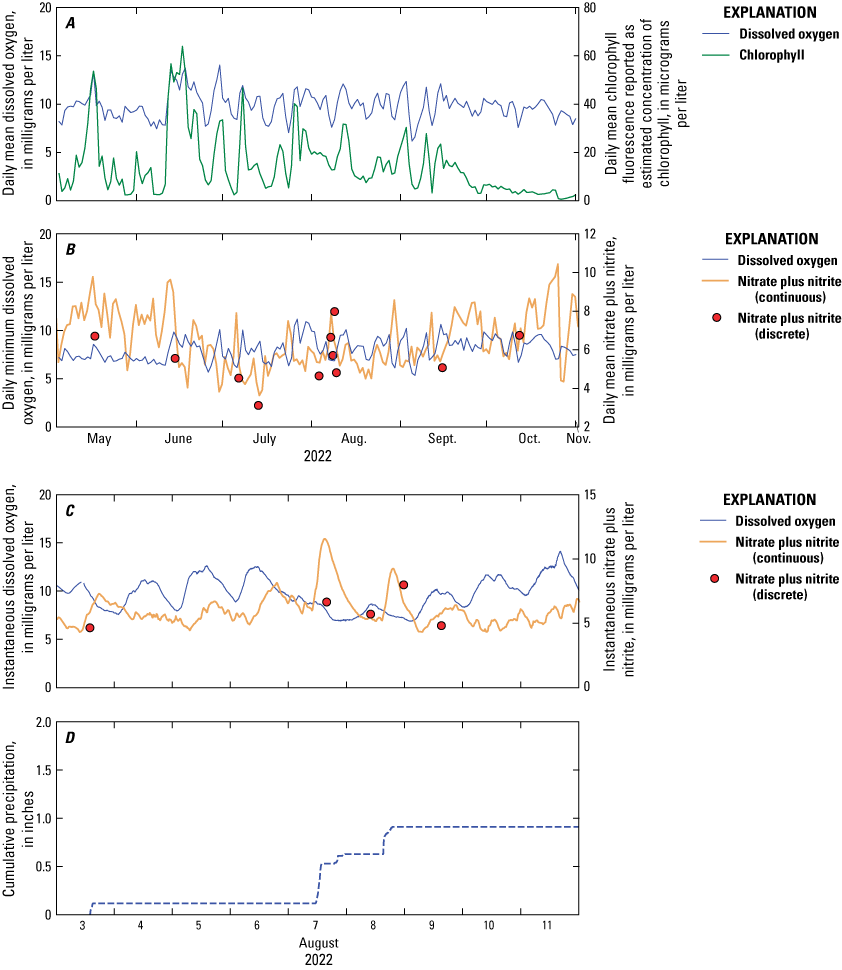
Graphs showing A, daily mean dissolved oxygen and daily mean chlorophyll concentration and B, daily minimum dissolved oxygen and daily mean nitrate plus nitrite and discrete nitrate plus nitrite sample values at monitoring location WB2, May through November 2022; and C, instantaneous dissolved oxygen and daily mean nitrate plus nitrite and discrete nitrate plus nitrite sample values at monitoring location WB2 and D, cumulative precipitation for the storm event sampling period August 3 through August 11, 2022, Grand Calumet River Area of Concern, northwest Indiana. Data from U.S. Geological Survey (2023).
Algal Community Analysis
Overall, cyanobacteria and eukaryotic algae showed distinct spatial and temporal distributions at the sampled sites (figs. 11 and 12) that were similar to observations from other studies of riverine systems (Hamilton and others, 2011; Banerji and others, 2018; Manier and others, 2021; Sindt and Wolf, 2021). The spatial differences and temporal shifts in the algal communities were likely associated with abiotic factors such as nutrient inputs, CSO events, water temperature, sunlight, land use, and water flow (Gast and others, 1990; Hamilton and others, 2011; Zhao and others, 2017; Bao and others, 2022). However, biotic factors, which can be influenced by abiotic factors, may in turn influence algal community shifts (Wang and others, 2021). Nuisance algal blooms potentially influence other algal species: for instance, certain cyanobacteria can fix atmospheric nitrogen (Fay, 1992; Byappanahalli and others, 2019; Kim and others, 2020; Wang and others, 2021), which can promote growth of such species (Kim and others, 2020). For example, in a mesocosm study, Kim and others (2020) found that non-nitrogen fixing cyanobacteria were more stimulated by nitrogen treatments than phosphorus treatments. Furthermore, cyanobacteria have inherent traits that promote their dominance over eukaryotic algae (Huisman and others, 2018; Wang and others, 2021).
The sampling sites were chosen because they were geographically distinct with their own potential microclimate, nutrient inputs, juxtaposition to CSOs, remediation status, and flow regime. Therefore, it is reasonable to assume algal communities would also be different among sites and over time. Although there were several CSO events that occurred during this study, any direct relationship between these events and our observed patterns of algal communities in terms of both abundance and spatial distributions is tenuous because of the limited sampling regime. However, it should be noted that nutrients from CSO releases can lead to increased cyanobacterial and algal activity, including occurrences of algal blooms (Gast and others, 1990; Gleich, 2019). For example, Gast and others (1990) sampled algae at 63 locations that received different combinations of sewer system discharges and found that locations with a combined sewer system had an immediate decrease in algal biomass and species diversity due to flushing; however, this decrease was followed by an increase in algal biomass and sometimes algal blooms.
One of the overarching goals of this study was to assess whether potential bloom-forming taxa were found at these sites. Algae have the potential to become more abundant given the right conditions. Much research has demonstrated that algae populations increase, and community shifts occur in response to environmental changes, increased nutrient loads, increased water temperature, and altered flow regimes (Giblin and Gerrish, 2020; Song and others, 2020). Research has also shown that increased algal abundance and blooms have the potential to deplete oxygen and further alter algal communities (Sun and others, 2022; Li and others, 2018). Several of the taxa identified in this study have the potential to form blooms or reach nuisance levels. Microcystaceae (cyanobacteria), which are well known bloom-formers, were found in higher abundance at EB1 (reference site) but were found in low abundance at the other Grand Calumet River sites. Site LG1, which like EB1 provided key conditions for Microcystaceae blooms, had a lower abundance than EB1 during all sampling events. Among eukaryotic algae, Chrysophyceae, Cryptophyceae, and Bacillariophyceae taxa all have the potential to form blooms and some, or all, of these taxa were present during sampling at all sites. Viridiplantae was abundant at many sites, particularly at EB1 in July and September. Viridiplantae is a large clade containing more than 400,000 species, some of which are known to form blooms when nutrients are abundant.
Using Nutrient Concentrations and Isotope Data to Identify Biochemical and Hydrologic Processes
Nitrogen and oxygen isotopic composition comparisons were used to determine if nitrate at WB2 and EB6 is from precipitation, synthetic fertilizer, reduced nitrogen fertilizer, soil organic nitrogen, or from CSO events (fig. 15B; Kreitler, 1979; Clark and Fritz, 1997; Zhang and others, 2018). Nutrient abundance and isotopic data were compared with continuous water quality to better understand the source of nutrients and how they relate to dissolved oxygen concentrations.
Continuous nitrate plus nitrite data were available from the streamgage at site WB2 during the 2022 study period (U.S. Geological Survey, 2023). Minimal or no consistent patterns occurred between continuous daily mean nitrate plus nitrite concentrations and daily mean dissolved oxygen concentrations; however, there is a statistically significant weak negative correlation between chlorophyll concentration and nitrate plus nitrite, which indicates periods of increased daily mean chlorophyll concentration generally correspond with decreases in nitrate plus nitrite at the site (figs. 22 and 23). A significant example of this occurred from June 11 to 18, 2022, when daily mean chlorophyll concentrations of less than 10 µg/L increased to more than 40 µg/L, indicating an increase of algal biomass. In that same time period, daily mean nitrate plus nitrite concentrations decreased from 9.5 mg/L to 4.0 mg/L. Additionally, daily mean dissolved oxygen concentrations (that were at a stable concentration of about 8 mg/L the week prior), increased to consistent values greater than 10 mg/L and as much as 13.7 mg/L from June 11 to June 18 (fig. 22). At site WB2, dissolved oxygen concentrations increased during periods of increased chlorophyll concentrations, and nitrate plus nitrite concentrations seemed to decrease in response to increased chlorophyll concentrations; however, further analysis and more data could help draw definite conclusions about this relationship (fig. 22).
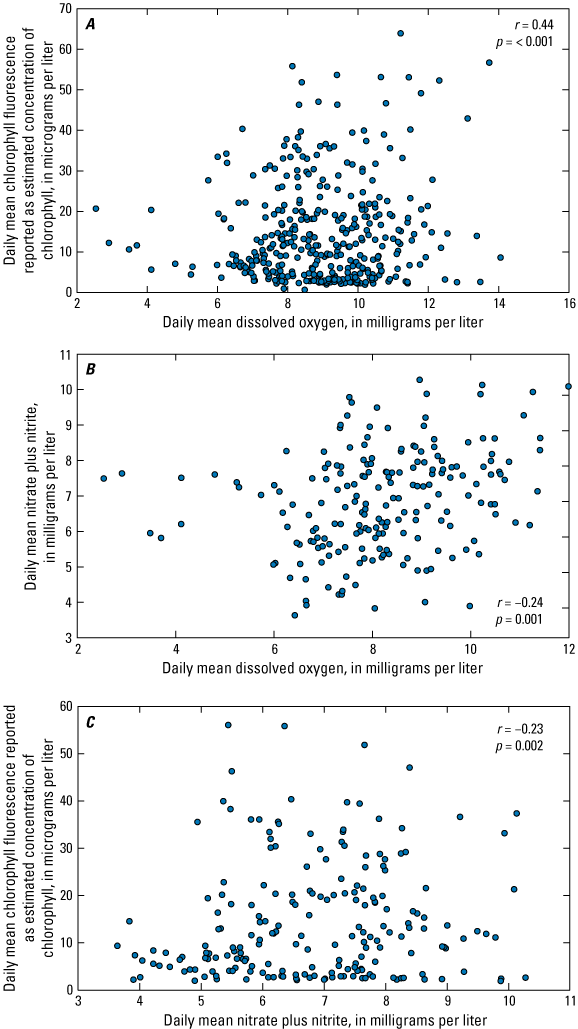
Graphs showing daily mean dissolved oxygen concentration compared with A, daily mean chlorophyll concentration and B, daily mean nitrate plus nitrite concentration and C, daily mean nitrate plus nitrite concentration compared with daily mean chlorophyll concentration for continuous water-quality data collected at site WB2, Grand Calumet River Area of Concern, northwest Indiana. The r and p values are Spearman correlation and significance values based on all data. Data from U.S. Geological Survey (2023).
Nitrogen Cycling and Nutrient Concentration
Discrete sampling for nutrient concentrations took place at WB2 in the west branch remediation area, EB6 in the east branch remediation area, and at the reference site EB1 (fig. 3). When considering how nutrient concentrations at these locations will potentially change because of different biochemical processes, it is important to understand key parts of the nitrogen cycle: ammonia is typically present in reducing conditions (low dissolved oxygen), and the conversion of ammonia to nitrite and then to nitrate occurs in oxidizing conditions (high dissolved oxygen). Specifically, nitrification is a two-step process: first, Nitrosomonas and Nitrosospira bacteria oxidize ammonia to nitrite, and then Nitrobacter and Nitrospira bacteria oxidize nitrite to nitrate. This process decreases ammonia concentrations, increases nitrate plus nitrite concentrations (Sliekers and others, 2002), and decreases dissolved oxygen concentration.
Below is the three-step chemical formula that demonstrates how dissolved oxygen is related to the nitrogen cycle (Bernhard, 2010):
Reaction 1 converts ammonia (NH3) and dissolved oxygen (O2) in the water column into hydroxylamine (NH2OH) and water (H2O) catalyzed by the ammonia monooxygenase enzyme. Reaction 2 then converts hydroxylamine and water into nitrite (NO2−) catalyzed by the hydroxylamine oxidoreductase enzyme. Reaction 3 uses dissolved oxygen (O2) from the water column and nitrite (NO2−) to form nitrate (NO3) through bacterial nitrite oxidation. Previous studies have identified that CSO events can lead to hypoxic, reducing conditions in rivers (Munger and others, 2016; Zhu and others, 2021). The CSO events affecting dissolved oxygen concentrations could also have an influence on the nitrogen cycle, specifically on nitrification.Water samples collected from site WB2 contain lower concentrations of ammonia and nitrite, but higher concentrations of nitrate compared with those from EB6 (table 9). This pattern suggests that nitrification may be occurring more efficiently at WB2, with algal communities more effectively oxidizing ammonia to nitrite and then to nitrate. Supporting this interpretation are the higher biological and chemical oxygen demand concentrations at WB2, which typically indicate more active algal communities (table 9; fig. 18; Udeigwe and Wang, 2010). Additionally, the differences in nutrient concentrations between the two sites may also reflect natural variability in the composition of fluids released during combined sewer overflow (CSO) events. The CSO systems near WB2 and EB6 differ, and variations in the effluent released from these systems could contribute to the observed differences in nutrient and dissolved oxygen concentrations (figs. 18 and 24).
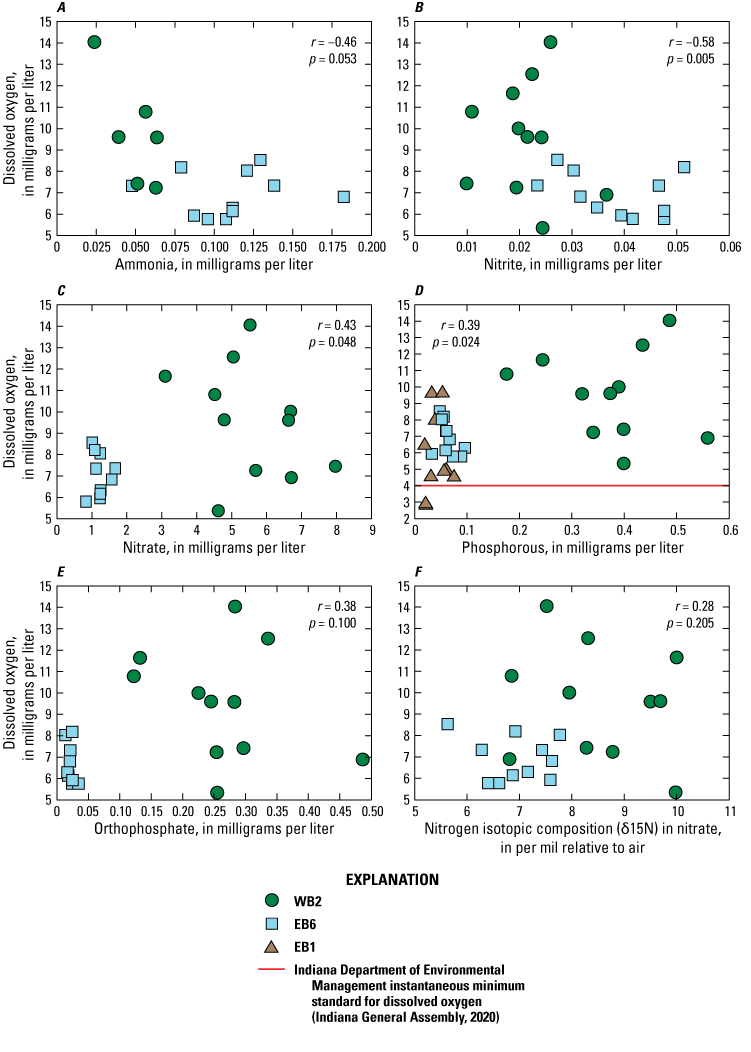
Graphs showing dissolved oxygen concentration compared with A, ammonia, B, nitrite, C, nitrate, D, phosphorus, E, orthophosphate concentrations, and F, the nitrogen isotopic composition in nitrate for discrete water-quality samples collected at sites WB2, EB6, and EB1, Grand Calumet River Area of Concern, northwest Indiana. The r and p values are Spearman’s correlation and significance values based on all data. Data from U.S. Geological Survey (2023).
Ammonia can negatively affect fish populations. Safe levels for fish reproduction are determined to be less than 0.020 mg/L in water (U.S. Environmental Protection Agency, 1999), and it can have additional negative effects where concentrations exceed 0.05 mg/L (Atauzzaman and Ali, 2022). Samples collected at EB6 contained 0.05 to 0.18 mg/L of ammonia from May to October 2022. The results from EB6 exceeded 0.05 mg/L of ammonia throughout the 2022 study period except for the August 3 sample. Whereas at WB2, only the June 14 and August 9, 2022, water samples exceeded 0.05 mg/L of ammonia. All 11 samples collected at the reference site EB1 were below the detection limit of 0.04 mg/L.
In addition to looking at nutrient concentrations, isotopic compositions, and one storm sampling event to understand how nitrogen cycling is related to dissolved oxygen concentrations in the Grand Calumet River, we also compared continuous nitrate plus nitrite and dissolved oxygen concentration data collected at WB2 (fig. 23B). There was an inverse relationship between daily mean nitrate plus nitrite concentration and daily mean dissolved oxygen concentration, with daily mean nitrate plus nitrite responding with a varied lag time to dissolved oxygen changes from May 4 to November 15, 2022 (figs. 22B and 23B). During the August 3–12 period at WB2, there were distinct periods in which nitrate rose sharply, and dissolved oxygen fell (fig. 23). These periods coincided with the storm sampling and with CSO releases that likely contributed to the peaks in nutrients. The trends of increasing nitrate plus nitrite concentrations corresponding to decreasing dissolved oxygen concentrations may be related to nitrogen cycling and CSO releases.
Isotopic Sourcing and Dissolved Oxygen Relationship
Discrete sampling for isotopic composition analyses took place in 2022 at WB2, EB6, and EB1 (fig. 3). Stable isotopes of hydrogen and oxygen can be used to understand the source of water contributing to the streams at WB2, EB6, and EB1 that is then interacting with CSO releases. When comparing isotopes of hydrogen and oxygen in water, data are typically compared with the global meteoric water line (Craig, 1961) and a local meteoric water line (Tian and Wang, 2019). A meteoric water line is a plot of the isotopic composition of water samples from all over the world (global meteoric water line) or from a geographic area (local meteoric water line; Kendall and Caldwall, 1998). Most of the results fall along these meteoric water lines, indicating that precipitation is a large contribution to the river systems at the WB2, EB6, and EB1 (fig. 16C). The EB1 water samples had heavier isotopic compositions of hydrogen and oxygen in water than the WB2 and EB6 samples. This is likely due to the stagnant to slow moving shallow water that allows for the evaporation of water at site EB1. Evaporation releases lighter isotopes of hydrogen and oxygen into the atmosphere, leaving behind residually heavier isotopes in the stream water at EB1 (fig. 16C).
As stated in the “Stable Isotopic Composition” section, the nitrogen and oxygen isotopic composition in nitrate can be used to source nitrate from different processes. The δ18O in nitrate from soil organic nitrogen and nitrate from CSO ranged from −9 to 15 per mil (fig 16B; Zhang and others, 2018). The δ15N values for nitrate from soil organic nitrogen were in a narrower range of 2 to 8 per mil, whereas nitrate from CSOs had δ15N values that ranged from 1 to 24 per mil (Zhang and others, 2018). Of the 11 samples collected at WB2, 7 had δ15N in nitrate values greater than 8 per mil, indicating nitrate solely from CSO events (fig. 16A). All 11 samples collected at EB6 had δ15N in nitrate values less than 8 per mil, indicating a mixture of nitrate contributions from soil organic nitrogen and CSO events. Nitrate concentrations from samples collected at site EB1 were below the necessary level to perform isotopic measurements of nitrogen and oxygen in nitrate.
The WB2 and EB6 isotopic compositions showed contributions of nitrate from CSO events and soil organic nitrogen (figs. 16A and 16B). Site EB6 is in an unremediated reach of the east branch Grand Calumet River where sediment has not been dredged or capped. The lighter δ15N in nitrate values may be indicative of the legacy sediment and unremediated status of the reach or may reflect a CSO source. In comparison, most of the samples collected from WB2 (about 64 percent) had values greater than 8 per mil of δ15N in nitrate, indicating that CSO contributions have a greater effect on nitrate concentrations at WB2 then nitrate from soil. In addition, there is a statistically significant correlation between increasing nitrate concentrations and heavier isotopic compositions, that further supports that higher nitrate concentrations are associated with CSO events.
Limitations, Data Gaps, and Future Efforts
Continuous water-quality monitoring was limited by site access constraints. To complete the field work in a timely, orderly, and repeatable fashion it was necessary for the sites to be accessible under all hydrologic conditions. Seasonal continuous water-quality monitoring only for 2 years limited the ability to assess long-terms trends within the study area and limited the range of conditions captured because yearly conditions can vary greatly.
The sampling frequency of the metagenomics component of the study (three events within one season) limited the identification of clear spatial differences and temporal shifts in communities. Bloom-forming taxa were abundant in some samples, which made it difficult to draw clear conclusions about the relation between algal communities and eutrophication. Continuous dissolved oxygen and chlorophyll concentrations during the week before and after algal community analysis showed that conditions before and after sampling events had about the same range as the full range through the period of record. Although the ranges were representative, the sampling events rarely occurred during periods of low dissolved oxygen. Future studies could benefit from including a lengthier, more robust sampling regime than the one in this study so that yearly comparisons of community analysis, water chemistry, CSO events, and other nutrient inputs can be made.
The lack of discrete nutrient concentration results during the period of community sampling limited the ability to perform algal community analysis for the identification of nitrifying bacteria such as Nitrosomonas, Nitrosospira, Nitrospira, and Nitrobacter. The identification of the presence and abundance of nitrifying bacteria communities, the identification of nitrate or ammonia and nitrite as the most dominant nitrogen compound species, and a comparison of the dissolved oxygen concentrations during the sampling events could identify the communities and associated abundance that control dissolved oxygen concentrations and nutrient concentrations in stream waters.
Future studies to assess the eutrophication impairment in the Grand Calumet River could be aided by more frequent and event-based metagenomics paired with water-quality sampling. Additionally, long-term dissolved oxygen studies and nutrient-data collection (continuous and discrete), could improve understanding of the complex dynamics that can lead to eutrophication.
Summary
The 1972 Great Lakes Water Quality Agreement between the United States and Canada identified the Grand Calumet River Area of Concern, which includes the Grand Calumet River and Indiana Harbor Canal, as having all 14 of the Agreement-defined Beneficial Use Impairments present, including Beneficial Use Impairment 8: eutrophication or undesirable algae. Remedial Action Plans were developed to address the Beneficial Use Impairments. At the onset of this study, the Area of Concern Beneficial Use Impairment removal matrix in the Stage 2.5 Remedial Action Plan indicated that dissolved oxygen, nutrient, and algae monitoring were needed to evaluate conditions to consider removal of the Beneficial Use Impairment. The removal target for Beneficial Use Impairment of eutrophication or undesirable algae was revised in January 2024 and states that it can be considered for removal when community outreach activities specifically designed to reduce nonpoint source and stormwater contributions of nutrients to Area of Concern waters have been conducted within the Area of Concern, biological controls on nutrients or excess algal growth have been implemented, and all approved contaminated sediment management projects have been completed or planned. Many sources of contamination that can contribute to excess nutrients within the system and cause eutrophic conditions are present in the Grand Calumet River watershed, including landfills, urban runoff, dumpsites, sewage treatment plants, combined sewer overflows, and industrial effluent.
To evaluate whether eutrophic conditions or undesirable algae were present, several sites within this area were monitored to determine the effect of combined sewer overflows on surface water quality and ecosystem health, the relationship between dissolved oxygen concentration and nutrient concentrations, how combined sewer overflow releases affect these relationships, and how different remediation processes (such as dredging, or dredging and capping) along the Grand Calumet River and Indiana Harbor Canal have affected water quality. One site (EB1) was selected as a reference site that had natural conditions unaffected by combined sewer overflows or remediation.
Remediation status was not shown to affect dissolved oxygen concentrations, because many of the sites, regardless of remediation status, had days where daily mean dissolved oxygen concentrations fell below the daily mean threshold of 5.0 milligrams per liter (mg/L) or had days when instantaneous dissolved oxygen concentrations fell below the 4.0 mg/L minimum threshold. However, monitoring locations in unremediated reaches had the largest daily difference in dissolved oxygen concentrations, indicating that more algal growth and decomposition could be taking place in these locations than at remediated reaches in the study area. In 2021, 11 of the 13 monitored locations had at least 1 occurrence of daily mean dissolved oxygen falling below 5.0 mg/L, and 12 of the 13 monitored locations had at least 1 occurrence of instantaneous dissolved oxygen values falling below the minimum standard of 4.0 mg/L. In 2022, analysis at four of the five sites showed daily mean dissolved oxygen values below 5.0 mg/L and instantaneous readings below 4.0 mg/L. Low dissolved oxygen concentrations commonly followed combined sewer overflow events.
Samples were collected for algal community analysis in 2021 at five geographically distinct sites within the study area during three sampling events. Algal communities in these samples were determined by deoxyribonucleic acid (DNA) sequencing that targeted 16S ribosomal ribonucleic acid (RNA) for cyanobacteria and 18S ribosomal RNA for eukaryotic algae to characterize the spatiotemporal differences in these algal communities and whether communities capable of becoming nuisance species or those associated with eutrophication were commonly found during this period. Sampling identified 42 main cyanobacteria and 20 main eukaryotic algae taxa. Several of the taxa capable of becoming nuisance species were identified, including the cyanobacteria Microcystaceae (predominantly found at the reference site EB1) and the eukaryotic algae Chrysophyceae, Cryptophyceae, and Bacillariophyceae.
After completion of the 2021 monitoring, a subset of 5 of the 13 original sites were selected for continued monitoring in 2022. Discrete samples were taken at three sites for nutrients; nitrogen, hydrogen and oxygen isotopic concentrations; and biological oxygen demand and chemical oxygen demand to identify the source of nutrients that contribute to the eutrophic conditions observed in 2021. Site WB2 (in the middle of the west branch remediation area) had the highest concentrations of chemical oxygen demand, biological oxygen demand, nitrate, phosphorus, and orthophosphate for the sampling period in 2022. Site EB6 (just east of the east branch remediation area) had the highest concentrations of ammonia and nitrite, and reference site EB1 (the farthest east site) had the lowest concentrations, including nondetections, for all nutrients.
All isotopic sample results from sites WB2 and EB6 in 2022 fell within the isotopic range of nitrate from soil organic nitrogen or from combined sewer overflows for values of stable isotopic composition of nitrogen and oxygen in nitrate. Most stable isotopes of hydrogen and oxygen in water samples fell along the local meteoric water line except for the samples from EB1 that had heavier isotopic compositions of hydrogen and oxygen in water than the WB2 and EB6 samples, indicating evaporation of water at EB1.
Combined sewer overflow releases were found to affect both continuously monitored and discretely sampled parameters. After combined sewer overflow events, dissolved oxygen typically decreased and chlorophyll concentration typically increased, possibly because of nutrients being flushed into streams and increased growth and respiration by plants and algae. On the basis of the nitrogen isotopic analysis, combined sewer overflow releases were associated with higher nitrate concentrations in the Grand Calumet River. Additionally, biological oxygen demand was affected by combined sewer overflow events and could affect how combined sewer overflow events impacted water quality. Results from storm sampling at WB2 showed that ammonia concentrations first increase and then decrease during combined sewer overflow events.
Discrete sampling gave insight into diminished dissolved oxygen levels in the different reaches of the Area of Concern based on remediation condition. Nitrification may have been more efficient at sites where nutrient loading from combined sewer overflow releases initiated conversions from ammonia and nitrite to nitrate. Greater nitrate concentrations where biological oxygen demand and chemical oxygen demand are also high suggest that nitrification is occurring and that dissolved oxygen levels may diminish as nitrification continues.
Overall, the study showed that eutrophic conditions were present in the study area regardless of remediation status. Combined sewer overflow events have a substantial influence on water quality parameters measured during the study and appear to contribute to periods of eutrophication. Discrete water-quality samples collected in 2022 included parameters that identified nutrients from both sewage and soil. The information from this study can assist in identifying management actions that can help address the eutrophication Beneficial Use Impairment in the Grand Calumet River Area of Concern.
References Cited
Altschul, S.F., Gish, W., Miller, W., Myers, E.W., and Lipman, D.J., 1990, Basic local alignment search tool: Journal of Molecular Biology, v. 215, no. 3, p. 403–410, accessed July 30, 2025, at https://doi.org/10.1016/S0022-2836(05)80360-2.
Anagnostidis, K., and Komárek, J., 1988, Modern approach to the classification system of cyanophytes. 3—Oscillatoriales, in Anagnostidis, K., Golubić, S., Komárek, J., Lhotský, O., eds., Cyanophyta (cyanobacteria) morphology, taxonomy, ecology—Proceedings of the 10th Symposium of the IAC (International) [sic] Association for Cyanophyte Research) Greece (Hellas) 1986: Algological Studies 50–53, p. 327–472. [Also published as Archiv für Hydrobiologie, v. 80, no. 1–4.]
Atauzzaman, M., and Ali, M.A., 2022, Effects of combined sewer overflow on water quality—A case study of Hatirjheel Lake in Dhaka: SN Applied Sciences, v. 4, article 303, 13 p., accessed July 30, 2025, at https://doi.org/10.1007/s42452-022-05187-6.
Aunins, A.W., Byappanahalli, M., and Shively, D.A., 2023, Grand Calumet River Area of Concern metabarcoding data: U.S. Geological Survey data release, accessed July 30, 2025, at https://doi.org/10.5066/P93261E5.
Banerji, A., Bagley, M., Elk, M., Pilgrim, E., Martinson, J., and Santo Domingo, J., 2018, Spatial and temporal dynamics of a freshwater eukaryotic plankton community revealed via 18S rRNA gene metabarcoding: Hydrobiologia, v. 818, p. 71–86, accessed July 30, 2025, at https://doi.org/10.1007/s10750-018-3593-0.
Bao, L., Chen, J., Tong, H., Qian, J., and Li, X., 2022, Phytoplankton dynamics and implications for eutrophication management in an urban river with a series of rubber dams: Journal of Environmental Management, v. 311, article 114865, 9 p., accessed July 30, 2025, at https://doi.org/10.1016/j.jenvman.2022.114865.
Bernhard, A., 2010, The nitrogen cycle—Processes, players, and human impact: Nature Education Knowledge, v. 3, no. 10, article 25, accessed July 30, 2025, at https://www.nature.com/scitable/knowledge/library/the-nitrogen-cycle-processes-players-and-human-15644632/.
Bisanz, J.E., 2018, qiime2R—Importing QIIME2 artifacts and associated data into R sessions (version 0.99): GitHub software release, accessed July 30, 2025, at https://github.com/jbisanz/qiime2R.
Bolyen, E., Rideout, J.R., Dillon, M.R., Bokulich, N.A., Abnet, C.C., Al-Ghalith, G.A., Alexander, H., Alm, E.J., Arumugam, M., Asnicar, F., Bai, Y., Bisanz, J.E., Bittinger, K., Brejnrod, A., Brislawn, C.J., Brown, C.T., Callahan, B.J., Caraballo-Rodríguez, A.M., Chase, J., Cope, E.K., Da Silva, R., Diener, C., Dorrestein, P.C., Douglas, G.M., Durall, D.M., Duvallet, C., Edwardson, C.F., Ernst, M., Estaki, M., Fouquier, J., Gauglitz, J.M., Gibbons, S.M., Gibson, D.L., Gonzalez, A., Gorlick, K., Guo, J., Hillmann, B., Holmes, S., Holste, H., Huttenhower, C., Huttley, G.A., Janssen, S., Jarmusch, A.K., Jiang, L., Kaehler, B.D., Kang, K.B., Keefe, C.R., Keim, P., Kelley, S.T., Knights, D., Koester, I., Kosciolek, T., Kreps, J., Langille, M.G.I., Lee, J., Ley, R., Liu, Y.-X., Loftfield, E., Lozupone, C., Maher, M., Marotz, C., Martin, B.D., McDonald, D., McIver, L.J., Melnik, A.V., Metcalf, J.L., Morgan, S.C., Morton, J.T., Naimey, A.T., Navas-Molina, J.A., Nothias, L.F., Orchanian, S.B., Pearson, T., Peoples, S.L., Petras, D., Preuss, M.L., Pruesse, E., Rasmussen, L.B., Rivers, A., Robeson, M.S., II, Rosenthal, P., Segata, N., Shaffer, M., Shiffer, A., Sinha, R., Song, S.J., Spear, J.R., Swafford, A.D., Thompson, L.R., Torres, P.J., Trinh, P., Tripathi, A., Turnbaugh, P.J., Ul-Hasan, S., van der Hooft, J.J.J., Vargas, F., Vázquez-Baeza, Y., Vogtmann, E., von Hippel, M., Walters, W., Wan, Y., Wang, M., Warren, J., Weber, K.C., Williamson, C.H.D., Willis, A.D., Xu, Z.Z., Zaneveld, J.R., Zhang, Y., Zhu, Q., Knight, R., and Caporaso, J.G., 2019, Reproducible, interactive, scalable and extensible microbiome data science using QIIME 2: Nature Biotechnology, v. 37, no. 8, p. 852–857, accessed July 30, 2025, at https://doi.org/10.1038/s41587-019-0209-9.
Booth, A., Fleck, J., Pellerin, B.A., Hansen, A., Etheridge, A., Foster, G.M., Graham, J.L., Bergamaschi, B.A., Carpenter, K.D., Downing, B.D., Rounds, S.A., and Saraceno, J.F., 2023, Field techniques for fluorescence measurements targeting dissolved organic matter, hydrocarbons, and wastewater in environmental waters—Principles and guidelines for instrument selection, operation and maintenance, quality assurance, and data reporting: U.S. Geological Survey Techniques and Methods, book 1, chap. D11, 41 p., accessed July 30, 2025, at https://doi.org/10.3133/tm1D11.
Brand, W. A., Coplen, T. B., Vogl, J., Rosner, M., and Prohaska, T., 2014, Assessment of international reference materials for isotope-ratio analysis (IUPAC Technical Report): Pure and Applied Chemistry, v. 86, no. 3, p. 425–467, accessed September 8, 2025, at https://doi.org/10.1515/pac-2013-1023.
Bushnell, B., 2014, BBMap—A fast, accurate, splice-aware aligner—9th Annual Genomics of Energy & Environment Meeting, Walnut Creek, Calif., March 17–20, 2019: Berkeley, Calif., Lawrence Berkeley National Lab, 2 p., accessed July 30, 2025, at https://www.osti.gov/biblio/1241166.
Byappanahalli, M.N., Nevers, M.B., Przybyla-Kelly, K., Ishii, S., King, T.L., and Aunins, A.W., 2019, Great Lakes Cladophora harbors phylogenetically diverse nitrogen‐fixing microorganisms: Environmental DNA, v. 1, no. 2, p. 186–195, accessed July 30, 2025, at https://doi.org/10.1002/edn3.20.
Byappanahalli, M.N., Shively, D.A., Przybyla-Kelly, K.J., and Spoljaric, A.M., 2023, Eutrophication and plankton communities (cyanobacteria and eukaryotic algae) in the Grand Calumet River Area of Concern, Indiana, 2021: U.S. Geological Survey data release, accessed July 30, 2025, at https://doi.org/10.5066/P9EE4N0L.
Byappanahalli, M., Shively, D.A., Przybyla-Kelly, K., and Spoljaric, A.M., 2025, Nuisance algae—Planktonic communities in the Grand Calumet River Area of Concern, Indiana, 2021: U.S. Geological Survey data release, accessed July 30,2025, at https://doi.org/10.5066/P13R2DPD.
Callahan, B.J., McMurdie, P.J., Rosen, M.J., Han, A.W., Johnson, A.J.A., and Holmes, S.P., 2016, DADA2—High-resolution sample inference from Illumina amplicon data: Nature Methods, v. 13, no. 7, p. 581–583, accessed July 30, 2025, at https://doi.org/10.1038/nmeth.3869.
Caporaso, J.G., Lauber, C.L., Walters, W.A., Berg-Lyons, D., Lozupone, C.A., Turnbaugh, P.J., Fierer, N., and Knight, R., 2011, Global patterns of 16S rRNA diversity at a depth of millions of sequences per sample: Proceedings of the National Academy of Sciences of the United States of America, v. 108, supplement 1, p. 4516–4522, accessed July 30, 2025, at https://doi.org/10.1073/pnas.1000080107.
Clark, I.D., and Fritz, P., 1997, Environmental Isotopes in Hydrogeology: Boca Raton, N.Y., Lewis, 342 p. [Also available at https://doi.org/10.1201/9781482242911.]
Craig, H., 1961, Isotopic variations in meteoric waters: Science, v. 133, no. 3465, p. 1702–1703, accessed July 30, 2025, at https://doi.org/10.1126/science.133.3465.1702.
Crawford, C.G., and Wangsness, D.J., 1987, Streamflow and water quality of the Grand Calumet River, Lake County, Indiana, and Cook County, Illinois, October 1984: U.S. Geological Survey Water-Resources Investigations Report 86–4208, 137 p., accessed July 30, 2025, at https://doi.org/10.3133/wri864208.
Crawford, D.W., Bonnevie, N.L., and Wenning, R.J., 1995, Sources of pollution and sediment contamination in Newark Bay, New Jersey: Ecotoxicology and Environmental Safety, v. 30, no. 1, p. 85–100, accessed July 30, 2025, at https://doi.org/10.1006/eesa.1995.1010.
Divers, M.T., Elliott, E.M., and Bain, D.J., 2014, Quantification of nitrate sources to an urban stream using dual nitrate isotopes: Environmental Science & Technology, v. 48, no. 18, p. 10580–10587, accessed July 30, 2025, at https://doi.org/10.1021/es404880j.
Fay, P., 1992, Oxygen relations of nitrogen fixation in cyanobacteria: Microbiological Reviews, v. 56, no. 2, p. 340–373, accessed July 30, 2025, at https://doi.org/10.1128/mr.56.2.340-373.1992.
Fenelon, J.M., and Watson, L.R., 1993, Geohydrology and water quality of the Calumet aquifer, in the vicinity of the Grand Calumet River/Indiana Harbor Canal, northwestern Indiana: U.S. Geological Survey Water-Resources Investigations Report 92–4115, 151 p., accessed July 30, 2025, at https://doi.org/10.3133/wri924115.
Foster, G.M., Graham, J.L., Bergamaschi, B.A., Carpenter, K.D., Downing, B.D., Pellerin, B.A., Rounds, S.A., and Saraceno, J.F., 2022, Field techniques for the determination of algal pigment fluorescence in environmental waters—Principles and guidelines for instrument and sensor selection, operation, quality assurance, and data reporting: U.S. Geological Survey Techniques and Methods, book 1, chap. D10, 34 p., accessed August 2024 at https://doi.org/10.3133/tm1D10.
Gasith, A., and Resh, V.H., 1999, Streams in Mediterranean climate regions—Abiotic influences and biotic responses to predictable seasonal events: Annual Review of Ecology and Systematics, v. 30, p. 51–81, accessed July 30, 2025, at https://doi.org/10.1146/annurev.ecolsys.30.1.51.
Gast, H.F., Suykerbuyk, R.E.M., and Roijackers, R.M.M., 1990, Urban storm water discharges—Effects upon plankton communities: Water Science and Technology v. 22, no. 10–11, p. 155–162, accessed July 30, 2025, at https://doi.org/10.2166/wst.1990.0300.
Giblin, S.M., and Gerrish, G.A., 2020, Environmental factors controlling phytoplankton dynamics in a large floodplain river with emphasis on cyanobacteria: River Research and Applications, v. 36, no. 7, p. 1137–1150, accessed July 30, 2025, at https://doi.org/10.1002/rra.3658.
Gleich, S.J., 2019, Nutrient effects on phytoplankton community composition in the eutrophic Anacostia River and a focus on diatom physiology: College Park, Md., University of Maryland, master of science thesis, 95 p., accessed July 30, 2025, at https://drum.lib.umd.edu/items/2615c980-dbcc-41e2-b006-a6c7b9f10f3e.
Hach, 2022, Nitratax sc—User manual (Edition 7): Loveland, Colo., Hach, 37 p., accessed July 30, 2025, at https://cdn.bfldr.com/7FYZVWYB/at/gkcc3tf3wc8bnnwp939jrjp/DOC0235403211_ed7.pdf.
Hamilton, P.B., Lavoie, I., Ley, L.M., and Poulin, M., 2011, Factors contributing to the spatial and temporal variability of phytoplankton communities in the Rideau River (Ontario, Canada): River Systems, v. 19, no. 3, p. 189–205, accessed July 30, 2025, at https://doi.org/10.1127/1868-5749/2011/019-0026.
Huisman, J., Codd, G.A., Paerl, H.W., Ibelings, B.W., Verspagen, J.M.H., and Visser, P.M., 2018, Cyanobacterial blooms: Nature Reviews Microbiology, v. 16, no. 8, p. 471–483, accessed July 30, 2025, at https://doi.org/10.1038/s41579-018-0040-1.
Hupfer, M., and Hilt, S., 2008, Lake restoration, in Jørgensen, S.E., and Fath, B.D., eds., Encyclopedia of ecology: London, Academic Press, p. 2080–2093, accessed July 30, 2025, at https://doi.org/10.1016/B978-008045405-4.00061-6.
Huson, D.H., Beier, S., Flade, I., Gorska, A., El-Hadidi, M., Mitra, S., Ruscheweyh, H., and Tappu, R., 2016, MEGAN Community Edition—Interactive exploration and analysis of large-scale microbiome sequencing data: PLOS Computational Biology, v. 12, no. 6, article e1004957, 12 p., accessed July 30, 2025, at https://doi.org/10.1371/journal.pcbi.1004957.
Illumina, 2013, 16S metagenomic sequencing library preparation—Preparing 16S ribosomal RNA gene amplicons for the Illumina MiSeq system: San Diego, Calif., Illumina, 28 p., accessed July 30, 2025, at https://support.illumina.com/content/dam/illumina-support/documents/documentation/chemistry_documentation/16s/16s-metagenomic-library-prep-guide-15044 223-b.pdf.
Indiana Department of Environmental Management, 2023a, Cleanup of contaminated sediments: Indiana Department of Environmental Management web page, accessed September 2023 at https://www.in.gov/idem/lakemichigan/grand-calumet-river-and-indiana-harbor-ship-canal/cleanup-of-contaminated-sediments/.
Indiana Department of Environmental Management, 2023b, Virtual file cabinet, Indiana Department of Environmental Management database, accessed April 2023 at https://ecm.idem.in.gov/cs/idcplg?IdcService=GET_DOC_PAGE&Action=GetTemplatePage&Page=HOME_PAGE.
Indiana Department of Environmental Management, 2025, Indiana CSO outfall map: Indiana Department of Environmental Management interactive map, accessed June 6, 2025, at https://www.in.gov/idem/cleanwater/information-about/combined-sewer-overflow-cso-program/indiana-cso-outfall-map/.
Indiana General Assembly, 2020, Water quality standards: Indiana administrative code, title 327, article 2, rules 1–11, 144 p., accessed September 3, 2020, at http://www.in.gov/legislative/iac/T03270/A00020.PDF.
International Joint Commission United States and Canada, 1987, Revised Great Lakes Water Quality Agreement of 1978—Agreement, with annexes and terms of reference, between the United States and Canada signed at Ottawa November 22, 1978, and phosphorus load reduction supplement signed October 16, 1983 as amended by protocol signed November 18, 1987: International Joint Commission United States and Canada, 64 p., accessed January 15, 2025, at https://www.ijc.org/sites/default/files/GLWQA_e.pdf. [Reprint February 1994.]
Kay, R.T., Greeman, T.K., Duwelius, R.F., King, R.B., Nazimek, J.E., and Petrovski, D.M., 1997, Characterization of fill deposits in the Calumet region of northwestern Indiana and northeastern Illinois: U.S. Geological Survey Water-Resources Investigations Report 96–4126, 36 p., 3 pls., accessed July 30, 2025, at https://doi.org/10.3133/wri964126.
Keck, F., Vasselon, V., Tapolczai, K., Rimet, F. and Bouchez, A., 2017, Freshwater biomonitoring in the information age: Frontiers in Ecology and the Environment, v. 15, no. 5, p. 266–274. [Also available at https://doi.org/10.1002/fee.1490.]
Kendall, C. and Caldwall, E.A., 1998, Fundamentals of isotope geochemistry, chap. 2, of Isotope tracers in catchment hydrology, p. 51–86, accessed July 30, 2025, at https://wwwrcamnl.wr.usgs.gov/isoig/isopubs/itchch2.html.
Kim, K., Mun, H., Shin, H., Park, S., Yu, C., Lee, J., Yoon, Y., Chung, H., Yun, H., Lee, K., Jeong, G., Oh, J., Lee, I., Lee, H., Kang, T., Ryu, H.S., Park, J., Shin, Y., and Rhew, D., 2020, Nitrogen stimulates Microcystis-dominated blooms more than phosphorus in river conditions that favor non-nitrogen-fixing genera: Environmental Science & Technology, v. 54, no. 12, p. 7185–7193, accessed July 30, 2025, at https://doi.org/10.1021/acs.est.9b07528.
Klose, K., Cooper, S.D., Leydecker, A.D., and Kreitler, J., 2012, Relationships among catchment land use and concentrations of nutrients, algae, and dissolved oxygen in a southern California river: Freshwater Science, v. 31, no. 3, p. 908–927, accessed July 30, 2025, at https://doi.org/10.1899/11-155.1.
Kreitler, C.W., 1979, Nitrogen-isotope ratio studies of soils and groundwater nitrate from alluvial fan aquifers in Texas: Journal of Hydrology, v. 42, no. 1–2, p. 147–170, accessed July 30, 2025, at https://doi.org/10.1016/0022-1694(79)90011-8.
Leibniz Institute DSMZ-German Collection of Microorganisms and Cell Cultures GmbH, 2018, Silva 132 release: Leibniz Institute DSMZ-German Collection of Microorganisms and Cell Cultures GmbH data release, accessed November 2021, at https://www.arb-silva.de/no_cache/download/archive/qiime/.
Li, Z., Song, S., Li, C., and Yu, Z., 2018, The sinking of the phytoplankton community and its contribution to seasonal hypoxia in the Changjiang (Yangtze River) estuary and its adjacent waters: Estuarine, Coastal and Shelf Science, v. 208, p. 170–179, accessed July 30, 2025, at https://doi.org/10.1016/j.ecss.2018.05.007.
Manier, J.T., Haro, R.J., Houser, J.N., and Strauss, E.A., 2021, Spatial and temporal dynamics of phytoplankton assemblages in the upper Mississippi River: River Research and Applications, v. 37, no. 10, p. 1451–1462, accessed July 30, 2025, at https://doi.org/10.1002/rra.3852.
Marzadri, A., Tonina, D., and Bellin, A., 2013, Quantifying the importance of daily stream water temperature fluctuations on the hyporheic thermal regime—Implication for dissolved oxygen dynamics: Journal of Hydrology, v. 507, p. 241–248, accessed July 30, 2025, at https://doi.org/10.1016/j.jhydrol.2013.10.030.
McMurdie, P.J., and Holmes, S., 2013, phyloseq—An R package for reproducible interactive analysis and graphics of microbiome census data: PLOS One v. 8, no. 4, article e61217, 11 p., accessed July 30, 2025, at https://doi.org/10.1371/journal.pone.0061217.
Moore, P.A., 1959, The Calumet region—Indiana's last frontier: Indianapolis, Ind., Indiana Historical Bureau, 685 p. [Reprinted 1977 with an afterward by Lance Trusty. Also available at https://indianamemory.contentdm.oclc.org/digital/collection/p1819coll6/id/45221/rec/11.]
Mueller, D.K., Schertz, T.L., Martin, J.D., and Sandstrom, M.W., 2015, Design, analysis, and interpretation of field quality-control data for water-sampling projects: U.S. Geological Survey Techniques and Methods, book 4, chap. C4, 54 p. [Also available at https://doi.org/10.3133/tm4C4.]
Munger, Z.W., Carey, C.C., Gerling, A.B., Hamre, K.D., Doubek, J.P., Klepatzki, S.D., McClure, R.P., and Schreiber, M.E., 2016, Effectiveness of hypolimnetic oxygenation for preventing accumulation of Fe and Mn in a drinking water reservoir: Water Research, v. 106, p. 1–14, accessed July 30, 2025, at https://doi.org/10.1016/j.watres.2016.09.038.
National Center for Biotechnology Information, 2021, NCBI ftp server: National Center for Biotechnology database, accessed May 2021 at https://ftp.ncbi.nlm.nih.gov/.
National Oceanic and Atmospheric Administration, 2023, What is eutrophication?: National Oceanic and Atmospheric Administration website, accessed September 2023 at https://oceanservice.noaa.gov/facts/eutrophication.html.
Nevers, M.B., Whitman, R.L., and Gerovac, P.J., 2002, History and environmental setting of the Grand Calumet River: Proceedings of the Indiana Academy of Sciences, v. 108–109, no. 1–4, p. 3–10, accessed July 30, 2025, at https://www.csu.edu/cerc/researchreports/documents/HistoryEnvironmentalSettingGrandCalumetRiver2000.pdf.
Nie, J., Feng, H., Witherell, B.B., Alebus, M., Mahajan, M.D., Zhang, W., and Yu, L., 2018, Causes, assessment, and treatment of nutrient (N and P) pollution in rivers, estuaries, and coastal waters: Current Pollution Reports, v. 4, no. 2, p. 154–161, accessed July 30, 2025, at https://doi.org/10.1007/s40726-018-0083-y.
Onset, 2020, HOBO dissolved oxygen logger (U26-001) manual: Bourne, Mass., Onset, 6 p., accessed July 30, 2025, at https://www.onsetcomp.com/sites/default/files/resources-documents/15603-K%20MAN-U26x.pdf.
Pete, J.S., 2022, Up to 10 million gallons a day of wastewater being discharged into Grand Cal; people urged to avoid: The Times of Northwest Indiana, October 3, 2022, accessed July 30, 2025, at https://www.nwitimes.com/news/local/lake/east-chicago/up-to-10-million-gallons-a-day-of-wastewater-being-discharged-into-grand-cal-people/article_758f 7623-bf48-5c48-9230-f3e67546c5b8.html.
Piredda, R., Claverie, J.-M., Decelle, J., de Vargas, C., Dunthorn, M., Edvardsen, B., Eikrem, W., Forster, D., Kooistra, W.H.C.F., Logares, R., Massana, R., Montresor, M., Not, F., Ogata, H., Pawlowski, J., Romac, S., Sarno, D., Stoeck, T., and Zingone, A., 2018, Diatom diversity through HTS-metabarcoding in coastal European seas: Scientific Reports, v. 8, article 18059, 12 p., accessed July 30, 2025, at https://doi.org/10.1038/s41598-018-36345-9.
QIAGEN, 2023 DNeasy PowerSoil Pro kit handbook: Venlo, Netherlands, QIAGEN, 23 p., accessed June 13, 2025, at https://www.qiagen.com/us/resources/resourcedetail?id=9bb59b74-e493-4aeb-b6c1-f660852e8d97&lang=en.
QIIME 2 development team, 2024, denoise-paired—Denoise and dereplicate paired-end sequences (ver. 2024.2): QIIME 2 development team webpage, accessed February 3, 2025, at https://docs.qiime2.org/2024.2/plugins/available/dada2/denoise-paired/.
R Core Team, 2022, R—A language and environment for statistical computing. R Foundation for Statistical Computing software release, version 4.2.1, accessed October 2022 at https://www.R-project.org/.
Renn, D.E., 2000, Suspended sediment in the Indiana Harbor Canal and the Grand Calumet River, northwestern Indiana, May 1996–June 1998: U.S. Geological Survey Water-Resources Investigations Report 00–4102, 52 p., accessed March 31, 2025, at https://doi.org/10.3133/wri20004102.
Révész, K., and Casciotti, K., 2007, Determination of the δ(15N/14N) and δ(18O/16O) of nitrate in water—RSIL Lab Code 2900: U.S. Geological Survey Techniques and Methods, book 10, sec. C, chap. 17, 24 p., accessed July 31, 2025, at https://pubs.usgs.gov/tm/2006/tm10c17/pdf/tm10c17.pdf.
Révész, K., and Coplen, T.B., 2008a, Determination of the δ(18O/16O) of water—RSIL lab code 489: U.S. Geological Survey Techniques and Methods, book 10, chap. C2, 28 p., accessed July 31, 2025, https://pubs.usgs.gov/tm/2007/tm10c2/pdf/tm10c2.pdf.
Révész, K., and Coplen, T.B., 2008b, Determination of the δ(2H/1H) of water—RSIL lab code 1574: U.S. Geological Survey Techniques and Methods, book 10, chap. C1, 27 p., accessed July 31, 2025, at https://pubs.usgs.gov/tm/2007/tm10c1/.
Ruhl, C.A., and Simpson, M.R., 2005, Computation of discharge using the index-velocity method in tidally affected areas: U.S. Geological Survey Scientific Investigations Report 2005–5004, 31 p., accessed July 30, 2025, at https://doi.org/10.3133/sir20055004.
Sediment Management Working Group, 2004, Major contaminated sediment sites: Sediment Management Working Group database [updated 2008], accessed July 30, 2025, at https://www.smwg.org/mcss-database.
Sindt, A.R., and Wolf, M.C., 2021, Spatial and temporal trends of Minnesota River phytoplankton and zooplankton: River Research and Applications, v. 37, no. 5, p. 776–795, accessed July 30, 2025 at https://doi.org/10.1002/rra.3796.
Sliekers, A.O., Derwort, N., Campos Gomez, J.L., Strous, M., Kuenen, J.G., and Jetten, M., 2002, Completely autotrophic nitrogen removal over nitrite in one single reactor: Water Research, v. 36, no. 10, p. 2475–2482, accessed July 30, 2025, at https://doi.org/10.1016/S0043-1354(01)00476-6.
Snyder, A., comp., 2012, Update to the Stage 2.5 Remedial Action Plan (RAP) Grand Calumet River/Indiana Harbor Ship Canal Area of Concern: Indiana Department of Environmental Management report, 32 p., accessed September 3, 2020, at https://www.in.gov/idem/lakemichigan/files/grancal_rap_stage_2_update.pdf.
Song, J., Hou, C., Liu, Q., Wu, X., Wang, Y., and Yi, Y., 2020, Spatial and temporal variations in the plankton community because of water and sediment regulation in the lower reaches of Yellow River: Journal of Cleaner Production, v. 261, article 120972, 11 p., accessed July 30, 2025, at https://doi.org/10.1016/j.jclepro.2020.120972.
Steevens, J.A., Besser, J.M., Dorman, R.A., and Sparks, D.W., 2020, Influence of remediation on sediment toxicity within the Grand Calumet River, Indiana, USA: Chemosphere, v. 249, article 126056, 11 p., accessed July 30, 2025, at https://doi.org/10.1016/j.chemosphere.2020.126056.
Stewart, P.M., Butcher, J.T., and Simon, T.P., 1999, Ecological assessment of the Grand Calumet lagoons and adjacent ponds—Water quality, aquatic communities, sediment contaminants, and toxicity testing—Report to the National Park Service, Water Resources Division, and the Indiana Dunes National Lakeshore: Porter, Ind., U.S. Geological Survey, 37 p.
Stoeck, T., Bass, D., Nebel, M., Christen, R., Jones, M.D.M., Breiner, H.-W., and Richards, T.A., 2010, Multiple marker parallel tag environmental DNA sequencing reveals a highly complex eukaryotic community in marine anoxic water: Molecular Ecology, v. 19, supplement 1, p. 21–31, accessed July 30, 2025, at https://doi.org/10.1111/j.1365-294X.2009.04480.x.
Sun, X., Li, Z., Ding, X., Ji, G., Wang, L., Gao, X., Chang, Q., and Zhu, L., 2022, Effects of algal blooms on phytoplankton composition and hypoxia in coastal waters of the northern Yellow Sea, China: Frontiers in Marine Science, v. 9, article 897418, 10 p., accessed July 30, 2025, at https://doi.org/10.3389/fmars.2022.897418.
Tian, C., and Wang, L., 2019, Stable isotope variations of daily precipitation from 2014–2018 in the central United States: Scientific Data, v. 6, article 190018, 8 p., accessed July 30, 2025, at https://doi.org/10.1038/sdata.2019.18.
Udeigwe, T.K., and Wang, J.J., 2010, Biochemical oxygen demand relationships in typical agricultural effluents: Water, Air, & Soil Pollution, v. 213, p. 237–249, accessed July 30, 2025, at https://doi.org/10.1007/s11270-010-0381-5.
U.S. Environmental Protection Agency, 1971, Biochemical oxygen demand (5 days, 20 °C): U.S. Environmental Protection Agency Method 405.1 [revised 1974], accessed July 30, 2025, at https://www.nemi.gov/methods/method_summary/5326/.
U.S. Environmental Protection Agency, [1993], The determination of chemical oxygen demand by semi-automated colorimetry (revision 2.0, August 1993): U.S. Environmental Protection Agency Method 410.4, accessed July 31, 2025, at https://www.epa.gov/sites/default/files/2015-08/documents/method_410-4_1993.pdf.
U.S. Environmental Protection Agency, 1999, 1999 update of ambient water quality criteria for ammonia: U.S. Environmental Protection Agency report EPA 822-R-99-014. [Supersedes 1998 update. Also available at https://nepis.epa.gov/Exe/ZyPDF.cgi/20003O3L.PDF?Dockey=20003O3L.PDF.]
U.S. Environmental Protection Agency, 2023a, Combined sewer overflow basics: U.S. Environmental Protection Agency web page, accessed September 2023 at https://www.epa.gov/npdes/combined-sewer-overflow-basics.
U.S. Environmental Protection Agency, 2023b, Combined sewer overflows (CSOs): U.S. Environmental Protection Agency web page, accessed September 2023 at https://www.epa.gov/npdes/combined-sewer-overflows-csos.
U.S. Environmental Protection Agency, 2023c, Grand Calumet River AOC: U.S. Environmental Protection Agency web page, accessed September 2023 at https://www.epa.gov/great-lakes-aocs/grand-calumet-river-aoc.
U.S. Geological Survey, 2020, Dissolved oxygen: U.S. Geological Survey Techniques and Methods, book 9, chap. A6.2, 33 p., accessed July 31, 2025, at https://doi.org/10.3133/tm9A6.2. [Supersedes U.S. Geological Survey Techniques of Water-Resources Investigations, book 9, chap. A6.2, version 3.0.]
U.S. Geological Survey, 2023, USGS water data for the nation: U.S. Geological Survey National Water Information System database, accessed September 17, 2023, at https://doi.org/10.5066/F7P55KJN.
U.S. Geological Survey, 2024, Parameters: U.S. Geological Survey National Water Information System database, accessed July 23, 2025, at https://help.waterdata.usgs.gov/codes-and-parameters/parameters.
U.S. Geological Survey, [variously dated], National field manual for the collection of water-quality data, section A of Handbooks for water-resources investigations: U.S. Geological Survey Techniques of Water-Resources Investigations, book 9, 10 chaps. (A0–A8, A10), accessed November 16, 2023, at https://www.usgs.gov/mission-areas/water-resources/science/national-field-manual-collection-water-quality-data-nfm?qt-science_center_objects=0&qt-scie nce_center_objects.
Wagner, R.J., Boulger, R.W., Jr., Oblinger, C.J., and Smith, B.A., 2006, Guidelines and standard procedures for continuous water-quality monitors—Station operation, record computation, and data reporting: U.S. Geological Survey Techniques and Methods, book 1, chap. D3, [variously paged; 83 p.], accessed July 31, 2025, at https://doi.org/10.3133/tm1D3.
Wang, Z., Akbar, S., Sun, Y., Gu, L., Zhang, L., Lyu, K., Huang, Y., and Yang, Z., 2021, Cyanobacterial dominance and succession—Factors, mechanisms, predictions, and managements: Journal of Environmental Management, v. 297, article 113281, 8 p., accessed July 31, 2025, at https://doi.org/10.1016/j.jenvman.2021.113281.
Wetzel, R.G., 2001, Limnology—Lake and river ecosystems: London, Academic Press, 1,006 p. [Also available at https://doi.org/10.1016/C2009-0-02112-6.]
Wolf, D.I., and Vis, M.L., 2020, Stream algal biofilm community diversity along an acid mine drainage recovery gradient using multimarker metabarcoding: Journal of Phycology, v. 56, no. 1, p. 11–22, accessed July 31, 2025, at https://doi.org/10.1111/jpy.12935.
Xue, D., De Baets, B., Van Cleemput, O., Hennessy, C., Berglund, M., and Boeckx, P., 2012, Use of Bayesian isotope mixing models to estimate proportional contributions of multiple nitrate sources in surface water: Environmental Pollution, v. 161, p. 43–49, accessed July 31, 2025, at https://doi.org/10.1016/j.envpol.2011.09.033.
YSI Incorporated, 2024, EXO user manual, revision K: Yellow Springs, Ohio, Xylem, accessed July 31, 2025, at https://www.ysi.com/File%20Library/Documents/Manuals/EXO-User-Manual-Web.pdf.
Zhang, Y., Shi, P., Song, J., and Li, Q., 2018, Application of nitrogen and oxygen isotopes for source and fate identification of nitrate pollution in surface water—A review: Applied Sciences, v. 9, no. 1, article 18, 17 p., accessed July 31, 2025, at https://doi.org/10.3390/app9010018.
Zhao, W., Li, Y., Jiao, Y., Zhou, B., Vogt, R.D., Liu, H., Ji, M., Ma, Z., Li, A., Zhou, B., and Xu, Y., 2017, Spatial and temporal variations in environmental variables in relation to phytoplankton community structure in a eutrophic river-type reservoir: Water, v. 9, no. 10, article 754, 15 p., accessed July 31, 2025, at https://doi.org/10.3390/w9100754.
Zhu, Q., Li, X., Li, G., Tang, W., Li, C., Li, J., Zhao, C., Du, C., Liang, X., Li, W., and Zhang, L., 2021, New insights into restoring microbial communities by side-stream supersaturated oxygenation to improve the resilience of rivers affected by combined sewer overflows: Science of the Total Environment, v. 782, article 146903, 13 p., accessed July 31, 2025, at https://doi.org/10.1016/j.scitotenv.2021.146903.
Conversion Factors
International System of Units to U.S. customary units
Temperature in degrees Celsius (°C) may be converted to degrees Fahrenheit (°F) as follows:
°F = (1.8 × °C) + 32.
Supplemental Information
Specific conductance is given in microsiemens per centimeter at 25 degrees Celsius (µS/cm at 25 °C).
Concentrations of chemical constituents in water are given in either milligrams per liter (mg/L) or micrograms per liter (µg/L).
Results for measurements of chlorophyll fluorescence (fChl) are reported in estimated concentrations of chlorophyll in micrograms per liter (µg/L).
Results for measurements of stable isotopes of an element (with symbol E) in water and dissolved constituents are expressed in per mil (‰), which is the isotopic ratio of a sample divided by an isotopic ratio in standards such as air (AIR) and Vienna Standard Mean Ocean Water (VSMOW) subtracted by 1 and then multiplied by 1000.
Abbreviations
δ2H
stable isotopic composition of hydrogen
δ15N
stable isotopic composition of nitrogen
δ18O
stable isotopic composition of oxygen
ASV
amplicon sequence variant
BUI
Beneficial Use Impairment
CSO
combined sewer overflow
DNA
deoxyribonucleic acid
EPA
U.S. Environmental Protection Agency
KPCOFGS
Kingdom;Phylum;Class;Order;Family;Genus;Species
PVC
polyvinyl chloride
USGS
U.S. Geological Survey
For more information about this report, contact:
Director, Ohio-Kentucky-Indiana Water Science Center
U.S. Geological Survey
5957 Lakeside Blvd
Indianapolis, IN 46278
GS-W-OKI_Director@usgs.gov
or visit our website at https://www.usgs.gov/centers/oki-water
Publishing support provided by
USGS Science Publishing Network,
Pembroke and Reston Publishing Service Centers
Disclaimers
Any use of trade, firm, or product names is for descriptive purposes only and does not imply endorsement by the U.S. Government.
Although this information product, for the most part, is in the public domain, it also may contain copyrighted materials as noted in the text. Permission to reproduce copyrighted items must be secured from the copyright owner.
Suggested Citation
Hammer-Lester, R., Dumond, A., Moore, M.T., Story, A., Shively, D., Byappanahalli, M.N., Aunins, A., and Lampe, D.C., 2026, Evaluation of a eutrophication Beneficial Use Impairment in the Grand Calumet River Area of Concern in northwest Indiana, 2021–22: U.S. Geological Survey Scientific Investigations Report 2026–5130, 57 p., https://doi.org/10.3133/sir20265130.
ISSN: 2328-0328 (online)
Study Area
| Publication type | Report |
|---|---|
| Publication Subtype | USGS Numbered Series |
| Title | Evaluation of a eutrophication Beneficial Use Impairment in the Grand Calumet River Area of Concern in northwest Indiana, 2021–22 |
| Series title | Scientific Investigations Report |
| Series number | 2026-5130 |
| DOI | 10.3133/sir20265130 |
| Publication Date | June 10, 2026 |
| Year Published | 2026 |
| Language | English |
| Publisher | U.S. Geological Survey |
| Publisher location | Reston, VA |
| Contributing office(s) | Ohio-Kentucky-Indiana Water Science Center |
| Description | Report: ix, 57 p.; 3 Data Releases; Dataset |
| Country | United States |
| State | Indiana |
| Other Geospatial | Grand Calumet River Area of Concern |
| Online Only (Y/N) | Y |
| Additional Online Files (Y/N) | N |