

Investigation of Fish Communities in Natural Channel Sections of the Mohawk River, New York
Links
- Document: Report (5.94 MB pdf) , HTML , XML
- Data Release: USGS Data Release - Fish Community Data from Natural Channel Sections of the Mohawk River, NY (ver. 1.1, January 2026)
- NGMDB Index Page: National Geologic Map Database Index Page (html)
- Download citation as: RIS | Dublin Core
Acknowledgments
This research was primarily funded by the Mohawk River Basin Program of the New York State Department of Environmental Conservation. The authors extend their appreciation to the New York State Canal Corporation’s Utica Maintenance Section, Region 4 and 6 Fisheries Units of the New York State Department of Environmental Conservation, and the New York State Museum Ichthyology Laboratory. The authors also thank Dylan Winterhalter, Andrew Adams, Benjamin Cuppett, Richard Beres, Dillon VanDemortel, Danny Skelton, Zachary Kubsch, John Christopher, John Byrnes, and Jason Finkelstein of the U.S. Geological Survey for their contributions to the field work or data analysis of this project.
Abstract
Little is known about the natural resources in the natural channel sections of the Mohawk River between Rome and Frankfort, New York, where the river channel runs separately from and parallel to the Erie Canal. This river section runs through multiple locations that are listed as active remediation sites under New York’s Inactive Hazardous Waste Disposal Site Program and has negligible public or commercial access. As a result, there is minimal recreational usage of this river section, and efforts to conduct biological sampling have been limited. To better understand the composition of fish communities and contaminant concentrations in the natural channel of the Mohawk River, the U.S. Geological Survey, in cooperation with the New York State Department of Environmental Conservation, sampled resident fish in the 34-kilometer section from the mouth of Oriskany Creek downstream to Frankfort. Fish communities were sampled using boat electrofishing during 2021, 2023, and 2024 across multiple reaches within this section. These data were used to estimate species richness (number of species), relative abundance and biomass (catch rates), population size structure (distribution of lengths), and fish condition (a proxy for health). Some gamefish specimens were also analyzed to determine contaminant concentrations in fish tissue.
A total of 1,531 individual fish and 38 fish species were captured across all surveys. Seventeen of the 38 (45 percent) species were classified as native to the Mohawk River watershed, whereas 21 of the 38 (55 percent) species were classified as nonnative. Some popular gamefish species such as largemouth bass (Micropterus salmoides) and smallmouth bass (Micropterus dolomieu) were abundant in most reaches, whereas others such as walleye (Sander vitreus) and northern pike (Esox lucius) were found sporadically. Only one round goby (Neogobius melanostomus) was captured, indicating that this high-profile invasive species remains uncommon in this habitat. A backwater reach had the greatest relative abundance and condition of many species. This indicates connected lentic habitats such as oxbows and backwaters may be important nursery and refuge areas in the aquatic ecosystem.
Polychlorinated biphenyl (PCB) concentrations in fish tissue were highly elevated relative to the New York State Department of Health (NYSDOH) fish consumption “don’t eat” advisory guideline. Some specimens exceeded the guideline by an order of magnitude or more, particularly those from a localized area downstream from the Utica Harbor Dam. Concentrations of perfluorooctanesulfonic acid (PFOS) often approached the NYSDOH “don’t eat” consumption guideline but only one sample exceeded the guideline. Concentrations of other contaminants such as mercury and pesticides were consistently measured at less than the “don’t eat” consumption guidelines. These data indicate PCBs remain the primary contaminant of concern in the natural channel of the Mohawk River and are readily bioaccumulating in aquatic organisms despite prior remediation measures. Taken together, the findings in this report are intended to inform future decisions related to fisheries management, public access, recreational usage, and fish consumption advisories.
Introduction
The Mohawk River, located in eastern and central New York, is among the longest rivers in the state at nearly 240 kilometers (km). Its headwaters originate near the southern Adirondack Mountains and it flows south until reaching Rome, New York, where it turns east and flows through the Mohawk River valley before entering the Hudson River just north of Albany. The Mohawk River is a popular destination for recreational activities (Duda and others, 2019) and its waters are a primary or backup drinking water source for more than 100,000 people (New York State Department of Environmental Conservation [NYSDEC], 2021).
Historically, the Mohawk River was shallow and free flowing, but most of the east-west part of the river was modified for navigation and incorporated into the Erie Canal in the early 20th century (McBride, 1994, 2009). Today, the Mohawk River and the Erie Canal run together for most of the distance between Rome and Albany as a series of permanent and seasonal impoundments. However, there are extensive remaining sections of the original river channel (more than 70 km) that run separately from and parallel to the Erie Canal. These sections of the original river channel are typically referred to as the natural channel and contain a distinctive habitat relative to the adjacent canalized habitats. Most of this habitat type exists between Rome and Frankfort, N.Y., where the river runs along the south side of the Erie Canal.
To better understand the natural resources of this habitat type, the U.S. Geological Survey (USGS), in cooperation with the NYSDEC, sampled fish communities in the natural channel of the Mohawk River. The focus of this effort was the 34-km section from the mouth of Oriskany Creek downstream to Frankfort, which encompasses the deepest and most navigable waters of the natural channel. The habitat in the Oriskany-Frankfort reach is generally characterized by little riparian development, high sinuosity, and steep mud banks (table 1). The primary habitat cover in the river is large wood in the form of fallen trees and log jams, although beds of aquatic plants are present in some depositional areas with low velocities. Hard substrates such as boulders, cobbles, or gravel are rare except in localized areas at tributary mouths. There is one USGS streamgage in this river section, USGS station 01342602 (Mohawk River near Utica, N.Y.; USGS, 2025a). Mean annual streamflow at this streamgage was 1,322 cubic feet per second during water years 2021–24 (table 1). Water level fluctuations are severe in this river section with numerous rapid increases of 5 to 10 feet or more observed during the 4-year study period (fig. 1).
Table 1.
Physical habitat information for the Oriskany-Frankfort section of the natural channel of the Mohawk River in New York.[A water year is the period from October 1 to September 30 and is designated by the year in which it ends. km, kilometer; ft3/s, cubic foot per second; m, meter; %, percent]
| Parameter | Value | Data source |
|---|---|---|
| Length (km) | 34.24 | National Hydrography Dataset (U.S. Geological Survey, 2023) |
| Sinuosity | 1.36 | National Hydrography Dataset (U.S. Geological Survey, 2023) |
| Mean annual streamflow (ft3/s)1 | 1322 | National Water Information System (U.S. Geological Survey, 2025a) |
| Mean width (m)2 | 36.21 | National Hydrography Dataset (U.S. Geological Survey, 2023) |
| Gradient (%) | 0.03 | StreamStats (U.S. Geological Survey, 2025b) |
| Riparian development (%)3 | 16.5 | National Land Cover Database (U.S. Geological Survey, 2024a) |
| Elevation range (m) | 112–123 | StreamStats (U.S. Geological Survey, 2025b) |
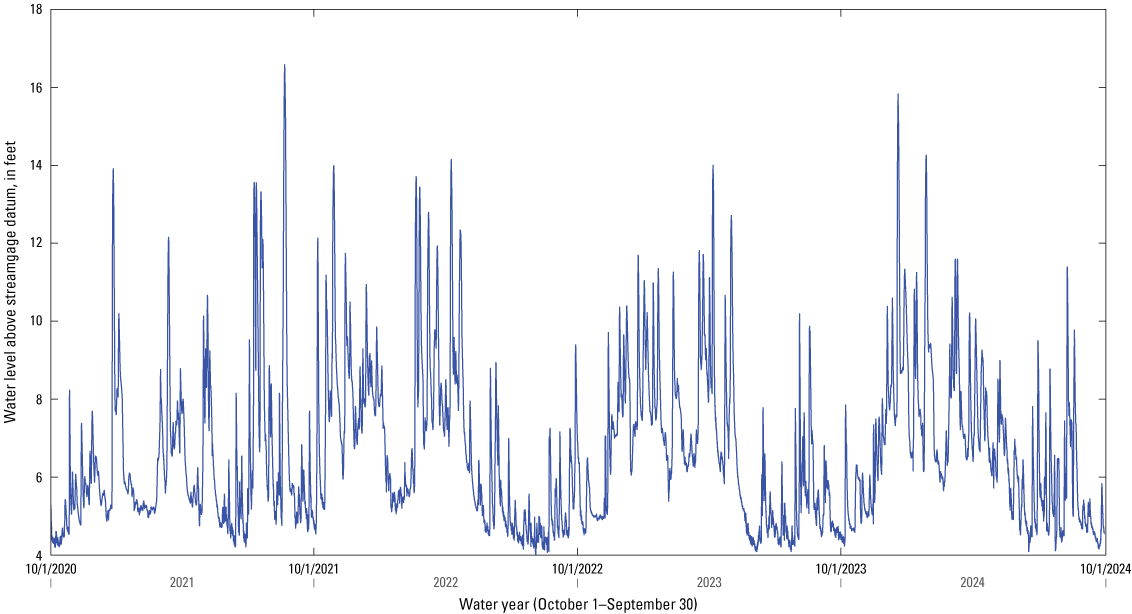
Hydrograph showing continuous (15-minute) water level data measured at streamgage 01342602 during water years 2021 through 2024. Data are from U.S. Geological Survey (2025a).
The Oriskany-Frankfort section of the natural channel also is noteworthy because it runs through seven active New York State Superfund Program remediation sites (NYSDEC, 2025a). Industry was pervasive along this section of the Mohawk River from the late 1800s to the 1970s, including energy production from coal and gas; asphalt, road tar, and chemical manufacturing; petroleum product storage; a metal machining scrapyard; and a landfill. The cumulative effect of this industrial activity has resulted in volatile organic compounds, polycyclic aromatic hydrocarbons, polychlorinated biphenyls (PCBs), per- and polyfluoroalkyl substances (PFAS), and metals being identified as contaminants of concern in the soil, groundwater, and river sediments at one or more of the remediation sites (NYSDEC, 2025a). A biological survey in 1934 noted “from Utica to Frankfort, the river runs as an open sewer with the water so foul that only the most tolerant species could be expected to survive; and attempts to capture fish in this section failed entirely” (New York Conservation Department, 1934). Considerable remediation efforts were conducted within and around the Oriskany-Frankfort section of the natural channel in the early 2000s, and the sites are still actively managed or monitored for any remaining sources of pollution. As a result of the pervasive contamination, there are multiple fish consumption advisories for this section of the Mohawk River and adjacent parts of the Erie Canal. Specifically, there is a New York State Department of Health (NYSDOH) “don’t eat” advisory for most gamefish because of elevated PCB concentrations in fish tissue relative to NYSDOH consumption guidelines (NYSDOH, 2025). New York State has also listed this river section as impaired on every iteration of the 303(d) List of Impaired Waters for PCBs since the waterbody was first assessed for PCBs in 1998 (NYSDEC, 2024).
Obtaining information from tributaries and understudied river sections has long been a management priority of the NYSDEC for the Mohawk River watershed. There is particularly little information available about the natural channel of the Mohawk River because of a lack of access points, which severely restricts both scientific research and public usage of the resource. There is virtually no public access and only minimal, low-intensity private access to the 34-km Oriskany-Frankfort reach of the natural channel. Most of the existing fish community data from this reach are from a 1981–85 survey of a region described as the “Middle Mohawk River” (Carlson, 2015). That study relied primarily on gill net and seine sampling and remains the most robust dataset available from the natural channel. Obtaining current and comprehensive information from this lengthy stretch of habitat is relevant not only for understanding and managing the aquatic ecosystem, but also for informing efforts to improve public access. The Mohawk River Basin Action Agenda recommends numerous actions aimed at improving public access and recreational opportunities in the watershed (NYSDEC, 2021). Therefore, the primary objective of this project was to better understand the composition of fish communities and contaminant concentrations in resident fish. Taken together, this information can be used to help inform future management and recreational use of this natural resource and will serve as a baseline to determine the effects of future management actions and introductions of invasive species.
Methods
The Oriskany-Frankfort section of the natural channel was separated into four sampling reaches based on access points, barriers, and habitat types (table 2). These sampling reaches are referred to as the upper Utica reach, the lower Utica reach, the lower Utica backwater reach, and the Frankfort reach. The upper Utica reach extends from the Oriskany Creek confluence eastward to the Utica Harbor Dam. The lower Utica reach extends from the downstream side of the Utica Harbor Dam eastward to the Dyke Road bridge (below which is an impassable rapid for boats). The lower Utica backwater is a large lentic habitat that can be accessed by boat from the north shore of the lower Utica reach. The lower Utica backwater reach was included in the study because it retains a direct water connection to the river at most or all water levels and its rare habitat type could confer considerable ecological importance. The Frankfort reach extends from the mouth of Bonny Brook (which created an impassable barrier to boats) eastward to where the Mohawk River reenters the Erie Canal at Frankfort. Given the vast amount of habitat in these reaches, subreaches were sampled to characterize each reach (table 2). The Frankfort and upper Utica reaches were sampled in 2021, the lower Utica and lower Utica backwater reaches were sampled in 2023, and additional subreaches of the lower Utica reach were sampled in 2024 (fig. 2A–D; table 2).
Table 2.
Reach description, sampling dates, number of subreaches, total electrofishing time, and method for achieving boat access on the natural channel of the Mohawk River in New York, 2021–24.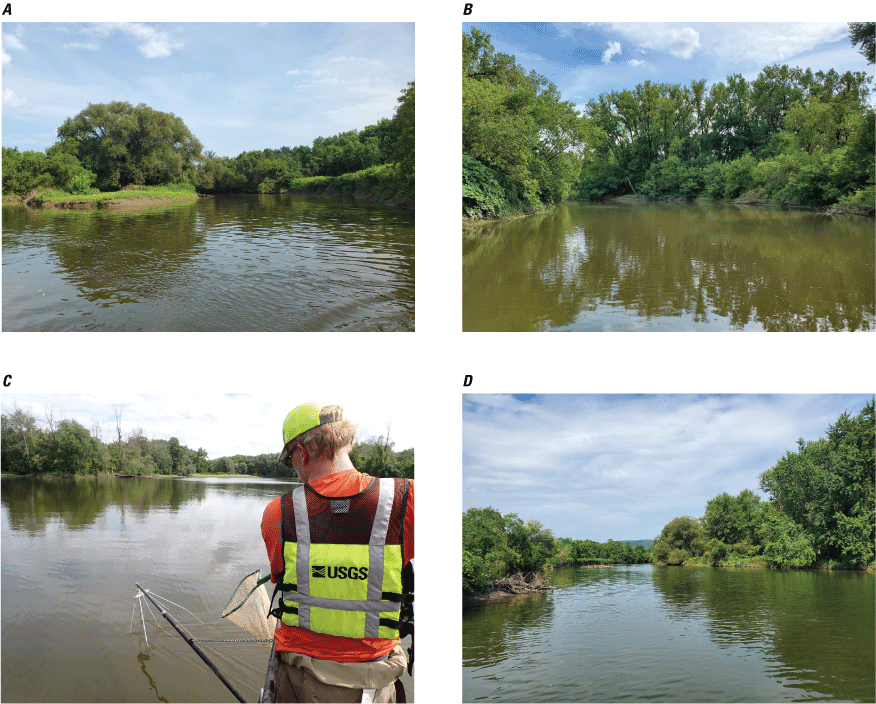
Photographs of the (A) upper Utica, (B) lower Utica, (C) lower Utica backwater, and (D) Frankfort reaches sampled on the natural channel of the Mohawk River in New York, 2021–24. Photographs A, B, and D by Scott George, U.S. Geological Survey; photograph C by Scott Wells, New York State Department of Environmental Conservation, used with permission.
Fish communities were sampled using boat electrofishing of nearshore habitats during late summer and generally followed methods described in Miranda and Boxrucker (2009) and Moulton and others (2002). Sampling was conducted during daytime because of the moderately turbid waters (Miranda and Boxrucker, 2009) characteristic of this section of the river and for safety considerations associated with boat launching, operation, and retrieval in unmarked channels without launches (fig. 3A, B).
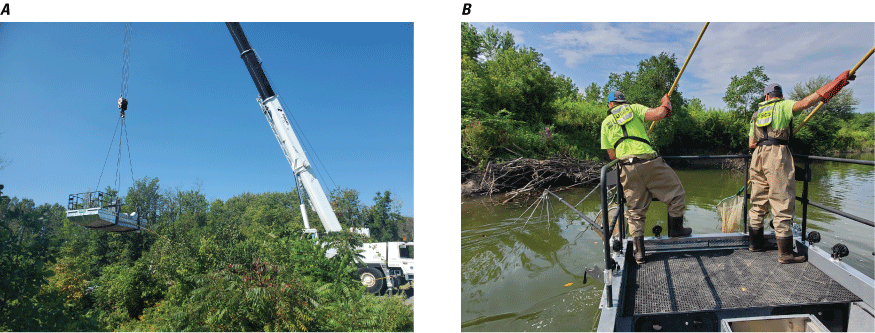
Photographs showing (A) crane-facilitated boat launching and (B) two technicians preparing to net fish during an electrofishing survey on the natural channel of the Mohawk River in New York. Photographs by Scott George, U.S. Geological Survey.
Sampling was conducted using a 5.1-meter (m) Smith-Root electrofishing boat with two anode booms outfitted with an APEX electrofishing system and EU7000iS Honda 7000-watt inverter generator. All electrofishing used pulsed direct current (voltage of 150–210 volts, frequency of 40–60 hertz, and duty cycle of 20 percent). Three or more subreaches within each reach (excluding the lower Utica backwater reach due to its limited size) were sampled (fig. 4A–D) to account for the patchiness common in fish distributions (Hubert and Fabrizio, 2007). For each subreach, electrofishing was conducted for 1,800 seconds of “on time” distributed evenly among parallel near-shore habitats (900 seconds along each bank). Sampling was conducted in a downstream-to-upstream direction and two to three crew members netted the stunned fish. All captured fish were transported to a shoreline processing station where they were identified to species, measured for total length (to the nearest millimeter [mm]), and weighed (to the nearest 0.1 gram [g]). The raw fish community data from all surveys are available in George and others (2025). All fish were released after processing, except for some individual fish that were kept for contaminant analysis.
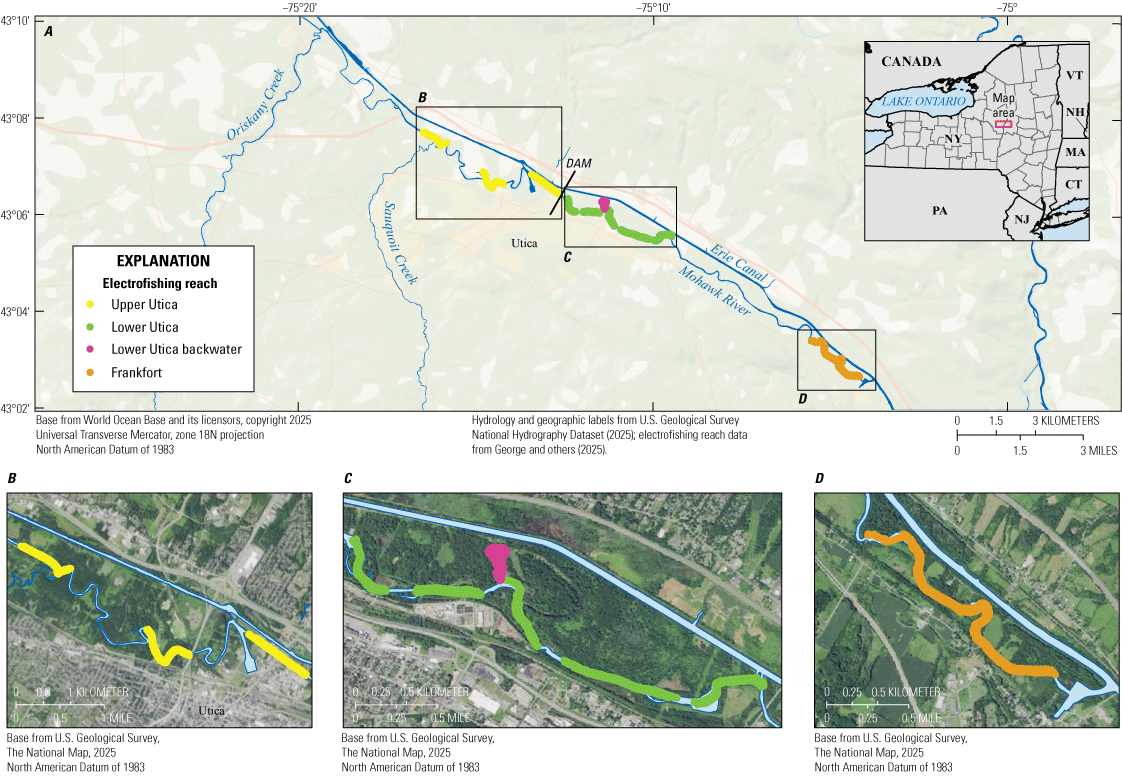
Map showing (A) the spatial coverage of boat electrofishing surveys across four reaches of the natural channel of the Mohawk River in New York, 2021–24, including enlarged map areas of (B) the upper Utica reach, (C) the lower Utica and lower Utica backwater reaches, and (D) the Frankfort reach. Data from George and others (2025).
The NYSDEC kept specimens of some gamefish species for contaminant analysis as part of a state-wide monitoring program. Individual fish were selected for analysis if they were (a) a popular gamefish likely to be targeted and consumed by anglers, (b) of legal size for harvesting, and (c) sufficiently abundant with multiple adult individuals present. These specimens were stored on ice and frozen within 24 hours. A standard left-side fillet from each specimen (NYSDEC, 2014) was analyzed at the NYSDEC Hale Creek Field Station Analytical Services Unit for PCBs, organochlorine pesticides (OCPs), mercury, and PFAS following standard operating procedures (NYSDEC, 2013, 2022, 2023c). Homogenized tissue aliquots for PCBs and OCPs were freeze-dried and then Soxhlet-extracted. After evaporating to dryness for lipid determination, samples were rediluted before cleanup on a Florisil column. Concentrations of PCBs and OCPs were quantified using a gas chromatography-electron capture detector. Total PCBs were determined by quantification of the sum of Aroclors 1242 and 1254/1260. Nineteen OCP compounds were determined by comparison to external calibration curves. Ten percent of samples were qualitatively confirmed by gas chromatography-mass spectroscopy. Mercury was determined by thermal decomposition, amalgamation, and atomic absorption spectrophotometry (NYSDEC, 2023c). Samples for PFAS determination were extracted in basic methanol, followed by solid-phase extraction clean up. Sample quantification for 13 PFAS compounds was determined by liquid chromatography-mass spectroscopy using isotope dilution methods (NYSDEC, 2022). Quality control for all methods included instrument calibration checks, surrogate compounds and control spikes (for PCBs and OCPs), duplicates, blanks, and reference materials. Instrument quality control was checked at the method-specified intervals, and sample batch processing controls (spikes, duplicates, blanks, and reference materials) were run at a minimum rate of 1:20 samples. Quality assurance was within control limits for accuracy, precision, and potential laboratory contamination for most analytical runs; where quality-control results were outside those limits, samples were either rerun or qualified, thereby allowing all data to be used for this study. Total PCBs, total dichlorodiphenyltrichloroethane (DDT), total mercury, and perfluorooctanesulfonic acid (PFOS) are presented in this report, and the full suite of all analytes and associated quality assurance data are available upon request from the NYSDEC Division of Fish and Wildlife (NYSDEC, 2023a, b, 2025b).
Data Analysis
Catch per unit effort was calculated for each species as fish per hour using ratio estimation. The ratio estimation approach involves adding the catch data from all subreaches within a reach and then dividing the total catch by the total effort, producing an estimate of relative abundance in fish per hour (fish/hr). Ratio estimation was used instead of averaging the catch rates for each individual subreach because the ratio estimation approach reduces the degree of bias (Hansen and others, 2007). Ratio estimation was also used with the weight data to produce estimates of relative biomass as grams of fish per hour (g/hr).
Size structure (distribution of fish lengths) was examined for six representative species that were captured in most or all reaches and span a variety of foraging behaviors and trophic positions. These species were largemouth bass (Micropterus salmoides), smallmouth bass (Micropterus dolomieu), brown bullhead (Ameiurus nebulosus), yellow perch (Perca flavescens), common carp (Cyprinus carpio), and pumpkinseed (Lepomis gibbosus). Size structure was assessed (a) visually using length frequency distributions with Gaussian kernel density estimate curves (Silverman, 1986) and (b) using the proportional size distribution (PSD) statistic. PSD is the percentage of adult individuals of a given species that meet or exceed the Gabelhouse quality length value (Gabelhouse, 1984; Neumann and others, 2012). This was calculated for each species as:
where PSD is the proportional size distribution statistic, the fraction numerator is the number of individuals that meet or exceed the quality length, and the fraction denominator is the number of adult individuals defined as those that meet or exceed the stock length (Gabelhouse, 1984; Neumann and others, 2012). PSD was calculated using the Simple Fisheries Stock Assessment Methods package (Ogle and others, 2025) in R (R Core Team, 2024).
Fish condition was compared among the four reaches using relative weight for the same six species. Relative weight is a measure of fish plumpness and is used as a surrogate for estimating fish health or condition (Neumann and others, 2012). Relative weight is based on the ratio of the observed fish weight to an expected weight based on fish length at capture (Wege and Anderson, 1978; Blackwell and others, 2000) and was calculated as:
whereWr
is the relative weight,
W
is the weight of a given fish, and
Ws
is a standard weight for a fish of the observed length across the species geographic range (Pope and Kruse, 2007; Neumann and others, 2012; Ogle, 2016).
Standard weights were determined from the species-specific standard weight equations in Neumann and others (2012) and were used to calculate relative weight for each species with the Simple Fisheries Stock Assessment Methods package (Ogle and others, 2025) in R (R Core Team, 2024). The minimum total length for inclusion in this calculation was 150 mm for both largemouth bass and smallmouth bass, 130 mm for brown bullhead, 100 mm for yellow perch, 200 mm for common carp, and 50 mm for pumpkinseed (Neumann and others, 2012; Ogle and others, 2025). A relative weight value of 100 for these species corresponds to the 75th percentile of fish weight for a given length, representing a fish in above-average condition. Linear regression was used to explore the relation between relative weight and fish length for each species to determine if fish condition changed with fish size (Pope and Kruse, 2007).
Results
A total of 1,531 individual fish and 38 fish species (including one hybrid) were captured across all surveys. Seventeen of the 38 (45 percent) species were classified as native to the Mohawk River watershed, whereas 21 of the 38 (55 percent) species were classified as nonnative (table 3). Some popular gamefish species such as largemouth bass (fig. 5A) and smallmouth bass (fig. 5B) were abundant in most reaches, whereas others such as northern pike (Esox lucius) (fig. 5C) and walleye (Sander vitreus) (fig. 5D) were only found sporadically. Species richness ranged from 20 species at the lower Utica backwater reach, 21 at the upper Utica reach, 24 at the Frankfort reach, to 31 at the lower Utica reach (table 3).
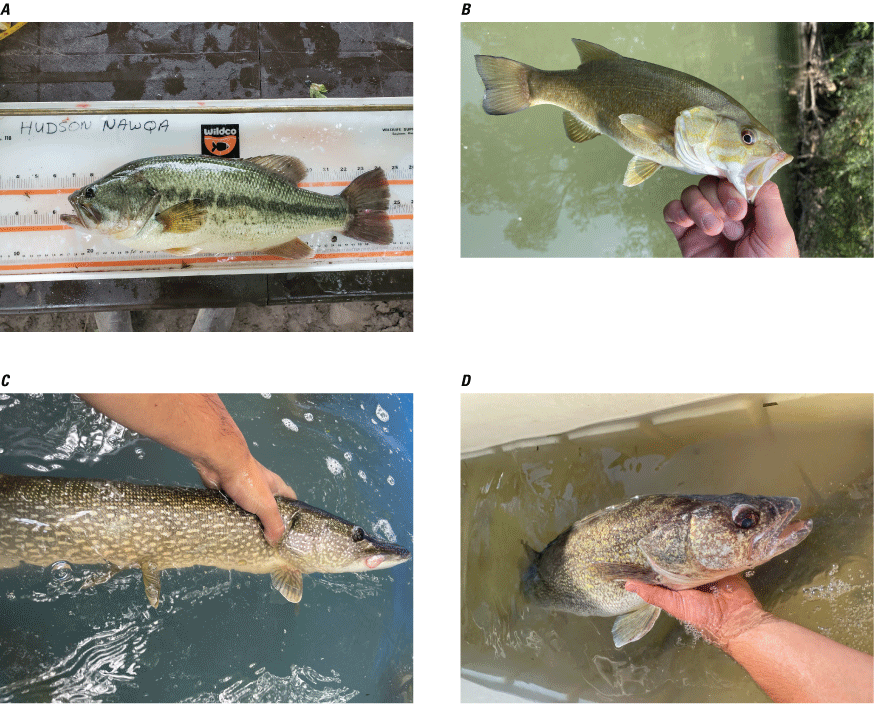
Photographs of a (A) largemouth bass (Micropterus salmoides), (B) smallmouth bass (Micropterus dolomieu), (C) northern pike (Esox lucius), and (D) walleye (Sander vitreus) from the natural channel of the Mohawk River in New York. Photograph A by Scott George, U.S. Geological Survey (USGS); photograph B by Dylan Winterhalter, USGS; photograph C by John Christopher, USGS; and photograph D by Thomas Sadekoski, USGS.
Relative abundance of all species ranged from 115 fish/hr at the upper Utica reach to 716 fish/hr at the lower Utica backwater reach (table 3). The greater catch rates in the backwater reach were driven largely by golden shiner (Notemigonus crysoleucas; 132 fish/hr), yellow perch (124 fish/hr), brown bullhead (104 fish/hr), pumpkinseed (82 fish/hr), and gizzard shad (Dorosoma cepedianum; 78 fish/hr) (table 3). Relative biomass of all species ranged from 26,023 g/hr at the Frankfort reach to 171,229 g/hr at the lower Utica reach (table 3). Common carp comprised 75, 83, 50, and 20 percent of the biomass in the upper Utica, lower Utica, lower Utica backwater, and Frankfort reaches, respectively, and the species’ near-absence from the Frankfort reach was primarily responsible for the lower biomass in that reach.
Table 3.
The relative abundance and relative biomass for all fish captured during electrofishing surveys at four reaches of the natural channel of the Mohawk River in New York, 2021–24.[Data from George and others (2025). The native status of each species to the Mohawk River watershed was determined using the species list in Carlson and others (2016). A “—” indicates no fish of a given species were captured.]
The size structures of largemouth bass and smallmouth bass were dominated by fish less than 200 mm in length at the upper Utica and lower Utica reaches, whereas the proportion of larger individuals was greater at the Frankfort and lower Utica backwater reaches (fig. 6A–L). Common carp size structure consisted of exclusively large adults at the upper Utica, lower Utica, and Frankfort reaches, whereas the lower Utica backwater reach contained a more balanced size distribution that included small individuals. Brown bullhead size structure was tightly clustered in the range of 250–350 mm at the two reaches where the species was found. Yellow perch and pumpkinseed size structures at all reaches were heavily skewed towards fish less than 120 mm, although some large yellow perch exceeding 300 mm were found at the lower Utica reach. When the data were composited across all reaches, the PSD values were: 79 for largemouth bass, 67 for smallmouth bass, 98 for brown bullhead, 29 for yellow perch, 99 for common carp, and 2 for pumpkinseed.
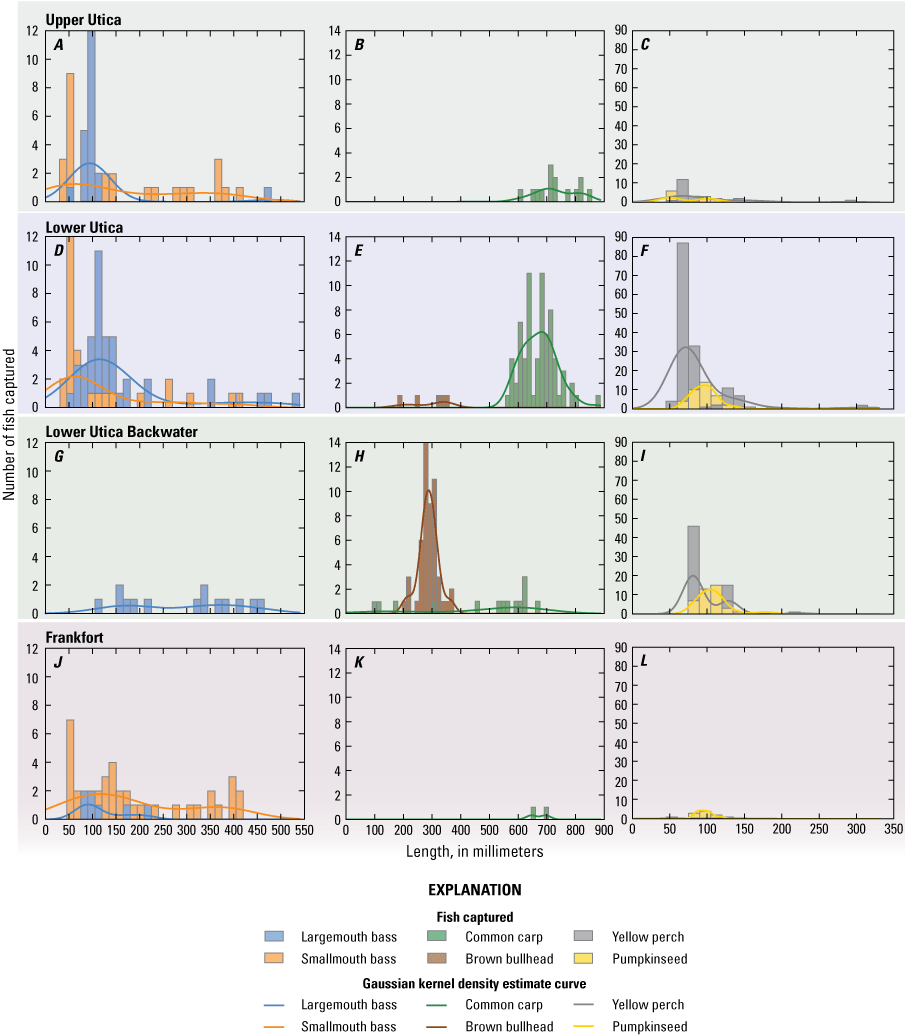
Graphs of length frequency distributions with Gaussian kernel density estimate curves showing the size structure of six abundant gamefish species (largemouth bass [Micropterus salmoides], smallmouth bass [Micropterus dolomieu], brown bullhead [Ameiurus nebulosus], yellow perch [Perca flavescens], common carp [Cyprinus carpio], and pumpkinseed [Lepomis gibbosus]) captured during electrofishing surveys at the (A–C) upper Utica, (D–F) lower Utica, (G–I) lower Utica backwater, and (J–L) Frankfort reaches of the natural channel of the Mohawk River in New York, 2021–24. Data from George and others (2025).
Fish condition was examined for the same six species for which size structure was assessed. Largemouth bass had the greatest mean relative weight of the six species, ranging from 115.8 at the Frankfort reach to 121.5 at the lower Utica reach (table 4). The relative weights of common carp and pumpkinseed were also consistently large, with most individuals exceeding 100 and therefore representing fish in above average condition. In contrast, the relative weight of brown bullhead was consistently below this target, ranging from 86.7 at the lower Utica backwater reach to 88.9 at the lower Utica reach. The other two species produced more variable estimates of relative weight among the four reaches.
Table 4.
Mean relative weight, standard error, and number of individuals used in the calculation for six abundant gamefish species captured during electrofishing surveys at four reaches of the natural channel of the Mohawk River in New York, 2021–24.[Data from George and others (2025). Species are given by common names; the corresponding scientific names can be found in table 3. A “—“ indicates that less than two fish meeting the minimum length value of a given species were present and therefore a relative weight (Wr) value was not calculated. SE, standard error; n, number of individuals]
Linear regression identified size-related condition trends for four of the six species (fig. 7). The condition of largemouth bass and smallmouth bass declined in relation to greater fish length, whereas the condition of common carp and pumpkinseed increased in relation to greater fish length. No clear size-related condition trends were noted for brown bullhead and yellow perch.
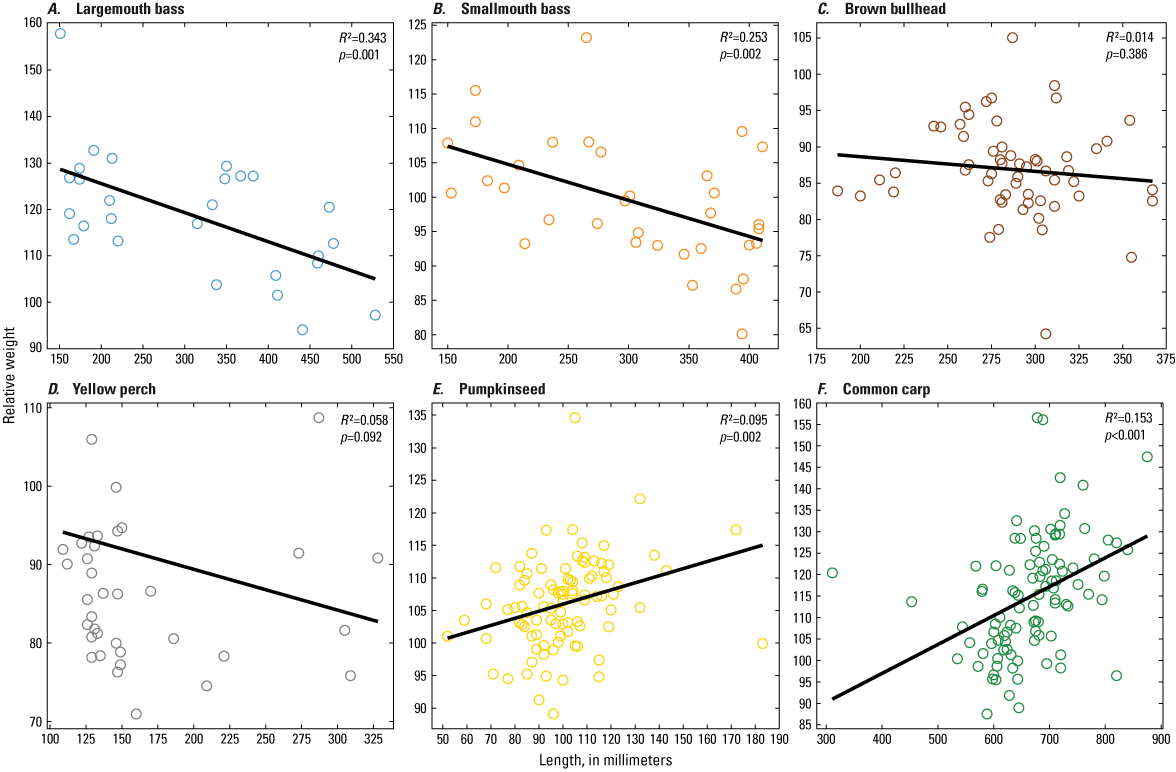
Scatterplots showing the relation between the relative weight and length with line of best fit for six abundant gamefish species (largemouth bass [Micropterus salmoides], smallmouth bass [Micropterus dolomieu], brown bullhead [Ameiurus nebulosus], yellow perch [Perca flavescens], common carp [Cyprinus carpio], and pumpkinseed [Lepomis gibbosus]) captured during electrofishing surveys on the natural channel of the Mohawk River in New York, 2021–24. R2, coefficient of determination; p, probability value associated with the slope of the line of best fit; <, less than.
A total of 81 fish were taken for contaminant analysis throughout the three years of sampling, although at the time of this report, data are only available for the 67 fish collected during the 2021 and 2023 sampling (NYSDEC, 2023a, b, 2025b). These 67 fish consisted of 2 common carp, 2 chain pickerel (Esox niger), and 10 smallmouth bass from the Frankfort reach in 2021; 8 common carp, 4 chain pickerel, 3 walleye, and 2 northern pike from the upper Utica reach in 2021; 7 largemouth bass and 9 brown bullhead from the lower Utica backwater reach in 2023; and 10 common carp, 3 largemouth bass, 6 white sucker, and 1 brown bullhead from the lower Utica reach in 2023.
Concentrations of total PCBs ranged from below the limit of detection to 52.7 micrograms per gram (µg/g), and 57 percent of all individuals exceeded the NYSDOH “don’t eat” consumption guideline of 1 µg/g (NYSDOH, 2025). Total PCB concentrations were generally highest in the lower Utica reach where 14 of the highest 20 concentrations were measured. Among species, common carp consistently had the highest total PCB concentrations, particularly those from the lower Utica reach, where the mean concentration from 10 fish was 18.8 µg/g. Total mercury concentrations ranged from 0.0314 to 0.561 µg/g and no values exceeded the NYSDOH “don’t eat” consumption guidelines of 0.95 (sensitive population) and 2 µg/g (general population). Total DDT concentrations ranged from below the limit of detection to 0.138 µg/g and no values exceeded the NYSDOH “don’t eat” consumption guidelines of 5 (sensitive population) and 15 µg/g (general population). Concentrations of PFOS ranged from below the limit of detection to 85.3 nanograms per gram (ng/g), with one value exceeding the NYSDOH “don’t eat” consumption guideline of 40 ng/g.
Table 5.
Contaminant concentrations in fish tissue from select specimens captured during electrofishing surveys at four reaches of the natural channel of the Mohawk River in New York, 2021–24.[Fish capture information is from George and others (2025) and contaminant data are from analytical reports (New York State Department of Environmental Conservation, 2023a, b, 2025b). Species are given by common names; the corresponding scientific names can be found in table 3. Values displayed in bold font and followed by an asterisk (*) exceed the New York State Department of Health consumption guidelines for “don’t eat” (New York State Department of Health, 2025). Values reported as <DL are below the method limit of detection. Length is given in millimeters (mm); weight in grams (g); polychlorinated biphenyl (PCB), mercury, and dichlorodiphenyltrichloroethane (DDT) in micrograms per gram (µg/g) wet weight; perfluorooctanesulfonic acid (PFOS) in nanograms per gram (ng/g) wet weight]
Discussion
Fish communities in the Oriskany-Frankfort section of the Mohawk River were dominated by warmwater species typical of lakes and large rivers in New York. The 38 species identified in this study compared similarly to the 1981–85 survey, which identified 35 species across all sections of the natural channel (Carlson, 2015). Similarly, a study of canal habitats between Rome and Waterford (including canalized parts of the Mohawk River) during 2014 and 2015 identified 38 species (George and others, 2016). The results from the current 2021–24 assessment indicate reaches of the natural channel varied across a continuum of riverine (river-like) to lacustrine (lake-like) community types. At one extreme, the fish community at the Frankfort reach was the most riverine, being dominated by minnows and smallmouth bass. In contrast, the lower Utica backwater reach had the most lacustrine structure, producing the greatest relative abundance of largemouth bass, bluegill (Lepomis macrochirus), pumpkinseed, yellow perch, golden shiner, and brown bullhead, whereas smallmouth bass were not captured. The lower Utica backwater reach also had the greatest condition of yellow perch and pumpkinseed and the second greatest condition of largemouth bass observed in the study. Taken together, these results underscore the potential importance of the lower Utica backwater reach and similar connected lentic waters such as oxbows, bays, and backwaters. The data indicate that such habitats likely function as nursery and refuge areas that may be important to sustain populations of lentic species in the dominant river-channel habitat.
One of the most noteworthy findings from this investigation was the near-absence of round goby (Neogobius melanostomus) from the fish community in the natural channel of the Mohawk River. Round goby is a well-known invasive fish species linked to a variety of negative ecological effects and has recently colonized the Mohawk and Hudson Rivers (George and others, 2021; Pendleton and others, 2022). Only a single round goby was captured throughout the 3 years of sampling on the natural channel. This specimen was captured in 2024 in the lower Utica reach and had a length of 78 mm and weight of 6.1 g (George and others, 2022). A few other deceased round goby were anecdotally noted during surveys, but round goby was a negligible part of the fish community in the sampled habitats. This finding is in contrast to recent and ongoing research on the canalized part of the Mohawk River and parts of the Hudson River, which have found round goby to be increasing in abundance, and in some cases, the dominant benthic fish (George and others, 2020; George and others, 2022).
The unexpected near-absence of round goby has a few plausible explanations. First, round goby were first identified in the Mohawk River watershed in 2014 (USGS, 2024b), so the species may simply require more time to reach its carrying capacity in the natural channel. Second, boat electrofishing has a known capture bias towards larger fish (Reynolds and Kolz, 2012) and could have underrepresented the abundance of round goby. Although other small benthic fish such as darters were well-represented in our data, a different sampling method could have been more effective at capturing round goby. Third, the most likely explanation for the near-absence of round goby is that the physical habitat in the Oriskany-Frankfort section of the Mohawk River is unsuitable or of poor quality for round goby. Shoreline and benthic habitats in the sampled reaches were dominated by mud substrates (fig. 2A–D), a considerable departure from the coarse rocky substrates preferred by round goby (Young and others, 2010; Kornis and others, 2012).
Contaminant concentrations in fish tissue varied greatly by species and reach but clearly indicate several important findings. First, PCBs appear to be the primary contaminant of concern for consuming fish in the natural channel of the Mohawk River. Concentrations of PFOS approached the NYSDOH “don’t eat” consumption guideline (NYSDOH, 2025), but only one value exceeded it. Mercury, total DDT (table 5), and other contaminants (available upon request from the NYSDEC) were consistently measured at well less than NYSDOH “don’t eat” consumption guidelines. Second, common carp consistently carried the highest concentrations of PCBs and thereby represent the greatest risk for human consumption. This finding is consistent with other research indicating that common carp often bioaccumulate PCBs at a greater rate than most fish species, likely because of their high lipid content and benthic foraging behavior (Pérez-Fuentetaja and others, 2010; Baldigo and others, 2023). Third, total PCB concentrations in most of the analyzed specimens exceeded levels expected to adversely affect piscivorous (fish eating) wildlife species (0.1–3 µg/g) such as American mink (Neogale vison), bald eagle (Haliaeetus leucocephalus), and North American river otter (Lontra canadensis) (Eisler, 1986; Canadian Council of Ministers of the Environment, 1999; Bush and others, 2020), indicating a potential risk to the broader ecosystem. Fourth, PCB concentrations were highest in fish from the lower Utica reach compared with the other three reaches. Nineteen of the 20 fish analyzed from this reach exceeded the NYSDOH “don’t eat” consumption guideline of 1 µg/g. Common carp from the lower Utica reach averaged 18.8 µg/g, with one individual measured at 52.7 µg/g. These results may be due to the lower Utica reach being nearest to all the active remediation sites in the Oriskany-Frankfort section of the Mohawk River with PCBs listed as a contaminant of concern (NYSDEC, 2025a). It is important to note, however, the comparisons among reaches are complicated by inconsistency in the species analyzed. For example, only two common carp were captured and analyzed from the Frankfort reach, and the availability of largemouth bass, smallmouth bass, and brown bullhead also differed considerably among reaches. Additional data may be necessary to make a more standardized comparison among reaches and to determine temporal trends over time in contaminant concentrations.
Despite the observed concentrations of PCBs in some species, the relative weight metric indicated most fish were in above-average condition. Nearly every largemouth bass and most common carp and pumpkinseed exceeded the 75th percentile of condition (relative weight>100). The mean condition of smallmouth bass approximated the 75th percentile and only the mean condition of yellow perch and brown bullhead was below the 75th percentile. This finding of mostly average or above-average fish condition is consistent with a review of the ecotoxicology of PCBs in fish, which found little evidence that PCBs have widespread effects on the health or survival of wild fish populations (Henry, 2015). Similarly, recent assessments in the Hudson River, N.Y. (Maceina and Sammons, 2019), Logan Martin Lake reservoir, Alabama (Rypel and Bayne, 2010), and St. Clair River in Ontario, Canada (Muttray and others, 2020), did not find evidence that fish tissue PCB concentrations affected fish growth or abundance. Another meta-analysis, however, found stronger evidence of PCB effects on fish survival, growth, and reproduction (Berninger and Tillitt, 2019). In the natural channel of the Mohawk River, the condition of largemouth bass and smallmouth bass declined as fish grew longer (a proxy measure for age). It is unclear if the observed declines result from cumulative effects of contaminant loads, lack of appropriate forage size, or data bias from not differentiating between male and female fish. This assessment of adult fish condition also does not consider other potential expressions of toxicity, such as reproductive impairment or early life stage mortality, and should simply be considered as one indicator of ecosystem health.
Conclusions
The findings of this study on fish communities and contaminant concentrations have important implications for future management of the Mohawk River natural channel. First, this investigation identified 34 kilometers (km) of riverine habitat characterized by largely undeveloped shorelines that sustain populations of frequently pursued gamefish such as largemouth bass (Micropterus salmoides), smallmouth bass (Micropterus dolomieu), walleye (Sander vitreus), and northern pike (Esox lucius). This suggests the habitat and natural resources of the natural channel might be suitable for recreational activities such as paddling, shore angling, and angling from paddle craft if it were deemed appropriate to expand public access. Second, the observed polychlorinated biphenyl concentrations in fish tissue clearly demonstrate the continued effect of legacy contaminants on the aquatic ecosystem. The contaminant data presented in this report may be used to reevaluate existing fish consumption advisories on the natural channel. The risks associated with exposure to contaminants in fish (and the surrounding landscape) must also be considered in decisions related to expanding public access and promoting use of the resource. Finally, despite considerable sampling effort during 2021–24, this investigation only surveyed a small part of the existing natural channel habitat type. About 31 percent of the 34 km Oriskany-Frankfort section was sampled, and none of the 15 km to the west between Rome and Oriskany was sampled. It may be reasonable to extrapolate these findings across the unsampled parts of the Oriskany-Frankfort section, but our findings should not be considered representative of the natural channel upstream from the confluence of Oriskany Creek, which is considerably narrower and shallower and does not have any active remediation sites on the adjacent shorelines. Additional investigation would be needed to identify the most appropriate sampling methods for this reach and could be considered as a future research direction. Future sampling in the Oriskany-Frankfort reach may also be considered to assess temporal trends in contaminant concentrations and support decision making for additional remedial studies or actions. Taken together, this information is intended to be used to guide future management, public access, and research on the natural channel of the Mohawk River.
References Cited
Baldigo, B.P., Phillips, P.J., George, S.D., and Filipski, M., 2023, Contaminant risks in consuming fish from the area of concern in the Upper Niagara River: Journal of Great Lakes Research, v. 49, no. 5, p. 1086–1101, accessed 2025 at https://doi.org/10.1016/j.jglr.2023.07.002.
Berninger, J.P., and Tillitt, D.E., 2019, Polychlorinated biphenyl tissue‐concentration thresholds for survival, growth, and reproduction in fish: Environmental Toxicology and Chemistry, v. 38, no. 4, p. 712–736, accessed 2025 at https://doi.org/10.1002/etc.4335.
Blackwell, B.G., Brown, M.L., and Willis, D.W., 2000, Relative weight (Wr) status and current use in fisheries assessment and management: Reviews in Fisheries Science, v. 8, no. 1, p. 1–44, accessed 2025 at https://doi.org/10.1080/10641260091129161.
Bush, D., Armstrong, B., Bowman, S., and Bohr, J., 2020, Assessment of the bird or animal deformities or reproductive problems beneficial use impairment in Michigan’s great lakes areas of concern: Michigan Department of Environment, Great Lakes, and Energy, Water Resources Division, Surface Water Assessment Section, report number MI/EGLE/WRD-20/002, 85 p., accessed 2025 at https://www.michigan.gov/-/media/Project/Websites/egle/Documents/Programs/WRD/GLWARM/Toxics/wildlife-bui-2020.pdf?rev=3ac4d617b15e467fad482ac61214f194.
Carlson, D.M., Daniels, R.A., and Wright, J.J., 2016, Atlas of inland fishes of New York: New York State Education Department and New York State Department of Environmental Conservation, New York State Museum Record 7, 370 p., accessed 2025, at https://nysm.nysed.gov/sites/default/files/atlasofinlandfishes.pdf.
Canadian Council of Ministers of the Environment, 1999, Canadian tissue residue guidelines for the protection of wildlife consumers of aquatic biota—Polychlorinated biphenyls (PCBs) (2001 ver.): Canadian Environmental Quality Guidelines, Canadian Council of Ministers of the Environment, Winnipeg, no. 1299, 8 p., accessed 2025 at https://ccme.ca/en/res/polychlorinated-biphenyls-pcbs-canadian-tissue-residue-guidelines-for-the-protection-of-wildlife-consumers-of-aquatic-biota-en. pdf.
Duda, M., Jones, M., Beppler, T., Bissell, S., Center, A., Criscione, A., Doherty, P., Hughes, G., Gerken, C., and Lanier, A., 2019, New York angler effort and expenditures in 2017—Report 1 of 4: New York State Department of Environmental Conservation, Division of Fish and Wildlife, prepared by Responsive Management, 189 p. [Also available at https://extapps.dec.ny.gov/docs/fish_marine_pdf/nyas17rpt1.pdf.]
Eisler, R., 1986, Polychlorinated biphenyl hazards to fish, wildlife, and invertebrates—A synoptic review: U.S. Fish and Wildlife Service Biological Report 85(1.7), no. 7, 88 p., accessed 2025 at https://ia800703.us.archive.org/35/items/polychlorinatedb00eisl/polychlorinatedb00eisl.pdf.
Gabelhouse, D.W., 1984, A length-categorization system to assess fish stocks: North American Journal of Fisheries Management, v. 4, no. 3, p. 273–285, accessed 2025 at https://doi.org/10.1577/1548-8659(1984)4<273:ALSTAF>2.0.CO;2.
George, S.D., Baldigo, B.P., Rees, C.B., Bartron, M.L., and Winterhalter, D., 2021, Eastward expansion of round goby in New York—Assessment of detection methods and current range: Transactions of the American Fisheries Society, v. 150, no. 2, p. 258–273, accessed 2025 at https://doi.org/10.1002/tafs.10290.
George, S.D., Baldigo, B.P., Rees, C.B., Bartron, M.L., Winterhalter, D.R., Coombs, J., and Darling, M.J., 2020, Environmental DNA (eDNA) and fish capture data from round goby screening surveys on the eastern Erie Canal, New York (ver. 2.0, May 2024): U.S. Geological Survey data release, accessed 2025 at https://doi.org/10.5066/P9W9TMPW.
George, S.D., Baldigo, B.P., and Wells, S.M., 2016, Effects of seasonal drawdowns on fish assemblages in sections of an impounded river–canal system in upstate New York: Transactions of the American Fisheries Society, v. 145, no. 6, p. 1348–1357, accessed 2025 at https://doi.org/10.1080/00028487.2016.1223751.
George, S.D., Darling, M.J., and Sadekoski, T.R., 2025, Fish community data from natural channel sections of the Mohawk River, NY (ver. 1.1, January 2026): U.S. Geological Survey data release, at https://doi.org/10.5066/P13JVPW7.
George, S.D., Rees, C.B., Bartron, M.L., Atkins, L.M., Baldigo, B.P., Coombs, J., Darling, M.J., and Getchell, R.G. 2022, Environmental DNA and fish capture data from round goby surveys on the Champlain Canal (ver. 17.0, December 2025): U.S. Geological Survey data release, accessed 2025 at https://doi.org/10.5066/P9ZCMH8S.
Hansen, M.J., Beard, T.D., Jr., and Hayes, D.B., 2007, Sampling and experimental design, chapter 3 in Guy, C.S., and Brown, M.L., eds., Analysis and interpretation of freshwater fisheries data: Bethesda, Maryland, American Fisheries Society, p. 51–120. [Also available at https://www.researchgate.net/publication/239918619_Sampling_and_Experimental_Design.]
Henry, T.B., 2015, Ecotoxicology of polychlorinated biphenyls in fish—A critical review: Critical Reviews in Toxicology, v. 45, no. 8, p. 643–661, accessed 2025 at https://doi.org/10.3109/10408444.2015.1038498.
Kornis, M., Mercado‐Silva, N., and Vander Zanden, M.J., 2012, Twenty years of invasion—A review of round goby Neogobius melanostomus biology, spread and ecological implications: Journal of Fish Biology, v. 80, no. 2, p. 235–285, accessed 2025 at https://doi.org/10.1111/j.1095-8649.2011.03157.x.
Maceina, M.J., and Sammons, S.M., 2019, The relation between polychlorinated biphenyls and population metrics of 4 species of fish from the upper Hudson River, New York, USA: Environmental Toxicology and Chemistry, v. 38, no. 2, p. 329–339, accessed 2025 at https://doi.org/10.1002/etc.4322.
McBride, N.D., 1994, A fisheries management plan for the lower Mohawk River: New York State Department of Environmental Conservation report, Mohawk River Watershed: H240, Watershed Filed #625, [variously paged; 109 p.] [Also available at https://nysl.ptfs.com/#!/s?a=c&q=*&type=16&criteria=field11%3D896959449&b=0.]
McBride, N.D., 2009, Lower Mohawk River fisheries, in Cockburn, J.M.H, and Garver, J.I., eds., Proceedings from the 2009 Mohawk Watershed Symposium, Olin Center, Union College, Schenectady, New York, March 27th, 2009: Union College, p. 51–54. [Also available at https://arches.union.edu/do/6e1d6b65-f603-4fd2-9ee1-77683b2e44ec.]
Miranda, L.E., and Boxrucker, J., 2009, Warmwater fish in large standing waters, in Bonar, S.A., Hubert, W.A., and Willis, D.W., eds., Standard methods for sampling North American freshwater fishes: Bethesda, Maryland, American Fisheries Society, p. 29–42. [Also available at https://doi.org/10.47886/9781934874103.ch3.]
Moulton, S.R., II, Kennen, J.G., Goldstein, R.M., and Hambrook, J.A., 2002, Revised protocols for sampling algal, invertebrate, and fish communities as part of the National Water-Quality Assessment Program: U.S. Geological Survey Open-File Report 02–150. [Also available at https://pubs.usgs.gov/of/2002/ofr-02-150/.]
Muttray, A., Muir, D., Tetreault, G., McMaster, M., and Sherry, J., 2020, Tissue contaminants and wild fish health in the St. Clair River Area of Concern—Part 2—Spatial trends and temporal declines in organics (corrigendum April 7, 2021): Science of The Total Environment, v. 746, no. 136525, 15 p. report and 1 p. corrigendum, accessed 2025 at https://doi.org/10.1016/j.scitotenv.2020.136525.
New York State Department of Environmental Conservation [NYSDEC], 2013, SOP OC1.108 (2-19-2013)—Determination of organochlorine residues by gas chromatography: New York State Department of Environmental Conservation. [Based on FDA Pesticide Analytical Manual Vol. I, 3rd Edition (1994, updated October 1999).]
New York State Department of Environmental Conservation [NYSDEC], 2021, Mohawk River Basin action agenda—Conserving, preserving, and restoring the Mohawk River watershed 2021–2026: New York State Department of Environmental Conservation, 32 p. [Also available at https://extapps.dec.ny.gov/docs/water_pdf/mohawkrbaa2021.pdf.]
New York State Department of Environmental Conservation [NYSDEC], 2023a, Mercury, PCBs, organochlorine pesticides, and PFAS analyses of fish collected in 2021 from the Mohawk River near Frankfort: New York State Department of Environmental Conservation, Division of Fish and Wildlife, Analytical Services Unit at Hale Creek Field Station Analytical data report no. ASU 23-37, 13 p.
New York State Department of Environmental Conservation [NYSDEC], 2023b, Mercury, PCBs, organochlorine pesticides, and PFAS analyses of fish collected in 2021 from the Mohawk River near Utica Harbor: New York State Department of Environmental Conservation, Division of Fish and Wildlife, Analytical Services Unit at Hale Creek Field Station Analytical data report no. ASU 23-38, 17 p.
New York State Department of Environmental Conservation [NYSDEC], 2023c, SOP HC-405.4—Determination of total Mercury (Hg) in fish tissue by thermal decomposition, amalgamation & atomic absorption spectrophotometry (Revision 4): New York State Department of Environmental Conservation. [Based on USEPA 7473].
New York State Department of Environmental Conservation [NYSDEC], 2024, Final 2020/2022 NYS section 303(d) list: New York State Department of Environmental Conservation. [Also available at https://extapps.dec.ny.gov/fs/projects/cleanwateract/nys_section303(d)_list.xlsx.]
New York State Department of Environmental Conservation [NYSDEC], 2025a, Environmental site remediation database search: New York State Department of Environmental Conservation database, accessed 2025 at https://appfactory.dec.ny.gov/DERExternalSearch/ERDSearch. [Site information directly accessible using site codes 633009, 633015, 633021, 633020, 633031, 633032, and 633047].
New York State Department of Environmental Conservation [NYSDEC], 2025b, Mercury, PCBs, organochlorine pesticides, and PFAS analyses of fish collected in 2023 from Mohawk River—Utica: New York State Department of Environmental Conservation, Division of Fish and Wildlife, Analytical Services Unit at Hale Creek Field Station Analytical data report no. ASU 25-16, 20 p.
New York State Department of Health [NYSDOH], 2025, New York State health advice on eating fish you catch: New York State Department of Health, accessed 2025 at https://www.health.ny.gov/environmental/outdoors/fish/health_advisories/.
Ogle, D.H., Doll, J.C., Wheeler, A.P., and Dinno, A., 2025, FSA—Simple fisheries stock assessment methods (ver. 0.9.6, January 2025): R package, accessed 2025 at https://cran.r-project.org/web/packages/FSA/index.html.
Pendleton, R., Berdan, R., George, S., Kenney, G., and Sethi, S.A., 2022, Round goby captured in a North American estuary—Status and implications in the Hudson River: Journal of Fish and Wildlife Management, v. 13, no. 2, p. 524–533, accessed 2025 at https://doi.org/10.3996/JFWM-22-012.
Pérez-Fuentetaja, A., Lupton, S., Clapsadl, M., Samara, F., Gatto, L., Biniakewitz, R., and Aga, D.S., 2010, PCB and PBDE levels in wild common carp (Cyprinus carpio) from eastern Lake Erie: Chemosphere, v. 81, no. 4, p. 541–547, accessed 2025 at https://doi.org/10.1016/j.chemosphere.2010.06.033.
R Core Team, 2024, R—A language and environment for statistical computing, version 4.4.1 (Race for Your Life): Vienna, Austria, R Foundation for Statistical Computing software release, accessed 2025 at https://www.r-project.org/ and https://cran.r-project.org/src/base/R-4/.
Rypel, A.L., and Bayne, D.R., 2010, Do fish growth rates correlate with PCB body burdens?: Environmental Pollution, v. 158, no. 8, p. 2533–2536, accessed 2025 at https://doi.org/10.1016/j.envpol.2010.05.014.
U.S. Geological Survey [USGS], 2023, USGS National hydrography dataset best resolution—New York: U.S. Geological Survey, National Geospatial Program dataset, accessed 2025 at https://www.usgs.gov/national-hydrography/national-hydrography-dataset.
U.S. Geological Survey [USGS], 2024a, Annual national land cover database (NLCD)—Collection 1 products (ver. 1.1, June 2025): U.S. Geological Survey data release, accessed 2025 at https://www.mrlc.gov/data.
U.S. Geological Survey [USGS], 2024b, Specimen observation data for Neogobius melanostomus (Pallas, 1814)—Nonindigenous aquatic species: U.S. Geological Survey database, accessed 2025 at https://nas.er.usgs.gov/queries/collectioninfo.aspx?SpeciesID=713.
U.S. Geological Survey [USGS], 2025a, USGS Water Data for the Nation: U.S. Geological Survey National Water Information System database, accessed 2025 at https://doi.org/10.5066/F7P55KJN.
U.S. Geological Survey [USGS], 2025b, StreamStats: U.S. Geological Survey database, accessed 2025 at https://streamstats.usgs.gov/ss/.
Young, J.A., Marentette, J.R., Gross, C., McDonald, J.I., Verma, A., Marsh-Rollo, S.E., Macdonald, P.D., Earn, D.J., and Balshine, S., 2010, Demography and substrate affinity of the round goby (Neogobius melanostomus) in Hamilton Harbour: Journal of Great Lakes Research, v. 36, no. 1, p. 115–122, accessed 2025 at https://abel.mcmaster.ca/publications/pdfs/Young%20et%20al%202010%20JGLR.pdf.
Datums
Horizontal coordinate information is referenced to the North American Datum of 1983 (NAD 83).
Vertical coordinate information is referenced to the North American Vertical Datum of 1988 (NAVD 88).
Supplemental Information
Concentrations of chemical constituents in fish tissue are given in either micrograms per gram (µg/g) or nanograms per gram (ng/g) wet weight.
A water year is the 12-month period from October 1 through September 30 of the following year and is designated by the calendar year in which it ends.
Abbreviations
DDT
dichlorodiphenyltrichloroethane
OCP
organochlorine pesticide
PCB
polychlorinated biphenyl
PFAS
per- and polyfluoroalkyl substances
PFOS
perfluorooctanesulfonic acid
PSD
proportional size distribution
NYSDEC
New York State Department of Environmental Conservation
NYSDOH
New York State Department of Health
USGS
U.S. Geological Survey
Director, New York Water Science Center
U.S. Geological Survey
425 Jordan Road
Troy, NY 12180–8349
or visit our website at
https://www.usgs.gov/centers/ny-water
Publishing support provided by the U.S. Geological Survey, Science Publishing Network, Pembroke and Moffett Publishing Service Centers.
Disclaimers
Any use of trade, firm, or product names is for descriptive purposes only and does not imply endorsement by the U.S. Government.
Although this information product, for the most part, is in the public domain, it also may contain copyrighted materials as noted in the text. Permission to reproduce copyrighted items must be secured from the copyright owner.
Suggested Citation
George, S.D., Sadekoski, T.R., Darling, M.J., Baldigo, B.P., Wells, S.M., Erway, D.B., Conine, A.L., Becker, J.C., and Dieterle, K.J., 2026, Investigation of fish communities in natural channel sections of the Mohawk River, New York: U.S. Geological Survey Scientific Investigations Report 2026–5131, 20 p., https://doi.org/10.3133/sir20265131.
ISSN: 2328-0328 (online)
Study Area
| Publication type | Report |
|---|---|
| Publication Subtype | USGS Numbered Series |
| Title | Investigation of fish communities in natural channel sections of the Mohawk River, New York |
| Series title | Scientific Investigations Report |
| Series number | 2026-5131 |
| DOI | 10.3133/sir20265131 |
| Publication Date | March 19, 2026 |
| Year Published | 2026 |
| Language | English |
| Publisher | U.S. Geological Survey |
| Publisher location | Reston, VA |
| Contributing office(s) | New York Water Science Center |
| Description | Report: ix, 20 p.; Data Release |
| Country | United States |
| State | New York |
| Other Geospatial | Mohawk River |
| Online Only (Y/N) | Y |