

Hydrologic Investigation of Water Level Fluctuations at Moreau Lake, Moreau Lake State Park, Town of Moreau, New York
Links
- Document: Report (36.8 MB pdf) , HTML , XML
- Data Releases:
- USGS data release - Geospatial data from the Moreau Lake area, town of Moreau, N.Y.
- USGS data release - Hydrologic data from the Moreau Lake area, town of Moreau, N.Y.
- USGS data release - Horizontal-to-vertical spectral ratio (HVSR) soundings and depth-to-bedrock data for the Moreau Lake area, town of Moreau, N.Y.
- NGMDB Index Page: National Geologic Map Database Index Page (html)
- Download citation as: RIS | Dublin Core
Acknowledgments
Thanks are extended to Casey Holzworth of the New York State Department of Parks, Recreation and Historic Preservation for his efforts in facilitating the study; Peter Iskenderian, park manager, during much of the study, for his enthusiastic support of all aspects of work in the park; and Gary Hill, park naturalist, for sharing his local knowledge and observations of seasonal conditions in the park. Thomas Field provided data from his former fish hatchery and permitted access to wells, springs, and land that proved invaluable for understanding the groundwater flow system. The late Harvey Wolfers provided a copy of the 1969 Rist-Frost Associates consultant report, which he authored, and shared his recollections with the author. Thanks are extended to all the homeowners and businesses and the Saratoga Water Authority for access to wells that were critical to developing an understanding of the local hydrogeology.
The author also wishes to acknowledge the efforts of U.S. Geological Survey volunteer (and later, colleague) Bradley Sporleder in verifying well locations in the office and helping with seismic surveys, water level measurements, and any other fieldwork. Travis Smith and Kenneth McGrath are also acknowledged for surveying measuring points of wells, ponds, and lake water levels.
Abstract
The causes of water level fluctuations at Moreau Lake, within Moreau Lake State Park in the town of Moreau, New York, were investigated from 2016 to 2021 after lake water levels dropped between 2015 and 2016, raising concerns about the loss of a shallow swimming area at the park beach. Annual variation in precipitation records from the area did not account for the lake water level decline. Two possible causes for the low lake water levels were investigated: the increase in groundwater withdrawals from new residential development since about 2000 and seasonal changes (nongrowing and growing seasons) in precipitation.
Investigation of the potential effects of nearby groundwater withdrawals required the compilation and collection of well-log data, seismic surveys, and measurements of lake and groundwater levels, field chemical parameters, and water isotopes to define the hydrogeologic system and to estimate water use. The net result of this work was the determination that Moreau Lake is a “flow though” lake with no surface water outlet; groundwater enters the lake on the upgradient side and exits through the downgradient side, however, groundwater does not flow southward from the lake toward nearby groundwater withdrawals from the semiconfined aquifer, and thus groundwater withdrawals were unlikely to have an effect on lake water levels.
Investigation of the historic precipitation records during nongrowing (November through April) and growing (May through October) indicated that (1) nongrowing season precipitation from 2011–12 to 2015–16 was more deficient than any similar period during the past 78 years and (2) since about 2000, nongrowing seasons have been drier overall and growing seasons have been considerably wetter. Initiation of lake water level monitoring in 2016 provided an opportunity to compare seasonal precipitation with seasonal lake water level changes. Nongrowing season lake water levels are very sensitive to precipitation, such that high precipitation (40 percent above the seasonal median) resulted in a 5-foot rise in lake water level. In contrast, the growing season lake water levels are sensitive to dry conditions; for example, deficient rainfall (about 6 percent below the seasonal median) resulted in a decline of lake water levels of about 3.5 feet. However, lake water levels are insensitive to high growing season rainfall inputs (about 10 to 47 percent above the seasonal median); lake water levels consistently declined about by 0.8 feet within this range of seasonal excessive precipitation.
Introduction
Moreau Lake is the centerpiece of the 6,250-acre Moreau Lake State Park, within the towns of Moreau, Corinth, and Wilton in northern Saratoga County as well as the towns of Lake Luzerne and Queensbury in southern Warren County, New York. The park is a popular destination because it is easily accessible from Interstate 87 and offers a lake for boating and fishing, a beach area for swimming and sunbathing, 41 miles (mi) of hiking trails, a campground, rental cottages, and a nature center (New York State Office of Parks, Recreation and Historic Preservation, 2006; Friends of Moreau Lake State Park, Inc., 2023). The main lake has a maximum depth of about 50 feet (ft), has shallow embayments to the east and west, and is connected to a pond immediately to the north (northern embayment; fig. 1).
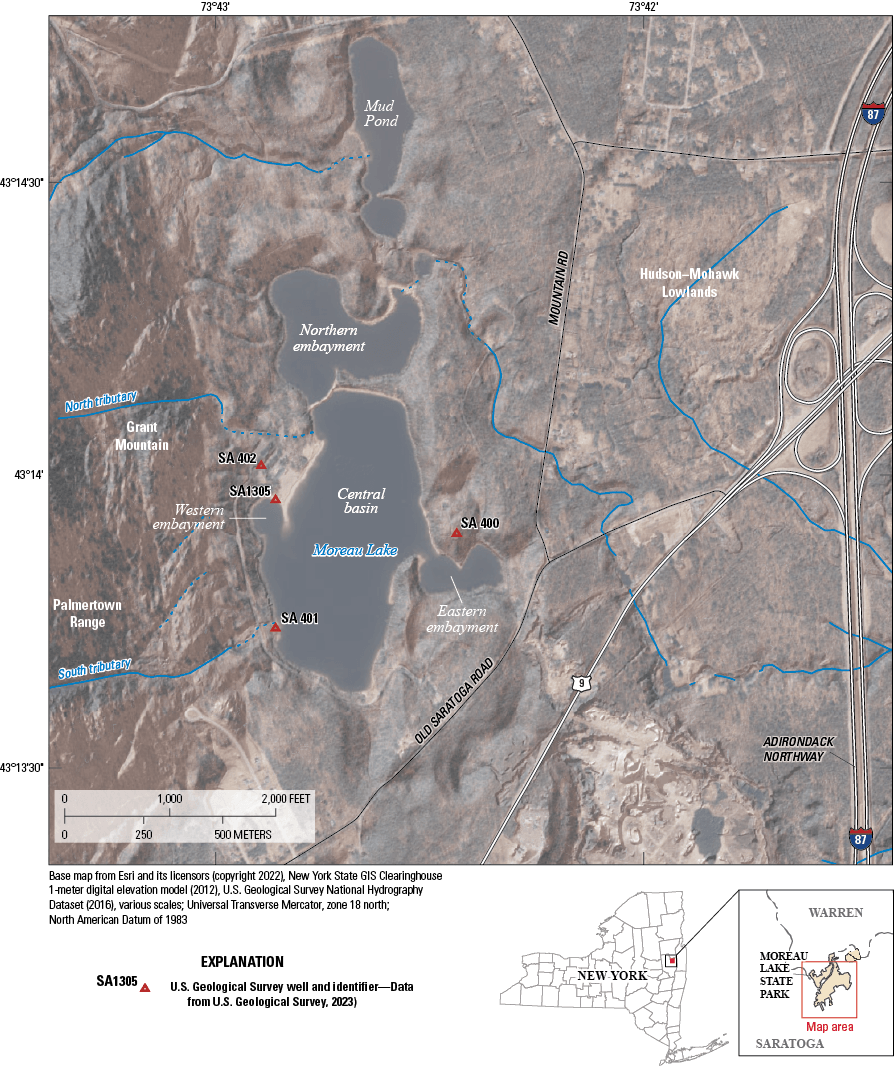
Map showing Moreau Lake and vicinity, including streams and U.S. Geological Survey wells, in the town of Moreau, New York.
During 2015, a lake water level drop of approximately 4 to 5 ft was noted by State park officials. This drop compressed the shallow swimming area at the beach, causing concern about what was happening at the lake. A preliminary look at the annual precipitation record (Northeast Regional Climate Center, 2021) at the Floyd Bennett Memorial Airport (formerly Warren County Airport) at Glens Falls (9 mi northeast of the lake) during the 1960s drought of record and 2010–15 indicated that 2010–15 was much wetter, except for 2015 (fig. 2). The conditions causing low lake water levels in 2015 were thus different in some respect to those during the 1960s.
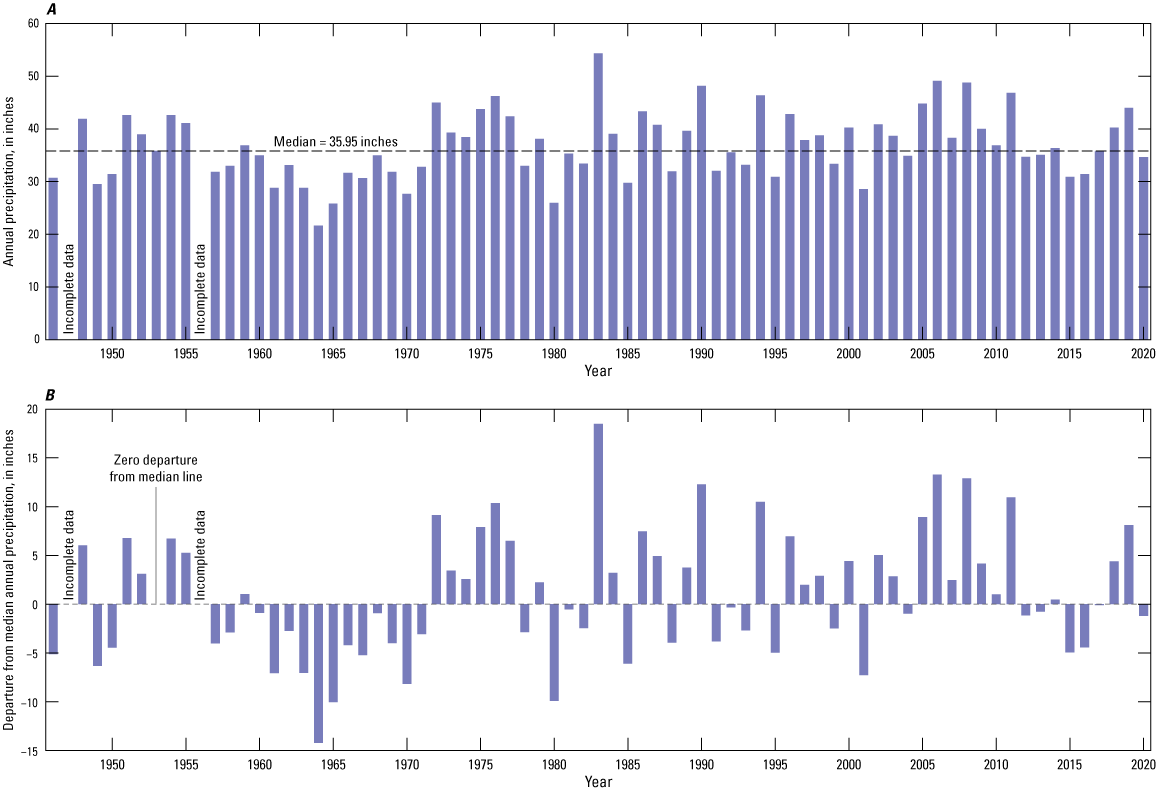
Graphs showing period-of-record precipitation data (1944–2021, excluding 1947 and 1956 when data were incomplete) from the Floyd Bennett Memorial Airport (formerly Warren County Airport) weather station in Glens Falls, New York: A, total annual precipitation, in inches, B, departure of annual precipitation, in inches, from the median annual precipitation (35.95 inches). Precipitation data are from Northeast Regional Climate Center (2021).
One hydrologic change since about 2000 has been the drilling of individual domestic wells (New York State Department of Environmental Conservation, 2022) for widespread residential development to the north-northeast and south-southeast of the park. Many of these wells draw water from a confined sand and gravel aquifer that was previously inferred to be hydraulically connected to Moreau Lake (Rist-Frost Associates, 1969, app. F). If this inference was correct, withdrawals from these wells might have an increasing negative effect on lake water levels over time.
Discussions between the New York State Department of Parks, Recreation and Historic Preservation and the U.S. Geological Survey (USGS) resulted in the initiation of a project in mid-2016 to quantify what was happening at the lake and to determine the cause of low lake water levels. Two overarching questions resulted from these discussions and guided the study:
-
Question 1—Do increased groundwater withdrawals since 2000 contribute to observed lake water level fluctuations?
-
Question 2—Do seasonal variations in precipitation account for observed lake-level fluctuations?
Previous Work
A comparison of historic Moreau Lake water levels among USGS topographic maps shows a 10-ft variation. The 1:62,500 Schuylerville quadrangle map (U.S. Geological Survey, 1900), surveyed in 1898, indicated a lake water level of 341 ft above mean sea level and that all the adjacent embayments and ponds east and north of the lake held water (fig. 1). The 1:24,000 Gansevoort quadrangle map (U.S. Geological Survey, 1968), surveyed in 1964, indicated a lake water level of 331 ft above mean sea level, and all adjacent embayments and ponds are mapped as wetlands.
During the 1960s drought, which was the longest, driest period on record in the northeastern United States (Barksdale, 1968; Cook and Jacoby, 1977; Pederson and others, 2013), lake water levels at Moreau Lake dropped substantially, which prompted the Capital District State Park Commission of New York State to fund a study of lake water levels and possible remediation options by a local engineering consultant. A variety of data were collected from July 1968 through July 1969 (Rist-Frost Associates, 1969). That study included six subtasks, documented in appendixes: a seismic-refraction study, a water balance study, dye studies and temperature profiles, a ground-magnetic study, water surveillance charts, and a geologic report.
The surficial geology of the lake and surrounding area was mapped by Cadwell and Dineen (1980–88) and reproduced in Heisig (1994, pl. 1). Moreau Lake occupies a kettle (depression), the largest of several within a kame terrace. Numerous hydrogeologic studies of kettle lakes in eastern mainland Massachusetts and on Cape Cod have documented the hydrogeologic framework, groundwater flow systems, and useful techniques for tracing kettle lake water movement into local groundwater flow systems (Colman and Friesz, 2001; Friesz and Church, 2001).
Study Approach
The study was initiated in mid-2016 to collect hydrologic and hydrogeologic data in the park and surrounding area and to document seasonal and annual fluctuations in lake water and groundwater levels. The data collected from 2016 to 2021, combined with precipitation and groundwater use estimates, provided a sound basis for understanding the factors controlling lake water levels. The following tasks were undertaken:
-
• establish a lake monitoring site and monitor Moreau Lake water level elevation,
-
• compile well-log data from the surrounding area,
-
• establish a network of local observation wells to monitor groundwater level elevations from surveyed measuring points,
-
• measure water field parameters (temperature, pH, specific conductance, dissolved oxygen) and stable isotopes of water at selected lake sites and wells,
-
• conduct horizontal-to-vertical spectral ratio (HVSR) seismic soundings to estimate depth to bedrock,
-
• assemble subsurface data in a geographic information system (GIS) to enable development of hydrogeologic cross sections and a conceptual model of the local hydrogeologic framework and groundwater flow system,
-
• analyze historic precipitation data and recent precipitation and lake water level data collected during the study,
-
• develop a general water budget, including estimation of groundwater withdrawals,
-
• use groundwater level data and basic groundwater tracers to constrain where lake water moves once it enters the groundwater system, and
-
• compile HVSR, geospatial, and hydrologic data for publication as data releases (Heisig, 2026a, b; Heisig and Sporleder, 2026).
Methods
Surrogate Measurement of Lake Water Levels at Well SA1305
Measurement of lake water levels was the single most important data objective of the study. The few fixed structures around the lake were in shallow water, and a monitoring station affixed to them would be in danger of going dry, given the continuing decline of lake water levels in late spring 2016. Another concern was that shifting lake ice could damage such a station. Instead, installation of a shallow monitoring well completed in sand and gravel adjacent to the lake was proposed as a surrogate measurement site for lake water levels. A shoreline site on the western side of the lake near the Park Nature Center was selected, and a 15-ft deep, 4-inch (in.) diameter well with a 10 ft screen from 5 to 15 ft below land surface was installed in late spring 2016 (figs. 1 and 3A). Designated by the USGS as well SA1305 (site 431357073425301), the well was instrumented with a pressure transducer for water level measurement and with satellite telemetry for near real-time data upload to the National Water Information System (NWIS; U.S. Geological Survey, 2023b).
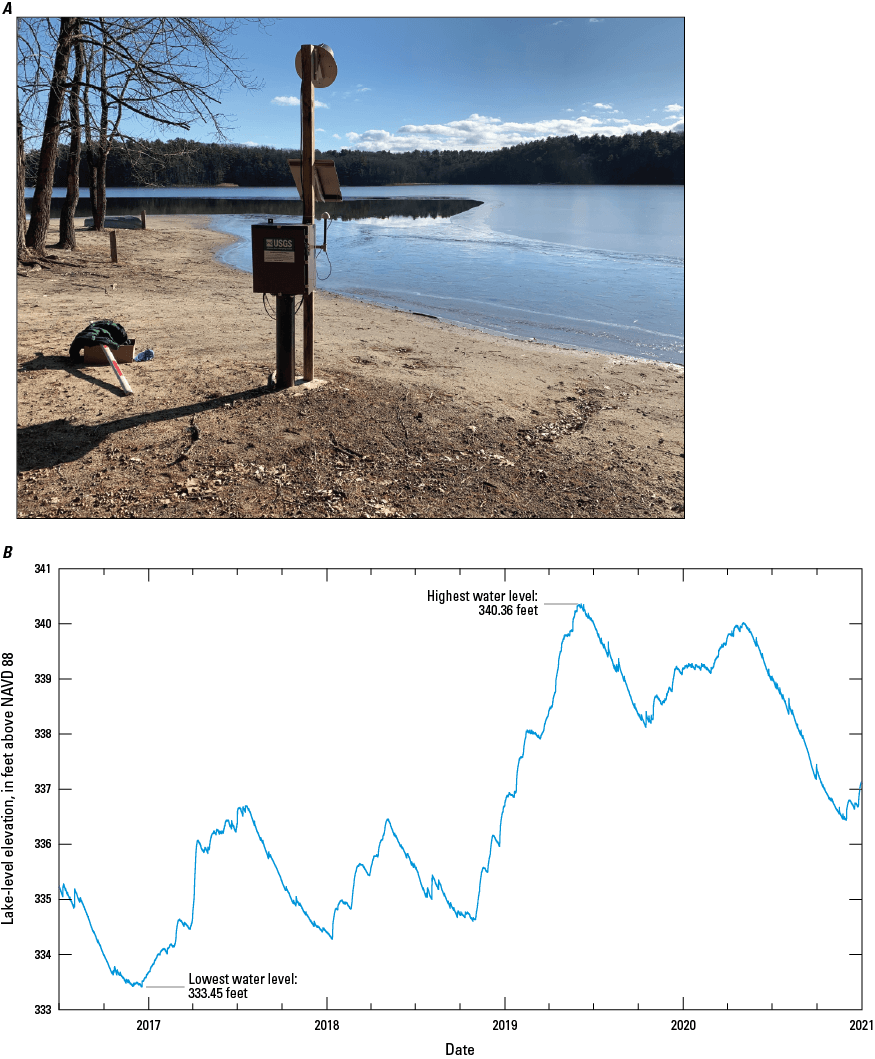
Water level monitoring adjacent to Moreau Lake in Moreau Lake State Park in the town of Moreau, New York. A, Photograph showing U.S. Geological Survey monitoring well SA1305, which measures shallow groundwater levels adjacent to the lake, installed in spring 2016 at a depth of 15 feet; B, graph showing elevation of lake water levels from 2016 to 2020 as measured at the well. Data are from U.S. Geological Survey (2023b). Photograph by Paul Heisig, U.S. Geological Survey.
Data collection began in July 2016. The record of water levels is shown in figure 3B. To evaluate how representative the groundwater levels at well SA1305 are of Moreau Lake water levels, a reference point in the lake was surveyed, and 10 comparison measurements were periodically made by the USGS between spring 2019 and spring 2020, along with measurements at nearby wells. Lake water levels were directly measured with a transducer from May 16 to November 6, 2019, for detailed comparison with transducer data from nearby wells SA1305 and SA 402 (fig. 1).
Seventeen discrete measurements of lake water levels show close agreement with the corresponding groundwater levels at well SA1305, with a few exceptions (fig. 4). Groundwater levels are typically slightly higher than lake water levels because well SA1305 is on the western side of the lake, adjacent to the mountainside and upgradient from the lake within the groundwater flow system, which is discussed in the “Lake Water Levels, Groundwater Levels, and Groundwater Flow” section of this report. The median difference between groundwater level and lake water level is +0.07 ft. The smallest water level differences, and even negative ones, were observed within a month or two of the onset of water level declines during the growing season (which typically coincides with warm weather). The largest differences (+0.65, +0.31, and +0.24 ft) were all in spring 2017 when groundwater and lake water level rose in response to direct rainfall and snowmelt enhanced by runoff and groundwater contributions from the mountainside. The largest difference lasted briefly during a period of steep water level rise and likely represented a lag in lake water level response to higher adjacent groundwater levels. Groundwater levels can rise more quickly than lake water levels because the fillable porosity of sand is about 30 percent, whereas the air above the lake surface is 100 percent porous. This means that the addition of the same amount of water to the lake and adjacent sandy shoreline can result in about a three times greater initial increase in groundwater levels.
The differences between lake water levels and groundwater levels at well SA1305 are small relative to seasonal water level fluctuations, which indicates that groundwater levels at well SA1305 are, overall, a good estimate of lake water levels, especially when compared with discrete measurements at well SA 401 (fig. 4), a nearby well also adjacent to the lakeshore. Groundwater and lake water level differences are larger at this well during periods of recharge (nongrowing season), as indicated by point measurements and a generalized hydrograph (fig. 4). The disparity between groundwater levels and lake water levels at the two wells is larger at well SA 401 because that area receives additional, focused groundwater recharge from streambed infiltration from the lake’s largest tributary stream (the south tributary; fig. 1), discussed in the “Water Budget Components Within the Moreau Lake Watershed and Comparison With Estimated Water Use” section of this report.
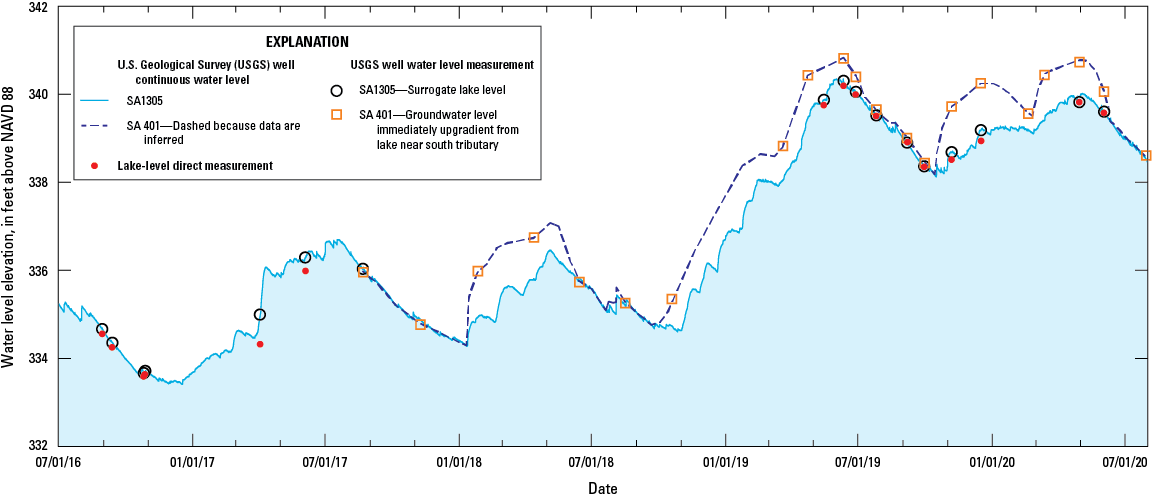
Graph showing comparison of direct measurements of lake water levels with groundwater level measurements at wells SA1305 and SA 401 at and near Moreau Lake in Moreau Lake State Park in the town of Moreau, New York. The wells are adjacent to and upgradient from the lake. Water level data are from Heisig (2026a).
A more detailed look at the water level relation between well SA1305 and Moreau Lake is depicted in figure 5. A water level sensor measured lake water levels directly at the reference point during warm weather (no ice) from May 16 to November 6, 2019. The figure depicts hydrographs from measurements at the lake and well SA1305, which show relatively small departures during much of the record as observed with the discrete water level measurements discussed above. An underlying area plot in figure 5 shows the differences in lake water level from the groundwater level at well SA1305 for the same period. An 11-point moving average was applied to reduce noise in the dataset (Heisig, 2026b). The overall median departure of groundwater level from lake water level is +0.04 ft during this period of predominantly declining water levels. The hydrographs show a pattern similar to the hydrographs in figure 4: the greatest differences are during periods of increasing or peak water levels, and progressively smaller differences, even becoming negative in October, are during seasonal declines in water levels.
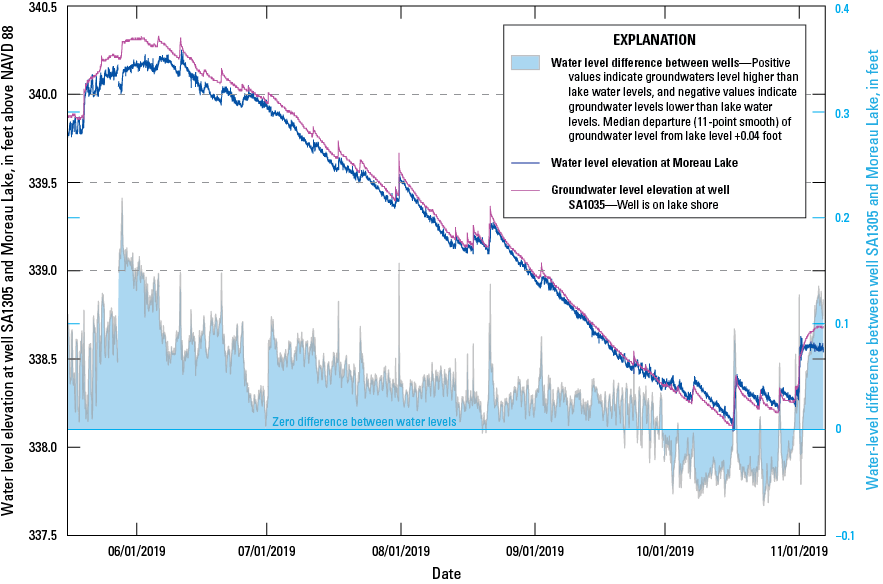
Hydrographs from monitoring well SA1305 and a nearby temporary direct lake water level measurement station at and near Moreau Lake, town of Moreau, New York, from May 16 to November 6, 2019, and a plot of the difference between the two (water level at well SA1305 minus lake water level). Elevation data are from Heisig (2026b).
The pronounced spikes in water level differences after storms are caused by a transient phenomenon known as the Lisse effect (refer to Weeks, 2005 for description), which happens when intense rainfall infiltrates and seals the surface soil layer to airflow so that air is trapped in the unsaturated zone. This effect results in overshoot (an unusually high measured response in pressure) but not actual groundwater level rise (Nimmo and others, 2015; Zang and others, 2017). Thus, the large differences these spikes appear to indicate should be ignored.
Well Data
Well data used in this report are stored in NWIS (U.S. Geological Survey, 2022) and in the geospatial data release (Heisig, 2026a). Sources of data used in this study include well records from the New York State Department of Environmental Conservation, which administers the New York State water well contractor program (New York State Department of Environmental Conservation, 2022), existing data in NWIS, test-boring data from the New York State Department of Transportation (Heisig, 2026b), Rist-Frost Associates (1969), and a master’s thesis (Tice, 1993). Well data from selected wells and test borings are summarized in table 1. All well elevations and elevations in general in this report are referenced to the North American Vertical Datum of 1988 (NAVD88). Land surface elevations at well sites are derived from either a light detection and ranging (lidar) digital elevation model (Federal Emergency Management Agency, 2012) or well measuring-point elevations surveyed by the USGS (Heisig, 2026b).
Table 1.
Data from selected wells near Moreau Lake and town of Moreau, New York.[Data are from Heisig (2026a). ft, foot; in., inch; gal/min, gallon per minute; lidar, light detection and ranging; NAVD88, North American Vertical Datum of 1988; NA, not applicable; ND, no data; ~, about]
HVSR Seismic Survey
An HVSR seismic survey can be used to estimate the thickness of unconsolidated sediment over bedrock (Nakamura, 1989). The HVSR seismic survey method is passive and uses a single three-component (x, y, and z directions) broadband seismometer to record ambient seismic noise. The ratio of the averaged horizontal (x, y) to vertical (z) frequency spectrum is used to determine the fundamental site resonance frequency, which can be interpreted using regression equations to estimate the thickness of the sediment overlying bedrock (Lane and others, 2008).
Two regional regression equations have been developed to estimate the thickness of sediment over bedrock (Heisig and Fleisher, 2022). These equations were derived from a total of 43 control-point measurements from various study areas in upstate New York. The control-point HVSR measurements were made at current or former well sites at which the depth to bedrock was known and unconsolidated sediment had been described in well logs (Heisig and Fleisher, 2022). The selected HVSR records also must show single, well-defined resonance frequency peaks. Estimates of shear wave velocity (VS) from these records were calculated using the following equation:
whereThe calculations of VS for all control sites yielded a wide range in VS values that were divided into two distinct groups: low and high VS, which corresponded to specific sediment types. The low VS group (VS approximately [≈] 700 to 1,135 feet per second [ft/s], with a median VS ≈ 969 ft/s) corresponded to sites with mixed, mostly fine-grained stratified sediments between 50 and 275 ft thick. The high VS group (VS ≈ 1,140 to 1,700 ft/s, with a median VS ≈ 1,435 ft/s) corresponded to three sediment types: (1) predominantly sand or sand and gravel of any thickness, (2) till (limited data), and (3) mixed stratified sediments greater than 275 ft thick that were likely overridden by readvancing ice. The regression equations are power functions, as follows:
whereZ
is the thickness of sediment over bedrock (in feet), and
f
is the measured resonance frequency (in hertz).
Forty-six of the HVSR measurements were usable for bedrock-depth estimates—either a single clear resonance peak or a clear peak with a high frequency small peak or shoulder. Limited bedrock control points (wells with reported depth to bedrock, preferably with a well log) in the area required some assumptions of the subsurface sediment material. The ice-contact deposits at Moreau Lake and to the north and south were assumed to be largely sand over bedrock or sand over till over bedrock, as well as some fine-grained sediments whose thickness was poorly constrained. The high VS equation was used in this area and in the immediately adjacent areas of lacustrine sand surficial deposits. The low VS equation was tried for the remainder of lowland sites to the east, but limited control-point comparisons indicated that using the average of the high VS and low VS estimates provided better estimates.
Isotope Ratios of Oxygen and Hydrogen in Water
Isotope ratios of oxygen and hydrogen in the water molecule can be used as a tracer of groundwater and lake water interaction (Stichler and Moser, 1979; Clark and Fritz, 1997; Dennis LeBlanc, USGS, written comm., 2019). Chemical elements are defined by the number of protons in their nucleus; isotopes of a given element vary in the number of neutrons in the nucleus. Stable isotopes, such as those of hydrogen (protium [1H] and deuterium [2H]) and oxygen (oxygen-16 [16O] and oxygen-18 [18O]), that make up water molecules are not subject to radioactive decay; thus, their relative abundance does not change. The differences in isotope weight, however, result in a degree of partitioning within the hydrologic cycle during condensation, precipitation, and evaporation (Craig, 1961). Water molecules composed of heavier isotopes are preferentially lost from the atmosphere through precipitation and those with lighter isotopes are preferentially lost from surface-water bodies through evaporation.
In humid areas, precipitation that directly infiltrates land surface and joins the groundwater system is not subject to significant evaporation, whereas lakes with sufficient evaporation have a heavier isotopic water signature than groundwater that is derived solely from infiltration of precipitation (refer to, for example, Friesz and Church, 2001; Colman and Friesz, 2001, p. 16, fig. 8). If lake water enriched in heavy oxygen and hydrogen isotopes enters the groundwater system, it can be identified at downgradient wells and springs (Stichler and Moser, 1979). Regional measures of oxygen and hydrogen isotope ratios in precipitation are used to develop a local meteoric water line, which serves as a reference for comparison with surface water and groundwater samples (Clark and Fritz, 1997, p. 51). Samples of water enriched in heavy isotopes by evaporation plot as a lower slope line that diverges from the local meteoric water line (refer to Stichler and Moser, 1979; Clark and Fritz, 1997, p. 43).
Sixteen water samples were selected for isotopic analysis from Moreau Lake and at wells and springs in the area to determine if evaporation at the lake was sufficient to create a discernable signature in downgradient wells and springs. Field measurements (water temperature, pH, specific conductance, and dissolved oxygen) and water samples were collected using field procedures outlined in the National Field Manual for the Collection of Water Quality Data (U.S. Geological Survey, variously dated). Samples were analyzed by the USGS Stable Isotope Laboratory in Reston, Virginia, according to Révész and Coplen (2008a, b). Field measurements and laboratory analytical results are available in Heisig (2026b) and NWIS (U.S. Geological Survey, 2022). The local meteoric water line (Burnett and others, 2004) used in this study was from about 96 mi west-southwest of Moreau Lake in Hamilton, N.Y. (latitude 42.8 degrees [°] N, longitude 75.6° W).
Question 1—Do Increased Groundwater Withdrawals Since 2000 Contribute to Observed Lake Water Level Fluctuations?
Since 2000, 237 wells have been drilled within 2 mi of Moreau Lake (New York State Department of Environmental Conservation, 2022). Groundwater withdrawals by domestic wells from an unconfined aquifer affect groundwater levels only locally because the water table can freely fluctuate and provide water from local aquifer storage (drainable porosity) and because the aquifer water is replenished almost everywhere by direct infiltration of rainfall and snowmelt. Confined aquifers are not replenished directly from above because the overlying confining unit is poorly permeable. Recharge is limited to the edges of the confining unit, but only where more permeable materials are present. When withdrawals are made from this type of aquifer, head or water pressure declines can propagate long distances toward recharge or discharge areas. Thus, if there are confined aquifers around Moreau Lake, that are in hydraulic connection with the lake (and thus the lake serves as a potential recharge source for confined aquifers), and there are significant groundwater withdrawals from the aquifer, then pumping-induced groundwater level declines can potentially induce greater groundwater outflow from Moreau Lake, which could lower lake water levels.
Rist-Frost Associates (1969) provided a conceptual model of the hydrogeologic framework of the Moreau Lake area on the basis of an understanding of the regional glacial history (LaFleur, 1965), seismic and magnetic surveys, observations of hydrologic features, and a few well records. This conceptualization was shown in an east-west geologic cross section that depicts a confining unit separating an upper unconfined aquifer from a lower confined aquifer just east of the lake, but not beneath the lake. However, Rist-Frost Associates (1969, app. F) states that “the ice which melted here may well have readvanced over earlier lake sediments” and that it was conceivable that some spring water east of the lake was derived from mountainside bedrock, passing beneath the lake through coarse-grained sediments to the spring discharge point. If the confining unit extends beneath Moreau Lake, this would imply no hydraulic connection between the lake and the confined aquifer beneath.
The answer to this question required integration of new data for refinement and definition of the hydrogeologic framework, aquifer types and extents, the groundwater flow system (especially flow directions in the Moreau Lake area), and well data, including logs, water levels, locations, aquifers used, and estimates of groundwater withdrawal from aquifers that have the potential to affect lake water levels.
Geologic Background
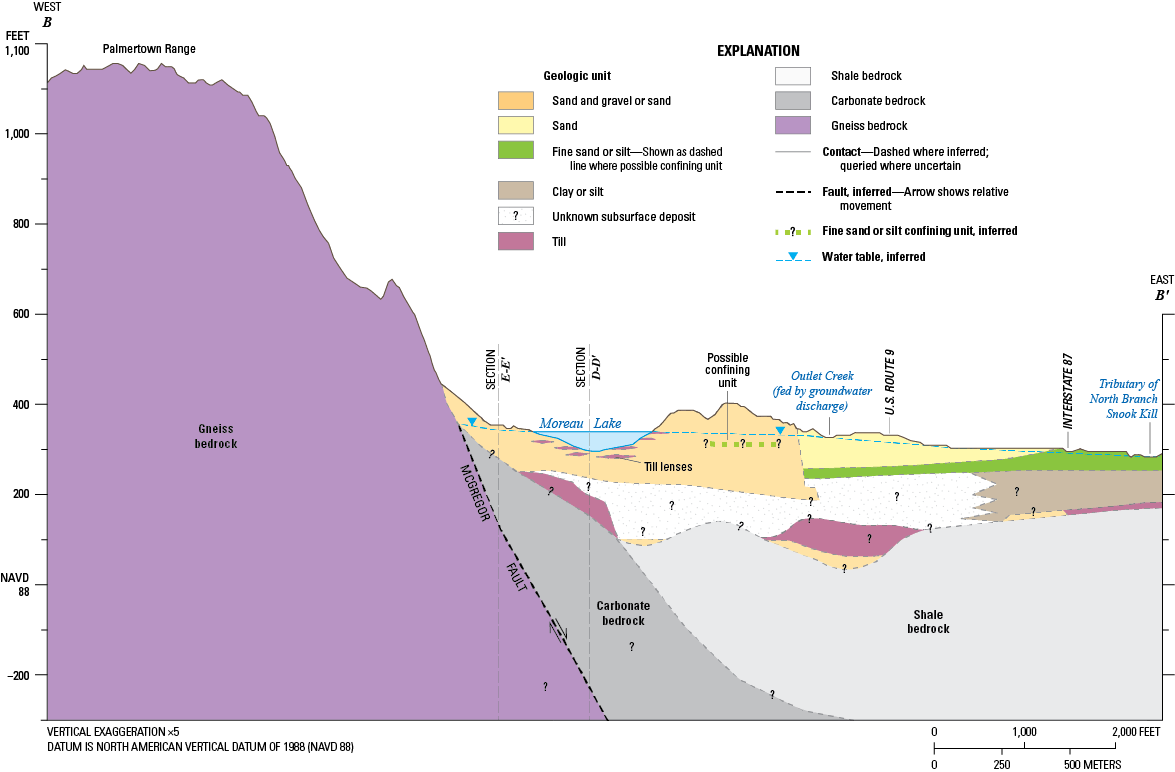
The Moreau Lake area straddles two physiographic provinces: the Adirondack Mountains on the western side and the Hudson-Mohawk lowlands on the eastern side. The Adirondack bedrock of the Palmertown Range (specifically Grant Mountain) consists of resistant, intensely deformed metamorphic rocks (gneisses) of Precambrian (Proterozoic) age (Fisher and others, 1970; Fisher, 1984), which rise as much as 900 ft above the adjacent lowlands. The lowlands are primarily underlain by less resistant shale of late to middle Ordovician age and minor amounts of underlying carbonates, which are exposed at the base of the mountainside immediately southwest of Moreau Lake and in the subsurface about 1.5 mi north of the lake (figs. 6 and 7). The boundary between these two provinces marks the trace of the McGregor fault, a normal fault along which the older, more resistant Adirondack bedrock has moved upward at least 2,070 ft relative to the younger, less resistant shale of the lowlands (Geraghty and Isachsen, 1980; Tice, 1993).
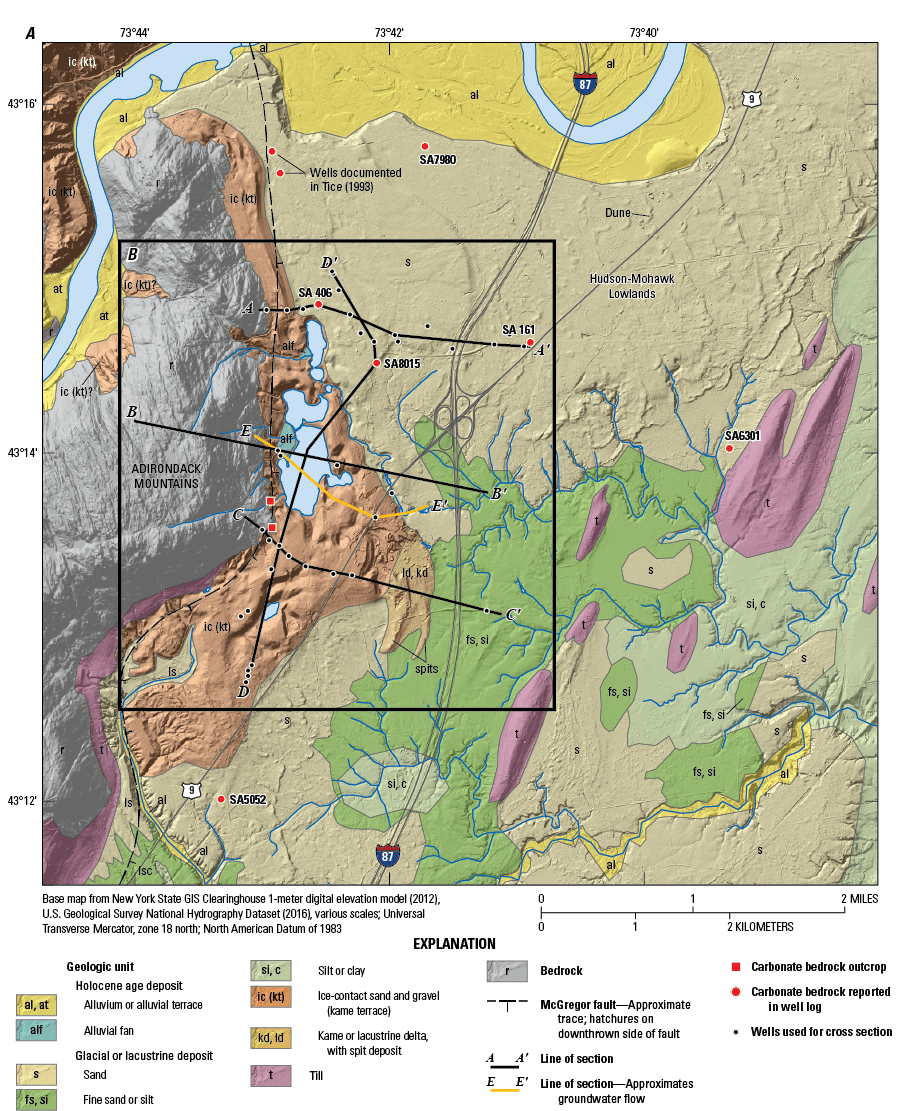
Maps showing surficial deposits and hydrogeologic cross section locations in the Moreau Lake area, town of Moreau, New York. A, Surficial geology of the area and B, detail showing the cross sections and wells used to map cross sections. Data are from Heisig (2026a).
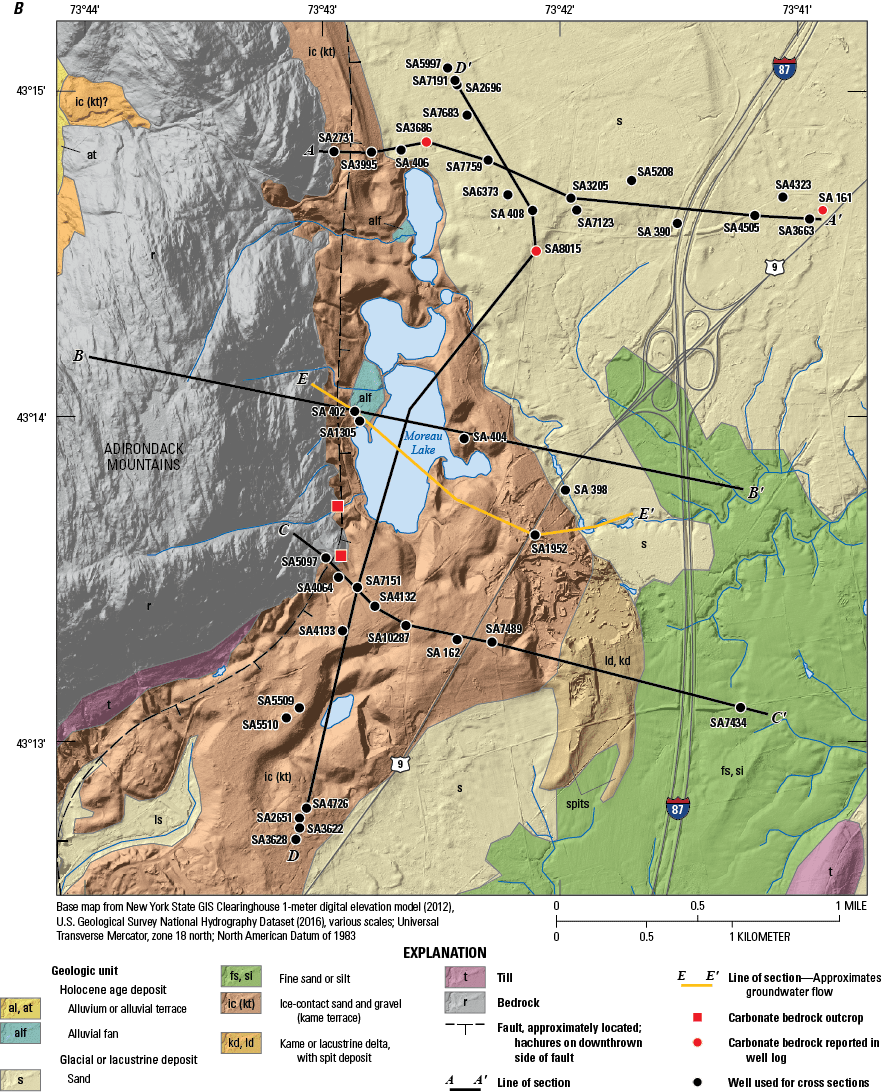
Generalized west-to-east geologic cross section B–B′ showing the Palmertown Range, the McGregor fault, and glacial deposits overlying less resistant bedrock of the Hudson-Mohawk lowlands in the Moreau Lake area, town of Moreau, New York. Refer to figure 6 for the location of the cross section.
Bedrock is at or near land surface over much of the uplands (Palmertown Range) but is blanketed by as much as 380 ft (well SA10287) of unconsolidated deposits in the lowlands. The elevation of the bedrock surface beneath the lowlands in the Moreau Lake area was estimated from well logs and from HVSR seismic measurements (fig. 8). The main feature of the bedrock surface is a 50- to 100-ft deep north-south trough immediately east of Moreau Lake, which is interrupted by some subsurface bedrock highs adjacent to Moreau Lake and thereafter trends southwest and deeper along the mountain front (figs. 7 and 8). The minimum estimated elevations in the trough are less than 50 ft above sea level. East of the trough, bedrock surface elevations are 150 to 200 ft above sea level. The trough is completely buried by unconsolidated deposits (figs. 7 and 8). The depths to bedrock in this interpretation are significantly greater than those interpreted from previous seismic work (Rist-Frost Associates, 1969), but are supported by more recent well-log data.
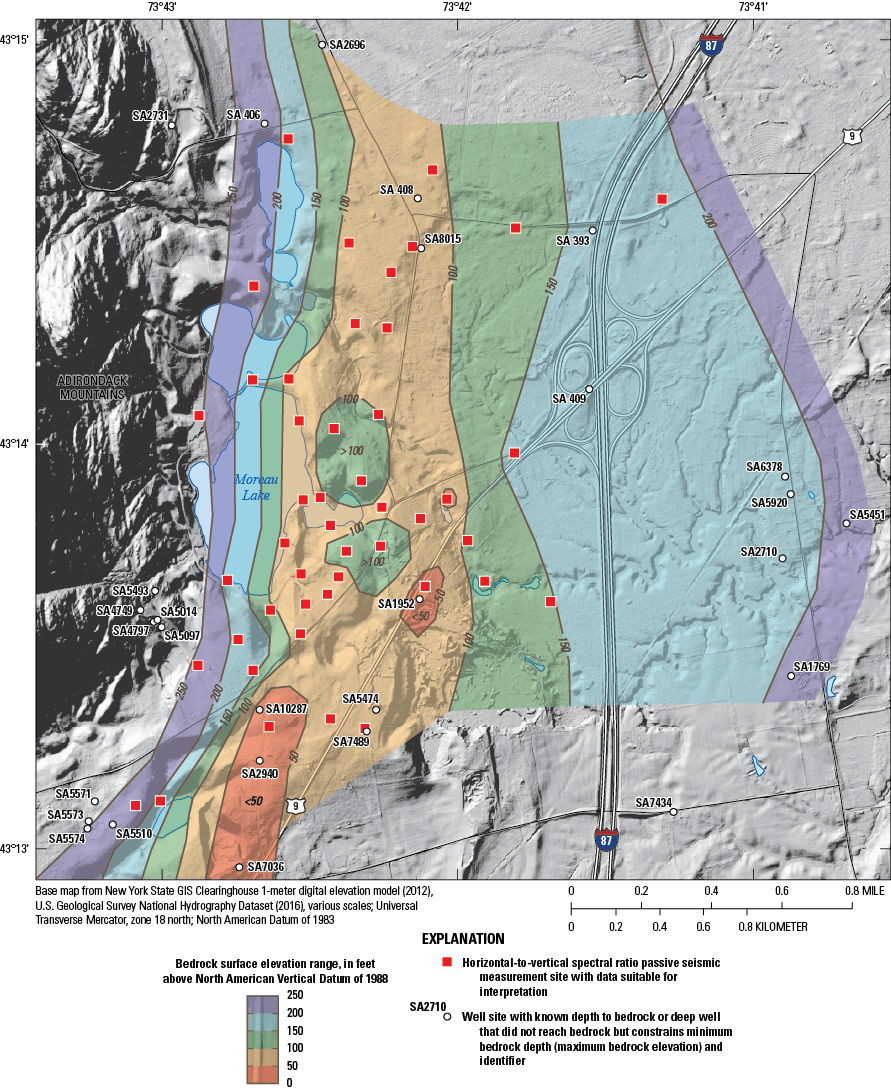
Map showing bedrock surface elevation of the Moreau Lake area, town of Moreau, New York. Data are from Heisig and Sporleder (2026).
Unconsolidated deposits consist of glacial (Pleistocene-age) and recent (Holocene-age) deposits. Glacial deposits make up most of the unconsolidated material and were deposited in the lowlands largely during final northward retreat of the Hudson Valley Lobe of the ice sheet at the end of the ice age (a little younger than 14,800 years ago; Ridge, 2003; 2012). Recent deposits are primarily alluvium deposited in floodplains of the Hudson River and along the courses of the largest streams.
Surficial deposits of the area are depicted in figure 6. Till deposits in the form of drumlins record the direction of ice movement (northeast to southwest), showing the deposition and reshaping of till beneath the ice before ice retreat. The ice-contact sand and gravel deposit along the base of Grant Mountain contains Moreau Lake and numerous other kettle (depression) features in the area, water-filled or not. The landform of this unit is a high (kame) terrace, which was deposited in a gap between the mountainside and the ice tongue in the Hudson valley by outflow from an upgradient glacial lake (fig. 9; Chadwick, 1928; LaFleur, 1965). The meltwater exited farther south into glacial Lake Albany, which was in contact with the retreating ice. Detached blocks of ice in this gap were surrounded and at least partially buried by this sediment. These ice blocks eventually melted, and overlying and adjacent sediment collapsed, leaving depressions. The largest and deepest of these kettles are below the present-day water table, and thus contain lakes. Moreau Lake is the largest of these kettle lakes. This kame terrace feature is referred to as the Moreau Pond terrace by Chadwick (1928) or Moreau Pond kame terrace (LaFleur, 1965).
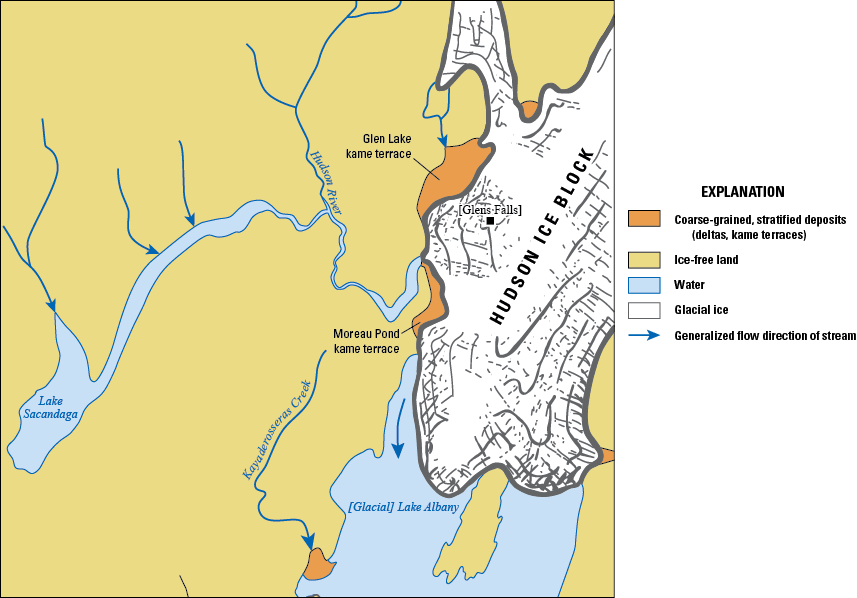
Schematic map showing ice-retreat position in the Hudson Valley at the time of deposition of ice-contact deposits (about 12,600 years ago; refer to Ridge, 2003) in the Moreau Lake area (Moreau Pond kame terrace, on map), town of Moreau, New York; modified from LaFleur (1965).
Continued ice retreat and meltwater discharge through the Hudson River gap at the northern end of Palmertown Mountain widened the gap between the ice and the terrace, which allowed deposition of kame delta or lacustrine deltaic deposits (Chadwick, 1928; Tice, 1993) and two levels of contiguous spit deposits (fig. 6). The high plain (400 to 380 ft elevation) of mostly sand (from well logs) north of Moreau Lake is also attributed to Hudson River discharge into this area, constrained by ice to the east (Chadwick, 1928).
With the continued northward retreat of the ice margin, open-water conditions prevailed in the area from Lake Albany I at about 420 ft elevation at Milton Delta (LaFleur, 1965) through Lake Albany II at about 350 to 360 ft elevation (DeSimone and LaFleur, 1985). Fine-grained lacustrine sediments (clay, silt, and fine sand) were deposited in the deep waters of the lakes, and fine to medium sand, in shallow areas (fig. 6).
Holocene-age deposits are primarily floodplain alluvium and alluvial terraces in the Hudson River floodplain (perhaps 10 to 20 ft thick) and less along the courses of the larger streams in the area. Since the glacial lakes drained, lacustrine sand deposits have also been subsequently partially reworked into dune fields in some areas of the lake plain (not mapped, but visible in fig. 6).
Hydrogeologic Framework
Well logs from the area provide information in the third dimension that is critical for delineation of the subsurface hydrogeologic framework and how it relates to Moreau Lake. However, many well logs in the area only specify a general sequence of deposits in the overburden and do not give specific depths where changes in sediment type occur. The limited number of well logs that do detail the sediment types and their depth intervals were used with the less descriptive logs to infer the framework in three cross sections—two west-east cross sections north and south of the lake and a north-south cross section that includes Moreau Lake (fig. 6). The cross sections focus on sediment descriptions because the deposits change with depth and because sand is a primary component beneath the two most important surficial units—lacustrine sand and ice-contact sand and gravel. The key difference in subsurface material is whether it is fine-grained or coarse-grained. Saturated sand and gravel generally constitute aquifer materials and fine-grained deposits may act as confining units, which impede groundwater movement. Surficial deposits from figure 6 are listed above the cross sections for reference.
The surficial material of the northern west-east cross section A–A′ is largely lacustrine sand with a narrow strip of ice-contact sand and gravel at the base of the bedrock mountainside at the western end (fig. 10). Well logs indicate that the sand is 80 to 126 ft thick and underlain by lacustrine fine sand, silt, and clay that is at least 152 ft thick over the bedrock trough and thins to about 80 to 100 ft along the edges of the trough. The elevation of the top of the fine-grained deposits is 270 to 300 ft. The log of a single deep well log north of the section (well SA2696; fig. 8) indicates sand and gravel beneath at least some of the fine-grained deposits.
West-to-east hydrogeologic cross section A–A′, through Moreau Lake near the town of Moreau, New York. Refer to figure 6 for the location of the cross section. Data are from Heisig (2026a, b).
The surficial material shown in the southern west-east cross section C–C′ includes a wide band of ice-contact sand and gravel eastward from the base of the mountain that transitions first to lacustrine delta sands and then to lacustrine fine sand and silt (fig. 11). Depth to bedrock is greatest beneath the ice-contact deposits and shallows to the east. The sediments beneath the mapped ice-contact area are varied but mostly sand: the logs for two wells (SA4132 and SA7489) indicate 40 to 50 ft of gravel over 40 to 60 ft of sand. Beneath that, about 50 ft of fine sand, silt, and clay is underlain by an unknown thickness of sand. The fine-grained units are not continuous; two other well logs indicate 290 ft of sand (well SA 162) and 101 ft of mostly medium to coarse sand with fine sand and silt layers between 30 and 39 ft (well SA4064), and a third well log indicates 380 ft thickness of sand and boulders over till (well SA10287).
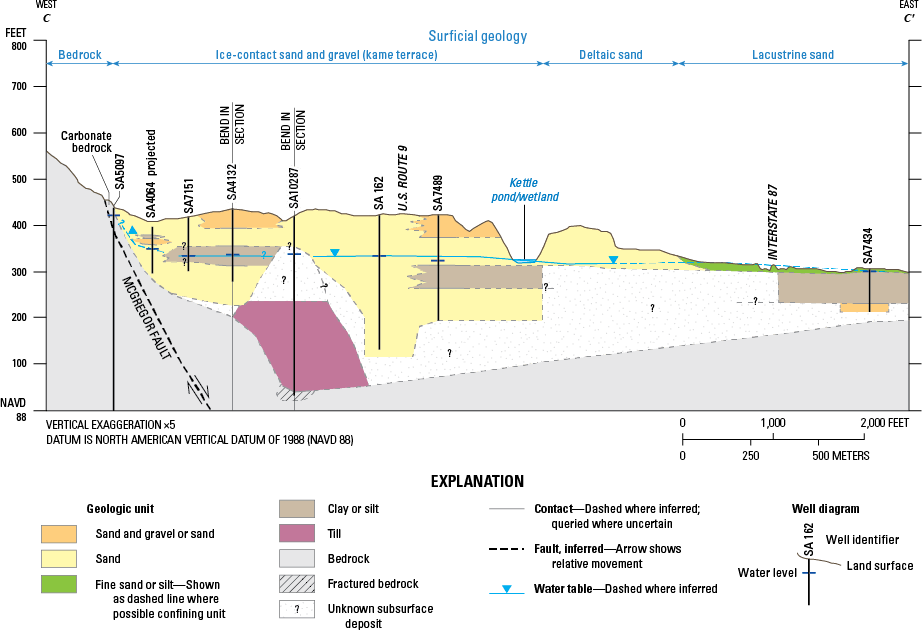
West-to-east hydrogeologic cross section C–C′, immediately south of Moreau Lake, town of Moreau, New York. Refer to figure 6 for the location of the cross section. Data are from Heisig (2026a, b).
The tops of the fine-grained units are at different elevations. West of the till, elevations are about 345 to 350 ft, whereas east of the till, the elevation is about 310 ft. The depth at which the till was penetrated is not noted in the well log, but higher elevation of fine-grained deposits to the west might be explained as local impoundments in part dammed by till—if so, the till would need to be thick, as outlined by the inferred contact in figure 11. Eastward in the cross section, the lacustrine delta deposit includes a well-sorted sand of unknown thickness. The lacustrine fine sand and silt surficial deposit is very thin and overlies 75 ft of clay at well SA7434, which overlies sand and gravel of unknown thickness.
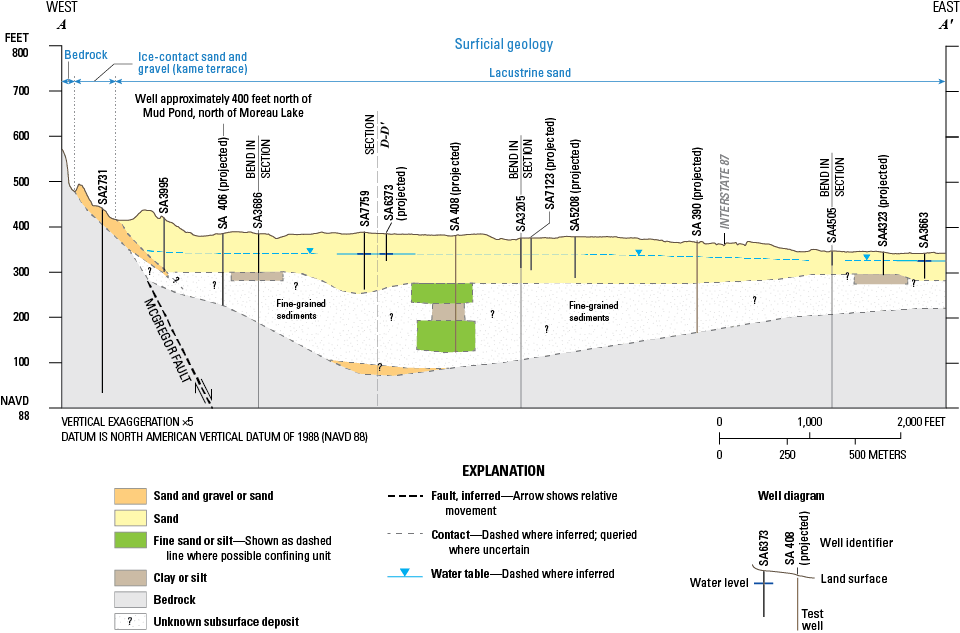
The third cross section (D–D′) is oriented south to north across Moreau Lake and extends about 1 mi in each direction from the lake (fig. 12). Two-thirds of the cross section is within the ice-contact (kame terrace) feature and one-third is within the lacustrine plain to the north of the lake. Subsurface differences between the areas are evident. To the north, fine-grained sediments constitute a thick confining unit that is likely continuous. To the south, confining units are thinner and discontinuous, causing only local confinement, and masses of till on bedrock are more common. Beneath the lacustrine sand, as far south as well SA 408, there is about 110 ft of sand overlying about 150 ft of fine sand and silt or silt and clay. The top of the fine-grained sediments is at about 270 to 275 ft in elevation. The log for well SA2696 indicates some sand and gravel beneath the fine-grained sediments. South of well SA 408, there is an abrupt change—the well log at well SA8015 indicates 190 ft of sand, but no obvious fine-grained sediment, overlying 80 ft of till over bedrock. Perhaps this is the subsurface transition to the ice-contact deposits. There is no subsurface geologic information for the remaining distance to Moreau Lake where the surficial deposits transition to ice-contact deposits.
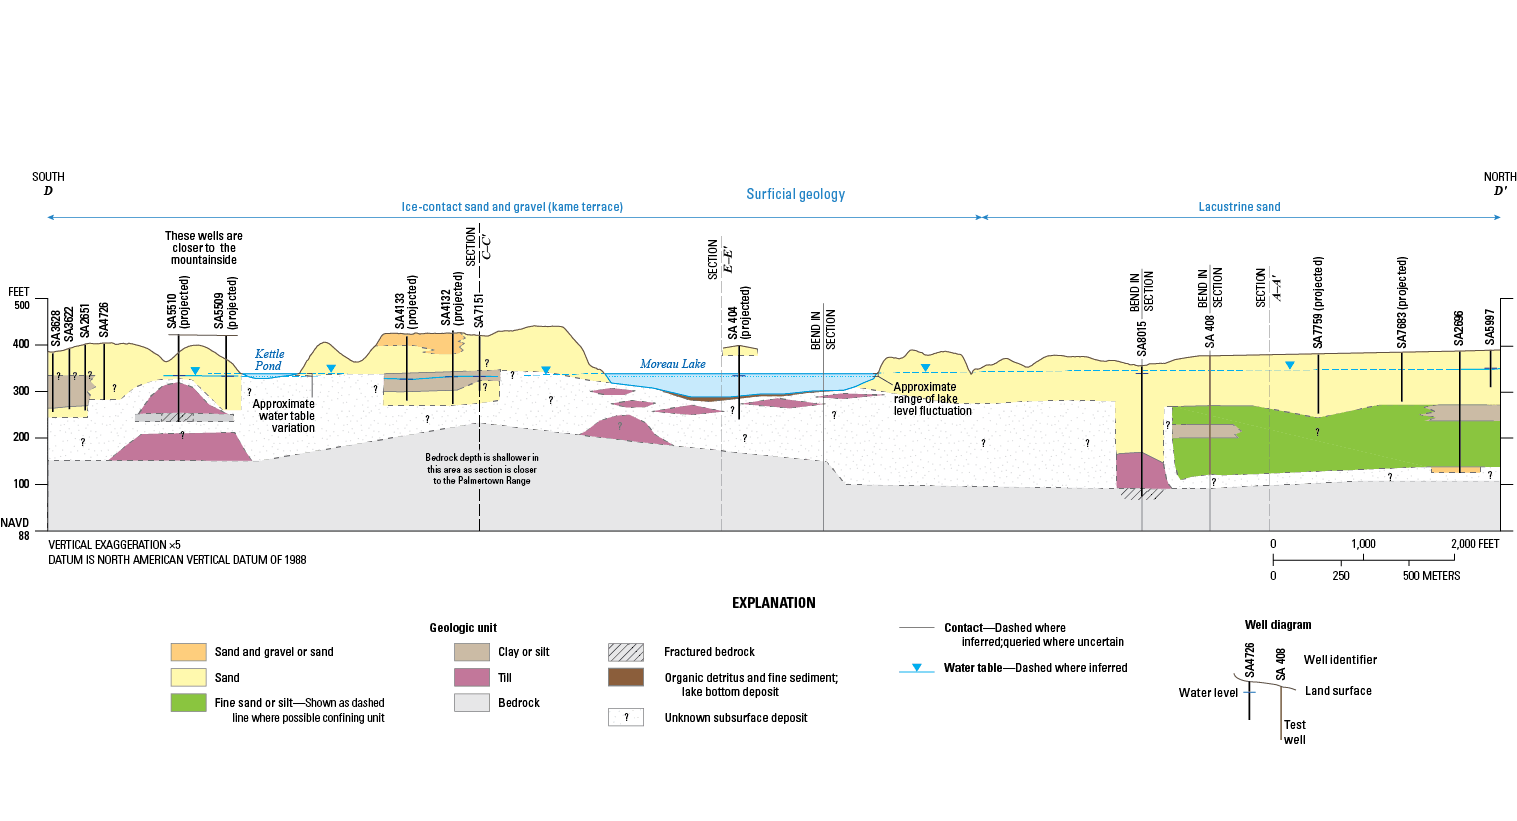
South-to-north hydrogeologic cross section D–D′, which passes through Moreau Lake, town of Moreau, New York. Refer to figure 6 for the location of the cross section. Data are from Heisig (2026a, b).
Beneath the ice-contact surficial deposits south of Moreau Lake, the subsurface is characterized by (1) apparently discontinuous and thin (approximately 50 ft) fine-grained units (top-of-unit elevation 345 to 350 ft), (2) areas of till beneath the sand, and (3) instances of thick sand over sand and gravel. In effect, there is not a consistent fine-grained unit (confining unit) above the deep sand or sand and gravel deposits, and the basal sand and gravel unit is generally absent at depth where till is present atop the bedrock surface.
The silt and clay unit just south of Moreau Lake (figs. 11 and 12) is about 50 ft thick with an upper surface elevation of about 350 ft. The known range of lake water level elevations at Moreau Lake is about 331 to 341 ft, so the bottom of the confining unit may extend 30 to 40 ft below the surface of the lake, which has a maximum depth of about 50 ft. This might indicate that subsurface outflow of lake water to the south is largely blocked by this fine-grained confining unit. It also implies thin saturated sand above the confining unit because it is above lake water level and because the thick unsaturated zone (about 80 ft) does not allow for rapid recharge to the water table. A thin, unproductive saturated zone above the confining unit is also indicated by well completions in the area—all wells draw from saturated sand or sand and gravel beneath the confining unit, rather than from above it. The confining unit does not appear to extend completely to the lake because there are no exposures of fine-grained material and no springs are evident on the slopes along the south side of the lake. There likely is a layer of collapsed sediment (stratified and glacial till) around and beneath the lake resulting from melt-out of the ice block that occupied the area. The confining unit, if present, is also not thick enough to completely underlie the lake. Historic seismic data from Rist-Frost Associates (1969) indicate till at the southern end of the lake as well; because the confining unit does not completely underlie the lake, the till would likely inhibit or block the southward outflow of lake water into the aquifer.
The sediments beneath and immediately adjacent to Moreau Lake (at and below the lake water level) are poorly defined because there are few wells in the park and there are no well logs for them. However, inferences can be made, given the environment in which Moreau Lake developed and from other data sources.
As the Moreau Lake ice block melted, sediments within and atop the ice melted out, leaving a residue of unsorted sediments (flow or ablation till) and possibly some stratified sediments in the depression left by the ice block. Till may have been deposited beneath the ice block before the melt out, resulting in a discontinuous unsorted mixture of dense sediments beneath and around Moreau Lake. Seismic-refraction measurements (from 1969) along much of the southern and all the eastern shores of the lake show seismic velocities (7,000 to 10,000 ft/s) for the material above bedrock that are indicative of till (Rist-Frost Associates, 1969, app. 1, fig. 1.4). In the present study, a shallow wellpoint could not be installed on the central-eastern shore of the lake because a dense till-like material was reached within 2 ft of land surface at the shoreline.
The seismic data and interpretations from Rist-Frost Associates (1969) for the Moreau Lake study area, however, differed from the HVSR seismic measurements from this study (fig. 8; Heisig and Sporleder, 2026) and recent well logs that define the bedrock surface outside the immediate lake area as deeper and till less pervasive along parts of the southern and eastern parts of the lake. If the presence of thick till is correct, this would limit groundwater flow in those directions. However, groundwater temperature and water isotope data (discussed in the “Movement of Water From Moreau Lake in the Local Groundwater Flow System” section of this report) from nearby wells immediately east (well SA 400) and southeast (well SA 404) clearly show lake-derived groundwater flowing in those directions.
Evidence for permeable material on the eastern side of Moreau Lake is particularly strong at well SA 404, an unused downgradient well (161 ft deep) on a knoll about 60 ft above the lake (fig. 12) that has about 100 ft of water in the casing below lake water level. Water temperature profiles in this well are nearly 10 degrees Fahrenheit (°F) warmer than that of well SA 402, a bedrock well on the western (upgradient) side of the lake, which indicates that lake water is moving eastward past the entire 100-ft saturated length of well SA 404 (Heisig, 2026b). If there was a confining unit at this location, one might expect to see discontinuities in temperature profiles within the casing, which were not observed. In summary, at the very least, low permeability till exists as discontinuous shallow lenses and deeper mounds on bedrock in the area beneath and around Moreau Lake, as depicted in figure 12, but with considerable uncertainty.
Aquifers
Aquifers in the lowland area around Moreau Lake include unconfined sand, locally or semiconfined sand or sand and gravel, and several confined aquifers, which include sand and gravel or fractured bedrock (figs. 13 and 14). The unconfined sand aquifer is the most widespread in the areas of lacustrine sand and ice-contact sand and gravel (fig. 6) where its overall thickness and saturated thickness can support year-round domestic water withdrawals. This aquifer is the most extensive and reliable in the terraced sand plain north and northeast of Moreau Lake. It occupies a narrow strip east of Moreau Lake and extends south and southwestward within the ice-contact deposit, although it is not consistently used for water supply there presumably because of insufficient saturated thicknesses (fig. 13).
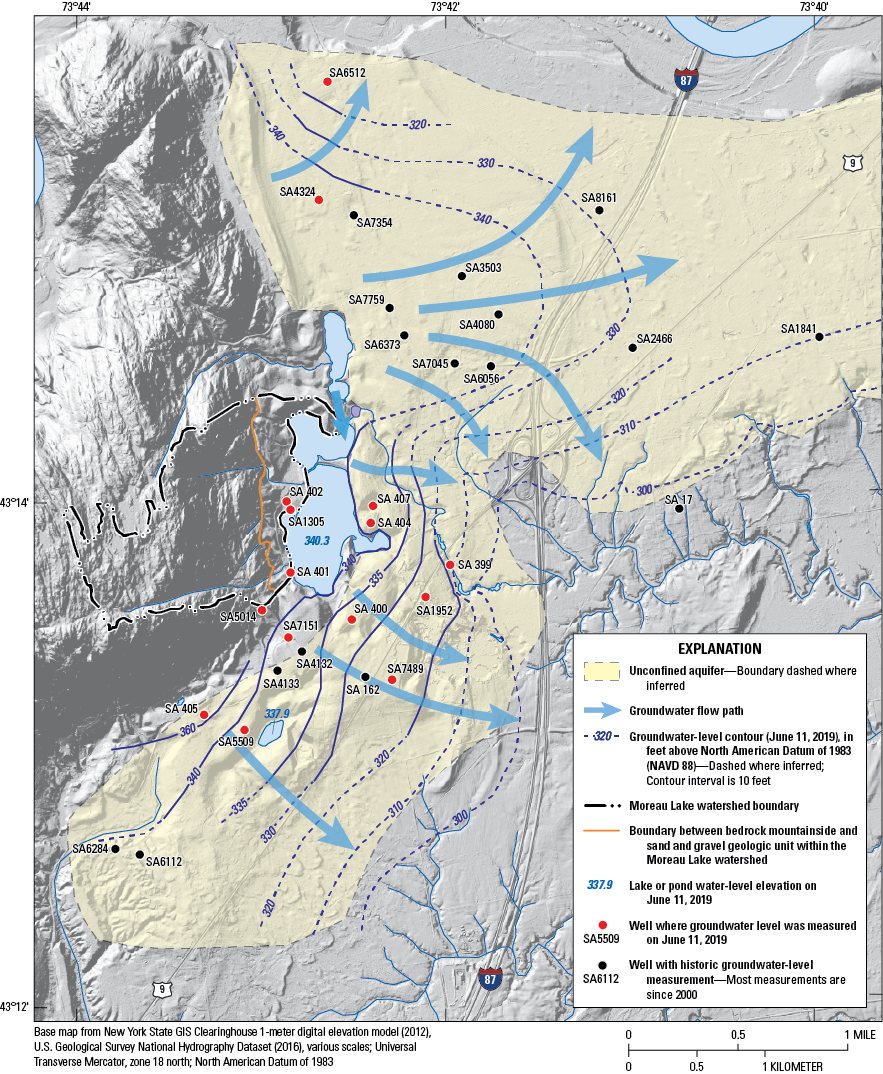
Map showing extent of unconfined sand aquifer, water table elevation contour lines, general groundwater flow paths, and extent of the Moreau Lake watershed in the Moreau Lake area, town of Moreau, New York. Data are from Heisig (2026a, b).

Map showing inferred extents of semiconfined and confined aquifer settings in the Moreau Lake area, town of Moreau, New York. Data are from Heisig (2026a).
The semiconfined aquifer lies beneath discontinuous confining units (lacustrine fine sand, silt, and clay or till) mostly south and southwest and immediately east of the lake (figs. 12 and 14). Confined aquifer areas (fig. 14) include (1) thick lacustrine fine sand, silt, and clay that overlies and confines sand and gravel or fractured bedrock at depths as great as 250 ft, and which is north and northeast of Moreau Lake within the bedrock trough (figs. 8 and 12); (2) a few instances of very deep (270 to 380 ft) sand and gravel or fractured bedrock confined by till; (3) an area of lacustrine clay over sand and gravel southeast of Moreau Lake; and (4) farther east of the aforementioned areas, fractured bedrock overlain by lacustrine clay or till confining units.
Distribution of Groundwater Use Among Aquifers
Before an accounting of potential effects of increases in groundwater withdrawals on lake water levels can be made, the distribution of wells and the aquifers they withdraw from must be documented and interpreted. Within an arbitrary 2-mi radius around Moreau Lake (fig. 15), there are 675 parcels served by private water sources (Saratoga County, 2016). Within that same area, 237 wells have been drilled for water supply since 2000 (New York State Department of Environmental Conservation, 2022), indicating growth of about 35 percent from 2000 to 2016.
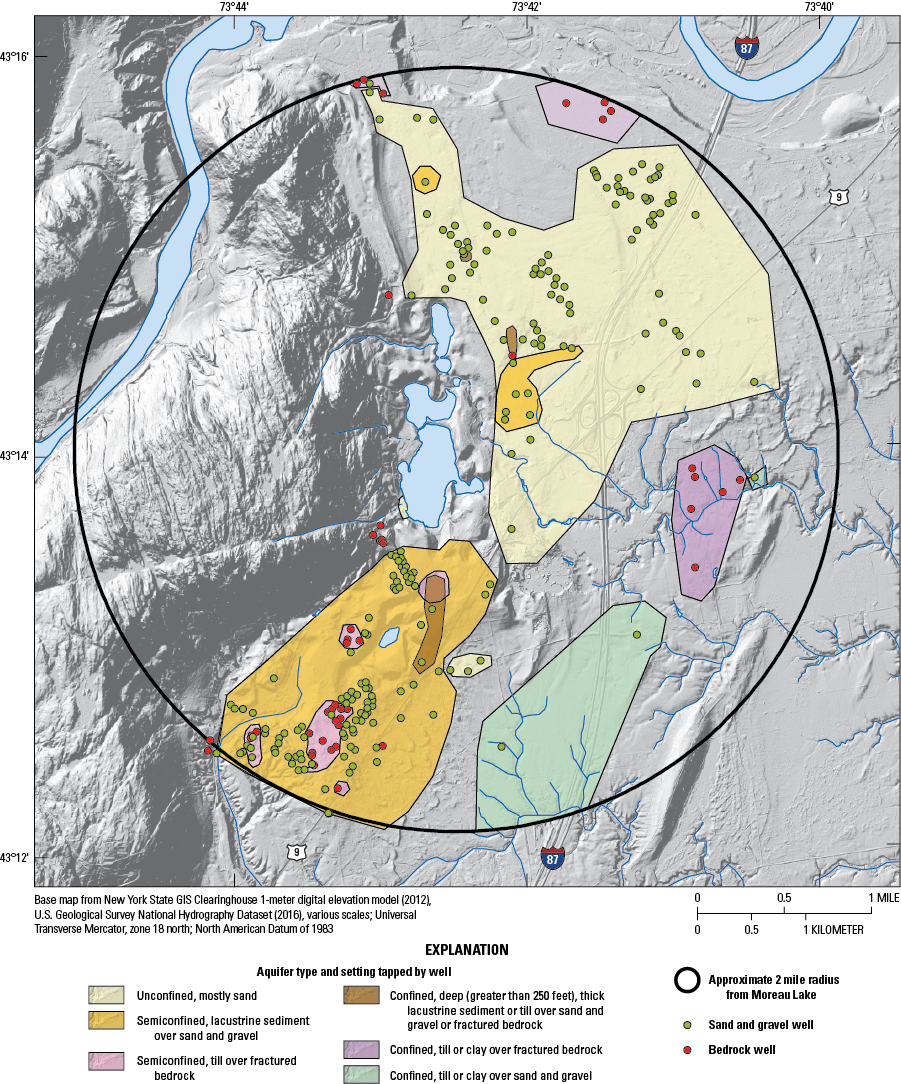
Map showing wells drilled since 2000 and aquifers tapped within 2 miles of Moreau Lake, town of Moreau, New York. Data are from Heisig (2026a).
Well logs for the new wells were examined to determine the type of aquifers being used and to map the distribution of water use within a 2-mi radius of Moreau Lake (fig. 15; table 2). The results indicated that the unconfined aquifer was most used north and east of Moreau Lake and that the semiconfined aquifer was most used south and southwest of Moreau Lake. Confined aquifers were minimally used near Moreau Lake. Pumping from unconfined aquifers releases groundwater by dewatering of pore space and causes only localized drawdown, whereas pumping from confined aquifers releases groundwater by depressurizing pore space and causes more areally extensive drawdown. Semiconfined aquifers are not continuously confined, which means that any recharge windows (local unconfined areas) that do occur will dampen or prevent declines in water levels from being transmitted any great distance. Thus, it appears unlikely that semiconfined aquifer withdrawals from the large number of new wells south of Moreau Lake have had an effect on lake water levels.
Table 2.
Aquifer types or settings used for water supply in the Moreau Lake area, towns of Moreau, Wilton, and Northumberland, New York, since 2000.[Well data are from Heisig (2026a). <, less than]
Nevertheless, for completeness, estimates of post-2000 (new) and total annual groundwater withdrawals from the semiconfined aquifer south of Moreau Lake are presented in this report and are compared with other water budget components in the “Water Budget Components Within the Moreau Lake Watershed and Comparison With Estimated Water Use” section of this report. The land use of the area of interest is essentially all single-family residential. The census block that covers the semiconfined aquifer area south of the lake (BG 360910601.013) indicates an average household size of 2.6 people (HomeTownLocator, 2020). Using a water usage estimate of 75 gallons per day per person for New York State (Dieter and others, 2018, table 6) and 101 households for the area (table 2), the estimated increase in water use from the aquifer during the past 20 years (since 2000) is about 7.2 million gallons per year (Mgal/yr). Residences in the area are served by onsite septic systems. Septic leachate is returned to the unconfined aquifer through a generally thick unsaturated zone (commonly greater than 40 ft). Only limited return to the confined aquifer is possible where confining units are absent. About 9 percent of domestic water use in New York State is consumptive (lost to the atmosphere) through activities such as lawn watering (Shaffer and Runkle, 2007, app. 1, table 1.1).
Before 2000, there were few wells in the area; therefore, groundwater use was low. Tax parcel data indicated that about 127 parcels in the aquifer area were supplied by private wells (Saratoga County, 2016). There were a total of 120 wells tapping semiconfined and unconfined aquifers since 2000, which indicated that there were seven preexisting wells in the area. Assuming six wells tapped the semiconfined aquifer, annual water usage before 2000 was estimated to be about 0.4 Mgal/yr. The total annual withdrawal in 2020 included 107 households and was about 7.7 Mgal/yr.
Lake Water Levels, Groundwater Levels, and Groundwater Flow
Groundwater level measurements (2017–2020) from a network of 16 wells, together with historic groundwater level measurements and lake water level monitoring (July 2016–2021; fig. 3), were used to define the local groundwater flow system around Moreau Lake. Three years of discrete groundwater level measurements from wells in unconfined to semiconfined settings near Moreau Lake with those from Moreau Lake (well SA1305) indicated that Moreau Lake water levels were higher than water levels in all but two wells on the western (mountain) side of the lake (fig. 16). This indicates a groundwater level gradient and general groundwater flow from high-elevation areas in the west to low-elevation groundwater discharge areas in the east. In addition, groundwater level fluctuations during the period of record are largest near areas of highest groundwater recharge at the base of the mountainside and around Moreau Lake (5.7 to 6.9 ft) and progressively decrease downgradient to a low of 1.5 ft near an area of groundwater discharge (well SA 399).
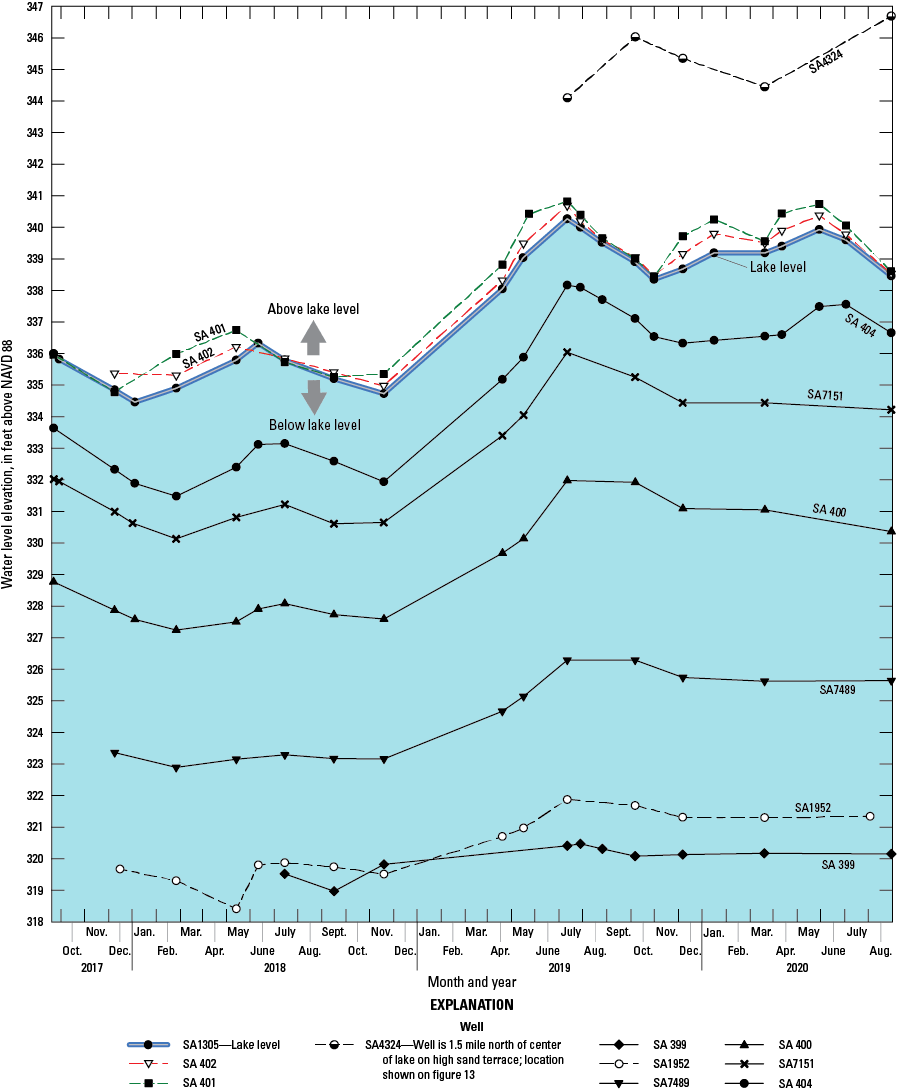
Graph showing discrete water level elevation measurements from 2017 to 2020 in the Moreau Lake area, town of Moreau, New York, including the local groundwater level network and one well (SA4324) representing higher groundwater levels to the north of the lake. Elevation data are from Heisig (2026b). NAVD88, North American Vertical Datum of 1988.
A map showing contours of the water table surface in the greater Moreau Lake area was constructed using measurements from 15 wells, Moreau Lake, and a kettle pond south of Moreau Lake measured on June 11, 2019 (a time of high water levels), 15 historic water levels reported in driller’s logs, and from mapped elevations of streams (fig. 13). The historic water levels are given less weight for delineation of water level contours. They were measured at different times of year, but the median water level fluctuations from 13 recently measured wells with minimal pumping effects was about 5.5 ft, an indication that it is reasonable to use them with 10-ft elevation contours. All wells in the network were completed in what are interpreted as either unconfined or semiconfined aquifers. The map depicts the general decrease in groundwater levels from the mountainside eastward as well as subsequent bending of the water table contours and groundwater flow lines toward discharge areas. Discharge areas are springs and seepage areas that are the source of streamflow. Groundwater flow lines indicate the direction of groundwater flow. A notable feature is a large eastward bulge of high water levels north of Moreau Lake, indicated by the 330 and 340 ft contours, that correspond to the highest terrace elevation of the sand plain. The southern side of the bulge encompasses the kettle ponds immediately north of Moreau Lake. This implies that groundwater levels, and thus kettle pond levels, are higher than the level of Moreau Lake. The pond immediately north of Moreau Lake (northern embayment; fig. 1) is mostly separated from the lake by a narrow sandy strip of land but connected through a small channel under a footbridge. When the channel has been dammed, a higher water level is maintained in the pond than in Moreau Lake and erosion from groundwater seepage on the Moreau Lake side just east of the footbridge has also been observed, all of which is consistent with the water table map.
Water levels from confined aquifer settings (fig. 14) were not used to construct a potentiometric (confined water level) map because of uncertainty in the degree of hydraulic interconnection of the confined aquifers and the availability of only historic measurements. Wells completed in semiconfined settings were monitored and were considered most similar to adjacent unconfined settings. No wells in strictly confined settings were monitored during the study. It was considered unlikely that the deep confined aquifer in the bedrock trough was in hydraulic connection with the much shallower confined settings 1.5 to 2 mi from Moreau Lake. Historic water levels within the deep confined aquifer (wells SA10287, SA8015, SA2696, and SA 408) showed a general, but not consistent, decrease in water levels from south to north, but the differences were mostly within a 5-ft range, which was within the likely errors of the historic measurements (plus or minus 5 ft) and below the 10-ft contour interval that would have been used. All deep confined aquifer water levels east and north of the lake were lower than in the overlying unconfined aquifer, whereas in the single deep confined aquifer well south of the lake, water levels were higher than that in the unconfined aquifer.
Movement of Water from Moreau Lake to the Local Groundwater Flow System
An understanding of the hydrogeologic framework of the greater Moreau Lake area provides a basis for looking more specifically at the movement of water from Moreau Lake after it enters the local groundwater system. Interpretation of groundwater flow direction from water level data was supplemented with field measurements (water temperature and specific conductance) and laboratory analyses (oxygen and hydrogen isotope ratios of water) that serve as groundwater tracers. If lake water is being drawn towards areas of increased groundwater withdrawal (to the south), it would indicate the potential for negative effects on lake water levels. Alternatively, if lake water is moving through the groundwater system to natural discharge areas, then it can be inferred that increased groundwater withdrawals have no discernable effect on lake water levels.
Groundwater Levels and Flow Lines
The water table map of the Moreau Lake area shows groundwater flow lines drawn perpendicular to the water table contours in the direction of decreasing water levels (depicted by arrowheads; fig. 17). Flow lines downgradient from Moreau Lake are depicted in the blue shaded area of inferred groundwater flow from the lake and indicate that lake water entering the unconfined aquifer flows to the east and southeast, discharging at springs and along stream courses, rather than southward toward the area of increased groundwater withdrawals in the semiconfined aquifer setting. Hydrogeologic cross section E–E′ approximates a flow line from the lake to a discharge location (fig. 18). The limited number of wells along the cross section leaves some uncertainty in the position of water level contours and flow lines but provides strong evidence for the general flow direction. Tracers of groundwater movement were used to test whether or not there was agreement with the groundwater level interpretation.
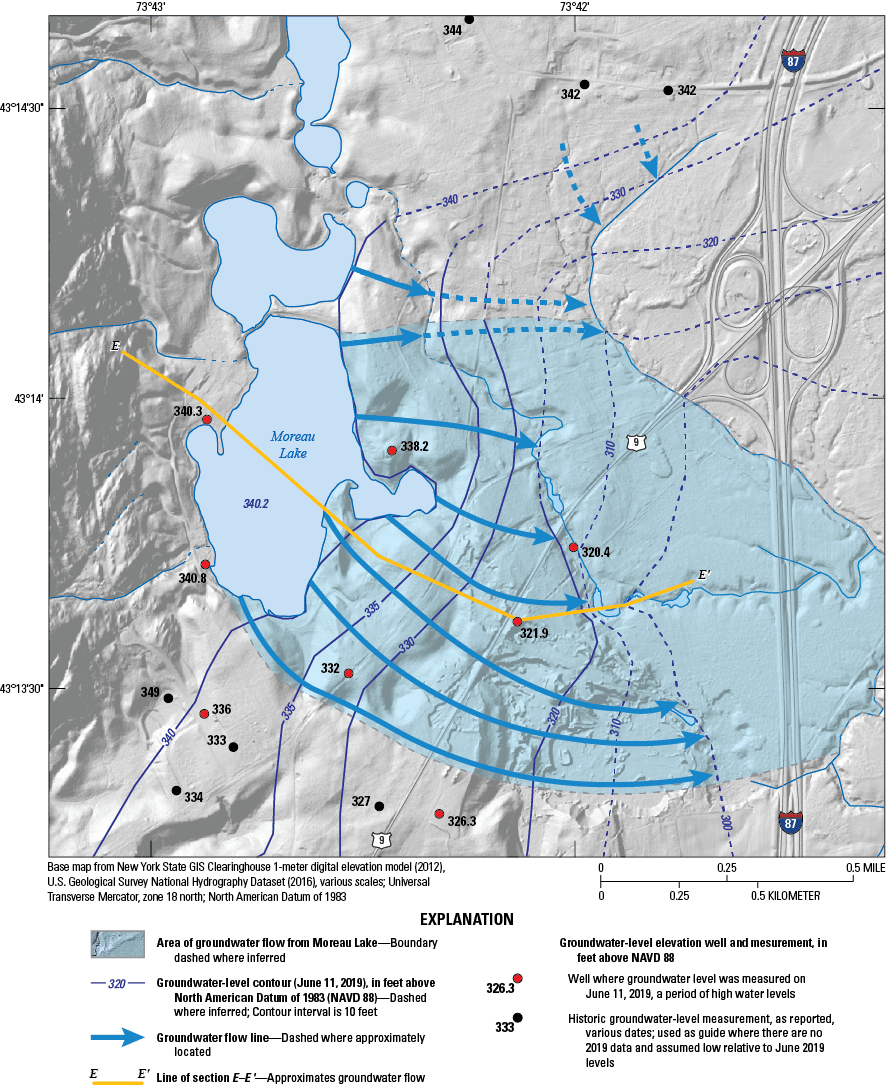
Map showing the estimated water table elevation in the Moreau Lake area, town of Moreau, New York, and inferred groundwater flow lines during wet conditions (June 11, 2019) when lake water level was high (340.2-foot elevation). Groundwater data are from Heisig (2026a, b). NAVD88, North American Vertical Datum of 1988.
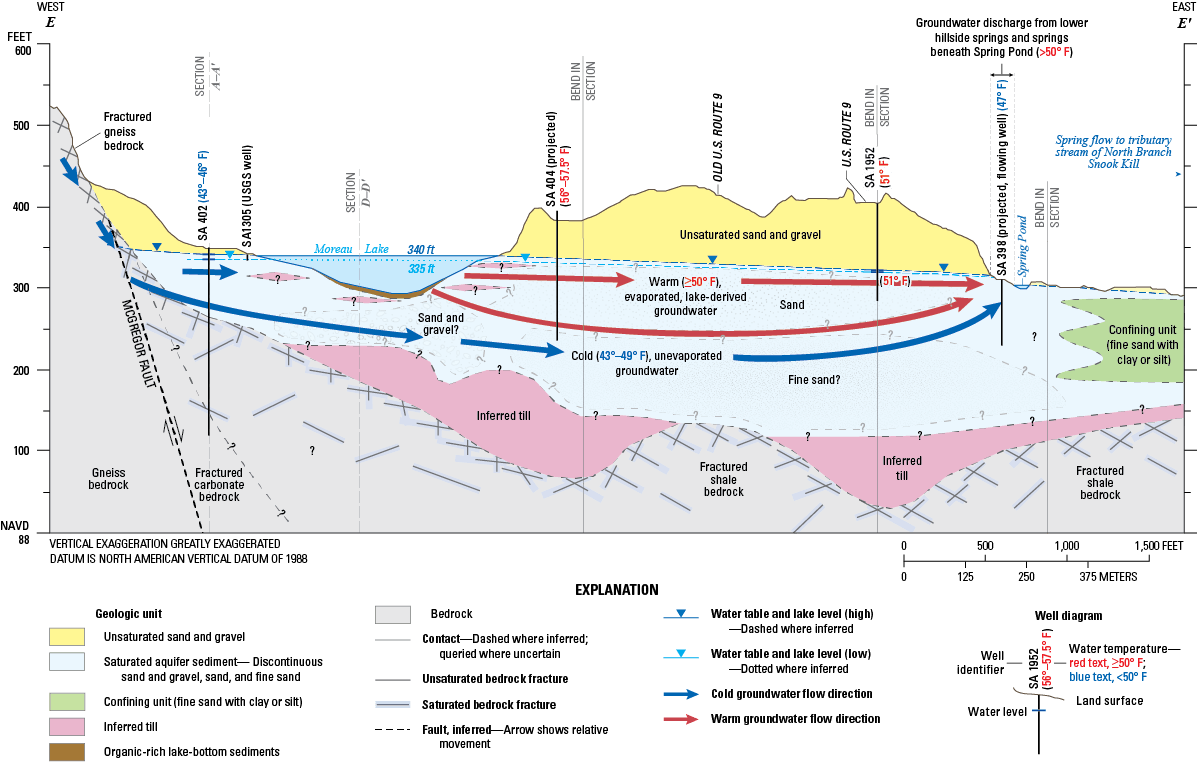
Hydrogeologic cross section E–E′ in the Moreau Lake area, town of Moreau, New York, which approximately follows a groundwater flow line from Moreau Lake to spring discharges to the east. The spring pond is fed by groundwater discharge from springs on the adjacent hillside and beneath the pond. The water temperature of these springs is greater than (>) 50 degrees Fahrenheit (°F). Data are from Heisig (2026b). Refer to figures 6 and 17 for the location of the cross section. ft, foot; NAVD88, North American Vertical Datum of 1988; ≥, greater than or equal to.
Water Temperature
Water temperature is a useful water tracer in areas of surface water and groundwater interaction. Because the surface of Moreau Lake is in contact with the atmosphere, it is subject to wide seasonal changes in water temperature. For example, the top to bottom temperature based on vertical profiles in the middle of the lake ranged from 73 to 50 °F at the end of summer (September) and 33 to 40 °F in winter (February). In contrast, groundwater temperatures in wells not affected by any surface water—those just upgradient from Moreau Lake, on the mountainside, and in sand and gravel aquifers south and north of the lake—were consistently between 43 to 49 °F (fig. 18). Groundwater temperatures at most wells and springs downgradient from the lake were 50 to 57.5 °F, which is indicative of lake-derived groundwater. However, groundwater from two wells (35 and 80 ft deep) and one spring at and near a former fish hatchery site consistently have temperatures between 47 and 47.8 °F (fig. 19). The hatchery site represents the lowest elevation (about 312 ft) close to the lake, roughly 20 to 30 ft lower than the lake water levels. Springs emanating from the eastern hillside of the site, however, are warmer than 50 °F, indicating that they contain lake water. The colder temperatures at the spring and wells are interpreted to be deep groundwater passing beneath the lake (refer to figs. 18 and 19). Groundwater temperature immediately south of Moreau Lake could not be measured directly from well SA7151, so the possibility of southward flow had to be resolved with other groundwater tracers.
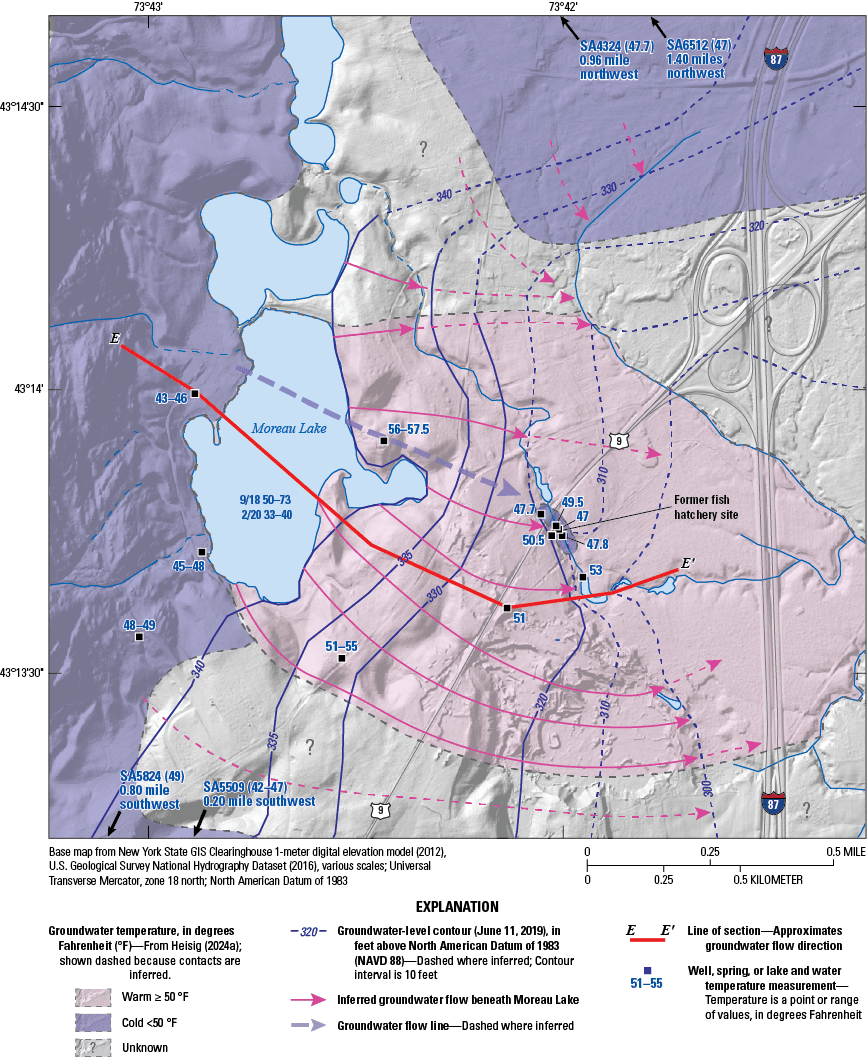
Map of groundwater temperature relative to water table contours and groundwater flow lines, showing net warmer water moving downgradient from Moreau Lake, town of Moreau, New York. Data are from Heisig (2026a, b).
Specific Conductance
Specific conductance was measured in wells, springs, the lake, tributaries to the lake, and the stream downgradient from the lake (fig. 20). Specific conductance is a surrogate measurement of total dissolved solids or mineral content of water. In general, specific conductance increases in the downgradient groundwater flow direction. This corresponds to an increase in human activities in that direction, as the landscape changes from pristine mountainside to the park facilities and then to residential development and major roadways (U.S. Route 9; refer to figs. 1 and 18). Under natural conditions, the mineral content of groundwater also typically increases with residence time in the flow system. Tributaries to the lake and wells on the western (mountain) side of the lake have the lowest specific conductances and range from about 32 to 115 microsiemens per centimeter at 25 degrees Celsius (µS/cm).
Specific conductances from vertical lake profiles ranged from about 106 to 133 µS/cm, with the highest measurements directly atop or within the organic-rich bottom sediments. Groundwater from wells completed in the unconfined aquifer north and south of the lake showed specific conductances of 108 and 268 µS/cm, respectively. Specific conductance measurements in wells downgradient from the lake (east and southeast) and having large depths to water were somewhat higher than the lake values, ranging from 131 to 187 µS/cm, and generally matched up with the inferred flow lines of lake-derived groundwater. At the discharge area, depths to groundwater become shallow, and specific conductance in water from the stream and hillside springs associated with lake water ranged from 224 to 312 µS/cm. These higher values were likely caused by longer residence time in the flow system and by infiltration of deicing-salt leachate along U.S. Route 9 (signed as Saratoga Road) and Old Saratoga Road (the old path of U.S. Route 9), as well as effluent from septic systems (fig. 18). Specific conductance at the wells at the former fish hatchery ranged from 238 to 337 µS/cm, which was likely a result of longer residence times in the groundwater flow system and interaction with carbonate minerals in bedrock or sediments rather than road-salt contamination (figs. 18 and 20).
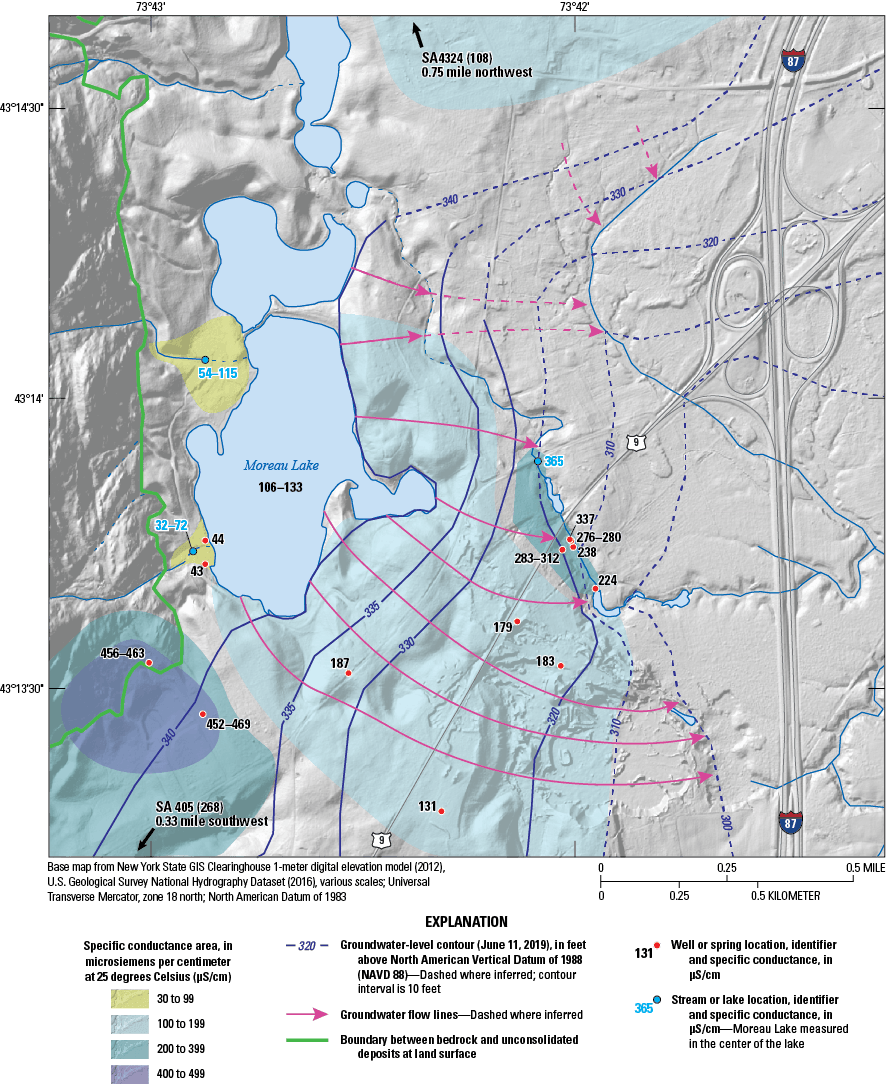
Map of groundwater specific conductance relative to water table contours and groundwater flow lines, showing major discontinuity between Moreau Lake and wells immediately south of the lake that have much higher specific conductances in the Moreau Lake area, town of Moreau, New York. Data are from Heisig (2026b).
Immediately south of the lake, groundwater specific conductances ranged between about 450 and 470 µS/cm in the bedrock well SA5097 and the downgradient sand and gravel well SA7151. These values are nearly four times higher than those observed in Moreau Lake and appear to be natural because there is no development upgradient on the mountainside. Slivers of carbonate bedrock were noted at land surface near the bedrock well and in the streambed of the nearby lake tributary between the gneiss of the mountainside and the shale of the lowlands (refer to fig. 7). Carbonate rock is more reactive (subject to dissolution) than the other rock types and thus may be the reason for the higher specific conductance in the area. The high specific conductance in the water from the sand and gravel well, which is within a residential area served by wells, is strong evidence that the groundwater in this area is derived from mountainside sources rather than Moreau Lake.
Isotope Ratios of Oxygen and Hydrogen
Sixteen water samples were selected for isotopic analysis from Moreau Lake and at wells and springs in the area to determine if evaporation at the lake was sufficient to create a discernable signature in downgradient wells and springs (Stichler and Moser, 1979). Four dip samples and one Kemmerer sample (collected from about 25 ft of depth) from the lake were analyzed: three from May 2018, when lake water was relatively mixed following spring turnover (western and eastern embayment and the central basin; fig. 1), and two in September 2018, when effects of evaporation were expected to be greatest (western and eastern embayments). Samples from the western and eastern embayments were collected to test the degree of evaporation on the upgradient (western) and downgradient (eastern) sides of the lake. A single groundwater sample was collected at well SA5824, which is 1.7 mi south-southwest of the lake, as a control sample; because the well draws from a semiconfined aquifer near the mountainside, it was unaffected by evaporation from any surface-water body.
Well SA 401, a park production well upgradient from (but at the edge of) the lake, was sampled as an additional verification that the well’s water source was upgradient groundwater and not lake water. Well SA7151, which taps a semiconfined aquifer directly south of the lake, was selected to determine whether or not any lake water was moving southward. The remaining samples were from two springs (SA 397 and SA 414), wells SA 398 and SA 399 at the former fish hatchery, and wells SA 400 and SA1952, whose groundwater was identified as downgradient from and affected by the lake by other evidence. Precipitation data collected at Colgate University in Hamilton, N.Y. (Burnett and others, 2004) were used to plot the local meteoric water line in the isotope plot (fig. 21).
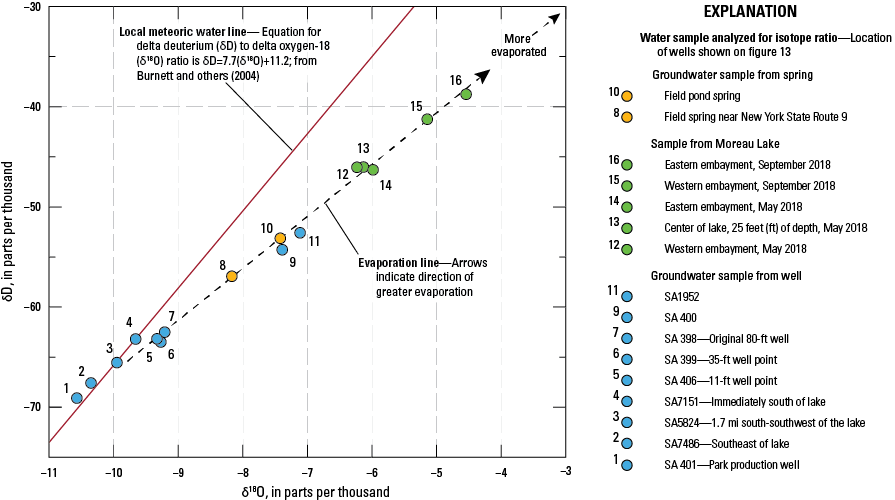
Graph showing water isotope ratio plot of samples from Moreau Lake and selected wells and springs in the Moreau Lake area, town of Moreau, New York, showing evaporation effects on Moreau Lake water and downgradient groundwater and springs. Data are from Heisig (2026b).
The oxygen and hydrogen isotope ratio data plot (fig. 21) shows that Moreau Lake water is affected significantly by evaporation such that groundwater derived from the lake is traceable. The lake water samples collected at the end of summer showed the largest effects from evaporation; in addition, the downgradient (eastern embayment) water was more affected by evaporation than the upgradient (western embayment) water, which is conceptually more recent, upgradient groundwater discharge into the lake. The three springtime lake water samples were more mixed and uniform in isotopic composition, following spring turnover in the lake. The control groundwater well sample collected from the upgradient (lakeshore) park production well and the sample collected from the semiconfined aquifer well immediately south of the lake had values that plotted on or close to the local meteoric water line. This indicates that lake water is not migrating south through the semiconfined aquifer, which is consistent with water level, temperature, and specific-conductance data. Also indicated is that the park production well at the lakeshore does not induce lake water into the aquifer; the source of water for the well is from precipitation that falls on the upgradient mountainside, and more specifically from tributary streamflow infiltration between the mountainside and the lake.
The groundwater samples from two wells between the lake and the discharge area and from two springs on the western side of the discharge area (the former fish hatchery) all indicate a mixture of evaporated (lake) water and unevaporated groundwater, which also confirms the groundwater flow path indicated by water level and temperature data. The three wells at the former fish hatchery that discharge cold water have isotopic values that show slight evaporation effects, but within the uncertainty of the local meteoric water line, which is consistent with a predominantly nonlake source indicated by the temperature data. These results are indicated in map form with color-coded sample points in figure 22.
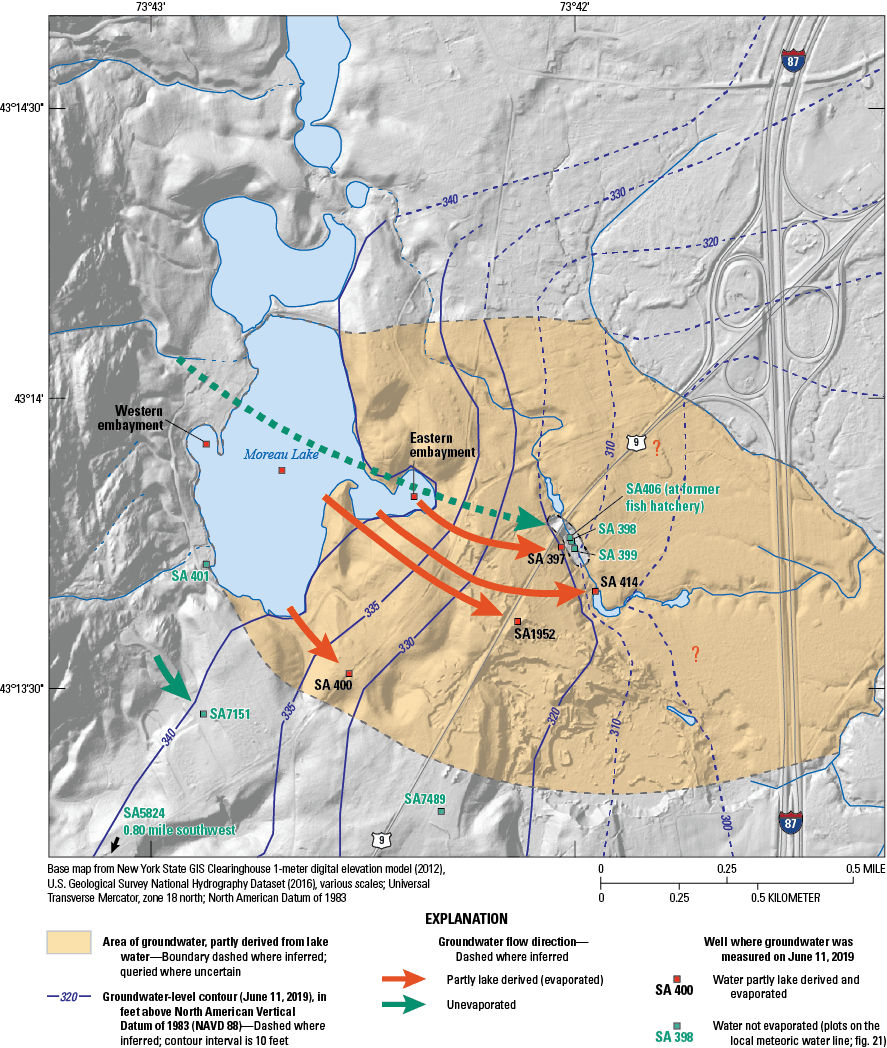
Map showing groundwater sample locations analyzed for delta deuterium (δ2H) and delta oxygen 18 (δ18O) in the Moreau Lake area, town of Moreau, New York. Locations are color coded to indicate water affected by evaporation (partly derived from lake water) or not affected by evaporation. Data are from Heisig (2026b).
The preceding sections provide multiple lines of evidence that indicate that water from Moreau Lake does not flow southward into the groundwater flow system toward the residential area with the greatest increase in groundwater withdrawal since 2000. Instead, a water table map of the Moreau Lake area with groundwater flow lines and maps of groundwater and lake temperature, specific conductance, and water isotopes indicate that lake water moves through the groundwater system to the east and southeast through the water table aquifer with discharge at springs and along stream courses. Thus, groundwater withdrawals have no discernable effect on water levels at Moreau Lake. A final step is to look at the water budget of the Moreau Lake area and to document how the increased groundwater withdrawals from the semiconfined aquifer compare with seasonal variations in precipitation.
Water Budget Components and Estimated Water Use
An annual accounting of water in the Moreau Lake area can be estimated from regional maps of 1951–80 mean annual values of precipitation, runoff, and evapotranspiration from Randall (1996) as shown schematically in figure 23. Precipitation and runoff values were interpolated from National Oceanic and Atmospheric Administration weather stations and streamflow records at USGS gages, respectively, and evapotranspiration was estimated as the difference between those values.
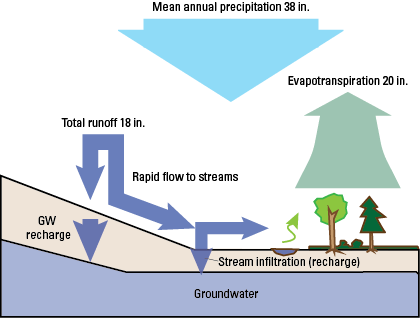
Schematic diagram of regional estimates of water budget components from 1951 to 1980 data analysis in Randall (1996). in., inch.
The lack of precipitation data in southern Saratoga County and atop the Palmertown Range are limitations. Annual precipitation, the sole water input, is about 38 in., annual runoff is about 18 in., and annual evapotranspiration is about 20 in. Runoff consists of two components: rapid surface flow to streams and other waterbodies during intense storms or snowmelts and water that infiltrates land surface and either replenishes soil-moisture deficits or continues downward to the water table and recharges groundwater. At Moreau Lake, the two main tributaries generally lose all flow to infiltration along the streambed where the streams leave their mountainside bedrock channels and flow over sand and gravel adjacent to the lake.
Water budget components such as evapotranspiration and runoff vary in time during the course of a year because of the large seasonal return of water from the Earth’s surface back to the atmosphere during the warmer months (the growing season) through plant transpiration and evaporation. The monthly distribution of precipitation and estimates of evapotranspiration provide an indication of whether evapotranspiration may be limited by rainfall during the growing season as well as the amount of water available for runoff and recharge during the course of a year (fig. 24). About 78 years of data from the Floyd Bennett Memorial Airport (formerly the Warren County Airport) in Glens Falls were used to generate monthly mean air temperature and monthly mean, minimum, and maximum precipitation. Monthly means of precipitation (fig. 24) differed by 1.3 in. or less, but with higher totals in the summer months and lower in winter, particularly in February and January. The minimums and maximums show that a wide range of departures from the mean are possible in any given month. Monthly temperature means were used as input for the Thornthwaite method (Thornthwaite, 1948) for calculating potential evapotranspiration by month (fig. 24).
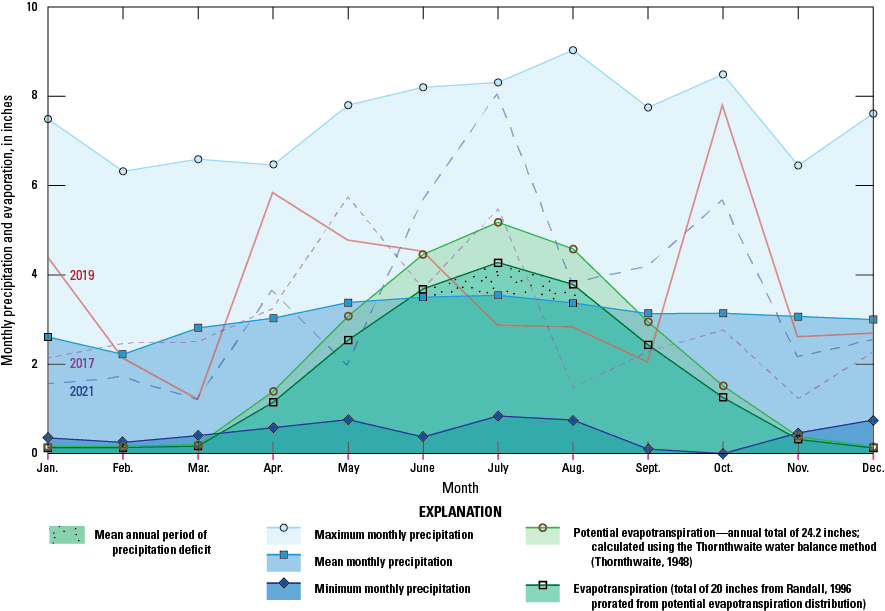
Graph showing monthly mean, maximum, and minimum precipitation and estimates of monthly potential evapotranspiration (based on the Thornthwaite method) and annual evapotranspiration from Randall (1996) prorated by monthly percentages from the Thornthwaite estimate for the Moreau Lake area, town of Moreau, New York. Monthly precipitation for three years with wet growing seasons during the study period (2017, 2019, and 2021) are provided as examples of large month-to-month variations, particularly during the growing season. Precipitation data are from Northeast Regional Climate Center (2021).
Potential evapotranspiration is the amount of evapotranspiration possible if water is not a limiting factor—essentially the upper limit of possible evapotranspiration. The annual total from this method was 24.2 in. Because this was considerably higher than the approximately 20-in. estimate from Randall (1996), the monthly distribution was prorated for a seasonal total of 20 in., which is considered more realistic (fig. 24). These estimates of monthly mean evapotranspiration exceed the precipitation means (thus producing a water deficit) by less than 1 in. during June, July, and August, which is a relatively small amount. For comparison, the Thornthwaite estimates extend deficit months from May to September, with a maximum deficit of about 1.75 in. from mean precipitation in July. These deficits are much smaller than the variations inherent in monthly precipitation, which indicates that conditions of water surplus or deficit relative to plant needs may be highly variable during the warmest summer months in the Moreau Lake area. This figure also indicates a water surplus most other months of the year, and this surplus becomes either overland or shallow subsurface runoff and groundwater recharge.
The fate of precipitation over the course of an annual cycle in regional (upstate New York) conceptualizations such as the schematic presented by Heath (1965) is considerably different from that of the Moreau Lake area (fig. 25). In upstate New York, precipitation is depicted as relatively constant from month to month, but evaporation and transpiration are major components during the warm months (growing season) and cease or decrease substantially during the cold months (nongrowing season). Runoff, divided into overland runoff and groundwater recharge, behaves in the opposite way—it is highest during the nongrowing season and lowest or largely absent during the growing season. Overland runoff to streams and evaporation and transpiration to the atmosphere are shown as losses from the system, but there is an additional loss: groundwater outflow. Groundwater systems are dynamic—groundwater recharge is an addition of water to the groundwater system, but groundwater is constantly flowing toward discharge areas to more or less balance the inputs. If not in balance, groundwater storage may increase or decrease (a change in water levels). In many areas, recharge may be a minor component, but in areas of sand and gravel aquifers, it can be significant.
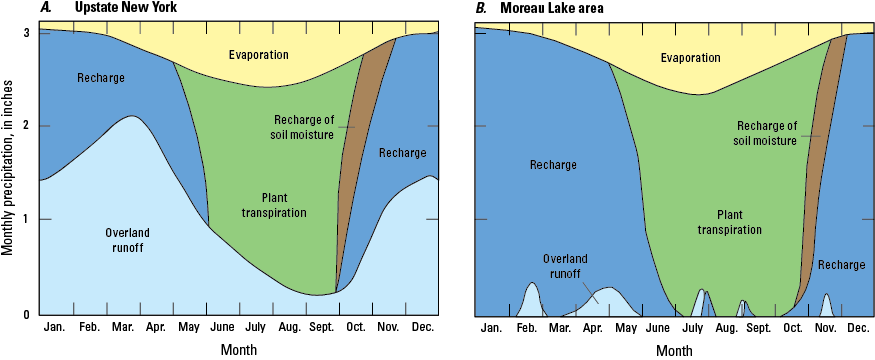
Conceptual water budget diagrams A, generalized for upstate (central) New York (from Heath, 1965) and B, modified for the Moreau Lake area, town of Moreau, New York.
Moreau Lake and its groundwater contributing area (fig. 25B) have a somewhat unusual hydrogeologic setting (fig. 13) and have water-budget components that depart from those of the general schematic for upstate New York (fig. 25A; Heath, 1965). Much of the contributing area (0.68 square mile [mi2]) to the lake (0.20 mi2) consists of bedrock mountainside (78 percent) separated from the lake by a fringe of sand and gravel (22 percent). Groundwater flow from the mountainside, through and beneath the lake, and exiting to the east and southeast from the lake (fig. 19) is indicated by higher-than-lake groundwater levels in the bedrock and sand and gravel on the western side of the lake and lower-than-lake groundwater levels to the south and east (fig. 16). This means that the contributing area of groundwater to the lake is strictly upgradient (west) from the lake, as shown in figure 13. The surface or topographic watershed of the lake might suggest water contributions from steep sand and gravel slopes on the eastern, southern, and western sides of the lake. High infiltration rates of sand and gravel indicate that only intense summer thunderstorms with rainfall rates that exceed the infiltration capacity of the soil or rain or snowmelt on frozen ground in winter could result in surface runoff to the lake. This represents a small area of infrequent contribution and is therefore not considered further.
Each water-budget component of the local hydrogeologic system has its own variation (fig. 25B) compared with those in upstate New York (fig. 25A). All precipitation falling directly on Moreau Lake is direct recharge (no overland runoff), although some water losses from plant transpiration along the shoreline are expected. Evaporation during ice-free periods is likely larger than plant transpiration. Groundwater loss through flow or discharge to the east (primarily) and southeast is the major loss from the lake and underlying sediments.
The water budget of bedrock uplands most closely follows that of upstate New York (fig. 25A) except that overland runoff is limited to two small tributary streams (fig. 1), and much of the water input infiltrates and moves through the shallow subsurface of broken-up bedrock (regolith) and through fractures (fig. 26) in the upper 100 ft or so of bedrock (as recharge) toward the sand and gravel at the base of the mountainside.
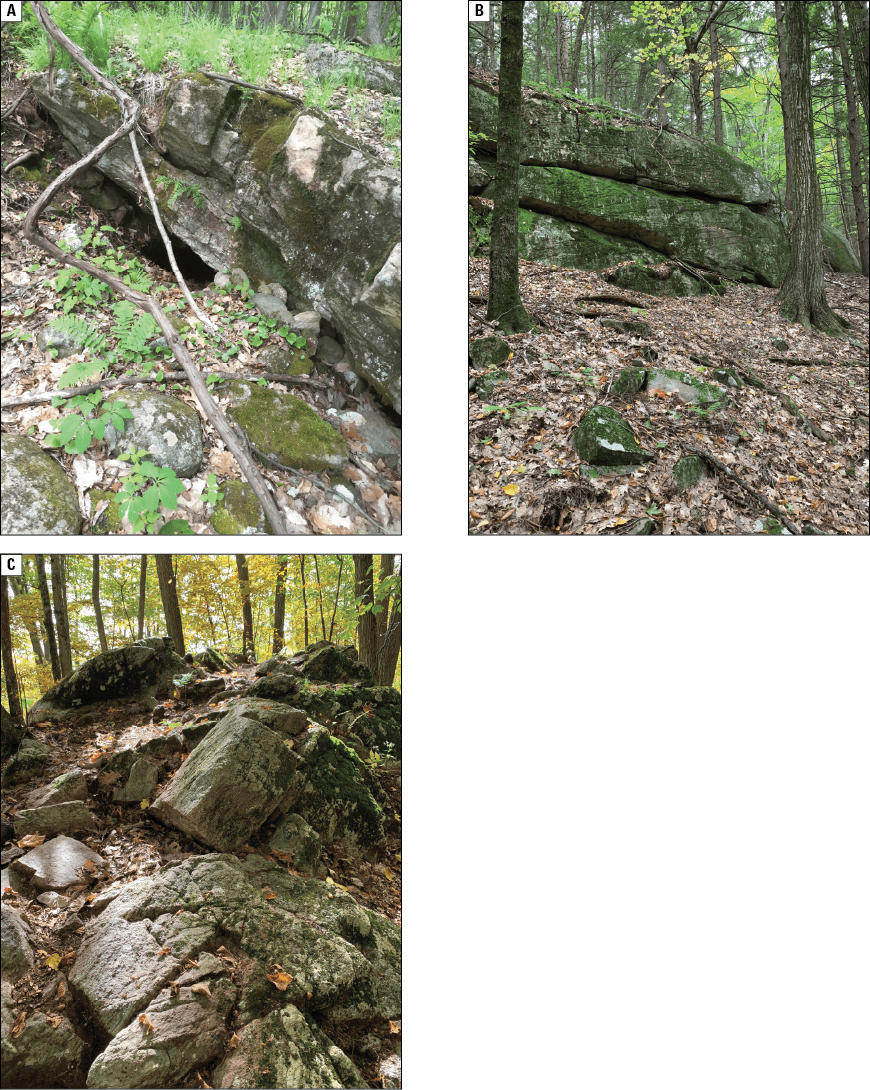
Photographs of Grant Mountain showing A, lower hillside, B, mid-hillside, and C, upper hillside views of fractured bedrock and broken-up rock at land surface adjacent to Moreau Lake, town of Moreau, New York. Photographs by Paul Heisig, U.S. Geological Survey.
The sand and gravel that separates the bedrock mountainside from the lake is an important link in the system because of its high permeability. Water from the mountainside recharges either groundwater in the subsurface where bedrock fractures discharge to the sand and gravel or sand and gravel where mountainside streams cross the sand and gravel and largely infiltrate into the streambed before reaching the lake (fig. 27). Only the two largest tributaries regularly have flow on bedrock before reaching the sand and gravel, but it is only during periods of high-intensity or long-duration rainfall, major snowmelt periods, or spring wet periods that tributary flow directly replenishes Moreau Lake (fig. 27). The period with the most flow to the lake from the south tributary is in late spring when high water inputs from the mountainside raise groundwater levels in the sand and gravel enough that tributary flow is maintained all the way to the lake. The net result (fig. 25B) is that overland runoff is a minor component of the water budget and that recharge is a major component. The end date of plant transpiration is also shifted a little later in the year (fig. 25B) compared with upstate New York (fig. 25A), on the basis of water level responses at well SA1305.
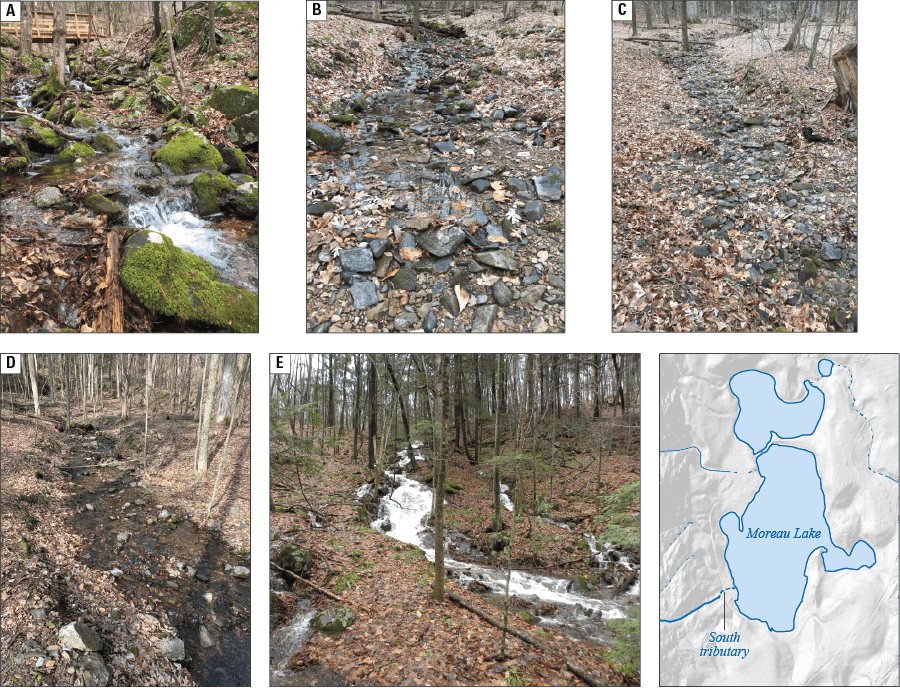
Photographs of flow conditions at the Moreau Lake south tributary in Moreau Lake State Park, town of Moreau, New York. Conditions on April 13, 2018, showing infiltration loss of all flow during about a 150-foot (50-yard) reach: A, Initial flow just after leaving bedrock channel (near the footbridge); photograph by Paul M. Heisig, U.S. Geological Survey (USGS). B, End of visible surface water; photograph by Paul M. Heisig, USGS. C, Dry channel downgradient; photograph by Paul M. Heisig, USGS. High flow conditions during which D, water table is high (April 16, 2019; photograph by Paul M. Heisig, USGS) and E, flow exceeds infiltration rate (December 22, 2018; photograph courtesy of Peter Iskenderian, New York State Department of Parks, Recreation and Historic Preservation).
Recharge during the growing season is limited, but more likely in the Moreau Lake area (fig. 25B) than in upstate New York (fig. 25A) because fractured bedrock near or at land surface on the mountainside and the sandy soils around Moreau Lake can accept water from occasional large, long duration rainfalls. Thick unsaturated zones in sandy soils effectively delay recharge water reaching the water table (offset in overland runoff and recharge in fig. 25B). Groundwater recharge is more rapid where stormflows in streams cross dry sand and gravel streambeds.
The variation in seasonal monthly precipitation departures from median values (fig. 24), especially during the nongrowing season, can be a large percentage of the seasonal monthly precipitation medians. Figure 28 shows the largest variations in seasonal precipitation from the respective medians during a recent 5-year period (2015–19) in terms of volume. The span in the difference between extremes during the nongrowing season is 25.5 million cubic feet (Mft3) of water, about 75 percent of the seasonal median, while during the growing season, the difference is 16.5 Mft3 of water, about 40 percent of the seasonal median. This variability in precipitation affects lake water levels at the seasonal scale, which is addressed in the “Comparison of Continuous Lake Water Level Data (2016–21) With Precipitation Data” section of this report.
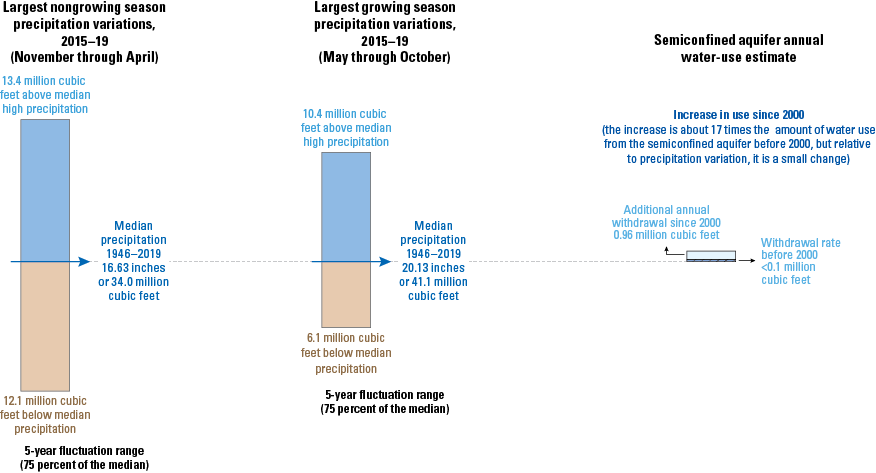
Graph showing seasonal (growing and nongrowing) precipitation departures from the 1944–2021 seasonal medians for 2015 to 2019 within the Moreau Lake contributing area, town of Moreau, New York, and estimated annual semiconfined aquifer use and change since 2000. Precipitation data are from Northeast Regional Climate Center (2021). Mft3, million cubic feet; in., inch.
Water use within the Moreau Lake groundwater contributing area is limited to the primary production well (SA 401) on the southwestern side of the lake; a second production well (SA 400) is downgradient from the lake and was considered in the discussion of the semiconfined aquifer. Well SA 401 is a shallow (30 ft deep) well completed in the unconfined sand and gravel aquifer. The well serves most of the campground and the beach facilities at the park. An estimate of annual withdrawals from typical summer-season pumpage (J. Burnham, park supervisor, New York State Department of Parks, Recreation and Historic Preservation, oral commun., February 2, 2022) is approximately 1.25 Mgal/yr. The well is not used during the off-season (winter). The well is close to the shoreline of the lake and initially was assumed to induce water from the lake into the sand and gravel aquifer when pumping, but this is not the case. The well is close to the south tributary, which follows and drains a large linear feature on the mountainside. Most flow from the tributary infiltrates into the stream bed (fig. 27).
Together with local contributions from the mountainside, this is an area of focused recharge. Groundwater from the mountain is low in mineral content—the south tributary specific conductance range is 32 to 74 µS/cm—and groundwater from wells and springs not influenced by Moreau Lake and associated ponds is cold, 43 to 49 °F, as discussed in the “Water Temperature” section of this report. Lake water, in contrast, shows higher specific conductance (115–133 µS/cm, from August and September 2018 lake-center vertical temperature and specific conductance profiles) and wide seasonal temperature fluctuations. For example, lake center vertical temperature profiles taken during winter (February 19, 2020) and summer (August 16 and September 12, 2018) ranged from 33 to 41 °F and 50 to 82 °F, respectively (Heisig, 2026b). When well SA 401 was sampled on September 3, 2018, (Labor Day weekend) after pumping at least 2,500 gallons, the specific conductance was 43 µS/cm and the temperature was 45 °F, a clear indication that at the end of the summer camping season (the maximum possible stress), the well water was derived from the mountain and not from the lake. A water isotope sample from this well also conclusively shows that, unlike lake water, the well water was not subject to evaporation (figs. 21 and 22).
In effect, the focused recharge of mountainside water into the sand and gravel near well SA 401 results in a gradient toward the lake, most obvious during the nongrowing and recharge season (fig. 4), that prevents lake water from reaching well SA 401. Thus, some groundwater that would discharge to the lake is intercepted, but lake water is not being induced into the aquifer. This withdrawal is not a new stress on the system and should not be a factor on any recent lake water level behavior because the park has been in operation since 1961.
Withdrawals from wells that are completed in the semiconfined sand and gravel or bedrock aquifers were evaluated given the possibility that lake water levels might be affected. However, groundwater flow directions derived from groundwater level elevations and from physical and chemical parameters showed that there was no significant groundwater flow to the south, where most wells drawing from confined aquifers were. The water use estimate (about 1.0 million cubic feet per year of water) shown in figure 28 is added for completeness and to show that its magnitude (a worst case) is small compared with that of seasonal precipitation variability.
Summary.—Increased groundwater withdrawals since 2000 do not contribute to observed lake water level fluctuations. Investigation of the hydrogeology, groundwater use, and water budget of the Moreau Lake area has provided multiple lines of evidence that indicate that increased groundwater pumpage since 2000 has no discernable effect on Moreau Lake water levels. To summarize the evidence:
-
• The primary aquifer with the potential to affect lake water levels is not a single, strongly confined aquifer with limited avenues for recharge, which might result in the propagation of reduced groundwater heads (water levels) toward the lake. Rather, it appears to consist of a few semiconfined aquifer areas with some local unconfined areas. The majority of new wells are 1 to 2 mi from the lake, which makes propagation of pumping stresses unlikely. Limited water level data from wells in this area generally indicate higher water levels toward the mountainside (west) than those to the east, an indication that water from the mountainside, and not Moreau Lake, is the primary source of recharge.
-
• Hydrogeologic cross sections (figs. 11 and 12) depict a confining unit that likely inhibits southward groundwater outflow from Moreau Lake, leaving little aquifer material to flow into. Seismic surveys from Rist-Frost Associates (1969) also indicate the presence of till along the southern and southwestern border of the lake, which may also block or impede groundwater flow.
-
• Groundwater level data and multiple groundwater tracers also indicate that Moreau Lake water flows into the unconfined aquifer to the east-southeast rather than to the south. Groundwater levels and interpreted flow lines, specific conductance differences between the lake and groundwater immediately south, and the absence of evaporated (lake-derived) groundwater immediately south of the lake all indicate that lake-derived groundwater is not flowing to the south. Interpreted groundwater flow lines from water levels, water temperature, and water isotopes all indicate that lake water moves into the aquifer and flows toward discharge areas to the east and southeast.
-
• A lake water level fluctuation of about 6.7 ft recorded at well SA1305 between 2016 and 2020 (fig. 3B) does not correspond to any change in groundwater withdrawal.
-
• Likewise, historic surveyed lake water levels show a 10 ft variation in water level elevation during a period when groundwater use was minimal in the Moreau Lake area (341 ft elevation, Schuylerville 1:62,500 quadrangle map [U.S. Geological Survey, 1900], surveyed 1898; 331 ft elevation, Gansevoort 1:24,000 quadrangle map [U.S. Geological Survey, 1968], surveyed 1964).
-
• Water budget calculations indicate that recent (2015–19) seasonal variations in precipitation greatly exceed any withdrawals from the semiconfined aquifer, which indicates that some aspect of precipitation is the most likely driver of lake water level variations.
Question 2—Do Seasonal Variations in Precipitation Account for Observed Lake-Level Fluctuations?
Annual variations in precipitation did not explain low lake water levels in 2015 and 2016 (fig. 2), so a finer-scale, hydrologically based partition of precipitation was performed. The lake is essentially the exposed water table of the surrounding sand and gravel aquifers (figs. 8, 12, and 18), and its water contributing area is largely a mountainside of the Palmertown Range (fig. 13), which consists of bedrock mantled by a thin veneer of till and colluvium. Water enters the lake from direct precipitation on the lake surface and from upgradient groundwater inflow and surface-water runoff from the mountainside. Water exits the lake through evaporation from the lake surface when it is ice free and through discharge of lake water into the sand and gravel aquifer. There was no observed surface discharge of lake water; a channel exists, but the elevation of the control at the head of the channel is higher than lake water levels measured during this study.
Historic Seasonal Precipitation and Low Lake Water Levels in 2015 and 2016
The amount of precipitation available for groundwater recharge varies during the annual hydrologic cycle (fig. 25). During the growing season, much of the precipitation is taken up by vegetation and transpired back to the atmosphere or evaporated from the land surface; groundwater recharge is sporadic and limited. Vegetation is largely dormant during the nongrowing season, which means more water is available for surface runoff or groundwater recharge from precipitation or during a winter thaw when there is snowmelt. Given this seasonal shift in the water budget, dividing annual precipitation data into growing season (May through October) and nongrowing season (November through April) periods was selected for comparisons with changes in lake water levels.
Seasonal precipitation departures from median values during the past 78 years (1944–2021) indicated several periods largely below or above the median within each season (fig. 29). The most striking period was the 1960s drought: both growing and nongrowing seasons were deficient for 11 years (1961–71), except for the nongrowing season of 1968–69. Reconstructed precipitation records from tree-ring analysis (Pederson and others, 2013) indicated that this drought was the most extreme dry period in the Hudson Valley area since at least 1531 (about 490 years). Other periods that stand out included the consistently wet (both seasons) mid-1970s, wet nongrowing seasons from 1948–49 to 1954–55, wet growing seasons from 2003 to 2013, and dry nongrowing seasons from 2008–09 to 2017–18. Long-term changes included generally wet growing seasons and dry nongrowing seasons since about 2000. The record of precipitation data used covered from 1944 to 2021; however, the growing season record has data for 75 years, and the nongrowing season, for 76 years. The missing data are for nonconsecutive years in the early part of the record.
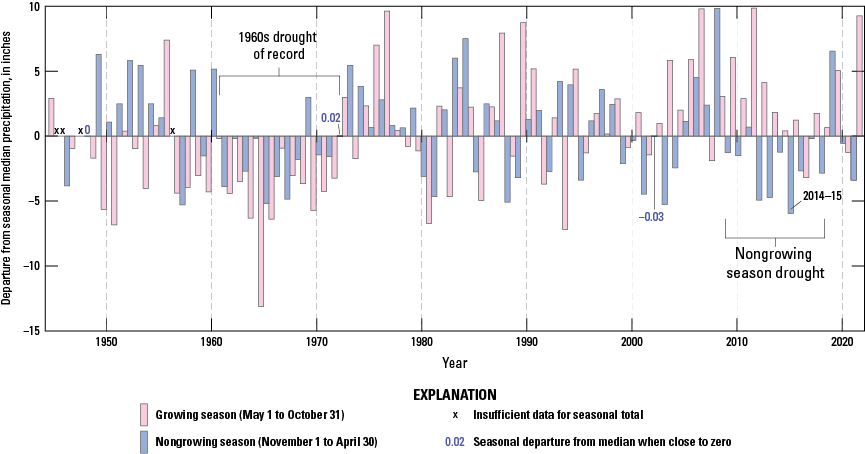
Graph showing departures from seasonal median precipitation, from precipitation measured at the Floyd Bennett Memorial Airport (formerly Warren County Airport) in Glens Falls, New York. Annual precipitation is divided into growing (May 1 to October 31) and nongrowing (November 1 to April 30) season totals for the period of record from 1946 to 2021. The median for the growing season is 20.13 inches and that for the nongrowing season is 16.61 inches. Precipitation data are from Northeast Regional Climate Center (2021).
The low water levels at Moreau Lake in 2015 and 2016 fall within the extended nongrowing season dry period from 2008–09 to 2017–18 and within the most extreme dry period of 2011–12 to 2015–16. This 5-year period is the driest nongrowing season period on record, even exceeding any consecutive 5-year period during the 1960s drought. The 2011–12 to 2015–16 average departure from the nongrowing season median was −3.9 in., whereas the 1962–63 to 1966–67 average departure was −3.2 in. This 2011–12 to 2015–16 period, when lake water levels were at their lowest, was essentially a nongrowing season drought. Recovery from dry nongrowing seasons was limited from 2012–13 to 2017–18 by growing season precipitation totals that were above the median, but not by more than 1.7 in., except in 2016, which was −3.3 in. below the median.
Ranked bar charts of growing and nongrowing season precipitation data provide some perspective for the 2014–15 to 2015–16 period as well as long-term changes in seasonal precipitation since 2000 (fig. 30). The 2014–15 nongrowing season ranks as the driest within the period of record (76 years). This is significant because most replenishment of the local hydrogeologic system is from nongrowing season precipitation. The 2016 growing season was the driest since 1993 (28 years).
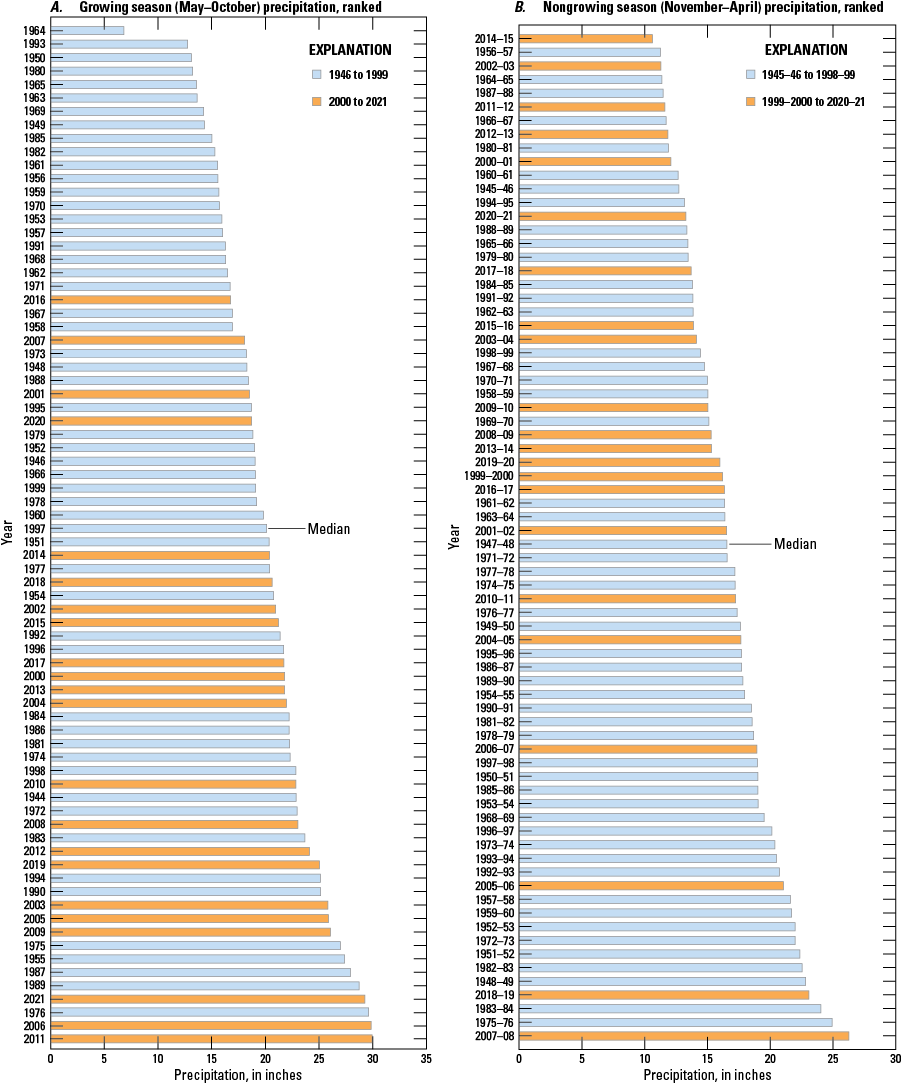
Graphs showing ranked seasonal precipitation totals for the Floyd Bennet Memorial Airport (formerly Warren County Airport) in Glens Falls, New York, for A, growing (May 1 to October 31) and B, nongrowing (November 1 to April 30) seasons for the period of record from 1946 to 2021. Precipitation data are from Northeast Regional Climate Center (2021).
Since 2000, which represents only 28 percent of the precipitation record, 82 percent of growing season precipitation totals have been greater than the median value, an overwhelmingly wet signal. This also includes 50 percent of the top 10 wettest seasons and 75 percent of the top 4 wettest seasons. None of the top 20 driest growing seasons have occurred since 2000.
Nongrowing season precipitation values since 2000 have been below the respective median value 73 percent of the time, but the dry conditions have been punctuated by extremely wet seasons. Along with the 2014–15 nongrowing season being the driest on record, 50 percent of the top 10 driest nongrowing seasons have been since 2000. Two of the top four wettest nongrowing seasons have also been since 2000.
These changes maybe be decadal in nature and not long-term trends. However, regional changes in climatic characteristics have been documented that appear consistent with the findings herein:
-
• A 55 percent increase in the heaviest precipitation was documented between 1958 and 2016 in the northeastern United States (Easterling and others, 2017, fig. 7.4), which is consistent with more frequent organized clusters of summer thunderstorms and an increase in summer precipitation. Pederson and others (2013) also noted an increase in summer precipitation starting in 2003 in the lower Hudson Valley region.
-
• A warming trend across the northeastern United States is indicated by increases in annual growing degree days, referenced to 50 °F (GDD50; U.S. Environmental Protection Agency, undated a). An annual growing degree day total is the sum of all positive values during a given year from the equation:
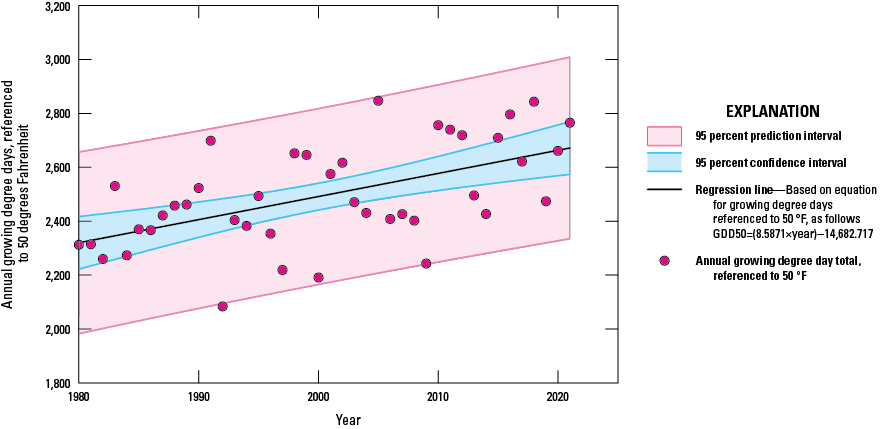
Graph showing annual growing degree day (GDD50) totals, referenced to 50 degrees Fahrenheit (°F), at Moreau Lake, town of Moreau, New York, from 1980 to 2021. Maximum and minimum daily temperatures used to calculate GDD50 from 1-kilometer (0.62-mile) grid tile 11934 (latitude: 43.2307, longitude: −73.7113) are from Thornton and others (2020).
Seasonal Comparison of Continuous Lake Water Level Data (2016–21) With Precipitation Data
Water level data from well SA1305, a surrogate for lake water levels, collected from early July 2016 to the end of 2021 provide a basis for evaluating seasonal precipitation as a driver of lake water level. A comparison of seasonal water level changes at well SA1305 with the seasonal precipitation percent differences from the seasonal medians provides a qualitative picture that makes conceptual sense (fig. 32). Deficits in nongrowing season precipitation correspond to small seasonal lake water level rises, whereas nongrowing season precipitation in excess of the median corresponds to the largest increase in lake water level during the study. During the growing season, a precipitation deficit corresponds to the largest seasonal lake water level decline. Conceptually, water levels in the lake and local aquifer should reflect the balance between water inputs and outputs in the local hydrogeologic system.
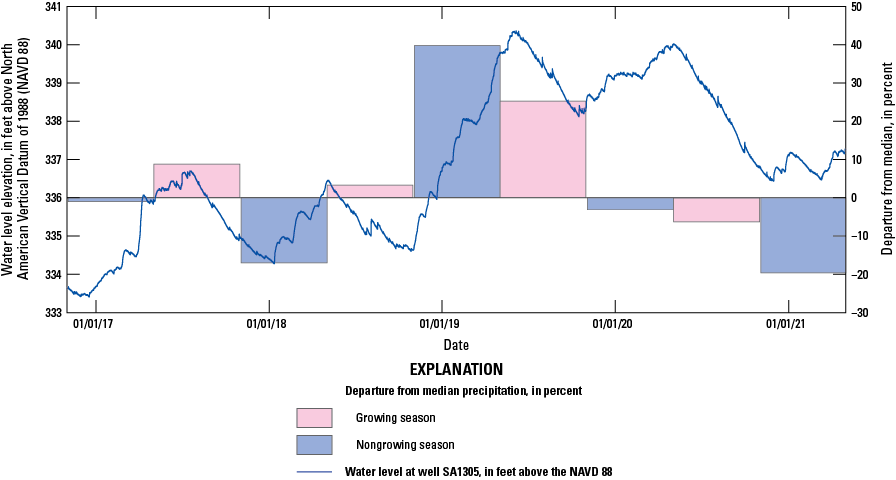
Graph showing lake water levels measured at well SA1305 at Moreau Lake, town of Moreau, New York, and seasonal precipitation departures from respective seasonal precipitation median values as a percentage. Data are from Heisig (2026b).
Plots of seasonal lake water level change as a function of seasonal precipitation departure, in percent, from respective seasonal medians mostly show strong linear-regression relations and conceptual consistency (fig. 33). Precipitation during the nongrowing season always resulted in a proportional positive net water level change at Moreau Lake, although the 2021 season approached no net gain. The relation between the nongrowing season precipitation and the lake water level change shows a strong positive linear relation (with a coefficient of determination [R2] equal to 0.95) from 2017–18 to 2020–21 and the 1968–69 nongrowing season data:
whereΔhNGS
is the nongrowing season lake water level change, in feet, and
PDSPM
is the percent difference from the seasonal precipitation median.
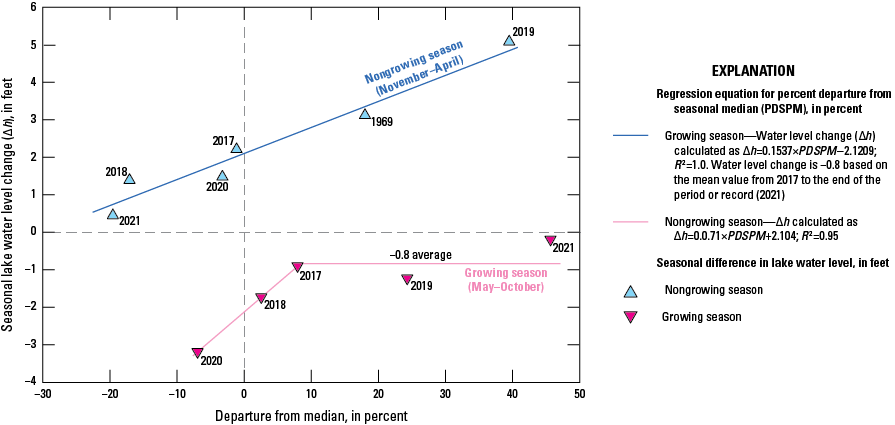
Graph showing regressions of percent departures from growing and nongrowing season precipitation medians with respective growing and nongrowing season lake water level changes, as measured at well SA1305 at Moreau Lake, town of Moreau, New York (except for 1968–69 nongrowing season measurements, which were direct lake water level measurements; Rist-Frost Associates, 1969). Data are from Northeast Regional Climate Center (2021).
Lake water level elevations measured from July 1968 to July 1969 by Rist-Frost Associates (1969) encompassed the full 1969 nongrowing season. The nongrowing season relation is likely as strong as it is because evapotranspiration is very low during this season, such that most precipitation in the contributing area (mostly the mountainside) eventually ends up in the lake or underlying sand and gravel aquifer either from groundwater flow or surface runoff from rainfall events or periods of snowmelt. This relation also indicates that nongrowing season precipitation inputs typically exceed downgradient groundwater losses from the lake and aquifer system.
The relation of lake water level change as a function of growing season precipitation has two parts (fig. 33): (1) a strong positive linear relation when seasonal precipitation is less than or equal to about the +8 percent precipitation departure from the seasonal median and (2) an approximate zero-slope plateau (variable data, but perhaps weakly positive) response at greater than +8 percent departures. During the growing season, water losses increase with warmer temperatures, and groundwater outflows from the lake and aquifer are supplemented by water losses from transpiration from vegetation and increases in evaporation (fig. 25). The seasonal increase in water loss always exceeded precipitation input, resulting in net growing season declines in lake water level during the study period.
The regression equation (R2 = 1.0) for seasons with precipitation less than +8 percent departure from the median is as follows:
whereΔhGS
is the growing season lake water level change, in feet, and
PDSPM
is the percent difference from the seasonal precipitation median.
The scatter is large and data points are too few to generate a meaningful regression. Instead, the water level responses of the three points (years 2017, 2019, and 2021) were averaged (−0.80 ft), and the zero slope (flat) line was added as an approximation of the uncertain but limited response to further increases in growing season precipitation. This response indicates growing season lake-level response is relatively insensitive to precipitation variation from about +8 up to +45 percent departures.
The most likely reason for the minimal or nonresponse of lake levels during growing seasons with precipitation greater than or equal to +8 percent from the seasonal median is the distribution of precipitation within the growing season. Months of deficient rainfall (less than the median) during the months of highest evapotranspiration (May through September; fig. 24) would maximize the negative effect of evapotranspiration on lake level, similar to deficient growing-season precipitation in figure 33. When monthly precipitation of wet growing season years (2017, 2019, and 2021) are plotted over median precipitation values and estimates of potential evapotranspiration (fig. 24), it is evident that monthly rainfall was below median precipitation and below potential evapotranspiration during August and September in 2017 and during July, August, and September in 2019. In 2021, monthly precipitation was above median precipitation and potential evapotranspiration for every month except May, and it was below the higher of the two potential evapotranspiration estimates in August. Thus, the 2021 growing season point on figure 33 is probably the most representative of a typical wet growing season lake level response of the three seasons. The least representative is the 2019 growing season, which was deficient in rainfall during July through September but above median precipitation during May, June, and October. This is consistent with the 2019 growing season point plotting lowest (least positive lake level response) of the three wet growing seasons depicted in figure 33.
Two other factors may cause departures from ideal seasonal conditions: hotter than average growing seasons and disparity between the calendar-defined growing and nongrowing seasons and the start and end of groundwater level recession and recharge hydrologic regimes. Increases in evapotranspiration (transpiration and evaporation) are expected with hotter-than-average temperatures and thus might limit groundwater-level recovery or increase groundwater level declines. Total annual GDD50 is one measure of how hot (or long) a growing season was (fig. 31). However, this effect is subtle or not evident among the wettest growing seasons (2019 and 2021). 2019 was the coolest growing season (lowest GDD50) and 2021 was the second hottest. A more likely factor in the scatter of points about the regression lines (fig. 33) are annual variations in the start and end of hydrologic regimes (periods of groundwater or lake water level recession and recharge) relative to the calendar start and end of the growing season as defined in this report. These periods are evident at well SA1305 at Moreau Lake (fig. 34) and in many groundwater level records where depths to water are not large (less than about 20 ft to water); for local examples, refer to wells SA1285 (U.S. Geological Survey, 2023a) and WR 80 (U.S. Geological Survey, 2023c).
The annual period of groundwater recession generally corresponds to the growing season and is characterized by generally linear declines in water level, which are typically punctuated by minor spikes during rainfalls that, if large enough, result in an upward shift in the recession line that is parallel to the previous one. Exceptions are major summertime rainfall events (organized clusters of thunderstorms), such as those in July and August 2021, that likely resulted in significant runoff from the mountainside, causing sustained rises in water levels (for about 1 week each) before recession resumed.
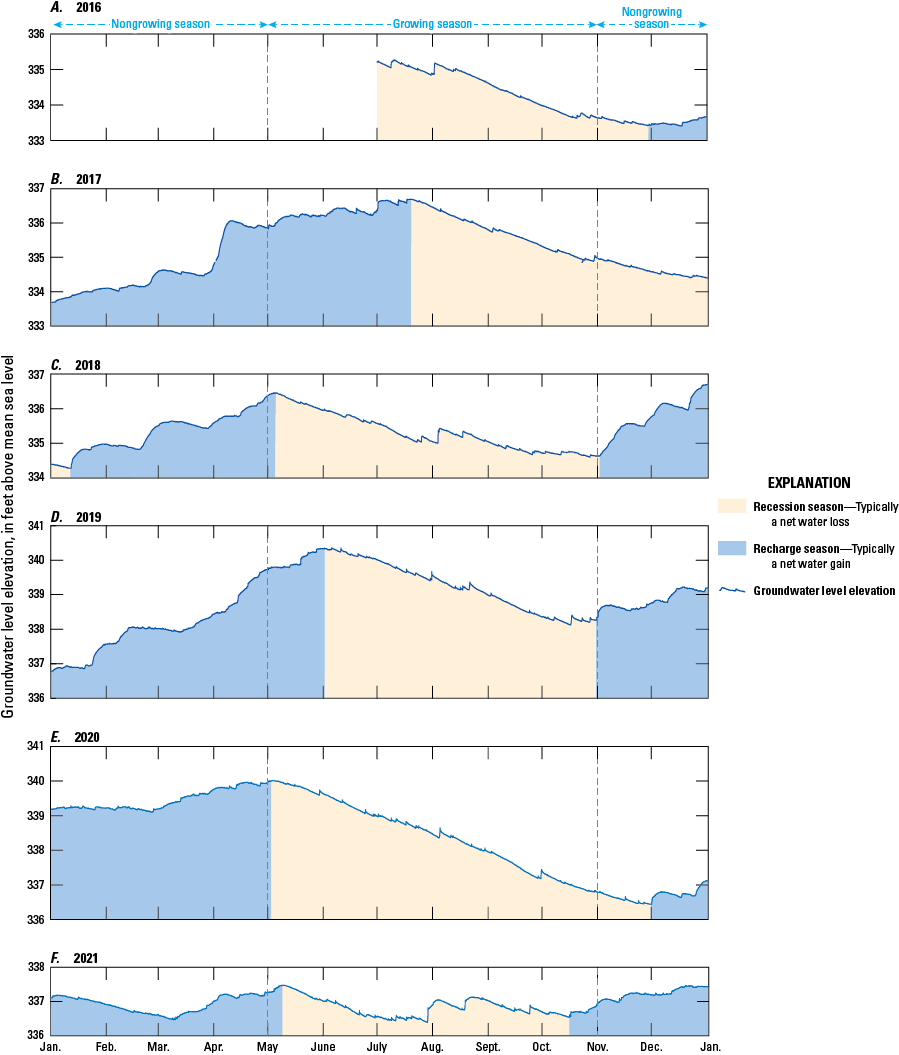
Graphs showing disparity between calendar-defined growing (May through October) and nongrowing (November through April) seasons and recharge and recession hydrologic regimes as indicated by annual hydrographs for the period of record (2016 to 2021) from well SA1305 at Moreau Lake, town of Moreau, New York.
The annual period of recharge generally corresponds to the nongrowing season and is characterized by prolonged, convex upward groundwater level rises followed by much slower recession rates; refer to, for example, 2018 and 2019 (fig. 34C and D). The mountainside adjacent to the lake means that there is a large slope of poorly permeable bedrock that will continue to provide surface runoff and shallow groundwater downslope to the lake or aquifer for an extended time after a rainfall or snowmelt event, which results in a hydrograph peak in the form of a step-up and gradual decline rather than a well-defined peak with steep upward and downward limbs.
Offsets between the start and end of annual recession and recharge hydrologic regimes relative to the growing and nongrowing seasons are evident in figure 34. The start of the recession regime, as observed from 2017 to 2021, was only delayed relative to the assumed May 1 start of the growing season because transpiration from vegetation is a prerequisite for a sustained recession condition. However, recession could potentially be initiated earlier by a lack of precipitation or by a warm spring and early leaf out (early onset of transpiration; U.S. Environmental Protection Agency, undated b). Recession was initiated within a week after the start of the growing season (May 1) in 2018, 2020, and 2021. Delays in recession, however, can be as late as mid-July (as in 2017). Delays are observed in years where regular rainfall during May, June, or even July continues to exceed losses from transpiration and extends the recharge regime. The recharge regime can only start when transpiration has largely ceased and when a rainfall event produces a sustained water-level rise rather than a brief spike. If the recharge regime is offset from the start of the nongrowing season (November 1), it is typically a delay in the start—if there is no significant rainfall or snowmelt, recession conditions will continue. The recharge regime started at the same time as the nongrowing season in 2018 and 2019, but it was delayed by about 1 month in 2016 and 2020; in 2017, it was delayed by more than 2 months into early January 2018. The cause of an early onset of the recharge regime in 2021 was likely related to extremely wet conditions from June to October. As transpiration was ramping down in October, the wet conditions apparently exceeded vegetation needs and allowed recharge to initiate early. First frost was not until late October, so that was not a factor in early onset of the recharge period.
The growing season and nongrowing season precipitation and lake water level relations used here provide a basis for estimating seasonal lake water level changes across the record of precipitation, recognizing that the greatest confidence is within the range of lake water level changes measured during this study. The relations show conceptual consistency (fig. 33). At zero departure from median precipitation (median seasonal precipitation), predicted lake water level changes for the nongrowing (+2.10 ft) and growing season (−2.12 ft) result in no net lake water level change during a full cycle of seasons.
Hindcasts of Lake Water Level Changes at Moreau Lake
The relations between seasonal precipitation and seasonal lake water level changes established in the “Seasonal Comparison of Continuous Lake Water Level Data (2016–21) With Precipitation Data” section of this report provide an opportunity to hindcast seasonal lake water level changes from the 78-year precipitation record. This allows a look at 2015–16 changes that were of concern as well as earlier lake water level behavior. The nongrowing season data used in the regression cover a wide range of lake water level change (0.46 to 5.09 ft), which encompasses most of the estimates, so there is a reasonably high degree of confidence within that range. The growing season relation has two components: a linear negative component, defined between about −1 and −3 ft of lake water level change within about −10 to +8 percent departures from the median precipitation values, and a general stable seasonal decline of about −0.8 ft for precipitation in excess of +8 percent departure from the median. Those relations were used for hindcasting growing season lake water level changes within the stated precipitation ranges. A lower limit for growing season water level declines was needed because applying the linear relation to the precipitation record resulted in seasonal declines that were excessive (7 to 12 ft during 1963–65 in particular) and that were not supported by surveyed lake water levels in 1964, 1968, and 1969.
Measurement and analysis of linear or near-linear lake water level recession rates from 2016 to 2020 were used to constrain the maximum growing season water level declines for hindcast estimates (fig. 35). Recession rates were calculated for 38 periods ranging from 2 to 27 days in length, and the date for each data point is the start date of the respective recession period (Heisig, 2026b). Recession is the result of (1) lake water and groundwater flow toward discharge areas to the east-southeast, (2) evaporation from the lake surface, and (3) transpiration by vegetation from low-elevation areas around the lake shore. Recession rates were compared with the number of days of recession measurement, the starting water level elevation of recession measurement, and the numerical calendar day. The lake water level recession rate as a function of numerical calendar day (fig. 36) shows maximum recession rates increasing early in the season toward a peak rate of 0.03 foot per day in the second half of July, followed by slowly decreasing rates to the end of the season. This pattern matches that of maximum potential evapotranspiration (fig. 24).
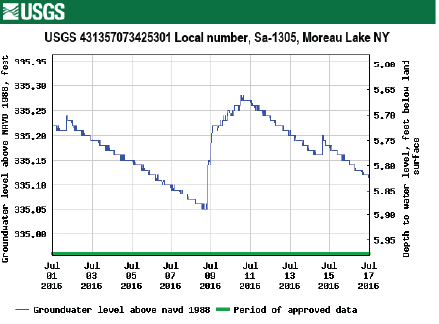
Screen capture of a graph showing linear recession of water levels at well SA1305 at Moreau Lake, town of Moreau, New York, July 1 to July 17, 2016. Figure from U.S. Geological Survey (2022).
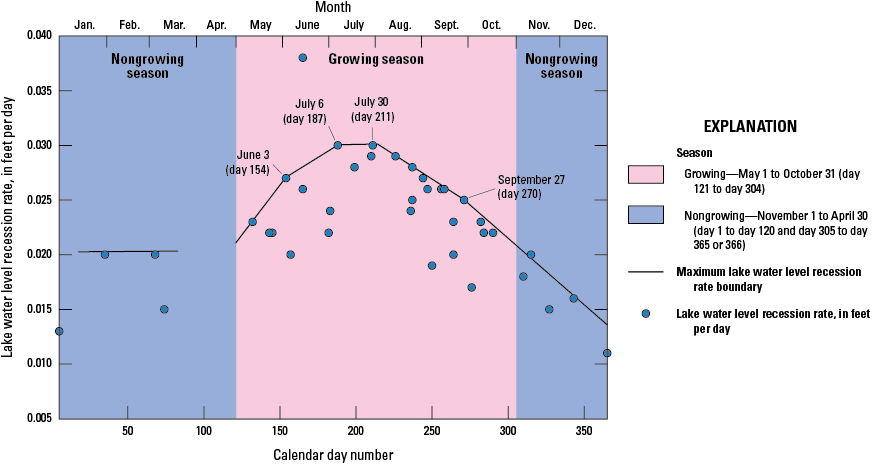
Graph showing lake water level recession rates, calculated from 2016–20 hydrograph from well SA1305 at Moreau Lake, town of Moreau, New York, plotted as a function of calendar day number and month.
The upper bound of recession rates during the growing season was used to calculate a maximum recession amount. Linear segments of maximum recession rates were identified on the well SA1305 hydrograph (fig. 3), and each was averaged to obtain a representative maximum rate that was then multiplied by the number of days in the segment to determine the water level decline. The calculated water level declines were then summed for a seasonal maximum decline total, which is 4.76 ft. This estimate was considered to be a maximum because it assumes no precipitation during the season. This value was applied to the growing season hindcast as the maximum expected growing season decline for any seasonal rainfall amount that resulted in a water level decline estimate greater than 4.76 ft.
The resulting hindcast of seasonal lake water level change during the past 78 years is depicted in figure 37. Nongrowing season lake water level responses generally paralleled nongrowing season precipitation because a single regression relation defined the lake water level response and the data points it was based upon covered a wide range of lake water level fluctuation (fig. 33). The resulting nongrowing season hindcasts were nearly always a rise in lake water level (93 percent). It is notable that the 2014–15 hindcast was the most negative (−0.4 ft) for a nongrowing season during the 76-year period of record.
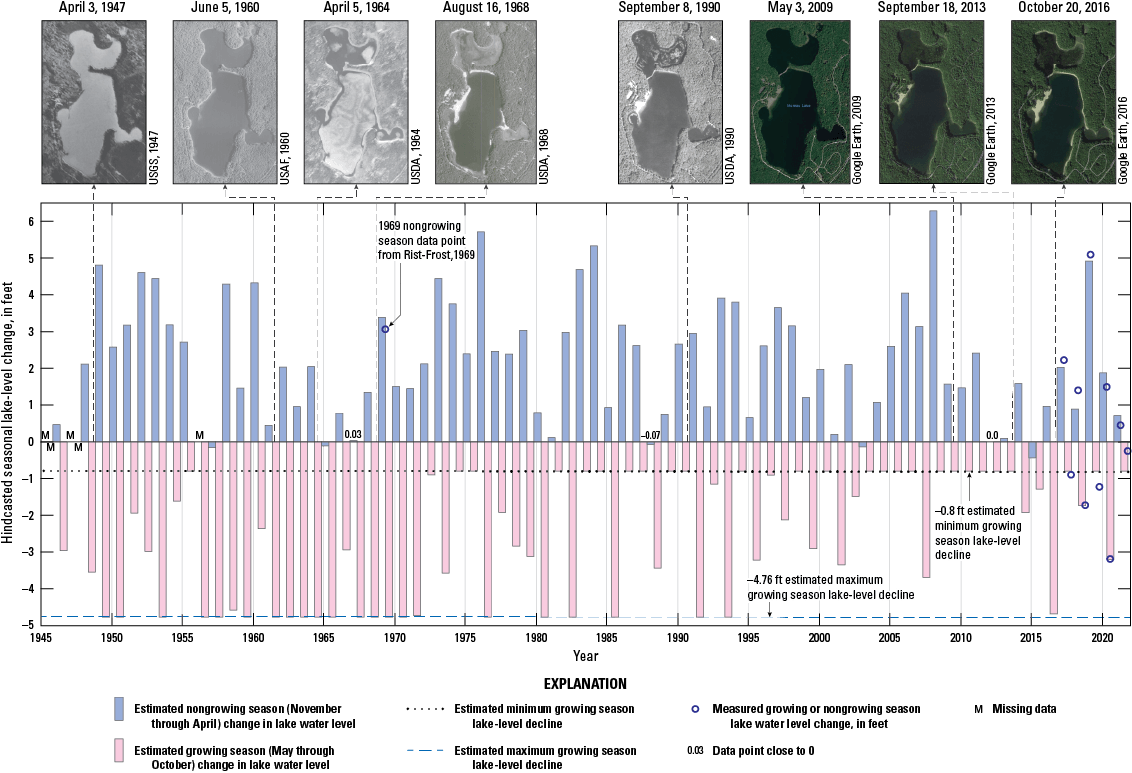
Hindcasts of historic seasonal lake water level changes at Moreau Lake, town of Moreau, New York, from 1946 to 2021 from regression equations derived from 2016–21 data. Historic satellite images of Moreau Lake are included to provide context. Graph data are from Heisig (2026b). USGS, U.S. Geological Survey; USAF, U.S. Air Force; USDA, U.S. Department of Agriculture; ASCS, Agricultural Stabilization and Conservation Service; ft, foot.
The growing season lake water level response (fig. 33), however, departs from growing season precipitation totals because the upper boundary condition (plateau or minor positive response) and steep regression relation (lower boundary) result in lake water level responses that are insensitive (do not proportionally rise) to precipitation inputs +8 percent or greater above the median, but that are very sensitive to deficient seasonal precipitation. As a result, growing season lake water level responses are frequently constrained (censored) at the upper bound (flat response) and at lower bound (too large a response).
The upper bound (minimum) lake water level decline during the growing season plateaus at about −0.8 ft at a low threshold of +8 percent or greater precipitation departure from the seasonal median (fig. 33). From 1946 to 1980, this upper bound was reached 9 percent of the time (three times; fig. 37). From 1981 to 2021, the upper bound was reached 58 percent of the time (23 times). This change indicates generally wetter growing season conditions during the past 40 years than the early part of the period of record.
During dry conditions, the steep slope of the growing season regression relation indicates a greater sensitivity in lake water level response to deficient precipitation than during the nongrowing season (fig. 33). There is a striking difference in the occurrence of dry growing season maximum lake water level declines during the period of record (fig. 37). From 1956 to 1971, when dry growing season conditions prevailed, the maximum seasonal lake water level decline (−4.76 ft) was reached 81 percent of the time. In contrast, this lower bound has not been reached in the past 27 growing seasons (since 1993).
In summary, hindcasts provide estimates of lake water level fluctuations for Moreau Lake during the past 78 years. Nongrowing season lake water level responses basically mirror precipitation inputs, whereas growing season lake water level responses differ, in that (1) lake water levels are more sensitive to dry conditions (decline faster) than during the nongrowing season (these declines are constrained to a maximum seasonal decline [−4.76 ft] in light of historic lake water level data), and (2) lake water levels are insensitive to any inputs wetter than slightly above median precipitation and, specifically, are constrained by a minimum seasonal decline of no higher than −0.80 ft. As a result, the upper bound is frequently reached during wet growing seasons (mostly since 1980). The lower bound is frequently reached during dry growing seasons (from about 1950 to 1971). Last, the nongrowing season hindcast for 2014–15, the period of most recent concern at the lake, indicated a −0.4 ft seasonal lake water level decline, the most negative of the few years with negative net change during the 78-year period of record.
Summary
An investigation of lake water level fluctuation was undertaken at Moreau Lake, in Moreau Lake State Park, town of Moreau, New York, by the U.S. Geological Survey from 2016 to 2021 to determine the cause of low lake water levels that occurred in 2015 and 2016. The low lake water levels did not correlate with annual precipitation data, and two potential causes were hypothesized: (1) groundwater withdrawals from more than 200 new domestic wells drilled for residential development since 2000 might be increasing the seasonal declines in groundwater and lake water levels, particularly if withdrawals are from confined aquifers that potentially have hydraulic connection with the lake, and (2) there may be changes in precipitation other than annual totals, specifically, more hydrologically based growing and nongrowing season totals.
The first task was to begin quantitative monitoring of lake water levels, which had only been monitored from mid-1968 to mid-1969 during a previous study of low lake water levels. A shallow monitoring well (SA1305) was drilled in late spring 2016 on the southwestern shore of the lake as a surrogate for lake water level measurement. The well provided a stable monitoring location not subject to damage from lake ice. Comparison of water level measurements from well SA1305 with direct lake water level measurements showed a median difference of +0.07 foot (ft).
To answer the question of whether or not the increase in groundwater withdrawals from newly (since 2000) drilled nearby domestic wells were causing a decline in lake water levels, greater definition of the following were required: the hydrogeologic framework, aquifer types and extents, groundwater levels and flow directions, aquifer water use, and water budget. Defining the hydrogeologic framework entailed compiling local well logs, developing and regularly measuring a groundwater level network, taking field-parameter measurements, analyzing water isotopes, and carrying out passive seismic surveys.
The basic geologic framework consists of the Palmertown Range, which is the southern edge of the Adirondack Mountains physiographic province and rises about 800 ft above the western side of Moreau Lake, and the Hudson-Mohawk lowland physiographic province to the east. The metamorphic bedrock of the Palmertown Range is largely exposed at land surface with either thin glacial till or regolith (broken up bedrock) where covered. The McGregor fault is the boundary between the two provinces—the Palmertown Range bedrock has moved upward relative to the Hudson-Mohawk lowlands, which consist of less resistant sedimentary rock (mostly shale with some carbonate rock). Unconsolidated, glacial, and postglacial deposits blanket the lowlands. A generally north-south bedrock trough on the eastern side of Moreau Lake is completely filled by as much as 380 ft of sediment. The major surficial geologic deposits of the lowlands include extensive lacustrine sands ranging in thickness from 40 to 120 ft to the north and east of Moreau Lake, ice-contact sand and gravel deposits as much as 80 ft in thickness along the base of the Palmertown Range, and lacustrine silt and clay or glacial till deposits from 30 to 90 ft thick farther to the east. Moreau Lake is a kettle lake that was formed within the ice-contact deposits where an ice block was detached from retreating glacial ice, was partly buried by sediment, and later melted, leaving a depression that was lower than the surrounding water table.
The hydrogeologic system is characterized by an extensive unconfined aquifer, a semiconfined aquifer, and a few confined aquifer areas. The unconfined aquifer exists within the lacustrine sands north and northeast of Moreau Lake and at certain locales (including near Moreau Lake) within the ice-contact deposits where saturated thickness is sufficient for water withdrawal. The semiconfined aquifer extends southward about 2 miles from Moreau Lake and is characterized by localized lacustrine sediment and till confining units and some adjacent unconfined areas. Confined aquifer settings include very deep (greater than 250 ft) confined fractured bedrock or sand and gravel deposits in the bedrock trough area and fractured bedrock (or occasional sand and gravel) confined by fine-grained lacustrine sediments or till to the east of Moreau Lake where lacustrine sands are thin or absent. Since 2000, most new domestic wells have been drilled and completed in the semiconfined and unconfined aquifers. The effects of groundwater withdrawals from the unconfined aquifer are localized and far outside of the park and therefore do not affect lake water levels. Withdrawals from the semiconfined aquifer are mostly 1.5 to 2 miles from the lake. If the confining units are discontinuous, it is less likely that reduced water levels from withdrawals would propagate towards Moreau Lake. Water use from confined settings near Moreau Lake is limited to several deep wells producing insignificant amounts of groundwater pumpage.
Groundwater level measurements at a small network of wells, at Moreau Lake, and from historic (well log) data from the unconfined and semiconfined aquifers were used to construct a water table map for high water level conditions in spring 2019. Water level contours and groundwater flow lines indicated largely eastward flow from the base of the Palmertown Range and discharge at springs or subsurface seepage into stream headwater channels east of Moreau Lake. The water table is highest in the lake plain north of Moreau Lake such that there is a southward component of groundwater flow toward Moreau Lake.
Groundwater levels immediately south of Moreau Lake were a little lower than the lake, which left open the possibility that some lake water might be moving in that direction, which is in the direction of greatest water use in the semiconfined aquifer. However, a closer look at groundwater flow lines near the lake, groundwater and lake water measurements of temperature, specific conductance, and water isotopes, and the geometry of the confining unit just south of the lake provides multiple lines of evidence that lake water does not move southward into the groundwater system, but rather to the east-southeast toward discharge areas.
Annual water use estimates from the semiconfined aquifer (total and since 2000) and seasonal precipitation variations from 2015 to 2019 were calculated to compare the magnitude of natural input variations to groundwater pumpage within the water budget. Nongrowing and growing season precipitation variations during 2015–19 were about 25 times and 16 times greater, respectively, than total and post-2000 semiconfined aquifer withdrawals. Thus, multiple lines of evidence conclusively show that Moreau Lake water levels are not affected by increases in groundwater withdrawals since 2000 and that lake water flows into the adjacent groundwater system toward the east and southeast.
A more detailed evaluation of precipitation inputs to the groundwater and lake system entailed classification of precipitation and lake water level data into equal 6-month, hydrologically based growing (May through October) and nongrowing (November through April) seasons. When plotted using this seasonal division, it became clear that low lake water levels in 2015 and 2016 were associated with dry nongrowing seasons. In fact, 2014–15 was the driest nongrowing season on record (76 years). Ranked plots also showed longer term shifts in precipitation. Despite relatively stable annual precipitation, nongrowing seasons have become drier, but punctuated with extremely wet seasons, and growing seasons have become wetter in recent years, presumably from more convective storms (thunderstorms), a trend that has been documented regionally.
With the availability of several years of lake water level data, comparisons were made with seasonal precipitation data. A plot of the seasonal gain or loss of lake water level, in feet, as a function of seasonal precipitation departure from respective seasonal median, in percent, showed clear relations for each season. Nongrowing season water level rise was positively correlated with seasonal precipitation (R2=0.95) from 6 years of data, and each year showed lake water level gains. The growing season relation had two parts, but the net seasonal change was always negative. First, there was a steep positive correlation (R2=1.0) from 3 years of data: below about +8 percent departure from median growing season precipitation, the drier the conditions, the greater the negative change in lake water level. Secondly, for growing season precipitation greater than +8 percent departure, the response appeared to plateau or slightly increase—three points averaged about a −0.8 ft decrease in lake water level, which is best explained by monthly within-season rainfall deficits or excesses during the months with the highest potential evapotranspiration (June through September). The net result is that, in the nongrowing season, more precipitation resulted in a predictably greater rise in lake water level. In the growing season, under dry conditions, lake water level is more sensitive to a lack of precipitation than during the nongrowing season and drops rapidly. However, under wet conditions, lake water level is insensitive to increases in precipitation, and the response generally plateaued. In effect, wet summer periods did not replenish water levels, but only limited net seasonal losses to about −0.8 ft. The net result was that wet nongrowing seasons were the only means of significant water level recovery or maintenance at Moreau Lake.
Development of these relations then allowed estimates of seasonal lake water level changes to be made from historic seasonal precipitation records with some constraints: wet growing seasons could not have seasonal lake water level declines greater than −0.8 ft. Growing season declines during very dry years (well below the range of data used to develop the relation) resulted in large declines that were not borne out by surveyed lake water level (1964) or by satellite imagery. Thus, a lower limit was needed. Analysis of recession rates (primarily during the growing season) by calendar day resulted in the compilation of maximum possible rates during the season, which were used to calculate a maximum seasonal decline in lake water level (−4.76 ft). Hindcasts of seasonal rises or losses of Moreau Lake were then calculated for 1946 to 2021. The results showed that the 2014–15 nongrowing season was so dry that lake water level dropped by about 0.4 ft. Only 5 years had calculated nongrowing season declines, and 2014–15 was by far the greatest decline, which explains why lake water levels were so low during 2015–16. In addition, the results highlighted persistent large growing season lake water level declines (dry conditions) from 1946 through 1971 and persistent minimal growing season declines (wet conditions) since about 1981.
References Cited
Barksdale, H.C., 1968, The northeast water supply crisis of the 1960’s: U.S. Geological Survey, 14 p. [Also available at https://doi.org/10.3133/70039594.]
Burnett, A.W., Mullins, H.T., and Patterson, W.P., 2004, Relationship between atmospheric circulation and winter precipitation δ18O in central New York State: Geophysical Research Letters, v. 31, no. 22, paper L22209, 4 p., accessed December 21, 2022, at https://doi.org/10.1029/2004GL021089.
Cadwell, D.H., and Dineen, R.J., 1980–88, Surficial geologic maps of the Gansevoort, Mechanicville, Middle Grove, Niskayuna, Round Lake, Quaker Springs, Saratoga Springs, and Troy North 7.5-minute quadrangles: Albany, N.Y., New York State Geological Survey open-file maps, scale 1:24,000. [Maps were republished in USGS Water-Resources Investigations Report 93–4029, available at https://doi.org/10.3133/wri934029.]
Chadwick, G.H., 1928, Ice evacuation stages at Glens Falls, New York: Geological Society of America Bulletin, v. 39, no. 4, p. 901–922. [Also available at https://doi.org/10.1130/GSAB-39-901.]
Colman, J.A., and Friesz, P.J., 2001, Geohydrology and limnology of Walden Pond, Concord, Massachusetts: U.S. Geological Survey Water-Resources Investigations Report 2001–4137, 61 p. [Also available at https://doi.org/10.3133/wri014137.]
Cook, E.R., and Jacoby, G.C., Jr., 1977, Tree-ring-drought relationships in the Hudson Valley, New York: Science, v. 198, no. 4315, p. 399–401. [Also available at https://doi.org/10.1126/science.198.4315.399.]
Craig, H., 1961, Isotopic variations in meteoric waters: Science, v. 133, no. 3465, p. 1702–1703. [Also available at https://doi.org/10.1126/science.133.3465.1702.]
Dieter, C.A., Maupin, M.A., Caldwell, R.R., Harris, M.A., Ivahnenko, T.I., Lovelace, J.K., Barber, N.L., and Linsey, K.S., 2018, Estimated use of water in the United States in 2015: U.S. Geological Survey Circular 1441, 65 p., accessed December 12, 2022, at https://doi.org/10.3133/cir1441. [Supersedes USGS Open-File Report 2017–1131.]
DeSimone, D.J., and LaFleur, R.G., 1985, Glacial geology and history of the northern Hudson basin, New York and Vermont, in Lindemann, R.H., ed., New York State Geological Association 57th Annual Meeting, Saratoga Springs, N.Y., September 27–29, 1985, Field Trip Guidebook: Saratoga Springs, N.Y., New York State Geological Association, p. 82–116. [Also available at https://ottohmuller.com/nysga2ge/Files/1985.]
Easterling, D.R., Kunkel, K.E., Arnold, J.R., Knutson, T., LeGrande, A.N., Leung, L.R., Vose, R.S., Waliser, D.E., and Wehner, M.F., 2017, Precipitation change in the United States, chap. 7 of Wuebbles, D.J., Fahey, D.W., Hibbard, K.A., Dokken, D.J., Stewart, B.C., and Maycock, T.K., eds., Climate science special report—Fourth national climate assessment: U.S. Global Change Research Program, v. I, p. 207–230, accessed January 19, 2022, at https://doi.org/10.7930/J0H993CC.
Federal Emergency Management Agency, 2012, Hudson-Hoosic lidar, in Federal high resolution DEM: Federal Emergency Management Agency data, accessed July 15, 2016, at https://gis.ny.gov/nys-dem.
Fisher, D.W., Isachsen, Y.W., and Rickard, L.V., 1970, Geologic map of New York state: New York State Museum and Science Service Map and Chart Series 15, 5 sheets, scale 1:250,000. [Also available at https://www.nysm.nysed.gov/sites/default/files/mc15_geologicmapofnewyork.pdf.]
Friends of Moreau Lake State Park, Inc., 2023, About the park: Friends of Moreau Lake State Park, Inc. web page, accessed January 9, 2024, at https://friendsofmoreaulake.org/about-the-park/.
Friesz, P.J., and Church, P.E., 2001, Pond-aquifer interaction at South Pond of Lake Cochituate, Natick, Massachusetts: U.S. Geological Survey Water-Resources Investigation Report 01–4040, 42 p. [Also available at https://doi.org/10.3133/wri014040.]
Geraghty, E.P., and Isachsen, Y.W., 1980, Investigation of the McGregor-Saratoga-Ballston Lake fault system—East central New York: Nuclear Regulatory Commission Contractor Report CR–1866, 44 p. [Also available at https://ntrl.ntis.gov/NTRL/dashboard/searchResults/titleDetail/NUREGCR1866.xhtml.]
Heisig, P.M., 1994, Generalized stratigraphy, surficial geology, types of aquifers, and 1988–89 ground-water pumpage in eastern Saratoga County, New York: U.S. Geological Survey Water-Resources Investigations Report 93–4029, 16 p., 8 pl., accessed February 11, 2020, at https://doi.org/10.3133/wri934029.
Heisig, P.M., 2026a, Geospatial data from the Moreau Lake area, town of Moreau, N.Y.: U.S. Geological Survey data release, https://doi.org/10.5066/P9JPZ1R5.
Heisig, P.M., 2026b, Hydrologic data from the Moreau Lake area, town of Moreau, N.Y.: U.S. Geological Survey data release, https://doi.org/10.5066/P9K0LSHJ.
Heisig, P.M., and Fleisher, P.J., 2022, Glacial geology and hydrogeology of valley-fill aquifers in the Oneonta area, Otsego and Delaware Counties, New York: U.S. Geological Survey Scientific Investigations Report 2022–5069, 35 p., 1 pl., accessed February 11, 2020, at https://doi.org/10.3133/sir20225069.
Heisig, P.M. and Sporleder, B.A., 2026, Horizontal-to-vertical spectral ratio (HVSR) soundings and depth-to-bedrock data for the Moreau Lake area, town of Moreau, N.Y.: U.S. Geological Survey data release, https://doi.org/10.5066/P9R49VRO.
HomeTownLocator, 2020, Neighborhood locator, July 1, 2020, census block group 360910601.013: New York Gazetteer, accessed 2020 at https://newyork.hometownlocator.com/maps/address/neighborhood-explorer.
LaFleur, R.G., 1965, Glacial lake sequences in the eastern Mohawk-northern Hudson region, in Hewitt, P.C. and Hall, L.M., eds., New York State Geological Association 37th Annual Meeting, Schenectady, N.Y., April 30–May 2, 1965, Field Trip Guidebook: Schenectady, N.Y., New York State Geological Association, p. C1–C23. [Also available at https://ottohmuller.com/nysga2ge/Files/1965/NYSGA%201965%20Schenectady%20bookmarked.pdf.]
Lane, J.W., White, E.A., Steele, G.V., and Cannia, J.C., 2008, Estimation of bedrock depth using the horizontal-to-vertical (H/V) ambient-noise seismic method, in Proceedings, 21st EEGS Symposium on the Application of Geophysics to Engineering and Environmental Problems, Philadelphia, Pa., April 6–10, 2008: Denver, Colo., Environmental and Engineering Geophysical Society, 13 p., accessed November 29, 2017, at https://doi.org/10.3997/2214-4609-pdb.177.170.
New York State Department of Environmental Conservation, 2022, DECinfo locator—Water wells data layer: New York State Department of Environmental Conservation data, accessed January 2022, at https://gisservices.dec.ny.gov/gis/dil/.
New York State Office of Parks, Recreation and Historic Preservation, 2006, Environmental setting, chap. 2 of Moreau Lake State Park: New York State Office of Parks, Recreation and Historic Preservation final master plan/final environmental statement, p. 23–102, accessed July 7, 2023, at https://www.parks.ny.gov/inside-our-agency/master-plans.aspx.
Nimmo, J.R., Horowitz, C., and Mitchell, L., 2015, Discrete-storm water table fluctuation method to estimate episodic recharge: Ground Water, v. 53, no. 2, p. 282–292. [Also available at https://doi.org/10.1111/gwat.12177.]
Northeast Regional Climate Center, 2021, Northeast RCC CLIMOD 2: National Oceanic and Atmospheric Administration Northeast Regional Climate Center database, accessed December 15, 2021, at http://climod2.nrcc.cornell.edu/.
Pederson, N., Bell, A.R., Cook, E.R., Lall, U., Devineni, N., Seager, R., Eggleston, K., and Vranes, K.P., 2013, Is an epic pluvial masking the water insecurity of the greater New York City region?: Journal of Climate, v. 26, no. 4, p. 1339–1354. [Also available at https://doi.org/10.1175/JCLI-D-11-00723.1.]
Randall, A.D., 1996, Mean annual runoff, precipitation, and evapotranspiration in the glaciated northeastern United States, 1951–80: U.S. Geological Survey Open-File Report 96–395, 2 pls. [Also available at https://doi.org/10.3133/ofr96395.]
Révész, K., and Coplen, T.B., 2008a, Determination of the snake(2H/1H) of water—RSIL lab code 1574, chap. C1 of Révész, K., and Coplen, T.B., eds., Methods of the Reston Stable Isotope Laboratory: U.S. Geological Survey Techniques and Methods, book 10, chap. C1, 27 p. [Also available at https://doi.org/10.3133/tm10C1.]
Révész, K., and Coplen, T.B., 2008b, Determination of the δ(180/160) of water—RSIL lab code 489, chap. C2 of Révész, K., and Coplen, T.B., eds., Methods of the Reston Stable Isotope Laboratory: U.S. Geological Survey Techniques and Methods, book 10, chap. C2, 28 p. [Also available at https://doi.org/10.3133/tm10C2.]
Ridge, J.C., 2003, The last deglaciation of the northeastern United States—A combined varve, paleomagnetic, and calibrated 14C chronology, chap. 3 of Cremeens, D.L., and Hart, J.P., eds., Geoarchaeology of landscapes in the glaciated northeast: New York State Museum Bulletin 497, p. 15–45. [Also available at https://nysl.ptfs.com/aw-server/rest/product/purl/NYSL/f/cc34d1bb-23d3-489b-99d3-6e654cdcb844.]
Ridge, J.C., 2012, The North American glacial varve project: Tufts University web page, accessed March 2022 at https://eos.tufts.edu/varves.
Saratoga County, 2016, Saratoga County, NY, parcel viewer: Saratoga County geographic information system data, accessed 2017 at https://spatial.vhb.com/SaratogaMapViewer/. [Water data retrieved from tax parcel data.]
Shaffer, K.H., and Runkle, D.L., 2007, Consumptive Water use coefficients for the Great Lakes basin and climatically similar areas: U.S. Geological Survey Scientific Investigations Report 2007–5197, 191 p. [Also available at https://doi.org/10.3133/sir20075197.]
Stichler, W., and Moser, H., 1979, An example of exchange between lake and groundwater, in Isotopes in lake studies—Proceedings of an advisory group meeting, Vienna, Austria, August 29–September 2, 1977: Vienna, Austria, International Atomic Energy Agency, p. 115–119. [Also available at https://www-naweb.iaea.org/napc/ih/documents/IAEA%20Monographs/STI%20511%20Isotopes%20in%20Lake%20studies%201979.PDF]
Tice, S.J., 1993, A paleoseismic investigation of the McGregor fault, east-central New York: State University of New York at Albany master’s thesis, 138 p. [Also available at https://scholarsarchive.library.albany.edu/cas_daes_geology_etd/92/.]
Thornton, M.M., Shrestha, R., Wei, Y., Thornton, P.E., Kao, S., and Wilson, B.E., 2020, Daymet—Daily surface weather data on a 1-km grid for North America, version 4: Oak Ridge National Laboratory, Distributed Active Archive Center for Biogeochemical Dynamics dataset, accessed December 7, 2022, at https://doi.org/10.3334/ORNLDAAC/1840.
Thornthwaite, C.W., 1948, An approach toward a rational classification of climate: The Geographical Review, v. 38, no. 1, p. 55–94. [Also available at https://doi.org/10.2307/210739.]
U.S. Environmental Protection Agency, [undated] a, Climate change indicators—Growing degree days: U.S. Environmental Protection Agency web page, accessed December 7, 2022, at https://www.epa.gov/climate-indicators/climate-change-indicators-growing-degree-days.
U.S. Environmental Protection Agency, [undated] b, Climate change indicators—Leaf and bloom dates: U.S. Environmental Protection Agency web page, accessed December 12, 2022, at https://www.epa.gov/climate-indicators/climate-change-indicators-leaf-and-bloom-dates.
U.S. Geological Survey, 1900, Schuylerville, New York, 7.5-minute quadrangle: U.S. Geological Survey topographic map, scale 1:62,500. [Also available at https://www.sciencebase.gov/catalog/item/5a8a34c6e4b00f54eb3da127.]
U.S. Geological Survey, 1968, Gansevoort, New York, 7.5-minute quadrangle: U.S. Geological Survey topographic map, scale 1:62,500. [Also available at https://www.sciencebase.gov/catalog/item/646d55b6d34ee02593fb534e.]
U.S. Geological Survey, 2022, USGS water data for the nation: U.S. Geological Survey National Water Information System database, accessed May 23, 2022, at https://doi.org/10.5066/F7P55KJN.
U.S. Geological Survey, 2023a, Local number SA–1285, Clifton Park NY—425048073472501: U.S. Geological Survey National Water Information System database, accessed May 23, 2022, at https://doi.org/10.5066/F7P55KJN. [Site-specific data available at https://waterdata.usgs.gov/monitoring-location/425048073472501/#parameterCode=72019&period=P365D.]
U.S. Geological Survey, 2023b, Local number SA–1305, Moreau Lake NY—431357073425301: U.S. Geological Survey National Water Information System database, accessed May 23, 2022, at https://doi.org/10.5066/F7P55KJN. [Site-specific data available at https://waterdata.usgs.gov/monitoring-location/431357073425301/#parameterCode=62611&period=P7D.]
U.S. Geological Survey, 2023c, Local number WR–80, Warrensburg NY—433001073474701: U.S. Geological Survey National Water Information System database, accessed May 23, 2022, at https://doi.org/10.5066/F7P55KJN. [Site-specific data available at https://waterdata.usgs.gov/monitoring-location/433001073474701/#parameterCode=72019&period=P365D.]
U.S. Geological Survey, [variously dated], National field manual for the collection of water quality data: U.S. Geological Survey Techniques of Water-Resources Investigations, book 9, chaps. A1–A9, [variously paged], accessed May 23, 2017, at https://www.usgs.gov/mission-areas/water-resources/science/national-field-manual-collection-water-quality-data-nfm.
Weeks, E.P., 2005, The Lisse effect revisited: Groundwater, v. 40, no. 6, p. 652–656, accessed July 31, 2023, at https://doi.org/10.1111/j.1745-6584.2002.tb02552.x.
Zang, Y.G., Sun, D.M., Feng, P., and Semprich, S., 2017, Effects of airflow induced by rainfall on shallow groundwater table fluctuations: Ground Water, v. 55, no. 3, p. 375–386. [Also available at https://doi.org/10.1111/gwat.12486.]
Conversion Factors
Datums
Vertical coordinate information is referenced to the North American Vertical Datum of 1988 (NAVD 88).
Horizontal coordinate information is referenced to the North American Datum of 1983 (NAD 83).
Elevation, as used in this report, refers to distance above the vertical datum.
Supplemental Information
Specific conductance is given in microsiemens per centimeter at 25 degrees Celsius (µS/cm).
Concentrations of chemical constituents in water are given in either milligrams per liter (mg/L) or micrograms per liter (µg/L).
Seasonal variations are measured on the basis of two equal, 6-month seasons: a nongrowing season (November through April) and a growing season (May through October).
Results for measurements of stable isotopes of an element (with symbol E) in water, solids, and dissolved constituents commonly are expressed as the relative difference in the ratio of the number of the less abundant isotope (iE) to the number of the more abundant isotope of a sample with respect to a measurement standard.
For more information, contact:
Director, New York Water Science Center
U.S. Geological Survey
425 Jordan Road
Troy, NY 12180–8349
dc_ny@usgs.gov
or visit our website at
https://www.usgs.gov/centers/ny-water
Publishing support provided by the
USGS Science Publishing Network,
Pembroke Publishing Service Center
Disclaimers
Any use of trade, firm, or product names is for descriptive purposes only and does not imply endorsement by the U.S. Government.
Although this information product, for the most part, is in the public domain, it also may contain copyrighted materials as noted in the text. Permission to reproduce copyrighted items must be secured from the copyright owner.
Suggested Citation
Heisig, P.M., 2026, Hydrologic investigation of water level fluctuations at Moreau Lake, Moreau Lake State Park, town of Moreau, New York: U.S. Geological Survey Scientific Investigations Report 2026–5132, 55 p., https://doi.org/10.3133/sir20265132.
ISSN: 2328-0328 (online)
Study Area
| Publication type | Report |
|---|---|
| Publication Subtype | USGS Numbered Series |
| Title | Hydrologic investigation of water level fluctuations at Moreau Lake, Moreau Lake State Park, town of Moreau, New York |
| Series title | Scientific Investigations Report |
| Series number | 2026-5132 |
| DOI | 10.3133/sir20265132 |
| Publication Date | April 29, 2026 |
| Year Published | 2026 |
| Language | English |
| Publisher | U.S. Geological Survey |
| Publisher location | Reston, VA |
| Contributing office(s) | New York Water Science Center |
| Description | Report: viii, 55 p., 3 Data Releases |
| Country | United States |
| State | New York |
| Other Geospatial | Moreau Lake, Moreau Lake State Park, Town of Moreau |
| Online Only (Y/N) | Y |
| Additional Online Files (Y/N) | N |