

Escherichia coli Monitoring and Assessment in 2022 and 2023 After Beach Restoration at Lake St. Clair Metropark Beach, Macomb County, Michigan
Links
- Document: Report (4.13 MB pdf) , HTML , XML
- Dataset: USGS water data for the Nation U.S. Geological Survey National Water Information System database
- Data Release: USGS data release - Water flux and avian species data at Lake St. Clair Metropark in Macomb County, Michigan, collected during recreational seasons of 2021, 2022, and 2023
- NGMDB Index Page: National Geologic Map Database Index Page (html)
- Download citation as: RIS | Dublin Core
Acknowledgments
This study was done in cooperation with the Michigan Department of Environment, Great Lakes, and Energy. Support was provided by the Huron-Clinton Metroparks staff and the Macomb County Health Department.
We thank all the U.S. Geological Survey employees who provided technical, analytical, and editorial support for the study and this report.
Abstract
Lake St. Clair Metropark Beach in Michigan has a history of closures because of elevated Escherichia coli (E. coli) concentrations in its recreational waters. To reduce closures, restoration projects were implemented in 2021 to deter waterfowl from congregating on the beach. In this study, the U.S. Geological Survey, in cooperation with the Michigan Department of the Environment, Great Lakes, and Energy and in collaboration with Huron-Clinton Metroparks and the Macomb County Health Department, monitored E. coli from 2022–23 in surface water, shallow groundwater, and sediment at Lake St. Clair Metropark Beach. Results were compared to data from a prerestoration (2018–19) study. A significant decrease in daily geometric mean E. coli concentrations in surface water was observed postrestoration, but the number of high concentration events increased. This resulted in more frequent beach closures postrestoration. Surface-sediment E. coli concentrations significantly decreased after restoration, and waterfowl populations generally decreased from 2021 to 2023, suggesting that the deterrence measures could be influencing E. coli concentrations in surface sediments and surface water. Groundwater E. coli concentrations were orders of magnitude higher than those in surface water and revealed no change correlated with restoration. Seepage measurements indicated that groundwater occasionally discharges into surface water, potentially providing a transport mechanism for E. coli to reach the lake. Continued monitoring and consideration of environmental factors could help to better understand the beach system.
Introduction
The Clinton River drainage basin in southeastern Michigan was designated as an Area of Concern (AOC) in the 1980s by the International Joint Commission United States and Canada (1987). An AOC is a geographic area within the Great Lakes region that has been highly degraded by one or more of 14 beneficial use impairments (BUIs; International Joint Commission United States and Canada, 1987). These BUIs may be caused by contaminants from nonpoint urban and rural runoff or point sources including combined sewer overflows, municipal and industrial discharges, or contaminated sediments (Michigan Department of Natural Resources, 1988).
The Clinton River AOC encompasses the entire Clinton River drainage basin and nearshore areas of Lake St. Clair that are affected by discharge from the Clinton River mouth (fig. 1). Lake St. Clair Metropark Beach is roughly 3 miles west of the Clinton River mouth in Macomb County, Michigan, and is included in the Clinton River AOC because of high Escherichia coli (E. coli) concentrations in its recreational waters and frequent beach closures (U.S. Environmental Protection Agency, 2024). Beach closures are one of the 14 BUIs that categorize an AOC; therefore, because of its proximity to the Clinton River drainage basin, Lake St. Clair Metropark Beach is included in the Clinton River AOC. Beach managers make decisions on beach advisories and closures based on fecal indicator bacteria concentrations, including E. coli and enterococci, in their recreational waters of interest (U.S. Environmental Protection Agency, 2023). These closures and advisories are put in place to protect public health from disease-causing microorganisms (pathogenic bacteria, viruses, and protozoa) that are alongside E. coli in fecal waste and cause waterborne disease outbreaks (U.S. Environmental Protection Agency, 2012).
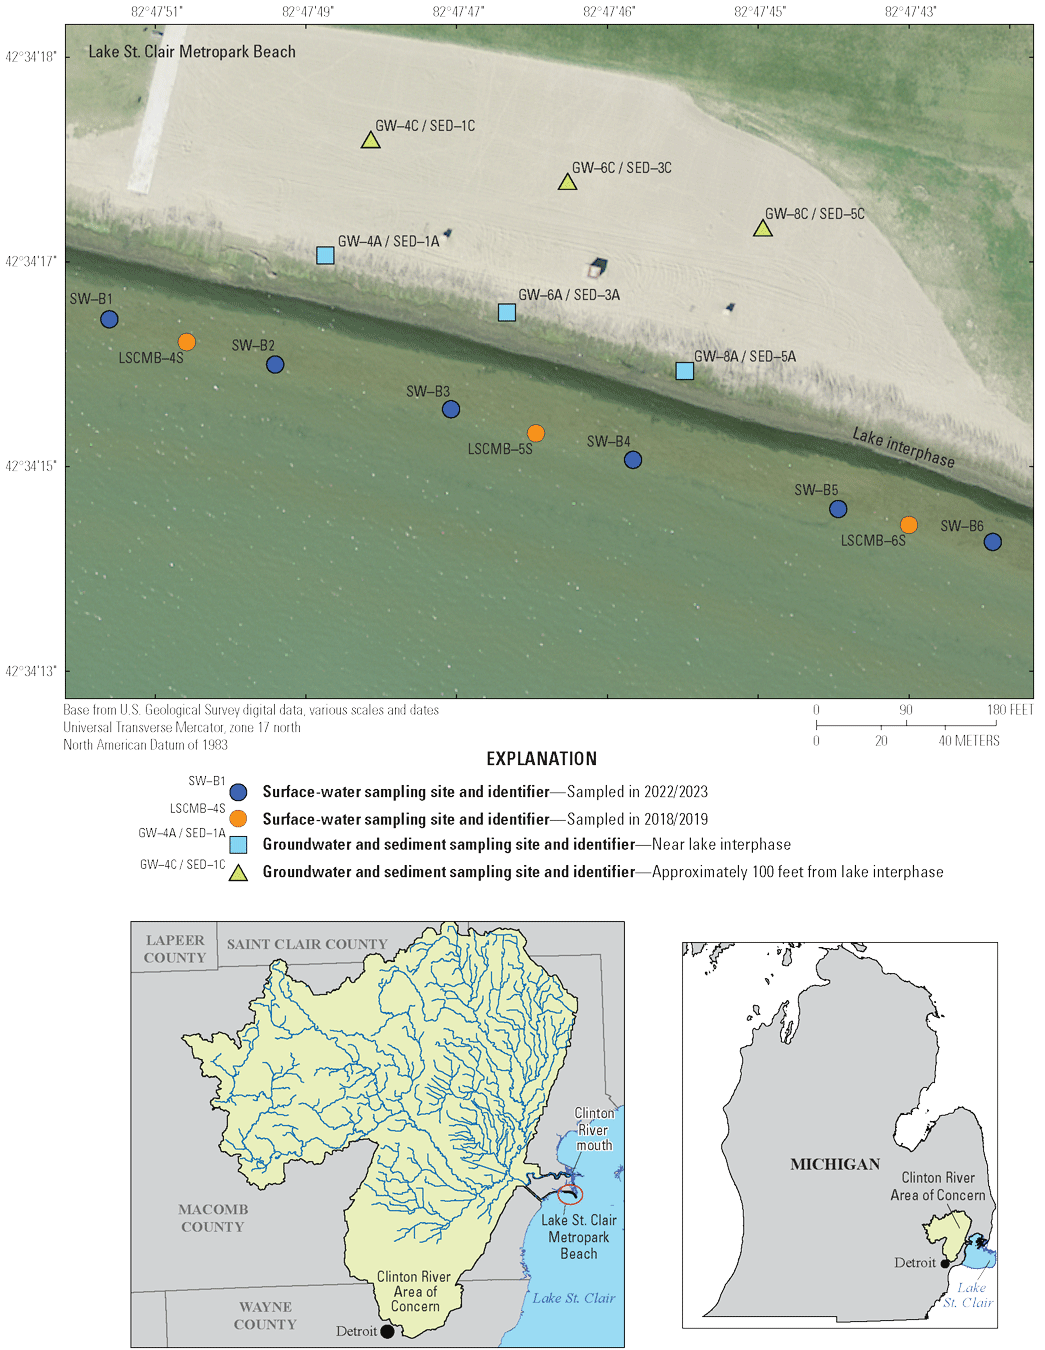
Maps showing sampling sites from the 2018, 2019, 2022, and 2023 recreational seasons (May through September) at Lake St. Clair Metropark Beach within the Clinton River Area of Concern, Macomb County, Michigan.
The U.S. Environmental Protection Agency has established recommendations for recreational water-quality criteria for the United States based on public health risk studies (U.S. Environmental Protection Agency, 2012). Based on these national criteria, the State of Michigan has established its own water-quality criteria for recreational waters (Michigan Department of Environmental Quality, 2006). Michigan’s guidelines state that “all waters of the state protected for total body contact recreation shall not contain more than 130 E. coli per 100 milliliters, as a 30-day geometric mean” (Michigan Department of Environmental Quality, 2006, p. 45). Furthermore, the guidelines state that waters designated for total body contact (TBC) recreation may not contain more than 300 E. coli per 100 milliliters (mL) for a geometric mean of at least three samples taken during the same sampling event in a defined sampling location (Michigan Department of Environmental Quality, 2006). The State of Michigan relies on county health departments to routinely test for E. coli at public swimming beaches to ensure that these criteria are not surpassed. In the event that E. coli concentrations exceed the water-quality criteria, the county health department will close the beach and continue monitoring until E. coli concentrations fall below the regulatory limits (Michigan Department of Environment, Great Lakes, and Energy, 2024c). Data collected from other entities, including the U.S. Geological Survey (USGS) for this and previous studies, are not considered when making regulatory decisions by county health departments on daily beach closures.
The Macomb County Health Department (MCHD) has monitored E. coli concentrations at Lake St. Clair Metropark Beach annually from April to September since 1995 and makes determinations for beach closures based on Michigan’s water-quality criteria (Macomb County Health Department, 2024). Results from water-quality monitoring from 2000 to 2005 were summarized by Fogarty (2007), who discovered that E. coli concentrations exceeded 1,000 colony-forming units (CFU)/100 mL (partial body contact standard; Michigan Department of Environment, Great Lakes, and Energy, 2024b) in 16 percent of all samples collected at Lake St. Clair Metropark Beach during that time. In the last 10 years (2013–23), the E. coli water-quality criteria have been frequently surpassed at Lake St. Clair Metropark Beach, resulting in 145 days of beach closures (Michigan Department of Environment, Great Lakes, and Energy, 2024a).
A hydrodynamic model to determine environmental explanatory variables for higher E. coli concentrations at Lake St. Clair Metropark Beach and another nearby beach on Lake St. Clair was completed in 2008 (Holtschlag and others, 2008). Results of that study indicated that rainfall before sampling events was positively associated with E. coli concentrations exceeding the TBC standard of 300 most probable number per 100 milliliters (MPN/100 mL) and that water temperature and turbidity were also important explanatory variables for E. coli concentrations at Lake St. Clair Metropark Beach. The Holtschlag and others (2008) study did not determine if the Clinton River was a source of E. coli to Lake St. Clair Metropark Beach, but it did find that increased streamflow from the Clinton River resulted in a decreased probability of high E. coli concentrations.
In an attempt to reduce the number of beach closures per recreational season, Huron-Clinton Metroparks first sought to identify the source of E. coli at Lake St. Clair Metropark Beach. In 2018, the USGS in cooperation with the Environmental Protection Agency and in collaboration with the Michigan Department of the Environment, Great Lakes, and Energy; MCHD; and Huron-Clinton Metroparks, began a study to monitor E. coli in Lake St. Clair Metropark Beach surface water, groundwater, and sediment; the Clinton River; and offshore areas of Lake St. Clair (Fogarty and others, 2021). That study also sought to determine the source of E. coli using microbial source tracking (MST) markers (Fogarty and others, 2021). Results of Fogarty and others (2021) indicated that the source of E. coli was likely local to the beach rather than coming from an outside source, such as the Clinton River or its drainage basin. Fogarty and others (2021) also found waterfowl, particularly the Larus species (gulls) and Branta canadensis (Canada geese), and to a lesser extent, human MST markers as potential sources of E. coli at Lake St. Clair Metropark Beach.
Given the results of Fogarty and others (2021), Huron-Clinton Metroparks implemented several beach restoration projects in an attempt to reduce E. coli at the beach and in the recreational waters at Lake St. Clair Metropark Beach. Beginning in 2021, Huron-Clinton Metroparks planted native grasses and plants upgradient from the sandy beach at Lake St. Clair Metropark Beach with the goal of discouraging waterfowl from landing in these areas. These vegetative buffers have been effective management strategies for geese in other areas because they block the geese’s line of sight for potential predators (Titchenell and Lynch, 2010). The native plants also serve to reduce stormwater runoff to the lake at Lake St. Clair Metropark Beach (Huron-Clinton Metroparks, 2024), which Fogarty and others (2021) identified as a potential transport mechanism of E. coli. Additionally, Huron-Clinton Metroparks installed acoustic bird deterrents along the edges of the beach, which replicate goose and gull distress sounds, to again discourage waterfowl from landing on the beach (Huron-Clinton Metroparks, 2024). Acoustic bird deterrents have been widely used in agricultural settings (Rivadeneira and others, 2018) and urban environments (Belant, 1997) and are commonly suggested as a means for reducing the number of nuisance gulls (Lowney and others, 2018). Although acoustic bird deterrents are a common solution to nuisance bird presence, waterfowl may become habituated to these sounds if other deterrent strategies are not implemented in tandem (Lowney and others, 2018; Rivadeneira and others, 2018). Finally, dogs trained for waterfowl harassment were hired to further deter birds from congregating at Lake St. Clair Metropark Beach. This strategy has been successful in several other Great Lakes beaches for the management of waterfowl to reduce bacterial levels and beach closures (Converse and others, 2012; Nevers and others, 2018; Jordan and others, 2019); however, the positive effects of this management strategy, when not paired with other bird deterrent strategies, have been a fairly short-term (weeks to months) solution (Hartmann and others, 2012; Nevers and others, 2018; Jordan and others, 2019). In this study, the USGS, in cooperation with the Michigan Department of the Environment, Great Lakes, and Energy and in collaboration with Huron-Clinton Metroparks and the MCHD, collected E. coli samples in surface water, groundwater, and sediment to determine if changes occurred after the restoration projects were completed.
Purpose and Scope
The purpose of this report was to describe the evaluation of E. coli concentrations in surface water, groundwater, and sediment at Lake St. Clair Metropark Beach after the implementation of restoration projects intended to reduce beach closures. Results from postrestoration years were compared to prerestoration data to determine if changes in E. coli concentrations occurred over time. Escherichia coli monitoring for this study took place during the 2022 and 2023 recreational seasons (May through September), and data were compared to data from the 2018 and 2019 recreational seasons. Waterfowl on the beach and throughout the Lake St. Clair Metropark area were enumerated. Groundwater seepage rates through lakebed sediments were measured to understand the potential for groundwater to transport E. coli to surface water and vice versa.
Sample Collection Methods and Analysis
Lake St. Clair Metropark Beach is a 938-acre public recreational area in Harrison Township, Macomb County, Mich. (fig. 1). Lake St. Clair Metropark Beach is surrounded by an urban area on the western shore of Lake St. Clair, just west of the mouth of the Clinton River, which has a 760-square-miledrainage basin that contains wetlands, forests, urban areas, agricultural areas, suburban areas, and parks (Fogarty and others, 2021). Lake St. Clair Metropark Beach includes ~600 feet (ft) of sandy beach, frequently used by recreators to access the Lake St. Clair Metropark Beach shallow swimming waters during summer months (May through September). The MCHD has been collecting surface-water E. coli samples two times per week during the recreation season and in at least three locations in the swimming beach per sampling date since 1995, and their data are used to make determinations on beach closures (Macomb County Health Department, 2024).
The USGS collected E. coli samples from May through September 2022 and 2023 in shallow nearshore surface water (number of samples [n]=480), shallow groundwater (n=72), and beach sediment (n=144) near the recreational waters at Lake St. Clair Metropark Beach (fig. 1; table 1). Six nearshore surface-water locations were sampled twice per week over 20 weeks from May to September in 2022 and 2023 (fig. 1). USGS and MCHD did not collect surface-water samples on the same days. Surface-water sampling locations were spread across the entire recreational swimming area, approximately 120 ft apart. Groundwater samples were collected from 6 sampling sites on the beach—3 close to the lake interphase, where the lake meets the land, (site short name ending in “A” on table 1) and 3 ~100 ft from the lake interphase (site short name ending in “C” on table 1)—6 times during each of the 2022 and 2023 sampling seasons (fig. 1). At the same time groundwater samples were collected, sediment samples were collected from the surface of the recreational beach and from the same depth that groundwater samples were taken (average depth of ~2 ft). Samples were collected during various wet (more than 0.10 inches of rain within 24 hours prior to sampling) and dry (less than 0.10 inches of rain within 24 hours prior to sampling) weather conditions. Groundwater seepage measurements were taken five times in 2022 (June, July, and August) and twice in 2023 (August), again during various wet and dry weather conditions. These measurements were taken in the shallow, nearshore waters of Lake St. Clair in at least two locations per measurement event. Volunteers and staff at Lake St. Clair Metropark Beach monitored the number and location of gulls and Canada geese on the beach near the recreational waters and in five other zones of the Metropark in 2021, 2022, and 2023. Volunteers enumerated birds at least 2 days a week during recreational seasons, but often up to 6 days per week, and occasionally several times per day, depending on volunteer availability (Byers, 2026). The duration of each observation was also variable and depended upon location, bird movements, and weather patterns.
Table 1.
Summary of sampling sites for surface-water, groundwater, and sediment Escherichia coli samples collected at Lake St. Clair Metropark Beach in Macomb County, Michigan, in 2018, 2019, 2022, and 2023.[Data available in USGS National Water Information System database (U.S. Geological Survey, 2025). USGS, U.S. Geological Survey; ID, identifier]
Results for 2018 and 2019 were originally published in Fogarty and others (2021).
Sites sampled in 2018 and 2019 by Fogarty and others (2021) and located between the sites sampled in 2022 and 2023.
All results from E. coli sampling are available in the USGS National Water Information System database (U.S. Geological Survey, 2025), which is accessible through the Water Quality Portal (National Water Quality Monitoring Council, 2024) by using the USGS station numbers in table 1. Groundwater seepage measurements and waterfowl enumeration data are presented in Byers (2026). Meteorological data from the National Oceanic and Atmospheric Administration Mount Clemens Air National Guard Base (USW00014804; National Oceanic and Atmospheric Administration, 2024) were used for all meteorological comparisons.
Sampling Procedures
Samples were collected by USGS personnel in accordance with the USGS National Field Manual (U.S. Geological Survey, [variously dated]). Surface-water E. coli samples were collected by wading into Lake St. Clair to a depth of ~3 ft and collecting grab samples into directional flow in 100 mL sterile, transparent, and nonfluorescing vessels. Shallow groundwater E. coli samples were collected in the same 100 mL sterile vessels using a sterilized piezometer, sterilized tubing, and a peristaltic pump. Beach sediment E. coli samples were collected using sterile techniques concurrently with groundwater samples. A 50 mL conical tube was used to collect sediment at the surface of all groundwater collection locations, and a second sediment sample was collected at the same depth that groundwater samples were taken (average depth of ~2 ft). Samples were collected in compliance with the methods of Fogarty and others (2021) and immediately placed on ice and out of direct sunlight for preservation and same-day processing by the USGS Michigan Bacteriological Research Laboratory (MI-BaRL; Myers and others, 2014) in Lansing, Mich.
Groundwater seepage across the shallow lake sediment-water interface was measured using a half-barrel seepage meter as described in Rosenberry and LaBaugh (2008). The seepage meter was submerged in the shallow lake water (average depth of ~2 ft) and inserted into the bed sediment to create a seal between the seepage meter and the sediment. Flux of water into or out of the seepage meter was measured using an attached bag containing a known volume of water. After a measured amount of time, the volume of water in the bag was remeasured and a volumetric flow rate was calculated. A flux velocity was then derived by dividing the volumetric flow rate by the area covered by the seepage meter. Potential sources of error for seepage meter measurements include leaks, incomplete seals between the seepage meter and lakebed sediment, and insufficient equilibration time and are discussed further in Rosenberry and LaBaugh (2008).
Waterfowl, specifically Canada geese and gulls, were enumerated primarily by three Lake St. Clair Metropark Beach volunteers and staff during the 2021–23 recreational seasons, with seven additional volunteers collecting observations in 2021. These observations were collected after the restoration projects were completed at Lake St. Clair Metropark Beach, and no prerestoration bird counts were recorded. Volunteers were instructed to count birds in a chunking system, in compliance with U.S. Fish and Wildlife Service estimation techniques (U.S. Fish and Wildlife Service, 2024), and to walk in a standardized pattern in each counting zone. Waterfowl flying overhead or floating in Lake St. Clair were excluded from enumeration.
Analytical Methods and Analyses
The MI-BaRL analyzed all E. coli samples using the Colilert-18 Quanti-Tray/2000 method (IDEXX Laboratories, Inc., Westbrook, Maine) in compliance with the U.S. Environmental Protection Agency-approved methods for determining recreational water quality (U.S. Environmental Protection Agency, 2012), which are also used by the MCHD for water-quality monitoring (Macomb County Health Department, 2024). Sample results that exceeded the detection limit of the method were reported as greater than (>) 2,400 MPN/100 mL, and results below the minimum detection limit were reported as less than (<) 1 MPN/100 mL. Samples were diluted with sterile deionized water as needed to extend the maximum detection limit of the method, which resulted in some reportable concentrations >2,400 MPN/100 mL or grams of dry weight (gDW). Beach sediment samples were processed in compliance with the methods of Francy and Darner (1998) and Fogarty and others (2021). Approximately 3 grams of sediment were added to 30 mL of sterile deionized water, and aliquots were taken for dilution to again extend the maximum detection limit of the method.
Statistical Analyses
Surface-water results are reported as daily geometric means to match Michigan’s regulatory water-quality criteria. Escherichia coli concentrations from the six surface-water sampling sites were used to compute geometric means for each sampling day and better represent the conditions of the entire swimming area than individual sample values. Groundwater and sediment E. coli concentrations are reported individually. Less than 1 percent of all surface-water geometric means were censored, and 21 and 14 percent of groundwater and sediment samples were censored, respectively. The R package NADA2 was used to account for censored data that were above or below the method detection limits (Julian and Helsel, 2024).
Pre- and postrestoration E. coli concentrations collected by Fogarty and others (2021) and during this study in surface water (n=128), groundwater (n=99), and sediment (n=210) were compared using Peto-Peto nonparametric one-factor statistical tests, which compare differences between groups with censored data (Helsel, 2011). In the case of surface water and groundwater, data collected prerestoration (2018–19; Fogarty and others, 2021) were compared to data collected postrestoration (2022–23) for this study. Sediment data were also compared on a pre- and postrestoration basis, but the same recreational beach area was not sampled in 2018; therefore, the prerestoration values for sediment are only represented by data collected in 2019. For groundwater, data were further divided to account for location on the beach (near the lake interphase versus ~100 ft from the lake interphase), and two statistical tests were completed to compare each location before and after restoration. For sediment, location, as described for groundwater, and depth (surface versus deep) were taken into consideration for statistical analyses. Four tests were completed with sediment data, which compared pre- and postrestoration values for (1) surface sediment taken near the lake interphase, (2) surface sediment taken ~100 ft from the lake interphase, (3) deep sediment taken near the lake interphase, and (4) deep sediment taken ~100 ft from the lake interphase. A 95-percent confidence interval was used in the Peto-Peto tests for statistical analyses (Helsel, 2011).
Quality Assurance and Quality Control
Quality assurance and quality control samples were collected for all sample types to verify precision of analytical methods and identify any contamination in field samples. A total of 45 sequential replicate E. coli samples (~9 percent of surface-water samples analyzed) were collected from surface water, and 17 field blanks of sterile deionized water (~4 percent of the surface-water samples analyzed) for surface-water methods were collected. In addition, 6 sequential replicates (~8 percent of the groundwater samples analyzed) were collected from groundwater, and 12 field blanks of sterile deionized water (~17 percent of the groundwater samples analyzed) were also taken for groundwater methods. Finally, 12 sequential replicates (~8 percent of the sediment samples analyzed) were taken from sediment samples at the surface of the beach and at the same depth as groundwater samples. A laboratory blank sample for E. coli was analyzed by MI-BaRL for each sampling day (40 sampling days per recreational season).
Escherichia coli was not detected in any field blank sample taken with surface-water or groundwater methods or in any laboratory blank sample; therefore, little to no bias from outside contamination is expected to affect sample results. Replicate surface-water sample pairs had an average relative percentage difference (the difference between the two values, divided by the average of the two values, multiplied by 100) of 42 percent. Groundwater samples had a 30-percent average relative percentage difference, and sediment samples had 64- percent and 29-percent average relative percentage difference in surface and deep samples, respectively. This variability in E. coli concentrations is typical of field studies (for example, Fogarty and others, 2021) because E. coli is highly variable in the environment. Replicate samples tended to be of the same order of magnitude as their environmental sample counterparts and fell within the same relative percentage difference ranges observed by Fogarty and others (2021).
Escherichia coli Results after Beach Restoration Efforts
Surface Water
Escherichia coli data for each individual surface-water sampling site are shown in figure 2A, and daily geometric means of those data are shown in figure 2B. Daily geometric mean E. coli concentrations for recreational (surface) water ranged from <1 to 1,200 MPN/100 mL during the 2022 to 2023 study period. Median concentrations decreased from 39 MPN/100 mL in 2022 to 29 MPN/100 mL in 2023 (table 2). The State of Michigan’s water-quality criteria for TBC recreation is 300 MPN/100 mL, based on the geometric mean of at least three samples in a single day (Michigan Department of Environmental Quality, 2006). This threshold was exceeded on 2 sampling dates in 2022 and 5 sampling dates in 2023 (table 2; fig. 2B; fig. 3A). The other State of Michigan water-quality criteria, which states that E. coli concentrations over a 30-day geometric mean shall not exceed 130 MPN/100 mL, was never exceeded by USGS data collection efforts during the study period.
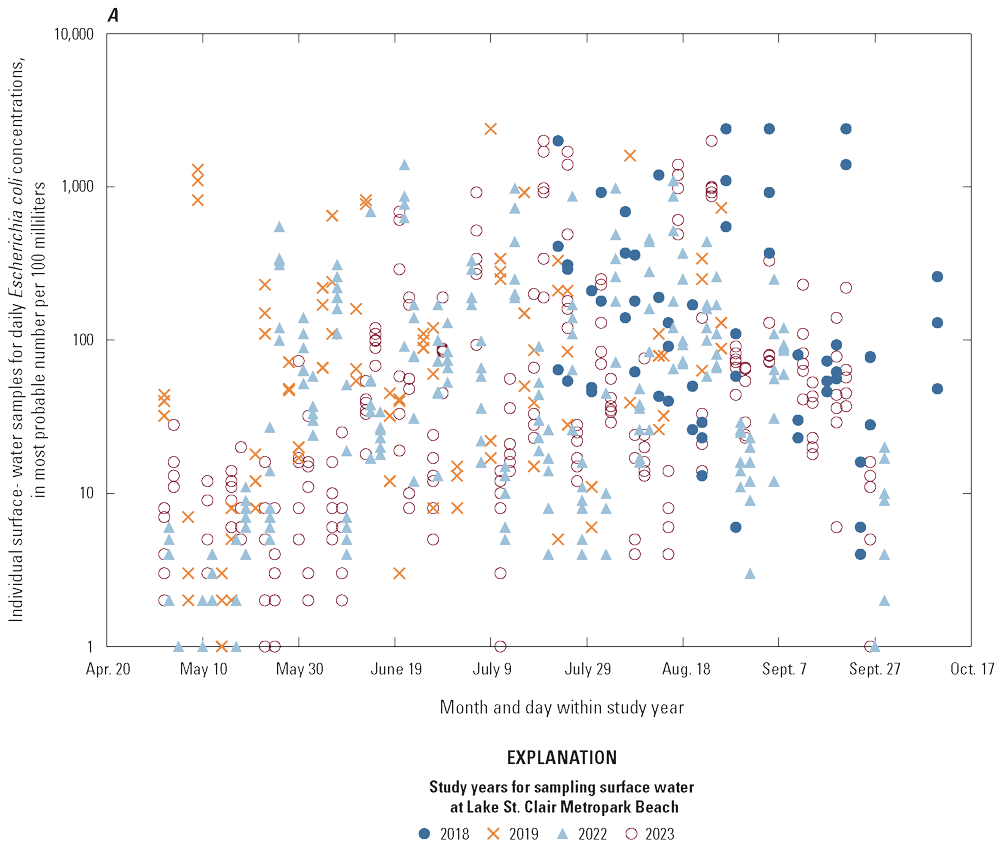
Graphs showing daily Escherichia coli concentrations, in most probable number per 100 milliliters, for (A) individual surface-water samples and (B) daily geometric means by year at Lake St. Clair Metropark Beach in Macomb County, Michigan, plotted against the month and day of the year for the 2018, 2019, 2022, and 2023 recreational seasons.
Table 2.
Summary statistics for Escherichia coli concentrations in surface-water (geometric means), groundwater, and sediment samples collected by the U.S. Geological Survey at Lake St. Clair Metropark Beach in Macomb County, Michigan, in 2018, 2019, 2022, and 2023.[MPN/100 mL, most probable number per 100 milliliters; <, less than; >, greater than; --, not applicable to data type; MPN/gDW, most probable number per gram of dry weight; TBC, total body contact]
Surface-water data are presented as geometric means from all six surface-water sampling sites collected on the same day.
Sampling sites in 2018 and 2019 were different than those in 2022 and 2023. Three surface-water sites were sampled in 2018 and 2019 compared to six sites in 2022 and 2023. Results for 2018 and 2019 were originally published in Fogarty and others (2021).
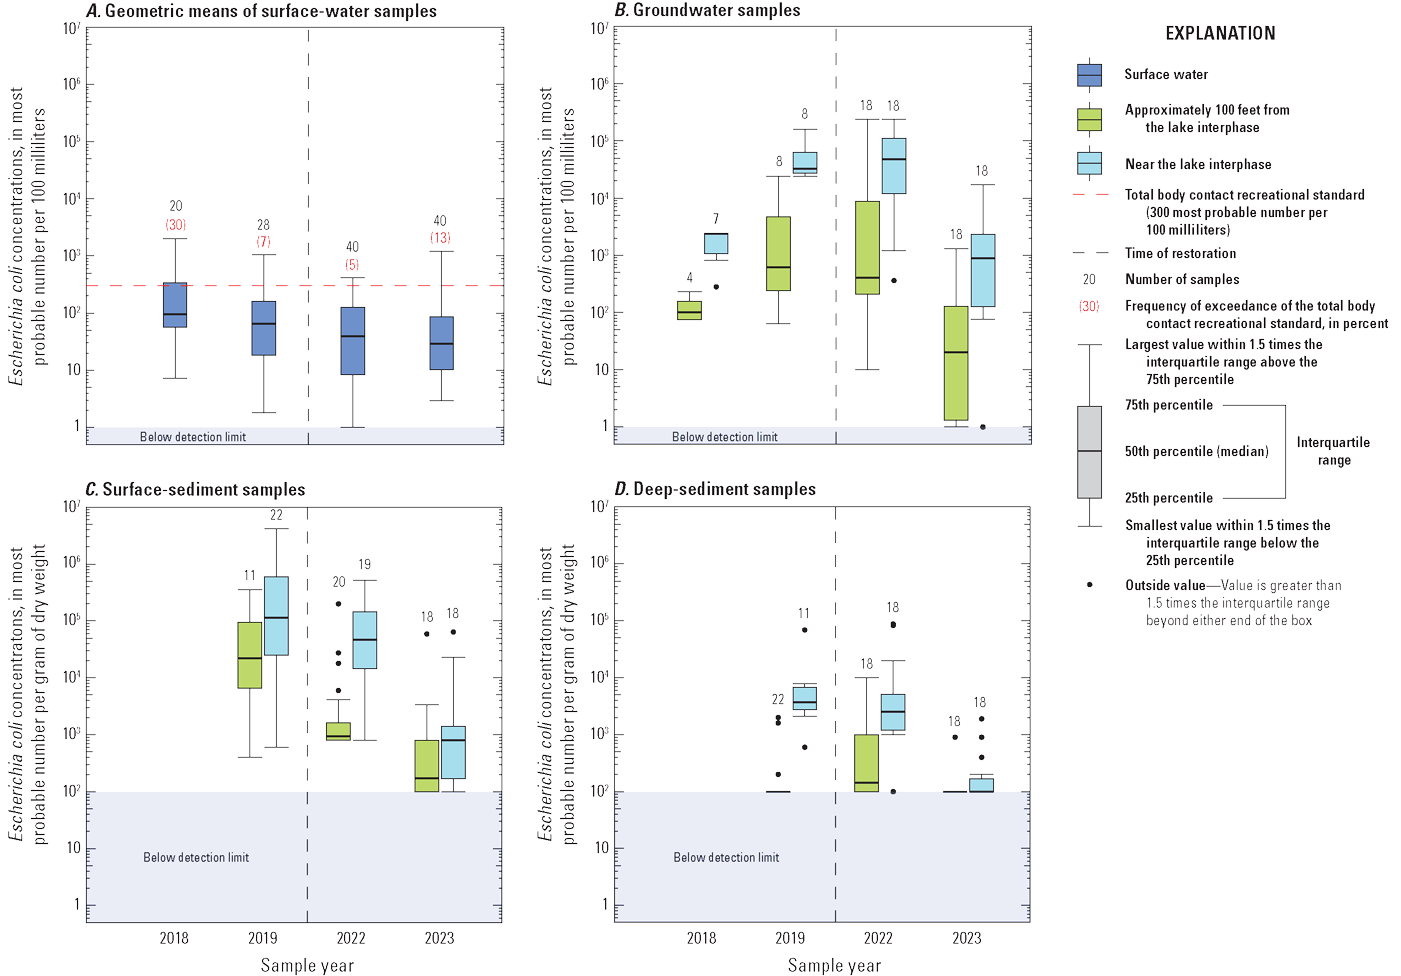
Boxplots showing Escherichia coli concentrations in (A) geometric means of surface-water samples, (B) groundwater samples, (C) surface-sediment samples, and (D) deep-sediment samples for all sampling sites at Lake St. Clair Metropark Beach in Macomb County, Michigan, pre- (2018, 2019) and postrestoration (2022, 2023).
Groundwater
Groundwater E. coli concentrations were highly variable from year to year, ranging from <1 to >240,000 MPN/100 mL during the study period. Concentrations were generally lower in 2023 compared to 2022 (table 2; fig. 3B). Median concentrations were 1,600 MPN/100 mL in 2022 and 130 MPN/100 mL in 2023 (table 2). Escherichia coli concentrations in samples collected in 2022 were generally a few orders of magnitude higher than E. coli concentrations of samples collected in 2023.
Near the lake interphase (“A” sampling sites on fig. 1 and table 1), groundwater was encountered ~1 ft below the surface. Approximately 100 ft from the lake interphase (“C” sampling sites on fig. 1 and table 1), groundwater samples were collected from a depth of ~2.5 to 3 ft below the surface. In 2022 and 2023, E. coli concentrations in groundwater near the lake interphase tended to be higher than those at the sampling sites ~100 ft from the lake interphase (fig. 3B).
Sediment
Escherichia coli concentrations in deep sediment ranged from <100 to 88,000 MPN/gDW (1 ft below land surface near the lake interphase and 2.5–3 ft below land surface ~100 ft from the lake interphase) and concentrations in surface sediment ranged from 100 to 520,000 MPN/gDW between 2022 and 2023 (table 2). Three outlier samples from 2022 were removed from the dataset. These values were an order of magnitude or two greater than all other sediment samples analyzed and were all collected on June 23, 2022, at the surface of the beach. Concentrations of the outliers ranged from 16,000,000 to 100,000,000 MPN/gDW, and associated water samples were not similarly elevated. For these reasons, it was determined that these data were potentially contaminated and deemed not representative of the environmental conditions at Lake St. Clair Metropark Beach. Median concentrations for all other samples taken were 5,200 and 800 MPN/gDW at the surface for 2022 and 2023, respectively, and 1,000 and 100 MPN/gDW at depth in 2022 and 2023, respectively (table 2). Similar to groundwater samples, E. coli concentrations in sediment samples collected in 2022 were generally a few orders of magnitude higher than E. coli concentrations in samples collected in 2023.
The highest E. coli concentrations in sediment samples were collected from the surface at sites near the lake interphase (“A” sampling sites on fig. 1 and table 1; fig. 3C). Sediment samples collected at the surface also tended to have higher E. coli concentrations overall when compared to samples taken at depth at the same sites. Sediment E. coli concentrations were lowest in samples taken at depth ~100 ft from the lake interphase (fig. 3D).
Groundwater Seepage Rates
Groundwater seepage rates were highly variable throughout the 2022–23 recreational seasons (table 3; Byers, 2026). The positive and negative values of the seepage rates shown in table 3 indicate the direction of groundwater flow. Positive seepage rates indicate that the shallow groundwater at Lake St. Clair Metropark Beach was generally flowing toward the recreational waters at the time seepage measurements were made, and negative seepage rates indicate that the recreational waters were losing to the shallow groundwater on that sampling date. Groundwater seepage rates in August of 2022 and 2023 had daily average values ranging from −0.81 to 1.23 centimeters per day (cm/d; table 3). The maximum and minimum groundwater seepage values for August of both years were in 2023. Positive average seepage values were measured on three of the five August sampling dates, and negative average values were measured on the other two days. In June and July of 2022, daily average seepage measurements yielded much higher or lower values than those observed in August, ranging from −23.4 cm/d in July to 7.94 cm/d in June. All seepage rate values from 2022 and 2023 fall within the expected range of previously observed values in coastal freshwater environments, from (positive or negative) 0.01 cm/d (Lee and Cherry, 1979) to greater than (positive or negative) 100 cm/d (Asbury, 1990; Rosenberry, 2000).
Table 3.
Average groundwater seepage rates at select sampling sites in the recreational waters at Lake St. Clair Metropark Beach in Macomb County, Michigan.[Individual seepage values can be found in Byers (2026). Dates shown as month/day/year. USGS, U.S. Geological Survey; ID, identifier; cm/d, centimeter per day]
The faster seepage rates in June and July of 2022 indicate a temporal variability in seepage rates at Lake St. Clair Metropark Beach. Previous research in lacustrine environments revealed that temporal variation in groundwater seepage rates may have several causes, including lake seiche events (Taniguchi and Fukuo, 1996), which have been demonstrated locally to propagate through and be dissipated by Lake St. Clair from the St. Clair and Detroit Rivers (not shown on fig. 1; Jackson, 2016). Additional potential causes of variation in groundwater flow rates include diurnal effects of evapotranspiration (Rosenberry and others, 2013), precipitation events (Rosenberry and Morin, 2004; Rosenberry and others, 2013), and tidal effects (Rosenberry and others, 2013), which all may affect the relative positions of the groundwater potentiometric surface and lake level. Further measurements of groundwater seepage throughout the recreational season could help to better characterize the dominant direction and magnitude of groundwater seepage at Lake St. Clair Metropark Beach and to better understand the ways in which groundwater and surface water interact at the lake interphase.
Gull and Geese Enumeration Results
Waterfowl, particularly gulls and geese, are a likely source of E. coli at Lake St. Clair Metropark Beach (Fogarty and others, 2021). Restoration efforts at Lake St. Clair Metropark Beach were mainly focused on reducing the number of waterfowl that congregated on the beach in hopes that reducing this source would reduce E. coli concentrations. In 2021, beach managers at Lake St. Clair Metropark Beach planted native grasses as a vegetative buffer and installed acoustic bird deterrents as potential long-term solutions to deter nuisance waterfowl. Dogs trained in waterfowl harassment were implemented as a short-term solution to deter birds in the summer recreation season of 2021.
Overall, gulls were much more common than geese at Lake St. Clair Metropark Beach and numbers generally declined between 2021 and 2023 (table 4). Gulls made up 89, 90, and 94 percent of the total number of birds enumerated in all of Lake St. Clair Metropark Beach in 2021, 2022, and 2023, respectively, with geese making up the remaining percentages. Of all the gulls enumerated, 81, 60, and 69 percent were on the recreational beach in 2021, 2022, and 2023, respectively. The average number of gulls counted per day on the recreational beach decreased from 131 gulls per day in 2021 to 62 gulls per day in 2022 and 83 gulls per day in 2023 (table 4). Far fewer geese than gulls were enumerated throughout the park and, specifically, on the recreational beach. On average, one goose per day was counted on the recreational beach in 2021 and 2022, and no geese were counted, on average, in 2023. The total number of geese enumerated on the recreational beach decreased from 120 to 30 geese from 2021 to 2023 (table 4). In the rest of the park at Lake St. Clair Metropark Beach, geese were observed more frequently but still with decreasing trends from 1,578 geese in 2021 to 660 geese in 2023 (table 4). Additionally, a reduction in the average number of birds (gulls plus geese) that were counted in all of Lake St. Clair Metropark Beach each day was observed, from 181 birds per day in 2021 to 114 birds per day in 2022 and 127 birds per day in 2023 (table 4).
Table 4.
Enumeration of gulls and geese on the recreational beach and other areas at Lake St. Clair Metropark Beach in Macomb County, Michigan, during the 2021, 2022, and 2023 recreational seasons.[Individual daily counts of birds can be found in Byers (2026)]
Pre- and Postrestoration Escherichia coli Comparisons
Escherichia coli concentrations from the recreational (surface) water, groundwater, and sediment samples collected during this study for the 2022 and 2023 recreational seasons were compared to those collected by Fogarty and others (2021) in 2018 and 2019. Between the study by Fogarty and others (2021) and this study, beach restoration projects were implemented to discourage waterfowl from congregating on the beach at Lake St. Clair Metropark Beach. Escherichia coli concentrations from before and after beach restoration projects were compared to determine if consistent changes in E. coli concentrations were observed in surface water, groundwater, or sediment. Weather conditions were variable throughout both sampling periods, but both studies captured similar precipitation and temperature conditions throughout the recreational seasons (table 5; National Oceanic and Atmospheric Administration, 2024). At Lake St. Clair Metropark Beach, July tended to be the warmest and driest month in all years analyzed. May, June, and August tended to be wetter than July and September (table 5). The greatest amount of precipitation was recorded in 2023, which was also the coolest recreational season sampled. The warmest year of the study period was 2018 (table 5).
Table 5.
Temperature and precipitation conditions near Lake St. Clair Metropark Beach in Macomb County, Michigan, for the 2018, 2019, 2022, and 2023 recreational seasons.[Data in this table are from the National Oceanic and Atmospheric Administration (2024).°F, degree Fahrenheit; in., inch;--, not applicable to data type]
Surface Water
Surface-water sampling locations varied between pre- and postrestoration sampling events. For the 2018 and 2019 study (Fogarty and others, 2021), fewer locations were sampled in the shallow recreational waters at Lake St. Clair Metropark Beach than in 2022 and 2023. In 2018 and 2019, three sites, located between the 2022–23 sites, were sampled at about the same depth (~3 ft; table 1; fig. 1). Sites sampled in 2018 and 2019 were ~70 ft from the nearest comparable sampling site in 2022 and 2023.
In 2018, surface-water samples were collected from mid-July through early October, and samples collected in 2019 were collected from May through August. Daily geometric means of all surface-water sampling sites were used for surface-water E. coli comparisons and reporting of summary statistics in table 2. Individual E. coli concentrations for pre- and postrestoration years are shown in figure 2A and daily geometric means for each recreational season are shown in figure 2B. Surface-water samples collected by Fogarty and others (2021) in 2018 and 2019 were not fully representative of the entire recreational season, whereas 2022 and 2023 data collected for the present study were more completely representative of the recreational season (May through September). Concentrations for all years were typically highest in June (not sampled in 2018), July, and August, which were the hottest months of the recreational season (table 5). Samples taken on the same day tended to have similar E. coli concentrations, although variation between the six sampling sites was observed (fig. 2A). Because of the inherent variability of E. coli concentrations in a large waterbody, the variability in measurements is not unexpected (Francy and Darner, 1998).
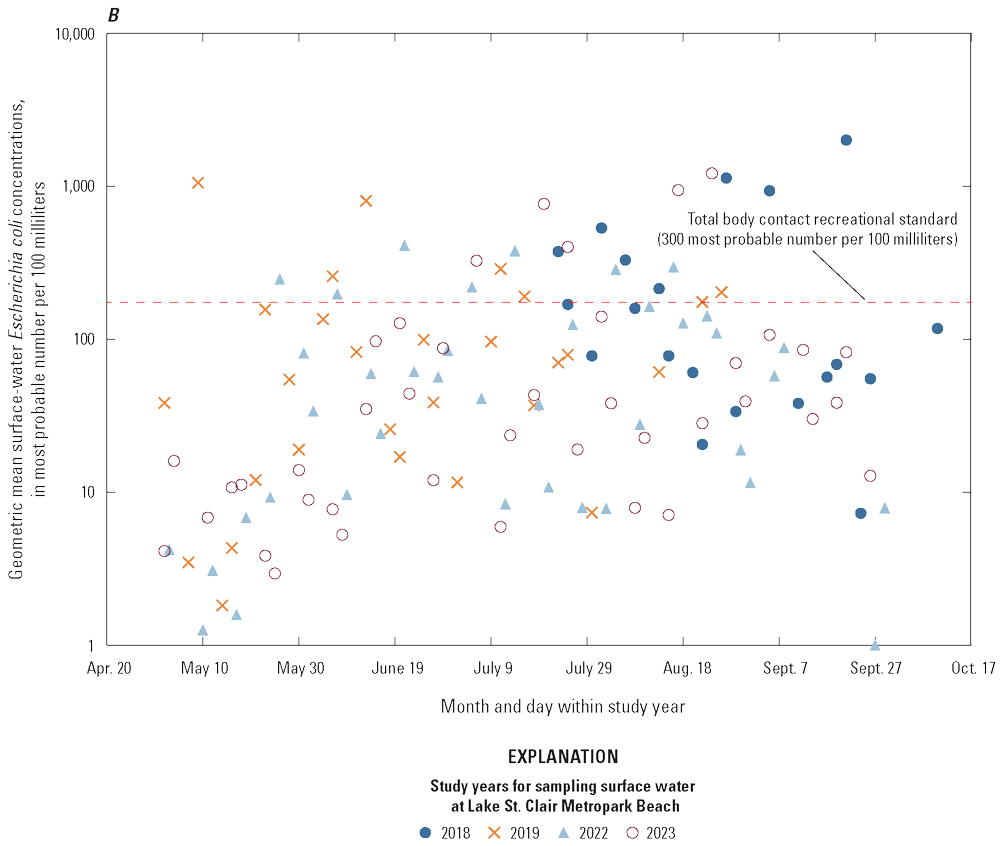
Geometric mean E. coli concentrations in surface water were variable throughout each recreational season (fig. 3A). Data from this study and data collected by MCHD indicate similar evidence for an overall decrease in E. coli concentrations after restoration. Before the implementation of beach restoration projects, geometric means of E. coli concentrations in surface water collected by Fogarty and others (2021) had a wide range of values (2.0 to 2,000 MPN/100 mL) with median concentrations of 98 and 66 MPN/100 mL in 2018 and 2019, respectively (table 2). After restoration efforts, the range of values in USGS collected data (<1 to 1,200 MPN/100 mL) and median concentrations (39 and 29 MPN/100 mL in 2022 and 2023, respectively) decreased (table 2; fig. 3A). Daily geometric mean E. coli concentrations in surface-water samples collected by USGS were significantly lower after restoration (2022–23) than before restoration (2018–19; probability value [p-value]=0.005; Peto-Peto nonparametric one factor test [Helsel, 2011]). This apparent decrease may be due, in part, to the shorter sampling seasons in 2018 and 2019. In these years, the warmest parts of the recreational season were over-represented resulting in a concentration distribution that may have been biased high. For example, in 2018, the distribution of concentrations in USGS samples is substantially higher than the distribution from the MCHD-collected samples (fig. 4). The data collected by MCHD represented the full recreational season (May through September) in all years. The distribution of MCHD data also generally decreased from before restoration to after restoration, although the data are more variable after restoration (fig. 4). The range of MCHD-collected data was greater following the restoration projects, with higher maximum E. coli concentrations measured after restoration compared to before restoration (table 6).
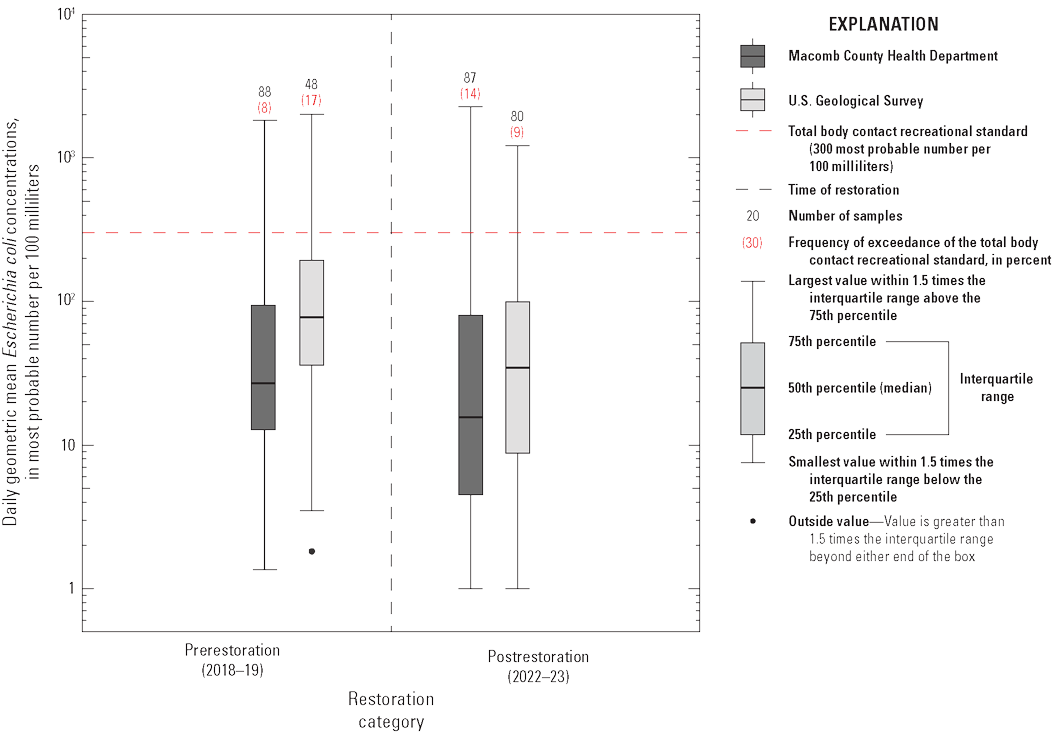
Boxplots showing the daily geometric mean Escherichia coli concentrations for surface water during pre- (2018–19) and postrestoration (2022–23) years in samples collected by the Macomb County Health Department and the U.S. Geological Survey.
Although the overall distribution of E. coli concentrations tended to decrease after restoration, high concentration events were more frequent in MCHD-collected data following restoration (table 6), and, as a result, beach closures were more frequent after restoration. During the 2018 and 2019 recreational seasons, MCHD closed the swimming beach to recreators for 7 days (~8 percent of their sampling days) because of high bacteria levels measured from their sampling efforts (table 6; Michigan Department of Environment, Great Lakes, and Energy, 2024a). Conversely, MCHD closed the beach for a total of 24 days in 2022 and 2023 (~28 percent of their sampling days; table 6). Geometric means surpassed the 300 MPN/100 mL threshold on 12 of MCHD’s 87 sampling days in 2022 and 2023 (~14 percent of sampling days; table 6). The beach was closed for an additional 12 days because MCHD data had exceedances of the 30-day geometric mean of 130 MPN/100 mL threshold (table 6; Michigan Department of Environment, Great Lakes, and Energy, 2024a). As a result, the proportion of exceedances of the TBC recreation standard from the MCHD-collected data was higher after the restoration efforts compared to before the restoration efforts.
Table 6.
Summary statistics for Macomb County Health Department Escherichia coli data collected in surface water (geometric means) at Lake St. Clair Metropark Beach in Macomb County, Michigan, from May to September 2008 to 2023.[Data in this table are from the Michigan Department of Environment, Great Lakes, and Energy (2024a). >, greater than; MPN/100 mL, most probable number per 100 milliliters]
Groundwater
The same groundwater sites were sampled at Lake St. Clair Metropark Beach for the 2018–19 and 2022–23 recreational seasons and are shown in table 1. Escherichia coli concentrations in groundwater samples tended to have minimum, median, and maximum values that were generally in the same order of magnitude in 2018, 2019, and 2022 (table 2). In 2023, however, E. coli concentrations tended to be an order of magnitude lower than those in previous years, with concentrations ranging from <1 to 17,000 MPN/100 mL, and a median concentration of 130 MPN/100 mL (table 2). Before and after restoration, groundwater E. coli concentrations tended to be lower at sampling sites ~100 ft from the lake interphase (sampling sites ending with “C” on fig. 1 and table 1) compared to those near the lake interphase (sampling sites ending with “A” on fig. 1 and table 1; fig. 3B).
Two Peto-Peto tests were conducted that compared pre- and postrestoration groundwater E. coli concentrations collected (1) near the lake interphase, and (2) ~100 ft from the lake interphase. No statistical differences existed between the pre- and postrestoration groundwater E. coli groups, with p-values of 0.99 and 0.16, for sampling sites near the lake interphase and ~100 ft from the lake interphase, respectively. Although no significant difference in groundwater E. coli concentrations between the pre- and postrestoration groups tested were discovered, the maximum E. coli concentration was an order of magnitude lower in 2023 (table 2). Pairwise Peto-Peto tests were also completed to compare groundwater E. coli concentrations between individual years; for example, 2022 was individually compared to 2018, 2019, and 2023. Results from these tests indicated that 2023 E. coli concentrations both near and far from the lake were significantly lower than those in 2022 (p-values <0.003). Yearly comparisons also revealed that E. coli concentrations in 2018 were not significantly different from those in 2023 in samples collected near the lake interphase or ~100 ft from the lake interphase. These results indicate that the variation in E. coli concentrations observed in groundwater samples may be explained by influences from yearly variability in air or water temperatures, precipitation, or other factors not considered by this study that are not directly related to the restoration efforts.
Sediment
The same sites were sampled for E. coli in sediment in 2019, 2022, and 2023; however, a different set of sampling sites were analyzed during the 2018 sampling season by Fogarty and others (2021). Because of these differences in sampling site locations, only values from 2019 were used as a prerestoration comparison for sediment results. Before and after the beach restoration efforts, E. coli concentrations in sediment were highest in samples taken at the surface of the beach near the lake interphase (fig. 3C). After restoration efforts, the maximum concentrations of E. coli in surface sediment decreased by an order of magnitude (table 2). As was the case with groundwater samples, sediment E. coli concentrations in 2023 tended to be an order of magnitude lower than previous years (table 2). For all years, the lowest E. coli concentrations in sediment were observed in samples taken at depth ~100 ft from the lake interphase. The maximum concentration of E. coli in sediment samples taken at depth in 2023 was 1,900 MPN/gDW, which is an order of magnitude lower than the maximum in 2022 (88,000 MPN/gDW) and 2019 (69,000 MPN/gDW; Fogarty and others, 2021).
Using the nonparametric Peto-Peto test (Helsel, 2011), sediment E. coli concentrations from 2019 (n=66; Fogarty and others, 2021) were compared to those from 2022 and 2023 combined (n=144) in four pre- and postrestoration groups: (1) surface sediment near the lake interphase, (2) surface sediment ~100 ft from the lake interphase, (3) deep sediment near the lake interphase, and (4) deep sediment ~100 ft from the lake interphase. Surface-sediment E. coli concentrations significantly decreased from pre- to postrestoration near the lake interphase (p-value <0.001) and ~100 ft from the lake interphase (p-value <0.001). Deep-sediment E. coli concentrations significantly decreased from pre- to postrestoration near the lake interphase (p-value <0.001) but significantly increased ~100 ft from the lake interphase (p-value <0.001). This difference in test results for the deep-sediment group ~100 ft from the lake interphase is likely because of the large proportion of samples (86 percent) in this location that were below the detection limit in 2019 (Fogarty and others, 2021) compared to 19 percent of samples in this study that were below the detection limit after restoration. Although these results do not follow the same trend as the other three sediment depths and locations, the deep-sediment samples ~100 ft from the lake interphase still had the lowest median E. coli concentrations of all subsets of sediment data for all years analyzed (fig. 3D). Three of the four depth and location sediment groups analyzed had statistically significant reductions in E. coli concentrations after restoration at Lake St. Clair Metropark Beach; however, only 1 year of data were used for prerestoration comparison.
Synthesis of Escherichia coli, Groundwater Seepage, and Waterfowl Enumeration Data at Lake St. Clair Metropark Beach
An overall decrease in surface-water E. coli concentrations was observed when comparing pre- and postrestoration samples in both USGS- and MCHD-collected data; however, increased variability was observed in MCHD data after restoration (fig. 4). The number of beach closures increased following restoration efforts, indicating that more high E. coli concentration events occurred postrestoration, and the conditions that caused these events persisted. Other studies have documented reductions in E. coli concentrations in surface water following waterfowl harassment with dogs (Converse and others, 2012; Nevers and others, 2018; Jordan and others, 2019); however, these studies measured E. coli immediately following this treatment strategy. Measurements for our study were made at least one year after waterfowl harassment dogs were employed at Lake St. Clair Metropark Beach; therefore, reductions cannot be directly attributed to bird harassment as they have been in previous studies. Acoustic bird deterrents have also been proven effective in reducing gull presence near freshwater sources, thereby reducing E. coli concentrations in surface water (Benton and others, 1983). Benton and others (1983) found that the reduction in gulls and associated reduction in E. coli lasted at least 14 months after the initial installation of bird deterrent systems, at which time they concluded their study. This prolonged reduction in E. coli in surface water after the use of acoustic bird deterrents demonstrates that the ongoing measures put in place by Lake St. Clair Metropark Beach to reduce waterfowl presence may be affecting surface-water E. coli concentrations, but those effects are not substantial enough to reduce beach closures within two years of implementation.
A significant reduction of E. coli in sediment samples was observed after the restoration efforts at Lake St. Clair Metropark Beach. Although E. coli in beach sediment is not monitored for regulatory reasons, this reduction in surface-sediment E. coli concentrations may have larger implications for the overall reduction of E. coli at Lake St. Clair Metropark Beach. Few other studies have evaluated the presence of E. coli in beach sands before and after restoration actions similar to those performed at Lake St. Clair Metropark Beach; that is, use of canid harassment, acoustic bird deterrents, and (or) vegetated buffer zones. Other studies have demonstrated that different types of restoration actions, specifically those that replace beach sand containing high E. coli concentrations with E. coli-free sand (Whitman and Nevers, 2003) or add exogenous sand on top of sand that previously had fecal indicator bacteria issues (Hernandez and others, 2014), were effective in reducing E. coli and other fecal indicator bacteria in beach sands.
At Lake St. Clair Metropark Beach, sediment samples on the surface of the beach tended to have higher E. coli concentrations than those at depth. Similarly, Whitman and Nevers (2003) found higher E. coli concentrations in sediment samples taken at shallower depths compared to samples taken beneath the water table at a Lake Michigan beach. The findings of this study, along with those of Whitman and Nevers (2003), indicate that average E. coli concentrations in sediment at or below the water table are generally an order of magnitude lower than those at the surface (table 2). High E. coli concentrations at the surface of the beach have locally been attributed to waterfowl or human sources through MST (Fogarty and others, 2021), which are consistent with observations amongst other Great Lakes beaches (Standridge and others, 1979; Whitman and Nevers, 2003; Ishii and others, 2007; Halliday and Gast, 2010; Nevers and others, 2022).
Since the restoration projects were implemented at Lake St. Clair Metropark Beach in 2021, the total number of birds on the recreational beach have generally decreased (table 4). Decreased waterfowl numbers may be a factor in reducing E. coli concentrations in sediment at Lake St. Clair Metropark Beach, but this study was not designed to demonstrate a causal relationship between bird numbers and E. coli. Previous studies have concluded that restoration actions similar to those taken at Lake St. Clair Metropark Beach can decrease the number of gulls and geese on recreational beaches (Benton and others, 1983; Titchenell and Lynch, 2010; Converse and others, 2012; Nevers and others, 2018). Enumeration of waterfowl at Lake St. Clair Metropark Beach only offers a snapshot of bird presence on the recreational beach, and the actual number of birds congregating on the beach may be over- or underestimated by these daily counts over the course of the recreational seasons.
Escherichia coli concentrations in sediment and groundwater samples tended to be higher close to the lake interphase compared to samples taken ~100 ft from the lake interphase (figs. 3B–D). Previous research has revealed that groundwater beneath wet sand, close to a lake interphase, is more likely to have elevated E. coli concentrations than locations beneath dry sand (Crowe and Milne, 2013). Similarly, nearshore beach sediment has been identified as a reservoir for E. coli in several Great Lakes beaches (Kinzelman and others, 2003; Beversdorf and others, 2007; Ishii and others, 2007; Whitman and others, 2014; Wu and others, 2017). Fogarty and others (2021) posited that there may be a reservoir of E. coli in beach sediment at Lake St. Clair Metropark Beach, wherein E. coli colonies can establish populations and grow in quantity throughout the recreational season. Bacteria have been observed to survive longer in sediment than in water because of higher available organic matter content, which is required for growth, and protection from ultraviolet radiation (Francy and Darner, 1998; Alm and others, 2006; Rumball and others, 2021).
One important factor that likely contributes to the higher E. coli concentrations in groundwater and sediment near the lake interphase is shoreline erosion caused by wave action. As waves crash against shoreline sediment, E. coli bound to sand grains may become resuspended in the water column (Vogel and others, 2016; Safaie and others, 2021; Nevers and others, 2022). This mechanical separation of E. coli and other fecal indicator bacteria from nearshore sand grains allows the bacteria to then be transported and recirculated through nearshore surface water and shallow groundwater (Vogel and others, 2016; Wu and others, 2017). Transport of fecal indicator bacteria, including E. coli, from nearshore sediment has been observed to increase E. coli concentrations in nearshore surface waters to levels that may exceed water-quality criteria and lead to public health advisories (Wu and others, 2017; Palmer and others, 2020). At Lake St. Clair Metropark Beach, resuspension and transport of bacteria may be of concern in terms of beach closures, as E. coli concentrations in groundwater (fig. 3B) and near the lake interphase in surface (fig. 3C) and deep sediment (fig. 3D) tended to be at least an order of magnitude higher than the associated surface-water value (fig. 3A).
Other factors that may provide transport mechanisms for E. coli at Lake St. Clair Metropark Beach include precipitation, which may transport E. coli through sediment via infiltration, potentially adding to the E. coli reservoir (Beversdorf and others, 2007; Ishii and others, 2007; Malott and others, 2016; Fogarty and others, 2021), and groundwater seepage (Whitman and others, 2001). Groundwater seepage measurements at Lake St. Clair Metropark Beach revealed some positive values, indicating that groundwater discharged to recreational waters during both recreational seasons (table 3). Whitman and others (2001) found that E. coli concentrations within seepage fluxes at another Great Lakes beach tended to be highly variable; concentrations ranged from <100 to >50,000 MPN/100 mL. A later study at that same beach concluded that groundwater seepage did not contribute a substantial amount of E. coli to the receiving surface waters (Whitman and Nevers, 2003). When groundwater was discharging into the recreational waters at Lake St. Clair Metropark Beach, it is possible that E. coli was being transported to surface water, although direct measurements of E. coli in the seepage waters would be needed to understand how E. coli are transported locally. Negative groundwater seepage rates were also measured at Lake St. Clair Metropark Beach (table 3), indicating that the recreational waters were flowing into groundwater occasionally throughout the study period. This indicates that E. coli may occasionally be transported from surface water to the shallow groundwater at Lake St. Clair Metropark Beach, depending on the conditions of groundwater and surface-water interactions. More measurements of groundwater seepage over time could help to determine the prevailing direction of groundwater flow and the effect that fluxes of E. coli have on surface-water and groundwater bacterial concentrations.
Previous work at Lake St. Clair Metropark Beach by Holtschlag and others (2008) and Fogarty and others (2021) had conflicting findings on the correlation between precipitation and the concentration of E. coli in surface water. Holtschlag and others (2008) found that rainfall before E. coli sampling was positively correlated with E. coli concentrations, whereas Fogarty and others (2021) found no correlation between the two factors. Correlations between environmental factors and E. coli were not analyzed as part of this study, so uncertainty about the effects of factors such as precipitation remain. A consistent relationship did not exist between the distribution of E. coli concentrations in each recreational season and the recreational season average maximum temperature, average minimum temperature, or precipitation total. For example, in 2023, groundwater, surface sediment, and deep sediment, on average, had the lowest concentrations of E. coli measured for all years during this study (figs. 3B–D). That same year, precipitation totals were highest amongst the study years, and temperatures were generally the lowest (table 5). Other studies have concluded that increased precipitation often leads to increased concentrations of E. coli (Haack and others, 2003; Beversdorf and others, 2007); this was not the case at Lake St. Clair Metropark Beach in 2023, potentially because of the cooler temperatures. Conversely, in 2019, which had the second-highest season-long precipitation total, E. coli concentrations were substantially higher than in 2023, particularly in surface sediment, potentially indicating agreement with the previous studies. Also, 2019 had the highest maximum air temperature (table 5), which may promote E. coli growth; however, all seasonal maximum temperatures observed fell within the range for optimal E. coli growth (73–90 degrees Fahrenheit; Beversdorf and others, 2007; Ishii and others, 2007; Weiskerger and others, 2019). The recreational season with the least precipitation, 2022, had the lowest maximum E. coli concentration in surface water, which again seems to agree with previous works on the effects of precipitation to E. coli concentrations. Seasonal averages and totals do not provide a refined or detailed look at relations between E. coli and environmental factors like temperature and precipitation. A more detailed analysis would help to disentangle the confounding effects of environmental conditions and beach restoration efforts.
Summary
The objective of this study was to evaluate Escherichia coli (E. coli) concentrations in surface water, groundwater, and sediment at Lake St. Clair Metropark Beach in Macomb County, Michigan, before and after implementation of restoration projects intended to reduce beach closures caused by high E. coli concentrations. Lake St. Clair Metropark Beach has a history of beach closures because of elevated E. coli concentrations that exceed the State of Michigan’s total body contact recreation standards of 300 most probable number (of bacteria) per 100 milliliters (MPN/100 mL) as a geometric mean of at least three samples taken the same day and (or) 130 MPN/100 mL as a 30-day geometric mean. These elevated E. coli concentrations and associated beach closures have caused Lake St. Clair Metropark Beach to be included in the Clinton River Area of Concern under the beach closure beneficial use impairment. Huron-Clinton Metroparks implemented several beach restoration projects in 2021 after a study concluded that waterfowl or humans local to the beach may be sources of E. coli. These restoration projects sought to reduce E. coli concentrations at Lake St. Clair Metropark Beach by reducing the number of waterfowl that congregate in the recreational areas. After these restoration projects, this 2-year study, completed in cooperation with the Michigan Department of the Environment, Great Lakes, and Energy and in collaboration with Huron-Clinton Metroparks and the Macomb County Health Department, found variable surface-water E. coli concentrations, and groundwater and sediment E. coli concentrations that were orders of magnitude higher than those of surface water. Data from this study were compared to prerestoration data from 2018-19 published in Fogarty and others (2021). These comparisons revealed that surface-water and sediment E. coli concentrations were significantly lower after beach restoration. The apparent decrease in surface-water concentrations may be due, in part, to the shorter sampling seasons in 2018 and 2019. During 2018 and 2019, the warmest parts of the recreational season were over-represented resulting in a concentration distribution that may have been biased high. Surface-water data collected by the Macomb County Health Department represented the full recreational season (May through September) in all years. The distribution of Macomb County Health Department data also generally decreased from before restoration to after restoration, although the data are more variable after restoration. Although E. coli concentrations in surface water were typically lower after restoration, more beach closures attributed to high E. coli concentration events were observed based on Macomb County Health Department data. The conditions that produced these high E. coli concentrations in surface water persisted at Lake St. Clair Metropark Beach for at least two years postrestoration. There was a significant decrease in surface-sediment E. coli concentrations following restoration and a general decrease in waterfowl numbers between 2021 and 2023, which may indicate that the bird deterrence measures could be influencing E. coli concentrations in sediment and surface water, although a causal relationship cannot be concluded. Groundwater E. coli concentrations before and after restoration were variable and did not appear to be correlated with the timing of restoration efforts. Groundwater E. coli concentrations were not significantly different before and after restoration, but sediment and groundwater E. coli concentrations were an order of magnitude lower in 2023 compared to previous years of analyzed data. Groundwater seepage rates reveal that groundwater discharges to surface water at times, which indicates that groundwater could be transporting E. coli to the recreational waters. Overall, there are mixed results on the relation between E. coli concentration decreases and restoration efforts. The greater number of beach closures postrestoration indicates that conditions leading to high E. coli concentrations at Lake St. Clair Metropark Beach persist. Continued monitoring of E. coli at Lake St. Clair Metropark Beach could help to determine whether the decreasing E. coli trends observed in U.S. Geological Survey and Macomb County Health Department data continue. Future work could explicitly consider effects of environmental factors, further characterize the role of surface-water and groundwater interactions affecting the surface-water quality, and (or) determine the role of the potential E. coli reservoir in the beach sediment on water quality.
References Cited
Alm, E.W., Burke, J., and Hagan, E., 2006, Persistence and potential growth of the fecal indicator bacteria, Escherichia coli, in shoreline sand at Lake Huron: Journal of Great Lakes Research, v. 32, no. 2, p. 401–405, accessed March 2024 at https://doi.org/10.3394/0380-1330(2006)32[401:PAPGOT]2.0.CO;2.
Belant, J.L., 1997, Gulls in urban environments—Landscape-level management to reduce conflict: Landscape and Urban Planning, v. 38, nos. 3–4, p. 245–258, accessed August 2024 at https://doi.org/10.1016/S0169-2046(97)00037-6.
Benton, C., Khan, F., Monaghan, P., Richards, W.N., and Shedden, C.B., 1983, The contamination of a major water supply by gulls (Larus sp.)—A study of the problem and remedial action taken: Water Research, v. 17, no. 7, p. 789–798, accessed July 2024 at https://doi.org/10.1016/0043-1354(83)90073-8.https://doi.org/10.1016/0043-1354(83)90073-8.
Beversdorf, L.J., Bornstein-Forst, S.M., and McLellan, S.L., 2007, The potential for beach sand to serve as a reservoir for Escherichia coli and the physical influences on cell die-off: Journal of Applied Microbiology, v. 102, no. 5, p. 1372–1381, accessed March 2024 at https://doi.org/10.1111/j.1365-2672.2006.03177.x.
Byers, V.C., 2026, Water flux and avian species data at Lake St. Clair Metropark in Macomb County, Michigan, collected during recreational seasons of 2021, 2022, and 2023: U.S. Geological Survey data release, https://doi.org/10.5066/P13GGCXS.
Converse, R.R., Kinzelman, J.L., Sams, E.A., Hudgens, E., Dufour, A.P., Ryu, H., Santo-Domingo, J.W., Kelty, C.A., Shans, O.C., Siefring, S.D., Haugland, R.A., and Wade, T.J., 2012, Dramatic improvements in beach water quality following gull removal: Environmental Science & Technology, v. 46, no. 18, p. 10206–10213, accessed July 2024 at https://doi.org/10.1021/es302306b.
Crowe, A., and Milne, J., 2013, Relationship between dry and wet beach ecosystems and E. coli levels in groundwater below beaches of the Great Lakes, Canada, chap. 19 of Ribeiro, L., Stigter, T.Y., Chambel, A., Condesso de Melo, M.T., Monteiro, J.P., Medeiros. A., Groundwater and Ecosystems: London, CRC Press, p. 237–251, accessed August 2024 at https://doi.org/10.1201/b15003.
Fogarty, L.R., 2007, Bacteria and emerging chemical contaminants in the St. Clair River/ Lake St. Clair Basin, Michigan: U.S. Geological Survey Open-File Report 2007–1083, 10 p., accessed March 2024, at https://doi.org/10.3133/ofr20071083.
Fogarty, L.R., Maurer, J.A., Hyslop, I.M., Totten, A.R., Kephart, C.M., and Brennan, A.K., 2021, Understanding sources and distribution of Escherichia coli at Lake St. Clair Metropark Beach, Macomb County, Michigan: U.S. Geological Survey Scientific Investigations Report 2021–5089, 34 p., accessed March 2024, at https://doi.org/10.3133/sir20215089.
Francy, D.S., and Darner, R.A., 1998, Factors affecting Escherichia coli concentrations at Lake Erie public bathing beaches: U.S. Geological Survey Water-Resources Investigations Report 98–424, 41 p., accessed March 2024 at https://doi.org/10.3133/wri984241.
Haack, S.K., Fogarty, L.R., and Wright, C., 2003, Escherichia coli and enterococci at beaches in the Grand Traverse Bay, Lake Michigan—Sources, characteristics, and environmental pathways: Environmental Science & Technology, v. 37, no. 15, p. 3275–3282, accessed July 2024 at https://doi.org/10.1021/es021062n.
Halliday, E., and Gast, R.J., 2010, Bacteria in beach sands—An emerging challenge in protecting coastal water quality and bather health: Environmental Science & Technology, v. 45, no. 2, p. 370–379, accessed August 2024 at https://doi.org/10.1021/es102747s.
Hartmann, J.W., Beckerman, S.F., Engeman, R.M., and Seamans, T.W., 2012, Report to the city of Chicago on conflicts with ring-billed gulls and the 2012 integrated ring-billed gull damage management project: U.S. Department of Agriculture National Wildlife Research Center, 29 p., accessed July 2024 at https://digitalcommons.unl.edu/icwdm_usdanwrc/1145/.
Hernandez, R.J., Hernandez, Y., Jimenez, N.H., Piggot, A.M., Klaus, J.S., Feng, Z., Reniers, A., and Solo-Gabriele, H.M., 2014, Effects of full-scale beach renovation on fecal indicator levels in shoreline sand and water: Water Research, v. 48, p. 579–591, accessed August 2024, at https://doi.org/10.1016/j.watres.2013.10.020.
Holtschlag, D.J., Shively, D., Whitman, R.L., Haack, S.K., and Fogarty, L.R., 2008, Environmental factors and flow paths related to Escherichia coli concentrations at two beaches on Lake St. Clair, Michigan, 2002–2005: U.S. Geological Survey Scientific Investigations Report 2008–5028, 38 p., accessed March 2024 at https://doi.org/10.3133/sir20085028.
Huron-Clinton Metroparks, 2024, Lake St. Clair beach area improvements: Huron-Clinton Metroparks web page, accessed March 15, 2024, at https://www.metroparks.com/projects/#11.
International Joint Commission United States and Canada, 1987, Great Lakes water quality agreement—Protocol amending the 1978 agreement between Canada and the United States of America on Great Lakes water quality, 1978, as amended on October 16, 1983: International Joint Commission United States and Canada, 75 p., accessed March 2024 at https://publications.gc.ca/site/eng/9.822800/publication.html.
Ishii, S., Hansen, D.L., Hicks, R.E., and Sadowsky, M.J., 2007, Beach sand and sediments are temporal sinks and sources of Escherichia coli in Lake Superior: Environmental Science & Technology, v. 41, no. 7, p. 2203–2209, accessed March 2024 at https://doi.org/10.1021/es0623156.
Jackson, P.R., 2016, Seiche-induced unsteady flows in the Huron-Erie Corridor: Spectral analysis of oscillations in stage and discharge in the St. Clair and Detroit Rivers: Proceedings of the International Conference on Fluvial Hydraulics (River Flows 2016), v. 978-1, p. 235–241, accessed August 2024 at https://www.researchgate.net/publication/305346511_Seiche-induced_unsteady_flows_in_the_Huron-Erie_Corridor_Spectral_analysis_of_oscillations_in_stage _and_discharge_in_the_St_Clair_and_Detroit_Rivers.
Jordan, D.W., Kane, M.E., Gehring, T.M., Sokol, R.L., and Alm, E.W., 2019, Exclusion of ring-billed gulls (Larus delawarensis) from recreational beaches using canid harassment: The Condor, v. 121, no. 1, p. 1–10, accessed August 2024, at https://doi.org/10.1093/condor/duy002.
Julian, P., and Helsel, D., 2024, NADA2—Data analysis for censored environmental data, version 1.18: R package software release, accessed February 21, 2025, at https://CRAN.R-project.org/package=NADA2.
Kinzelman, J.L., Whitman, R.L., Byappanahalli, M., Jackson, E., and Bagley, R.C., 2003, Evaluation of beach grooming techniques on Escherichia coli density in foreshore sand at North Beach, Racine, WI: Lake and Reservoir Management, v. 19, no. 4, p. 349–354, accessed July 2024 at https://doi.org/10.1080/07438140309353944.
Lowney, M.S., Beckerman, S.F., Barras, S.C., and Seamans, T.W., 2018, Gulls: Fort Collins, Colo., U.S. Department of Agriculture—Animal and Plant Health Inspection Service, Wildlife Damage Management Technical Series, v.17, 16 p., accessed August 2024 at https://digitalcommons.unl.edu/nwrcwdmts/17.
Macomb County Health Department, 2024, Bathing beach monitoring: Macomb County Health Department web page, accessed March 8, 2024, at https://www.macombgov.org/departments/health-department/environmental-health-services/bathing-beach-monitoring.
Malott, S., O’Carroll, D.M., and Robinson, C.E., 2016, Dynamic groundwater flows and geochemistry in a sandy nearshore aquifer over a wave event: Water Resources Research, v. 52, no. 7, p. 5248–5264, accessed March 2024 at https://doi.org/10.1002/2015WR017537.
Michigan Department of Environment, Great Lakes, and Energy, 2024a, BeachGuard database, Lake St. Clair—H.C.M.A.—Lake St. Clair Metropark Beach: Michigan Department of Environment, Great Lakes, and Energy web page, accessed March 15, 2024, at https://www.egle.state.mi.us/beach/BeachDetail.aspx?BeachID=545.
Michigan Department of Environment, Great Lakes, and Energy, 2024b, E. coli in surface waters: Michigan Department of Environment, Great Lakes, and Energy web page, accessed August 5, 2024, at https://www.michigan.gov/egle/about/organization/water-resources/glwarm/e-coli-in-surface-waters.
Michigan Department of Environment, Great Lakes, and Energy, 2024c, Standards in Michigan beach monitoring: Michigan Department of Environment, Great Lakes, and Energy web page, accessed August 5, 2024, at https://www.michigan.gov/egle/about/organization/water-resources/beaches/about-beach-monitoring#:~:text=If%20either%20the%20single-day%20or%2030-day%2 0average%20bacteria,when%20bacteria%20levels%20fall%20back%20within%20acceptable%20levels.
Michigan Department of Environmental Quality, 2006, Water resources protection, part 4, Water quality standards: Michigan Department of Environmental Quality Water Bureau report, 72 p., accessed March 15, 2024, at https://www.epa.gov/sites/default/files/2014-12/documents/mi-part4-wqs.pdf.
Michigan Department of Natural Resources, 1988, Remedial action plan for Clinton River Area of Concern, November 1988: Michigan Department of Natural Resources report, 447 p., accessed March 8, 2024, at https://www.epa.gov/sites/default/files/2015-08/documents/1988_clinton_river_rap.pdf.
Myers, D.N., Stoeckel, D.M., Bushon, R.N., Francy, D.S., and Brady, A.M.G., 2014, Fecal indicator bacteria: U.S. Geological Survey Techniques of Water-Resources Investigations, book 9, chap. A7.1, 73 p., accessed March 6, 2024, at https://pubs.usgs.gov/publication/twri09A7.1.
National Oceanic and Atmospheric Administration, 2024, Local climatological data for Mount Clemens ANG Base, MI US: National Oceanic and Atmospheric Administration web page, accessed March 6, 2024, at https://www.ncdc.noaa.gov/cdo-web/datasets/LCD/stations/WBAN:14804/detail.
National Water Quality Monitoring Council, 2024, Water Quality Portal, U.S. Geological Survey and U.S. Environmental Protection Agency web page, accessed August 28, 2024, at https://www.waterqualitydata.us/.
Nevers, M.B., Buszka, P.M., Byappanahalli, M.N., Cole, T., Corsi, S.R., Jackson, P.R., Kinzelman, J.L., Nakatsu, C.H., and Phanikumar, M.S., 2022, Microbial source tracking and evaluation of best management practices for restoring degraded beaches of Lake Michigan: Journal of Great Lakes Research, v. 48, no. 2, p. 441–454, accessed July 2024 at https://doi.org/10.1016/j.jglr.2022.01.009.
Nevers, M.B., Byappanahalli, M.N., Shively, D., Buszka, P.M., Jackson, P.R., and Phanikumar, M.S., 2018, Identifying and eliminating sources of recreational water quality degradation along an urban coast: Journal of Environmental Quality, v. 47, no. 5, p. 1042–1050, accessed July 2024 at https://doi.org/10.2134/jeq2017.11.0461.
Palmer, J.A., Law, J.Y., and Soupir, M.L., 2020, Spatial and temporal distribution of E. coli contamination on three inland lake and recreational beach systems in the upper Midwestern United States: Science of the Total Environment, v. 722, 9 p., accessed July 2024 at https://doi.org/10.1016/j.scitotenv.2020.137846.
Rivadeneira, P., Kross, S., Navarro-Gonzalez, N., and Jay-Russell, M., 2018, A review of bird deterrents used in agriculture, in Woods, D.M., ed., Proceedings of the 28th Vertebrate Pest Conference: University of California, Davis, v. 28, p. 218–223, accessed August 2024 at https://doi.org/10.5070/V42811040.
Rosenberry, D.O., 2000, Unsaturated-zone wedge beneath a large, natural lake: Water Resources Research, v. 36, no. 12, p. 3401–3409, accessed August 2024 at https://doi.org/10.1029/2000WR900213.
Rosenberry, D.O., and LaBaugh, J.W., 2008, Field techniques for estimating water fluxes between surface water and ground water: U.S. Geological Survey Techniques and Methods 4–D2, 128 p., accessed March 2024 at https://doi.org/10.3133/tm4D2.
Rosenberry, D.O., and Morin, R.H., 2004, Use of an electromagnetic seepage meter to investigate temporal variability in lake seepage: Groundwater, v. 42, no. 1, p. 68–77, accessed July 2024 at https://doi.org/10.1111/j.1745-6584.2004.tb02451.x.
Rosenberry, D.O., Sheibley, R.W., Cox, S.E., Simonds, F.W., and Naftz, D.L., 2013, Temporal variability of exchange between groundwater and surface water based on high-frequency direct measurements of seepage at the sediment-water interface: Water Resources Research, v. 49, no. 5, p. 2975–2986, accessed August 2024 at https://doi.org/10.1002/wrcr.20198.
Rumball, N.A., Mayer, H.B., and McLellan, S.L., 2021, Selective survival of Escherichia coli phylotypes in freshwater beach sand: Applied and Environmental Microbiology, v. 87, no. 4, p. e02473–20, accessed March 2024 at https://doi.org/10.1128/AEM.02473-20.
Safaie, A., Weiskerger, C.J., Nevers, M.B., Byappanahalli, M.N., and Phanikumar, M.S., 2021, Evaluating the impacts of foreshore sand and birds on microbiological contamination at a freshwater beach: Water Research, v. 190, no. 116671, accessed August 2024 at https://doi.org/10.1016/j.watres.2020.116671.
Standridge, J.H., Delfino, J.J., Kleppe, L.B., and Butler, R., 1979, Effect of waterfowl (Anas platyrhynchos) on indicator bacteria populations in a recreational lake Madison, Wisconsin: Applied and Environmental Microbiology, v. 38, no. 3, p. 547–550, accessed July 2024 at https://doi.org/10.1128/aem.38.3.547-550.1979.
Taniguchi, M., and Fukuo, Y., 1996, An effect of seiche on groundwater seepage rate into Lake Biwa, Japan: Water Resources Research, v. 32, no. 2, p. 333–338, accessed August 2024 at https://doi.org/10.1029/95WR03245.
Titchenell, M.A., and Lynch, W.E., Jr., 2010, Coping with Canada geese—Conflict management and damage prevention strategies: The Ohio State University Extension, Ohio Woodland Stewards Program, 8 p., accessed July 2024 at https://woodlandstewards.osu.edu/publications/wildlife.
U.S. Environmental Protection Agency, 2012, Recreational water quality criteria: U.S. Environmental Protection Agency Office of Water 820–F–12–058, 63 p., accessed March 8, 2024, at https://www.epa.gov/sites/default/files/2015-10/documents/rwqc2012.pdf.
U.S. Environmental Protection Agency, 2023, EPA’s Beach Report—2022 Swimming Season: U.S. Environmental Protection Agency Report EPA 823-R23-005, 4 p., accessed March 14, 2024, at https://www.epa.gov/beaches/annual-beach-swimming-season-reports.
U.S. Environmental Protection Agency, 2024, Clinton River AOC: U.S. Environmental Protection Agency web page, accessed July 5, 2024, at https://www.epa.gov/great-lakes-aocs/clinton-river-aoc.
U.S. Fish and Wildlife Service, 2024, Estimating flock size: U.S. Fish and Wildlife Service Aerial Observer Training and Testing Resources web page, accessed April 30, 2024, at https://www.fws.gov/waterfowlsurveys/forms/counting.jsp?menu=counting.
U.S. Geological Survey, 2025, USGS water data for the Nation: U.S. Geological Survey National Water Information System database, accessed February 27, 2025, at https://doi.org/10.5066/F7P55KJN.
U.S. Geological Survey, [variously dated], National field manual for the collection of water-quality data: U.S. Geological Survey Techniques of Water-Resources Investigations, book 9, chaps. A1–A10, accessed March 6, 2024, at https://pubs.water.usgs.gov/twri9A.
Vogel, L.J., O’Carroll, D.M., Edge, T.A., and Robinson, C.E., 2016, Release of Escherichia coli from foreshore sand and pore water during intensified wave conditions at a recreational beach: Environmental Science & Technology, v. 50, no. 11, p. 5676–5684, accessed April 2024 at https://doi.org/10.1021/acs.est.6b00707.
Weiskerger, C.J., Brandão, J., Ahmed, W., Aslan, A., Avolio, L., Badgley, B.D., Boehm, A.B., Edge, T.A., Fleisher, J.M., Heaney, C.D., Jordao, L., Kinzelman, J.L., Klaus, J.S., Kleinheinz, G.T., Meriläinen, P., Nshimyimana, J.P., Phanikumar, M.S., Piggot, A.M., Pitkänen, T., Robinson, C., and Harwood, V.J., 2019, Impacts of a changing earth on microbial dynamics and human health risks in the continuum between beach water and sand: Water Research, v. 162, p. 456–470, accessed August 2024 at https://doi.org/10.1016/j.watres.2019.07.006.
Whitman, R.L., Harwood, V.J., Edge, T.A., Nevers, M.B., Byappanahalli, M., Vijayavel, K., Brandão, J., Sadowsky, M.J., Wheeler Alm, E., Crowe, A., Ferguson, D., Ge, Z., Halliday, E., Kinzelman, J., Kleinheinz, G., Przybyla-Kelly, K., Staley, C., Staley, Z., and Solo-Gabriele, H.M., 2014, Microbes in beach sands—Integrating environment, ecology, and public health: Reviews in Environmental Science and Bio/Technology, v. 13, no. 3, p. 329–368, accessed August 2024 at https://doi.org/10.1007/s11157-014-9340-8.
Whitman, R.L., Horvath, T.G., Goodrich, M.L., Nevers, M.B., Wolcott, M.J., and Haack, S.K., 2001, Characterization of E. coli levels at 63rd Street Beach: Report to the City of Chicago, 85 p., accessed August 2024 at https://www.academia.edu/13121542/Characterization_of_E_coli_levels_at_63rd_Street_Beach.
Whitman, R.L., and Nevers, M.B., 2003, Foreshore sand as a source of Escherichia coli in nearshore water of a Lake Michigan beach: Applied and Environmental Microbiology, v. 69, no. 9, p. 5555–5562, accessed March 2024 at https://doi.org/10.1128/AEM.69.9.5555-5562.2003.
Wu, M.Z., O’Carroll, D.M., Vogel, L.J., and Robinson, C.E., 2017, Effect of low energy waves on the accumulation and transport of fecal indicator bacteria in sand and pore water at freshwater beaches: Environmental Science & Technology, v. 51, no. 5, p. 2786–2794, accessed April 2024 at https://doi.org/10.1021/acs.est.6b05985.
Conversion Factors
U.S. customary units to International System of Units
Temperature in degrees Celsius (°C) may be converted to degrees Fahrenheit (°F) as follows:
°F = (1.8 × °C) + 32.
Temperature in degrees Fahrenheit (°F) may be converted to degrees Celsius (°C) as follows:
°C = (°F – 32) / 1.8.
Datum
Horizontal coordinate information is referenced to the North American Datum of 1983 (NAD 83).
Vertical coordinate information is referenced to the North American Vertical Datum of 1988 (NAVD 88).
Supplemental Information
Concentrations of Escherichia coli (E. coli) in water are reported as most probable number per 100 milliliters (MPN/100 mL) or as colony-forming units per 100 milliliters (CFU/100 mL).
Concentrations of Escherichia coli (E. coli) in beach sediment are reported as most probable number per gram of dry weight (MPN/gDW).
Abbreviations
>
greater than
<
less than
AOC
Area of Concern
BUI
beneficial use impairment
E. coli
Escherichia coli
MCHD
Macomb County Health Department
MI-BaRL
Michigan Bacteriological Research Laboratory
MPN
most probable number (of bacteria)
MST
microbial source tracking
n
number of samples
p-value
probability value
TBC
total body contact
USGS
U.S. Geological Survey
For more information about this publication, contact:
Director, USGS Upper Midwest Water Science Center
2280 Woodale Drive
Mounds View, MN 55112
763–783–3100
For additional information, visit: https://www.usgs.gov/centers/upper-midwest-water-science-center.
Publishing support provided by the USGS Science Publishing Network,
Rolla Publishing Service Center
Disclaimers
Any use of trade, firm, or product names is for descriptive purposes only and does not imply endorsement by the U.S. Government.
Although this information product, for the most part, is in the public domain, it also may contain copyrighted materials as noted in the text. Permission to reproduce copyrighted items must be secured from the copyright owner.
Suggested Citation
Lockmiller, H.A., Byers, V.C., and Fogarty, L.R., 2026, Escherichia coli monitoring and assessment in 2022 and 2023 after beach restoration at Lake St. Clair Metropark Beach, Macomb County, Michigan: U.S. Geological Survey Scientific Investigations Report 2026–5134, 24 p., https://doi.org/10.3133/sir20265134.
ISSN: 2328-0328 (online)
Study Area
| Publication type | Report |
|---|---|
| Publication Subtype | USGS Numbered Series |
| Title | Escherichia coli monitoring and assessment in 2022 and 2023 after beach restoration at Lake St. Clair Metropark Beach, Macomb County, Michigan |
| Series title | Scientific Investigations Report |
| Series number | 2026-5134 |
| DOI | 10.3133/sir20265134 |
| Publication Date | April 09, 2026 |
| Year Published | 2026 |
| Language | English |
| Publisher | U.S. Geological Survey |
| Publisher location | Reston, VA |
| Contributing office(s) | Upper Midwest Water Science Center |
| Description | Report: viii, 24 p.; Data Release; Dataset |
| Country | United States |
| State | Michigan |
| Other Geospatial | Lake St. Clair Metropark Beach |
| Online Only (Y/N) | Y |
| Additional Online Files (Y/N) | N |