

Water Use in Louisiana, 2020
Links
- Document: Report (51.4 MB pdf) , HTML , XML
- Data Release: USGS Data Release - Water withdrawals in Louisiana, 2020
- NGMDB Index Page: National Geologic Map Database Index Page (html)
- Download citation as: RIS | Dublin Core
Acknowledgments
This report was made possible through the assistance and cooperation of personnel at public-supply, industrial, and power-generation facilities throughout Louisiana.
Additionally, special thanks are given to U.S. Geological Survey employees Zachary Smith, Drew Westerman, Alexe Daccuro, Erik Wojtylko, Natalie Trahan, Max Lindaman, Melissa Harris, and Natalie Houston for their assistance.
Abstract
The U.S. Geological Survey (USGS), in cooperation with the Louisiana Department of Transportation and Development, collected water-withdrawal and water-use data from a 2020 inventory of water withdrawals in Louisiana. In 2020, approximately 8,700 million gallons per day (Mgal/d) of water was withdrawn from groundwater and surface-water sources in Louisiana, which represented a 0.22-percent decrease from 2015. Total groundwater withdrawals were about 1,900 Mgal/d, an increase of 7.1 percent from 2015, and total surface-water withdrawals were about 6,800 Mgal/d, a decrease of 2.1 percent from 2015 to 2020.
Total water withdrawals, in million gallons per day, in 2020 for the various categories of use were as follows: public supply, 720; industry, 2,100; power generation, 4,100; rural domestic, 39; livestock, 7.0; rice irrigation, 930; general irrigation, 250; and aquaculture, 590. From 2015 to 2020, Louisiana’s total withdrawals for public supply increased by 1.4 percent, industry decreased by 2.3 percent, power generation decreased by 4.9 percent, rural domestic decreased by 1.2 percent, livestock increased by 11 percent, rice irrigation increased by 13 percent, general irrigation increased by 12 percent, and aquaculture increased by 20 percent.
About 51 percent (approximately 960 Mgal/d) of all groundwater withdrawn was from the Chicot aquifer system and 24 percent (approximately 450 Mgal/d) was withdrawn from the Mississippi River alluvial aquifer. Since 2015, withdrawals from the Chicot aquifer system increased by 13 percent, and withdrawals from the Mississippi River alluvial aquifer increased by 18 percent. About 72 percent (4,900 Mgal/d) of all surface water withdrawn was from the Mississippi River main stem. This value represents a 1.1-percent decrease in withdrawals from 2015 to 2020.
All water-withdrawal and water-use data presented in this report should be considered estimates. Because of rounding, totals and percentages presented in the tables, figures, and text in the report may differ slightly from totals or percentages calculated individually.
Introduction
Louisiana has a total land and water area of over 52,000 square miles (U.S. Census Bureau, 2012), and water resources are abundant throughout the State. Every day, large amounts of groundwater and surface water are withdrawn from natural sources and are used for public-supply, industrial, power-generation, rural-domestic, livestock, irrigation, and aquaculture purposes. Water-use data are essential to appraise the effects of present use and to plan for the future use of Louisiana’s water resources. The U.S. Geological Survey (USGS), in cooperation with the Louisiana Department of Transportation and Development, has collected and published water-withdrawal and water-use information on a 5-year basis since 1960.
Purpose and Scope
The purpose of this report is to present data from a 2020 inventory of water withdrawals in Louisiana. This report presents information on withdrawals from groundwater and surface-water sources for use in public supply, industry, power generation, rural domestic, livestock, irrigation, and aquaculture for each parish in Louisiana. Included in the report are tables of water use by category, parish, aquifer or aquifer system, and surface-water basin. This report also presents trends in Louisiana water withdrawals based on data from previous 5-year water-use reports developed since 1960 (Snider and Forbes, 1961; Bieber and Forbes, 1966; Dial, 1970; Cardwell and Walter, 1979; Walter, 1982; Lurry, 1987; Lovelace, 1991; Lovelace and Johnson, 1996; Sargent, 2002; Sargent, 2007; Sargent, 2012; and Collier and Sargent, 2018).
Presentation of Data
The 2020 water-use data in this report are aggregated by category of use, parish, water source, aquifer, and surface-water basin. The information is presented in several formats to offer a complete description of water use in Louisiana.
The section entitled “Water Use by Category” describes the 2020 groundwater and surface-water withdrawals for public-supply, industrial, power-generation, rural-domestic, livestock, irrigation, and aquaculture purposes. Graphical and tabular data for each parish, major aquifer, and surface-water basin in Louisiana are presented in the report. Each of Louisiana’s 64 parishes (fig. 1) are presented in alphabetical order by parish name in appendix 1. Water-withdrawal and water-use data are also presented for the 13 major aquifers or aquifer systems, listed in order from youngest to oldest (figs. 2, 3), and for the 10 surface-water basins (fig. 4). Additionally, the report contains sections on total water withdrawals and trends in water withdrawals and water use in Louisiana as evaluated since 1960.
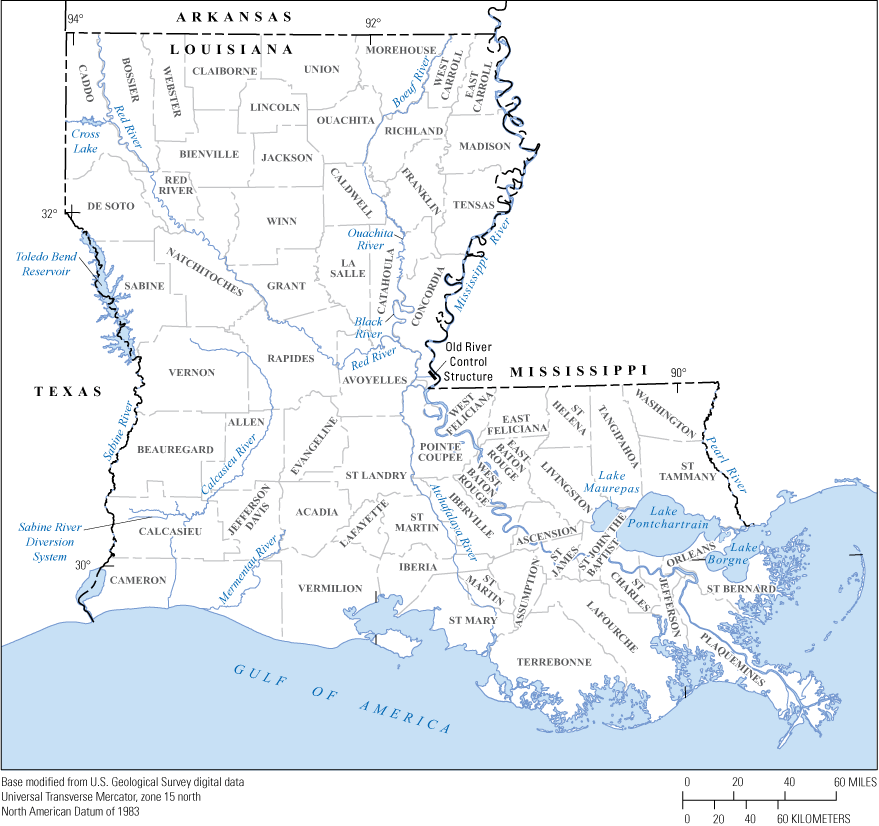
Parishes in Louisiana.
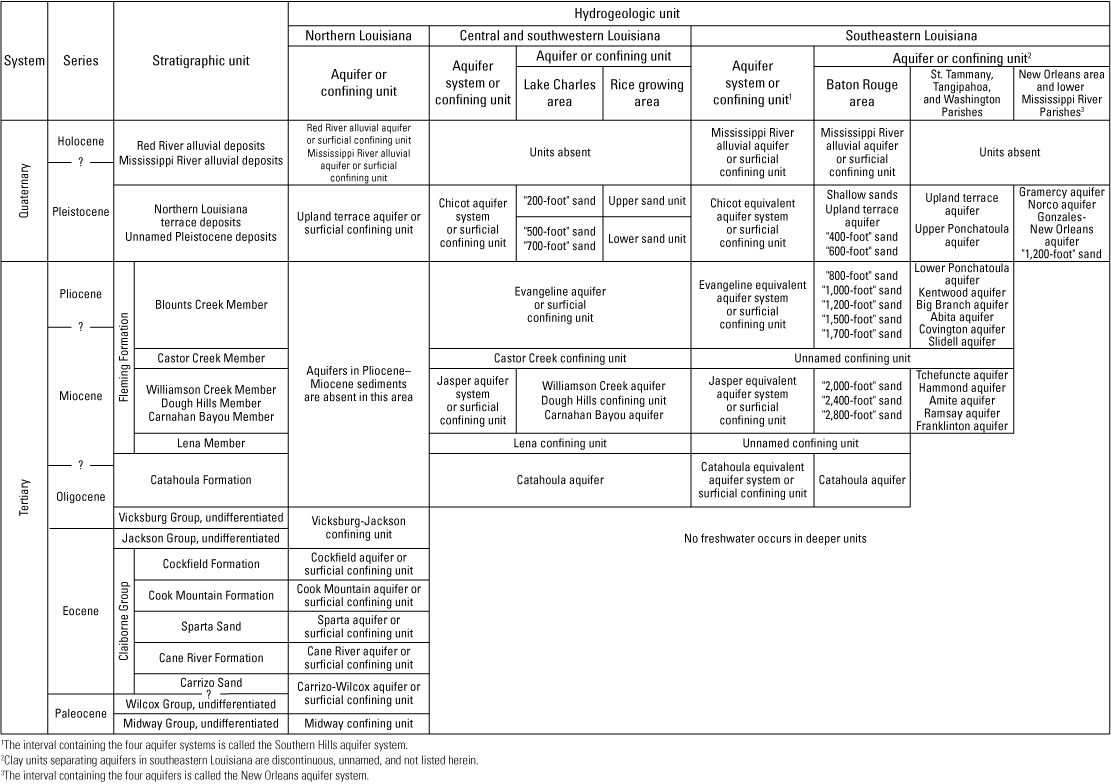
Hydrogeologic units in Louisiana (modified from Lovelace and Lovelace, 1995).
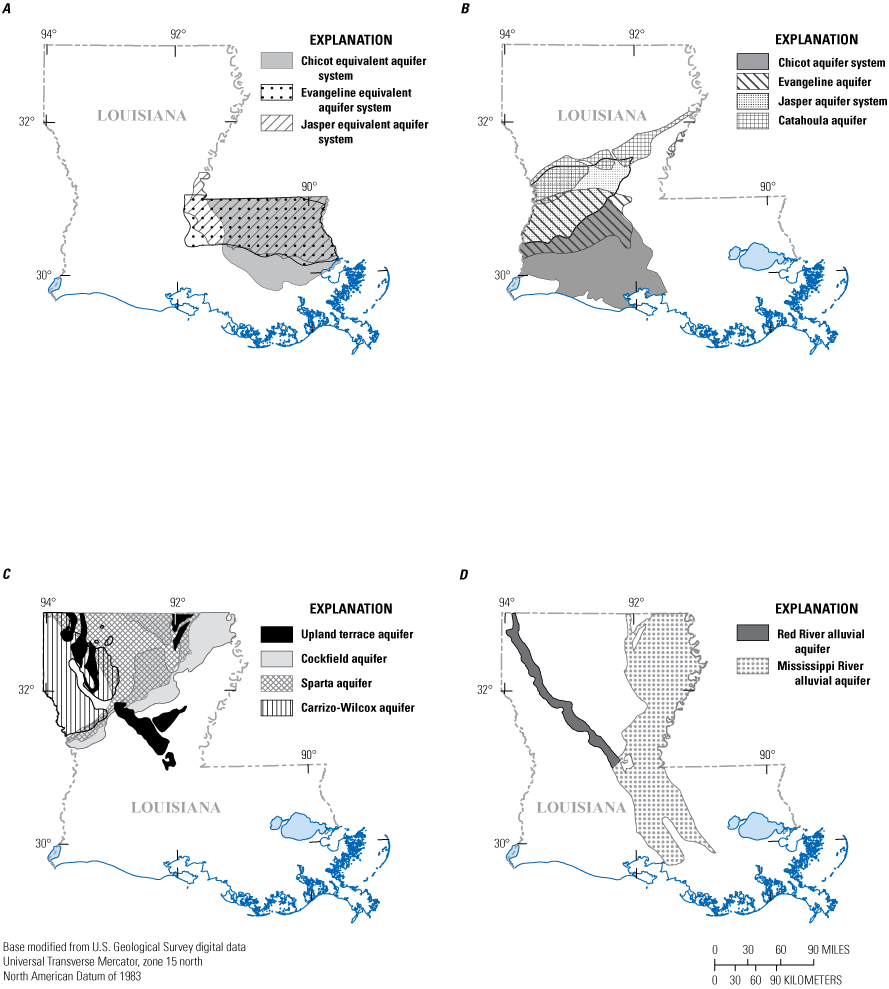
Approximate areal extent of Louisiana’s freshwater aquifers and aquifer systems, by region: A, southeastern (Jasper, Evangeline, and Chicot equivalent aquifer systems); B, central and southwestern (Catahoula and Evangeline aquifers and Jasper and Chicot aquifer systems); C, northern (upland terrace, Sparta, Carrizo-Wilcox, and Cockfield aquifers); and D, the Mississippi River and Red River alluvial aquifers (modified from Stuart and others, 1994).
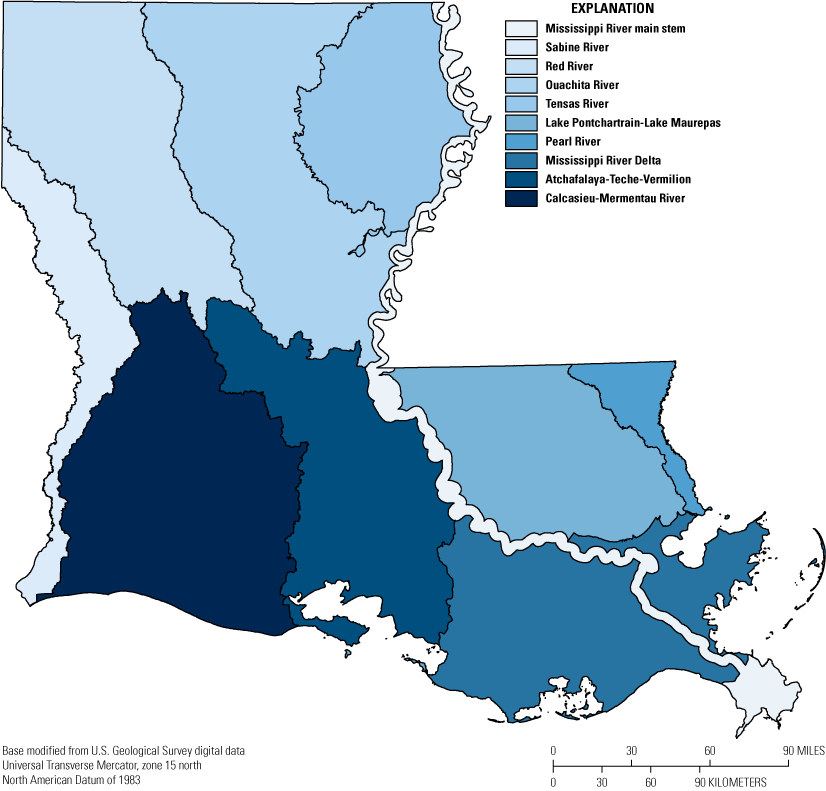
Major surface-water basins in Louisiana (modified from Garrison and Covay, 1994).
Data in this report are compiled from reported and estimated water withdrawals made during the 2020 calendar year. The data are limited by the accuracy of the information reported by the individual facilities or users and by the accuracy of ancillary data and methods used to estimate withdrawals when reported withdrawals were unavailable. All water-withdrawal and water-use data presented in this report should be considered estimates. Water-use values presented in tables and figures have been rounded to two decimal places, and water-use values presented in the text have been rounded to two significant figures. However, all totals and percentages presented in the report were calculated using unrounded values stored in a water-use database at the USGS office in Baton Rouge, La. Because of this rounding, totals and percentages presented in tables, figures, and text in the report may differ slightly from totals or percentages calculated by using rounded numbers in the report. (For example, as stated in the section “Public Supply,” withdrawals for public supply totaled approximately 720 million gallons per day [Mgal/d], but using the rounded total for each source [groundwater, 360 Mgal/d, and surface water, 370 Mgal/d], the sum is 730 Mgal/d.) Withdrawals that were less than 0.005 Mgal/d are not shown in tables or on figures, unless otherwise noted, but are included in calculations of percentages and totals. All historical withdrawal data (years 1960–75) presented in bar charts are from previous 5-year water-use data compilations and are presented without interpretation. Historical water-use data are updated and corrected as new information becomes available. Because of this practice, water-use values from years prior to 2020 that are presented in this report may not exactly match data presented in previously published 5-year water-use reports.
Previous Reports
The previous 5-year reports that have been published are as follows: Snider and Forbes (1961), Bieber and Forbes (1966), Dial (1970), Cardwell and Walter (1979), Walter (1982), Lurry (1987), Lovelace (1991), Lovelace and Johnson (1996), Sargent (2002), Sargent (2007), Sargent (2012), and Collier and Sargent (2018). In addition, the 2015 report was accompanied by a related data release, which contained water withdrawn in 2014 and 2015, tabulated by parish, water-use category, source type, and designated source name (Collier, 2018). Related, special-topic reports, include Lurry (1985) and Stuart and Lurry (1988), which discuss specific information about public water supplies in Louisiana, and Lovelace (1994), which discusses water requirements for crawfish farming at selected sites in south-central Louisiana. Additionally, Covay and others (1992) reported on water requirements for growing rice in southwestern Louisiana, 1985–86.
Data Collection and Estimation
Water-withdrawal information for public-supply, industrial, and power-generation facilities was primarily obtained directly from the facilities. The main source for public water system information was the Louisiana Department of Health’s Safe Drinking Water Program, Drinking Water Watch database (Louisiana Department of Health, 2020) and the U.S. Environmental Protection Agency’s Safe Drinking Water Information System (U.S. Environmental Protection Agency, 2020). These sources provided contact information, identified whether the water source was groundwater or surface water, and indicated the current operational status (active or inactive) for all the current water suppliers in a parish. The Louisiana Manufacturing Industry Database (Manufacturers’ News, Inc., 2020), an online directory that lists Louisiana manufacturers and their contact information, was the main source for industrial facilities, and the U.S. Energy Information Administration (U.S. Energy Information Administration, 2021), along with prior information acquired during previous compilations, provided the majority of the information for power-generation facilities. Hydroelectric power-generation instream water use was not included in surface-water withdrawals in this report because the water was not considered withdrawn but is discussed in the “Power Generation” subsection of “Water Use by Category.” A master list of these water-use facilities was compiled into a local database at the USGS office in Baton Rouge, La.
Water withdrawals for rural-domestic and livestock uses were estimated on the basis of population data and per capita use rates. Population data were compiled from multiple sources. Parish and State population estimates for 2020 were obtained from the U.S. Census Bureau (2020) and rural-domestic populations for each parish were based on U.S. Census Bureau’s American Housing Survey (U.S. Census Bureau, 1993, 2011), which reported estimates of populations served by a public-supply facility. For the purpose of this report, an average of 80 gallons per day (gal/d) per person was used to estimate withdrawals by the rural-domestic portion of the population (Lurry, 1987). Population data used for livestock estimates were from the Louisiana Cooperative Extension Service (2023). In Louisiana, livestock that require substantial amounts of water included cattle, horses, swine, sheep, and poultry. For consistency and comparability with past water-use reports, the per capita use rates for livestock from previous reports were used to estimate withdrawals for livestock. The rates used (in gal/d per head) were as follows: milk cows, 20; other cattle, 10; horses, 10; swine, 3.0; sheep, 2.0; and poultry, 0.04 (Lovelace and Johnson, 1996, p. 11).
Water withdrawals for irrigation were estimated on the basis of crop acreage in each parish and irrigation application rates. Several different sources were used to study and develop estimates of water application-rate data for crop irrigation. The sources included the U.S. Department of Agriculture's 2017 Census of Agriculture and 2018 Irrigation and Water Management Survey (National Agricultural Statistics Service, 2019a, b) in addition to the Louisiana State University Agricultural Extension. All crop-acreage data originated from inventories compiled by the Louisiana Cooperative Extension Service (2023) for calendar year 2020.
Water withdrawals for aquaculture were estimated on the basis of reported and estimated use. Water withdrawals at bait farms and fish hatcheries were obtained directly from the facilities. Water withdrawals for crawfish, catfish, and alligator farms were estimated for each parish using 2020 acreage or other production data available from the Louisiana Cooperative Extension Service (2023) and application rates for crawfish and catfish were obtained from the Louisiana State University Agricultural Extension Service.
Water-use information was compiled and divided into two groups: site-specific and aggregate. The information for public-supply, industrial, and power-generation facilities was collected for specific sites; that is, the location of the facility and its water sources were known and recorded with the withdrawal data. The information for rural-domestic, livestock, irrigation, and aquaculture withdrawals was estimated parish-wide, without knowledge of the exact location of each user or source of water. For these parish-wide, aggregated withdrawals, per capita use rates were used to estimate withdrawals for livestock and aquaculture, and water was distributed on the basis of data reported by farmers and county agents. Louisiana water-well registration inventories provided by the Louisiana Department of Natural Resources include data on the distribution of irrigation wells screened in different aquifers within a parish (Louisiana Department of Natural Resources, 2020). This information was used to distribute aggregated groundwater withdrawal data among the appropriate aquifers. Aggregated surface-water withdrawals in each parish were distributed among hydrologic basins on the basis of the percentage of the parish within each basin. Seasonal withdrawals, such as for irrigation and sugar cane processing, were prorated for the entire year.
All the water-use information was entered into a database at the USGS office in Baton Rouge, La. All withdrawal data in this report were retrieved from the USGS database and are expressed in millions of gallons per day (Mgal/d). The withdrawal data used in this report are available online in an associated U.S. Geological Survey data release (Robinson, 2025).
Most of the uses of water described in this report require freshwater, which, for purposes of this report, is defined as water containing less than 1,000 milligrams per liter (mg/L) of dissolved solids, or, for drinking water, less than 250 mg/L of chloride (U.S. Environmental Protection Agency, 2024). Most of the water withdrawals described in this report were assumed to be fresh. However, in some areas of Louisiana, especially near the Gulf of Mexico, USGS historical data indicate that chloride concentrations could exceed 250 mg/L, indicating a presence of saline water (Tollett and others, 2003; Lovelace, 2007). Collection and presentation of chloride concentrations in water withdrawn was beyond the scope of this study.
Water Use by Category
Water use is defined in this report as water withdrawn or diverted from a groundwater or surface-water source to be used for public-supply, industrial, power-generation, rural-domestic, livestock, irrigation, or aquaculture purposes. The glossary at the end of this report offers further explanation of the water-use categories that are discussed in this section.
In 2020, withdrawals for power generation accounted for about 47 percent of the total water withdrawn from both groundwater and surface-water sources, industry accounted for 24 percent, irrigation (rice and general irrigation combined) 14 percent, public supply 8.3 percent, aquaculture 6.8 percent, and rural domestic and livestock combined accounted for the approximated remainder of 0.53 percent (fig. 5). Irrigation accounted for the greatest percentage of groundwater withdrawals, about 43 percent of the total (fig. 6), and power generation was the category with the greatest surface-water withdrawals in the State, accounting for about 59 percent of the total withdrawals from all surface-water sources (fig. 7).
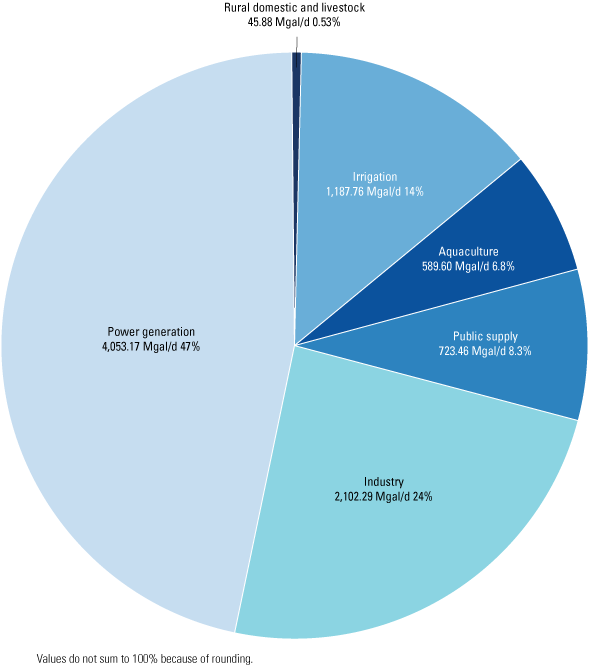
Total water withdrawals in Louisiana by water-use category, 2020 (Robinson, 2025). Mgal/d, million gallons per day; %, percent
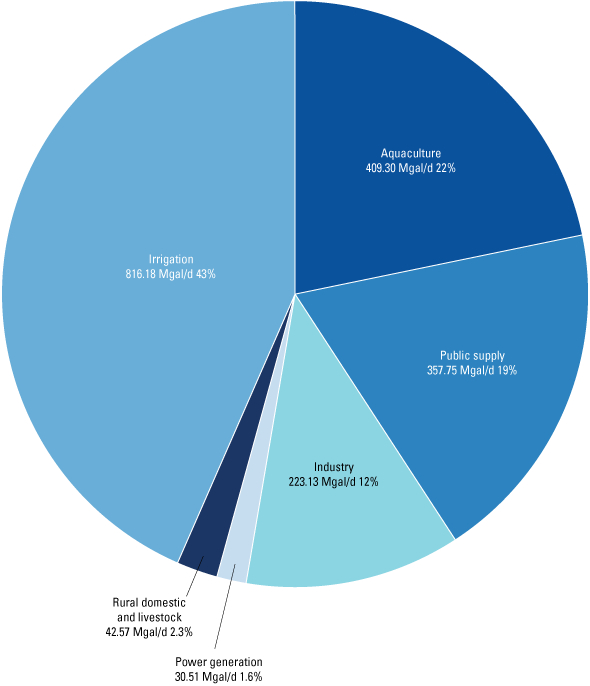
Groundwater withdrawals in Louisiana by water-use category, 2020 (Robinson, 2025). Mgal/d, million gallons per day; %, percent
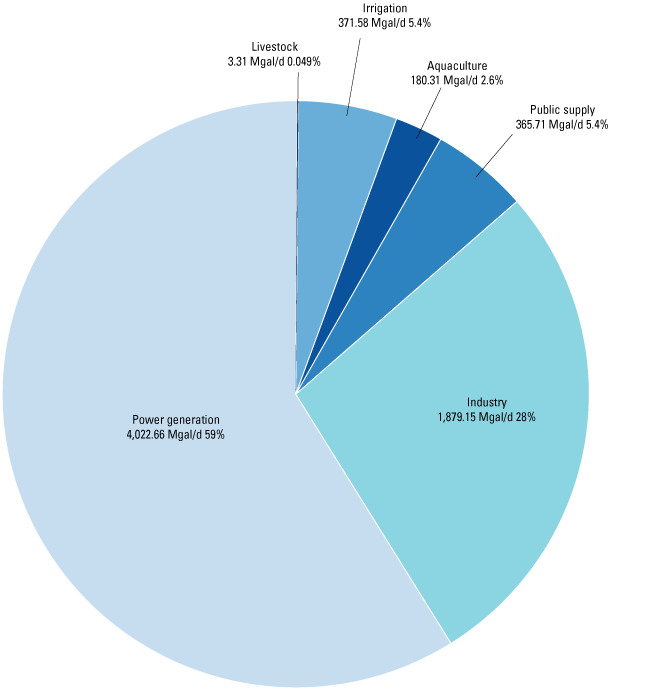
Surface-water withdrawals in Louisiana by water-use category, 2020 (Robinson, 2025). Mgal/d, million gallons per day; %, percent
Public Supply
Approximately 4.2 million people, 90 percent of Louisiana’s total population of 4.7 million in 2020 (U.S. Census Bureau, 2020), used about 720 Mgal/d of water provided by public-supply facilities (figs. 8 and 9). This water accounted for about 8.3 percent of the total water withdrawn in the State. Per capita use was 170 gal/d. Of the 720 Mgal/d, about 360 Mgal/d was withdrawn from groundwater sources, and about 370 Mgal/d was withdrawn from surface-water sources. Of the 4.2 million people receiving water from a public supplier, about 64 percent were supplied with water from a groundwater source, and about 36 percent were provided with water from a surface-water source. Table 1 lists withdrawals from the top 25 public suppliers in Louisiana in 2020.
Table 1.
Public-supply water withdrawals by top 25 public suppliers, 2020 (Robinson, 2025).[Withdrawals are in million gallons per day (Mgal/d). Summation of numbers in columns may differ slightly from totals because of rounding. Withdrawals that were less than 0.005 Mgal/d but greater than 0 are shown as 0.00, and blank values indicate that there were no withdrawals. No., number; W.W. waterworks; --, no data]
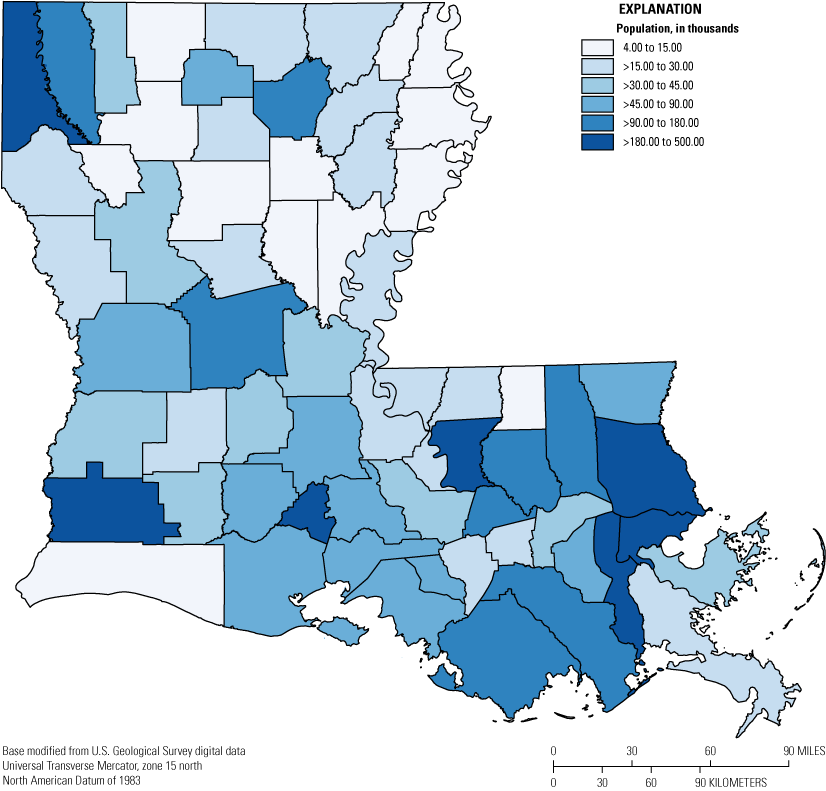
Louisiana population by parish, 2020 (U.S. Census Bureau, 2020).
Public-supply water withdrawals in Louisiana by parish, 2020 (Robinson, 2025).
All major aquifers and aquifer systems in Louisiana were utilized as sources of water for public supply (fig. 3; appendix 2). In northern Louisiana, the chief source of groundwater was the Sparta aquifer, which provided 9.1 percent (33 Mgal/d) of all the groundwater used for public supply in the State. In southwestern Louisiana, the Chicot aquifer system was the major source of groundwater, providing 26 percent (93 Mgal/d) of the State’s total groundwater used for public supply. In southeastern Louisiana, the Evangeline equivalent aquifer system provided 21 percent (76 Mgal/d) of the groundwater used for public supply in the State, and the Jasper equivalent aquifer system provided 19 percent (67 Mgal/d).
Of the 10 major surface-water basins in Louisiana (fig. 4), 7 were utilized as sources of water for public supply (appendix 3). The Mississippi River was the largest source of surface water used for public supply in the State. In 2020, about 240 Mgal/d of Mississippi River water was used, primarily to parishes in southeastern Louisiana where groundwater supplies are limited or unavailable. This amount represents 66 percent of the total surface-water withdrawals for public supply in Louisiana. Cross Lake (fig. 1) in the Red River basin supplied 10 percent of surface-water withdrawals for public supply (37 Mgal/d), and an additional 20 other major surface-water bodies provided the remaining 24 percent of surface withdrawals. In 2020, Orleans Parish had the greatest surface-water withdrawals by public suppliers, about 150 Mgal/d (appendix 1). At the time, approximately 380,000 people lived in Orleans Parish, making it the third most populated parish in the State (U.S. Census Bureau, 2020).
Some public-supply facilities provide water to industrial facilities. In 2020, public-supply facilities in Louisiana reported that about 2.6 Mgal/d was delivered to industrial facilities in 20 parishes. The greatest amount of water delivered to industries was in West Baton Rouge Parish, where public-supply deliveries totaled 1.5 Mgal/d (table 2).
Table 2.
Public-supply water withdrawals delivered to industries in Louisiana by parish, 2020 (Robinson, 2025).[Withdrawals are in million gallons per day (Mgal/d). Summation of numbers in columns may differ slightly from totals because of rounding. Withdrawals that were less than 0.005 Mgal/d but greater than 0 are shown as 0.00, and blank values indicate that there were no withdrawals. --, no data]
Industry
Industrial facilities in Louisiana withdrew approximately 2,100 Mgal/d of water in 2020, about 220 Mgal/d of which was from groundwater sources and 1,900 Mgal/d from surface-water sources. Industrial withdrawals accounted for 24 percent of all withdrawals in 2020. Chemical manufacturers withdrew approximately 1,600 Mgal/d or 75 percent of total industrial withdrawals. Most of the surface water withdrawn by industry was used for once-through cooling and was returned to its source after use. Table 3 lists 2020 withdrawals by source and Standard Industrial Classification (SIC) code for the major industrial groups.
Table 3.
Water withdrawals in Louisiana by major industrial group, 2020 (Robinson, 2025).[Withdrawals are in million gallons per day (Mgal/d). Summation of numbers in columns may differ slightly from totals because of rounding. Source of Standard Industrial Classification: Office of Management and Budget (1987). NA, not applicable; --, no data]
The majority of the 220 Mgal/d of groundwater withdrawn for industrial use in 2020 was in the southern portion of the State. In southeastern Louisiana, the Chicot, Evangeline, and Jasper equivalent aquifer systems provided approximately 90 Mgal/d or 40 percent of total groundwater withdrawals (appendix 2). The Evangeline and Catahoula aquifers and the Chicot and Jasper aquifer systems in the central and southwestern part of the State provided 83 Mgal/d, or 37 percent of total groundwater withdrawals. In northern Louisiana, the upland terrace, Cockfield, Sparta, and Carrizo-Wilcox aquifers provided 23 Mgal/d, or 10 percent. The Red River and Mississippi River alluvial aquifers provided 27 Mgal/d, the remaining 12 percent, of groundwater withdrawn for industrial use.
The major sources of surface water withdrawn for industrial use include the Mississippi River, Calcasieu River, the Sabine River Diversion System, and the Red River (fig. 1). Withdrawals and percentages of the total surface water withdrawn for industry by surface-water body are as follows: Mississippi River: 1,700 Mgal/d or 92 percent; Calcasieu River: 54 Mgal/d or 2.9 percent; Sabine River Diversion System: 41 Mgal/d or 2.2 percent; and Red River 19 Mgal/d or 1.0 percent. There were 16 other major contributing surface-water bodies, none of which provided more than 1 percent of total surface water withdrawn for industrial use, which, together, provided 46 Mgal/d or the remaining 2.4 percent.
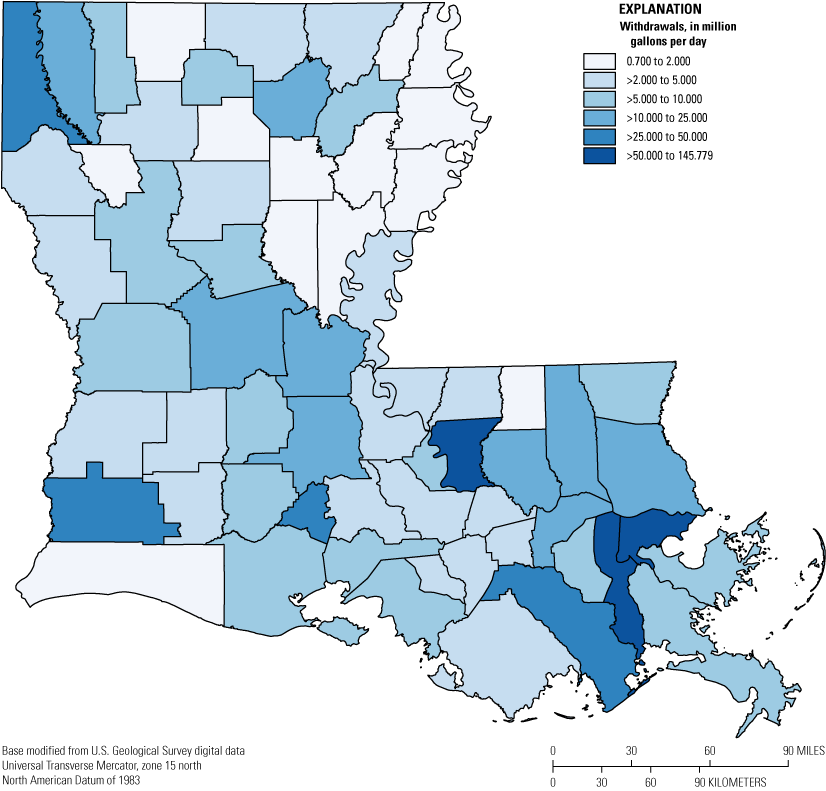
Total industrial withdrawals were greatest in St. Charles and Iberville Parishes, with 570 and 460 Mgal/d, respectively; which, combined, accounted for 49 percent of total industrial withdrawals made in 2020 (fig. 10).
Industrial water withdrawals in Louisiana by parish, 2020 (Robinson, 2025).
Power Generation
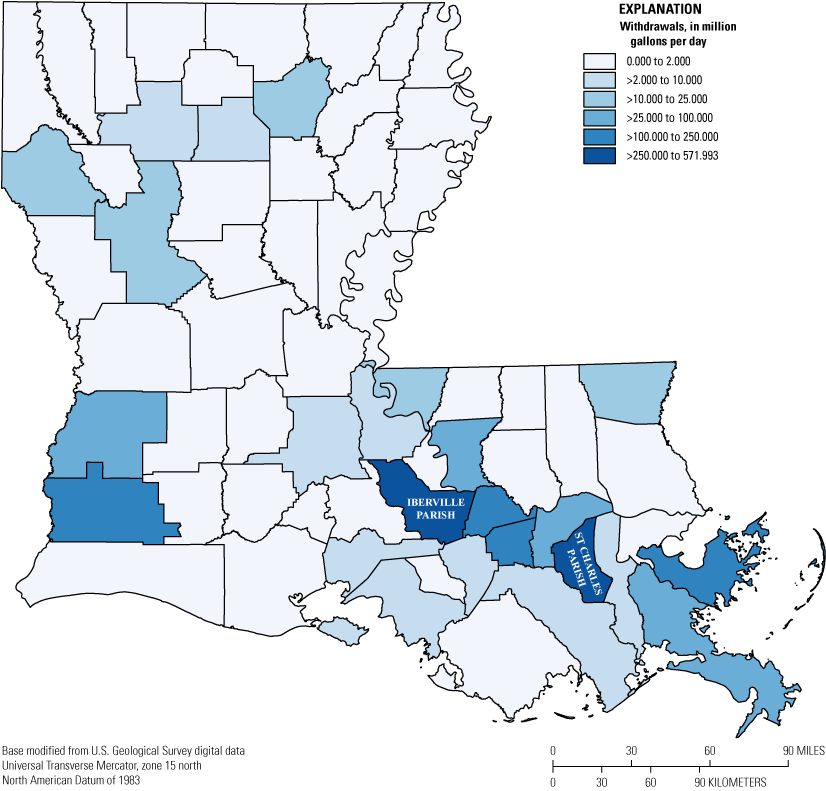
Power-generation facilities withdrew approximately 4,100 Mgal/d, or 47 percent of the total water withdrawn in Louisiana in 2020, making it the largest percentage of use out of all water-use categories. Of the total water withdrawn for power generation, 30 Mgal/d of groundwater and 2,900 Mgal/d of surface water were withdrawn for use in fossil-fuel plants, 3.1 Mgal/d of surface water was withdrawn for use in hydroelectric plants, and 0.013 Mgal/d of groundwater and 1,100 Mgal/d of surface water was withdrawn for use in nuclear plants. Total withdrawals were greatest in St. Charles Parish, which withdrew solely from surface-water sources, and accounted for approximately 1,900 Mgal/d, or 46 percent, of all withdrawals for power-generation purposes in 2020 (fig. 11).
Power-generation water withdrawals in Louisiana by parish, 2020 (Robinson, 2025).
Groundwater sources provided 31 Mgal/d, or 0.75 percent, of the water withdrawn for power generation. The Chicot and Jasper aquifer systems in southwestern Louisiana (figs. 2, 3; appendix 2) were the sources of 17 Mgal/d, or 55 percent, of the groundwater withdrawals for power generation. The remaining 14 Mgal/d, or 45 percent, of groundwater withdrawals were from the Chicot, Evangeline, and Jasper equivalent aquifer systems in southeastern Louisiana.
More than 99 percent, or 4,000 Mgal/d, of the total water withdrawn for power generation in 2020 originated from surface-water sources. The Mississippi River was the source for the majority of this surface water, providing an estimated 2,900 Mgal/d, or 73 percent, of total surface-water withdrawals for power-generation purposes. Most surface water withdrawn for power-generation purposes was used for cooling and was returned to its source after use.
In 2020, 71,000 Mgal/d of water passed through Louisiana’s two hydroelectric powerplants. The larger of the two hydroelectric powerplants, located at the Old River Control Structure in southern Concordia Parish (fig. 1) near the Louisiana-Mississippi border, uses water from the Mississippi River. In 2020, an average of 69,000 Mgal/d passed through the plant’s turbines. The second hydroelectric powerplant in Louisiana used water impounded in the Toledo Bend Reservoir in Sabine Parish on the Louisiana-Texas border (fig. 1) and released the water through the turbines near Burkeville, Texas. Because the plant is located on the Louisiana-Texas border, one-half of the water used was counted in Louisiana’s water-use inventory. In 2020, an average of 3,700 Mgal/d of water passed through the plant’s turbines. Of this amount, 1,900 Mgal/d was counted as power-generation instream use for Louisiana. As mentioned previously, for the purpose of this report, this hydroelectric power-generation instream use was not included in the surface-water withdrawal totals.
Rural Domestic
Approximately 490,000 people, or 10 percent of Louisiana’s population (U.S. Census Bureau, 2020), withdrew an estimated 39 Mgal/d of groundwater from privately owned domestic wells in 2020. Rural-domestic withdrawals accounted for about 0.45 percent of the total water withdrawn in the State in 2020.
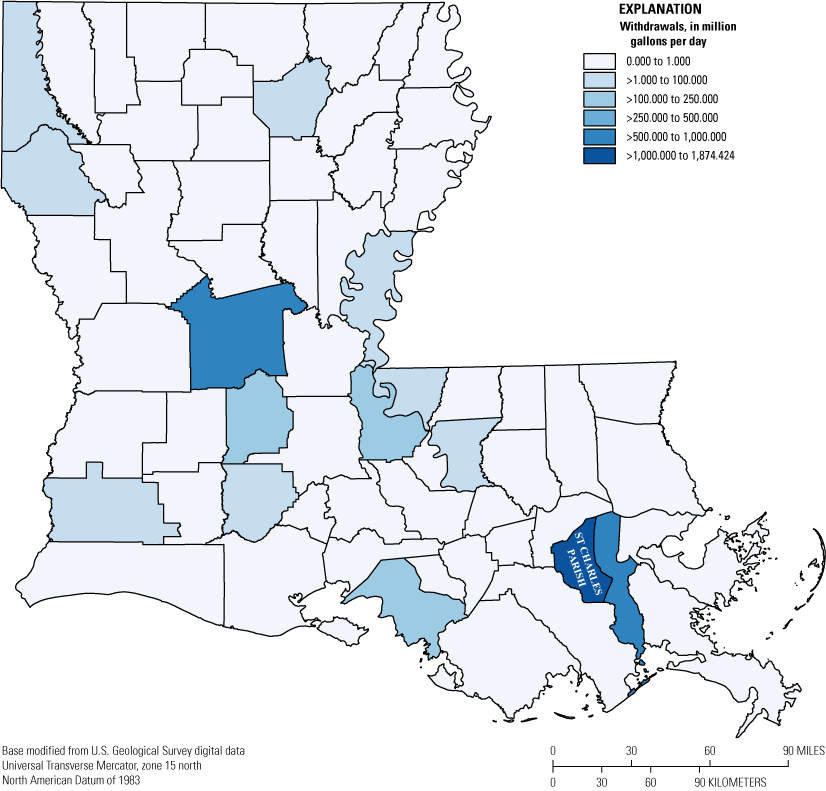
Every major aquifer and aquifer system (fig. 3; appendix 2) was used as a source for rural-domestic water. Percentages of the total groundwater withdrawals for rural-domestic use by major and minor aquifers are as follows: major aquifers in southeastern Louisiana, 40 percent; major aquifers in the central and southwestern parts of the State, 33 percent; major aquifers in northern Louisiana, 19 percent; and minor aquifers throughout the State, 7.8 percent. St. Tammany Parish had the greatest withdrawals for rural-domestic use at 5.3 Mgal/d (fig. 12). It was assumed that little or no surface water was used for rural-domestic purposes in Louisiana because suitable groundwater that requires minimal treatment generally is available.
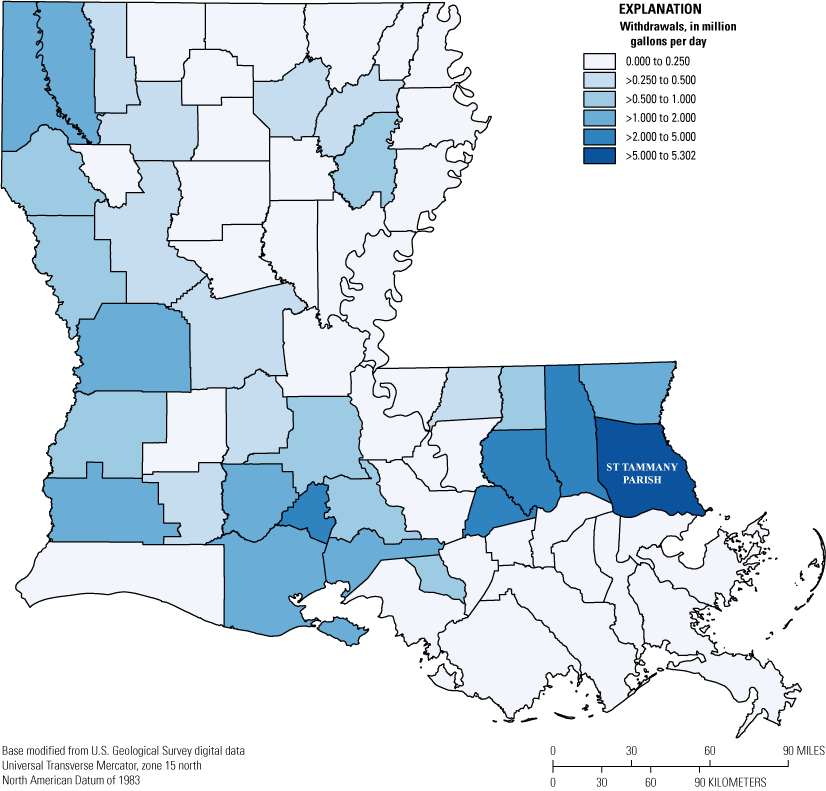
Rural-domestic water withdrawals in Louisiana by parish, 2020 (Robinson, 2025).
Livestock
In 2020, individual ranchers and farmers used approximately 7.0 Mgal/d of water for livestock operations, accounting for the smallest withdrawals of any category of use at about 0.081 percent of total water withdrawn in the State. Of the total withdrawals for livestock, 3.7 Mgal/d was groundwater, and 3.3 Mgal/d was surface water.
Surface-water sources for livestock withdrawals generally included small streams, canals, and private ponds. Groundwater sources included most of the major aquifers and aquifer systems. The Chicot aquifer system provided 1.1 Mgal/d, or 29 percent; the Mississippi River alluvial aquifer provided 0.93 Mgal/d, or 25 percent; and the upland terrace aquifer provided 0.38 Mgal/d, or 10 percent, of groundwater withdrawals for livestock (fig. 3; appendix 2). The remaining 1.3 Mgal/d, or 36 percent, of withdrawals was distributed among other aquifers in amounts less than 0.3 Mgal/d. Calcasieu and Vermilion Parishes had the greatest withdrawals for livestock, 0.37 and 0.36 Mgal/d, respectively (fig. 13).
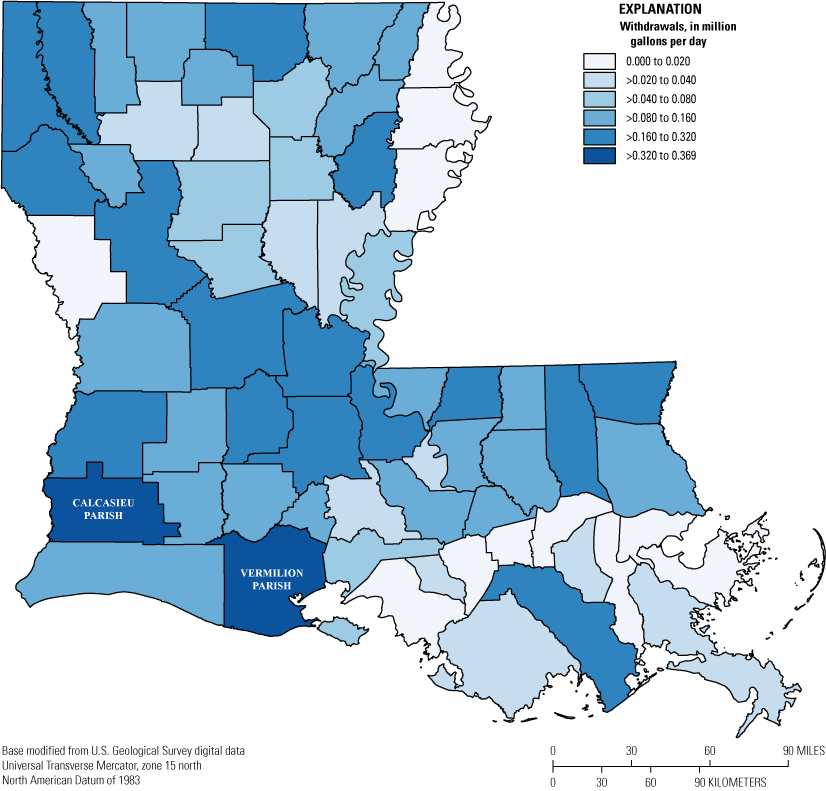
Livestock water withdrawals in Louisiana by parish, 2020 (Robinson, 2025).
Rice Irrigation
Farmers withdrew approximately 930 Mgal/d of water to irrigate about 470,000 acres of rice in 2020. Rice was harvested in 29 parishes, mainly in southwestern and northeastern Louisiana (Louisiana Cooperative Extension Service, 2023). All rice grown in Louisiana is assumed to be irrigated, and the average application rate in 2020 was about 2.2 acre-feet (acre-ft) per acre per year.
Of the total amount of water withdrawn for rice irrigation, about 620 Mgal/d, or 67 percent, was from groundwater sources and about 310 Mgal/d, 33 percent, was from surface-water sources. The greatest source of groundwater was the Chicot aquifer system in southwestern Louisiana, providing 440 Mgal/d, or 71 percent, of the total groundwater withdrawals (fig. 3; appendix 2). The Mississippi River alluvial aquifer in northeastern Louisiana provided 170 Mgal/d, or 28 percent, whereas other aquifers in the State contributed 8.6 Mgal/d, or 1.4 percent. Surface-water sources included streams, lakes, bayous, and canals. The Mermentau River (fig. 1) provided the greatest percentage of surface-water withdrawals from a single waterbody throughout Louisiana at 140 Mgal/d, or 46 percent. Total withdrawals for rice irrigation were greatest in Acadia Parish at about 170 Mgal/d, of which about 120 Mgal/d came from groundwater sources and about 51 Mgal/d from surface-water sources (fig. 14).
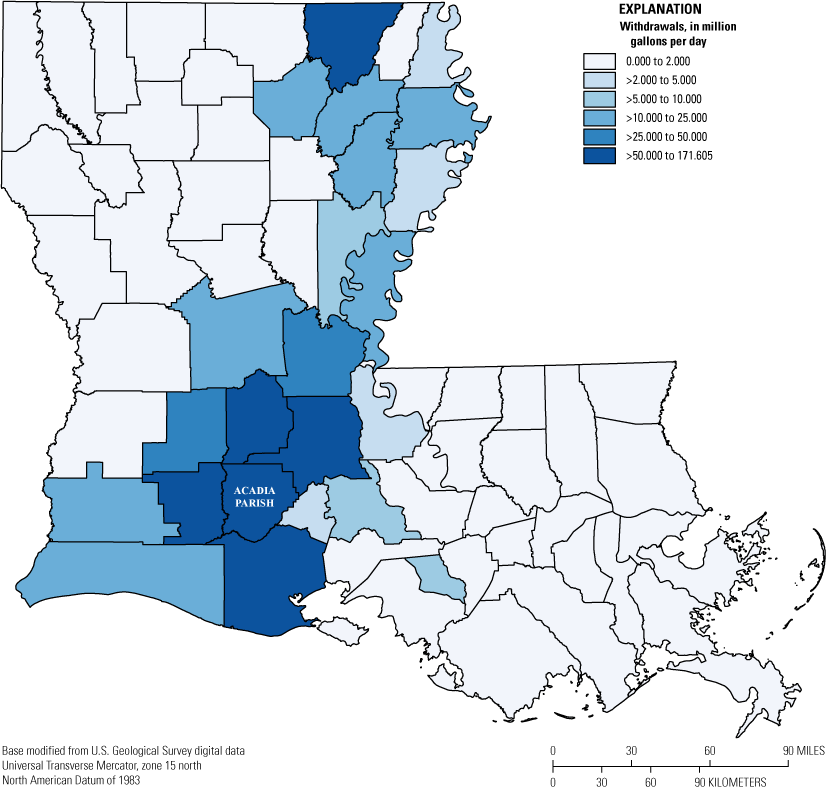
Rice-irrigation water withdrawals in Louisiana by parish, 2020 (Robinson, 2025).
General Irrigation
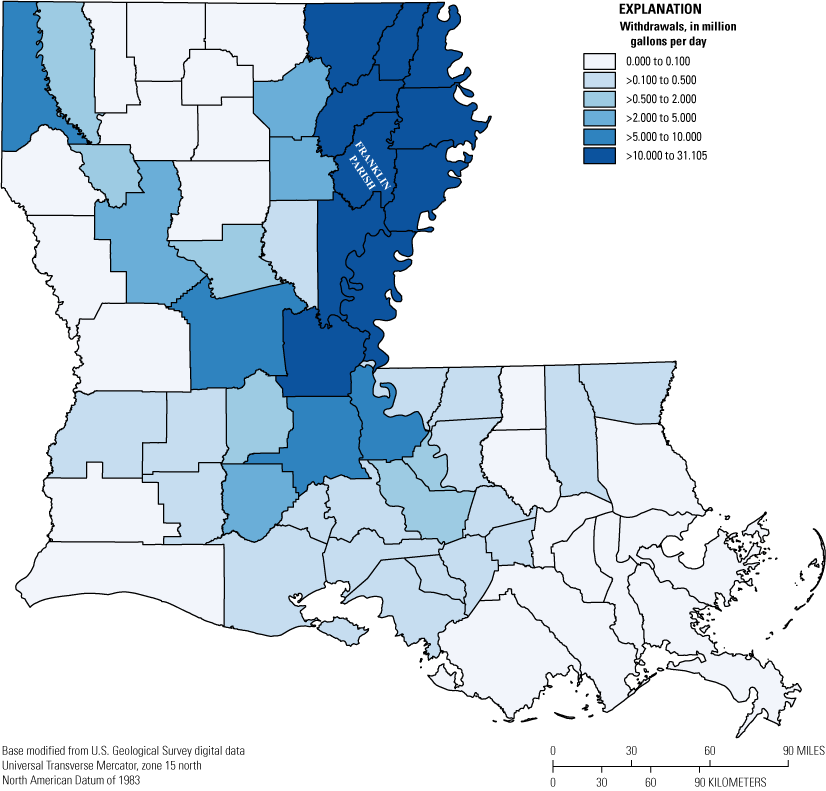
In 2020, farmers withdrew about 250 Mgal/d of water to irrigate approximately 550,000 acres of crops other than rice, mainly in northeastern Louisiana (fig. 15) (Louisiana Cooperative Extension Service, 2023). Crops with substantial amounts of irrigated acreage included cotton, corn, soybeans, sorghum, and berries, and the average application rate for these crops was about 0.55 acre-ft per acre per year.
General-irrigation water withdrawals in Louisiana by parish, 2020 (Robinson, 2025).
Of the total withdrawals for general irrigation, about 190 Mgal/d, or 76 percent, was groundwater and 60 Mgal/d, or 24 percent, was surface water. The Mississippi River alluvial aquifer provided 170 Mgal/d, or 88 percent, of the total groundwater withdrawn for general irrigation; the Chicot aquifer system provided 9.0 Mgal/d, or 4.7 percent; and the other aquifers in the State provided 14 Mgal/d, or 7.2 percent (fig. 3; appendix 2). Surface-water sources included rivers and streams, lakes, bayous, and canals. The Boeuf River (fig. 1) provided the greatest percentage of surface-water withdrawals from a single waterbody throughout Louisiana at 11 Mgal/d, or 18 percent. Total withdrawals for general irrigation were greatest in Franklin Parish at about 31 Mgal/d, of which about 28 Mgal/d came from groundwater sources and about 3 Mgal/d from surface-water sources (fig. 15).
Aquaculture
In 2020, approximately 590 Mgal/d of water was withdrawn for aquaculture in Louisiana. Crawfish ponds demanded the vast majority of water used for aquaculture, with 99.8 percent of the water used to maintain water levels on 280,000 acres of crawfish ponds. Other uses for aquaculture included 0.04 percent on 84 acres of catfish ponds and 0.16 percent at alligator farms and other aquaculture facilities (Louisiana Cooperative Extension Service, 2023).
Of the total water withdrawn for aquaculture, about 410 Mgal/d was groundwater and about 180 Mgal/d was surface water. The Chicot aquifer system provided the greatest percentage of groundwater at 330 Mgal/d, or 81 percent, followed by the Mississippi River alluvial aquifer at 68 Mgal/d, or 18 percent; the Evangeline aquifer at 6.4 Mgal/d, or 1.6 percent; and other aquifers (totaled) at 3.0 Mgal/d, or 0.74 percent (fig. 3; appendix 2). Numerous streams, rivers, and bayous were used as sources of surface water. The Mermentau River (fig. 1) provided the greatest percentage of surface-water withdrawals from a single waterbody throughout Louisiana at 31 percent (57 Mgal/d) of total surface-water withdrawals for aquaculture purposes. Total withdrawals for aquaculture were greatest in Jefferson Davis Parish, at about 130 Mgal/d, with about 53 Mgal/d originating from groundwater sources and about 79 Mgal/d from surface-water sources (fig. 16).
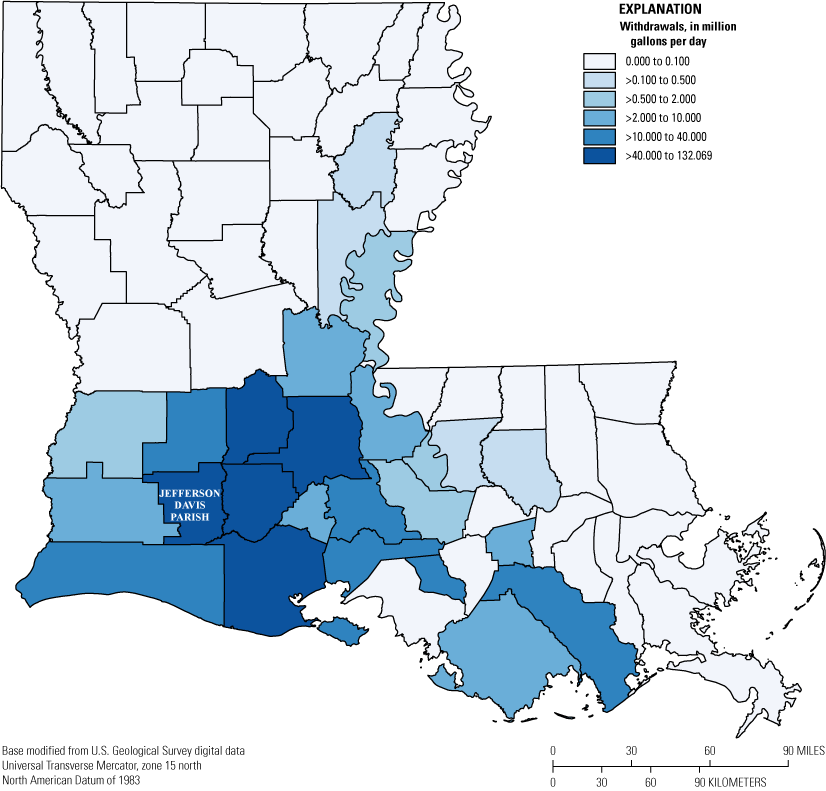
Aquaculture water withdrawals in Louisiana by parish, 2020 (Robinson, 2025).
Water Use by Parish, Aquifer, and Surface-Water Basin
Water Use by Parish
In 2020, St. Charles Parish had the greatest total withdrawals, at about 2,500 Mgal/d (figs. 17, 18). Acadia Parish had the greatest groundwater withdrawals in the State, with about 210 Mgal/d, of which over 94 percent was used for rice irrigation and aquaculture purposes (fig. 19; appendix 1). In addition to having the greatest total withdrawals, St. Charles Parish was also the parish with the greatest surface-water withdrawals in the State, at about 2,400 Mgal/d and accounting for more than 99 percent of total withdrawals in the parish in 2020 (fig. 20; appendix 1). More than 99 percent of withdrawals in St. Charles Parish were made for power-generation and industrial purposes.
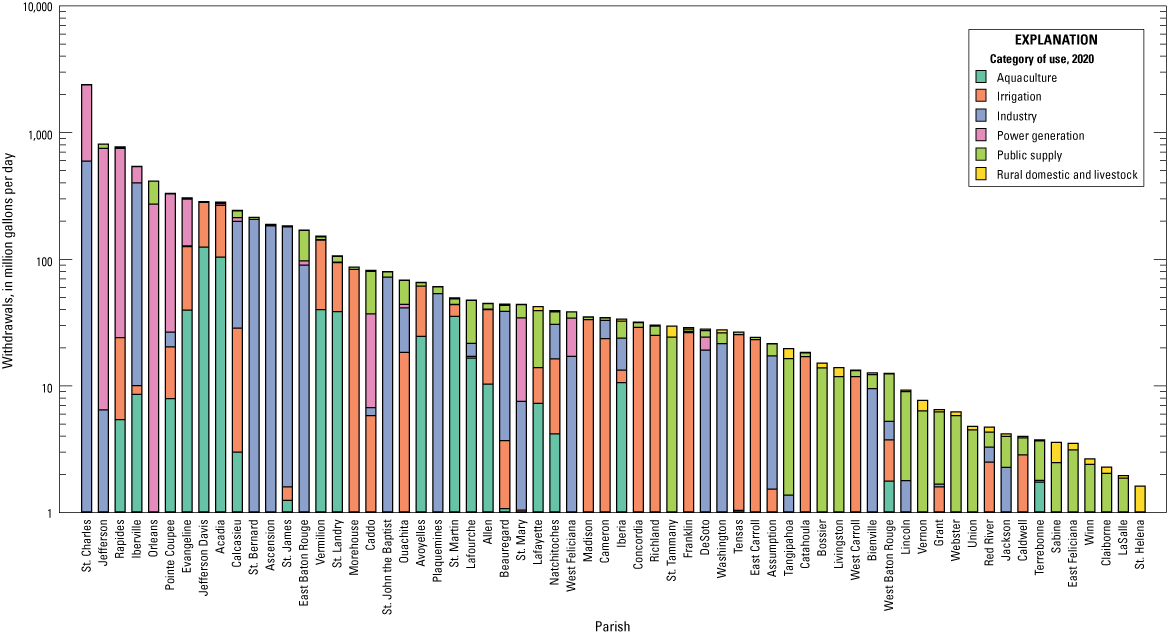
Water withdrawals in Louisiana by parish and category of use, 2020 (Robinson, 2025).
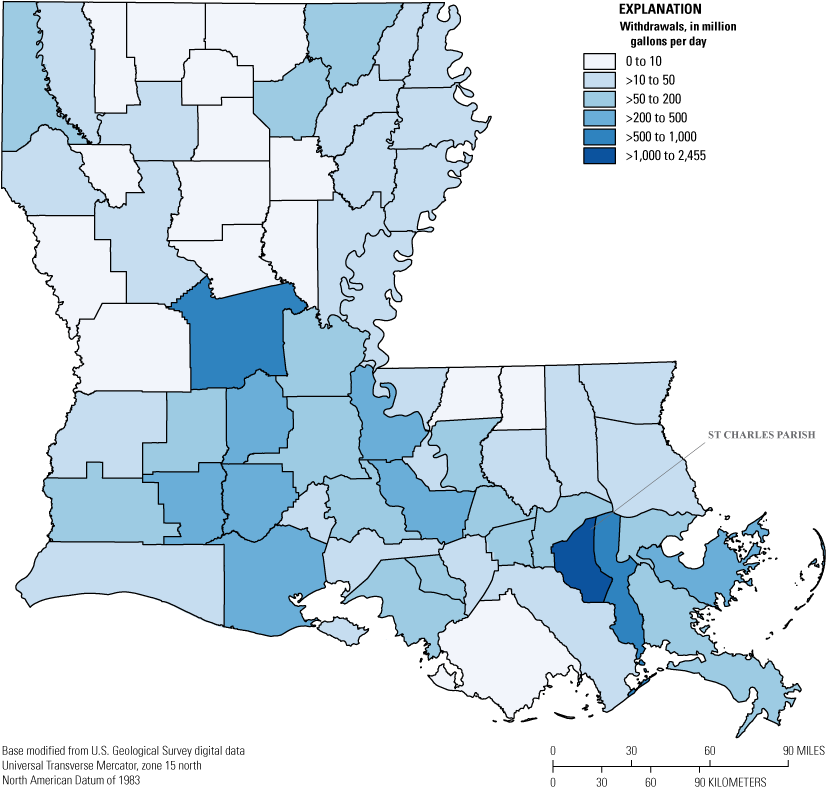
Summary of total water withdrawals in Louisiana by parish, 2020 (Robinson, 2025).
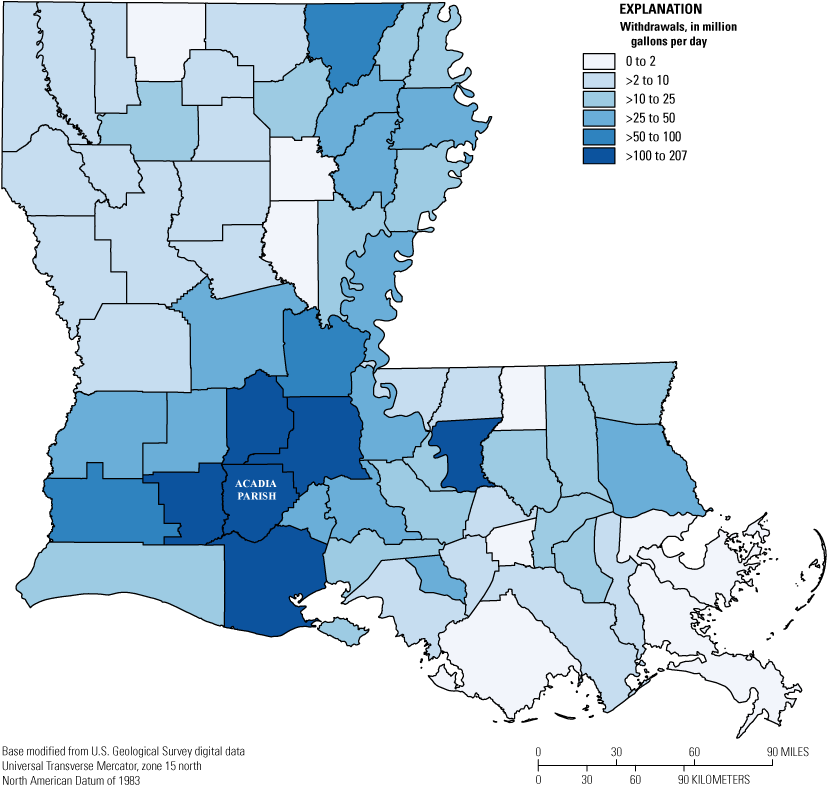
Groundwater withdrawals in Louisiana by parish, 2020 (Robinson, 2025).
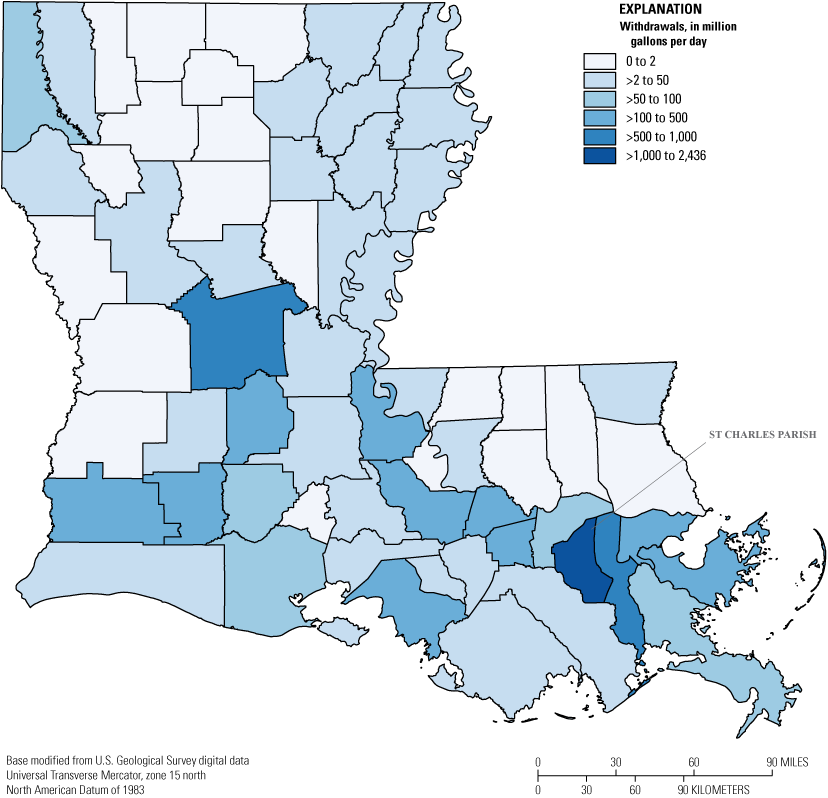
Surface-water withdrawals in Louisiana by parish, 2020 (Robinson, 2025).
Water withdrawals for each of the 64 parishes in Louisiana are summarized by use category and source in tables 4–6. Further summarization is available in appendix 1, which contains one-page summaries of water-use information by parish.
Table 4.
Public-supply, industrial, power-generation, and rural-domestic water withdrawals in Louisiana by parish and source 2020 (Robinson, 2025).[Withdrawals are in million gallons per day (Mgal/d). Summation of numbers in columns may differ slightly from totals because of rounding. Withdrawals that were less than 0.005 Mgal/d, but greater than 0, are shown as 0.00. GW, groundwater; SW, surface water; --, no withdrawals]
Table 5.
Livestock, rice-irrigation, general-irrigation, and aquaculture water withdrawals in Louisiana by parish and source 2020 (Robinson, 2025).[Withdrawals are in million gallons per day (Mgal/d). Summation of numbers in columns may differ slightly from totals because of rounding. Withdrawals that were less than 0.005 Mgal/d, but greater than 0, are shown as 0.00. GW, groundwater; SW, surface water; --, no withdrawals]
Table 6.
Total water withdrawals in Louisiana by parish and source, 2020 (Robinson, 2025).[Withdrawals are in million gallons per day (Mgal/d). Summation of numbers in columns may differ slightly from totals because of rounding]
Water Use by Aquifer
In 2020, total groundwater withdrawals were approximately 1,900 Mgal/d, of which more than 99.9 percent was withdrawn from 13 major aquifers or aquifer systems, which include, from youngest to oldest, the Red River alluvial aquifer, Mississippi River alluvial aquifer, upland terrace aquifer (northern Louisiana), Chicot aquifer system, Chicot equivalent aquifer system (southeastern Louisiana), Evangeline aquifer, Evangeline equivalent aquifer system (southeastern Louisiana), Jasper aquifer system, Jasper equivalent aquifer system (southeastern Louisiana), Catahoula aquifer, Cockfield aquifer, Sparta aquifer, and Carrizo-Wilcox aquifer (figs. 2, 3). The Chicot aquifer system supplied the most groundwater, about 960 Mgal/d, which represented 51 percent of all groundwater withdrawals. The Mississippi River alluvial aquifer supplied the second most groundwater, about 450 Mgal/d, which represented 24 percent of all groundwater withdrawals (fig. 21).
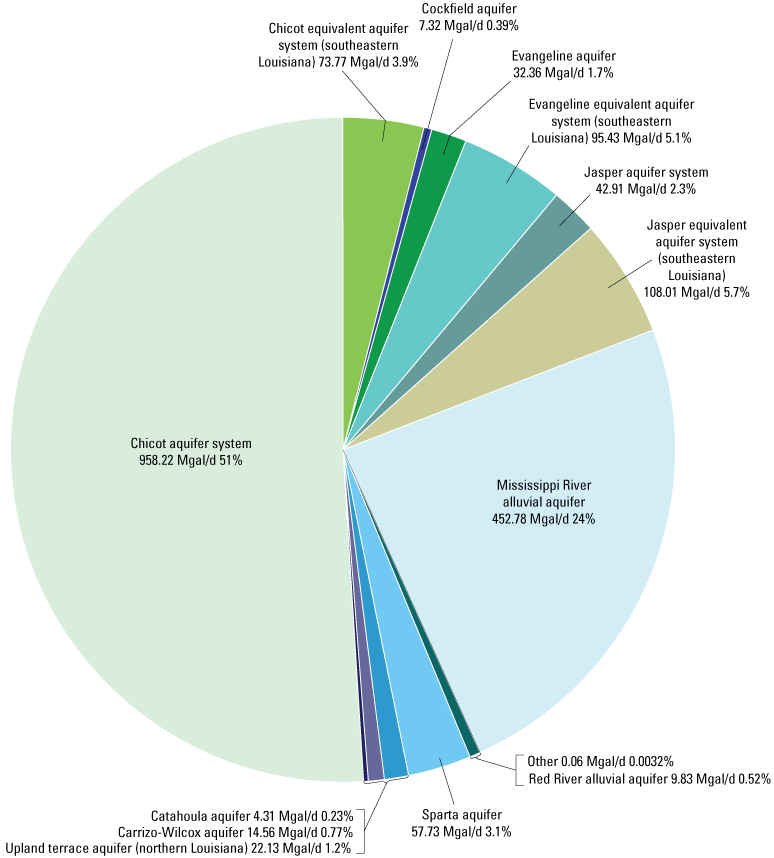
Groundwater withdrawals in Louisiana by major aquifer or aquifer system, 2020 (Robinson, 2025). Mgal/d, million gallons per day; %, percent
Groundwater withdrawals are summarized by aquifer or aquifer system and parish in tables 7–8. Each aquifer summary includes a table of withdrawals by category of use, a list of withdrawals by parish, a location map, and a bar chart showing annual withdrawals at 5-year intervals for the period 1980–2020.
Table 7.
Groundwater withdrawals from the Red River alluvial aquifer, Mississippi River alluvial aquifer, upland terrace aquifer, Chicot aquifer system, Chicot equivalent aquifer system, Evangeline aquifer, and the Evangeline equivalent aquifer system (Holocene-Pliocene aquifers), in Louisiana by parish, 2020 (Robinson, 2025).[Aquifer ages shown in figure 2. Withdrawals are in million gallons per day (Mgal/d). Summation of numbers in columns may differ slightly from totals because of rounding. --, withdrawals less than 0.005 Mgal/d are not shown]
Table 8.
Groundwater withdrawals from the Jasper aquifer system, Jasper equivalent aquifer system, Catahoula aquifer, Cockfield aquifer, Sparta aquifer, and the Carrizo-Wilcox aquifer (Miocene-Paleocene aquifers), and other ungrouped aquifers in Louisiana by parish, 2020 (Robinson, 2025).[Aquifer ages shown in figure 2. Withdrawals are in million gallons per day (Mgal/d). Summation of numbers in columns may differ slightly from totals because of rounding. --, withdrawals less than 0.005 Mgal/d are not shown]
Water Use by Surface-Water Basin
In 2020, total surface-water withdrawals were approximately 6,800 Mgal/d, of which more than 99.9 percent was withdrawn from the 10 major surface-water basins defined in this report (originally defined by Garrison and Covay, 1994). These basins include the Atchafalaya-Teche-Vermilion, Calcasieu-Mermentau River, Lake Pontchartrain-Lake Maurepas, Mississippi River main stem, Mississippi River Delta, Ouachita River, Pearl River, Red River, Sabine River, and Tensas River surface-water basins (fig. 4). The Mississippi River main stem supplied the most water, about 4,900 Mgal/d, which represented about 72 percent of all surface-water withdrawals in 2020 (fig. 22).
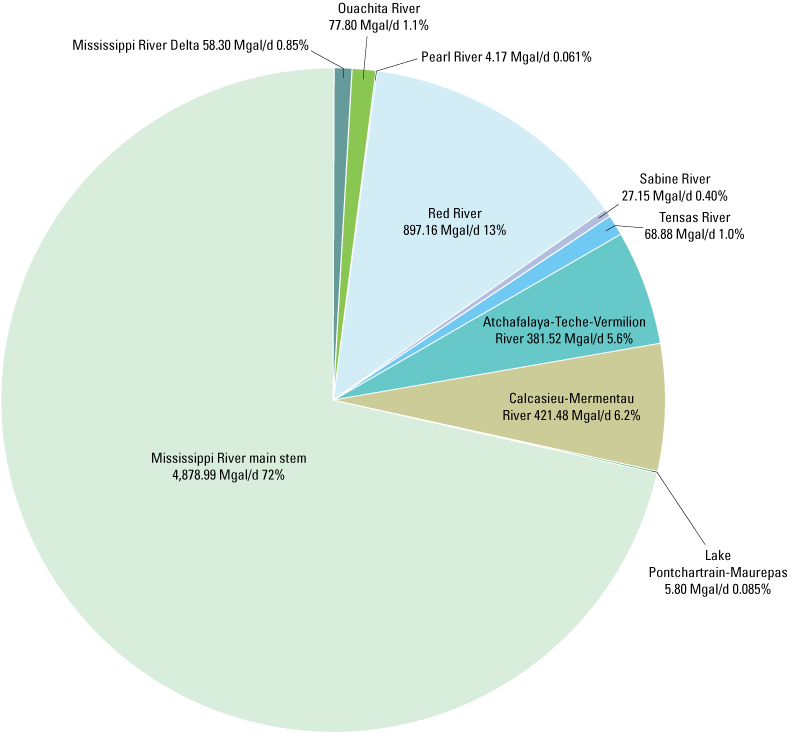
Surface-water withdrawals in Louisiana by major surface-water basin, 2020 (Robinson, 2025). Mgal/d, million gallons per day; %, percent
Surface-water withdrawals are summarized by basin and parish in table 9. Further summarization is available in appendix 3, which contains one-page summaries of surface-water withdrawals for each of the 10 surface-water basins listed above. Each summary includes tables of withdrawals by category of use, parish, and by major waterbodies within the basin, in addition to a location map.
Table 9.
Surface-water withdrawals in Louisiana by parish and major surface-water basin, 2020 (Robinson, 2025).[Withdrawals are in million gallons per day. Summation of numbers in columns may differ slightly from totals because of rounding. --, no data]
Total Water Use
Total withdrawals from groundwater and surface-water sources in 2020 were approximately 8,700 Mgal/d (table 10). Of this total, about 1,900 Mgal/d was from groundwater and about 6,800 Mgal/d was from surface water. St. Charles Parish had the greatest total withdrawals, at about 2,500 Mgal/d (figs. 17, 18). Acadia Parish had the greatest groundwater withdrawals in the State, at about 210 Mgal/d (fig. 19). In addition to having the greatest total withdrawals, St. Charles was also the parish with the greatest surface-water withdrawals in the State, at about 2,400 Mgal/d (fig. 20). About 51 percent (960 Mgal/d) of all groundwater was withdrawn from the Chicot aquifer system, and about 24 percent (450 Mgal/d) was withdrawn from the Mississippi River alluvial aquifer (table 7). About 72 percent (or 4,900 Mgal/d) of all surface water withdrawn in Louisiana was withdrawn from the Mississippi River main stem (table 6).
Table 10.
Total water withdrawals in Louisiana by category and source water, 2020 (Robinson, 2025).[Withdrawals are in million gallons per day. Summation of numbers in columns may differ slightly from totals because of rounding --, no data]
Water Use Trends
Since 1960, Louisiana’s population has increased by 43 percent, but from 2015 to 2020, the State’s population decreased by 0.28 percent (fig. 23) (U.S. Census Bureau, 1961, 2016, 2020). Since 2015, Calcasieu, St. Tammany, East Baton Rouge, Ascension, and Jefferson Parishes had the largest increases in population and Caddo, Orleans, Acadia. Terrebonne, and Iberia Parishes had the largest decreases in population.
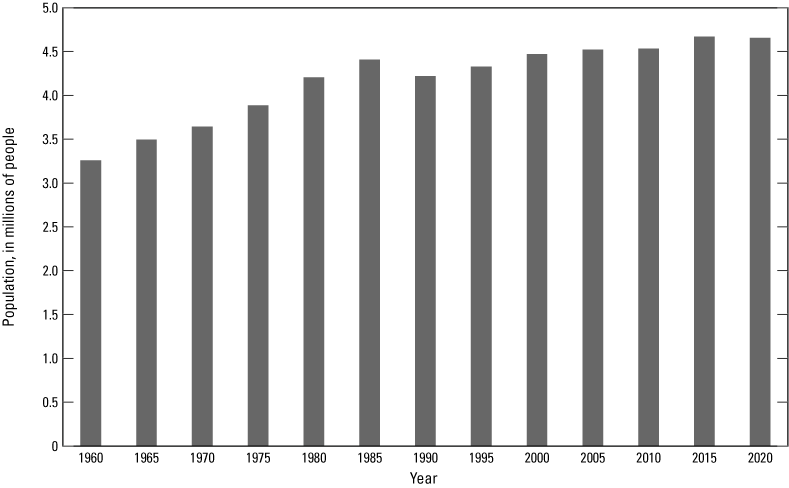
Total population in Louisiana, 1960–2020 (Forstall, 1996; U.S. Census Bureau, 2020).
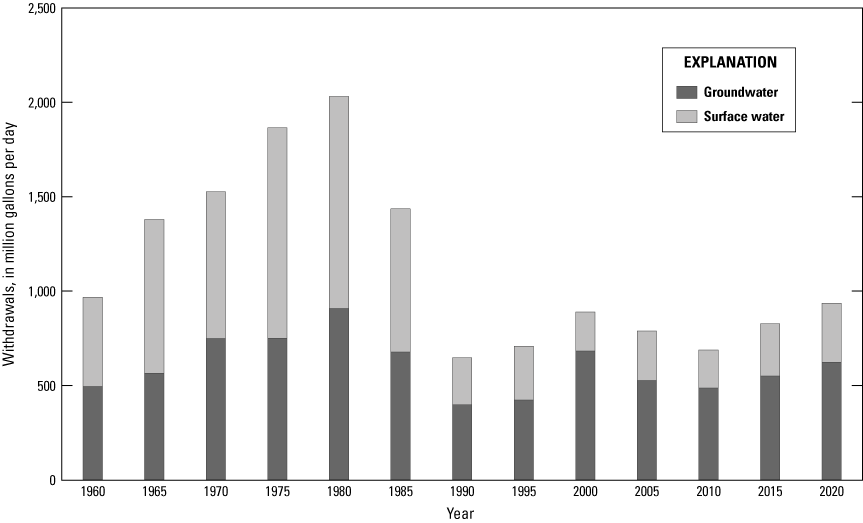
Total public-supply withdrawals increased by approximately 1.4 percent from 2015 to 2020 (fig. 24), comparable to the increase in population. The total groundwater withdrawals for public supply decreased by 0.23 percent and surface-water withdrawals increased by 3.0 percent. Public-supply withdrawals decreased in 33 of Louisiana’s 64 parishes between 2015 and 2020. The median change in public-supply withdrawals by parish was a decrease of 0.01 Mgal/d; that is, the change for half of the parishes was greater than a 0.01 Mgal/d increase, and the change for the other half was less than the 0.01 Mgal/d increase. East Baton Rouge Parish had the greatest decrease, at 3.3 Mgal/d, and St. John the Baptist Parish had the greatest increase in total public-supply withdrawals, at 5.2 Mgal/d. Since 1960, public-supply withdrawals have increased by 170 percent.
Public-supply water withdrawals in Louisiana, 1960–2020 (Robinson, 2025).
Total industrial withdrawals decreased by 2.3 percent from 2015 to 2020 (fig. 25). Industrial withdrawals from groundwater sources decreased by 14 percent and industrial withdrawals from surface-water sources decreased by 0.76 percent. From 2015 to 2020, 30 of the 54 parishes (56 percent) that had water withdrawals for industrial purposes had a decrease in withdrawals and the median difference in withdrawals during this period was a decrease of 0.01 Mgal/d. Calcasieu Parish had the greatest decrease, at 40 Mgal/d, whereas Iberville Parish had the greatest increase, at 72 Mgal/d. Since 1960, total industrial withdrawals in Louisiana have decreased by 49 percent.
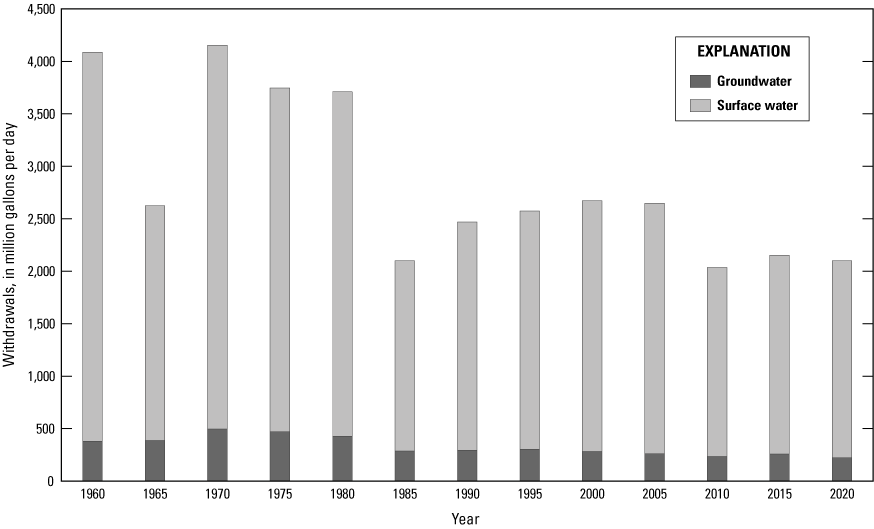
Industrial water withdrawals in Louisiana, 1960–2020 (Robinson, 2025).
Groundwater withdrawals for power generation decreased by 18 percent from 2015 to 2020 and surface-water withdrawals decreased by 4.8 percent, resulting in an overall decrease of 4.9 percent for power-generation withdrawals from 2015 to 2020 (fig. 26). Between 2015 and 2020, 9 of the 16 parishes (56 percent) that had water withdrawals for power generation showed a decrease in withdrawals, and the median change in withdrawals for the parishes that generated power was a decrease of 0.31 Mgal/d. The parish with the greatest decrease in withdrawals was Orleans Parish, at 270 Mgal/d, and St. Charles Parish had the greatest increase, at 82 Mgal/d. The decrease in power-generation withdrawals from 2015 to 2020 is likely due to the decommission and deactivation of two powerplants in Iberville and Orleans Parishes. Total withdrawals for power generation in Louisiana have increased by 81 percent since power-generation withdrawals were first reported in the 1965 water-use report (fig. 26).
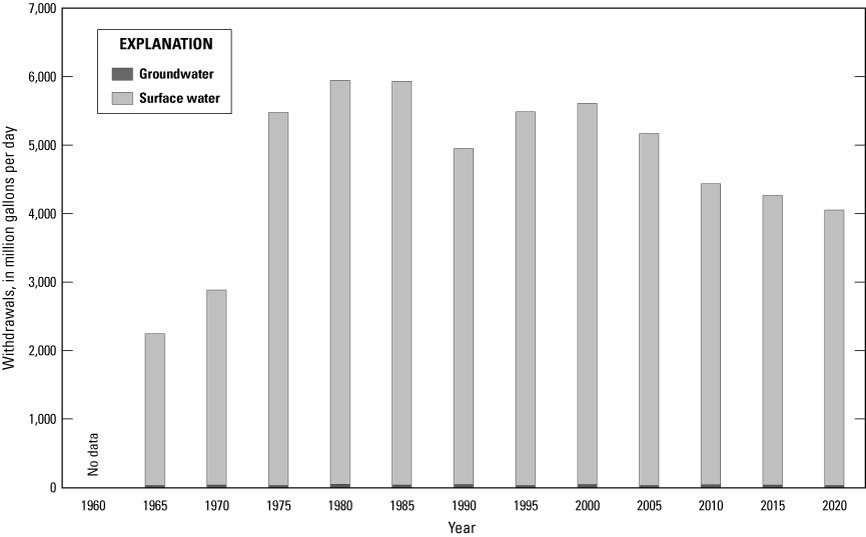
Power-generation water withdrawals in Louisiana, 1965–2020 (Robinson, 2025).
Rural-domestic withdrawals in Louisiana decreased by 1.2 percent from 2015 to 2020 (fig. 27). Thirty-nine of the 64 parishes (61 percent) had a decrease in rural-domestic water use from 2015 to 2020, and the median change in water withdrawals for rural-domestic use was a decrease of less than 0.01 Mgal/d. Vermilion Parish had the greatest decrease, at 0.20 Mgal/d, and Vernon Parish had the greatest increase, at 0.095 Mgal/d. The small decrease in total rural-domestic withdrawals from 2015 to 2020 is consistent with, and may be due in part to, the continued expansion of public suppliers into rural areas and a subsequent shift from the use of private domestic wells to public supplies. Since 1960, groundwater withdrawals for rural-domestic use have decreased by 4.4 percent (fig. 27).
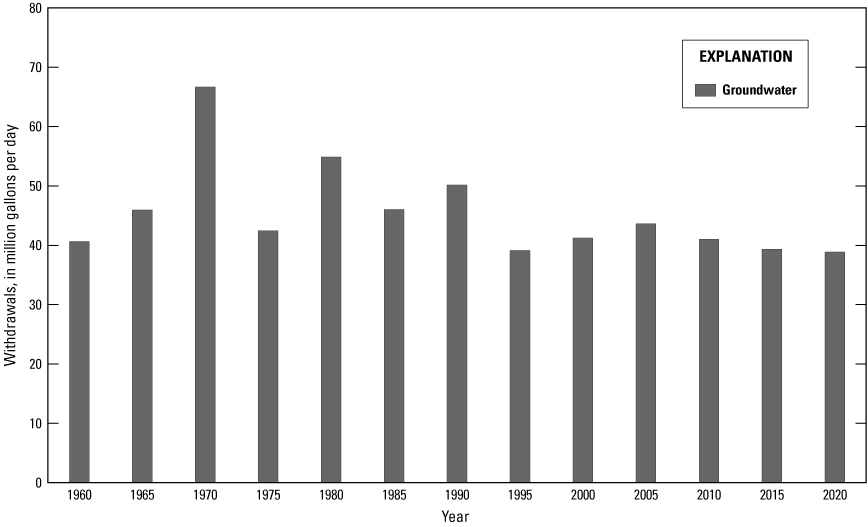
Rural-domestic water withdrawals in Louisiana, 1960–2020.
Groundwater withdrawals for livestock increased by 16 percent, surface-water withdrawals increased by 5.2 percent, and total withdrawals for livestock increased by 11 percent from 2015 to 2020 (fig. 28). Despite the increase in total withdrawals for livestock, 34 of 64 parishes (53 percent) that had water withdrawals for livestock had a decrease from 2015 to 2020 and the median change was a decrease of 0.01 Mgal/d. Sabine Parish had the greatest decrease, at 0.081 Mgal/d, and Beauregard Parish had the greatest increase, at 0.12 Mgal/d. Withdrawals for livestock in Louisiana have decreased by 73 percent since 1960 (fig. 28).
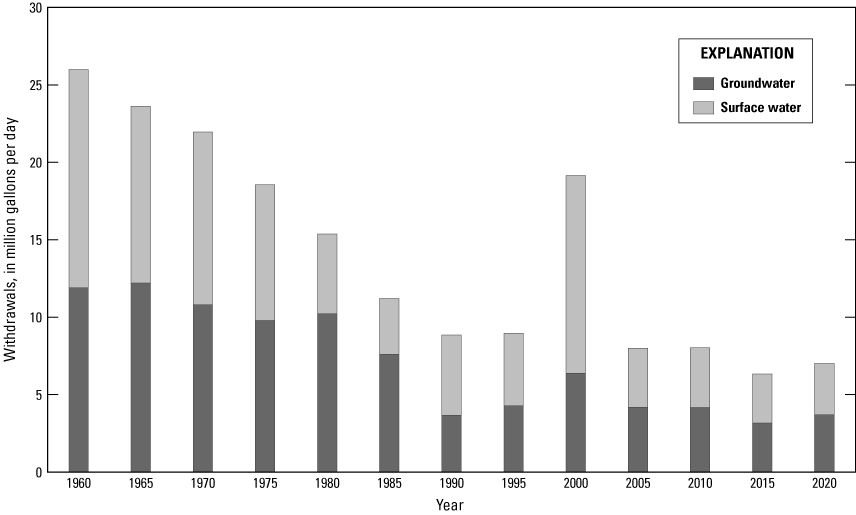
Livestock water withdrawals in Louisiana, 1960–2020 (Robinson, 2025).
From 2015 to 2020, total withdrawals for rice irrigation increased by 13 percent, congruent with a 13-percent increase in rice-harvest acreage (Louisiana Cooperative Extension Service, 2017, 2023). Groundwater withdrawals for rice irrigation increased by 13 percent, and for the same period, surface-water withdrawals for rice irrigation increased by 12 percent (fig. 29). From 2015 to 2020, water withdrawals increased in 18 of the 30 parishes (60 percent) that had water withdrawals for rice irrigation, and the median change in withdrawals for these parishes was an increase of 1.9 Mgal/d. Morehouse Parish had the greatest increase, at 36 Mgal/d, and Calcasieu Parish had the greatest decrease, at 8.3 Mgal/d. Total withdrawals for rice irrigation in Louisiana have decreased by 3.4 percent from 1960 to 2020 (fig. 29).
Rice-irrigation water withdrawals in Louisiana, 1960–2020 (Robinson, 2025).
Total withdrawals for general irrigation increased by 12 percent from 2015 to 2020. During the same period, groundwater withdrawals for general irrigation increased by 14 percent, and surface-water withdrawals increased by 7.5 percent (fig. 30). From 2015 to 2020, water withdrawals decreased in 35 of the 62 parishes in Louisiana (56 percent) that had general-irrigation withdrawals, and the median change in general-irrigation water use was a decrease of less than 0.01 Mgal/d. Pointe Coupee Parish had the greatest decrease, at 2.4 Mgal/d, and Franklin Parish had the greatest increase, at 11 Mgal/d. General-irrigation withdrawals in Louisiana have increased by 820 percent since 1960 (fig. 30).
General-irrigation water withdrawals in Louisiana, 1960–2020 (Robinson, 2025).
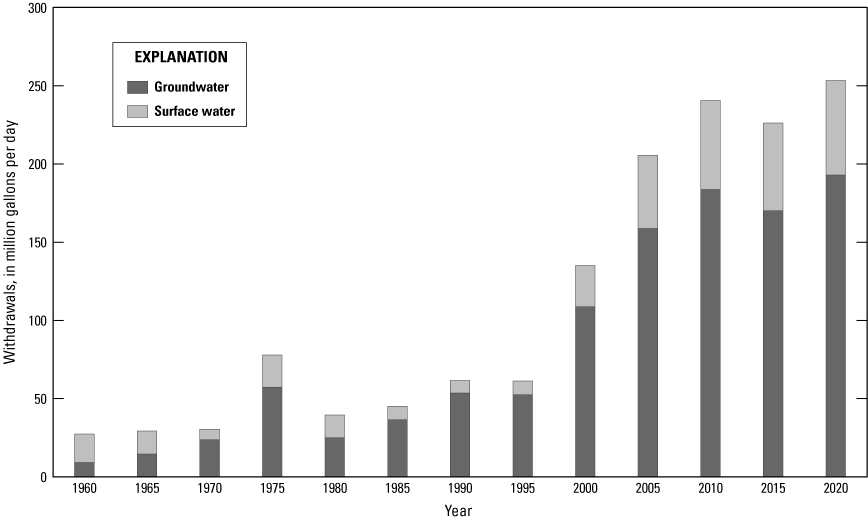
From 2015 to 2020, total withdrawals for aquaculture in Louisiana increased by 20 percent (fig. 31). During the same period, groundwater withdrawals increased by 21 percent, and surface-water withdrawals increased by 16 percent. From 2015 to 2020, withdrawals decreased in 21 of the 36 parishes (58 percent) that had aquaculture withdrawals, and the median change in aquaculture withdrawals for these parishes was a decrease of 0.01 Mgal/d. Vermilion Parish had the greatest increase, at 64 Mgal/d, and Acadia Parish had the greatest decrease, at 15 Mgal/d. Total withdrawals for aquaculture in Louisiana have increased by 290 percent since aquaculture withdrawals were first reported in the 1980 water-use report (fig. 31).
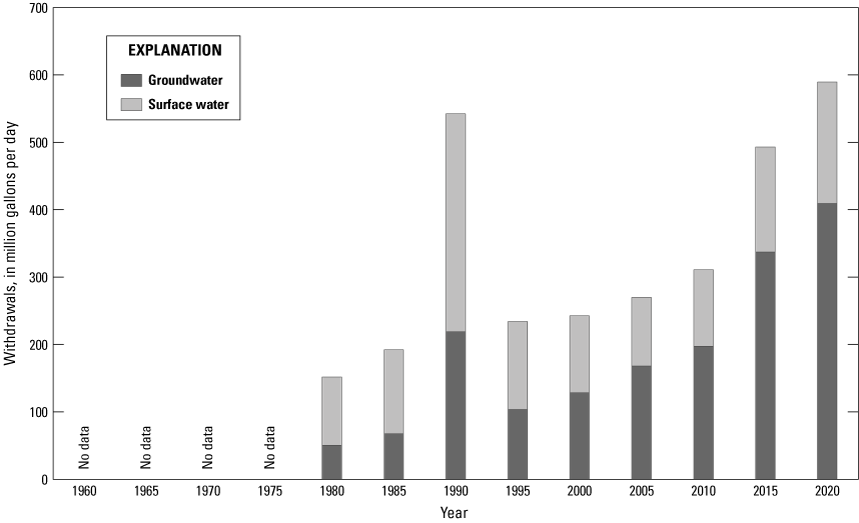
Aquaculture water withdrawals in Louisiana, 1980–2020 (Robinson, 2025).
Total groundwater withdrawals for all water-use categories increased by 130 Mgal/d (7.1 percent) from 2015 to 2020 (fig. 32). Since 2015, withdrawals from the Chicot aquifer system increased by 13 percent, and withdrawals from the Mississippi River alluvial aquifer increased by 18 percent. Total surface-water withdrawals decreased by 2.1 percent from 2015 to 2020 (fig. 33). The Mississippi River main stem had the greatest withdrawals of any surface-water basin in 2020, at 4,900 Mgal/d, or 72 percent of all surface water, and it had a decrease of just 1.1 percent from 2015.
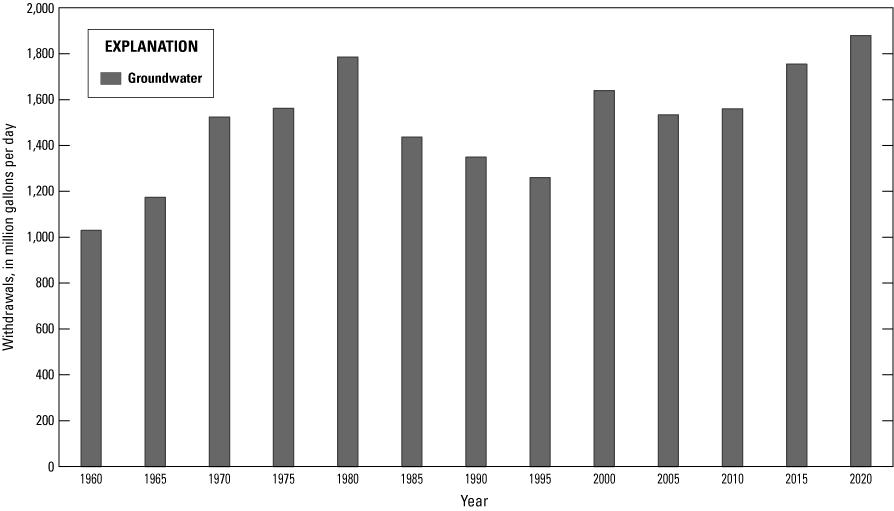
Total groundwater withdrawals in Louisiana, 1960–2020 (Robinson, 2025).
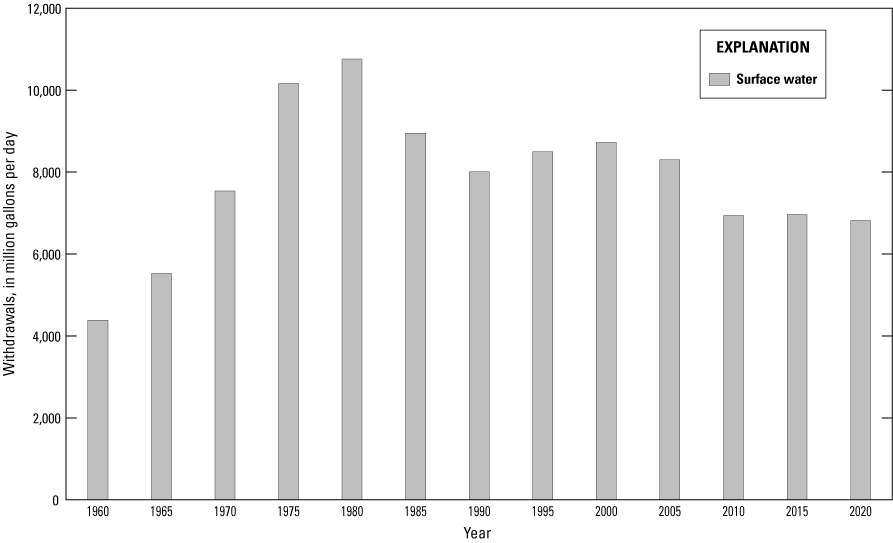
Total surface-water withdrawals in Louisiana, 1960–2020 (Robinson, 2025).
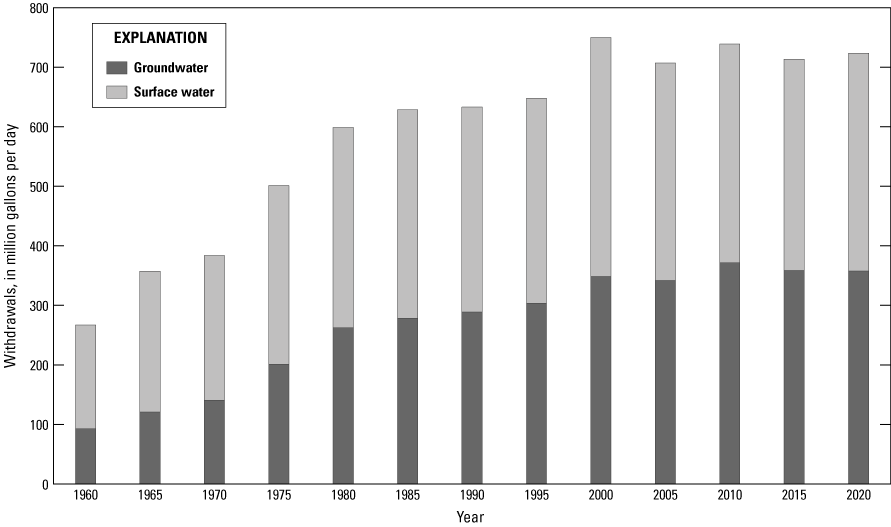
Figure 34 shows increases and decreases in total water withdrawals in Louisiana since 1960. Withdrawals of both groundwater and surface water increased steadily from 1960 to 1980. For that period, total groundwater withdrawals increased by approximately 73 percent (from 1,000 to 1,800 Mgal/d), total surface-water withdrawals increased by 150 percent (from 4,400 to 11,000 Mgal/d), and total water withdrawals in Louisiana increased by approximately 130 percent (from 5,400 to 13,000 Mgal/d). From 1980 to 2020, total groundwater withdrawals increased by 5.3 percent (about 94 Mgal/d), total surface-water withdrawals decreased by 37 percent (about 3,900 Mgal/d), and total water withdrawals decreased by 31 percent (about 3,800 Mgal/d). As indicated in figure 34, from 2015 to 2020, total water withdrawals in Louisiana decreased by 0.22 percent.
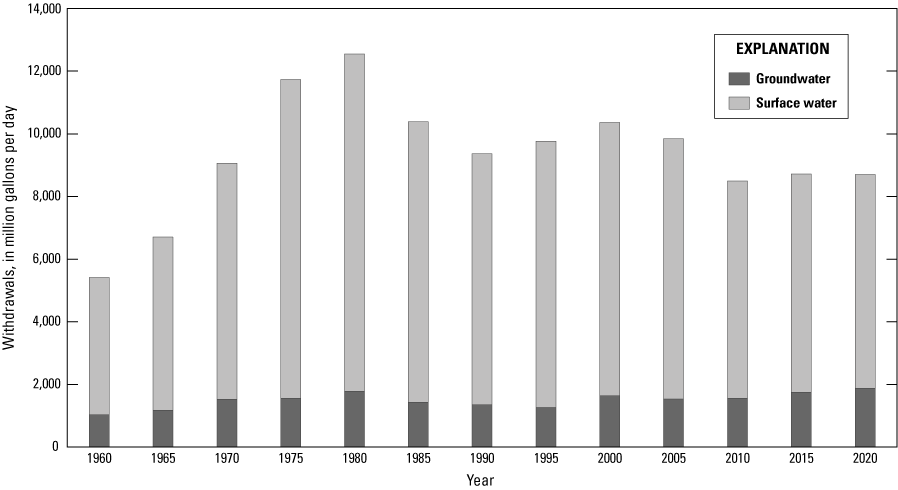
Total water withdrawals in Louisiana, 1960–2020 (Robinson, 2025).
Overall, since 1960, groundwater withdrawals have increased by 83 percent, surface-water withdrawals have increased by 56 percent, and total water withdrawals have increased by 61 percent. Figure 35 summarizes withdrawals from 1960 to 2020, showing total withdrawals along with total withdrawals by category for the same period.
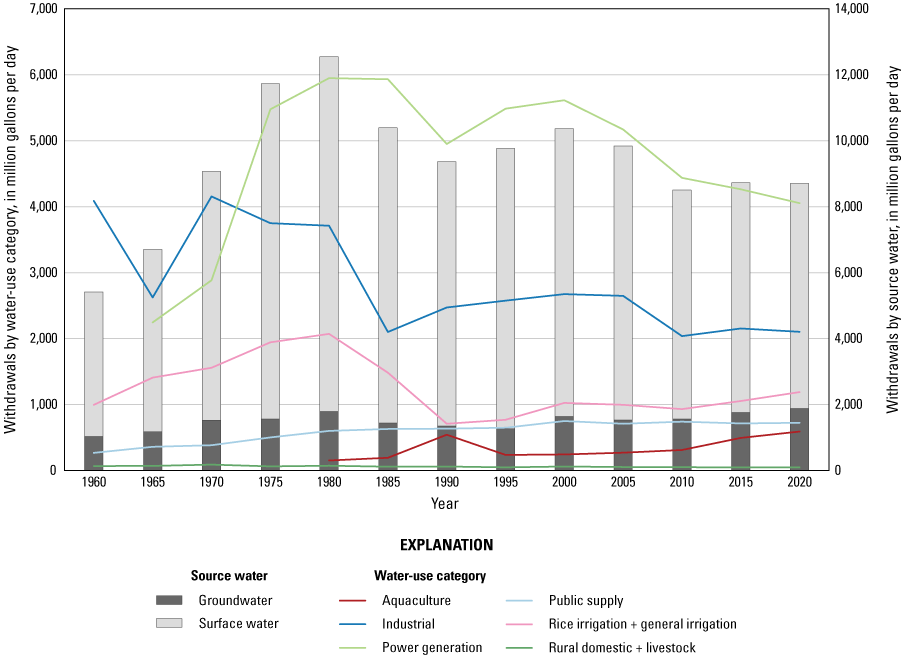
Total water withdrawals and total withdrawals by category in Louisiana, 1960–2020 (Robinson, 2025).
Summary
The U.S. Geological Survey (USGS), in cooperation with the Louisiana Department of Transportation and Development, collected water-withdrawal and water-use data from a 2020 inventory of water withdrawals in Louisiana. In 2020, public water suppliers in Louisiana withdrew approximately 720 million gallons per day (Mgal/d) of water, 360 Mgal/d from groundwater sources and 370 Mgal/d from surface-water sources, to supply approximately 4.2 million Louisiana residents. From 2015 to 2020, groundwater withdrawals for public-supply use decreased by 0.23 percent, surface-water withdrawals increased by 3.0 percent, and total water withdrawals for public-supply use increased by 1.4 percent.
Industry in Louisiana withdrew approximately 2,100 Mgal/d of water, 220 Mgal/d from groundwater sources and 1,900 Mgal/d from surface-water sources. Industrial withdrawals in 2020 accounted for 24 percent of all withdrawals. Since 2015, industrial groundwater use decreased by 14 percent and surface-water use decreased by 0.76 percent, resulting in an overall decrease of 2.4 percent in withdrawals.
Power-generation facilities withdrew approximately 4,100 Mgal/d, which accounted for about 47 percent of all water withdrawn in 2020. Of the 4,100 Mgal/d, only 31 Mgal/d came from groundwater sources, whereas more than 99 percent (more than 4,000 Mgal/d) originated from surface-water sources. The Mississippi River provided 73 percent (2,900 Mgal/d) of the surface water withdrawn for power-generation use. Groundwater withdrawals for power generation decreased by 18 percent from 2015 to 2020. Surface-water withdrawals decreased by 4.8 percent, resulting in an overall decrease of 4.9 percent for power-generation withdrawals from 2015 to 2020.
In 2020, an average of 69,000 Mgal/d of Mississippi River water passed through the turbines of the hydroelectric powerplant at the Old River Control Structure in southern Concordia Parish. For the hydroelectric powerplant at the Toledo Bend Reservoir in Sabine Parish near Burkeville, Texas, an average of 3,700 Mgal/d of water passed through its turbines, 1,900 Mgal/d of which was counted as power-generation instream use for Louisiana in 2020. Hydroelectric power-generation instream use was not included in surface-water withdrawals in this report because the water was not considered to be withdrawn.
Approximately 490,000 people, or about 10 percent of Louisiana’s total population, using privately owned domestic wells, withdrew an estimated 39 Mgal/d of groundwater for domestic use in 2020. Rural-domestic withdrawals decreased by 1.2 percent from 2015 to 2020. The small decrease is consistent with the continued expansion of public suppliers into rural areas and the resultant shift from the use of private domestic wells to public supplies.
Withdrawals for livestock were approximately 7.0 Mgal/d of water in 2020. Of this total, 3.7 Mgal/d was groundwater and 3.3 Mgal/d was surface water. Groundwater used for livestock increased by 16 percent and surface water increased by 5.2 percent, with a total increase of 11 percent in withdrawals for livestock from 2015 to 2020.
Rice farmers withdrew approximately 930 Mgal/d of water to irrigate their fields in 2020. Of this total, 620 Mgal/d was groundwater and 310 Mgal/d was surface water. The Chicot aquifer system in southwestern Louisiana provided 71 percent of the groundwater used for rice irrigation. Groundwater withdrawals for rice irrigation increased by 13 percent and surface-water withdrawals increased by 12 percent from 2015 to 2020. Rice-harvest acreage increased by 13 percent, and, congruently, total withdrawals for rice irrigation increased by 13 percent.
Farmers also withdrew approximately 190 Mgal/d of groundwater and 60 Mgal/d of surface water to irrigate crops other than rice in 2020. Groundwater withdrawals for these crops increased by 14 percent and surface-water withdrawals increased by 7.5 percent from 2015 to 2020. Withdrawals for general irrigation totaled about 250 Mgal/d in 2020 and increased by 12 percent from 2015 to 2020.
Water withdrawn for aquaculture in Louisiana was approximately 590 Mgal/d in 2020. Of this total, 410 Mgal/d was groundwater and 180 Mgal/d was surface water. Since 2015, groundwater withdrawals have increased by 21 percent and surface-water withdrawals have increased by 16 percent. Total withdrawals for aquaculture increased by 20 percent from 2015 to 2020.
Total withdrawals in 2020 were approximately 8,700 Mgal/d. Total groundwater withdrawals were 1,900 Mgal/d, and total surface-water withdrawals were 6,800 Mgal/d. In 2020, about 51 percent (960 Mgal/d) of all groundwater withdrawn was from the Chicot aquifer system, and about 24 percent (450 Mgal/d) was withdrawn from the Mississippi River alluvial aquifer. Approximately 72 percent (4,900 Mgal/d) of all surface water withdrawn was from the Mississippi River main stem.
From 2015 to 2020, groundwater withdrawals from the Chicot aquifer system increased by 13 percent, and withdrawals from the Mississippi River alluvial aquifer increased by 18 percent, resulting in a 7.1-percent increase in total groundwater withdrawals. During the same period, there was a 1.1-percent decrease in surface-water withdrawals from the main stem of the Mississippi River and total surface-water withdrawals decreased by 2.1 percent. Since 2015, total withdrawals for all water-use categories decreased by just 0.22 percent.
All water-withdrawal and water-use data presented in this report should be considered estimates. Because of rounding, totals and percentages presented in the tables, figures, and text in the report may differ slightly from totals or percentages calculated individually.
References Cited
Collier, A.L., 2018, Water withdrawals by source and category in Louisiana Parishes, 2014–2015: U.S. Geological Survey data release, accessed June 3, 2020, at https://doi.org/10.5066/F78051VM.
Collier, A.L., and Sargent, B.P., 2018, Water use in Louisiana, 2015: Louisiana Department of Transportation and Development, Water Resources Special Report no. 18, 138 p. [Also available at https://wise.er.usgs.gov/dp/pdfs/WaterUseinLouisiana_2015.pdf.]
Forstall, R.L., 1996, Population of states and counties of the United States—1790 to 1990: Washington, D.C., U.S. Bureau of the Census, 225 p. [Also available at https://www2.census.gov/library/publications/decennial/1990/population-of-states-and-counties-us-1790-1990/population-of-states-and-counties-of-the-un ited-states-1790-1990.pdf.]
Garrison, C.R., and Covay, K.J., 1994, Statistical summary of surface-water quality in Louisiana Sabine River basin, 1952–85: Louisiana Department of Transportation and Development, Water Resources Technical Report no. 55A, 63 p. [Also available at https://wise.er.usgs.gov/dp/pdfs/TR55A.pdf.]
Louisiana Department of Health, 2020, Safe Drinking Water Program: Louisiana Department of Health, Drinking Water Watch database, accessed August 17, 2020, at https://sdw.oph.dhh.la.gov/DWW/index.jsp.
Louisiana Department of Natural Resources, 2020, Strategic Online Natural Resources Information System (SONRIS): Louisiana Department of Natural Resources web page, accessed October 29, 2020, at https://sonris.com/.
Lovelace, J.K., 2007, Chloride concentrations in ground water in East and West Baton Rouge Parishes, Louisiana, 2004–05: U.S. Geological Survey Scientific Investigations Report 2007–5069, 27 p. [Also available at https://pubs.usgs.gov/sir/2007/5069/.]
Manufacturers’ News, Inc., 2020, Louisiana manufacturing industry database: Evanston, Ill., MNI database, accessed September 14, 2020, at https://www.industryselect.com/.
National Agricultural Statistics Service, 2019a, 2017 Census of Agriculture—United States, summary and State data: National Agricultural Statistics Service, 711 p., 2 app., accessed October 18, 2023, at https://www.nass.usda.gov/Publications/AgCensus/2017/Full_Report/Volume_1,_Chapter_2_US_State_Level/usv1.pdf.
National Agricultural Statistics Service, 2019b, 2017 Census of Agriculture—2018 Irrigation and Water Management Survey: National Agricultural Statistics Service, 216 p., 2 app., accessed October 18, 2023, at https://www.nass.usda.gov/Publications/AgCensus/2017/Online_Resources/Farm_and_Ranch_Irrigation_Survey/fris.pdf.
Robinson, A.L., 2025, Water withdrawals in Louisiana, 2020: U.S. Geological Survey data release, https://doi.org/10.5066/P13G8OMQ.
Stuart, C.G., Knochenmus, D., and McGee, B.D., 1994, Guide to Louisiana’s ground-water resources: U.S. Geological Survey Water Resources Investigations Report 94–4085, 55 p. [Also available at https://doi.org/10.3133/wri944085.]
Tollett, R.W., Fendick, R.B., Jr., and Simmons, L.B., 2003, Quality of water in domestic wells in the Chicot and Chicot equivalent aquifer systems, southern Louisiana and southwestern Mississippi, 2000–2001: U.S. Geological Survey Water-Resources Investigations Report 03–4122, 85 p. [Also available at https://doi.org/10.3133/wri034122.]
U.S. Census Bureau, 2011, 2010 census redistricting data (Public Law 94–171) summary file—Population and housing occupancy status 2010; State; County/County equivalent [table GCT–PL2]: U.S. Census Bureau web page, accessed June 27, 2011, at http://factfinder2.census.gov/faces/tableservices/jsf/pages/productview.xhtml?pid=DEC_10_PL_GCTPL2.ST05&prodType=table.
U.S. Census Bureau, 2012, Geography—State area measurements, 2010: U.S. Census Bureau web page, accessed April 25, 2017, at https://www.census.gov/geo/reference/state-area.html.
U.S. Census Bureau, 2016, Annual estimates of the resident population—April 1, 2010 to July 1, 2015: U.S. Census Bureau web page, accessed March 9, 2017, at https://factfinder.census.gov/bkmk/table/1.0/en/PEP/2015/PEPANNRES/0400000US22.0400000US22.05000.
U.S. Census Bureau, 2020, Total population, decennial census, table P1 in DEC 118th Congressional District summary file: U.S. Census Bureau web page, accessed November 13, 2023, at https://data.census.gov/table/DECENNIALCD1182020.P1?g=040XX00US22.
U.S. Energy Information Administration, 2021, Form EIA-923 detailed data, 2020: U.S. Energy Information Administration website, accessed November 10, 2021, at https://www.eia.gov/electricity/data/eia923/.
U.S. Environmental Protection Agency, 2020, Envirofacts—Safe drinking water search for the State of Louisiana: U.S. Environmental Protection Agency database, accessed August 17, 2020, at https://enviro.epa.gov/enviro/sdw_form_v3.create_page?state_abbr=LA.
U.S. Environmental Protection Agency, 2024, Secondary drinking water standards—Guidance for nuisance chemicals: U.S. Environmental Protection Agency web page, accessed April 13, 2024, at https://www.epa.gov/dwstandardsregulations/secondary-drinking-waterstandards-guidance-nuisance-chemicals.
Glossary
- alluvial aquifer
A water-bearing deposit of unconsolidated material (sand and gravel) left behind by a river or other flowing water (Kleiss and others, 2000).
- aquaculture water use
Water used in the farming of organisms that live in water within a confined space and under controlled feeding, sanitation, and harvesting procedures, and establishments primarily engaged in hatching fish and in operating fishing preserves (Dieter and others, 2018). In Louisiana, this use is primarily for fish, crawfish, and alligator farming. Instream fish farming is not included in this category.
- aquifer
A body of rock that contains sufficient saturated permeable material to conduct groundwater and to yield significant quantities of water to wells and springs (Jackson, 1997).
- aquifer system
A heterogeneous body of intercalated permeable and less permeable material that acts as a water-yielding hydraulic unit of regional extent (Jackson, 1997).
- application rate
The rate at which water is applied to a given area. Usually expressed in units of depth per time (Dickens and others, 2011).
- cooling system
An equipment system that provides water for cooling purposes, such as to condensers at power plants or at factories. May include water intakes, outlets, cooling towers, ponds, canals, pumps, and pipes. Generally, very little water is consumed. Types include once-through and closed-loop cooling (Dieter and others, 2018).
- freshwater
Water containing less than 1,000 milligrams per liter of dissolved solids; generally, water with more than 500 milligrams per liter is undesirable for drinking and for many industrial uses (Dieter and others, 2018).
- groundwater
In the broadest sense, all subsurface water; more commonly that part of the subsurface water that is in the saturated zone, including underground streams (U.S. Geological Survey, 2023).
- hydroelectric power-generation water use
The use of water in the generation of electricity at plants where the turbine generators are driven by falling water. Hydroelectric water use is most commonly an instream use (Bradley, 2017).
- industrial water use
Water used for fabrication, processing, washing, and cooling. Includes industries such as chemical and allied products, food, mining, paper and allied products, petroleum refining, and steel (Dieter and others, 2018).
- instream use
Water that is used, but not withdrawn, from a surface-water source for such purposes as hydroelectric power generation, navigation, water-quality improvement, fish propagation, and recreation. Instream use is not included in surface-water totals of this report (Dieter and others, 2018).
- irrigation water use
Any withdrawal made for the use of water application to vegetation. This use includes application to field crops such as rice, corn, cotton, fruit crops, nurseries, and special applications such as the watering of golf courses and sporting fields (Lovelace, 1991).
- livestock water use
Water used for watering, feedlots, dairy operations, and other livestock production needs of cattle, horses, sheep, swine, poultry, and other animals (Lovelace, 1991; Dieter and others, 2018).
- miscellaneous streams
Refers to surface-water sources from which water is withdrawn for aggregated use categories—livestock, irrigation, and aquaculture—when specific water-body sources were not identified. The term “miscellaneous streams” also is used to indicate sources such as streams, lakes, bayous, and canals for which withdrawals would be insignificant if listed individually (Lovelace, 1991).
- once-through cooling
Cooling system in which the water is withdrawn from a source, circulated through the heat exchangers, and then returned to a body of water at a higher temperature (Dieter and others, 2018). Little water, if any, used in this process is consumed (Lovelace, 1991). Also known as an open-loop cooling system.
- per capita use
The average amount of water used per person during a standard time period, generally per day (Solley and others, 1998).
- power-generation water use
Water used for thermoelectric power-generation purposes such as cooling, sanitation, washing, and steam generation. Use of water for hydroelectric power generation is considered an instream use and not a withdrawal. Therefore, hydroelectric power-generation use is not included in surface-water withdrawal summaries in this report but is reported as an instream use (Lovelace, 1991).
- public-supply deliveries
The amount of water withdrawn and delivered from a public supplier to users for domestic, commercial, industrial, thermoelectric-power, and public-use purposes (U.S. Geological Survey, 2023).
- public-supply water use
Water withdrawn and delivered to a group of users by public or private water suppliers. For this report, a public water supply is defined as one that serves at least 25 people or 15 connections year round. The water is used for a variety of purposes such as domestic, commercial, industrial, or public water needs (Lovelace, 1991).
- rural-domestic water use
Self-supplied water used by a person or family for personal home use, such as drinking, food preparation, bathing, washing clothes and dishes, flushing toilets, and outdoor purposes such as watering lawns and gardens. These users are often in rural areas where public supplies are unavailable (Lovelace, 1991; Dieter and others, 2018).
- saline water
Water that contains 1,000 milligrams per liter or more of dissolved solids (Dieter and others, 2018).
- Standard Industrial Classification (SIC) code
A standard used by Federal agencies for the classification of establishments by type of activity. In 1987, a SIC revision was promulgated by the U.S. Office of Management and Budget to facilitate comparisons of economic statistics by the various government agencies. This SIC version was used as the reference for industrial classification in this report (Office of Management and Budget, 1987; Lovelace, 1991).
- surface water
An open body of water such as a lake, river, or stream (Solley and others, 1998).
- surface-water basin
The land area drained by a river or stream. Also referred to as a “drainage basin” or “watershed” (U.S. Geological Survey, 2023).
- water use
Water withdrawn or diverted from a groundwater or surface-water source for a specific purpose, such as for public supply, industry, power generation, rural domestic, livestock, irrigation, or aquaculture purposes (Lovelace, 1991; Dieter and others, 2018).
- water withdrawal
Water removed from a groundwater or surface-water source for use (Dieter and others, 2018).
Glossary References Cited
Bradley, M.W., comp., 2017, Guidelines for preparation of State water-use estimates for 2015: U.S. Geological Survey Open-File Report 2017–1029, 54 p., accessed February 8, 2018, at https://doi.org/10.3133/ofr20171029.
Dickens, J.M., Forbes, B.T., Cobean, D.S., and Tadayon, S., 2011, Documentation of methods and inventory of irrigation data collected for the 2000 and 2005 U.S. Geological Survey estimated use of water in the United States, comparison of USGS-compiled irrigation data to other sources, and recommendations for future compilations: U.S. Geological Survey Scientific Investigations Report 2011–5166, 60 p. [Also available at https://pubs.usgs.gov/sir/2011/5166/.]
Dieter, C.A., Maupin, M.A., Caldwell, R.R., Harris, M.A., Ivahnenko, T.I., Lovelace, J.K., Barber, N.L., and Linsey, K.S., 2018, Estimated use of water in the United States in 2015: U.S. Geological Survey Circular 1441, 65 p., accessed June 3, 2020, at https://doi.org/10.3133/cir1441. [Supersedes USGS Open-File Report 2017–1131.]
Kleiss, B.A., Coupe, R.H., Gonthier, G.J., and Justus, B.G., 2000, Water quality in the Mississippi Embayment, Mississippi, Louisiana, Arkansas, Missouri, Tennessee, and Kentucky, 1995–98: U.S. Geological Survey Circular 1208, 15 p. [Also available at https://pubs.usgs.gov/circ/circ1208/.]
Solley, W.B., Pierce, R.R., and Perlman, H.A., 1998, Estimated use of water in the United States in 1995: U.S. Geological Survey Circular 1200, 71 p. [Also available at https://doi.org/10.3133/cir1200.]
U.S. Geological Survey, 2023, Water resources of the United States—Water basics glossary: U.S. Geological Survey web page, accessed September 19, 2023, at https://water.usgs.gov/water-basics_glossary.html.
Appendix 1. Water Use by Parish
Appendix References Cited
Robinson, A.L., 2025, Water withdrawals in Louisiana, 2020: U.S. Geological Survey data release, https://doi.org/10.5066/P13G8OMQ.
U.S. Census Bureau, 2020, Total population, decennial census, table P1 in DEC 118th Congressional District summary file: U.S. Census Bureau web page, accessed November 13, 2023, at https://data.census.gov/table/DECENNIALCD1182020.P1?g=040XX00US22.
Appendix 2. Water Use by Aquifer
Appendix Reference Cited
Robinson, A.L., 2025, Water withdrawals in Louisiana, 2020: U.S. Geological Survey data release, https://doi.org/10.5066/P13G8OMQ.
Appendix 3. Water Use by Surface-Water Basin
Appendix References Cited
Garrison, C.R., and Covay, K.J., 1994, Statistical summary of surface-water quality in Louisiana Sabine River basin, 1952–85: Louisiana Department of Transportation and Development, Water Resources Technical Report no. 55A, 63 p. [Also available at https://wise.er.usgs.gov/dp/pdfs/TR55A.pdf.]
Robinson, A.L., 2025, Water withdrawals in Louisiana, 2020: U.S. Geological Survey data release, https://doi.org/10.5066/P13G8OMQ.
Conversion Factors
U.S. customary units to International System of Units
For more information about this publication, contact
Director, Lower Mississippi-Gulf Water Science Center
U.S. Geological Survey
640 Grassmere Park, Suite 100
Nashville, TN 37211
For additional information, visit
https://www.usgs.gov/centers/lmg-water/
Publishing support provided by
U.S. Geological Survey Science Publishing Network,
Lafayette Publishing Service Center
Disclaimers
Any use of trade, firm, or product names is for descriptive purposes only and does not imply endorsement by the U.S. Government.
Although this information product, for the most part, is in the public domain, it also may contain copyrighted materials as noted in the text. Permission to reproduce copyrighted items must be secured from the copyright owner.
Suggested Citation
Robinson, A.L., 2026, Water use in Louisiana, 2020: U.S. Geological Survey Scientific Investigations Report 2026–5135, 150 p., https://doi.org/10.3133/sir20265135.
ISSN: 2328-0328 (online)
ISSN: 2328-031X (print)
Study Area
| Publication type | Report |
|---|---|
| Publication Subtype | USGS Numbered Series |
| Title | Water use in Louisiana, 2020 |
| Series title | Scientific Investigations Report |
| Series number | 2026-5135 |
| ISBN | 978-1-4113-4660-4 |
| DOI | 10.3133/sir20265135 |
| Publication Date | May 07, 2026 |
| Year Published | 2026 |
| Language | English |
| Publisher | U.S. Geological Survey |
| Publisher location | Reston, VA |
| Contributing office(s) | Lower Mississippi-Gulf Water Science Center |
| Description | Report: viii, 150 p.; Data Release |
| Country | United States |
| State | Louisiana |
| Online Only (Y/N) | N |
| Additional Online Files (Y/N) | N |