

Assessment of Groundwater Quantity and Quality Contributions to Lake Huron
Links
- Document: Report (19 MB pdf) , HTML , XML
- Data Release: USGS data release - Data to improve the understanding of groundwater quantity and quality contributions to Lake Huron
- NGMDB Index Page: National Geologic Map Database Index Page (html)
- Download citation as: RIS | Dublin Core
Acknowledgments
The authors of this report would like the acknowledge those who contributed to the success of this report: Joseph V. Klein for collecting field samples in the northern part of the study area and Derrick Hubbell, Daniel J. Obenauer, and Robert W. Howell for collecting the field samples in the southern part of the study area; the Lake Huron Cooperative Science and Monitoring Initiative for funding this work; the Lake Huron Working Group Partnership for continuous support and meetings; the Michigan Department of the Environment, Great Lakes, and Energy for sharing water-quality data from the WaterChem database; and technical reviews from Christopher J. Hoard and Martha G. Nielsen.
Abstract
Lake Huron, one of the five Great Lakes, borders the United States and Canada, with Michigan as the only U.S. State on its shoreline. Like other freshwater lakes, it faces water-quality challenges from nutrients and chemicals applied across its drainage basin. Although past studies focused on surface-water sources, groundwater contributions remain less understood. To address this gap, the U.S. Geological Survey, as part of the Cooperative Science and Monitoring Initiative, classified drainage basins to Lake Huron into eight hydrogeologic zones based on bedrock rock type and glacial sediment transmissivity. Utilizing existing data and empirical field data, we quantified groundwater discharge and identified areas of concern for loading of chloride and nitrate to Lake Huron. Groundwater contributions, including indirect and shoreline discharge, ranged from 5.8 to 11.5 inches annually, totaling 1.9 cubic miles and 0.09 cubic mile, respectively. Hydrogeologic zones with higher glacial sediment transmissivity yielded greater indirect groundwater discharge. Chloride levels above the U.S. Environmental Protection Agency’s 250-mg/L recommendation were mainly in the Saginaw lowlands, whereas nitrate above the 10-mg/L standard was rare—found in only 11 wells. Together, the analysis of where groundwater discharge is occurring in the Lake Huron Basin and the identification of areas with potential groundwater-quality concerns can help prioritize areas that are critical to protecting the long-term health of Lake Huron.
Plain Language Summary
Lake Huron is one of the five Great Lakes and is solely bordered by the State of Michigan on the U.S. side of the lake. Nutrients like nitrate and chemicals like chloride are commonly applied to the land surface in the form of agricultural fertilizers and road salts. Nutrients and chemicals can then be transported to downstream water bodies, such as Lake Huron, through streams and groundwater flow. However, neither the volume of groundwater nor the nutrients and chemicals it contributes to Lake Huron are well understood. As part of the Cooperative Science and Monitoring Initiative program, the goals of this study were to assess how much groundwater annually enters Lake Huron and identify if groundwater may be causing nitrate or chloride contamination to Lake Huron. In this study, we quantified groundwater contributions to Lake Huron for drainage areas with similar geology, analyzed existing datasets of groundwater quality with respect to nitrate and chloride, and collected field samples to compare to the other analyses. The results showed that most of the groundwater entering Lake Huron came from groundwater that discharges to streams that flow into the lake, and smaller amounts of groundwater enter Lake Huron through groundwater that directly discharges to the lake shore. Chloride was found to be a greater contaminant risk to Lake Huron because elevated chloride was identified in many groundwater samples from both the bedrock and glacial aquifers. Nitrate was less prevalent in the groundwater samples analyzed. Most groundwater samples did not have detectable levels of nitrate, and the samples that did were primarily from groundwater in the glacial aquifer that lay under agricultural areas.
Introduction
Groundwater is an important input to the Lake Huron water balance (Granneman and others, 2000); however, the quantity and quality of the groundwater have been largely understudied. Groundwater plays a critical role in the water quality of the lake because it can help buffer tributary temperatures and pH (Granneman and others, 2000) and transport nutrients and contaminants of concern to the lake (Haack and others, 2005; Xu and others, 2021). With the available studies and data, the Lake Huron 2022 to 2026 Lakewide Action Management Plan (LAMP) identified the groundwater quality across the Lake Huron Basin as “good” with low levels of nitrate and chloride (Environment and Climate Change Canada [ECCC] and U.S. Environmental Protection Agency [EPA], 2022). However, no long-term trends in quality were assessed owing to a lack of data, and the LAMP highlighted the need to better understand groundwater flow within the basin (ECCC and EPA, 2022).
The Cooperative Science and Monitoring Initiative (CSMI) is a program under the Science Annex of 2012 Great Lakes Water Quality Agreement that facilitates scientific research to provide monitoring and information for environmental management (ECCC and EPA, 2022). CSMI functions on a 5-year cycle and designates core research priorities for each of the five Great Lakes. The 2022 CSMI for Lake Huron included two priorities for groundwater in the Lake Huron Basin, which are included in the 2022 to 2026 Lake Huron LAMP (ECCC and EPA, 2022). These priorities address the need (1) to quantify groundwater inputs to Lake Huron and (2) to evaluate the effects of groundwater quality on physical, biological, and chemical processes in Lake Huron (ECCC and EPA, 2022). This study, supported through a partnership with CSMI, directly addresses the 2022 CSMI goals related to groundwater.
The specific objectives of this study were to (1) classify U.S. Lake Huron drainage basins using the bedrock and glacial geologies, (2) estimate the amount of groundwater discharging to Lake Huron from indirect discharge through stream base flow and direct shoreline discharge for each drainage basin within these geologic groups, (3) assess the risk of chloride and nitrate contaminants being transported to Lake Huron by groundwater using existing water-quality data, and (4) “ground truth” the analyses results utilizing empirical data collected for this study. This study leverages an approach refined through earlier CSMI research in the Lake Superior Basin (Nielsen and Martin, 2024). Better understanding of the source of large groundwater contributions to the lake and the areas in the basin with any groundwater-quality concerns can help managers effectively allocate resources.
Description of Study Area
The U.S. section of the Lake Huron Basin (hereafter referred to as the “Lake Huron Basin”), is located in the State of Michigan in the midwestern United States (fig. 1). The Lake Huron Basin for this study was defined as the total area of the hydrologic unit code 8 (HUC–8) basins draining to Lake Huron that were fully contained within the U.S. boundaries. The basin drains approximately 15,375 square miles of land from Michigan to Lake Huron and contains 684 miles of Lake Huron coastline.
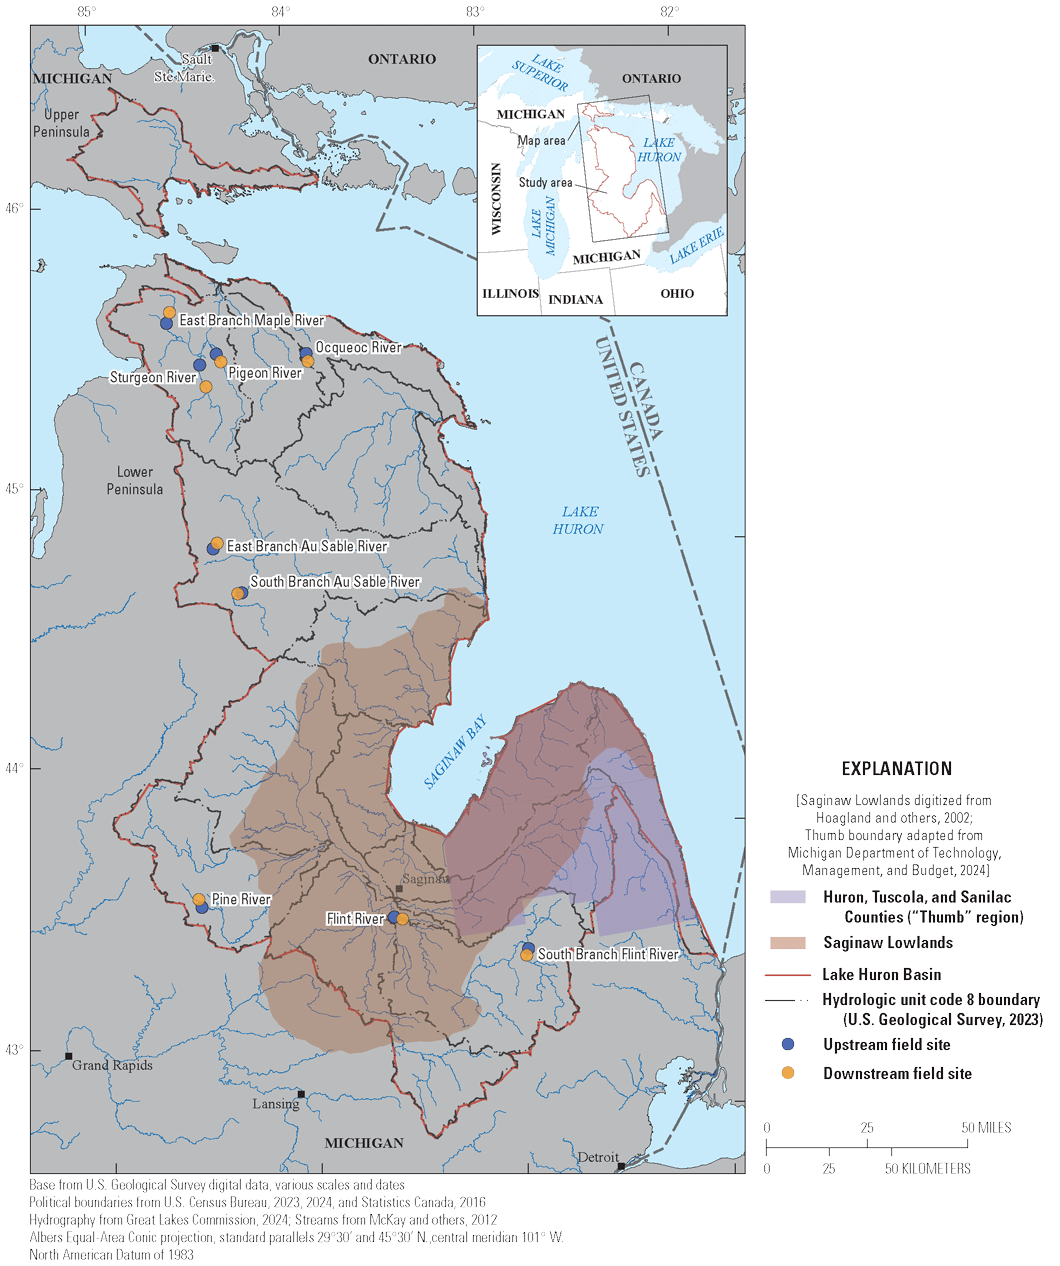
Map of the study area in eastern Michigan showing the hydrologic unit code 8 watersheds located fully within the United States boundary draining to Lake Huron and the upstream and downstream sites where field measurements were collected.
According to the Köppen-Geiger climate classification system, the northern part of the Lake Huron Basin is characterized as a humid, continental climate with mild summers and year-round precipitation (Dfb climate group), whereas the southern part of the basin is a humid, continental climate with hot summers and year-round precipitation (Dfa climate group) (Beck and others, 2018). The basin receives an average of 32.7 inches of precipitation annually (PRISM and Northwest Alliance for Computational Science & Engineering, 2022). Precipitation has been increasing from 1990 to 2020 and is projected to continue to increase with climate change (Kessler and Fry, 2022). The average temperature during the winter months (December through February) is 23.0 degrees Fahrenheit and during the summer months (June through August) is 67.1 degrees Fahrenheit (PRISM and Northwest Alliance for Computational Science & Engineering, 2024).
The Lake Huron Basin is located within the Michigan Basin (not shown), which consists of layers of sedimentary rocks formed into a bowl shape in Michigan’s Lower Peninsula and extending into parts of the Upper Peninsula (Hoaglund and others, 2002). Subcropping units of Ordovician to Jurassic bedrock are covered by thick Pleistocene glacial deposits. These surficial deposits are thickest in the western parts of the basin, thinning eastward toward the coastline (Soller and Garrity, 2018). Together, the bedrock units and glacial deposits make up a complex stratigraphy of aquifer systems and confining units.
The primary aquifers across the Lake Huron Basin include the sandstone Marshall aquifer (not shown), the sandstone and carbonate Parma-Bayport aquifer (not shown), the sandstone Saginaw aquifer (not shown), and the glacial aquifer from glacial deposits (Westjohn and Weaver, 1998). The glacial aquifer is the most heavily utilized aquifer across most of the basin except near the coastline and Huron, Tuscola, and Sanilac Counties (hereafter referred to as the “Thumb”) of the Lower Peninsula of Michigan where the glacial deposits are thin (Apple and Reeves, 2007). Furthermore, the glacial aquifer is a series of aquifers within the larger glacial deposits package but is often treated as one aquifer system (Hoaglund and others, 2002). The Marshall and Saginaw aquifers mainly consist of sandstone, whereas the Bayport-Parma aquifer is a combination of limestone and sandstone (Westjohn and Weaver, 1998). In addition to the primarily sandstone bedrock aquifers, the limestone of the Detroit River Group, Dundee Limestone, and Traverse Group are accessed across a few northern counties in the Lower Peninsula (Cathcart, 1982; Apple and Reeves, 2007). Aside from the glacial aquifer, the primary aquifers in the eastern end of the Upper Peninsula include the Jacobsville Sandstone of Keweenawan Supergroup, the Prairie du Chien Group, the sandstone of the Munising Formation, and the Niagara Group, which includes the Engadine Dolomite, the Manistique Dolomite, and the Burnt Bluff Formation (Apple and Reeves, 2007).
Previous Studies
Although little research has specifically occurred on groundwater flow in the Lake Huron Basin, groundwater-flow models across the entire Michigan Basin and Great Lakes Basin (not shown) have been constructed previously (Hoaglund and others, 2002; Xu and others, 2021). Based on these other studies, groundwater recharges across most of the Lake Huron Basin and flows downward through the glacial aquifer into the bedrock aquifers (Hoaglund and others, 2002). However, less surficial recharge occurs in the Saginaw lowlands, and groundwater from the bedrock aquifers flows upward and mixes with the shallow groundwater in this region (Kolak and others, 1999; Curtis and others, 2018).
Lake Huron is a regional sink for groundwater (Xu and others, 2021). Most of the groundwater flowing directly to the lake system enters near the shoreline of the lake as opposed to the offshore lakebed (Feinstein and others, 2010; Xu and others, 2021); however, offshore springs do exist off the coast of the northern Lower Peninsula (Ruberg and others, 2008). Groundwater entering the lake near the shoreline occurs either through direct shoreline discharge or indirectly through groundwater discharge to streams and subsequent stream discharge into the lake. The flux of groundwater to the lake through indirect discharge in the form of base flow has been determined to be much larger than that of direct shoreline discharge (Hoaglund and others, 2002). Although these regional studies provide some information on regional flow, the current study seeks to provide more localized information across the Lake Huron Basin to understand how groundwater contributions to Lake Huron differ across the basin.
Groundwater-quality research and modeling with respect to chloride and nitrate has also occurred across the State of Michigan (Knights and others, 2017; Curtis and others, 2018; Hamlin and others, 2020) or in small, localized areas of the Lake Huron Basin (Kolak and others, 1999). The LAMP designates the overall concentrations of chloride and nitrate as “good” across the basin (ECCC and EPA, 2022). However, high concentrations of chloride have been well-established to exist (greater than 250 milligrams per liter [mg/L]) across bedrock aquifers in Michigan, as deep brines with total dissolved solids concentrations greater than 100,000 mg/L exist in the bedrock (Long and others, 1988; Kolak and others, 1999). Specifically, upwelling of groundwater has resulted in increasing groundwater salinization in the Saginaw lowlands (Long and others, 2015; Curtis and others, 2019). Although deep brines can be a major source of chloride in groundwater in the Michigan Basin, chloride can also be introduced to the groundwater through anthropogenic sources such as oil and gas drilling, road salting, and septic systems (Kornelsen and Coulibaly, 2014). Shallow groundwater discharging to streams may be at a higher risk of contamination from anthropogenic sources (Boutt and others, 2001). Although the chloride concentrations aggregated across the entire basin may be below current management thresholds, the research in this report seeks to characterize the spatial distribution of chloride in the glacial and bedrock aquifers across the Lake Huron Basin using existing chloride data to better determine any areas of concern.
Nitrate concentrations are generally higher in shallower groundwater wells than deeper wells (Burrow and others, 2010) largely because groundwater contamination from nitrate mainly originates from anthropogenic sources such as fertilizer application, manure, and septic systems (Hamlin and others, 2022). As a result, many studies in Michigan have focused on the threat of nitrate contamination in the glacial aquifer, as opposed to bedrock aquifers (Luscz and others, 2015; Hamlin and others, 2020, 202223; Martin and others, 2021). The main source of nitrogen (N) to Lake Huron is from chemical fertilizers, manure, and N fixation through legumes (Hamlin and others, 2020). Luscz and others (2015) and Hamlin and others (2020) illustrate that N loading is likely much larger in the southern part of the basin, particularly in the Thumb of the Lower Peninsula and the Saginaw lowlands. However, Hamlin and others (2022) determined that groundwater concentrations of nitrate in the Thumb are generally under the 10-mg/L maximum contaminant level (MCL) established by the EPA. The research in this report will expand upon the current understanding of nitrate in the groundwater across the Lake Huron Basin.
Purpose and Scope
The purpose of this report is to describe the hydrogeology of the Lake Huron Basin, estimate the groundwater contributions to Lake Huron through direct and indirect discharge, and provide an assessment of the groundwater-quality conditions with respect to nitrate and chloride. Geologic and hydrologic data, compiled as part of previous investigations, were used for characterizing the hydrogeology in the Lake Huron Basin, estimating groundwater contributions to the lake using a water-budget approach, and assessing chloride and nitrate groundwater concentrations across the basin. Field data were gathered to ground truth base-flow data used in the water-budget analysis and to gather more groundwater chloride and nitrate data. This field collection was an additional part of the study that sought to provide more background information for a potential future groundwater model. However, the field data are not an extensive part of this work, as it encompasses a small set of sites. The report explains the methods used to characterize geology in the basin into hydrogeologic zones using existing surficial and bedrock geologic maps. The procedures are then detailed for determining the water budget for each of the hydrogeologic zones, and the results of the water budget by hydrogeologic zone are presented. These results include the indirect groundwater contributions to the lake through base flow and the direct groundwater contributions through shoreline discharge. Finally, this report details how the groundwater chloride and nitrate data were cleaned and analyzed to evaluate spatial trends across the basin. Chloride and nitrate were selected for the water-quality analysis because large datasets existed for both of these constituents, and the State of the Great Lakes report and the LAMP report (regional reports that provide a summary of indicators including groundwater health) use metrics based on nitrate and chloride (ECCC and EPA, 2022; Zhang and others, 2022).
Methods
The methods described in this section first classify the subbasins of Lake Huron at the HUC–8 scale into hydrogeologic zones. The hydrogeologic zones are used for the remainder of the analysis to understand how water quantity and quality vary across the basin. Water-budget calculations, an evaluation of the distribution of wells in the bedrock and glacial aquifers, and the spatial analysis of groundwater nitrate and chloride across the basin are then detailed. The final section of the methods describes the field methods used to measure streamflow discharge and water-quality parameters. The hydrogeologic zone classification, results of the water-budget components, and summary of the water-quality analysis can be accessed in the accompanying data release from Kaemming and others (2026).
Hydrogeologic Characterization
The geology of the Lake Huron Basin was classified on the basis of common properties to aid interpretations of the water-budget and water-quality analyses. Three main data sources were used to characterize the Lake Huron Basin into hydrogeologic zones: (1) the Watershed Boundary Dataset at the HUC–8 scale (USGS, 2023), (2) maps of bedrock geology in Michigan (Milstein, 1987; Reed and Daniels, 1987), and (3) a map of texture-based estimates of transmissivity (Bayless and others, 2017). Hydrogeologic zones were delineated within HUC–8 boundaries fully contained within the U.S. domestic boundaries, creating 16 zones across the basin.
The bedrock maps from Milstein (1987) and Reed and Daniels (1987) contained 32 unique geologic units within the Lake Huron Basin. For this study, each geologic-map unit was grouped by rock type and condensed into four main categories – breccia, limestone, sandstone and shale (fig. 2). The breccia group was composed of the Devonian Mackinac Breccia. The limestone group consists of (in ascending order): the Ordovician Prairie du Chien Group [undivided]; the Ordovician Black River Group [undivided]; the Ordovician Trenton Group [undivided]; the Ordovician Stonington Formation and Big Hill Dolomite (both of the Richmond Group); the Silurian Manitoulin Dolomite of the Cataract Group; the Silurian Burnt Bluff Group [undivided]; the Silurian Manistique Group [undivided]; the Silurian Engadine Group [undivided]; the Devonian Bois Blanc Formation; the Devonian Detroit River Group [undivided]; the Devonian Dundee Limestone; the Devonian Traverse Group [undivided]; the Mississippian Bayport Limestone of the Grand Rapids Group; and the Pennsylvanian Grand River Formation. The sandstone group is composed of (in ascending order): the Devonian Berea Sandstone and Bedford Shale [undivided]; the Berea Sandstone (where separately mapped); the Mississippian Marshall Sandstone; and the Pennsylvanian Saginaw Formation. The units labeled as shale were (in ascending order): the Ordovician Collingswood Shale Member, Utica Shale Member, and Queenston Shale (all of the Richmond Group); the Silurian Cabot Head Shale of the Cataract Group; the Silurian Point aux Chenes Shale of the Salina Group; the Devonian Bell Shale of the Traverse Group; the Devonian Antrim Shale; the Devonian Ellsworth Shale; the Devonian Bedford Shale (where separately mapped); Mississippian Sunbury Shale; Mississippian Coldwater Shale; the Mississippian Michigan Formation of the Grand Rapids Group; and the Jurassic red beds. After the geology was simplified, each HUC–8 was classified into one of these bedrock categories based on the dominant rock type within the HUC–8.
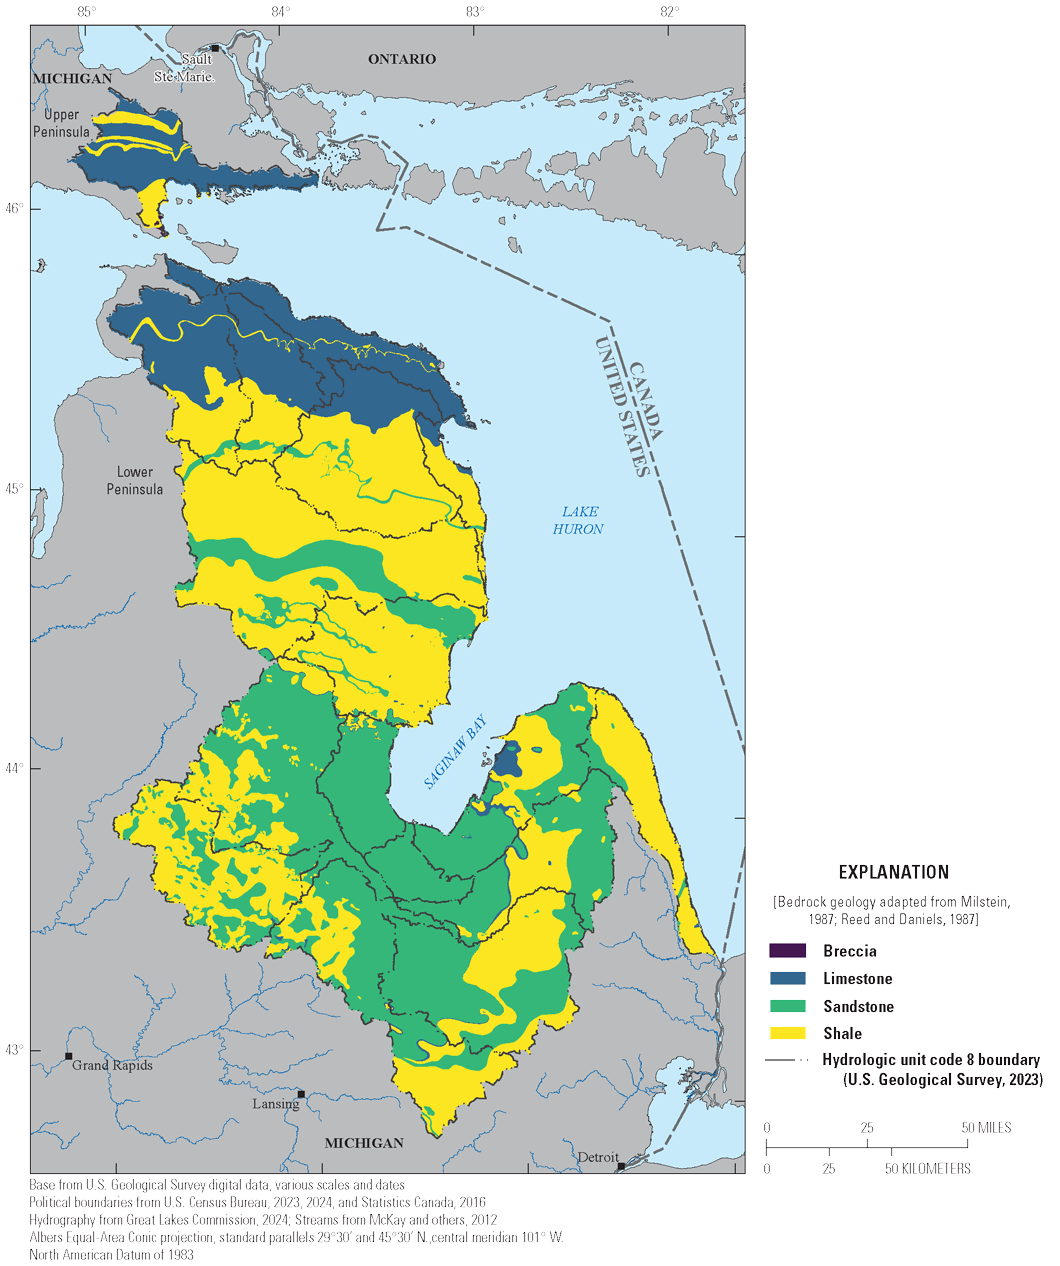
Map of the bedrock geology categorized by rock type underlying the glacial deposits in the Lake Huron Basin.
Glacial deposits cover most of the State of Michigan. These deposits vary in thickness with the thickest located near the northern center of the Lower Peninsula (fig. 3; Soller and Garrity, 2018). Texture-based estimates of transmissivity (Bayless and others, 2017) were used to characterize the glacial deposits into areas of high, medium, and low transmissivity (fig. 4). The average glacial transmissivity was calculated for each HUC–8, and the average value was used to classify each HUC–8 as high, medium, or low transmissivity, where low transmissivity was less than 1,000 square feet per day (ft2/d); medium was 1,000 to 2,000 ft2/d; and high was greater than 2,000 ft2/d.
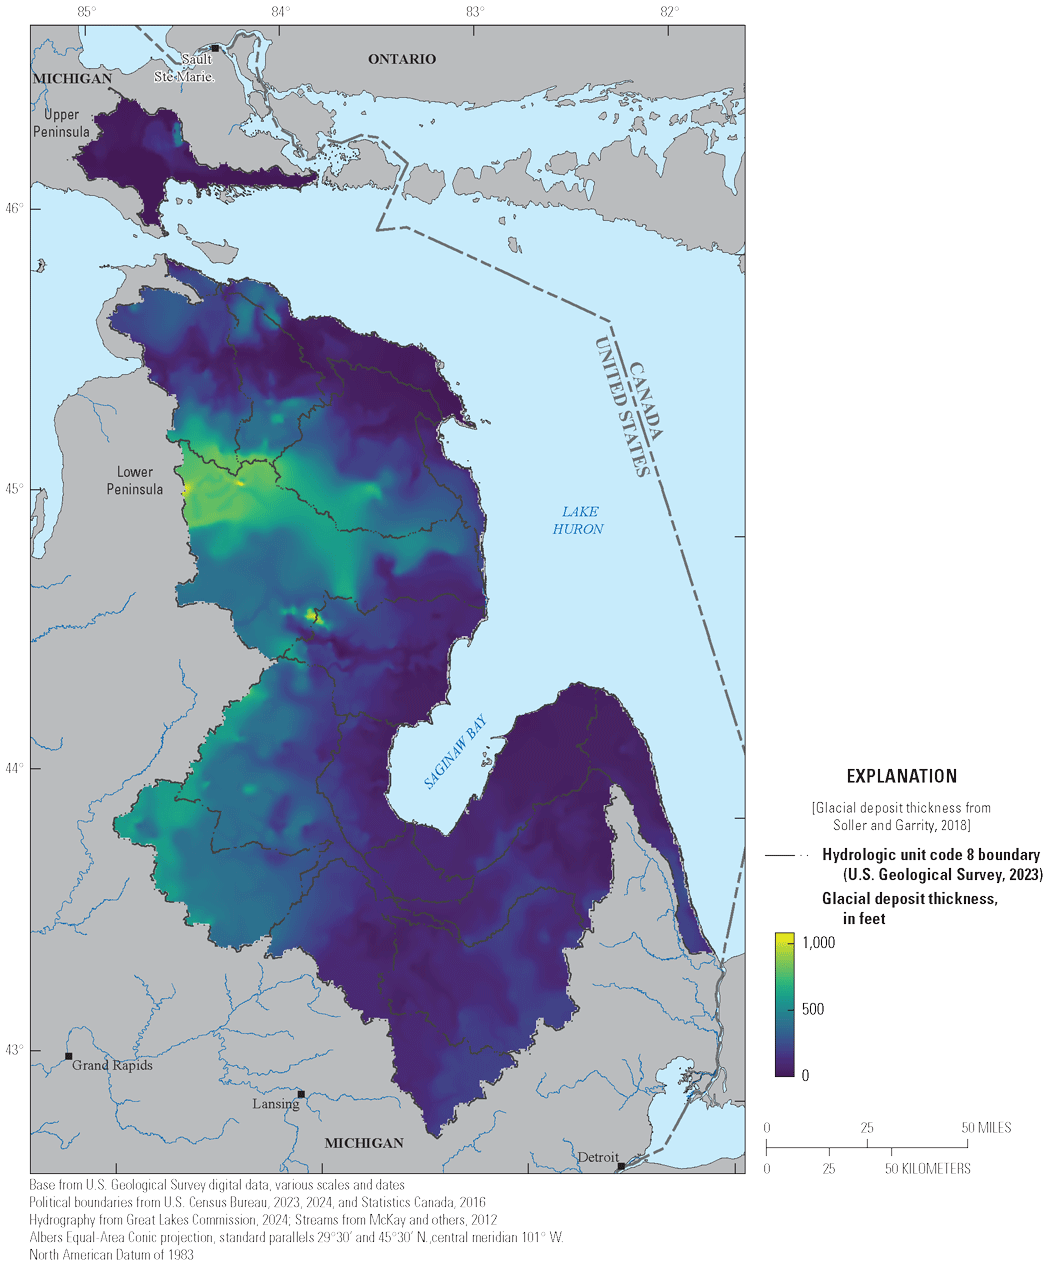
Map of the thickness of the glacial deposits, in feet, across the Lake Huron Basin, overlain by the hydrologic unit code 8 watershed boundaries.
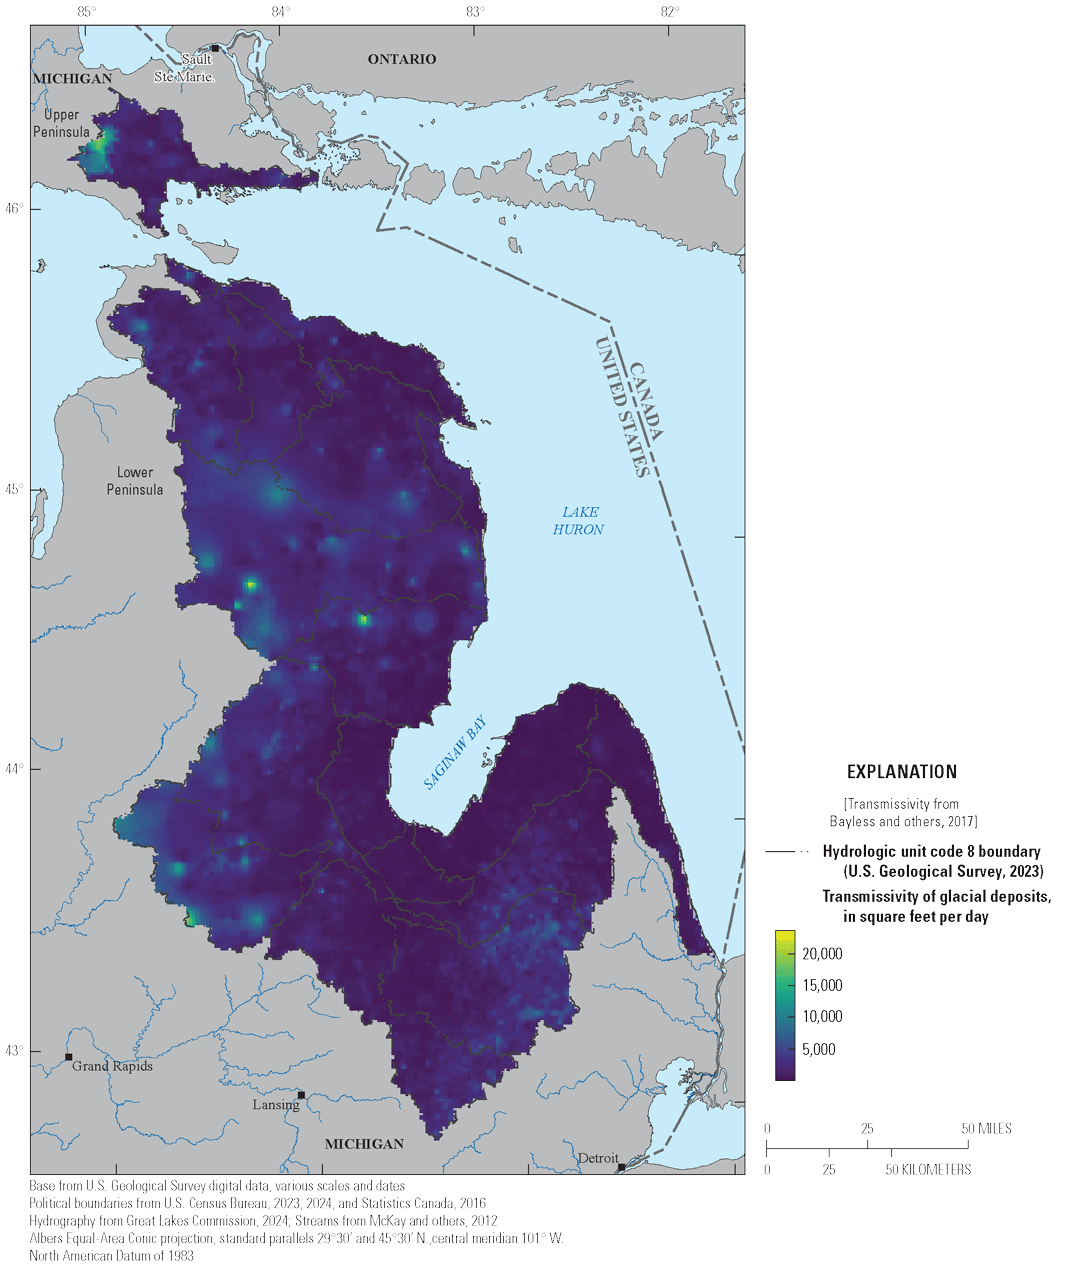
Map of the transmissivity of the glacial sediments, in square feet per day, in the Lake Huron Basin, overlain by hydrologic unit code 8 watersheds.
Each HUC–8 was then classified into one of the eight total hydrogeologic zone classifications using the dominant bedrock type and the overlying glacial deposit transmissivity classification. The hydrogeologic zone classifications were high transmissivity over sandstone (HTSa), medium transmissivity over sandstone (MTSa), low transmissivity over sandstone (LTSa), high transmissivity over shale (HTSh), medium transmissivity over shale (MTSh), low transmissivity over shale (LTSh), high transmissivity over limestone (HTL), and medium transmissivity over limestone (MTL). Low transmissivity over limestone would have also been a hydrogeologic zone, but no zones met that classification. Additionally, each HUC–8 was assigned a section number (for example, MTL, section 1) that allowed for the differentiation of HUC–8s with the same hydrogeologic classification (fig. 5). These hydrogeologic zones were used for the subsequent analyses.
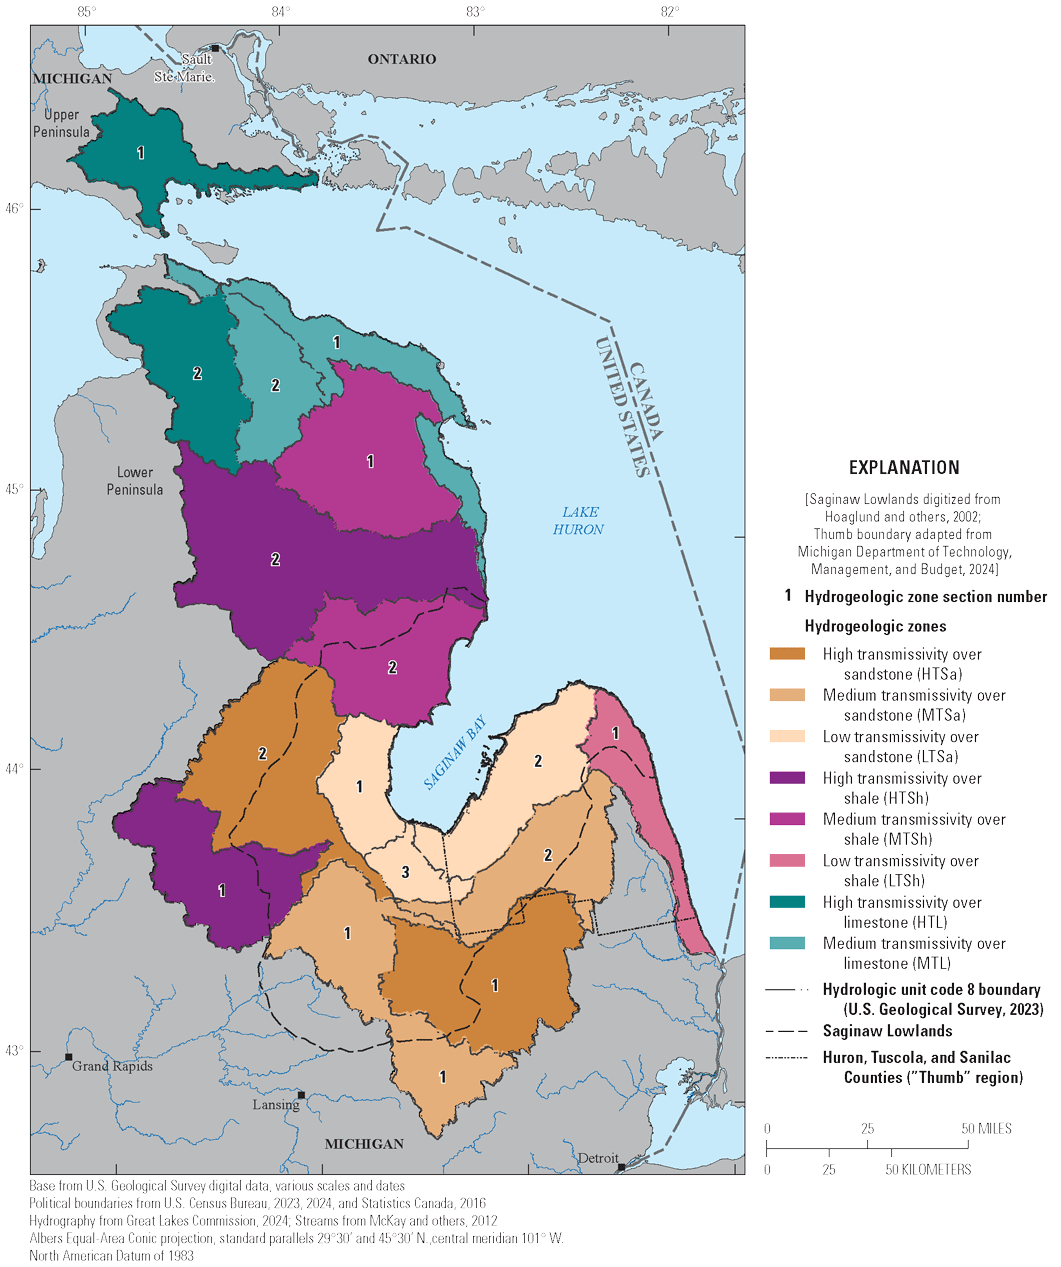
Map of the eight hydrogeologic zones assigned to the hydrologic unit code 8 watersheds in the Lake Huron Basin based on their predominant bedrock type and average glacial deposit transmissivity.
Water-Budget Analysis
An annual steady-state water budget was calculated for each hydrogeologic zone to estimate the groundwater contributions from the Lake Huron Basin into Lake Huron. Terms of the water balance, which in this report are given in units of inches per year, are displayed in equation 1. The change in storage is assumed to be 0 from year to year during the long term, so the precipitation is equal to the sum of base flow, runoff, shoreline discharge, and evapotranspiration (ET).
whereΔS
is the change in storage in a hydrogeologic zone,
Precipitation
is the average annual precipitation,
GWIndirect
is the average annual indirect groundwater discharge to Lake Huron via base flow to streams,
Runoff
is the average annual runoff,
GWShoreline
is the annual direct groundwater discharge to Lake Huron via shoreline discharge, and
ET
is the average annual evapotranspiration.
This analysis relied on preexisting datasets and models, using multiple sources for each component when possible. Owing to the limited availability of datasets, not all data have the same period of record. If data were reported at an annual time step, the data were analyzed for a trend at the Lake Huron Basin scale using a Mann-Kendall test (Mann, 1945) and were only included in the analysis if there was no trend. Results of the water-budget calculations are available in the accompanying data release (Kaemming and others, 2026).
Precipitation
The precipitation input to the model was the Parameter-elevation Regressions on Independent Slopes Model (PRISM) 30-year normal precipitation from 1991 to 2020 (PRISM and Northwest Alliance for Computational Science & Engineering, 2022). The PRISM precipitation data were available as a gridded dataset with an 800-meter grid cell size. The precipitation was spatially averaged over each of the hydrogeologic zones for this analysis.
Evapotranspiration
Three different ET models—Reitz and others (2017a, 2017b)57 and Wolock and McCabe (2018)—were averaged to obtain an ET estimate for each hydrogeologic zone. The dataset from Reitz and others (2017b) uses a Simplified Surface Energy Balance model in combination with a water balance model and spans from 2000 to 2015, whereas the dataset from Reitz and others (2017a) uses a water balance model to calculate actual ET with data spanning from 2000 to 2013. Wolock and McCabe (2018) also used a water balance approach with data ranging from 1990 to 2015. Although not all datasets have the same available years, the analysis in this report assumed that the average across all available years represents the steady state ET. The average annual ET across the Lake Huron Basin was analyzed for an annual trend through time using the Mann-Kendall test for each dataset, and all three datasets had no significant trend.
The processing of each ET dataset was handled in the same way, as each dataset was in a raster format. First, the dataset was averaged through time. The ET data were then averaged through space for each hydrogeologic zone. Finally, the average ET was taken across the three estimates for each hydrogeologic zone to be used in the water-budget analysis.
Indirect Groundwater Discharge
The indirect groundwater discharge through base flow to streams was aggregated across four datasets: weighted base-flow calculations from continuous streamgages (U.S. Geological Survey [USGS], 2024b), a vector-based geospatial dataset of recharge from Aichele (2005), recharge from a Soil-Water-Balance (SWB) model (Trost, 2018), and drain flow from a national shallow groundwater model (Zell and Sanford, 2020). Multiple datasets were used to better understand the uncertainty around the indirect groundwater discharge component of groundwater to Lake Huron and owing to the lack of USGS continuous streamgage data across all of the hydrogeologic zones (fig. 6). Recharge from the Aichele (2005) and SWB recharge datasets was assumed to be equal to base flow for this analysis because the Aichele (2005) dataset used base flow to estimate the recharge, and the SWB recharge was calibrated to base-flow targets (Trost, 2018). The indirect groundwater discharge results from the four datasets, or three datasets if no USGS streamgages were present within a hydrogeologic zone, were averaged for each hydrogeologic zone to obtain the final indirect groundwater discharge estimate.
The base flow for 25 USGS streamgages across the Lake Huron Basin (fig. 6) was calculated using five different hydrograph separation methods. The streamgages used in this analysis represent streamgages with no or minimal flow regulations, more than 5 years of data between 1980 and 2022, and no trend in annual base flow according to a Mann-Kendall trend test. Data were pulled from the National Water Information System (NWIS; USGS, 2024b) and then run through the DVstats package to perform hydrograph separation (Lorenz and DeCicco, 2017). The methods for hydrograph separation included application of the base-flow index to overall discharge (Wahl and Wahl, 1995); hydrograph separation program, HYSEP, with the sliding interval, local minimum, and fixed interval methods (Sloto and Crouse, 1996); and the PART method, which uses streamflow partitioning to estimate base flow (Rutledge, 1998).
The goal of this base-flow analysis was to estimate the long-term average annual base flow for each hydrogeologic zone using an area-weighted average of all the streamgages within a given hydrogeologic zone. To achieve this goal, daily base flow was averaged across the hydrograph separation methods to obtain an average daily base-flow estimate for each streamgage. Then, annual base flow was calculated from the average daily base flow for each year. The annual base flow was then averaged across the hydrograph separation methods to obtain average annual base-flow estimates for each streamgage. Watershed delineations were obtained from the GAGES–II dataset (Falcone, 2011). If a delineation was not available in the GAGES–II dataset, the watershed was delineated using the Python package, pyNHD (Chegini and others, 2021). Because multiple streamgages may exist on the same river, one area of the watershed could be counted several times when using an area-weighted approach for the hydrogeologic zones. To address this limitation, the watersheds were evaluated for any nesting, where an upstream streamgage’s watershed would exist within the downstream streamgage’s watershed, and the incremental watershed area was then determined to be the difference between the two watersheds (fig. 6). The annual base flow of an upstream streamgage was then subtracted from the annual base flow of the downstream streamgage. If streamgages did not overlap for the full period of record, the average proportion of the downstream to upstream streamgage was calculated and applied to the remaining years for the downstream streamgage record. The long-term average base flow was calculated for each streamgage, and the indirect groundwater discharge, in inches per year, was determined by dividing the long-term average discharge by the area of the nested watershed. Finally, the base flow for each hydrogeologic zone was determined by taking the area-weighted average of all of the streamgages within a watershed, where a streamgage with a watershed constituting more area of the HUC–8 would receive more weight.
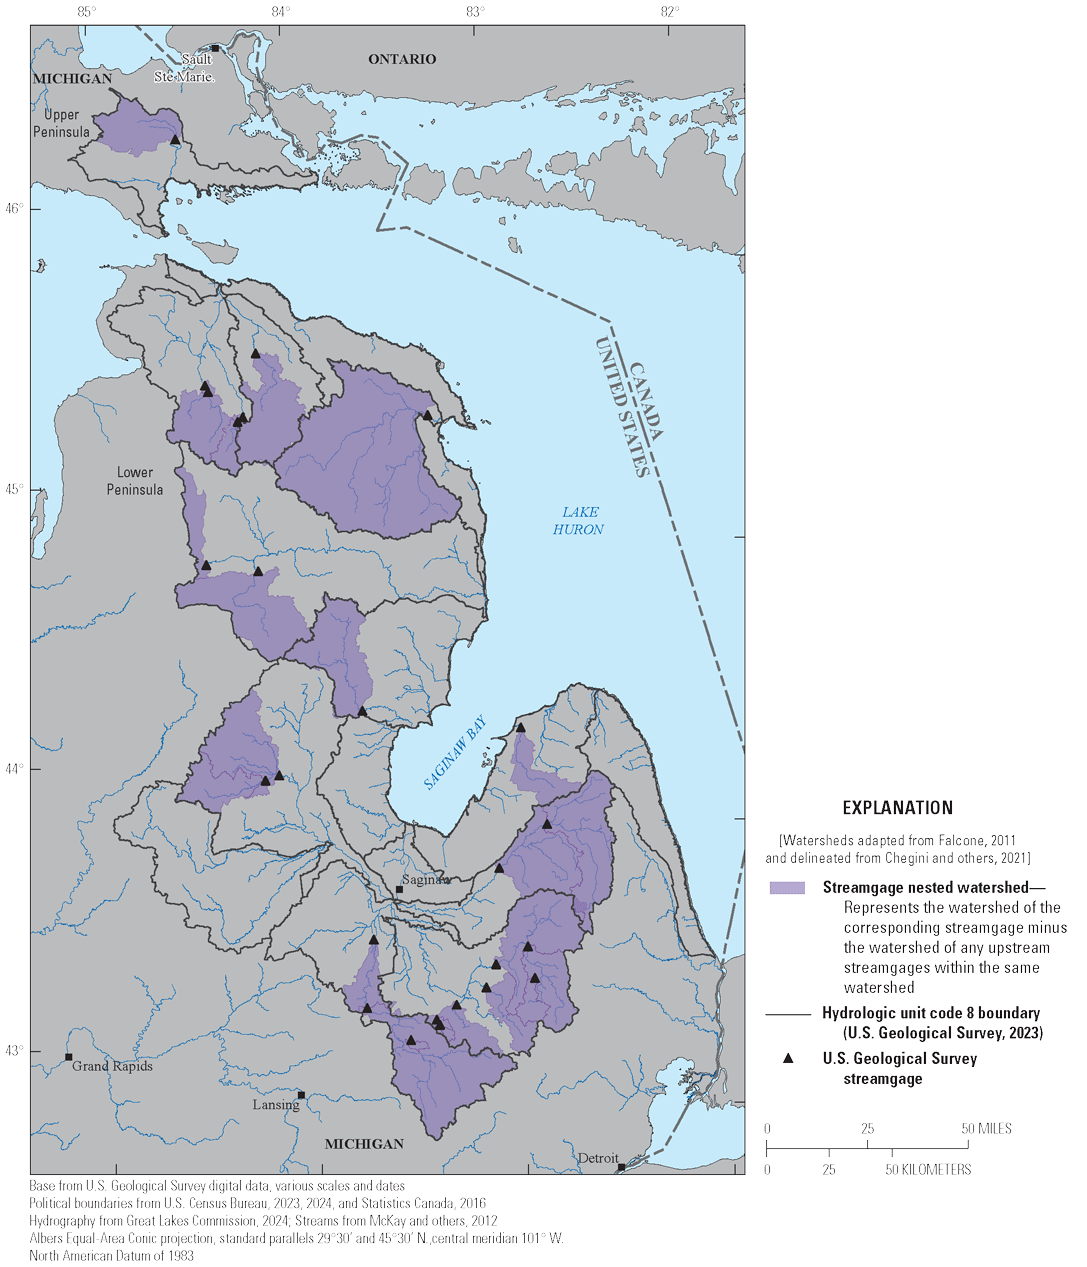
Map of the U.S. Geological Survey streamgages in the Lake Huron Basin used for hydrograph separation and their corresponding nested watersheds.
The recharge dataset from Aichele (2005) contains annual recharge estimates, in inches per year, for each Public Land Survey section across the State of Michigan. This analysis assumed that the recharge in this dataset was equal to base flow for an area because the recharge dataset assumed that the base flow calculated from base-flow separation in gaged basins was equal to the recharge in the basin. Aichele (2005) then created a regression using the base-flow separation and watershed characteristics to estimate the recharge across the State. To calculate the indirect discharge for the water budget, the recharge dataset was spatially clipped to each hydrogeologic zone, and the recharge values were averaged across each zone.
The SWB model outputs used in this analysis contain annual estimates of recharge for the glaciated United States from 1980 to 2011 (Trost, 2018). No annual trend through time was present in the dataset at the Lake Huron Basin scale according to the Mann-Kendall test. The recharge values were temporally and spatially averaged for each geologic zone to obtain the steady state recharge value.
The Zell and Sanford (2020) model is a MODFLOW 6 (Langevin and others, 2017), steady state model simulating shallow groundwater flow across the contiguous United States from 1985 to 2015. The drain package was used in this model to simulate streamflow, and any water flowing into the drain cells was assumed to be base flow (Zell and Sanford, 2020). Therefore, the drain cell (drain package) outputs were extracted from the model and summed to obtain a raster of estimated base flow for this model. The raster was then clipped to each hydrogeologic zone, and the values were averaged.
Direct Shoreline Discharge
The model from Knights and others (2017) estimated shoreline discharge to all the Great Lakes using a water-budget approach commonly used to estimate groundwater discharge to oceans. The work identified stretches of coastline outside areas that contribute to stream base flow and assumed recharge to this area would equal the direct shoreline discharge (Knights and others, 2017). The model output from Knights and others (2017) was the sole dataset used to estimate direct shoreline discharge to Lake Huron, as no other datasets could be identified. The coastline reaches from Knights and others (2017) were spatially joined with the hydrogeologic zones from this study. If a reach overlapped two zones, the reach was manually assigned to one of the zones to ensure the reaches were not double counted. The shoreline discharge calculated for each coastline reach by Knights and others (2017) was then summed across each hydrogeologic zone to obtain a total shoreline discharge.
Runoff
Runoff for each hydrogeologic zone was estimated using the average of two datasets. The first dataset used the same USGS streamgage dataset from NWIS described in the “Indirect Groundwater Discharge” section of the methods (USGS, 2024b), and the second dataset was a modeled quick flow runoff dataset from a contiguous United States scale water-budget model (Reitz and others, 2017a). Not all hydrogeologic zones contained USGS streamgages (fig. 6); therefore, having an additional runoff dataset was necessary to be able to have a runoff estimate from each hydrogeologic zone for the water-budget calculations. If a hydrogeologic zone had both datasets, the water-budget component represents the average of the two. Otherwise, the runoff for the water budget was just the calculation from the Reitz and others (2017a) dataset.
Runoff was calculated for the 25 streamgages using the same area-weighted average approach described within the “Indirect Groundwater Discharge” section. The runoff for each streamgage was the difference between the average annual base flow and the average annual total discharge. The same caveats from the base-flow analysis apply to the runoff analysis, where nested watersheds were used, and the incremental runoff between streamgages was calculated.
The runoff data from Reitz and others (2017a) were obtained as a long-term average raster from 2000 to 2013. The data were spatially clipped to each hydrogeologic zone, and the average runoff value across the hydrogeologic zone was calculated.
Evaluation of Wells Within the Bedrock and Glacial Aquifers
The number of groundwater wells within the bedrock and glacial aquifers was analyzed to obtain a proxy for water withdrawals across the aquifers in Michigan and to be used in the water-quality analysis outlined in the next section. The well data for this analysis were obtained from the Michigan Department of the Environment, Great Lakes, and Energy (MI–EGLE) Wellogic database (MI–EGLE, 2024c).
Quality control was performed on the Wellogic wells to use wells that were active and contained complete well records. The well dataset was filtered so that it did not include any inactive and (or) plugged wells. Further data cleaning was performed to remove wells with depths of 0 or 9999, well records that had static water level flags designated by MI–EGLE, and wells with static water levels deeper than the well depth. Finally, if a well did not have a well depth, but it had the screen interval, the well depth was set to the bottom of the screen. Additionally, the data were checked to ensure the screen tops or bottoms, if present, were not above land surface or deeper than the well depth. After this quality control, 130,656 wells remained in the dataset.
Wells were then designated as screened in bedrock or glacial material based on the well depth compared to the glacial deposit thickness dataset from Soller and Garrity (2018) (fig. 3). The raster of glacial deposit thickness was sampled at each well location. If the depth of the well was greater than the glacial deposit thickness, it was designated as bedrock; otherwise, the well was defined as screened in glacial material. This analysis assumed that glacial deposits started at the land surface for this analysis and that the well depth was representative of the screen depth. The well depth was used as opposed to the screen interval because many wells included a well depth but had no screen information.
Analysis of Chloride and Nitrate
Chloride and nitrate as nitrogen (N) data were obtained for 1994 to 2023 from the Michigan WaterChem database, which is a statewide water-quality database maintained by MI–EGLE (MI–EGLE, 2024b). The water-quality samples represent the constituents from tested drinking water wells with coordinates; however, the samples do not have a unique well identifier associated with them. Therefore, this analysis spatially joined the WaterChem dataset with the well dataset from the Michigan Wellogic database described in the “Evaluation of Wells Within the Glacial and Bedrock Aquifers” section to determine the spatial distribution of chloride and nitrate as N in the bedrock and glacial aquifers.
Quality Control of Water-Quality Data
The WaterChem data were quality assured through a series of data quality criteria described below. Location criteria were used as a first pass filter to screen out potentially spurious data from the water-quality dataset. Any samples with missing Global Positioning System coordinates were removed from the dataset. Along with Global Positioning System coordinates, each sample contained metadata on the county and township where the sample was collected. If the coordinates were not within the specified county or township, the samples were removed from the analysis. The dataset was checked to ensure the data fell within the specified timeframe of 1994 to 2023. Notably, a few samples in both datasets were marked as being collected in 1900, and these points were removed from the analysis. Finally, the samples were assigned a unique location identifier based on the coordinates to better analyze locations with repeat samples.
Spatial Distribution of Chloride and Nitrate Concentrations
The cleaned water-quality datasets were spatially joined with the cleaned Wellogic data to help determine whether the groundwater sample represented water from a glacial or bedrock aquifer. The Wellogic wells were filtered for this analysis to keep household and public water supply wells and wells with an unknown use and to remove wells with a known use other than for drinking water. The sample location needed to be within 328 feet (ft) (100 meters) of a well to be joined with it, and only one unique sample location could match a well. If more than one sample location joined with a well, then the sample closest to the well was assigned the properties of that well. Well assignments were quality controlled by ensuring that the well construction date was older than the water sample date. If the well had no construction date in the well record, the well and samples were kept in the dataset.
The original goal for collecting these data was to establish trends through time with repeat sampling; however, preliminary analysis revealed that only 34 well locations had more than 10 samples for chloride and 121 well locations had more than 10 samples for nitrate. As a result, the samples were instead mapped to better determine the distribution of wells that exceed the 250-mg/L chloride water-quality recommendation (EPA, 2024a) and the 10-mg/L nitrate as N water-quality standard (EPA, 2024b). Although some wells did have multiple samples, only the most recent sample at each well was mapped for this spatial analysis to eliminate potential bias when looking at the distribution of contamination across the basin. We chose the most recent sample, as opposed to the maximum or mean value because we are interested in current quality concerns and identifying the areas where groundwater investigations could be focused.
Field Campaign Design
In October 2024, a field campaign took place to collect measurements of stream discharge and water-quality samples across the Lake Huron drainage basins. All discharge and water-quality samples are available from NWIS (USGS, 2024b). The objective of this field data collection was to have empirical data to compare with the results of the water-budget and water-quality analyses conducted using existing data sources. Ten streams in six of the hydrogeologic zones defined for this study were selected; however, data were only collected at nine sites across five hydrogeologic zones because there was insufficient flow for discharge measurements at one site (fig. 1). Each stream had two points of measurement, an upstream and downstream site, which were located at least a mile apart and without any tributaries between them. Measurements were collected during the fall low-flow months when streamflow in the region becomes primarily groundwater-driven. Measurements were only taken when nearby streamgages were at or below the 25th percentile of daily discharge for that day. Stream discharge measurements at upstream or downstream sites were collected using an acoustic Doppler velocimeter following the standard procedures in Turnipseed and Sauer (2010). Upstream and downstream discharge measurements were collected on the same day; therefore, the change in discharge between the two sites signifies the gain (or loss) to streamflow from groundwater.
In addition to the discharge measurements, discrete samples were collected from upstream or downstream sites based on site access. Results from these samples would be compared to concentrations of chloride and nitrate as N in WaterChem wells within the hydrogeologic zones. Samples were collected from the centroid of the flow or the midpoint of the stream if flow conditions were too low to identify the centroid. Unfiltered chloride samples were collected directly into 100-milliliter bottles and stored on ice. Unfiltered nitrate-nitrite samples were preserved in the field and stored on ice. Samples were delivered to and analyzed by Great Lakes Environmental Center, Traverse City, Michigan, following the automated ferricyanide method (SM 4500-Cl E, parameter code 99220) for chloride (American Public Health Association, 2022a) and automated cadmium reduction method (4500-NO3−F, parameter code 00620) for nitrate-nitrite (American Public Health Association, 2022b).
The streamflow and water-quality data collected in the field were analyzed in coordination with the water-budget and water-quality analyses discussed in the “Water-Budget Analysis” and “Analysis of Chloride and Nitrate” sections. The change in discharge between the two measurement sites was compared with the indirect groundwater discharge analysis to identify if larger gains were present in the same regions of the basin that were established to have higher indirect groundwater discharge to Lake Huron. The chloride and nitrate-nitrite concentrations from the stream samples were compared with the concentrations from the groundwater wells in the WaterChem analysis that were in the watershed upstream from the river sample to understand if the concentrations in the river reflect the groundwater concentrations in the watershed.
Groundwater Quantity and Quality Contributions to Lake Huron
The Lake Huron Basin was categorized into hydrogeologic zones, which were then used to create a water budget and to better characterize the water quality with respect to nitrate and chloride. This section of the report explains the distribution of the hydrogeologic zones across the basin, shares the estimated indirect and direct groundwater discharge to the lake from the water-budget calculations, and explains how nitrate as N and chloride groundwater concentrations vary across the basin.
Hydrogeologic Zones
A map of texture-based estimates of glacial deposit transmissivity (Bayless and others, 2017) was used to classify the hydrogeologic zones into areas of high (greater than 2,000 ft2/d), medium (1,000 to 2,000 ft2/d), and low (less than 1,000 ft2/d) transmissivities. The average glacial aquifer transmissivity for the hydrogeologic zones across the Lake Huron Basin ranged from 241 to 3,701 ft2/d. High and medium transmissivity hydrogeologic zones dominated the northern part of the study area (fig. 5). Low glacial transmissivity hydrogeologic zones were located along the coastline of the Saginaw Bay and the Thumb of Michigan, and transmissivity of the glacial deposits generally increased as the hydrogeologic zones moved inland (fig. 5).
The bedrock geology was used to classify the HUC–8 zones into eight different hydrogeologic zones, which are grouped by their dominant lithologies: limestone, shale, and sandstone. The dominant bedrock type of the northern and Lower Peninsula was limestone, leading to HTL and MTL zones (fig. 5). Just to the south of the limestone was predominantly shale, where zones were classified into HTSh and MTSh. Finally, sandstone was the predominant bedrock type in the Saginaw lowlands and the Thumb of the Lower Peninsula (fig. 5). Zones along the Saginaw Bay coastline were classified as LTSa, whereas zones inland were MTSa and HTSa. Surrounding the sandstone were more shale zones of HTSh and LTSh. All hydrogeologic zone types had more than one HUC–8 classified into each respective zone except for LTSh located along the eastern coastline of the Thumb (fig. 5).
Water Budget
A water budget was calculated for each of the hydrogeologic zones, with precipitation as the only input to the zone and ET, indirect groundwater discharge via base flow, direct groundwater discharge through the Lake Huron shoreline, and runoff as the outputs. Multiple datasets were used for the ET, indirect groundwater discharge, and runoff terms to better understand the uncertainty. The goals of the water-budget analysis were to determine the total flux of groundwater to Lake Huron and to better understand the spatial distribution of groundwater delivery to the lake.
Variation of Water Budget Components with Multiple Datasets
The ET did not vary widely across the different datasets used in this analysis or across the basin. The datasets used to calculate the ET for the water budget were Reitz and others (2017a, 2017b) and Wolock and McCabe (2018). Overall, the dataset that produced the highest average ET was Reitz and others (2017b), but the average of all the datasets was within 0.3 inch per year (in/yr) of one another. The average standard deviation across the hydrogeologic zones was 1.2 in/yr (fig. 7). Zone LTSa2 showed the most variation in ET and had an average of 21.4 plus or minus (±) 2.3 in/yr, whereas zone MTL1 had the least variation across the ET datasets with an average ET of 21.7±0.3 in/yr (fig. 7). The average ET across the hydrogeologic zones was 22.4 in/yr and ranged from 21.4 in/yr in zones LTSh1, HTL1, and LTSa2 to 24.1 in/yr in MTSa1 (fig. 7).
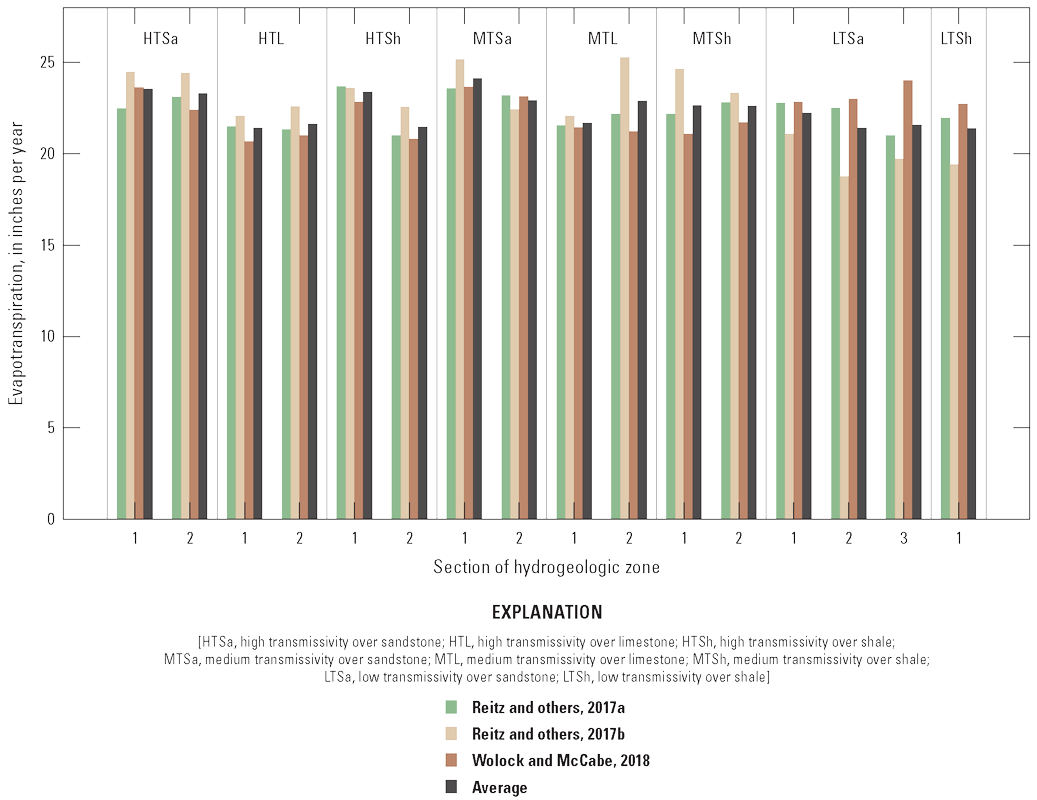
Bar chart of the results of the evapotranspiration analysis, in inches per year, for each hydrogeologic zone in the Lake Huron Basin, grouped by zone type with higher transmissivity zones to the left and lower transmissivity zones to the right.
The indirect groundwater discharge to Lake Huron varied widely across the datasets used to calculate this component and the hydrogeologic zones. The datasets used to estimate indirect groundwater discharge were USGS streamgages from NWIS (USGS, 2024b), Aichele (2005), Trost (2018), and Zell and Sanford (2020). Five of the zones did not have USGS streamgages (fig. 6); therefore, the other three datasets were used to calculate the base flow for those zones. The NWIS base-flow separation produced the largest and most variable indirect groundwater discharge estimates with an average of 8.3±2.9 in/yr across the hydrogeologic zones (fig. 8). The smallest and least variable indirect groundwater discharge estimates were from Trost (2018) and showed an average of 6.6±1.3 in/yr across the basin (fig. 8). The average standard deviation in indirect groundwater discharge across the hydrogeologic zones was 1.4 in/yr. Zones LTSh1 and LTSa2 had the smallest average indirect groundwater discharge contributions of 5.0±2.3 in/yr and 5.0±0.4 in/yr, respectively (fig. 8). The largest indirect groundwater discharge estimate was 11.4±2.8 in/yr in HTL2 (fig. 8).
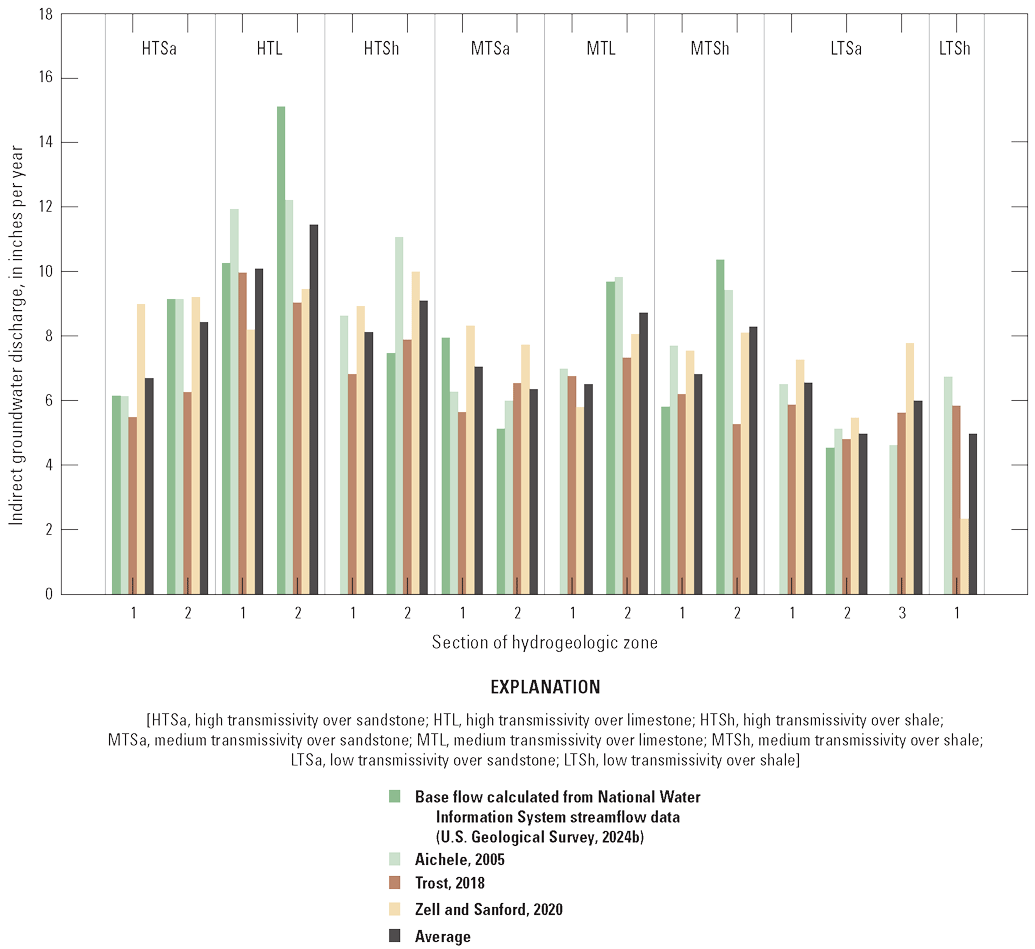
Bar chart of the results of the indirect groundwater discharge analysis for each hydrogeologic zone in the Lake Huron Basin, grouped by zone type with higher transmissivity zones to the left and lower transmissivity zones to the right.
The runoff estimates, calculated using USGS streamgages (USGS, 2024b) and Reitz and others (2017a), indicated large differences between the two datasets. Similar to the indirect groundwater discharge calculations, five hydrogeologic zones did not have runoff estimates from streamgages because no streamgage dataset was available for those zones (fig. 6). In 7 of the 11 hydrogeologic zones with two datasets to estimate runoff, the runoff calculated from NWIS streamgage data was higher than Reitz and others (2017a) (fig. 9). The average absolute difference between the two datasets was 0.94 in/yr. The zone with the lowest difference between the two datasets was LTSa2, whereas the zones with the greatest difference were in MTSh1 and HTL2 (fig. 9). Overall, the hydrogeologic zone with the greatest runoff was LTSa3 with a runoff of 5.7 in/yr, and the zone with the lowest runoff was HTSh2 with an average of 1.6±1 in/yr.
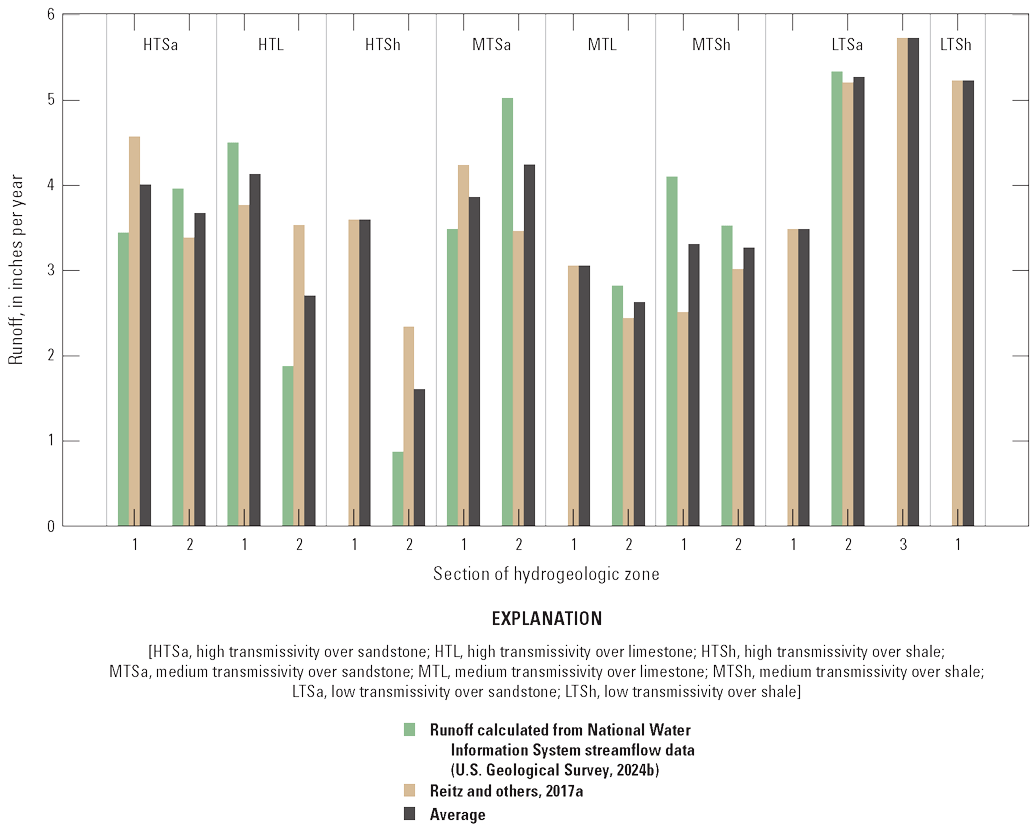
Bar chart of the runoff analysis for each hydrogeologic zone in the Lake Huron Basin, grouped by zone type with higher transmissivity zones to the left and lower transmissivity zones to the right.
Contributions of Each Water Budget Component
Precipitation, as determined from the PRISM dataset (PRISM and Northwest Alliance for Computational Science & Engineering, 2022), generally decreased from west to east across the basin. Precipitation was lower in the northeastern part of the basin in zones MTL1 and 2 and MTSh1. The average precipitation across the hydrogeologic zones ranged from 30.7 in/yr in MTSh1 to 34.8 in/yr in HTSh1 (fig. 10).
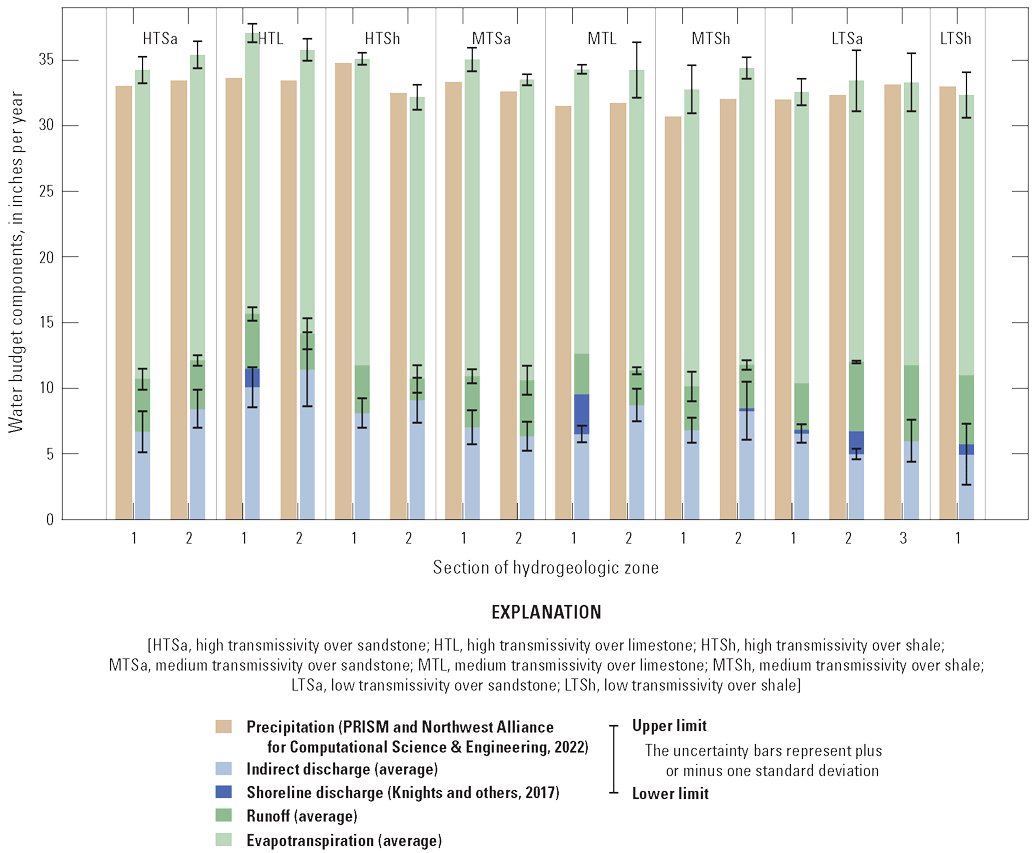
Bar chart of water-budget results for each hydrogeologic zone in the Lake Huron Basin, grouped by zone type with higher transmissivity zones to the left and lower transmissivity zones to the right.
ET was the largest output term in the water budget for each zone and, on average, constituted 66 percent of the total outputs (fig. 10). The average ET across the hydrogeologic zones was 22.4 in/yr. Overall, the ET did not vary widely across the basin.
Indirect groundwater discharge to Lake Huron through base flow was the second largest output in the water budget across the zones and was at least two times greater than the direct shoreline discharge in each zone (fig. 10). The average indirect groundwater discharge to Lake Huron across the hydrogeologic zones was 7.5 in/yr. In general, the indirect groundwater discharge to Lake Huron via base flow increased in hydrogeologic zones as transmissivity of the glacial deposits increased (figs. 10 and 11). Indirect groundwater discharge constituted, on average, 25.6 percent of the total outputs across zones with high transmissivity, 21.4 percent across zones with medium transmissivity, and 17.1 percent across zones with low transmissivity (fig. 11).
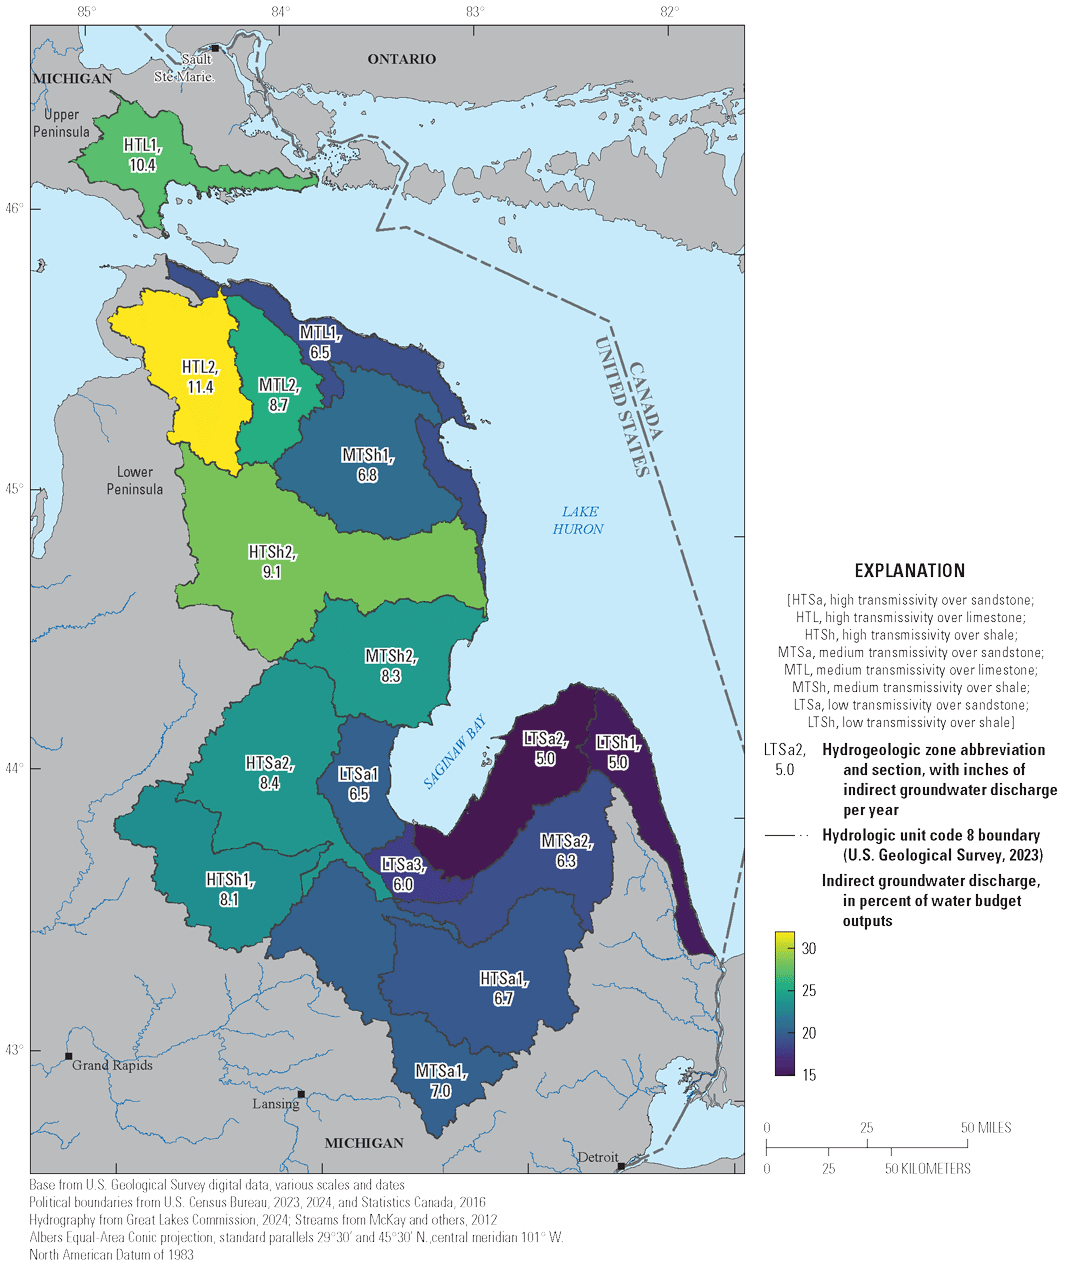
Map of indirect groundwater discharge to Lake Huron for each hydrogeologic zone.
Runoff was the third largest water-budget component and showed the opposite trend of indirect groundwater discharge with respect to transmissivity (fig. 10). Hydrogeologic zones with low transmissivity had the highest runoff, and high transmissivity hydrogeologic zones had lower runoff. The average runoff across the hydrogeologic zones was 3.7 in/yr.
The smallest component of the water budget was direct shoreline discharge (fig. 10). Only eight of the water-budget hydrogeologic zones had a shoreline discharge component (fig. 12). LTSa3 has a small segment of shoreline along the Saginaw Bay, but no shoreline discharge was calculated because the shoreline reaches (from Knights and others (2017)) overlapped with the adjacent hydrogeologic zones, so the shoreline segments were assigned to those adjacent zones. Across the eight zones with shoreline discharge, the average calculated direct shoreline discharge to Lake Huron was 2.7 percent of the water-budget outputs (fig. 12). The largest contribution of direct shoreline discharge to Lake Huron was 3 in/yr in zone MTL1 (fig. 12). The total volume of shoreline discharge in each zone was directly correlated with the amount of shoreline in the zone; the three hydrogeologic zones with the most shoreline discharge (MTL1, LTSa2, and HTL1) had the greatest shoreline discharge per length of shoreline (inches per miles).
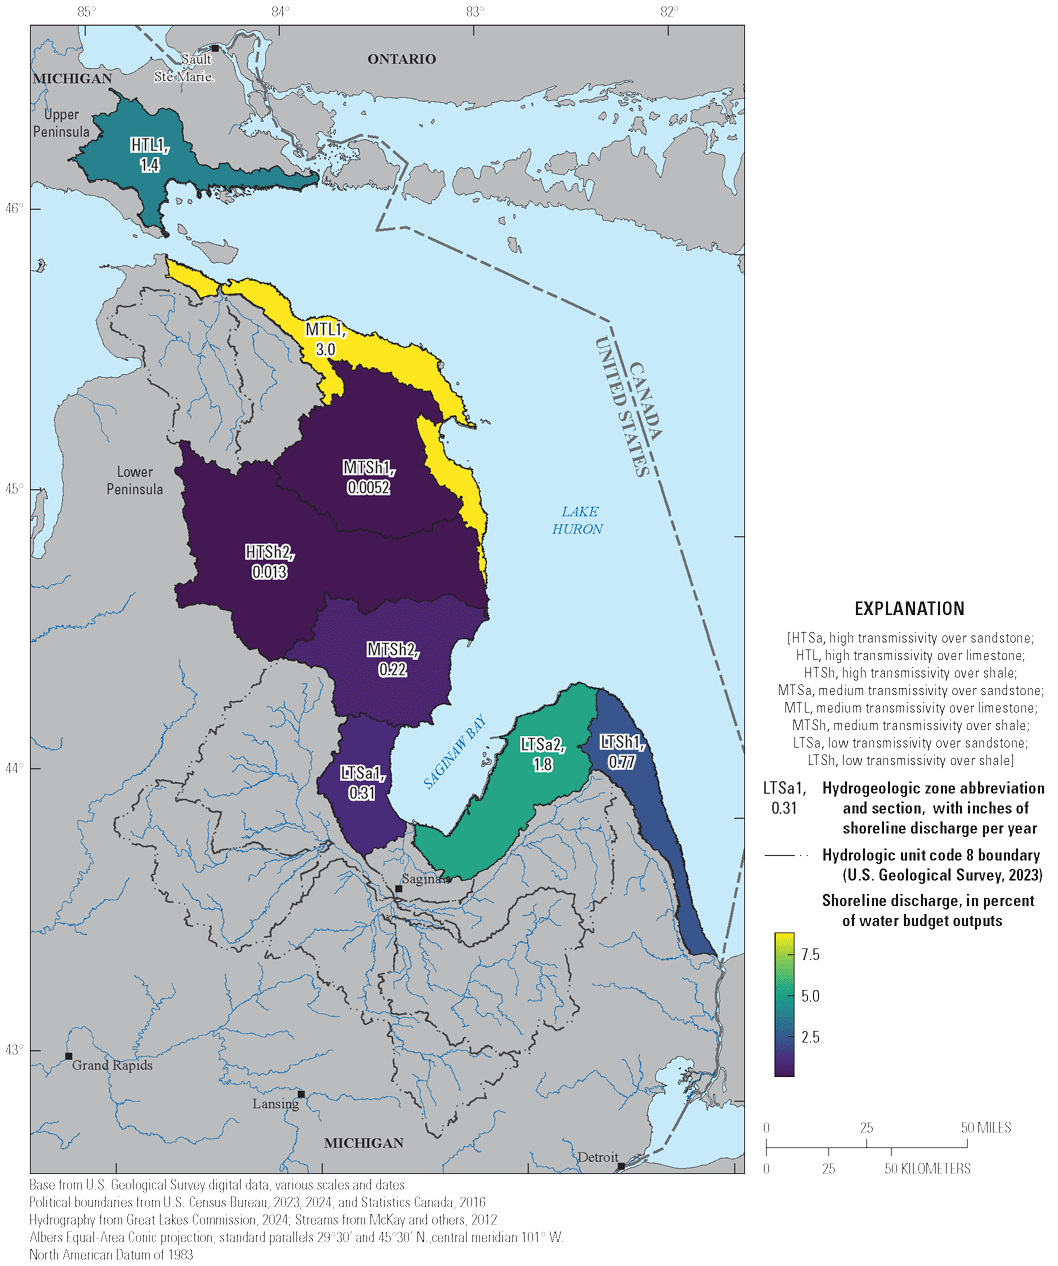
Map of shoreline discharge (direct groundwater discharge to Lake Huron) for each hydrogeologic zone in the Lake Huron Basin.
Wells Within the Bedrock and Glacial Aquifers
Across the entire basin, more wells were located in the glacial aquifer than in the bedrock aquifers; however, not all hydrogeologic zones followed this same trend. The entire Lake Huron Basin showed about a 2:1 ratio of glacial to bedrock wells, with 67.9 percent of wells being constructed in glacial deposits and 32.1 percent in bedrock (table 1). Six of the hydrogeologic zones did not follow the basinwide trend and instead had close to or at least a 2:1 ratio of bedrock wells to glacial wells (fig. 13). Only MTL1 had about an even split of bedrock to glacial wells (fig. 13). Only a fraction of the wells across the study area had samples of nitrate and chloride (table 1).
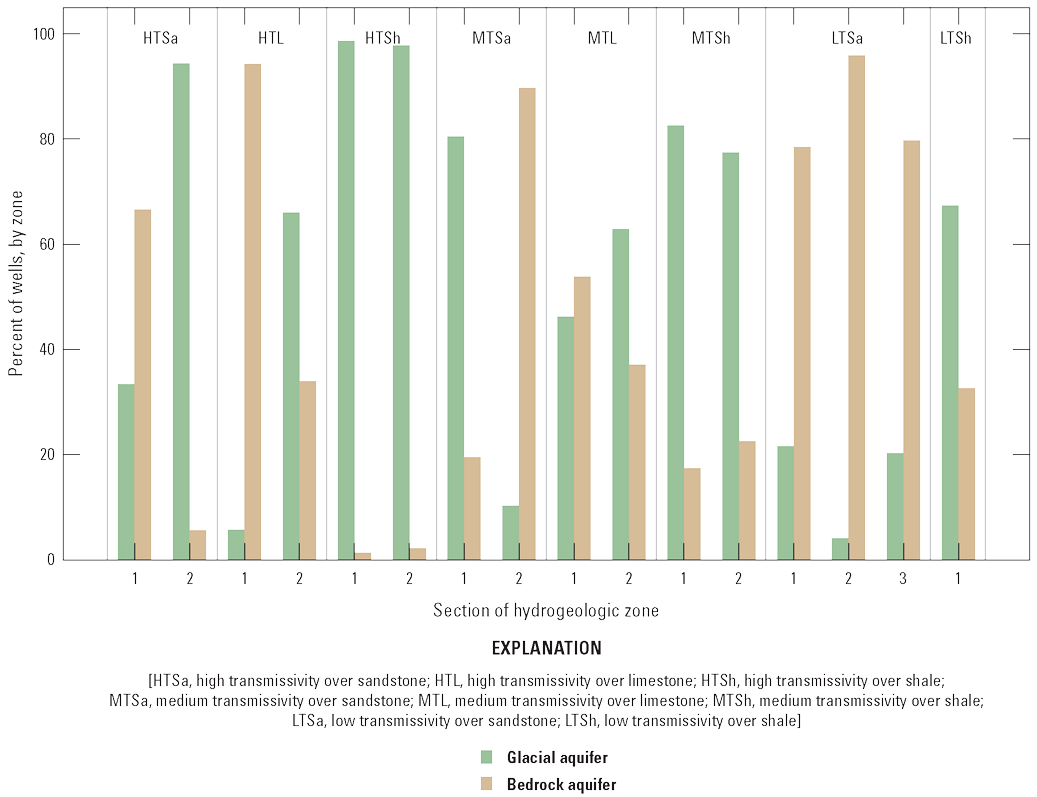
Bar chart displaying the percent of wells located in the glacial and bedrock aquifers for each hydrogeologic zone across the Lake Huron Basin.
Hydrogeologic zones within the Saginaw Bay region and the Thumb tend to have higher percentages of wells in the bedrock. Hydrogeologic zones having predominantly shale bedrock, independent of the glacial transmissivity, had at least 67 percent of the total wells in that zone finished in glacial deposits (fig. 13; table 1). Zones that contained less coastline and more land towards the western part of the basin had a higher percentage of glacial wells than bedrock wells (figs. 13 and 5), which followed the trend of the thickness of the glacial deposits increasing moving inland (fig. 3).
Table 1.
Summary of the distribution of wells from the Wellogic database (Michigan Department of the Environment, Great Lakes, and Energy, 2024c) and wells that contain nitrate and chloride samples (Michigan Department of the Environment, Great Lakes, and Energy, 2024b) in the glacial and bedrock aquifers.[NA, not applicable]
Water Quality
Chloride
The spatial analysis of chloride data from WaterChem used the most recent sample from each of the wells in the dataset. Of the 2,970 well locations with chloride data, 1,928 (65 percent) of the wells were in the glacial deposits and 1,042 (35 percent) were from the bedrock aquifers (table 1). More of the most recent samples from bedrock wells had concentrations greater than 250 mg/L than samples from wells in the glacial deposits. One hundred (10 percent) wells in the bedrock aquifers had chloride concentrations greater than the 250-mg/L EPA drinking water recommendation (fig. 14; table 2). Wells in eleven hydrogeologic zones had concentrations higher than 250 mg/L in the most recent chloride sample. The hydrogeologic zones with the highest percentage of high concentration wells in the bedrock aquifer were HTSa1 (38 percent), HTSa2 (14 percent), and LTSa2 (11 percent) (fig. 15; table 2). Seventy-three (3.8 percent) wells in the glacial deposits had chloride concentrations greater than 250 mg/L in their most recent sample. Samples with concentrations greater than 250 mg/L were present in 10 hydrogeologic zones in the glacial aquifer (fig. 14; table 2). The zones with the greatest percentage of high concentration wells in the glacial aquifer were in HTSa2 (37 percent) and HTSh1 (27 percent).
Table 2.
Summary of groundwater samples for chloride (Michigan Department of the Environment, Great Lakes, and Energy, 2024b, 2024c) across all hydrogeologic zones and the corresponding sections in the glacial and bedrock aquifers.[mg/L, milligram per liter; NA, not applicable]
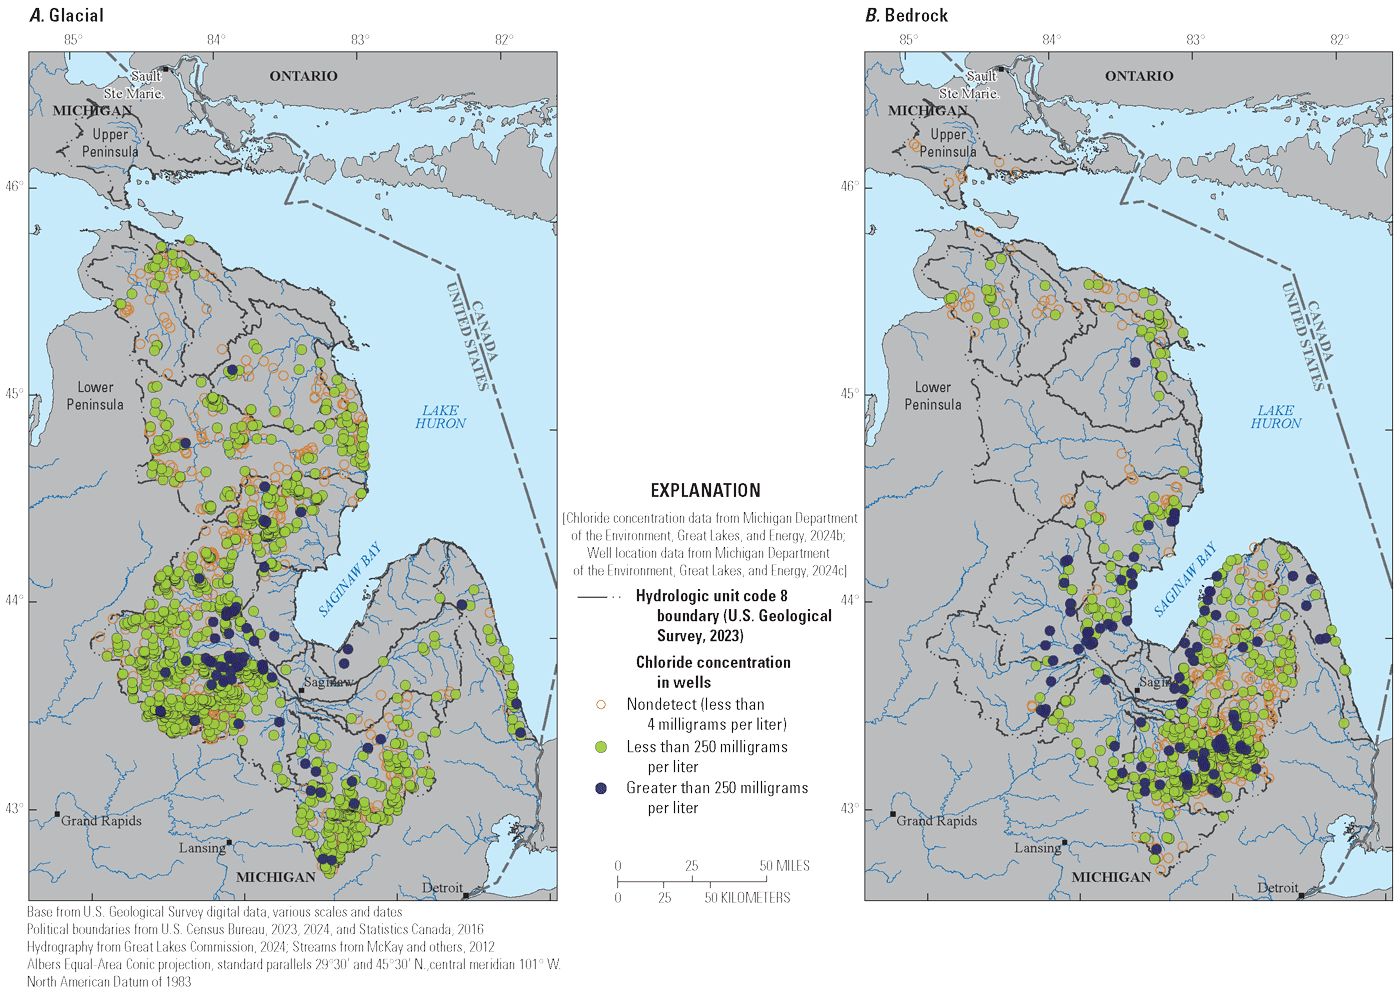
Maps of groundwater chloride concentrations sampled from drinking water wells across the Lake Huron Basin. A, Glacial deposit wells. B, Bedrock wells.
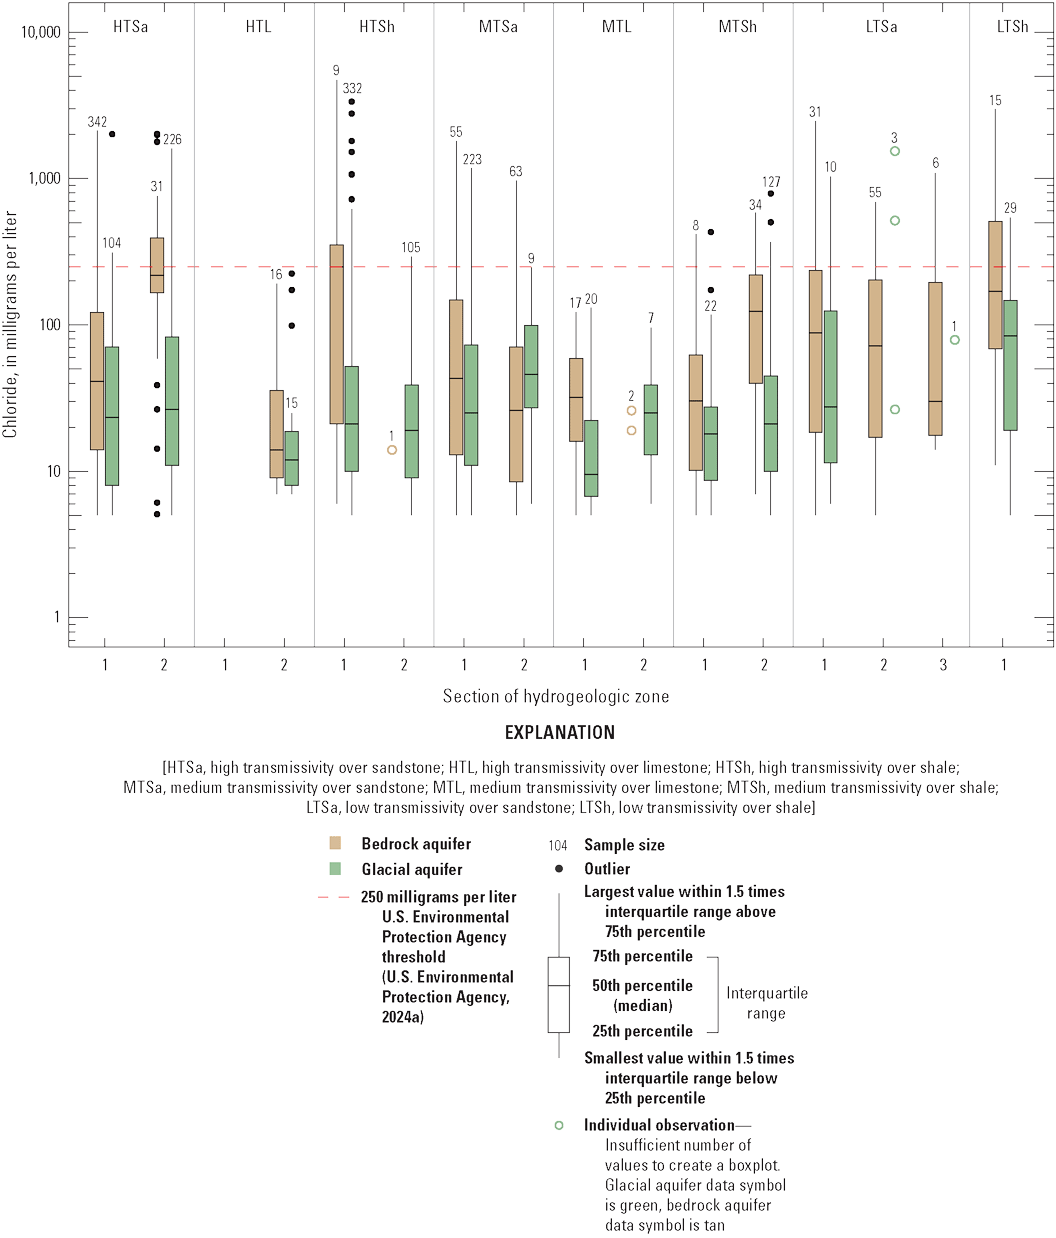
Boxplots of groundwater chloride concentrations above the detection limit (4 milligrams per liter) sampled from glacial and bedrock wells for each hydrogeologic zone in the Lake Huron Basin (n=1,918).
Nitrate
Of the 2,984 well locations with nitrate data, 1,949 (65 percent) of the wells were in the glacial deposits and 1,035 (35 percent) were from the bedrock aquifers (table 1). However, most of the samples from the glacial deposits and the bedrock were below method detection levels (fig. 16; table 3). More wells in the glacial deposits than the bedrock had samples with concentrations above method detection levels (fig. 16). Only 8 wells in the glacial aquifer and 3 wells in the bedrock aquifers had the concentration of the most recent sample from the wells be above the 10-mg/L maximum contaminant level (fig. 16; table 3).
Only 13 percent of wells in the glacial deposits had samples with a nitrate concentration above the method detection level (table 3). The greatest concentration detected was 21.3 mg/L (fig. 17). The hydrogeologic zones with samples from the glacial deposits containing nitrate concentrations exceeding the 10-mg/L as N drinking water standard were HTSh1, HTSh2, and MTSh2 (fig. 17).
Bedrock samples had even fewer detectable concentrations of nitrate than glacial samples, with only 3 percent of wells containing nitrate concentrations above method detection levels. Furthermore, 3 bedrock wells had samples greater than the EPA drinking water standard (fig. 16; table 3), with the highest result being 55.4 mg/L. The zones with bedrock detections exceeding the MCL were MTSh2, MTSa2, and LTSa2 (fig. 17).
Table 3.
Summary of groundwater samples for nitrate (Michigan Department of the Environment, Great Lakes, and Energy, 2024b, 2024c) across all hydrogeologic zones and the corresponding sections in the glacial and bedrock aquifers.[mg/L, milligram per liter; NA, not applicable]
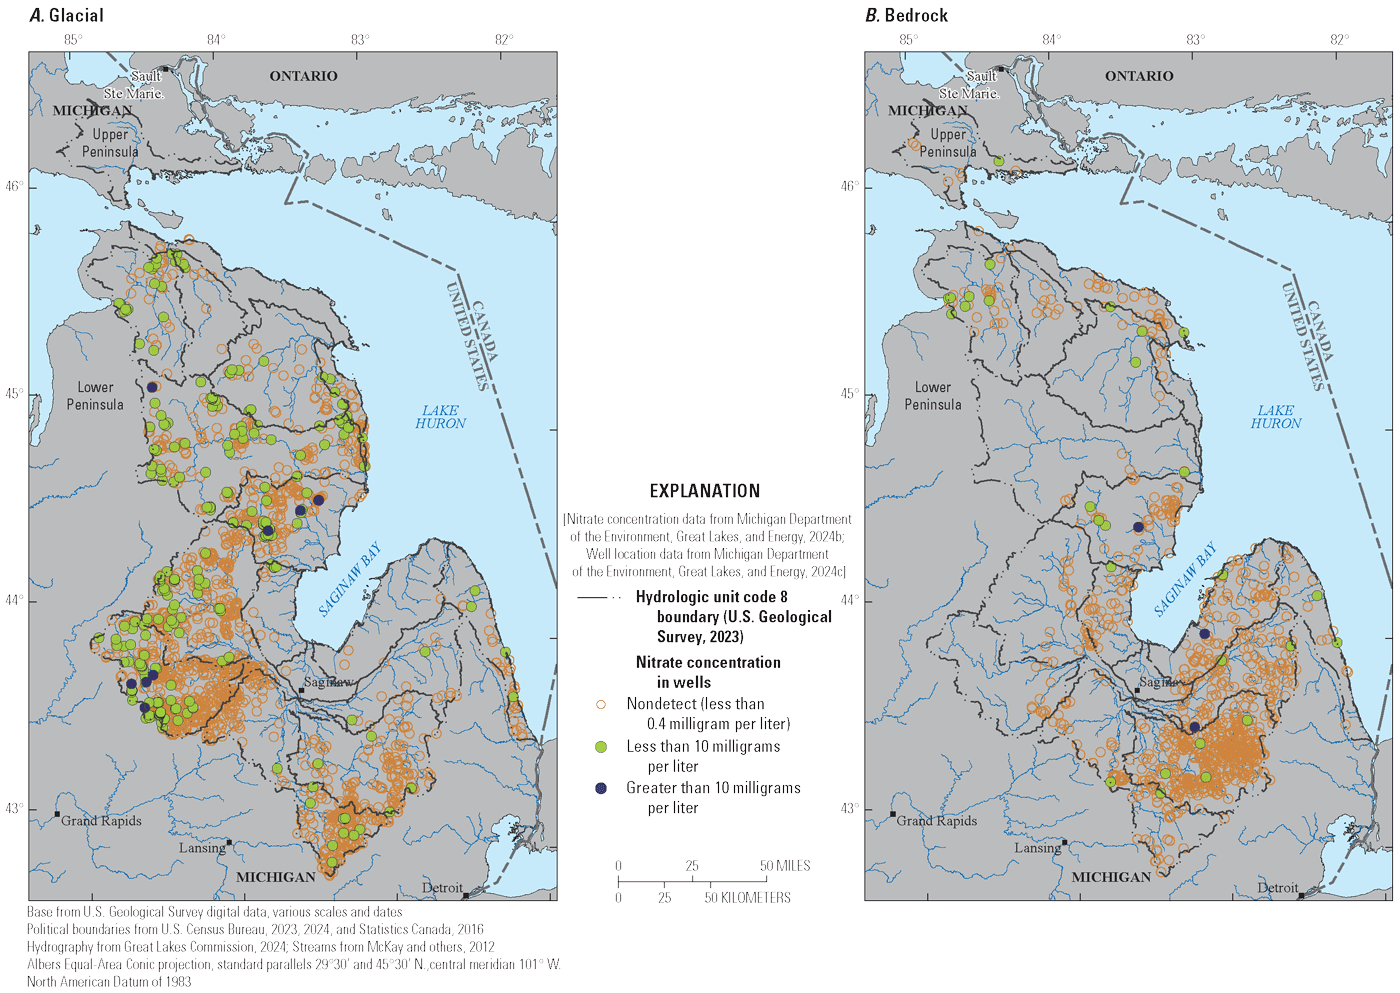
Maps of groundwater nitrate concentrations sampled from drinking water wells across the Lake Huron Basin. A, Glacial sediment wells. B, Bedrock wells.
Boxplots of groundwater nitrate as N concentrations above the detection limit (0.4 milligram per liter) sampled from bedrock and glacial wells for each hydrogeologic zone in the Lake Huron Basin (n=279).
Field Work
Initial results from the field data collection campaign indicated some expected differences in groundwater discharge based on the geologic zone in which the field sites were located. Distance between upstream and downstream sites ranged from approximately 1.11 river miles to 8.71 river miles, with an average of 3.64 river miles. Five rivers had increasing discharge amounts between the upstream and downstream sites (table 4). The South Branch Au Sable River discharge increased by 7.9 cubic feet per second (ft3/s; 13.1 percent of total discharge), the Sturgeon River discharge increased by 22 ft3/s (11.8 percent of total discharge), the East Branch Maple River discharge increased by 1.01 ft3/s (83.5 percent of total discharge), the Pigeon River discharge increased by 2 ft3/s (2.3 percent of total discharge), and the South Branch Flint River discharge increased by 2.4 ft3/s (3.8 percent of total discharge). These sites were located in high transmissivity zones and were distributed across all three bedrock rock types (limestone, shale, and sandstone). The distance between measurement sites at these rivers ranged from the shortest distance in the study (South Branch Au Sable River, 1.11 river miles) to the longest (Sturgeon River, 8.71 river miles). The remaining sites were located in zones with a variety of transmissivities and bedrock types and had either no changes to discharge amount or slight decreases.
Table 4.
Discharge and gain/loss measurements collected from streams across the Lake Huron Basin.[Streamflow data from U.S. Geological Survey, 2024b; dates shown in month/day/year format; USGS, U.S. Geological Survey; ft3/s, cubic foot per second]
All water-quality samples met the 250-mg/L chloride water-quality recommendation (EPA, 2024a) and the 10-mg/L nitrate-nitrite as N water-quality standard set by the EPA (EPA, 2024b). Chloride concentrations ranged from 4.4 to 80 mg/L (table 5). Concentrations were higher in the South Branch Flint River and Flint River sites (table 5; fig. 1), which are in the same hydrogeologic zones with multiple groundwater chloride samples above the 250-mg/L standard (fig. 14). Nitrate-nitrite concentrations ranged from less than 0.013 to 2.34 mg/L as N, and concentrations above 1 mg/L were measured in the Pine and Flint Rivers (table 5).
Table 5.
Concentrations of chloride and nitrate-nitrite as nitrogen samples from streams across the Lake Huron Basin.[Water-quality data from U.S. Geological Survey, 2024b; mg/L, milligram per liter]
Discussion
This study sought to quantify the groundwater contributions to Lake Huron and identify areas of potential groundwater-quality concern that could have implications for the lake, as outlined in the CSMI 2022 priorities (ECCC and EPA, 2022). The Lake Huron Basin was divided into subbasins by HUC–8, and each zone was categorized into a hydrogeologic zone classification. Water budget and water quality were then analyzed for each hydrogeologic zone. This section discusses the interpretation of the findings from these analyses.
Discussion of Hydrogeologic Zones
The hydrogeologic zones were developed to create a way to spatially visualize the analytical results and to contextualize the results of the regional geology. By incorporating bedrock type and surficial geologic differences (transmissivity), we were able to examine the relative influence each of these geologic components has on the groundwater inputs to Lake Huron and the groundwater quality. The classification of the hydrogeologic zones showed that the most northern part of the basin has generally glacial deposits of medium to high transmissivity and is underlain by limestone or shale (fig. 5). The zones in the southern part of the basin had a wider range in transmissivities, with low transmissivity glacial deposits located along the coastline of Saginaw Bay (fig. 5). These southern zones were generally underlain by sandstone, which includes the Marshall Sandstone and the Saginaw Formation. Generally, the surficial geology had more influence on how much groundwater discharged to Lake Huron streams than the bedrock geology. The bedrock geology appeared to have a strong influence on the groundwater quality with respect to chloride, whereas the geology did not appear to be as influential with nitrate, but this is largely due to the lack of nitrate in groundwater across the basin. The hydrogeologic zones are useful for capturing the regional trends across the Lake Huron Basin, but they cannot show the more local variations that are likely within each hydrogeologic zone.
Comparison of Groundwater Discharge to Lake Huron with Other Studies
One of the stated CSMI 2022 list of priorities was to quantify groundwater discharge to Lake Huron (ECCC and EPA, 2022). A water budget was calculated for each hydrogeologic zone in the basin to estimate the indirect and direct groundwater contribution to Lake Huron as well as to provide information regarding the spatial variability of groundwater contribution to Lake Huron.
Our analysis assumed that the indirect groundwater discharge was equal to base flow, and we calculated the indirect groundwater discharge across the hydrogeologic zones as a discharge per unit area. Estimated base-flow values can vary depending on the method used for base-flow separation or to predict base flow (Mao and others, 2024). The indirect groundwater discharge component of the water budget was calculated as an average of four different datasets and helps to indicate the range of the potential indirect groundwater discharge in each of the zones. Although the average value among the datasets is the same as was used in the water budget calculation, there was an average standard deviation of 1.4 in/yr. The range of indirect groundwater discharge can provide more insight into the uncertainty around this component of the water budget.
Together, direct and indirect groundwater discharge to Lake Huron accounted for 68 percent of all the land-based water sources to the lake, but the water budget analysis revealed that the indirect groundwater discharge to Lake Huron is much larger than direct shoreline discharge. Across the basin, indirect groundwater discharge delivered 1.9 cubic miles of water annually and direct shoreline discharge delivered 0.09 cubic miles annually. Similarly, indirect groundwater discharge was larger than the direct shoreline discharge across all hydrogeologic zones—even those with long shorelines that deliver larger amounts of shoreline discharge, such as MTL–1 and LTSa–2 (fig. 12). Hoaglund and others (2002) determined similar results showing that groundwater primarily discharges to Lake Huron by way of base flow, as opposed to directly discharging to the lake through shoreline. Furthermore, groundwater constituted an average of 66 ± 10 percent of the total streamflow, which was consistent with the findings from Neff and others (2005) that indicated groundwater discharge to streams across the Great Lakes Basin was between 40 and 75 percent of the total streamflow. The average direct shoreline discharge for hydrogeologic zones with shoreline discharge as a percent of the outputs was 2.7 percent but ranged from 0.01 to 8.8 percent (fig. 12). Our results, which used data from the Knights and others (2017) model, were slightly greater than Xu and others (2021), who determined that shoreline discharge was 1.1 percent of the supply to Lake Huron. Although the direct shoreline discharge was small compared to other components of the water budget, this form of discharge can have a large effect on water quality relative to the total volume of water contributed given its direct contact with the lake (Kornelsen and Coulibaly, 2014; Knights and others, 2017; Baer and others, 2019).
Geology has been known to have a strong influence on groundwater discharge to streams (Tague and Grant, 2004; Neff and others, 2005). The indirect groundwater discharge calculated in this study was positively correlated with the average transmissivity of the hydrogeologic zone. Furthermore, this study indicates that indirect groundwater discharge varied spatially across the basin, with higher groundwater discharge to streams located in high transmissivity zones in the northern or inland parts of the basin (fig. 11). Neff and others (2005) also determined that groundwater discharge to streams is higher in the northern or inland parts of the basin. The northern and inland parts of the watershed consist of thick, coarse textured glacial deposits (fig. 3; Soller and Garrity, 2018), which contribute to these regions being characterized as high and medium transmissivity zones.
Assumptions and Limitations of the Water Budget Approach
The water budget for this analysis assumed that the system was at steady state, where the inputs would equal the outputs, and the storage was not changing. However, only six of the hydrogeologic zones had inputs within 1 inch of the outputs (fig. 10). All zones with a difference greater than 1 in/yr had outputs greater than the inputs. The zones HTL1 and MTL1 had the greatest difference, with the outputs being 3.4 and 2.8 in/yr greater than the inputs, respectively. Compared to datasets used to calculate indirect groundwater discharge for HTL2, the hydrograph separation of USGS streamgages produced appreciably higher values, bringing up the average value (figs. 8). On a broader scale, error in the analysis may be present owing to the lack of temporal alignment between the input datasets. The input datasets were tested to ensure there was no trend through time and that the temporal ranges of the datasets shared some overlap; nonetheless, additional uncertainty is present when using data with varying time periods. Finally, the lack of alignment with inputs and outputs may also be due to inflows or outflows to the watersheds not accounted for in the equation, potential groundwater transfers owing to groundwater boundaries not aligning with the HUC–8 boundaries, ET being overestimated in the water-budget approaches (fig. 7; Reitz and others, 2017a, b; Wolock and McCabe, 2018), and groundwater pumping not being included in the output terms.
Discussion of Distribution of Wells in Glacial and Bedrock Aquifers
Examination of the distribution of groundwater wells from the Wellogic dataset (MI–EGLE, 2024c) within the bedrock and glacial sediments provides context for the overall use of the different aquifers across the basin and was used to aid the WaterChem analysis. Most of the wells in the Wellogic dataset were domestic wells. Zones HTSa1, MTSa1, and HTSa2 had the most wells (table 1), indicating that a large population may rely on domestic groundwater wells in these zones. Overall, more wells were present in the southern half of the basin, where there is a greater population density. More wells were present in the bedrock compared to the glacial deposits in the Saginaw Bay and Thumb regions of Michigan. The percentage of wells in the glacial deposits tended to increase with increasing thickness of glacial deposits (figs. 3 and 13). The number of wells with water-quality samples was much smaller than the overall number of wells from the Wellogic dataset (table 1), and more samples were available in zones with more wells.
Evaluation of Chloride Concentrations
This analysis of groundwater chloride data sought to contributing to addressing the CSMI 2022 priority of evaluating the effects of groundwater quality on physical, biological, and chemical processes in Lake Huron (ECCC and EPA, 2022). Although this work did not address how the groundwater quality affects the variety of processes in Lake Huron, it did identify areas in the Lake Huron Basin with potential groundwater-quality concern. In tandem with the water-budget analysis, which shows the regions of the basin with more groundwater discharge to Lake Huron, this work can help identify where contaminants in the inland part of the basin may be transported to the lake.
Overall, a higher percentage of bedrock wells when compared to the glacial wells had chloride concentrations greater than 250 mg/L even though more samples were collected in the glacial deposits (fig. 14). Bedrock wells in hydrogeologic zones within the Saginaw lowlands and Thumb regions of the basin contained a higher percentage of chloride samples above the 250-mg/L drinking water recommendation when compared to the rest of the basin (figs. 5 and 14). Zones HTSa1, HTSa2, and LTSa2 are all located in the Saginaw lowlands and Thumb region (fig. 5) and contained 63 percent of the total samples greater than the 250-mg/L threshold. The Saginaw Lowland and Thumb regions have been documented to contain high chloride levels from upwelling brines in the deep bedrock (Kolak and others, 1999; Long and others, 2015; Curtis and others, 2018). Furthermore, these hydrogeologic zones have sandstone as the primary bedrock type and overlie the Saginaw and Marshall aquifers, both of which can contain saline water throughout areas of the Saginaw lowlands (Westjohn and Weaver, 1996; Apple and Reeves, 2007). Zone HTSa1 also contains a large area of urban land use/cover (fig. 18; USGS, 2024a), which is prone to high loads of road salt contamination (fig. 19). The bedrock in zone HTSa1 is covered by thinner glacial deposits (fig. 3) with a high transmissivity (fig. 4), meaning that road salt may rapidly move through the glacial deposits and contaminate the bedrock. Only one bedrock well in the northern part of the basin contains elevated levels of chloride, and this region is not a documented area of upwelling from deep brines. Leaky oil and gas wells can also be a source of high concentrations of chloride (Curtis and others, 2018) and may be related to localized high chloride concentrations given their presence across the northern Lower Peninsula (MI–EGLE, 2024a).
Map of the land use and land cover across the Lake Huron Basin with the hydrologic unit code 8 overlain. Land use and land cover data from the National Land Cover Database (U.S. Geological Survey, 2024a).
Map of the 2019 road salt application (Bock and others, 2018) across the Lake Huron Basin overlain by the hydrogeologic zone boundaries.
Chloride concentrations exceeding 250 mg/L in the glacial deposits were predominantly observed in the southern portion of the study area. However, sampling density was greater in the southern part of the basin when compared to the northern half. Chloride contamination in wells in the glacial deposits likely originates from multiple sources, given that wells in the glacial deposits are susceptible to geogenic and anthropogenic stressors. A geogenic source of chloride in the glacial deposits may be from upwelling of brines for wells in the Saginaw lowlands (Kolak and others, 1999). Stanton and others (2017) determined that brackish water was present in many wells between 50 and 500 ft deep throughout the southern region of the Lake Huron Basin owing to evaporites in the bedrock. Given that the depth of wells in the glacial deposits with chloride samples ranges from 18 to 396 ft deep, glacial wells may also be facing contamination from deep bedrock brines. Glacial deposits are, additionally, prone to contamination from anthropogenic sources, such as road salt, septic systems, fertilizer application, and brines from mineral, oil, and gas wells (Kelly and others, 2012; Kornelsen and Coulibaly, 2014). For example, wells with high chloride concentrations in zone HTSh1 appear to be in agricultural areas just outside of an urban area (fig. 18). These wells are likely facing contamination mostly from road salt deicing on major roads near the urban area (fig. 19; Bock and others, 2018), but fertilizers, such as potassium chloride or manure, that are spread on row crops can contribute some amount of chloride contamination (Mullaney and others, 2009; Kelly and others, 2012). For example, in Illinois, manure contamination has led to elevated chloride concentrations of 57 mg/L (Panno and others, 2006), and potassium chloride application resulted in concentrations ranging from 10 to 37 mg/L (Kelly and others, 2012). Additionally, Michigan allows counties to spread brines on dirt roads for ice control in winter months and dust control in dry, summer months (Pasciolla, 2023). Therefore, it is likely that rural areas in zone HTSh1 may face contamination from this source as well.
Evaluation of Nitrate Concentrations
Overall, groundwater concentrations of nitrate as N were low in the WaterChem dataset (MI–EGLE, 2024b), with only 13 percent of wells in the glacial deposits and 3 percent of bedrock wells with concentrations above the detection limit (fig. 16). Additionally, only 0.4 percent and 0.3 percent of wells in the glacial deposits and bedrock, respectively, had concentrations above the MCL of 10 mg/L (fig. 17; table 3). The low number of wells with elevated levels of nitrate as N correlates with previous studies of nitrate concentrations in domestic and public supply wells in Michigan (Hamlin and others, 2022) and across the continental United States (Ransom and others, 2022), predicting groundwater nitrate concentrations of less than 1 mg/L for most of the Lake Huron Basin.
However, previous studies indicated high loadings of nitrogen in intensive agricultural regions like the Thumb and the Saginaw lowlands (fig. 18; Luscz and others, 2015; Hamlin and others, 2020; Zhan and others, 2024). The low concentrations in many of the wells may be better explained by the well depths than estimates of surficial nitrogen loads. The WaterChem dataset consists of primarily drinking water wells, which may be drilled deeper into the subsurface than potential nitrate contamination. Well depth is a strong predictor for nitrate presence, given that most nitrogen sources come from the land surface (MacLeod and others, 1995; Burrow and others, 2010; Wheeler and others, 2015; Uddameri and others, 2020; Ransom and others, 2022). Atmospheric deposition and anthropogenic inputs are the primary sources of nitrogen to the landscape (Luscz and others, 2015; Hamlin and others, 2020), meaning nitrate would likely be greater in surficial deposits than the deeper bedrock deposits (Zhan and others, 2024). Therefore, the deeper wells used in this study would be expected to have even lower concentrations than expected.
The most prolific contribution of nitrogen to the landscape across Michigan is through agricultural inputs of chemical fertilizers, manure, and nitrogen fixation in legumes (Luscz and others, 2015; Hamlin and others, 2020). The wells with detections above the 10-mg/L MCL were mainly present in agricultural regions of the watershed (figs. 16 and 18) and in regions that have previously been predicted to have higher nitrogen loads (Luscz and others, 2015). Higher nitrate concentrations were also present in zones with higher transmissivity (table 3). Given that nitrate inputs are largely at the land surface, a higher transmissivity allows for the nitrate to be transported through the groundwater system more quickly (Zhan and others, 2024).
Despite the glacial deposits having more wells with nitrate detections, nitrate was detected in the samples from bedrock wells. The presence of nitrate in the bedrock wells is likely due to the regional groundwater-flow system where groundwater recharges at the surface and flows downward to the bedrock (Hoaglund and others, 2002). The downward flow of water from the glacial deposits to the bedrock may be particularly relevant where glacial deposits are thin, making the bedrock aquifer more susceptible to contaminants introduced at the land surface (Borchardt and others, 2021). The three wells in the bedrock with concentrations exceeding 10 mg/L (fig. 16) are located in agricultural areas with thinner glacial deposits (fig. 3). However, understanding the migration of the nitrate from the surface to the bedrock is still challenging, given the three-dimensional flow of groundwater and the lack of hydrogeologic zones existing with a high prevalence of glacial and bedrock wells with nitrate samples (fig. 16).
Limitations of the Water Quality Assessment
Although the WaterChem dataset (MI–EGLE, 2024b) has a vast spatial coverage of the Lake Huron Basin, there were still locations in the study area that were not as well-represented in the dataset, especially in the northern part of the basin, which lacked a dense coverage of either bedrock or glacial wells (figs. 14 and 16). There were also few hydrogeologic zones that had many wells in the bedrock and in the glacial deposits (fig. 13; table 1), which posed a challenge for interpreting the pathway of high nitrate concentrations in bedrock wells. Furthermore, many of the wells lacked multiple samples, making it challenging to establish trends through time.
One potential limitation of this analysis was that the WaterChem dataset consists of samples from deeper drinking-water wells rather than shallow observation wells, which may make the data less representative of nitrate contamination across the basin or shallow groundwater systems that control localized flow paths to streams. In this study, the average well depth was 95 ft (ranging from 18 to 396 ft) in the glacial deposits and 210 ft (ranging from 30 to 540 ft) in the bedrock. Yang and others (2025) determined that most groundwater flow to streams across the basin occurs through groundwater that is less than 328 ft (100 meters) deep, but the study did not account for the heterogeneity and thick clay lenses found in the glacial deposits across the Lake Huron Basin (MI–EGLE, 2024c). The heterogeneity creates preferential flow paths and perched systems, which can affect the delivery of contaminants to streams. Given that nitrate is mainly from anthropogenic sources and atmospheric deposition (Luscz and others, 2015), and nitrate concentrations are correlated with well depth (MacLeod and others, 1995), this dataset may not fully represent shallow groundwater concentrations of nitrate. Fewer groundwater samples from the shallow system may be less concerning for the chloride concentrations, because a large quantity of chloride in the Saginaw lowlands, particularly, stems from deep brines (Long and others, 2015).
Field Data Interpretation
Broader interpretations of groundwater contribution to Lake Huron from the water-budget analysis were confirmed by the empirical data collected during the field campaign. Of the nine streams measured, the five streams showing increasing discharge attributed to groundwater were located in high transmissivity surficial materials. However, there was no correlation with latitude because these sites were located in southern and northern zones across the study area. The proximity to the lake shore also indicated no correlation with groundwater discharge to the streams in the field data, with neither the closest site to Lake Huron (Ocqueoc River; about 8.5 miles) or the farthest river (East Branch Au Sable River; about 68 miles) showing groundwater contributions to streamflow, with the furthest site showing slight loss of stream water between upstream and downstream sites.
The stream samples for water quality revealed that chloride and nitrate-nitrite as N concentrations in streams largely reflect the range of concentrations observed in the WaterChem dataset for the stream’s contributing area. Most, if not all of the water samples, were likely from the groundwater given that these samples were collected during base-flow drought conditions. Hydrogeologic zones with generally lower concentrations of chloride in wells also had lower concentrations in stream samples (table 5; fig. 15). The sites with slightly higher concentrations of chloride (greater than 50 mg/L) were the South Branch Flint River and Flint River (table 5). Both of these rivers are located within HTSa1, which has multiple wells with elevated chloride concentrations (fig. 14). The main branch of the Flint River had the highest chloride concentration of 80 mg/L. The main branch of the Flint River sampling location was near the outlet of the entire HUC–8 and reflects the chloride concentration in wells across the entire watershed. For HTSa1, the median and mean concentrations of chloride for wells with detectable chloride in the glacial deposits were 24 and 73 mg/L, respectively, and in the bedrock were 41 and 104 mg/L, respectively. The Flint River field site is also in proximity to a bedrock well with chloride concentrations above the EPA water-quality recommendation (EPA, 2024a). The proximity of the field site to wells with elevated concentrations illustrates that Flint River likely receives groundwater contributions from the bedrock and glacial deposits given that the concentration in the river is between the concentration values of the two aquifer settings.
The low concentrations of nitrate-nitrite detected in the stream samples reflects the generally low or below detection limit concentrations observed with the WaterChem dataset (MI-EGLE, 2024b). The Pine and Flint Rivers had the highest nitrate-nitrite concentrations, although these concentrations were still low (less than 2.5 mg/L; table 5). The Pine River had multiple glacial wells with detectable nitrate as N in proximity to the stream sampling location. Interestingly, nitrate as N was largely not detected in wells across the HTSa1 zone where the Flint River sampling location was located. However, nitrate as N contamination is possible given the large area of agricultural land within the upstream catchment of the sampling site (fig. 18). Overall, the concentrations of chloride and nitrate-nitrite in the stream samples reflect the groundwater concentrations in wells of the broader hydrogeologic zone.
Although the observable data collected in the field confirms some of the results from the water-budget and water-quality analyses, it must be recognized that point measurements of streamflow on one day in time can only be used to aid in interpretation of the water-budget results. The measurements were collected when this region was experiencing drought conditions, so any observable changes to streamflow can confidently be attributed to groundwater influence. However, to rely more heavily on these data for standalone interpretations, more intensive data collection efforts would need to be undertaken to measure more streams and during a much longer timeframe.
Synthesis of Quantity of Groundwater Discharge and Water Quality Effects to Lake Huron
Using the water-budget calculations and the analysis of the spatial distribution of nitrate as N and chloride groundwater concentrations can help inform future research in the basin. The indirect groundwater discharge component of the water budget quantifies groundwater discharge to streams across the whole basin and provides a mechanism for contaminants from the inland part of the basin that can be transported to the lake. Hydrogeologic zones in the northern and western parts of the Lake Huron Basin had higher transmissivity and contributed greater amounts of indirect groundwater discharge (fig. 11), making it possible for these areas to contribute greater loads of contaminants. The hydrogeologic zones in the northern part of the basin generally showed lower amounts of contamination; however, fewer samples were available.
The southern part of the basin, especially in the Saginaw lowlands, had a spread of wells with high concentrations of chloride (fig. 14). Although the hydrogeologic zones in the Saginaw lowlands had, on average, lower indirect groundwater discharge than the northern hydrogeologic zones (fig. 11), the streams in these zones outlet water to the Saginaw Bay, highlighting that this area of the lake may be vulnerable to chloride contamination. Additionally, the groundwater contributions to streams are likely from glacial deposits across the region unless the glacial deposits are thin. The wells in the glacial deposits across this region are subject to geogenic and anthropogenic chloride contamination, but the contribution of each source is not well constrained. Few groundwater models have occurred within the bounds of the Lake Huron watershed (Nielsen and Sterner, 2023), and given that most groundwater enters the lake by way of indirect discharge, a future groundwater model of the basin could be developed to track groundwater-flow paths to streams to better identify areas of the basin that are contributing to contamination of the lake.
Nitrate, generally, was not detected across the basin; however, the amount of agricultural lands in the basin (fig. 18) suggests that more nitrate than detected could be present. Previous work has identified high loading of nitrogen in the southern part of the basin (Luscz and others, 2015; Hamlin and others 2020), but this area also generally has a lower transmissivity (fig. 4), suggesting that nitrate may be slower to spread through the groundwater here. As a result, the basin could benefit from continued monitoring of nitrate and nested sampling at locations with known nitrogen inputs to better understand downward transport to the groundwater. Furthermore, the northern part of the basin was vastly under sampled compared to the southern area and could benefit from more extensive sampling, given nitrate as N was detected in more than 20 percent of the samples in zones HTL2, MTSh1, and HTSh2.
Summary
Lake Huron, like the four other Great Lakes, faces potential water quality challenges resulting from nutrients and chemicals applied to the landscape, then moving to the lake through groundwater and surface water pathways. However, the groundwater contributions of water and these potential contaminants to Lake Huron are understudied. The U.S. Geological Survey (USGS), as part of the Cooperative Science and Monitoring Initiative (CSMI), conducted this study to address some of the knowledge gaps around groundwater contributions to Lake Huron from Michigan, the only U.S. state bordering the lake. Specifically, this research sought to contribute to the CSMI 2022 goals of (1) quantifying groundwater contributions to Lake Huron and (2) understanding the effects of groundwater on biological, chemical, and physical processes on ecosystems. To achieve this, the study objectives were to (1) classify U.S. Lake Huron drainage basins using bedrock and glacial geologies, (2) estimate the amount of groundwater discharging to Lake Huron from indirect discharge through stream base flow and direct shoreline discharge within these geologic groups, (3) assess the risk of chloride and nitrate contaminants transported to Lake Huron by groundwater using existing water quality data, and (4) “ground truth” the analyses results utilizing empirical data collected for this study. The findings from these study objectives can aid resource managers in the Lake Huron Basin in understanding the potential role of groundwater for contaminant introduction to the lake.
The first step to addressing the CSMI goals was categorizing drainage basins at the hydrologic unit code 8 scale in the Lake Huron Basin into hydrogeologic zones based on bedrock geology and glacial deposit transmissivity. A water budget for each zone, which utilized existing data, was then calculated to understand indirect groundwater discharge through base flow and direct groundwater discharge through shoreline discharge to Lake Huron.
Our study indicates that groundwater is an important component of the water budget of Lake Huron. Indirect groundwater discharge through base flow in streams delivers an average of six times more water to Lake Huron than direct shoreline discharge. Indirect groundwater discharge from the Lake Huron Basin delivers an average of 7.5 inches per year (a total of 1.9 cubic miles annually) of water to the lake, with high transmissivity zones delivering an average of 1.7 and 3.3 inches more water than medium and low transmissivity zones, respectively. Together, direct and indirect groundwater discharge to Lake Huron accounted for 68 percent of all the land-based water sources to the lake.
Chloride and nitrate as N data from the Michigan Department of the Environment, Great Lakes, and Energy WaterChem database was processed and joined with Michigan Department of the Environment, Great Lakes, and Energy Wellogic well data to illustrate the distribution of chloride and nitrate concentrations across the glacial and bedrock aquifers. The most recent sample from the WaterChem dataset for each well was used to identify areas of current water-quality concern and to eliminate bias when discussing the spatial distribution. Chloride concentrations greater than the 250 milligrams per liter U.S. Environmental Protection Agency recommendation were more prevalent in the bedrock wells, where geogenic brines are upwelling from deep bedrock sources. Elevated concentrations of chloride in wells in the glacial deposits were also present, primarily in the Saginaw lowlands and Thumb of Michigan, and these wells face inputs from anthropogenic and geogenic sources. Nitrate as N, however, had more non-detections than samples above the detection method levels. For detected nitrate as N, the wells in the glacial deposits had more detections and concentrations over 10 milligrams per liter than wells in the bedrock, most of which were located in areas of cropland. Overall, chloride contamination appears to be a larger threat to Lake Huron water quality than nitrate from groundwater, given the presence of higher chloride concentrations across the basin. Groundwater chloride contamination may be of particular concern in the Saginaw Bay region, which is where many of the rivers discharge to in the southern part of the basin. However, less indirect groundwater discharge occurs in the southern part of the basin than the northern part of the basin. The northern part of the basin had larger gaps in the water-quality sampling given the lower population density and, therefore, fewer samples from drinking water wells. Results from the field data analysis generally confirmed the findings of the water budget and water quality analyses performed. Together, the analysis of where more groundwater discharge is occurring in the Lake Huron Basin and the identification of areas with potential groundwater-quality concerns can help prioritize areas that are critical to protecting the long-term health of Lake Huron.
References Cited
Aichele, S.S., 2005, Estimating shallow ground-water recharge in Michigan, box 1 of Neff, B.P., Piggot, A.R., and Sheets, R.A., Estimation of shallow ground-water recharge in the Great Lakes Basin: U.S. Geological Survey Scientific Investigations Report 2005–5284, p. 3, accessed April 4, 2025, at https://doi.org/10.3133/sir20055284.
American Public Health Association, 2022a, 4500-Cl− chloride, in Lipps, W.C., Baxter, T.E., Braun-Howland, E., eds., Standard methods for the examination of water and wastewater (24th ed.): Standard Methods Committee of the American Public Health Association, American Water Works Association, and Water Environment Federation, Washington D.C., APHA Press, 1,516 p, accessed July 2025 at https://doi.org/10.2105/SMWW.2882.079.
American Public Health Association, 2022b, 4500-NO3− nitrogen (nitrate), in Lipps, W.C., Baxter, T.E., Braun-Howland, E., eds., Standard methods for the examination of water and wastewater (24th ed.): Standard Methods Committee of the American Public Health Association, American Water Works Association, and Water Environment Federation, Washington D.C., APHA Press, 1,516 p., accessed July 2025 at https://doi.org/10.2105/SMWW.2882.089.
Apple, B.A., and Reeves, H.W., 2007, Summary of hydrogeologic conditions by county for the State of Michigan: U.S. Geological Survey Open-File Report 2007–1236, 87 p., accessed October 23, 2023, at https://doi.org/10.3133/ofr20071236.
Baer, S., Robertson, W., Spoelstra, J., and Schiff, S., 2019, Phosphorus and nitrogen loading to Lake Huron from septic systems at Grand Bend, ON: Journal of Great Lakes Research, v. 45, no. 3, p. 642–650, accessed April 2, 2024, at https://doi.org/10.1016/j.jglr.2019.03.003.
Bayless, E.R., Arihood, L.D., and Sperl, B.J., 2017, Maps and grids of hydrogeologic information created from standardized water-well drillers’ records of the glaciated United States: U.S. Geological Survey data release, accessed September 19, 2024, at https://doi.org/10.5066/F7BR8QCZ.
Beck, H., Zimmerman, N., McVicar, T., Vergopolan, N., Berg, A., and Wood, E., 2018, Present and future koppen-geiger climate classification maps at 1-km resolution: Scientific Data, v. 5, no. 1, p. 180214, accessed December 3, 2024, at https://doi.org/10.1038/sdata.2018.214.
Bock, A.R., Falcone, J.A., Oelsner, G., and Baker, N.T., 2018, Estimates of road salt application across the conterminous United States, 1992–2019 (ver. 2.0, August 2023): U.S. Geological Survey data release, accessed July 22, 2025, at https://doi.org/10.5066/P96IX385.
Borchardt, M.A., Stokdyk, J.P., Burney, A.K., Muldoon, M.A., Spencer, S.K., Firnstahl, A.D., Bonness, D.E., Hunt, R.J., and Burch, T.R., 2021, Sources and risk factors for nitrate and microbial contamination of private household wells in the fractured Dolomite aquifer of northeastern Wisconsin: Environmental Health Perspectives, v. 129, no. 6, p. 067004, accessed May 14, 2025, at https://doi.org/10.1289/EHP7813.
Boutt, D.F., Hyndman, D.W., Pijanowski, B.C., and Long, D.T., 2001, Identifying potential land use-derived solute sources to stream base flow using ground water models and GIS: Groundwater, v. 39, no. 1, p. 24–34, accessed November 15, 2024, at https://doi.org/10.1111/j.1745-6584.2001.tb00348.x.
Burrow, K.R., Nolan, B.T., Rupert, M.G., and Dubrovsky, N.M., 2010, Nitrate in groundwater of the United States, 1991–2003: Environmental Science & Technology, v. 44, p. 4988–4997, accessed December 18, 2024, at https://doi.org/10.1021/es100546y.
Chegini, T., Li, H.Y., and Leung, L. R., 2021, HyRiver—Hydroclimate Data Retriever: Journal of Open Source Software, v. 6, no. 66, article 3175, accessed March 22, 2024, at https://doi.org/10.21105/joss.03175.
Curtis, Z., Li, S., Liao, H, and Lusch, D., 2018, Data-driven approach for analyzing hydrogeology and groundwater quality across multiple scales: Groundwater, v. 56, no. 3, p. 377–398, accessed March 7, 2024, at https://doi.org/10.1111/gwat.12584.
Curtis, Z.K., Liao, H., Li, S., Prasanna, V.S., and Lusch, D.P., 2019, A multiscale assessment of shallow groundwater salinization in Michigan, v. 57, no. 5, p. 784–806, accessed December 28, 2023, at https://doi.org/10.1111/gwat.12873.
Environment and Climate Change Canada [ECCC] and U.S. Environmental Protection Agency [EPA], 2022, Lake Huron lakewide action management plan, 2022–2026: Binational.net, En164–56/2023E–PDF, EPA 905–R–23–005, 173 p., accessed May 8, 2024, at https://binational.net/wp-content/uploads/2024/05/Lake-Huron-2022-2026-LAMP.pdf.
Falcone, J., 2011, GAGES-II—Geospatial Attributes of Gages for Evaluating Streamflow: U.S. Geological Survey data release, accessed June 4, 2025, at https://doi.org/10.5066/P96CPHOT.
Feinstein, D.T., Hunt, R.J., and Reeves, H.W., 2010, Regional groundwater-flow model of the Lake Michigan Basin in support of the Great Lakes Basin water availability and use studies: U.S. Geological Survey Scientific Investigations Report 2010–5109, 379 p., accessed December 8, 2024, at https://doi.org/10.3133/sir20105109.
Granneman, N.G., Hunt, R.J., Nicholas, J.R., Reilly, T.E., and Winter, T.C., 2000, The importance of ground water in the Great Lakes: U.S. Geological Survey Water-Resources Investigations Report 00–4008, 13 p., accessed December 10, 2024, at https://mi.water.usgs.gov/reports/Grannemann9.html.
Great Lakes Commission, 2024, Great Lakes shorelines—Low resolution: Great Lakes Commission, accessed May 6, 2025, at https://www.arcgis.com/home/item.html?id=d87347457bc84e5c985db9e904b66b10.
Haack, S.K., Neff, B.P., Rosenberry, D.O., Savino, J.F., and Lundstrom, S.C., 2005, An evaluation of effects on groundwater exchange on nearshore habitats and water quality of western Lake Erie: Journal of Great Lakes Research, v. 31, supplement 1, p. 45–63, accessed December 16, 2024, at https://doi.org/10.1016/S0380-1330(05)70289-6.
Hamlin, Q., Kendall, A., Martin, S., Whitenack, H., Roush, J., Hannah, B., and Hyndman, D., 2020, Quantifying landscape nutrient inputs with spatially explicit nutrient source estimate maps: Journal of Geophysical Research—Biogeosciences, v. 125, no. 2, article e2019JG005134, accessed April 2, 2024, at https://doi.org/10.1029/2019JG005134.
Hamlin, Q.F., Martin, S.L., Kendall, A.D., and Hyndman, D.W., 2022, Examining relationships between groundwater nitrate concentrations in drinking water and landscape characteristics to understand health risks: GeoHealth, v. 6, no. 5, article e2021GH000524, accessed April 2, 2024, at https://doi.org/10.1029/2021GH000524.
Hoaglund, J., Huffman, G., and Granneman, N., 2002, Michigan basin regional ground water flow to three Great Lakes: Groundwater, v. 40, no. 4, p. 390–406, accessed December 28, 2023, at https://doi.org/10.1111/j.1745-6584.2002.tb02518.x.
Kaemming, B.B., Ford, C.M., and Martin, S.L., 2026, Data to improve the understanding of groundwater quantity and quality contributions to Lake Huron: U.S. Geological Survey data release, https://doi.org/10.5066/P133AHTG.
Kelly, W.R., Panno, S.V., and Hackley, K., 2012, The sources, distribution, and trends of chloride in the waters of Illinois: Illinois State Water Survey, accessed December 13, 2024, at https://www.isws.illinois.edu/pubdoc/b/iswsb-74.pdf.
Kessler, J., and Fry, L., 2022, Sub-indicator—Precipitation amounts in the Great Lakes Basin: State of the Great Lakes 2022 Technical Report, 13 p., accessed December 3, 2024, at https://stateofgreatlakes.net/wp-content/uploads/2022/07/Precipitation-Amounts-Subindicator-Report-SOGL-2022.pdf.
Knights, D., Parks, K., Sawyer, A., David, C., Browning, T., Danner, K., and Wallace, C., 2017, Direct groundwater discharge and vulnerability to hidden nutrient loads along the Great Lakes coast of the United States: Journal of Hydrology, v. 554, p. 331–341, accessed April 2, 2024, at https://doi.org/10.1016/j.jhydrol.2017.09.001.
Kolak, J., Long, D., Matty, J., Larson, G., Sibley, D., and Councell, T., 1999, Ground-water, large-lake interactions in Saginaw Bay, Lake Huron—A geochemical and isotopic approach: Geological Society of America Bulletin, v. 111, no. 2, p. 177–188, accessed December 4, 2024, at https://doi.org/10.1130/0016-7606(1999)111<0177:GWLLII>2.3.CO;2.
Kornelsen, K.C., and Coulibaly, P., 2014, Synthesis review on groundwater discharge to surface water in the Great Lakes Basin: Journal of Great Lakes Research, v. 40, no. 2, p. 247–256, accessed April 2, 2024, at https://doi.org/10.1016/j.jglr.2014.03.006.
Langevin, C.D., Hughes, J.D., Banta, E.R., Niswonger, R.G., Panday, S., and Provost, A.M., 2017, Documentation for the MODFLOW 6 Groundwater Flow Model: U.S. Geological Survey Techniques and Methods, book 6, chap. A55, 197 p., accessed April 2, 2024, at https://doi.org/10.3133/tm6A55.
Long, D.T., Wilson, T.P., Takacs, M.I., and Rezabek, D.H., 1988, Stable isotope geochemistry of saline near-surface groundwater—East-central Michigan Basin: Geological Society of America Bulletin, v. 100, no. 10, p. 1568–1577, accessed December 4, 2024, at https://doi.org/10.1130/0016-7606(1988)100<1568:SIGOSN>2.3.CO;2.
Long, D.T., Voice, T.C., Chen, A., Xing, F., and Li, S., 2015, Temporal and spatial patterns of Cl− and Na+ concentrations and Cl/Na ratios in salted urban watershed: Elementa—Science of the Anthropocene, v. 3, article 000049, accessed May 22, 2024, at https://doi.org/10.12952/journal.elementa.000049.
Lorenz, D., and DeCicco, L.A., 2017, DVstats—R package for managing, manipulating, and analyzing daily-values data (ver. 0.3.4): U.S. Geological Survey software package, accessed March 22, 2024, at https://code.usgs.gov/water/analysis-tools/DVstats.
Luscz, E.C., Kendall, A.D., and Hyndman, D.W., 2015, High resolution spatially explicit nutrient source models for the Lower Peninsula of Michigan: Journal of Great Lakes Research, v. 41, no. 2, p. 618–629, accessed May 8, 2024, at https://doi.org/10.1016/j.jglr.2015.02.004.
MacLeod, C.L., Barringer, T.H., Vowinkel, E.F., and Price, C.V., 1995, Relation of nitrate concentrations in the ground water to well depth, well use, and land use in Franklin Township, Gloucester County, New Jersey, 1970–85: U.S. Geological Survey Water-Resources Investigations Report 94–4174, 29 p., accessed July 18, 2025, at https://doi.org/10.3133/wri944174.
Mann, H.B., 1945, Non-parametric tests against trend: Econometrica, v. 13, no. 3, p. 163–171, accessed November 24, 2025, at https://doi.org/10.2307/1907187.
Mao, B., Wang, X., Jia, S., and Liu, Z., 2024, Multi-methods to investigate the baseflow—Insight from watershed scale spatiotemporal variety perspective: Ecological Indicators, v. 158, article 111573, accessed December 12, 2024, at https://doi.org/10.1016/j.ecolind.2024.111573.
Martin, S.L., Hamlin, Q.F., Kendall, A.D., Wan, L., and Hyndman, D.W., 2021, The land use legacy effect—Looking back to see a path forward to improve management: Environmental Research Letters, v. 16, no. 3, article 035005, accessed May 8, 2024, at https://doi.org/10.1088/1748-9326/abe14c.
McKay, L., Bondelid, T., Dewald, T., Johnston, J., Moore, R., and Rea, A., 2012, National Hydrography Dataset Plus, version 2—User guide: U.S. Environmental Protection Agency, accessed October 23, 2023, at https://www.epa.gov/waterdata/get-data.
Michigan Department of Technology, Management, and Budget, 2024, County from Michigan Geographic Framework: Michigan Department of Technology, Management, and Budget – Center for Shared Solutions, accessed September 10, 2024, at https://gis-michigan.opendata.arcgis.com/.
Michigan Department of the Environment, Great Lakes, and Energy [MI–EGLE], 2024a, Michigan Oil, Gas, and Minerals Division Data Explorer: Michigan Department of the Environment, Great Lakes, and Energy database, accessed December 10, 2024, at https://www.egle.state.mi.us/dataminer/.
Michigan Department of the Environment, Great Lakes, and Energy [MI–EGLE], 2024c, Wellogic, statewide groundwater database: Lansing Mich., Michigan Department of the Environment, Great Lakes, and Energy, accessed January 3, 2024, at https://www.egle.state.mi.us/wellogic/Login.aspx?ReturnUrl=%2fwellogic%2fdefault.aspx.
Milstein, R., 1987, Bedrock geology of southern Michigan: Michigan Department of Natural Resources, Michigan Geological Survey, Geological Publication BG–01, 1 sheet, scale 1:500,000. [Also available at https://ngmdb.usgs.gov/Prodesc/proddesc_71887.htm.]
Mullaney, J.R., Lorenz, D.L., and Arnston, A.D., 2009, Chloride in groundwater and surface water in areas underlain by the Glacial aquifer system, northern United States: U.S. Geological Survey Scientific Investigations Report 2009–5086, 43 p., accessed June 5, 2025, at https://doi.org/10.3133/sir20095086.
Neff, B.P., Day, S.M., Piggot, A.R., and Fuller, L.M., 2005, Base flow in the Great Lakes Basin: U.S. Geological Survey Scientific Investigations Report 2005–5217, 23 p., accessed December 11, 2024, at https://doi.org/10.3133/sir20055217.
Nielsen, M.G., and Martin, S.L., 2024, Using hydrogeologic context and water budgets to evaluate the potential for groundwater contributions to contaminants in Lake Superior: Journal of Great Lakes Research, accessed January 17, 2025, at https://doi.org/10.1016/j.jglr.2024.102402. [Version accessed was the version made available online on August 1, 2024, before the finalized version was made available in the journal in 2025.]
Nielsen, M.G., and Sterner, S.P., 2023, Upper Midwest Water Science Center Groundwater Model Archive Index v1.0 2023: U.S. Geological Survey data release, accessed September 20, 2024, at https://doi.org/10.5066/P9LHKNH3.
Panno, S.V., Hackley, K.C., Hwang, H.H., Greenberg, S.E., Krapac, I.G., Landsberger, S., and O’Kelly, D.J., 2006, Characterization and identification of Na-Cl sources in ground water: Ground Water, v. 44, no. 2, p. 176–187, accessed June 5, 2025, at https://doi.org/10.1111/j.1745-6584.2005.00127.x.
Pasciolla, I., 2023, Road commission—EGLE’s proposed brine restrictions excessive: Midland, Mich., Midland Daily News, April 12, 2023, accessed June 5, 2025, at https://www.ourmidland.com/news/article/midland-county-road-commission-fights-brine-17893355.php.
PRISM and Northwest Alliance for Computational Science & Engineering, 2022, 30-year normals: Northwest Alliance for Computational Science & Engineering, Oregon State University, digital data, accessed March 1, 2024, at https://www.prism.oregonstate.edu/normals/. [Database parameters selected: spatial resolution, 800m; variable, precipitation; temporal period, annual; download selection, all normal data (.acs).]
PRISM and Northwest Alliance for Computational Science & Engineering, 2024, United States monthly average daily mean temperature: Northwest Alliance for Computational Science & Engineering, Oregon State University, digital data, accessed March 1, 2024, at https://www.prism.oregonstate.edu.
Ransom, K.M., Nolan, B.T., Stackelberg, P.E., Belitz, K., and Fram, M.S., 2022, Machine learning predictions of nitrate in groundwater used for drinking supply in the conterminous United States: Science of the Total Environment, v. 807, part 3, article 151065, accessed December 13, 2024, at https://doi.org/10.1016/j.scitotenv.2021.151065.
Reed, R.C., and Daniels, J., 1987, Bedrock geology of northern Michigan: Michigan Department of Natural Resources, Michigan Geological Survey, Geological Publication BG–01, 1 sheet, scale 1:500,000. [Also available at https://ngmdb.usgs.gov/Prodesc/proddesc_71888.htm.]
Reitz, M., Sanford, W.E., Senay, G.B., and Cazenas, J., 2017a, Annual estimates of recharge, quick-flow runoff, and ET for the contiguous US using empirical regression equations, 2000–2013: U.S. Geological Survey data release, accessed March 25, 2024, at https://doi.org/10.5066/F7PN93P0.
Reitz, M., Senay, G.B., and Sanford, W.E., 2017b, Combined remote sensing and water-balance evapotranspiration estimates (SSEBop–WB) for the conterminous United States: U.S. Geological Survey data release, accessed March 5, 2024, at https://doi.org/10.5066/F7QC02FK.
Ruberg, S.A., Kendall, S.T., Biddanda, B.A., Black, T., Nold, S.C., Lusardi, W.R., Green, R., Casserley, T., Smith, E., Sanders, G.T., Lang, G.A., and Constant, S.A., 2008, Observations of the Middle Island sinkhole in Lake Huron—A unique hydrogeologic and glacial creation of 400 million years: Marine Technology Society Journal, v. 42, no. 4, p. 12–21, accessed December 4, 2024, at https://doi.org/10.4031/002533208787157633.
Rutledge, A.T., 1998, Computer programs for describing the recession of ground-water discharge and for estimating mean ground-water recharge and discharge from streamflow records—Update: U.S. Geological Survey Water-Resources Investigations Report 98–4148, 43 p., accessed August 2, 2023, at https://doi.org/10.3133/wri984148.
Sloto, R.A. and Crouse, M.Y., 1996, HYSEP—A computer program for streamflow hydrograph separation and analysis: U.S. Geological Survey Water-Resources Investigations Report 96–4040, 46 p., accessed August 8, 2023, at https://doi.org/10.3133/wri964040.
Soller, D.R., and Garrity, C.P., 2018, Quaternary sediment thickness and bedrock topography of the glaciated United States east of the Rocky Mountains: U.S. Geological Survey Scientific Investigations Map 3392, 2 sheets, scale 1:5,000,000, accessed April 29, 2024, at https://doi.org/10.3133/sim3392.
Stanton, J.S., Anning, D.W., Brown, C.J., Moore, R.B., McGuire, V.L., Qi, S.L., Harris, A.C., Dennehy, K.F., McMahon, P.B., Degnan, J.R., and Böhlke, J.K., 2017, Brackish groundwater in the United States: U.S. Geological Survey Professional Paper 1833, 185 p., accessed May 15, 2025, at https://doi.org/10.3133/pp1833.
Statistics Canada, 2016, Boundary files, 2016 census: Statistics Canada Catalogue, no 92–160–X, accessed May 6, 2025, at https://www12.statcan.gc.ca/census-recensement/2011/geo/bound-limit/bound-limit-2016-eng.cfm.
Tague, C., and Grant, G.E., 2004, A geological framework for interpreting the low-flow regimes of Cascade streams, Willamette River Basin, Oregon: Water Resources Research, v. 40, no. 4, article 2003WR002629, accessed December 18, 2024, at https://doi.org/10.1029/2003WR002629.
Trost, J.J., 2018, Soil-Water-Balance (SWB) model used to simulate potential groundwater recharge for the glacial aquifer system east of the Rocky Mountains, 1980–2011: U.S. Geological Survey data release, accessed February 7, 2024, at https://doi.org/10.5066/F7XW4HRJ.
Turnipseed, D.P., and Sauer, V.B., 2010, Discharge measurements at gaging stations: U.S. Geological Survey Techniques and Methods book 3, chap. A8, 87 p. [Also available at https://doi.org/10.3133/tm3A8.]
Uddameri, V., Silva, A.L.B., Singaraju, S., Mohammadi, G., and Hernandez, E.A., 2020, Tree-based modeling methods to predict nitrate exceedances in the Ogallala aquifer in Texas: Water, v. 12, no. 4, article 1023, accessed July 18, 2025, at https://doi.org/10.3390/w12041023.
U.S. Census Bureau, 2023, “tl_2023_us_internationalboundary” TIGER/Lines shapefile: U.S. Census Bureau, accessed April 21, 2025, at https://www.census.gov/cgi-bin/geo/shapefiles/index.php.
U.S. Census Bureau, 2024, “tl_2024_us_state” TIGER/Lines shapefile: U.S. Census Bureau, accessed April 21, 2025, at https://www.census.gov/cgi-bin/geo/shapefiles/index.php.
U.S. Environmental Protection Agency [EPA], 2024a, Drinking water regulations and contaminants: U.S. Environmental Protection Agency web page, accessed September 2, 2024, at https://www.epa.gov/sdwa/drinking-water-regulations-and-contaminants.
U.S. Environmental Protection Agency [EPA], 2024b, National primary drinking water regulations: U.S. Environmental Protection Agency web page, accessed September 2, 2024, at https://www.epa.gov/ground-water-and-drinking-water/national-primary-drinking-water-regulations.
U.S. Geological Survey [USGS], 2023, USGS Watershed Boundary Dataset (WBD) for 2-digit unit—04 (May 25, 2023) [shapefile]: U.S. Geological Survey data release, accessed March 19, 2024, at https://www.sciencebase.gov/catalog/item/51361e87e4b03b8ec4025c22.
U.S. Geological Survey [USGS], 2024a, Annual NLCD collection 1 science products: U.S. Geological Survey data release, accessed December 6, 2024, at https://doi.org/10.5066/P94UXNTS.
U.S. Geological Survey [USGS], 2024b, USGS water data for the Nation: U.S. Geological Survey National Water Information System database, accessed November 1, 2024, at https://doi.org/10.5066/F7P55KJN.
Westjohn, D. and Weaver, T., 1996, Hydrogeologic framework of Mississippian rocks in the central lower peninsula of Michigan: U.S. Geological Survey Water-Resources Investigations Report 94–4246, 46 p., accessed October 19, 2023, at https://doi.org/10.3133/wri944246.
Westjohn, D., and Weaver, T., 1998, Hydrogeologic framework of the Michigan Basin regional aquifer system: U.S. Geological Survey Professional Paper 1418, 45 p., accessed November 6, 2023, at https://doi.org/10.3133/pp1418.
Wheeler, D.C., Nolan, B.T., Flory, A.R., DellaValle, C.T., and Ward, M.H., 2015, Modeling groundwater nitrate concentrations in private wells in Iowa: Science of the Total Environment, v. 536, p. 481–488, accessed July 18, 2025, at https://doi.org/10.1016/j.scitotenv.2015.07.080.
Wolock, D.M., and McCabe, G.J., 2018, Water balance model inputs and outputs for the conterminous United States, 1900–2015: U.S. Geological Survey data release, accessed May 23, 2024, at https://doi.org/10.5066/F71V5CWN.
Xu, S., Frey, S.K., Erler, A.R., Khader, O., Berg, S.J., Hwang, H.T., Callaghan, M.V., Davison, J.H., and Sudicky, E.A., 2021, Investigating groundwater-lake interactions in the Laurentian Great Lakes with a fully-integrated surface water-groundwater model: Journal of Hydrology, v. 594, article 125911, accessed April 4, 2024, at https://doi.org/10.1016/j.jhydrol.2020.125911.
Yang, C., Condon, L.E., and Maxwell, R.E., 2025, Unravelling groundwater-stream connections over the continental Unites States: Nature Water, v. 3, no. 1, p. 70–79, accessed May 15, 2025, at https://doi.org/10.1038/s44221-024-00366-8.
Zell, W.O., and Sanford, W.E., 2020, MODFLOW 6 models used to simulate the long-term average surficial groundwater system for the contiguous United States: U.S. Geological Survey data release, accessed February 13, 2024, at https://doi.org/10.5066/P91LFFN1.
Zhan, Y., Guo, Z., Ruzzante, S., Gleeson, T., Andrews, C.B., Babovic, V., and Zheng, C., 2024, Assessment of spatiotemporal risks for nationwide groundwater nitrate contamination: Science of the Total Environment, v. 947, article 174508, accessed July 12, 2024, at https://doi.org/10.1016/j.scitotenv.2024.174508.
Zhang, H., Erickson, M., Van Stempvoort, D., Zhang, G., and Spoelstra, J., 2022, Sub-indicator—Groundwater quality: State of the Great Lakes 2022 Technical Report, 37 p., accessed December 3, 2024, at https://stateofgreatlakes.net/wp-content/uploads/2022/07/GroundwaterQualitySubindicator-Report_SOGL2022.pdf.
Conversion Factors
U.S. customary units to International System of Units
Temperature in degrees Fahrenheit (°F) may be converted to degrees Celsius (°C) as follows:
°C = (°F – 32) / 1.8.
Supplemental Information
Concentrations of chemical constituents in water are in milligrams per liter (mg/L).
Abbreviations
±
plus or minus
CSMI
Cooperative Science and Monitoring Initiative
ECCC
Environment and Climate Change Canada
EPA
U.S. Environmental Protection Agency
ET
evapotranspiration
HTL
high transmissivity over limestone
HTSa
high transmissivity over sandstone
HTSh
high transmissivity over shale
HUC–8
hydrologic unit code 8
LAMP
Lakewide Action Management Plan
LTSa
low transmissivity over sandstone
LTSh
low transmissivity over shale
MCL
maximum contaminant level
MI–EGLE
Michigan Department of the Environment, Great Lakes, and Energy
MTL
medium transmissivity over limestone
MTSa
medium transmissivity over sandstone
MTSh
medium transmissivity over shale
N
nitrogen
NWIS
National Water Information System
PRISM
Parameter-elevation Regressions on Independent Slopes Model
SWB
Soil Water Balance
USGS
U.S. Geological Survey
For more information about this publication, contact:
Director, USGS Upper Midwest Water Science Center
8505 Research Way
Middleton, WI 53562
608–828–9901
For additional information, visit: https://www.usgs.gov/centers/umid-water
Publishing support provided by the
USGS Science Publishing Network,
Rolla Publishing Service Center
Disclaimers
Any use of trade, firm, or product names is for descriptive purposes only and does not imply endorsement by the U.S. Government.
Although this information product, for the most part, is in the public domain, it also may contain copyrighted materials as noted in the text. Permission to reproduce copyrighted items must be secured from the copyright owner.
Suggested Citation
Kaemming, B.B., Ford, C.M., and Martin, S.L., 2026, Assessment of groundwater quantity and quality contributions to Lake Huron: U.S. Geological Survey Scientific Investigations Report 2026–5136, 41 p., https://doi.org/10.3133/sir20265136.
ISSN: 2328-0328 (online)
Study Area
| Publication type | Report |
|---|---|
| Publication Subtype | USGS Numbered Series |
| Title | Assessment of groundwater quantity and quality contributions to Lake Huron |
| Series title | Scientific Investigations Report |
| Series number | 2026-5136 |
| DOI | 10.3133/sir20265136 |
| Publication Date | April 20, 2026 |
| Year Published | 2026 |
| Language | English |
| Publisher | U.S. Geological Survey |
| Publisher location | Reston, VA |
| Contributing office(s) | Upper Midwest Water Science Center |
| Description | Report: viii, 41 p.; Data Release |
| Country | United States |
| State | Michigan |
| Other Geospatial | Lake Huron |
| Online Only (Y/N) | Y |
| Additional Online Files (Y/N) | N |