

Practical Guidance for Engaging End-Users and Experts in Developing Scientific Tools
Links
- Document: Report (1.83 MB pdf) , HTML , XML
- Data Release: USGS data release - Survey Responses Collected in 2024 Measuring End-users' and Experts' Experiences Being Engaged in Development of Scientific Tools
- Download citation as: RIS | Dublin Core
Acknowledgments
Thank you to the Biological Threats and Invasive Species Research Program for proposing and investing in this project and supporting the engagement and coproduction of science tools. In addition, thank you to the many project partners who responded to our survey and project leads who participated in this study and provided thoughtful and insightful lessons learned from their experiences. Special thanks to Aparna Bamzai-Dodson and Ella Samuel for reviewing and providing feedback on this report.
Abstract
This report provides actionable guidance for scientists developing scientific tools that inform on-the-ground decision making. Scientific tools, in the context of this report, are technology or protocols that help practitioners collect and analyze their own data, and information products and web tools that practitioners could use to inform decisions. Engaging end-users and fellow experts is fundamental to the creation of useful scientific tools. Scientists can use clear and specific direction on action steps and activities to effectively engage with end-users and fellow experts during development. Our study explores lessons learned from six U.S. Geological Survey projects that designed and implemented engagement activities with end-users and experts to coproduce scientific tools for natural resource managers. U.S. Geological Survey teams engaged end-users and experts across the United States from Federal, State, and local governments; universities; Tribes; territories; and nongovernmental organizations in designing and developing scientific tools intended to support end-users in their work. An online survey with 98 participants measured satisfaction across several indicators of successful engagement, including engagement activity frequency, sufficient opportunities to provide feedback, feedback implementation, inclusion of necessary perspectives, and functionality of the tool for end-users. Semistructured interviews were held with project leads, during which the project leads reviewed a summary of the survey results. The project leads reflected on the engagement efforts used in their project, then described lessons learned from the engagement experience and participant feedback. Common themes for ensuring effective engagement identified through thematic analysis included engaging end-users during product conceptualization; establishing clear roles and expectations; considering who end-users are and how end-users may use the tool; recruiting participants through your network, boundary spanners, and leadership; understanding individual use cases; communicating how feedback was integrated into the product; and strategically using virtual meeting tools. This guide shares practical steps and exercises for planning and facilitating effective engagement based on lessons learned from project leads and case study summaries of each project.
Introduction
Scientists developing tools and information products1 for on-the-ground applications can use guidance on the best practices and strategies to effectively engage end-users and fellow experts during the development process. Attention to these efforts typically focuses on research (for example, coproduced scientific findings that can be used by a practitioner [Beier and others, 2017]) or action (for example, community engagement or deliberation that incorporates perspectives of all parties who may be affected by the decision-making process [Reed and others, 2018]). The coproduction process, in which researchers and practitioners work together to produce science useful for decision making, is a common goal of conservation scientists striving to produce actionable scientific research findings (Bamzai-Dodson and others, 2021). Though information provided by coproduced research is valuable, scientists’ other products and resources (such as technology, tools, online interfaces, and protocols) enable conservation practitioners to ask and answer scientific questions in their work context. These resources either directly inform management decisions or enable other scientists and practitioners to collect or analyze data for their own research that informs management decisions. Coproduced research tools and resources that are developed to inform management are distinct from research that produces findings with the primary aim of advancing broad scientific knowledge. Coproduction is also broader than engagement that produces decision-support tools, which are software systems or processes that assist the user in solving complex problems by producing decision-relevant information (Geoffrion, 1983; Pearman and Cravens, 2022). This report provides actionable guidance for engaging end-users and other experts developing scientific tools beyond the domain of research. End-user and expert engagement and the requisite activities facilitating that engagement are fundamental to creating useful scientific tools.
All bolded terms are common terms used throughout this report, and the definitions can be found in the “Glossary” section.
For this guide, we define “scientific tools” as web tools, scientific protocols, or information products that support research or inform decisions for a natural resource management issue, often used across geographies. The term “web tool” refers to a scientific tool that has a web-based interface (with one or more components), which the user interacts with to learn or create new information. A “scientific protocol” is defined as a scientific tool that provides instructive, step-by-step guidance on specific methods of data collection, analysis, or interpretation. Scientific protocols may include technology, machines, or physical equipment. Finally, “information products” are static information providing general guidance about scientific topics, methods, or findings that answer a specific research question for on-the-ground applications. These products can be web-based or more traditional reports and journal articles. The categories used throughout this report are based on the project leads’ descriptions of their tools. We define the terms “end-user” as the person who directly interacts with a scientific tool and uses the knowledge from the tool to inform their work, and “expert” as a person with subject matter expertise in the content, method, or scientific discipline upon which a scientific tool is based.
Knowledge exchange and other forms of transdisciplinary collaboration and engagement are used to effectively address complex conservation threats that span across disciplinary, social, geographic, and ecological boundaries (Margules and others, 2020). Terminologies, frameworks, and epistemological perspectives related to knowledge exchange abound, such as stakeholder engagement (Reed and others, 2018), public participation (Parkins and Mitchell, 2005), coproduction (Beier and others, 2017), transdisciplinary science (Steger and others, 2021), collaborative conservation (Wilkins and others, 2021), social learning (Schusler and others, 2003), translational ecology (Schlesinger, 2010), and participatory science (Cvitanovic and others, 2019). Some principles of research coproduction are relevant to scientific tool development, such as representation, which stipulates that a project team should “systematically represent research user knowledge needs and priorities” (Reed and others, 2014, p. 341). Other practices are less relevant, such as engaging users in developing research questions or study designs (Reed and others, 2014; Meadow and others, 2015). Existing guidance on engaging end-users to produce actionable science describes types of engagement and specific approaches and activities for scientists to facilitate effective engagement (Bamzai-Dodson and others, 2021). Other research focuses on barriers to producing actionable science (Pearman and Cravens, 2022), learning from decision-support tool design and development (Stoltz and others, 2023), applying translational ecology for invasive species management (Morelli and others, 2021), coproducing actionable science (Beier and others, 2017), and finding the best practices for general stakeholder engagement (Reed, 2008; Reed and others, 2018). These studies contribute to a foundation of principles and practices for useful and actionable science. This type of guidance is particularly relevant to organizations like the U.S. Geological Survey (USGS), which “monitors, analyzes, and predicts current and evolving Earth-system interactions and delivers actionable information at scales and timeframes relevant to decision makers” (USGS, 2037). This report provides scientists with guidance on specific processes and activities that (1) facilitate engagement in scientific tool development and (2) address issues such as usability and product design.
The intended audience of this guide is scientists or project teams creating geographically agnostic web tools, scientific protocols, or information products used by land and resource managers. In other words, the tools can be used at multiple scales and geographies and likely require engagement at a large scale, such as nationally, instead of one specific community or geographic place. These tools typically support research or inform decisions for a natural resource management issue, though these tools may also be applied in other contexts or more narrow geographic areas.
Methods Used to Inform This Guide
This guide was informed by a mixed qualitative-quantitative study of six projects led by USGS scientists to produce scientific tools. There were six total projects: 2 projects produced a web tool, 2 produced a scientific protocol, and 2 produced an information product. During one or more years, each project facilitated engagement activities with potential end-users of the intended scientific tool or experts in a topical area related to the tool (hereafter collectively referred to as “participants”). These six projects were chosen because these projects were part of a broader national initiative about invasive species, which required project teams to plan, implement, and evaluate end-user engagement. As a result, an engagement coordinator, the first author of this report, was brought on to the initiative to coordinate and advise engagement activities and evaluate project teams’ engagement efforts using a structured survey. This survey provided the quantitative data for this study. Subsequently, the first author led semistructured interviews with project leads to gather lessons learned from their experiences. These interviews provided the qualitative data for this study. The following two subsections detail the methodology for the survey and semistructured interviews. The guidance and practical steps outlined throughout this report are based on an analysis of the interviews with project leads.
Summaries of each project and engagement efforts are provided in appendixes 1–3. We use the term “project lead” to refer to the person or people, typically scientists, who are the primary decisionmakers or points of contact for a project. We use the term “project team” to refer to the larger group of people, typically scientists, working to develop a scientific tool. As part of their engagement efforts, each project team systematically recruited and facilitated engagement activities with participants. Project leads across all six projects typically used the term “partner” for project participants, which is reflected in this report’s exemplary quotations. The lead author on this guide assisted in coordinating and advising, but not facilitating, engagement activities across the six projects and surveyed participants to evaluate the engagement process.
Survey Methodology
We developed the survey using existing research on coproduction and stakeholder engagement to produce actionable science in the contexts of natural resource management and medical research (Wall and others, 2017; Bamzai-Dodson and others, 2021; Bamzai-Dodson and McPherson, 2022; Meadow and Owen, 2021). Each question measured a specific indicator of successful engagement identified in the research on coproduction of actionable science (Lavallee and others, 2012; Ray and Miller, 2017; Wall and others, 2017). The indicators we chose to measure in the survey and the corresponding survey questions are summarized in table 1, and the full questionnaire is available in appendix 4.
Table 1.
Summary of survey questions evaluating participants’ experiences engaging or collaborating on projects to develop scientific tools.[N/A, not applicable]
| Indicators | Survey questions and statements | Response options |
|---|---|---|
| Participants perceive they had equitable opportunities to participate in the project (such as, meetings and workshops; adapted from Wall and others, 2017, p. 102) | The project team has provided me with sufficient opportunities to inform the project. | 7-point scale: Strongly disagree to strongly agree |
| Trust—“Stakeholders are confident that project outcomes reflect the discussions and decisions reached through a deliberative process” (Lavallee and others, 2012, p. 401) | I trust that the project team has considered the feedback I have given. | 7-point agreement scale: Strongly disagree to strongly agree |
| The participant group is diverse and representative of key perspectives (adapted from the criteria termed “legitimacy” in Lavallee and others, 2012, p. 401) | The project team is engaging partners with the necessary subject matter expertise and management perspectives to inform the project. | 7-point agreement scale: Strongly disagree to strongly agree |
| Frequency and medium of communication between the project team and participants (adapted from Wall and others, 2017, p. 102) | For each of the following types of interactions that you have participated in, what
is your perception of the frequency of this type of interaction? • Emails • One-on-one calls or meetings • Presentations (for example, updates or webinars about the project) • Virtual group meetings • In-person interactions • Other |
5-point scale: • Far too little, • Slightly too little, • The right amount, • Slightly too much, • Far too much, or • N/A if you did not participate in this type of interaction. |
| Level of engagement in the project (question design informed by Bamzai-Dodson and others, 2021) | Which of the following best describes your involvement in this project? | • I am informed about the project’s progress, final products, and outputs. • I am consulted for feedback on certain aspects of the project, such as analyses, design, implementation, products, and outputs. • I collaborate with the project team to formulate solutions and design final products and outputs. • I am a coequal to the rest of the project team; I provide foundational input and recommendations to the project development. |
| Findings or outputs meet the standard that the participants apply to usable information for action (adapted from Wall and others, 2017, p. 102) | How functional do you believe the scientific tool(s) or product(s) this project is producing will be to support your invasive species work? | • Not at all (not well-developed at all; not functional). • Minimal (very limited in scope, scale, or function). • Moderate (generally functional with notable insufficiencies or limitations). • Good (gaps may exist for minor elements). • Robust (well-developed and highly functional). |
| “[Participants] are satisfied with the level of engagement” (Wall and others, 2017, p. 102) | How do you feel about your experience with this project team? | 7-point scale: Extremely dissatisfied to extremely satisfied |
The questionnaire consisted of 17 questions (and followed the requirements for the Department of the Interior Programmatic Clearance for Customer Satisfaction Surveys) and was approved through the requirements of the Office of Management and Budget (control number 1040-0001).
We prioritized indicators based on how actionable the feedback about that indicator would be for project leads. For example, learning whether participants would like fewer or more frequent virtual group meetings could easily be interpreted and acted upon. In addition, project teams were consulted on what types of questions would provide the most useful information. This consultation resulted, for example, in adding a question asking participants how functional the projects’ deliverables would be for their work and what engagement level participants perceived they were involved in. Furthermore, the survey served as a formative evaluation because most projects were ongoing and had not released final products.
The survey was pretested using Qualtrics survey software by eight individuals with knowledge about the projects or expertise in stakeholder engagement or coproduction research. Feedback from this pretest group was incorporated, including suggestions and clarifications about wording in the questions, answer choices, and survey introductions. This feedback was followed by a review of the survey questions by nine project leads on the projects whose engaged participants comprised the sample population for the survey, as well as a USGS employee who oversees the projects. This final review resulted in two minor edits to wording to improve clarity, but otherwise, the survey was approved by all project leads.
The sample population consisted of 178 individuals who were invested in the outcomes of the projects but not part of the core USGS project teams. As part of the engagement efforts across the six projects, project leads designed engagement plans and kept up-to-date lists of engagement activity participants. Project leads were also informed of the survey and the need for participants’ contact information in advance. Some participants were listed in multiple projects. To address the fact that some participants were listed in multiple projects, the first question of the questionnaire read, “For the purpose of this survey, we are asking that you respond based on your experience with just one project, even if you have been involved in multiple. Please select the project with which you have been the most involved [original emphasis]. Use this project as the basis for your answers for the rest of the questions in this survey.”
Following the best practices for web-based survey research (Dillman and others, 2014), two reminder emails were sent to the distribution list after the initial survey distribution on April 30, 2024, using Qualtrics survey software. The survey closed June 19, 2024. Website data showed that 113 people accessed the introduction page and advanced at least to the survey’s first question. Out of these respondents, 15 answered too few questions to be included in the analysis. Another 7 did not finish the survey but provided responses to several questions included in the analysis. There were 91 respondents who finished the survey, which resulted in a response rate of 63.48 percent and a completion rate of 80.53 percent. In total, there were 98 responses representing Federal (47), academic (23), State (8), nongovernmental (7), Tribal (2), and private (2) organizations.
Semistructured Interviews
After closing the online survey and analyzing results, the lead author led a series of semistructured interviews in September and October 2024 with the 10 project leads across the 6 projects included in the survey (table 2).
Table 2.
Summary of the number of projects and project leads interviewed for each type of scientific tool included in the study.Semistructured interviews were administered according to the best ethical practices for research on human subjects, including informed consent. Interviewees were first invited to participate in an interview. At the start of the interview, interviewees were told how the data would be analyzed and reported, and that interviewees could decline or stop the interview at any time. All interviewees consented to participating in a recorded interview. For 4 of the projects (2 web tools and 2 information products), 2 project leads were interviewed about each project. For the 2 projects developing scientific protocols, 1 project lead was interviewed about each project, for a total of 10 project leads interviewed. All interviewees were interviewed separately, even if an interviewee worked on the same project as another interviewee. All interviewees were asked 13 questions in total. The interview questions were designed to directly inform this end-user engagement guide and were based on successful engagement indicators measured through the questionnaire, such as the frequency of interaction and communicating to participants how feedback was incorporated into the product. Interviewees were also asked about the product itself, how the project team recruited and engaged participants, and what interviewees would do differently. After a series of questions on these topics, the lead author presented the project leads with the survey results from their specific project’s participants. Then, the interviewees were asked several more questions, including what the interviewees would do differently after reviewing participant feedback and what lessons learned interviewees would share about participant engagement with a fellow scientist for a similar project. The complete interview guide can be found in appendix 5.
Interviews were recorded, with consent from the interviewees, and transcribed by the lead author. The shortest and longest interviews were 52 and 98 minutes, respectively, with an average length of 70 minutes. The lead author then assessed the data through a thematic analysis of the transcripts, a method for identifying and reporting data themes, following six phases of analysis outlined by Braun and Clarke (2006, p. 87): (1) “familiarizing yourself with the data,” (2) “generating initial codes,” (3) “searching for themes,” (4) “reviewing themes,” (5) “defining and naming themes,” and (6) “producing the report.”
Primary codes (representing high-level themes) were mainly determined before analysis, based on indicators similar to indicators in the questionnaire (refer to app. 4) as well as others outlined in Wall and others (2017). Primary codes determined before the analysis consisted of “necessary perspectives are included in the partner group,” “sufficient and accessible opportunities to engage,” “the project team,” “engagement timing,” and “engagement barriers.” During analysis, several other primary codes were identified: “meaningful engagement activities,” “effective facilitation,” and “the right partners.” Secondary codes (representing specific themes within each primary code) were identified through an inductive, or bottom-up, process, which means the themes are strongly linked to the data. The full codebook and the number of times the secondary codes were mentioned are presented in appendix 6.
All practical steps outlined in this report are based on the analysis of interviews and survey data. The thematic analysis was designed to identify specific lessons learned on accomplishing or addressing each of the overarching themes or indicators of effective engagement outlined in the primary codes. Therefore, the practical steps described throughout the report mirror the codebook (app. 6). This approach identified specific steps to directly address engagement principles and indicators at a level of detail that is often missing in existing literature. Throughout the report, findings from this analysis are presented in several ways to inform the audience of this report most effectively: descriptions of themes and exemplary quotations that illustrate a practical step, syntheses of how these themes relate to each other, and discussions about how themes exemplify existing guidance and engagement research. Because some of our themes mirror engagement principles and indicators described in existing literature, discussion of relevant literature is incorporated where appropriate. Therefore, our report combines the results and discussion sections into one cohesive set of practical guidance. For example, the need to thoughtfully consider who the end-users of a scientific tool are and how end-users will use the tool was a key theme. This finding’s description includes an example of an exercise to accomplish this step, which is commonly used in the technology sector and described in existing guidance. Similarly, we identified a multitude of themes that reflect the human-centered design approach, so we describe this approach and offer several resources to learn more about it. In addition, exemplary quotations are provided throughout the report as a mechanism to directly represent the lived experiences of interviewees and more intimately relay their advice to fellow scientists consulting this report. Quotations have been lightly edited for brevity and clarity.
Practical Guidance for Effective End-User and Expert Engagement
The following guidance is organized in chronological order, from “Step A—Set Up Your Engagement for Success” to “Step E—Facilitate Interactive Meetings.” We end with guidance to avoid common pitfalls that applies across steps A–E. Most steps are important to all three types of scientific tools: web tools, scientific protocols, and information products. Each step is relevant for all scientific tools, unless otherwise noted. A visual outline of these steps for effective engagement is presented in figure 1.
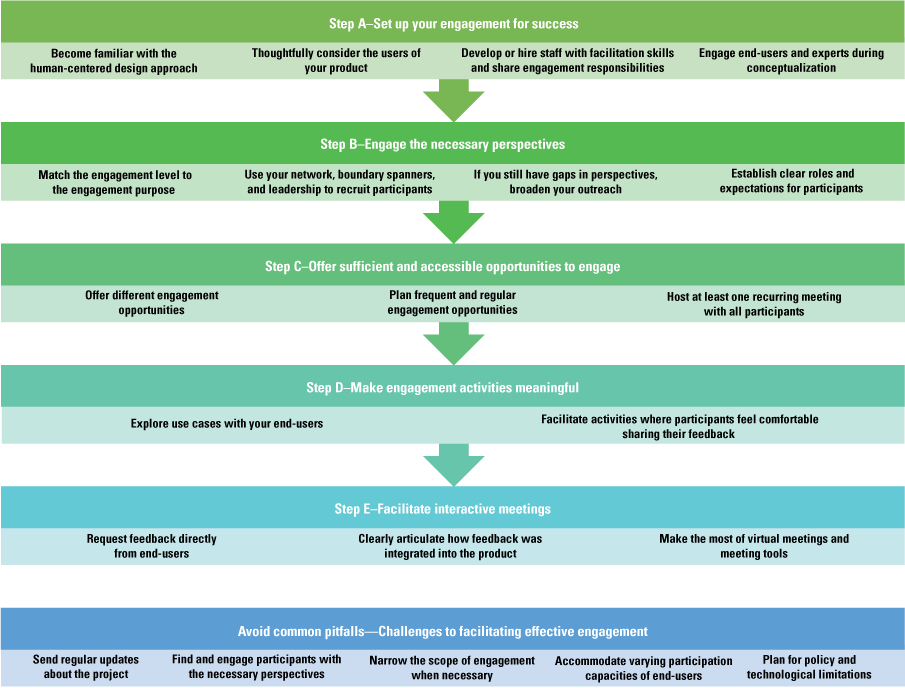
Flow chart of practical steps for effective end-user and expert engagement for scientific tools. This figure serves as a visual outline of the guidance provided in this report and mirrors the subsections of the report and the codebook used for the report’s thematic analysis of the interview data.
Step A—Set Up Your Engagement for Success
This section describes methods and approaches to set up engagement efforts for success.
Become Familiar with the Human-Centered Design Approach
The human-centered design approach is a structured method for developing tools, products, or experiences starting with a “deep understanding of the intended user’s needs and point of view” (Bamzai-Dodson and others, 2021, p. 1032). This approach begins at the start of the project and continues iteratively throughout the project development by engaging with users multiple times as user feedback is incorporated and the product is modified. In the present study, successful engagement by project leads included engagement methods that mirrored the human-centered design approach, including the following themes: engaging end-users in the conceptualization of the product, engaging end-users regularly throughout the project, and thinking about the end-users of the product and their use cases.
For resources that provide guidance on the human-centered design approach, refer to the U.S. General Services Administration (2037), IDEO.org (2015), Interaction Design Foundation (2016), and Consortium for Public Education (2025).
Thoughtfully Consider the Users of Your Product
Multiple interviewees who participated in our study identified the lesson learned that successful engagement depends on understanding how your product will be used, and to learn from potential end-users and collaborators, you must first identify them. This lesson reflects similar guidance provided by Stoltz and others (2023), advising tool creators to define the target users of the tool and understand the decision context. In Stoltz and others (2023), interviews of decision-support tool creators revealed that within USGS, “unsuccessful DSTs [decision-support tools] are often built without considering who the target users of the tool will be” (p. 14). However, our interviewees noted that predicting every potential end-user of a tool can be challenging. Upon reflecting on more than 5 years of facilitating engagement in a web tool, one interviewee stated,
Broadening that idea of what our ideal user was would have helped us reach out to groups like [Federal agency name redacted for privacy] or county weed managers, and really thinking about what is the scale at which this tool operates effectively. And that’s hard to know from an early stage of development, who your true adopters are. (Interviewee 2)
A helpful method from the design field for brainstorming potential end-users of your product involves creating user personas (Miaskiewicz and Kozar, 2011). User personas are fictional characters based on researching and understanding potential end-users of your product. This exercise guides your recruitment and conceptualization process by helping you and your project team think deeply about your end-users’ needs and experiences. One of the project teams included in the present study used a user persona exercise to inform the engagement and the design of a web tool. (A user persona template and an example for a project lead developing a scientific protocol are illustrated in figures 2 and 3.) This project’s lead noted that they only learned about end-users’ on-the-ground experiences after the end-users were recruited to participate in engagement activities. The end users’ on-the-ground experiences tested the project lead’s assumptions about user needs.
User personas are used to systematically recruit the necessary perspectives and plan what level and types of engagement are most appropriate for the various perspectives. This exercise can also be used to brainstorm potential experts to engage in the project by excluding the pain points portion of the exercise (fig. 2). Pain points refer to challenges end-users may face when using a scientific tool; since experts may not be end-users of the scientific tool, experts may not know the pain points.
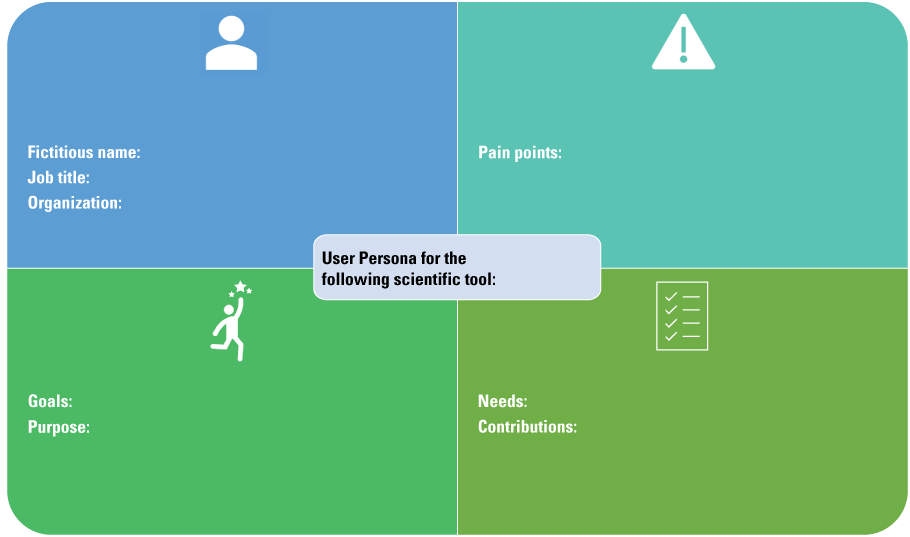
A worksheet for project teams to brainstorm user personas of potential end-users of the scientific tool. “Pain points” refers to challenges potential end-users may face when using a scientific tool.
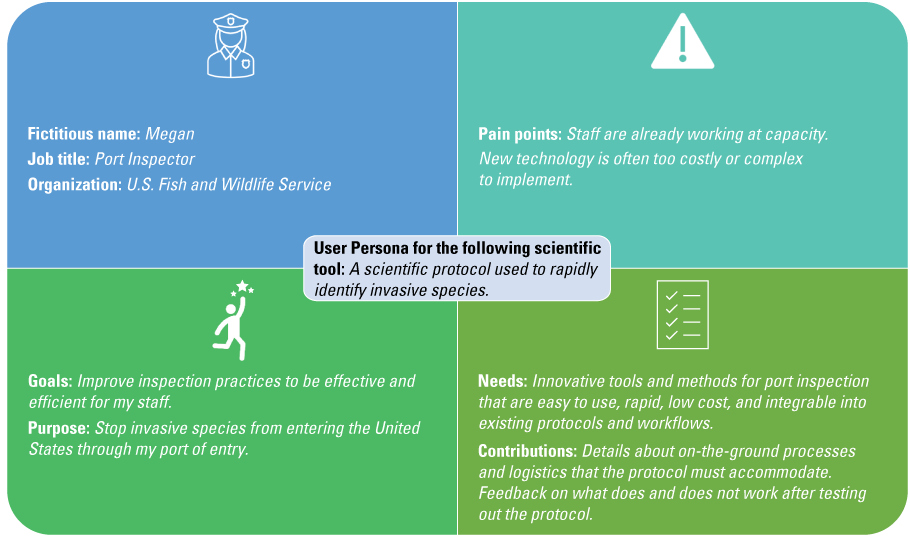
A worksheet example of a user persona for scientific protocol 1 (described in app. 2) illustrating the role, goals, challenges, and needs a potential end-user may have. Italicized text indicates examples of information a project lead would fill in. “Pain points” refers to challenges potential end-users may face when using a scientific tool.
Develop or Hire Staff with Facilitation Skills and Share Engagement Responsibilities
Some project teams noted that, as biologists or physical scientists, facilitation and engagement are not part of their expertise or how their performance is measured. However, trainings on negotiation, virtual meetings, webinar facilitation, and conflict management increased their team’s capacity to facilitate effective engagement. This lesson learned reflects the recommended best practices in the literature as well, such as the following indicator for effective engagement: “Research team has training or experience in collaborative research approaches” (Wall and others, 2017, p. 102). Similarly, Gerlak and others (2023) found that skillful facilitation supports effective communication and engagement processes. In other words, a particular aspect of engagement is how a project team facilitates interactions, such as group discussions during meetings. One project lead described the utility of facilitation training for biologists:
We’re biologists. We’re not particularly trained in that [meeting facilitation]…And so, I think early we were like, “Yes, engagement is good.” We didn’t really know how to do that…[facilitation training is] useful because there are going to be people. If you’re truly doing engagement, there are going to be people with opposing views…There are gonna be situations where you’re there to listen and hear the concerns, but then be able to take a breath and then still engage with that person and not run from it. (Interviewee 7)
Project teams noted that one team member is not enough to manage all engagement responsibilities, even for projects with small groups of participants. Furthermore, connecting participants with more of the project team increases knowledge exchange, relationship-building, and access to diverse expertise and perspectives. Therefore, project teams should consider sharing engagement responsibilities when possible and either hiring a team member who has expertise in engagement and facilitation or seeking training on engagement and facilitation. Sharing these responsibilities among a project team includes having a cofacilitator on virtual meetings to help monitor the chat, keep time, and facilitate virtual web tools. Sharing engagement responsibilities also includes sharing the responsibility of sending emails or newsletters, coordinating and scheduling interactions, and connecting the team with participants to build a network of knowledge exchange. One project lead described the importance of hiring staff specifically charged with engagement, because biologists are not always evaluated based on engagement:
Knowing my strengths and weaknesses and how I look at my time, it would have been very smart to actually fund someone [who] is specifically charged with doing this [engagement and partner communication]…This is so different because everything I get evaluated on—this is not one of them for the most part, right? So that’s one of the reasons why…it’s so easy to push to the side. (Interviewee 10)
Engage End-Users and Experts During Conceptualization
While external factors, such as rapid distribution of funding or accelerated timelines, can limit how early engagement begins, engaging end-users and experts as early as possible is a best practice highlighted throughout the literature on coproduction and product development (Ries, 2011; Wall and others, 2017; Bamzai-Dodson and others, 2021). Our interviewees emphasized that although it can be uncomfortable to engage potential end-users or experts before a draft product or concept for a product is formulated, there are benefits to doing so. One project lead characterized the necessity and discomfort that accompanied early engagement in a way that effectively reflected sentiments across interviewees:
I don’t have anything to show yet. And we don’t have answers to all the questions that [partners are] asking, and it’s really uncomfortable to go into a situation like that, not having answers. We want to be able to answer all the questions. We want to be able to say, “This is what we’re doing,” and have no fear, but it’s a really uncomfortable space to be. But I think embracing that discomfort, really, is playing out in a positive way in the long run…[the project team] got that engagement from the start and then we could honestly and truly tell people “Your engagement matters,” because we don’t have a plan yet…rather than coming to people afterwards and saying “We want your input, but everything is basically set in stone.” (Interviewee 7)
Creating or conceptualizing a product without first consulting the expected end-users inevitably means that project teams must make assumptions about end-user needs, day-to-day experiences, or context. Engaging potential end-users in the behind-the-scenes development demonstrates transparency and ensures that end-users’ perspectives are truly incorporated into the vision and function of the product. In contrast, requesting input after a draft or final product is created may mean there is minimal room to pivot and may appear disingenuous to the participant.
Project teams also emphasized the benefits of learning from experts early on in their project. These discussions could reveal existing resources and collaboration opportunities. The same project lead who emphasized how uncomfortable it can be to start engagement before you have all the answers reflected on an interview question about engagement timing:
Early engagement, because otherwise, you really are running the risk of duplicating efforts that are already out there. Yeah, you can do your market research and search the web and see what’s out there. But there’s actually so much that is in the works or only accessible to certain people, that if you’re not getting out there and talking to people you probably are recreating something…by doing that [talking to people], it also helped us to find our niche better, which is good for business…it doesn’t help anyone for us to be competing with other platforms…Working with those various platforms…now they’re some of our strongest partners. (Interviewee 7)
You almost wish that, in hindsight, having that opportunity to sit down and go over things in the hangar before we’re going down the runway—and getting them [partners] engaged in that at the very, very beginning of it…you may have ended up with something very, very different. But that [early engagement] didn’t happen, so, in hindsight, I wish I would have done that. (Interviewee 9)
In addition to engaging participants early, delivering drafts or versions of the work early rewards participants and keeps participants engaged with the project (Reed and others, 2014). Similarly, one of the lessons learned reported by Stoltz and others (2023) included working iteratively to develop a tool in response to feedback and results from usability tests. One project lead on a scientific protocol looked to strategies established in the private sector that similarly emphasized the need to engage end-users quickly, before there was a perfect product. In the technology sector, project development with frequent feedback is commonly called an agile development or a build-measure-learn process (sometimes referred to as a think-build-learn process; Ries, 2011). This project lead intentionally modeled the Ries’ (2011) build-measure-learn process and emphasized the value of an iterative approach:
You learn a lot by getting something out that isn’t perfect…[If you] build it [the product] as fast as you can and then get it out there and break it intentionally so you can then figure out how to make it better and learn from that…creating that build-measure-learn cycle. The faster that you can move through that cycle, the faster you get to a product or program that is more useful to your end-users. (Interviewee 10)
Step B—Engage the Necessary Perspectives
This section describes methods and approaches to engage the necessary perspectives.
Match the Engagement Level to the Engagement Purpose
Our findings reflect established best practices and guidance (Davidson, 1998; Bamzai-Dodson and others, 2021) for choosing the engagement levels and types of activities to facilitate for different end-users and experts. To thoughtfully recruit end-users and experts to engage in a project and establish clear roles and expectations, the project team should first determine what their engagement goals are. Different engagement activities accomplish different levels of involvement and fulfill different engagement purposes (Bamzai-Dodson and others, 2021). Table 3 presents an adaptation of a well-established framework useful for guiding what level of engagement (for example, inform, consult, collaborate, or coequal) is appropriate for a project and what engagement methods (for example, email lists, virtual group meetings, in-person workshops) are most conducive to facilitate that level of engagement. When coordinating with project leads on engagement plans, the first author adapted the Bamzai-Dodson and others (2021) table for congruency with scientific tool development instead of research projects. During the engagement planning process, the first author also incorporated feedback from project leads about points of confusion to inform table 3. For example, the name of the “Coequal” engagement category was originally “Empower”; however, this term clashed with realistic engagement possibilities of project teams and was changed to “Coequal,” which helped project teams more readily understand and apply this engagement level. Project leads used table 3 to brainstorm engagement strategies and design their engagement plans. Lessons learned from our interviews showed that some types of involvement (for example, “Coequal” table 3), may be more appropriate for collaborators who work on the project itself, whereas “Consult” (table 3) may be more appropriate for end-users who provide feedback based on their experience using the tool. The appropriate engagement level depends on the type of tool being created, the audience needed to contribute input, and the goals of the project team. For example, one project team focused on consulting end-users, but informing fellow experts.
[We have engaged] more of the science tech [technical] community…through traditional means, like our reviewed publications and presentations at scientific meetings where we focus more on the methodology. (Interviewee 1)
Table 3.
The engagement levels used by project leads as a guide for what activities and engagement levels to facilitate.[This table is adapted from Bamzai-Dodson and others (2021, table 1) and reflects guidance from coproduction and public participation research principles adapted for applying end-user and expert engagement in scientific tool development]
In contrast, another project team that produced an information product treated fellow experts as collaborators or coequals who were either involved in the project design or were coauthors of the final product. The experts could choose whether or not to participate.
Our other partners are all of the experts that we asked to participate, and it was an opt-in. There was no funding or anything toward them. They were helping us actually rate the risk based on the tool that we provided them and use their expert opinion. (Interviewee 3)
I was looking for folks that would be willing to work with us to do testing when it [the protocol] was ready, and to suggest different types of systems that were important. On the other end of the spectrum, coproduction and [collaboration], I wasn’t really looking for that either [because] I don’t think it made a lot of sense…I wasn’t expecting that partners would be coming into the lab alongside us to develop these sorts of things. (Interviewee 5)
In addition to asking project leads about their experiences recruiting and engaging participants, we also asked about what makes a good participant. We identified three characteristics that multiple project leads emphasized: (1) participants who provide honest, critical feedback; (2) are responsive and communicative; and (3) are tolerant of an iterative development process.
Every project has specific purposes, needs, audiences, and logistical considerations that determine the most appropriate engagement level(s) to pursue. Similar to how table 3 was used by project leads who participated in this study, table 4 can be used as a guide to consider what level(s) and type(s) of engagement are most appropriate for the identified users and experts and plan your engagement activities in tables 4 and 5.
Table 4.
A template for planning the first steps in engagement, describing the end-users and experts who could be recruited, the engagement level appropriate to each person, and recruitment strategies.[End-users and experts were recruited through a user persona exercise. Refer to figures 3 and 4 for the guidance in the user persona exercise that informed the “User and experts” column. The example of the port inspector is from figure 4]
Table 5.
A template for engaging end-users and experts in scientific tool development, with the engagement goals, activity types, frequency, follow-up actions, and types of end-users involved.[FWS, U.S. Fish and Wildlife Service; NPS, National Park Service]
Use Your Network, Boundary Spanners, and Leadership to Recruit Participants
Finding and keeping the necessary perspectives engaged was a common barrier emphasized by project leads. Overcoming this barrier is crucial for the tool’s success and building trust among participants. Representing user knowledge, needs, and priorities is similarly emphasized as a best practice for research project engagement (Reed and others, 2014). Once you are confident in your target audience(s), engagement purpose(s), and the engagement level(s) needed for each target audience, you can systematically recruit the necessary perspectives.
Your Existing Network
Social networks are an important resource for disseminating information, encouraging the adoption of new technology or tools, and recruiting collaborators (Lauber and others, 2011; Díaz-José and others, 2016). Existing contacts, whom you know, may be potential end-users or other people who may have technical expertise they can lend to your project. These contacts provide a starting point when recruiting individuals to participate in your engagement activities and provide meaningful input.
However, your existing network could be limited to the perspectives and experiences you are already familiar with. To engage all necessary perspectives, you might need to reach beyond this network.
Boundary Spanners and Leadership
Generate a list of the organizations, regional groups, meetings, conferences, and professional societies that are relevant to your product’s topic of interest. Contact leadership in the identified organizations, as well as individuals who work in the type of role that may use your product. In addition, work with leadership in your own organization to connect you with their contacts in other organizations. Although leaders or high-level managers may not be the end-users of your product, their buy-in and awareness are critical to ensure that their employees are empowered and encouraged to adopt your product.
In addition, consider who acts as a boundary spanner. A boundary spanner is a person who has the potential to link people, processes, and information among groups and organizations (Schwartz and others, 2021). For example, if your product will support research and policy related to reptile trade in the United States, the reptile and amphibian program coordinator for the Association of Fish and Wildlife Agencies may be an important boundary spanner to connect your work to State natural resource managers.
If You Still Have Gaps in Perspectives, Broaden Your Outreach
Inviting participants through existing networks may fall short of recruiting all the perspectives needed to inform your project. Similar to recruiting participants through boundary spanners, some project teams made new connections by attending events in person, where networking is often a goal of attendees. Presenting at events accomplishes several goals, including spreading awareness about the project and keeping potential end-users and other stakeholders informed. In addition, project teams may present at or host multiple events in which the audience may or may not return to participate in other engagement activities. During these events, a project team may invite audience members to sign up for future communication or engagement with a sign-up sheet or subscription link.
Our team did a ton of outreach at conferences, at meetings, at various virtual events and things like that, and out of that [outreach] we would just get a lot of people contacting us directly being like, “Hey, I want to learn more,” or, “Hey, I want to get involved,” or, “I’ve got these ideas,” or, “Would you come present to my group.” (Interviewee 7)
Those experts we identify through personal relationships, through societal participation, through publication knowledge, and then at one point we even looked through just university departments, like entomological departments or other groups, and we sent this invitation. So, a lot of them [the experts] were kind of a cold call, to be honest. (Interviewee 3)
Table 4 is a template for planning or brainstorming recruitment efforts based on the user personas outlined using figure 2.
Establish Clear Roles and Expectations for Participants
Establishing clear roles and expectations for the project teams and participants ensures effective engagement.
Identify and Meet Participants’ Expectations
A key lesson learned from our study is that by establishing clear roles and expectations, the project team can follow an agreed-upon frequency and type of communication with participants and be confident that these expectations are fulfilled. This lesson prevents participants from wondering when the project team will update participants on the project status or assuming that the project continued without their participation and feedback. Without clearly communicating what frequency or form of engagement to expect, you are more likely to fail to meet participants’ expectations.
Establishing early on what the expectation is for communication [is vital]…are they [the partner] looking for quarterly updates, annual updates, or just check-ins when you have something cool to share…having that conversation early on [about] how frequently folks want to be engaged and how they want to be engaged. (Interviewee 10)
Establish Expectations for Participants and Their Time
Participant roles can vary, from staying informed to providing feedback, contributing to the work, or being a coequal project team member. For example, a coequal project team member may be the coauthor on an information product or a staff member of a partnering organization developing one or more components of the final product. When recruiting participants, lessons learned from our study demonstrate that it is helpful, if possible, to provide and clearly articulate multiple participation options, which individuals can choose one or more of. For example, individuals may choose to stay informed by subscribing to an email list or to consult by participating in a group that meets quarterly to provide feedback on new versions of the product. When the project team is collaborating with an individual or group, the team should communicate expectations for time commitment, activities, and workload these collaborators will be responsible for. The team can communicate these expectations through an initial one-on-one or group meeting.
An effective method for recruitment and establishing clear roles and expectations was demonstrated by one project team. That project team created communication materials about specific engagement activities that varied in the time commitment expected and the purpose of the activity. The diagram shown in figure 4 illustrates the options participants could choose from. The project team initiated recruitment by sending an invitation to a one-time virtual kickoff meeting to various organizational leaders’ and boundary-spanning organizations’ email lists. During the kickoff meeting, the project team recruited participants by inviting participants to select which engagement options (discussed in fig. 4) the participants would like to be included in. For example, the participants could choose to (1) stay informed by choosing the “In the Know” group, (2) be consulted by signing up to join “Focus Groups,” or (3) collaborate by joining “Working Groups.” Participants subscribed to an email list for the chosen activity (or activities) and received subsequent announcements for meetings. The project team then shared responsibilities in facilitating the various activities.
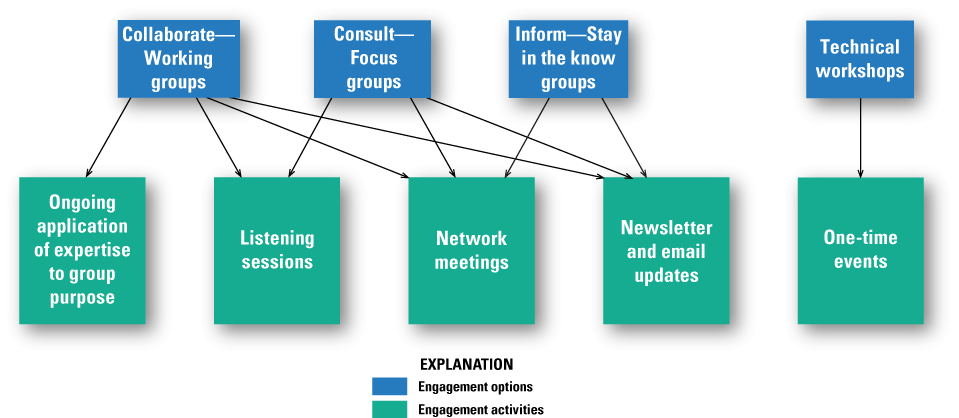
A conceptual diagram example presented to potential end-users by a web tool project team to illustrate the participants’ engagement options.
Step C—Offer Sufficient and Accessible Opportunities to Engage
This section describes methods and approaches to offer participants sufficient and accessible engagement opportunities.
Offer Different Engagement Opportunities
People vary in participation capacity as well as comfort and communication preferences. By offering different engagement opportunities, a project can accommodate diverse personalities and preferences and is more likely to hear from the perspectives that are necessary to inform the project. Engagement opportunities may include a mixture of virtual group meetings, emails, and in-person events, and varied avenues for providing input, especially in virtual group meetings. For example, when facilitating a group meeting, project teams can encourage participants to answer discussion questions by raising their hand, unmuting, posting their ideas in the chat, or brainstorming as a group anonymously on a virtual whiteboard application or in smaller breakout rooms. This encouragement ensures that participants who are less comfortable speaking up in front of the group have other options for sharing their feedback.
We had different types of roles because not everybody has a ton of time to commit…They [potential participants] might be interested, [but] they’ve got a million other things pulling them in different directions. So, we wanted to have an opportunity for people who did want to be more engaged, and an opportunity for people who could pop in and out when they had time, and an opportunity for people to just…stay in the know. That was very intentional, with having those different levels of involvement. (Interviewee 7)
One project team, working collaboratively with fellow experts to develop an information product, found that creating a collection of materials that participants can access at any time was a helpful resource for collaboration. This collection included an overview of the project, detailed written and video-recorded instructions, and related literature. Participants, especially collaborators or coequals on the project, appreciated this level of organization and accessibility.
Two project teams (one developing a scientific protocol and the other developing an information product) emphasized the benefits of customizing communication to participants’ preferences and needs when possible. For example, some participants requested one-on-one meetings to discuss specific questions that these participants felt uncomfortable asking in a group setting. Others preferred that information and files be shared as attachments in an email:
Plan Frequent and Regular Engagement Opportunities
Participants preferred more interaction as opposed to less. In our evaluation of project teams’ engagement with participants, survey respondents were consistently more likely to perceive the frequency of any given type of interaction as too little as opposed to too much. In other words, some project teams were overly worried about burdening their participants and not concerned enough about scheduling frequent and regular interaction.
Avoid Lapses in Communication as the Project Team Waits for a Significant Milestone to Share
Several project teams reflected that when time passes without interacting with their participants, the project teams are indeed working to develop the product and plan to follow up with participants only when there is a new version ready, something substantial to share, or a milestone worth reporting on. Project teams were concerned about imposing on the participants’ time each time the project teams reached out, if there was no major news. However, during this lapse in communication, participants may wonder whether they are out of the loop, the product has been finalized without any additional input from them, or the feedback they have already provided has not been incorporated. Rather than waiting for a significant update before communicating with participants, project teams should schedule frequent check-ins, either through an email list, newsletter, or group meetings.
Avoid Feeling Like an Imposition
Project teams often worry about burdening or imposing on participants with too many emails, meetings, or presentations. However, on the survey measuring participants’ perceptions of interaction frequency, very few participants chose the responses for “Too much” or “Slightly too much” interaction frequency, but many chose “Too little” or “Slightly too little” interaction frequency (fig. 5).
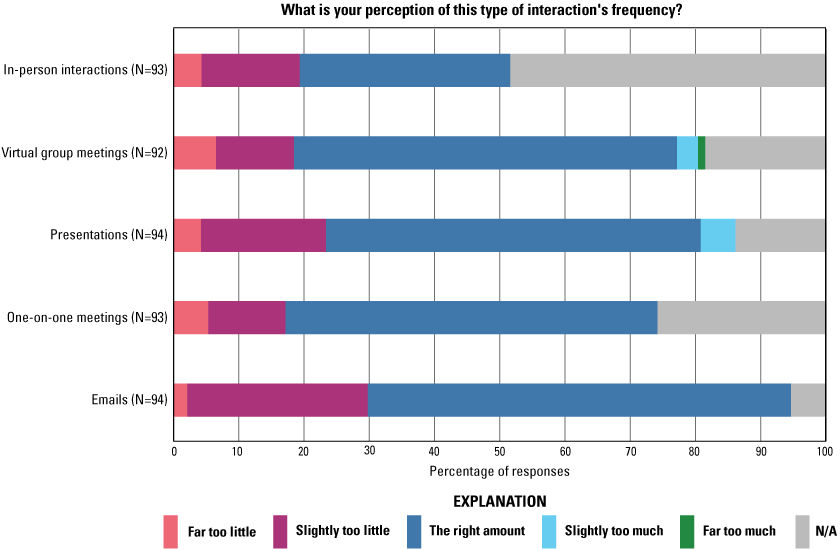
A bar graph of survey results measuring participants’ perception of the frequency of various types of interaction. These participants were engaged in projects to develop U.S. Geological Survey scientific tools. Data from Clements and Wilkins (2025). N, number of responses; N/A, not applicable.
Before seeing the survey results from their participants, one project lead explained that they believed participants were overburdened with emails and meetings:
I don’t wanna bother the person. I know every single one of them is overworked. And here, I’m gonna reach out to them and say, “Hey, I want you to do more work.” (Interviewee 9)
I should just reach out to people…[this result] totally changes my perception on that [interaction frequency]. (Interviewee 9)
Engage, engage. Engage. Don’t hesitate…[Send participants] emails. Message them. Don’t worry…don’t try to be polite…[don’t think] “Oh, I don’t want to burden you.” Burden them…they’re good. Just do it. (Interviewee 9)
For the last year and a half, I have done much less with partner engagement. For multiple reasons, one of which is that we are in the midst of executing what we had talked about…so we can go back to this group and say, “Okay, we did what we said we were gonna do.” (Interviewee 10)
One project lead, who was worried about participants feeling that the project was an imposition, saw a regular newsletter as a solution for keeping participants regularly informed. A newsletter allows people to subscribe and unsubscribe without directly contacting the project team.
But we also don’t want to bother people…So, I like the newsletter…I don’t want to flood people’s inboxes who don’t want to receive those emails. But I think with the newsletter, where you control your own subscription, that’ll make it a lot easier to be like, “Hey, there’s going to be this presentation…so please join if you’re interested.” (Interviewee 1)
Host at Least One Recurring Meeting With All Participants
When engaging participants in different ways (such as one-on-one or small group meetings, which prevents awareness of other participants), it may be helpful to host at least one recurring virtual meeting two or more times a year with all participants. If you offer other meaningful opportunities for engagement, then two may be enough, but if virtual group meetings are your primary method of engagement, then three may be needed, as noted by one project lead upon reviewing survey results:
It’s really more about staying up-to-date with what’s going on and having regularly scheduled meetings that they [participants] know that they can look forward to updates. Like maybe three times a year. I think once a year is probably too little. I think twice a year is better. (Interviewee 2)
A virtual meeting, instead of an in-person meeting, ensures access across budgets, schedules, and a general capacity to travel. At virtual meetings, all participants receive the same information at one time and are sufficiently aware of project updates. An important aspect of end-users’ trust in the project team and trust in the quality of the final product is knowing that the necessary perspectives are engaged in the project. Recurring large group meetings provide a transparent mechanism to show the breadth of perspectives involved. Additionally, large group meetings can be an opportunity for participants to hear the perspectives of others who may have diverging views on the final product and explore mutually agreeable solutions.
I think the challenge really is that you have all these individuals with their own perspectives and their own thoughts on [a topic] that sometimes the information you get contradicts [information from other individuals], so you’re really left in a “Where do I go from here?” [quandary]. (Interviewee 8)
In addition, reflect on how engagement varies across groups. If you invest a lot of time and energy into outreach and engagement, such as presenting at conferences and facilitating meetings, consider how frequently or consistently you interact with the same individuals or groups. Project teams sometimes feel as though a lot was invested into engagement activities, but then receive feedback that engagement has been inconsistent, because those activities were not all with the same group of people, or the same people were not able to attend all interactions. Consistent interaction with the same participants ensures that participants feel in the loop and have opportunities to provide feedback at the right times in the project.
Step D—Make Engagement Activities Meaningful
This section describes methods and approaches to make engagement activities meaningful.
Explore Use Cases with Your End-Users
Scientific protocol and web tools can benefit from this method. One of the most meaningful forms of engagement for scientific protocol and web tools, noted by multiple project teams, is working one-on-one with end-users to understand the challenges in their work and how a product can overcome those challenges or improve efficacy and efficiency. Understanding use cases typically requires one-on-one or small group interactions in which you ask the end-user questions about how they currently perform their job functions and how your product may support their work. Additionally, once you have a product for the end-user to test, you can then ask how the product is used, why the tool is needed, what features of the product are most useful, and how the product could be improved. This information complements and confirms lessons learned reported by Stoltz and others (2023): defining metrics of success, analyzing tool use trends, and understanding user experiences are key steps for developing an empirical understanding of the use and usability for decision-support tools.
For web tools in particular, virtual interactions, as opposed to in-person interactions, can be used to understand use cases. Project teams creating web tools note the importance of learning how individual end-users use the tool, including uses that the project team had not considered. One project lead working on a web tool emphasized the benefits of individual narratives about how the tool is used:
I think the most meaningful [information] is really when folks are like, “Here’s how we’re using the tool,” because you’re not gonna know that until somebody tells you. (Interviewee 2)
If you are creating a scientific protocol or kit for use in a laboratory or in the field, in-person site visits (in which you demonstrate, train, or allow the end-user to test out the product) are a critical step toward creating a useful product. This form of engagement allows the end-user to learn how to apply the product to their work and encourages early adoption, while you learn firsthand what assumptions you have made about use cases and how the protocol needs to be revised. One project lead, developing a scientific protocol, emphasized that exploring use cases on site with end-users was critical to the product development:
In-person trainings—it’s been a lot. It’s taken a lot of time, but I don’t think…there’s a better way to go about it. Yeah, you could make a video or do something virtually. But it’s not the same…I’ve learned a lot myself going out on these site visits. I’ve learned how to better train on these, but also, things get brought up that I may not have thought of. Or I make assumptions about how they’re [end-users] going to use it [the product] or what places they’re going to sample and how well it’s going to work and find—Oh yeah, if we’re going to be on a boat, maybe we need to make this part a little easier—That kind of stuff, so almost logistical stuff…I don’t think there’s been a time when I’ve gone out that I haven’t gone back with a slight tweaking of some aspect of how I’m thinking. (Interviewee 5)
Facilitate Activities Where Participants Feel Comfortable Sharing Their Feedback
Trust is a requisite for knowledge exchange. Meadow and others (2015, p. 187) describe convening as one approach to trust-building: “the process of bringing parties together for face-to-face contact; this [process] forms the foundation for relationships of trust and mutual respect.” In the present study, project leads noted that participants vary in their preferences and willingness to speak up, especially in larger groups or among peers. One project lead discussed the interaction types in their participant group:
I think because it’s such a diverse group and people don’t know each other, there’s probably hesitancy to speak up. So, a lot of the one-on-ones were probably the most meaningful [interaction]. (Interviewee 3)
Activities can build trust among participants, increase participation, and generate more diverse, comprehensive input. Activities identified by project teams that nurture comfort among the individuals in participant groups include virtual web tools, small group discussions, and in-person, informal interactions. You may also customize how you communicate with individual participants based on their requests. Making participants comfortable encourages participation and critical feedback:
What really sticks with me for the in-person workshops and for actual trust building—it’s more the time you spend outside of the meeting [that is important]. What was really critical for the success of that meeting was folks being able to go out to dinner, go on runs together, go on walks…And it was, more, building social networks that then allow folks to be a little bit more open, less guarded, when you’re actually doing the workshop activities…the [brainstorming] activity was fantastic, but one of the reasons why it was fantastic is because folks had spent a day and a half together in an awesome place, getting to know each other first, and then they were able to just throw out random ideas and care less whether it was a good idea, a bad idea, because they had trust with one another. (Interviewee 10)
Some of the ones that stand out in my mind are when people totally just shoot down our ideas…because I think that’s honest. I think it takes a level of comfort for somebody to feel like, “Yeah, I’m not just going to go along with this.” So, I think when that happens, it’s like, “Oh, we’re connecting right now”…like [when people say] “Sure, but I can already do it this other way.” Cool. Thank you. Don’t waste my time, and I won’t waste yours. (Interviewee 7)
Step E—Facilitate Interactive Meetings
This section describes methods and approaches to facilitate interactive meetings.
Request Feedback Directly from End-Users
A common practice in the scientific field is to invest heavily in the “Inform” engagement level (in other words, one-way direction of communication; Beier and others, 2017). Types of interactions that accomplish this engagement level often include presentations about, plans for, updates on, or results of scientific work, followed by time for questions. However, this format does not foster two-way interaction and limits meaningful knowledge exchange among end-users and project leads. It can also create a power imbalance between those doing the science and those using the science by leaving little room for those using the science to have a voice in the project’s purpose, design, content, or final product. Though “Inform” might be the appropriate engagement level in some situations, developing scientific tools to empower the end-users requires a two-way interaction directly with end-users. One project lead emphasized that direct interaction with end-users ensures that end-users’ needs are met and end-users continue to be involved:
That would be my advice, that it’s that really direct engagement and back and forth, particularly if the partner’s having issues or they need some additional [equipment] or something. Just trying to be really responsive to that and keep their momentum going, because if they [project leads] kind of stop and there’s a big gap, [partners are] probably going to lose interest. You probably lost that partner. (Interviewee 5)
Project leads in this study recognized that there is more to engagement than just sharing information or marketing your project. Interactions must be facilitated in a way that fosters the exchange of ideas and knowledge and generates input directly from the end-user on the final product. One project lead reflected that encouraging feedback requires more than just presentations and answering questions:
A lot of our meetings started out with a little bit more presentation style and Q&A [questions and answers]. And, you know, Q&A seemed like engagement. But it’s also not, because you’re going to hear the same voices over and over, which, what they have to say is important, but it’s not the only voice and opinion that’s out there. And we wanted to find ways that could get the whole meeting engaged with those people who aren’t going to raise their hands in a meeting and speak up. (Interviewee 7)
Project teams requested feedback directly from end-users through various interactions, exercises, and virtual meeting tools. Complete lists of these activities are in appendixes 1, 2, and 3. The following are several examples of these activities:
-
• One project team developing a scientific tool facilitated a meaningful in-person activity (though this activity can also be facilitated virtually using virtual whiteboards) called the “MoSCoW” (must-have, should-have, could-have, and won’t-have) exercise (Vijayakumar and others, 2024). In the technological sector, MoSCoW is a well-established exercise that asks end-users to brainstorm what a product must have, should have, could have, and won’t have. Notably, the project lead emphasized that part of why the exercise was so successful was that before the activity began, the participants spent several days in informal sessions together in person, including sharing meals or visiting local attractions. The feedback generated through this exercise from end-users ultimately informed the specifications and functionality of a piece of technology needed to perform the scientific protocol.
-
• Another project team developing an information protocol facilitated one-on-one meetings in which the project team guided the end-user through the drafted product and asked for specific feedback on the content, language, and presentation of the information.
-
• A project team developing a web tool facilitated meetings with end-users in which the project team presented new features and updates and then prompted participants with topics and questions for discussion using a virtual whiteboard that easily facilitated the exchange of ideas.
-
• Finally, two project leads working on the same information product struggled with generating feedback from participants during one-on-one meetings. Both project leads noted that preparing a set of questions targeted at what the project leads needed to know to inform their product, to guide these meetings, may have generated meaningful feedback.
Clearly Articulate How Feedback Was Integrated into the Product
Our study found that communicating to participants how their input was used or considered to design the product is critical to the success of project engagement and, ultimately, product success. Be intentional about showing that you heard the participant’s feedback and how you have incorporated that feedback into the product, or why you chose not to. This guidance is an essential step to ensure that participants trust the team, feel heard, and are invested in a tool that they themselves helped design to be useful to their work. This guidance can be done first by sending follow-up emails after meetings summarizing the feedback you received, and second by presenting (in the following meeting) the specific additions and revisions the team made to the web tool based on each piece of feedback. Making participants feel heard and showing how feedback is incorporated may take time, but creates a feedback loop that end-users learn to trust and stay engaged in.
I’m always an advocate of follow-up emails after meetings, letting folks know what our big takeaways were from what folks had to contribute…I think it’s a good way to connect with folks and let them know that they’re being heard. (Interviewee 2)
They got to actually see an advanced prototype of the [tool] that they had given guidance on the previous year, so they actually got to see it and try to operate it. So, that was really cool to see, because they felt some ownership of it, since they had provided some of the design specifications…Because they were involved in the creation of this [tool], when they did see it about 6 or 7 months later, their excitement and support and enthusiasm [were apparent], because it’s cool tech, but also because they felt that they contributed to it. So that’s been—I think—one of the highlights. (Interviewee 10)
Make the Most of Virtual Meetings and Meeting Tools
Web tools and information products can benefit from this method. Our interviewees noted that facilitating group interaction and using virtual meeting tools can make virtual meetings as meaningful as possible. Although project teams included in our study often found in-person interactions to be the most meaningful, virtual engagement was also an opportunity to engage many people across a large geographic area without the costs associated with in-person meetings and events. Furthermore, many tools and techniques can increase engagement and interaction during virtual meetings. Using virtual meetings to your advantage is especially relevant for web tools and information products but can be applied to scientific protocols and group discussions. Scientific protocols are more reliant on in-person interaction to test the protocols in the field, whereas information products and web tools can easily be accessed, tested, and discussed through virtual interactions.
Virtual interactions can include perspectives from people who otherwise would not have the capacity to travel for in-person meetings:
With COVID [coronavirus disease 2019], we shifted to more of a virtual way of doing things, and that seems to have worked out because it allows us to have more people from all across the country engaged than if we did something where people had to travel. (Interviewee 6)
Given the national extent of the data coverage, it’s harder to have an in-person thing that is inclusive of the disparate potential users. (Interviewee 2)
I always prefer in-person interactions…But I have been pleasantly surprised with some of the changes that we’ve made and how we interact virtually and make it more…of a group effort rather than just a presentation…Since the nature of this work is spread across the whole nation, you can’t be in person everywhere, all the time. And I think that virtual engagement has opened up the opportunities [so] that when we are there in person, we can actually make the most of it in person. (Interviewee 7)
Virtual Whiteboard Applications
Our findings show that offering multiple ways for participants to share ideas increases the utility of virtual meetings. One project lead noted that encouraging several ways to share feedback within one virtual meeting increases participation, for example, by using a virtual whiteboard or website that allows participants to interact and collaborate, meeting chats, and verbal discussion:
We can have that piece, as well as the chat, as well as verbal discussion. So, we can get feedback, kind of, from those three different pieces. And I feel like we end up getting valuable pieces of information from all three. (Interviewee 1)
[This virtual whiteboard software] is most recently what we landed on that helped. That was the one that checked a lot of those boxes, and it’s cool because people can write out an idea. And then, other people can comment on that idea and thumbs-up it if they agree with it, or [say] like, “Yep, me too.” And so, it has this built-in discussion ability. (Interviewee 7)
We tried [a meeting polling application], but it was less flexible, even in the number of questions you could post. It’s nice with [the application], ’cause we could have different options that people could upvote or downvote, but then they can also add their own suggestions. (Interviewee 1)
Project leads perceived that virtual whiteboard software was the most useful because of the following features:
-
• The participant could access the whiteboard easily without needing to create an account.
-
• The participant could add to the whiteboard anonymously, which encouraged honest feedback and input from quiet participants.
-
• The whiteboard was designed in a way that generated interaction among participants, not just answers to questions. For example, the project team could start with several written prompts, which participants could respond to, but participants could also create their own prompts, respond to each other’s comments, and react to posts on the whiteboard with a thumbs-up.
Virtual whiteboards enabled meaningful engagement that made participants comfortable sharing ideas more openly, encouraged interaction among participants, and promoted knowledge exchange. Table 5 can be used to plan engagement activities to meet your goals, including the types and frequency of activities, follow-up actions, and the perspectives you seek to involve. Table 5 is adapted from a similar table that the project teams used in the present study to plan their own engagement.
Avoid Common Pitfalls—Challenges to Facilitating Effective Engagement
This section describes challenges and how to avoid common pitfalls when engaging end-users and experts. This guidance can apply to any step of the engagement process.
Send Regular Updates About the Project
Project teams often worry about imposing on participants’ time with meetings or email updates. However, based on survey results, it is far more common for a participant to perceive a type of interaction as not frequent enough as opposed to too frequent. “I don’t wanna bother the person. I know every single one of them is overworked.” (Interviewee 9)
Find and Engage Participants with the Necessary Perspectives
Engaging the necessary perspectives was one of the primary challenges noted by project teams, regardless of whether project teams are seeking to recruit end-users or experts. The perception that not all necessary perspectives were included was occasionally reflected in survey feedback from participants (for full survey data, refer to Clements and Wilkins, 2025). Respondents indicated more disagreement with the statement “The project team is engaging partners with the necessary subject matter expertise and management perspectives to inform the project” compared to the statements “The project team has provided me with sufficient opportunities to provide feedback about the project” and “I trust that the project team has considered the feedback I have given.”
Project teams described the challenge of knowing who to invite and engage, getting participants to engage despite the many demands on their time, keeping participants engaged, and facing turnover if participants leave their role and there are no obvious replacements to represent those participants’ organization or perspective.
Narrow the Scope of Engagement When Necessary
Because a product is meant for scientists and resource managers across an entire country and disciplines, there is not one specific geographic area or group to engage. The size of the potential audience can make the task of engaging every potential end-user overwhelming.
It’s a really broad geographic area, and it’s really hard to find that balance between we could spend every single waking moment on engagement, but we also need to produce results…It’s really hard to find that balance between engagement and doing [development]. Especially on such a broad scale. (Interviewee 7)
Accommodate Varying Participation Capacities of End-Users
Ideally, a project team recruits a representative of each type of end-user or expert to participate in engagement activities. However, the capacity (in other words, time, resources, and personnel) to participate varies across sectors, organizations, and individuals. This inevitably causes some perspectives to be scarce or absent from engagement and feedback.
A lot of times, we’re in essence kind of cold-calling people, right. And you want to give them a little bit of information about what you’re trying to accomplish, but they’re busy, and you’re actually asking for upwards [of] an hour or more of their time. And sometimes you’re not the priority…You start off with a list of 50 people, and you end up with only 10 that are willing to give you that hour. (Interviewee 9)
Plan for Policy and Technological Limitations
There are various policy and technological limitations that could be considered. For example, file sharing is a challenge noted consistently by project teams working within a government agency. File sharing using applications such as Microsoft Teams and SharePoint is a way to gather feedback and collaborate on project planning and documents. However, when file sharing using these platforms is not possible, this lack creates a major barrier to end-user engagement. “It’s frustrating, because it [not being able to share files] makes it difficult to do my job” (Interviewee 6).
The first author, when assisting in engagement coordination, found that file sharing outside a government bureau is usually possible, though you may not be able to use your first choice of a file-sharing platform. To resolve the issue, you can work internally with agency communications and technology support to set up collaborative platforms that allow file sharing outside of your organization.
Limitations on Federal employees collecting information from the public, meant to prevent burdensome paperwork for Americans, sometimes also prevent meaningful and diverse avenues by which Federal staff can gather input on their products from end-users. The primary policy that limits information collection is the Paperwork Reduction Act of 1995 (PRA; 44 U.S.C. § 3501 et seq.). The PRA stipulates that a Federal employee must submit information requests, such as surveys, for review by the Office of Management and Budget if the employee will collect information from more than nine individuals who are not Federal employees. This approval process can last a long time, at which point the project team would ideally have already engaged end-users in codesign, testing, or feedback on the product. Some exceptions and clearances may apply, such as for usability testing (White House, 2010). More than one project lead expressed the challenge of abiding by the PRA and facilitating effective engagement:
PRA has everybody very concerned…it does present…a challenge for engagement, for sure. And so, trying to walk that line between true meaningful engagement and not crossing legal lines is a struggle…[PRA] is a barrier for actual meaningful engagement, especially when we’re trying to engage outside of the Federal family, which is the goal. (Interviewee 7)
This sentiment mirrors barriers identified by Stoltz and others (2023) because the PRA prevents quicker and more reliable avenues to collect feedback. While one-on-one and group discussions through virtual or in-person meetings are helpful, when a product has a large audience and is not geographically limited, it is impossible to meet every potential user throughout a large geographic region, such as the United States. Additionally, meetings rarely accommodate every participant’s schedule, and not all meeting participants who do attend are comfortable speaking up; some participants would prefer to share their opinion anonymously. Therefore, an anonymous, written, asynchronous avenue for feedback, such as a survey, can serve as a beneficial and complementary form of engagement to supplement other discussions. Thus, participants with a busy schedule or who are uncomfortable speaking up during meetings can respond to a survey on their own time and with their personal identity concealed.
To collect information using a survey when working in a Federal agency, you can explore the approval process for information collection instruments and contact your agency’s information collection officer.
Discussion
Scientists and tool creators understand the value of engaging end-users and experts in the development of scientific tools (Pearman and Cravens, 2022); however, inexperience among researchers and a lack of clear guidance on how to effectively do so can hinder researchers’ engagement efforts (Meadow and others, 2015). Frameworks and best practices for end-user engagement and coproduction point to many goals and indicators of successful engagement, such as building trust (Meadow and others, 2015), providing equitable opportunities for engagement (Wall and others, 2017), and engaging participants at the right time and through the appropriate engagement level (Wall and others, 2017; Bamzai-Dodson and others, 2021). Our study contributes to this body of literature by providing lessons learned that suggest specific exercises and actions project teams can apply to accomplish these goals, with insights articulated directly from project leads.
Our research addresses a need for more information on the engagement processes, communications, and facilitations that support the coproduction of actionable science (Gerlak and others, 2023). By compiling lessons learned directly from tool creators based on participants’ feedback, we present practical lessons learned for future scientists to incorporate into engagement processes. Several of the lessons learned are not emphasized in previous literature, including facilitating engagement activities that make participants feel comfortable sharing their feedback (especially in group settings) and not allowing the fear of imposing on participants’ time to prevent regular communication about the project. Other lessons confirm or build on previous studies’ recommendations, including applying processes such as human-centered design to thoughtfully consider how a tool may be used, engaging participants in the conceptualization of the tool even when addressing uncertainty is challenging, and testing the tool alongside end-users to learn where improvements to the tool are needed. The project leads’ reflections and quotations are meant to encourage adoption of these principles intentionally through the specific exercises, resources, and steps described throughout the guide. One topic that our report does not address completely is how to ensure long-term use of scientific tools and engagement in their continued development and adaptation (for example, continued use in five or ten years). We recommend consulting Stoltz and others (2023) for lessons learned on this important topic.
Summary
This research documents lessons learned from six projects that designed and implemented engagement activities with end-users and experts to coproduce scientific tools for natural resource managers. We used qualitative interviews to understand the detailed experiences of six project teams, and surveys to understand the perceptions of participants engaged in the projects. We described five broad steps and strategies for each step: (a) setting engagement up for success, (b) engaging the necessary perspectives, (c) offering sufficient and accessible opportunities to engage, (d) making engagement activities meaningful, and (e) facilitating interactive meetings. The engagement strategies described in this guide can be helpful to many scientific projects beyond the development of scientific tools.
References Cited
Bamzai-Dodson, A., Cravens, A.E., Wade, A.A., and McPherson, R.A., 2021, Engaging with stakeholders to produce actionable science—A framework and guidance: Weather, Climate, and Society, v. 13, no. 4, p. 1027–1041, accessed March 4, 2025, at https://doi.org/10.1175/WCAS-D-21-0046.1.
Bamzai-Dodson, A., and McPherson, R.A., 2022, When do climate services achieve societal impact? Evaluations of actionable climate adaptation science: Sustainability, v. 14, no. 21, article 14026, 14 p., accessed March 3, 2025, at https://doi.org/10.3390/su142114026.
Beier, P., Hansen, L.J., Helbrecht, L., and Behar, D., 2017, A how‐to guide for coproduction of actionable science: Conservation Letters, v. 10, no. 3, p. 288–296, accessed February 3, 2025, at https://doi.org/10.1111/conl.12300.
Braun, V., and Clarke, V., 2006, Using thematic analysis in psychology: Qualitative Research in Psychology, v. 3, no. 2, p. 77–101, accessed February 5, 2025, at https://doi.org/10.1191/1478088706qp063oa.
Clements, K.R., and Wilkins, E.J., 2025, Survey responses collected in 2024 measuring end-users’ and experts’ experiences being engaged in development of scientific tools: U.S. Geological Survey data release, accessed September 15, 2025, at https://doi.org/10.5066/P13TZJ7B.
Consortium for Public Education, 2025, Human-centered design resources (HCD): Consortium for Public Education website, accessed March 7, 2025, at https://www.theconsortiumforpubliceducation.org/resource/human-centered-design-resources/.
Cvitanovic, C., Howden, M., Colvin, R.M., Norström, A., Meadow, A.M., and Addison, P.F.E., 2019, Maximising the benefits of participatory climate adaptation research by understanding and managing the associated challenges and risks: Environmental Science & Policy, v. 94, p. 20–31, accessed March 7, 2025, at https://doi.org/10.1016/j.envsci.2018.12.028.
Davidson, S., 1998, Spinning the wheel of empowerment: Planning, v. 1262, no. 3, p. 14–15. [Also available at https://sarkissian.com.au/wp-content/uploads/sites/13/2009/06/Davidson-Spinning-wheel-article1998.pdf.]
Díaz-José, J., Rendón-Medel, R., Govaerts, B., Aguilar-Ávila, J., and Muñoz-Rodriguez, M., 2016, Innovation diffusion in conservation agriculture—A network approach: European Journal of Development Research, v. 28, p. 314–329, accessed February 5, 2025, at https://doi.org/10.1057/ejdr.2015.9.
Dillman, D.A., Smyth, J.D., and Christian, L.M., 2014, Internet, phone, mail, and mixed-mode surveys—The tailored design method: Hoboken, N.J., John Wiley & Sons, 524 p., accessed February 3, 2025, at https://doi.org/10.1002/9781394260645.
Geoffrion, A.M., 1983, Can MS/OR evolve fast enough?: Interfaces, v. 13, no. 1, p. 10–25, accessed March 3, 2025, at https://doi.org/10.1287/inte.13.1.10.
Gerlak, A.K., Guido, Z., Owen, G., McGoffin, M.S.R., Louder, E., Davies, J., Smith, K.J., Zimmer, A., Murveit, A.M., Meadow, A., Shrestha, P., and Joshi, N., 2023, Stakeholder engagement in the co-production of knowledge for environmental decision-making: World Development, v. 170, article 106336, accessed March 3, 2025, at https://doi.org/10.1016/j.worlddev.2023.106336.
IDEO.org, 2015, The field guide to human-centered design (1st ed.): Canada, IDEO.org, 189 p., accessed March 7, 2025, at https://www.designkit.org/resources/1.html.
Interaction Design Foundation, 2016, User centered design (UCD): Interaction Design Foundation web page, accessed March 7, 2025, at https://www.interaction-design.org/literature/topics/user-centered-design.
Lauber, T.B., Stedman, R.C., Decker, D.J., Knuth, B.A., and Simon, C.N., 2011, Social network dynamics in collaborative conservation: Human Dimensions of Wildlife, v. 16, no. 4, p. 259–272, accessed February 5, 2025, at https://doi.org/10.1080/10871209.2011.542556.
Lavallee, D.C., Williams, C.J., Tambor, E.S., and Deverka, P.A., 2012, Stakeholder engagement in comparative effectiveness research—How will we measure success?: Journal of Comparative Effectiveness Research, v. 1, no. 5, p. 397–407, accessed March 4, 2025, at https://doi.org/10.2217/cer.12.44.
Margules, C., Boedhihartono, A.K., Langston, J.D., Riggs, R.A., Sari, D.A., Sarkar, S., Sayer, J.A., Supriatna, J., and Winarni, N.L., 2020, Transdisciplinary science for improved conservation outcomes: Environmental Conservation, v. 47, no. 4, p. 224–233, accessed March 5, 2025, at https://doi.org/10.1017/S0376892920000338.
Meadow, A.M., Ferguson, D.B., Guido, Z., Horangic, A., Owen, G., and Wall, T., 2015, Moving toward the deliberate coproduction of climate science knowledge: Weather, Climate, and Society, v. 7, no. 2, p. 179–191, accessed March 5, 2025, at https://doi.org/10.1175/WCAS-D-14-00050.1.
Meadow, A.M. and Owen, G., 2021, Planning and evaluating the societal impacts of Climate Change Research Project—A guidebook for natural and physical scientists looking to make a difference: The University of Arizona, 51 p., accessed September 10, 2025, at https://doi.org/10.2458/10150.658313.
Miaskiewicz, T., and Kozar, K.A., 2011, Personas and user-centered design—How can personas benefit product design processes?: Design Studies, v. 32, no. 5, p. 417–430, accessed March 5, 2025, at https://doi.org/10.1016/j.destud.2011.03.003.
Morelli, T.L., Brown-Lima, C.J., Allen, J.M., Beaury, E.M., Fusco, E.J., Barker-Plotkin, A., Laginhas, B.B., Quirion, B.R., Griffin, B., McLaughlin, B., Munro, L., Olmstead, N., Richburg, J., and Bradley, B.A., 2021, Translational invasion ecology—Bridging research and practice to address one of the greatest threats to biodiversity: Biological Invasions, v. 23, p. 3323–3335, accessed February 4, 2025, at https://doi.org/10.1007/s10530-021-02584-7.
Parkins, J.R., and Mitchell, R.E., 2005, Public participation as public debate—A deliberative turn in natural resource management: Society and Natural Resources, v. 18, no. 6, p. 529–540, accessed March 3, 2025, at https://doi.org/10.1080/08941920590947977.
Pearman, O., and Cravens, A.E., 2022, Institutional barriers to actionable science—Perspectives from decision support tool creators: Environmental Science and Policy, v. 128, p. 317–325, accessed March 3, 2025, at https://doi.org/10.1016/j.envsci.2021.12.004.
Ray, K.N., and Miller, E., 2017, Strengthening stakeholder-engaged research and research on stakeholder engagement: Journal of Comparative Effectiveness Research, v. 6, no. 4, p. 375–389, accessed March 5, 2025, at https://doi.org/10.2217/cer-2016-0096.
Reed, M.S., 2008, Stakeholder participation for environmental management—A literature review: Biological Conservation, v. 141, no. 10, p. 2417–2431, accessed March 5, 2025, at https://doi.org/10.1016/j.biocon.2008.07.014.
Reed, M.S., Stringer, L.C., Fazey, I., Evely, A.C., and Kruijsen, J.H.J., 2014, Five principles for the practice of knowledge exchange in environmental management: Journal of Environmental Management, v. 146, p. 337–345, accessed February 4, 2025, at https://doi.org/10.1016/j.jenvman.2014.07.021.
Reed, M.S., Vella, S., Challies, E., Vente, J. de, Frewer, L., Hohenwallner‐Ries, D., Huber, T., Neumann, R.K., Oughton, E.A., Ceno, J.S. del, and Delden, H. van, 2018, A theory of participation—What makes stakeholder and public engagement in environmental management work?: Restoration Ecology, v. 26, no. S1, p. S7–S17, accessed February 3, 2025, at https://doi.org/10.1111/rec.12541.
Schlesinger, W.H., 2010, Translational ecology: Science, v. 329, no. 5992, p. 609, accessed February 4, 2025, at https://doi.org/10.1126/science.1195624.
Schusler, T.M., Decker, D.J., and Pfeffer, M.J., 2003, Social learning for collaborative natural resource management: Society and Natural Resources, v. 16, no. 4, p. 309–326, accessed February 3, 2025, at https://doi.org/10.1080/08941920390178874.
Schwartz, M.W., Fleishman, E., Williamson, M.A., Williams, J.N., and Morelli, T.L., 2021, The use of boundary-spanning organizations to bridge the knowledge-action gap in North America, chap. 9 of Ferreira, C.C., Klütsch, C.F.C., eds, Closing the knowledge-implementation gap in conservation science—Interdisciplinary evidence transfer across sectors and spatiotemporal scales, v. 4 of Arroyo Lopez, B., Garcia Gonzalez, J., Soria, R.M., eds., Wildlife Research Monographs: Cham, Switzerland, Springer Nature Switzerland AG, p. 229–254, accessed February 2025 at https://doi.org/10.1007/978-3-030-81085-6_9.
Steger, C., Klein, J.A., Reid, R.S., Lavorel, S., Tucker, C., Hopping, K.A., Marchant, R., Teel, T., Cuni-Sanchez, A., Dorji, T., Greenwood, G., Huber, R., Kassam, K-A., Kreuer, D., Nolin, A., Russell, A., Sharp, J.L., Hribar, M.Š., Thorn, J.P.R., Grant, G., Mahdi, M., Moreno, M., and Waiswa, D., 2021, Science with society—Evidence-based guidance for best practices in environmental transdisciplinary work: Global Environmental Change, v. 68, article 102240, 15 p., accessed February 5, 2025, at https://doi.org/10.1016/j.gloenvcha.2021.102240.
Stoltz, A.D., Cravens, A.E., Herman-Mercer, N.M., and Hou, C.Y., 2023, So, you want to build a decision-support tool? Assessing successes, barriers, and lessons learned for tool design and development: U.S. Geological Survey Scientific Investigations Report 2023–5076, 32 p., accessed September 10, 2025, at https://doi.org/10.3133/sir20235076.
U.S. General Services Administration, [2037], Human-centered design guide series: U.S. General Services web page, accessed March 7, 2025, at https://digital.gov/guides/hcd/.
U.S. Geological Survey [USGS], [2037], Who we are: U.S. Geological Survey web page, accessed March 7, 2025, at https://www.usgs.gov/about/about-us/who-we-are.
Vijayakumar, S., Prasad K.K., Holla M.R., 2024, Assessing the effectiveness of MoSCoW prioritization in software development—A holistic analysis across methodologies: EAI Endorsed Transactions on Internet of Things, v. 10, 9 p., accessed February 4, 2025, at https://doi.org/10.4108/eetiot.6515.
Wall, T.U., Meadow, A.M., and Horganic, A., 2017, Developing evaluation indicators to improve the process of coproducing usable climate science: Weather, Climate, and Society, v. 9, no. 1, p. 95–107, accessed February 4, 2025, at https://doi.org/10.1175/WCAS-D-16-0008.1.
White House, 2010, Memorandum for the heads of executive departments and agencies and independent regulatory agencies: White House, Executive Office of the President, accessed March 7, 2025, at https://obamawhitehouse.archives.gov/sites/default/files/omb/assets/inforeg/SocialMediaGuidance_04072010.pdf.
Wilkins, K., Pejchar, L., Carroll, S.L., Jones, M.S., Walker, S.E., Shinbrot, X.A., Huayhuaca, C., Fernández-Giménez, M.E., and Reid, R.S., 2021, Collaborative conservation in the United States—A review of motivations, goals, and outcomes: Biological Conservation, v. 259, article 109165, accessed March 5, 2025, at https://doi.org/10.1016/j.biocon.2021.109165.
Glossary
- boundary spanner
A person who has the potential to link people, processes, and information among groups and organizations.
- coproduction
A process in which researchers and stakeholders work together to produce science useful for decision making.
- decision-support tool
Software systems or processes that assist the user in solving complex problems by producing decision-relevant information
- end-user
The person who directly interacts with a scientific tool and uses the knowledge from the tool to inform their work.
- expert
A person with subject matter expertise in the content, method, or scientific discipline upon which a scientific tool is based.
- information product
Static information providing general guidance about scientific topics, methods, or findings that answers a specific research question for on-the-ground applications. These products can be web-based or more traditional scientific reports or journal articles.
- participant
A person who participates in engagement activities facilitated by the project team. Participants can be end-users of the project, topical experts, and others who have a vested interest in the final product.
- partner
A term often used by project leads to describe project participants.
- practitioner
A professional (such as a natural resource manager) who applies scientific information to decision making.
- project lead
The person, typically a scientist, who is the primary decisionmaker or point of contact for a project.
- project team
The people, typically scientists, who are developing a scientific tool.
- scientific protocol
A scientific tool that provides instructive, step-by-step guidance for specific methods of data collection, analysis, or interpretation. Scientific protocols may include technology, machines, or physical equipment.
- scientific tool
Web tools, scientific protocols, or information products that support research or inform decisions for a natural resource management issue, often used across geographies.
- use case
How a scientific tool is or can be used to achieve an end-user’s goal.
- user persona
User personas are fictional characters based on researching and understanding potential end-users of a product.
- web tool
A scientific tool that has a web-based interface (with one or more components), which the user interacts with to learn or create new information. Web tools include web-based decision-support tools.
Appendix 1. Lessons Learned from Engaging in Web-Tool Development
Web Tool Example 1
An overview of web tool example 1 is provided in Box 1.1.
Box 1.1. Summary of Web Tool Example 1
Summary of lessons learned identified in interviews with two project leads about engaging end-users and experts (collectively referred to as participants) in the development of scientific web tool 1 and reflecting on participants’ survey feedback.
-
• Product: Web-based decision-support tool that produces maps based on species distribution models
-
• Number of participants at the time of the survey: 40
-
• Engagement Activities: Large virtual group meetings, virtual or in-person presentations at regional or national meetings, one-on-one meetings with users, and a newsletter
-
• Lessons Learned:
-
o Engage end-users during conceptualization.
-
o Recruit participants through existing networks, boundary spanners, and leadership.
-
o Consider the wide range of potential use cases for the tool when recruiting—The impetus for this project was a request directly from end-users. However, the project team may have been more successful in testing the web tool and recruiting an inclusive group of participants if the project team had thought more carefully about the wide range of potential tool users.
-
o Strategically attend events to recruit new end-users of the tool—or learn about existing users’ experience with the tool
-
o Meetings should be regular but still have a purpose—For example, two times a year seems like too little to some participants, but three times would likely suffice. It can be challenging to keep regular meetings and time meetings to occur after a new version or update is launched for the web tool. A newsletter may keep participants informed in case participants miss a meeting or while end-users wait for new versions of the product.
-
o Clearly articulating how previous feedback has been integrated—how feedback has been integrated into the product ensures trust in the project team and makes participants feel heard.
-
o During meetings, offer multiple avenues for feedback—including group discussion, comments in the chat, and interaction through virtual whiteboards.
-
o The most effective virtual whiteboard tools—The best tools do not require an account, allow anonymous access, and have features that generate interaction between participants, not just answers to questions.
-
o Use cases of the web tool are key for the project team to understand opportunities to improve the tool—These use cases may include accompanying an end-user into the field or observing how end-users use the tool so that the project team can understand firsthand how the tool is used and how it can be improved. These cases often reveal opportunities and challenges that the team otherwise would not have discovered.
-
Web Tool Example 1—What is the Product?
This project created a desktop-optimized web-based decision-support tool. The tool creates maps that identify specific areas of the landscape for managers to focus their activities on. The tool delivers products derived from species-distribution model outputs for species that the user selects. Manager input drives the underlying parameters of the model to make the final outputs useful in making decisions.
Web Tool Example 1—How Did the Project Team Recruit Participants?
The initial concept for the project was codeveloped in conversations among U.S. Geological Survey scientists with expertise in species distribution modeling and partners at another Department of the Interior (DOI) bureau who expressed a need for the tool. Staff from the other bureau helped conceptualize the tool then served as boundary spanners; the staff connected the project team with additional resource managers who could provide experiential knowledge to inform the purpose and design of the tool. Subsequently, the project team began inviting other on-the-ground managers working on similar issues to participate in group discussions and tool conceptualization. The team also spoke with national leads in various Federal agencies within the DOI and were referred by existing partners to potential end-users in State and regional groups and agencies throughout the country. Several years into the project, the team joined a larger national initiative that funded enhancements to several tools across the U.S. Geological Survey. This national effort provided new opportunities for the project team to engage with leadership in the DOI and other bureaus, thereby increasing the scope of engagement. This leadership encouraged engagement with non-Federal entities and mentioned the project team as part of the overall effort. This outreach increased participation from “boots on the ground” practitioners and regional managers and resulted in a larger partner group to engage in the project and use the web tool.
Web Tool Example 1—How Did the Project Team Facilitate Engagement?
Initially, the project team facilitated frequent, smaller group meetings with partners in another DOI bureau who helped conceptualize the tool. As the team recruited additional end-users and released new versions of the tool, the team began facilitating large virtual group meetings to share updates and create a space for end-users to provide feedback. This feedback consisted of what new features, functionality, and model outputs would make the tool more useful for their work and what would make the interface and outputs more understandable and usable. These meetings took place when there was a meaningful update to share, a new version of the tool was released, or engagement was necessary to inform new developments. There were usually two meetings a year. The project team was cognizant of people’s busy schedules and careful not to take their participants’ time for granted, so the team began using a newsletter, with a subscribe or unsubscribe option to complement the periodic meetings.
Engagement Activities for Web Tool Example 1
-
• Virtual group meetings—Large virtual group meetings of between 20 and 40 people were the primary method of engagement with users. The project team sent a calendar invite to the group for a virtual meeting that the invitees could accept, at which point the event was automatically added to user’s online calendars, which helped increase participation.
-
• Virtual presentations—Presentations at online events for regional or national audiences involved in related natural resource management activities.
-
• In-person presentations—Presentations at in-person meetings and conferences in States or regions with participation gaps.
-
• One-on-one meetings—Meetings requested by users who wanted to provide additional feedback or need assistance learning to use the tool.
-
• Newsletter—An online newsletter that provided periodic announcements about updates to the tool, upcoming presentations or conference attendance by the project team, and opportunities to engage or provide feedback. One helpful feature of the newsletter was that recipients could subscribe or unsubscribe anytime, which alleviated the concern that the project team was bothering their participant group with too many messages or invitations.
-
• Use cases—Though typically unplanned, the most useful interactions the project team had with participants were when a user shared how the tool was used. The use cases provided important insight into new tool application possibilities, which the team sometimes had not considered.
-
• Trainings—One need requested by users that the project team intended to address was training for users on how to use the web tool, such as videos and tutorials on how to interact with the tool interface and interpret outputs.
Web Tool Example 1—How Did the Project Team Facilitate Meetings?
The project team worked together to prepare meeting presentations and virtual whiteboards for participants to post ideas on. The meetings were typically 1 hour long and were a balanced combination of presenting updates, addressing questions from the audience, and hearing feedback from the group. A key facilitation tool in these meetings was a virtual whiteboard where participants could post their ideas and feedback anonymously, without creating an account or logging in. The project team created multiple whiteboards. After each presentation, the facilitator sent a link in the virtual chat to participants for the whiteboard associated with the material the facilitator just presented. The whiteboard was prepopulated with questions and ideas for discussion. Participants then posted their feedback to these prompts, created new prompts, and generated other meaningful feedback from coparticipants. The whiteboard allowed participants to “thumbs-up” (in other words, “like”) someone else’s response, a feature that provided valuable information to the project team, because this feature helped the project team understand the common needs and use cases among their users.
Web Tool Example 1—Survey Results
For full survey results, refer to tables 1.1–1.5. The total number of responses for each question may vary because respondents could opt to skip any question.
Table 1.1.
Responses to survey questions evaluating end-user engagement in web tool 1 development.[Data from Clements and Wilkins (2025)]
Table 1.2.
Responses to survey questions evaluating the frequency of different types of interactions in web tool 1 development.[Data from Clements and Wilkins (2025). Respondents were instructed as follows: “For types of interaction that you have not participated in, please choose “N/A” (not applicable). Respondents were given an “other” option, and two respondents opted to write in other forms of interactions]
Table 1.3.
Responses to a survey question evaluating the involvement level of participants in web tool 1 development.[Data from Clements and Wilkins (2025)]
Table 1.4.
Responses to a survey question evaluating the overall experience with the project team in web tool 1 development.[Data from Clements and Wilkins (2025)]
Table 1.5.
Responses to a survey question evaluating how end-users perceive web tool 1’s functionality.[Data from Clements and Wilkins (2025)]
Web Tool Example 2
An overview of web tool example 2 is provided in Box 1.2.
Box 1.2. Summary for Web Tool Example 2
Summary of lessons learned identified in interviews with two project leads about engaging end-users and experts (collectively referred to as participants) in the development of scientific web tool 2 and reflecting on participants’ survey feedback.
-
• Product: A web tool that collates data and other resources on invasive species across the United States.
-
• Number of participants at the time of the survey: 88
-
• Engagement Activities: Large, regularly scheduled virtual meetings for topic-focused communities of practice; outreach and small group meetings at in-person events; and virtual webinars.
-
• Lessons Learned:
-
o Engage early, even if it feels messy and uncomfortable—Find out what products or tools already exist, where there are gaps, and how to engage end-users and experts in distinguishing what your product can fulfill. This engagement creates champions and collaborators for the project and prevents duplication of existing work.
-
o Enlist additional staff or collaborators to share the engagement responsibility—especially for a project with a large scope.
-
o Learn facilitation and interpersonal skills—Some interactions can be uncomfortable. Learning to facilitate meetings and productive interpersonal interactions ensures meaningful engagement.
-
o Take time to build trust and make people feel heard—Although moving on to solutions is tempting, the time spent to make people feel heard is essential to building relationships with collaborators, champions, and early adopters.
-
o Provide multiple types of interaction—(For example, emails, virtual group meetings, and one-on-one calls) to accommodate diverse preferences, schedules, time zones, and comfort speaking up in group settings. These interactions establish clear expectations for time commitments and roles and match the engagement level to participants’ engagement interests.
-
o Use web tools to facilitate diverse avenues for feedback—Web tools are a solution to the common issue of the same participants speaking up at every meeting by giving other participants anonymous or nonvocal avenues to provide input.
-
o Facilitating two-way interaction, especially through virtual meeting tools—This type of interaction engages diverse preferences to participate and promotes interaction among participants compared to presentations with question-and-answer sessions.
-
o Organize broad outreach at virtual and in-person events and conferences—This outreach expands your network and opens opportunities for collaboration and users.
-
o Ensure virtual meetings are automatically added to participants’ calendars.
-
o Align the product development schedule with regular interaction—While participants may prefer regularly scheduled meetings or updates (that is, monthly, quarterly, or biannually), the timeline for product development may not follow a regular schedule, and project teams may not regularly have a significant update to share. However, regular interaction is important to keep participants in the loop.
-
Web Tool Example 2—What Is the Product?
This product is a web-based tool that collates resources and data on invasive species from across the United States. The tool comprises multiple functions, such as mapping tools, occurrence data, species profiles, and an expert directory.
Web Tool Example 2—How Did the Project Team Recruit Participants?
The project team sought to bring together as many invasive species practitioners and scientists as possible across the United States to inform the tool’s conceptualization and development. The project team began recruitment and engagement very early in the process of tool creation to ensure that the tool did not re-create an existing resource and that the features and functions of the tool directly represented the needs and vision of their end-users. As such, a primary goal at the outset was to learn potential end-users’ use cases and user stories. The team began the recruitment process by sending an invitation to join a kickoff webinar to email lists of large, boundary-spanning organizations. The project team also requested contacts who had large networks of invasive species colleagues to share announcements with those networks. At their kickoff webinar, participants were invited to engage in several ways, such as communities of practice (COPs) around topics specific to the web tool, working groups, and an email list. Through this email list, which was publicly available to subscribe to throughout the project, the team sent announcements and invitations to participate in various engagement opportunities. Finally, the project team included three technical outreach specialists and a project coordinator, all of whom attended virtual and in-person invasive species meetings and conferences, presented the project, and invited audience members to participate. This outreach resulted in audience members contacting the team directly to learn more or request the team present at one of their organization’s meetings.
Web Tool Example 2—How Did the Project Team Facilitate Engagement?
The project team facilitated engagement through a team of outreach specialists in addition to the project coordinator. The intent of the engagement was to include as many potential end-users and collaborators as possible from across the United States. The project team’s strategy was systematic and organized. The team actively sought to reach diverse end-users by evaluating who was or was not engaging and looking for opportunities to reach end-users who were not represented. Outreach specialists researched effective engagement methods, trained for meeting and webinar facilitation, and created communication and outreach materials to make it easy for potential end-users to sign up and participate in engagement activities.
Engagement Activities for Web Tool Example 2
-
• COP meetings—During these meetings, technical outreach specialists facilitated discussions about gaps in existing web tools that, if filled, could aid practitioners’ and scientists’ work. These discussions initially included presentations of mockups of the web tool and feedback from participants. Once a beta of the tool was available, usability tests were added, where participants could use the latest version of the tool and provide feedback on how to make the tool more user-friendly, intuitive, or useful for end-users’ work. Usability tests were also completed by participants who collaborated directly on the project but were not part of the COP meetings.
-
• In-person meetings for a working group—The working group consisted of data aggregators who collectively answered questions such as “What are the concerns around data sharing? How does data sharing happen? Who does the work?”
-
• Webinars—Large, organized public webinars provided information about the tool.
-
• Conferences and events—To meet potential end-users where end-users are, the project team reached out at existing in-person and virtual conferences, meetings, and other events of topical relevance.
-
• Email list—The email list was publicly accessible, so anyone with an interest could stay informed about the project and receive announcements.
Web Tool Example 2—How Did the Project Team Facilitate Meetings?
The project team facilitated working-group and COP meetings differently. Early conceptualization with both groups created a vision for a product that is useful to a broad audience and adds value for data aggregation, decision support, and information sharing.
Working Groups
Working-group meetings included multiple in-person meetings to work through concerns and identify opportunities to leverage the strengths of existing web tools. The project team set aside time in the meetings for working-group members to voice concerns and opinions. Working-group members were also contacted by email and virtual calls.
Communities of Practice
The project team created four COPs, each focused on one of the early detection and rapid response steps: plan, detect, respond, and report. Each COP was assigned a specific technical outreach specialist. That specialist facilitated meetings with the assistance of one other team member, who answered questions in the meeting chat. The team used an email list platform called “GovDelivery,” through which participants could subscribe to one or more COPs. Announcements for upcoming COP meetings would then be sent to each group, and subscribers could register for the meeting and receive a link to join. Notably, an event did not automatically appear on the calendars of subscribers who received the email. The email asked recipients to register for the meeting. Subscribers would only receive a registration confirmation and calendar event after they registered.
The purpose of the COP meetings was for facilitators to gather feedback from participants and then use these ideas and suggestions to build the foundation of the web tool. Initially, only one COP would meet in a month, meaning that each COP met every 4 months. In time, the meeting frequency changed with the team’s development timeline. The way the project team facilitated these meetings also evolved. The project team created questions related to each COP topic (in other words, plan, detect, respond, report). These questions were based on feedback from potential end-users about possible useful tools, end users’ experiences on-the-ground using tools similar to the product, and items that have been helpful and unhelpful in their work. A typical meeting began with introducing the team’s ideas on how to address the COP topic; during the second half of the meeting, participants shared their personal experiences and lessons learned. Facilitators offered different avenues for providing feedback, including encouraging verbal responses by letting participants unmute, post written responses in the chat, and use virtual whiteboards within the Microsoft Teams meeting or external application that facilitated interaction. Using the external whiteboard, facilitators could post questions and screenshots of the web tool mockups. Participants could access the whiteboard on their own devices and react to questions or each other’s ideas.
Finally, once a beta version of the web tool was developed, facilitators invited COPs, working groups, and other interested users to attend small usability testing sessions. In these sessions, facilitators provided instructions for the usability test, shared the link to the beta web tool with participants, and asked participants to record their usability test. Facilitators distributed this information to participants by sharing a PowerPoint file that provided instructions, prompts, and tasks for the user to follow. The user was asked to perform a task on the web tool and record their own screen while attempting to complete it. The user then added the recording to a PowerPoint slide and answered questions about their experience. Users were asked to complete, record, and answer questions about three tasks. Users then shared or sent the PowerPoint file back to the project team. This allowed the project team to collect a large amount of usability information at one time from many people. The four COPs were combined into one larger group after most elements were built, and the tool went live.
Web Tool Example 2—Survey Results
For full survey results, refer to tables 1.6–1.10. The total number of responses for each question may vary because respondents could opt to skip any question.
Table 1.6.
Responses to survey questions evaluating end-user engagement in web tool 2 development.[Data from Clements and Wilkins (2025)]
Table 1.7.
Responses to survey questions evaluating the frequency of different types of interactions in web tool 2 development.[Data from Clements and Wilkins (2025). Respondents were instructed as follows: “For types of interaction that you have not participated in, please choose “N/A” (not applicable). Respondents were given an “other” option, and one respondent opted to write in an additional form of interaction]
Table 1.8.
Responses to a survey question evaluating the involvement level of participants in web tool 2 development.[Data from Clements and Wilkins (2025)]
Table 1.9.
Responses to a survey question evaluating the overall experience with the project team in web tool 2 development.[Data from Clements and Wilkins (2025)]
Table 1.10.
Responses to a survey question evaluating how end-users perceive web tool 2’s functionality.[Data from Clements and Wilkins (2025)]
Reference Cited
Clements, K.R., and Wilkins, E.J., 2025, Survey responses collected in 2024 measuring end-users’ and experts’ experiences being engaged in development of scientific tools: U.S. Geological Survey data release, accessed September 15, 2025, at https://doi.org/10.5066/P13TZJ7B.
Appendix 2. Lessons Learned from Engaging in Scientific Protocol Development
Scientific Protocol Example 1
An overview of scientific protocol example 1 is provided in Box 2.1.
Box 2.1. Summary for Scientific Protocol Example 1
Summary of lessons learned identified in an interview with one project lead about engaging end-users and experts (collectively referred to as participants) in the development of scientific protocol 1 and reflecting on participants’ survey feedback.
-
• Product: A scientific protocol to rapidly detect species from environmental deoxyribonucleic acid (eDNA) samples.
-
• Number of participants at the time of the survey: 18
-
• Engagement Activities: Email communication directly with participants, in-person training and testing the protocol, and virtual group meetings (biannually).
-
• Lessons Learned:
-
o Directly engaging end-users based on their use cases is the most effective way to ensure your product is useful—The need to understand use cases for your product cannot be underemphasized. By directly engaging and involving end-users in testing your product, the end-users learn how to use the product and how the product can benefit their work, and the project team learns how the product will truly be used and what improvements are necessary to make the product most effective.
-
o Be thoughtful in who to target your engagement efforts—It is always helpful to be thoughtful about who the end-users of your product are and what the end-users use cases may be. For a project that depends on on-the-ground in-person user testing, product teams must be strategic in who to engage, because the capacity for such direct, one-on-one engagement is more limited compared to projects that can rely on virtual or group interactions.
-
o Clearly communicate what the participant can expect through their project engagement—particularly regarding the research and development process. Participants may expect to use the protocol immediately, when in fact, the project is still in the research and development phase and relying on end-users to test the protocol, learn what can be improved, and identify any problems that should be corrected. If a participant becomes involved without understanding that the product may still be flawed, participants may be disappointed or frustrated when the team inevitably encounters challenges and needs to troubleshoot.
-
o Customize communication to each end-user when possible—When focusing on specific individual use cases, each participant is a potential early adopter and champion of your product. Participants also have specific needs and limitations for when and how to test the product on the ground in the participants’ context. These limitations require project teams to be flexible in response to participants’ schedules and questions that arise, which are specific to participants’ use cases and needs. Being willing to meet one-on-one virtually and provide instruction and guidance through emails builds these relationships.
-
o Prepare virtually for in-person interactions—When you perform user testing or demonstrations in person, time is of the essence. Therefore, it is helpful to have at least one virtual meeting before an in-person visit to provide background information about the project and discuss logistical questions and a plan for the in-person visit.
-
Scientific Protocol Example 1—What Is the Product?
This project produced a protocol and toolkit for eDNA detection, with a primary focus on the protocol for using the toolkit. The protocol guides end-users through a portable method to detect a species of interest. The protocol does not require laboratory space or genetics expertise and is easy to interpret. The supplies for the toolkit can be obtained independently by the end-user, although some supplies must be custom ordered.
Scientific Protocol Example 1—How Did the Project Team Recruit Participants?
The project lead engaged participants. Because the product is geographically agnostic and could be used by a variety of organizations in a variety of contexts, there was not a clear group of end-users to recruit from, such as a list of laboratories seeking this type of science. Therefore, the project lead began by considering all scenarios for which end-users might want to implement eDNA detection methods on the ground. Based on these scenarios, the team then reached out to as many people as possible to develop and provide feedback on the protocol, to cast a broad net to ensure many types of users participated, especially early adopters who were willing to test the product. The project lead prioritized potential end-users, such as resource managers, as opposed to experts, because end-users could provide case studies, on-the-ground experiences, and opportunities to test the protocol onsite in their work context.
Scientific Protocol Example 1—How Did the Project Team Facilitate Engagement?
The project lead primarily facilitated engagement through in-person testing of the protocol and toolkit with end-users. The project lead invested time and consideration for every partner and end-user to meet not just the user’s needs for the tool, but also the user’s preferred means of communication and interaction. The overall process was a working relationship tailored to end-users’ needs and time. This project was successful in terms of engagement because the project lead thought deeply about end-users’ needs and how to make a tool that was useful to them. The project lead also accompanied end-users in collecting samples and experienced or observed firsthand what it would be like to use the protocol in multiple contexts and field sites.
Engagement Activities for Scientific Protocol Example 1
-
• Small group meetings—After a potential end-user expressed interest through email, the project lead set up a one-on-one or small group meeting to introduce the project, the protocol, and background on the science.
-
• In-person testing—After the small group meetings, the project lead tested the protocol with potential end-users in person.
-
• Virtual group meetings—Throughout the project timeline, the project lead hosted several virtual group meetings to share updates and changes to the protocol.
Scientific Protocol Example 1—How Did the Project Team Facilitate Engagement?
After an initial virtual one-on-one or small group meeting, the project lead travelled to the end-users’ job location. On these visits, the project lead typically reiterated information about the project, provided updates on changes to the protocol since the initial meeting, discussed caveats and limitations, and emphasized that the project was in the experimentation (or research and development) phase. The project lead then guided hands-on testing of the protocol by running test samples. In some cases, the end-user had samples ready to test, or the project lead accompanied them to collect samples, sometimes by boat. Some in-person visits were facilitated as a workshop or training as part of a larger meeting or training event. These in-person visits still included hands-on examples and sampling, but in a classroom setting with a goal of exposure to the protocol as opposed to learning the exact process of how to use it. Follow-up engagement after these in-person interactions occurred virtually to answer any questions, address issues that required troubleshooting, and explore and interpret results.
Scientific Protocol Example 1—Survey Results
For full survey results, refer to tables 2.1–2.5. The total number of responses for each question may vary because respondents could opt to skip any question.
Table 2.1.
Responses to survey questions evaluating end-user engagement in scientific protocol 1 development.[Data from Clements and Wilkins (2025)]
Table 2.2.
Responses to survey questions evaluating the frequency of different types of interactions in scientific protocol 1 development.[Data from Clements and Wilkins (2025). Respondents were instructed as follows: “For types of interaction that you have not participated in, please choose “N/A” (not applicable). Respondents were given an “other” option, and one respondent opted to write in an additional form of interaction]
Table 2.3.
Responses to a survey question evaluating the involvement level of participants in scientific protocol 1 development.[Data from Clements and Wilkins (2025)]
Table 2.4.
Responses to a survey question evaluating the overall experience with the project team in scientific protocol 1 development.[Data from Clements and Wilkins (2025)]
Table 2.5.
Responses to a survey question evaluating how end-users perceive scientific protocol 1’s functionality.[Data from Clements and Wilkins (2025)]
Scientific Protocol Example 2
An overview of scientific protocol example 2 is provided in Box 2.2.
Box 2.2. Summary for Scientific Protocol Example 2
Summary of lessons learned identified in an interview with a project lead about engaging end-users and experts (collectively referred to as participants) in the development of scientific protocol 2 and reflecting on participants’ survey feedback.
-
• Product: A scientific protocol and technology to automatically sample water.
-
• Number of participants at the time of the survey: 10
-
• Engagement Activities: Small virtual group meetings during project conceptualization, one-on-one meetings to discuss the work plan, file sharing, one large in-person meeting, newsletter and email updates, and in-person interaction at conferences and events.
-
• Lessons Learned:
-
o Establish an agreed-upon frequency, format, and expectations for engagement with participants—The project team facilitated frequent and in-depth engagement during the first year and a half of the project. Then, due to capacity limitations, changes to the program, and a need to focus on building the product, there was a gap in communication for the year preceding the participant survey. This gap is reflected in survey responses, indicating participants were satisfied with initial engagement but now feel out of the loop. From these results, the project lead indicated that to prevent participants feeling out of the loop, the project team could discuss engagement expectations with participants and establish a plan with participants for communication early in the project. This plan could include the frequency of email or newsletter updates and creating a regular scheduled meeting to add to everyone’s calendars.
-
o Make room for change and communicate the possibility of external changes—After collecting initial feedback from participants, external changes required the project team to pivot and unable to incorporate this feedback. Because the potential for such changes was unclear at the beginning stages, it was difficult to communicate the changes later, which led to a gap in engagement. To prevent this, at the beginning of the project, the project team should tell participants about the possibility of external changes.
-
o Involve participants in conceptualizing and testing early versions of the product—The project team followed a build, measure, and learn cycle inspired by a method used in the private sector to rapidly test draft products with end-users. This method improved the product utility more quickly than only sharing products that are closer to the finished version. This method was popularized by the book “The Lean Startup” (Ries, 2011).
-
o Test the product through on-the-ground use cases—To apply the build, measure, and learn cycle for a product that includes both equipment and a protocol, the project team must learn from on-the-ground use cases of the product. This project team did so by providing the equipment to end-users who were willing to test the equipment at field sites, allowing the project team to rapidly learn from end-users’ experiences using the tool across diverse contexts and purposes.
-
o Create opportunities for participants to build trust—Informal interactions among participants engaged in this project nurtured comfort with sharing feedback and participating in group discussions. This trust among the overall group encourages knowledge exchange.
-
Scientific Protocol Example 2—What Is the Product?
This project designed an end-to-end workflow and technology for species surveillance using eDNA. The technology the team designed was an automated sampling device (often called an autosampler) that can be placed in water samples without the field team needing to be present for each sample.
Scientific Protocol Example 2—How Did the Project Team Recruit Participants?
The project team formed a group of end-users and experts who could provide insights into the end-users’ agency or organization’s potential use of the tool. The group shared the most useful aspects of the workflow and technology, which aspects were not needed, and how the project team could best support participants’ surveillance work. To recruit participants, the project team invited a combination of experts in automated eDNA sampling with whom the team already had relationships and representatives from several of the primary Federal, State, local, Tribal, and academic agencies and organizations involved in freshwater surveillance. The team also asked senior leadership in their own organization for additional recommendations on participants to recruit. These recruitment efforts resulted in a small group, referred to as the subject matter expert (SME) group, which included at least one representative from each of the key perspectives needed to inform the work. The small size of the group ensured more in-depth engagement with each individual.
Scientific Protocol Example 2—How Did the Project Team Facilitate Engagement?
The project team began engaging participants by hosting a series of virtual meetings, presenting a rough idea of the project, and requesting feedback on how to modify the project to reflect the SME group’s perspectives and needs. Based on this feedback, the team created a work plan meant to capture the SME group’s vision. The group consisted of content experts and end-users with experience applying similar scientific tools in the field. The team shared the work plan with each SME group member and met one-on-one to discuss opportunities for improvement and feedback on the most and least important or useful components of the plan. These meetings and work-plan refinements culminated in a 2-day in-person workshop at a collaborating research institute that was involved in developing the autosampler.
Engagement Activities for Scientific Protocol Example 2
-
• Virtual group meetings—These meetings consisted of presentations on a proposed outline for the project, discussions, and feedback collection. The project lead shared a Microsoft Word document containing the project work plan for each participant to review. The participant could provide tracked changes and comments on the document. Feedback was incorporated into the work plan, which was shared in future interactions.
-
• On-on-one meetings—After the participants reviewed the work plan, the project lead met each participant to discuss suggestions, particularly important project elements, and elements participants perceived to be less relevant to their work.
-
• Workshop—After a year of virtual group and one-on-one meetings, the project team hosted the SME group at an in-person workshop where additional topics and more detailed feedback were discussed.
-
• Emails and newsletters—In between the group and one-on-one meetings, the project team provided several project updates through email or newsletter bulletins.
-
• In-person interactions—The project team had some additional one-on-one discussions about the project with SME group members at events. Because some SME group members attended the same conferences or other events as the project team, several in-person interactions occurred at these events as opportunities arose.
Scientific Protocol Example 2—How Did the Project Team Facilitate Meetings?
Whereas virtual meetings were facilitated in a traditional format, beginning with a detailed presentation on project updates, and ending with a question-and-answer session, feedback, and discussion, the in-person workshop included a variety of activities that stimulated knowledge exchange and workflow and technology codesign.
One goal of the in-person workshop was to gather the SME group’s input on design requirements for the autosampler through discussion as a group. After a series of presentations on the scientific background of the project and automated sampling, the project team facilitated a MoSCoW (must-have, should-have, could-have, and won’t-have) exercise with the SME group and other attendees (Vijayakumar and others, 2024). A MoSCoW exercise, originally developed as a method to incorporate feedback while rapidly developing applications, is a prioritization technique often used in software development to understand the importance end-users place on each requirement or feature of a product. Workshop attendees were split into two groups of 10–15 people. A facilitator from the project team explained the exercise and provided Post-it notes for each individual to brainstorm and write down their design requests independently, followed by a small group discussion. The facilitator then captured suggestions from the group on large posters labeled with each of the MoSCoW categories, encouraging participants to carefully consider what features truly were a “must-have” as opposed to a lower priority category. After these smaller groups completed the exercise, the two groups came back together for a larger group discussion, during which a facilitator from the project team led further discussion on the features the two groups requested and encouraged more prioritization refinement. The design requests from this in-person activity were incorporated into the engineering of the technology as much as possible. Several SME group members saw the resulting product a year later at a small in-person meeting, whereas the rest of the group was updated on the final product a year and a half later.
This workshop took place in an area that was easy and fun to explore in small groups by visiting local sites or going out to eat together. This was balanced by a thoughtfully planned agenda that included a tour of a collaborating research institute and a description of the technology supporting the autosampler. Physical examples of previous models of the technology were placed in the meeting space to connect the participants with the work.
Scientific Protocol Example 2—Survey Results
For full survey results, refer to tables 2.6–2.10. The total number of responses for each question may vary because respondents could opt to skip any question.
Table 2.6.
Responses to survey questions evaluating end-user engagement in scientific protocol 2 development.[Data from Clements and Wilkins (2025)]
Table 2.7.
Responses to survey questions evaluating the frequency of different types of interactions in scientific protocol 2 development.[Data from Clements and Wilkins (2025). Respondents were instructed as follows: “For types of interaction that you have not participated in, please choose “N/A.” N/A, not applicable]
Table 2.8.
Responses to a survey question evaluating the involvement level of participants in scientific protocol 2 development.[Data from Clements and Wilkins (2025)]
Table 2.9.
Responses to a survey question evaluating the overall experience with the project team in scientific protocol 2 development.[Data from Clements and Wilkins (2025)]
Table 2.10.
Responses to a survey question evaluating how end-users perceive scientific protocol 2’s functionality.[Data from Clements and Wilkins (2025)]
References Cited
Clements, K.R., and Wilkins, E.J., 2025, Survey responses collected in 2024 measuring end-users’ and experts’ experiences being engaged in development of scientific tools: U.S. Geological Survey data release, accessed September 15, 2025, at https://doi.org/10.5066/P13TZJ7B.
Vijayakumar, S., Prasad K.K., Holla M.R., 2024, Assessing the effectiveness of MoSCoW prioritization in software development—A holistic analysis across methodologies: EAI Endorsed Transactions on Internet of Things, v. 10, 9 p., accessed February 4, 2025, at https://doi.org/10.4108/eetiot.6515.
Appendix 3. Lessons Learned from Engaging in Information Product Development
Information Product Example 1
An overview of information product example 1 is provided in Box 3.1.
Box 3.1. Summary for Information Product Example 1
Summary of lessons learned identified in interviews with two project leads about engaging end-users and experts (collectively referred to as participants) in the development of scientific information product 1 and reflecting on participants’ survey feedback.
-
• Product: An invasive species watchlist.
-
• Number of participants at the time of the survey: 24
-
• Engagement Activities: Email, two virtual workshops, file sharing, two virtual help sessions, and one-on-one calls and emails.
-
• Lessons Learned:
-
o Use multiple avenues to recruit experts—There is not just one way to recruit end-users or experts to participate in your project. This project team found that the following strategies recruited the varied expertise they needed for the project:
-
▪ Contacting relevant experts from the project team’s professional networks
-
▪ Inviting participants through organizational email lists of relevant experts
-
▪ Presenting the project virtually and in-person to share information about the project, inviting participants who are reviewing literature on the topic, and reaching out to authors who demonstrate relevant expertise.
-
-
o Communicate clear expectations from the beginning—When recruiting experts to be collaborators or coequals in a project, it is helpful to define the role the participant will play in the invitation, either in an email or verbally in a virtual meeting. This communication may include time commitment, a timeline with deadlines and dates for meetings and events, and an overview of what tasks the expert will be expected to perform, such as providing input. Certain expertise that is needed can be clarified at the onset, especially if that expertise goes beyond the specific expertise of the participant. Additionally, early advance notice of meetings allows participants to clear time on their calendars, so participants are more likely to attend. Given clearly defined roles and expectations, participants can opt out if participants do not have the capacity to participate.
-
o Customize communication to participants’ preferences and needs when possible—People differ in their preferences and level of comfort with different forms of communication and participation. For example, shared folders are helpful for making instructions, data, and other materials available all in one place. However, accessing these folders can be problematic for participants outside the U.S. Geological Survey, and alternative file-sharing methods are required. Some collaborators may also prefer to receive information and files as attachments in an email. Others may request one-on-one meetings to discuss specific questions they feel uncomfortable asking in a group setting. Offering multiple types of interaction accommodates these diverse preferences and needs.
-
o Create a collection of materials participants can access at any time—This collection can include an overview of the project, detailed instructions, and any related information, such as literature or data. These materials typically include written documents but may also include recorded videos. Participants, especially collaborators or coequals on the project, appreciate this level of organization and accessibility.
-
Information Product Example 1—What Is the Product?
This project produced an invasive species watch list that was created using an established horizon scan process. This process involved using a risk-assessment tool that was based on perceived risk, expert consultation, and a consensus process. The watch list can be used in other analyses, downstream sciences, and management and surveillance decisions.
Information Product Example 1—How Did the Project Team Recruit Participants?
At the outset of the project, the primary project leads recruited 2 university professors and 2 graduate students to be part of the core group. This core group then reviewed data and literature to determine what taxa groups would be included in the horizon scan. The core group then began recruiting participants by contacting scientists with previous experience with horizon scanning or special taxonomic skills related to the taxa groups of interest. For an expert elicitation-type exercise such as a horizon scan, a key factor to consider when recruiting partners is ensuring all necessary expertise is involved in the project. For this project, specific taxonomic expertise was vital. The core group recruited experts already known through their professional networks to consult on some taxa. Seeking expertise in the remaining taxa, the team sent email invitations (through email lists) to institutions related to the subject matter (for example, the Society for Freshwater Science). Additionally, the team contacted experts identified through authorship on publications related to the project’s taxa groups that did not yet have experts. If the team could still not find experts, a participant or core team member with the most relevant expertise was assigned to those taxa groups. For example, if the team was unable to recruit an expert on scorpions, scorpions were assigned to a participating expert on arachnids.
When recruiting experts, the project team clearly communicated expectations, time commitments, and tasks that participants would need to contribute to. For example, as is typical for horizon scan projects, experts were invited to be coauthors of the final publication from the onset. All deadlines, goals, and methodology for the work were determined before recruitment. Experts could then elect to be involved based on this information.
Information Product Example 1—How Did the Project Team Facilitate Engagement?
Because this project produced an information product that is straightforward, static, and not interactive, engagement did not focus on end-users outside of the subject matter expert (SME) group participating in the horizon scan. End-users outside of the SME group were updated on the process and product through presentations at relevant conferences and regional meetings.
Engagement Activities for Information Product Example 1
-
• Email coordination—After recruiting experts, the project leads communicated by email to establish which taxa group each expert would review and score using the provided risk-assessment tool.
-
• First workshop—The core team hosted an introductory workshop to describe the process, tasks, shared materials, and worksheets the experts needed to complete the tasks. Project materials, including a “Frequently Asked Questions” document, a tool description, and an instructional video, were key components of the collaboration; these materials guided participants through the horizon scan process independently and at their own pace during several months.
-
• Virtual help sessions—The core team hosted two virtual help sessions (following the introductory workshop) in which SMEs could attend and ask questions. Fewer experts attended the second session, indicating that the process was likely clear enough to complete independently.
-
• As-needed informal communications—Project leads communicated with experts individually, as needed, using emails, one-on-one calls, and Microsoft Teams chats. Each participant had preferences for communication, and the team accommodated these preferences for each person. For example, some participants had difficulty accessing the shared folder or preferred not to use Microsoft Teams, so these participants requested that all materials be sent by email.
-
• Second workshop—The final activity was a second workshop in which results were shared, and the SME group could provide feedback on the final product.
Information Product Example 1—How Did the Project Team Facilitate Meetings for Information Product Example 1?
The project team worked together to prepare meeting presentations and virtual whiteboards for participants to post ideas on. The meetings were typically 1 hour long and a balanced combination of update presentations, time to address questions from the audience, and time for feedback from participants. A key facilitation tool in these meetings was an online whiteboard that allowed participants to post their ideas and feedback anonymously without creating an account or logging in. The project team created multiple whiteboards. After each presentation, the facilitator sent a link to participants in the virtual chat for the whiteboard associated with the material just presented. The virtual whiteboard was prepopulated with questions and ideas for discussion. Participants could then post their feedback to these prompts, or they could create new prompts and generate other meaningful feedback from coparticipants. The whiteboard allowed participants to “thumbs-up” someone else’s response, a feature that provided valuable information to the project team because it helped them understand the common needs and use cases among their users.
Information Product Example 1—Survey Results
For full survey results, refer to tables 3.1–3.5. The total number of responses for each question may vary because respondents could opt to skip any question.
Table 3.1.
Responses to survey questions evaluating end-user engagement in information product 1 development.[Data from Clements and Wilkins (2025)]
Table 3.2.
Responses to survey questions evaluating the frequency of different types of interactions in the information product 1 development.[Data from Clements and Wilkins (2025). Respondents were instructed as follows: “For types of interaction that you have not participated in, please choose “N/A.” N/A, not applicable]
Table 3.3.
Responses to a survey question evaluating the involvement level of participants in information product 1 development.[Data from Clements and Wilkins (2025)]
Table 3.4.
Responses to a survey question evaluating the overall experience with the project team in information product 1 development.[Data from Clements and Wilkins (2025)]
Table 3.5.
Responses to a survey question evaluating how end-users perceive information product 1’s functionality.[Data from Clements and Wilkins (2025)]
Information Product Example 2
An overview of information product example 2 is provided in Box 3.2.
Box 3.2. Summary for Information Product Example 2
Summary of lessons learned identified in interviews with two project leads about engaging end-users and experts (collectively referred to as participants) in the development of scientific information product 2 and reflecting on participants’ survey feedback.
-
• Product: An informational webpage about how to apply environmental deoxyribonucleic acid (eDNA) methods for species surveillance
-
• Number of participants at the time of the survey: 11
-
• Engagement Activities: Individual emails to participants, file sharing, one-on-one virtual meetings, and one small in-person meeting.
-
• Lessons Learned:
-
o Do not let fear of imposing prevent frequent and regular engagement opportunities—The project team felt concerned about burdening their participants and consequently avoided frequent communication through email or meeting invitations. However, survey results showed that participants perceived that the team’s interactions were too infrequent, indicating that the project team was overly concerned with imposing on participants’ time and, in fact, needed to communicate with participants more frequently. Frequent and regular interactions could prevent long communication gaps, which are perceived negatively by participants.
-
o Directly engaging end-users one-on-one to review the information and interface usability collects feedback—The project team found that meeting one-on-one with potential end-users facilitated an in-depth review of the information product, in which the project team could observe the immediate reactions of the end-user to the web content. This meeting was similar to a usability test but tailored for a static information product opposed to an interactive webtool. End-users’ feedback informed the project team of what content needed clarification, more accessible language, or to be better communicated through a visualization.
-
o Engage end-users in early drafting or conceptualizing of the product—It can be challenging or uncomfortable to engage end-users when the project team has not yet created a product for end-users to react to. However, early engagement when conceptualizing the product, even before the team creates any content, ensures that end-users’ ideas for the purpose of the product and ways that the product can help end-users are embedded into the design and the included content. In retrospect, this project team would have preferred a series of workshops with a broad audience in which the group could brainstorm and conceptualize the content, modules, and scope of the product.
-
o Prepare a set of questions for meetings with end-users about what you need to know to inform your product—To make the most of group or one-on-one meetings with end-users and generate meaningful feedback, the meeting facilitator can prepare a series of questions to ask the participants at the beginning of the meeting and throughout review of the product.
-
o Engage end-users with interest in the topic or product—If a product focuses on a topic or serves an innovative purpose that potential end-users do not have any existing knowledge about, end-users may have little interest, be resistant to change, or hold skepticism about how the product can benefit end-users. This skepticism may prevent end-users from participating or result in unproductive engagement. For example, if asked “What would make this product useful to you?” a participant without existing knowledge or interest in the topic may say they do not know or plan to use it. Therefore, allowing participants to self-select their engagement level can help prevent unproductive interactions. Those participants who are interested in the product can participate in activities to provide feedback, whereas those participants who are less knowledgeable or interested can choose to stay informed through simple updates.
-
Information Product Example 2—What Is the Product?
The goal of this project was to create a set of easily navigable web pages providing informational materials on eDNA, especially for application to early detection and rapid response for invasive species. The intended audience was resource managers who have varying levels of knowledge about eDNA and would therefore look to this product for guidance.
Information Product Example 2—How Did the Project Team Recruit Participants?
The project team’s primary goal for recruitment was gathering feedback from potential end-users of the information. A secondary goal was gathering feedback from fellow SMEs (scientists) on the topic. The team began by creating a list of resource managers, supervisors of resource managers, and scientists who use eDNA in their work and could advise the project based on their expertise. The team targeted individuals in State or Federal agency roles.
Information Product Example 2—How Did the Project Team Facilitate Engagement?
After initial email exchanges inviting individuals to participate, the project team scheduled meetings to describe and share drafts of the information product.
Engagement Activities for Information Product Example 2
-
• Emails soliciting feedback—The project team sent email messages with screenshots and text from the web page to participants. The participant could make edits and comment on the text and screenshots.
-
• One-on-one virtual meetings—Participants navigated through draft web pages during these meetings.
-
• One in-person meeting—SMEs reviewed the information product and provided feedback during this meeting.
Information Product Example 2—How Did the Project Team Facilitate Meetings?
Most interactions between the project team and end-users or SMEs were virtual one-on-one meetings. In the early phases of developing the product, the project team presented an outline of the content that would be included in the various web pages of the product. The team would ask participants if this approach was sufficient or certain topics should be added or taken away. Then, the team would later work to incorporate the feedback and request to meet with participants again to share the new version and gather more feedback. In these meetings, the project team provided a link to the participant, who then navigated through each web page. These pages were primarily text with some images. The project team observed participants’ reactions to the information, what participants were particularly engaged by, and which details stood out as most important or valuable. The project team asked the participants to note what parts of the product were useful, were not useful, and could use more clarification. Feedback often differed from one participant to another. Therefore, one-on-one meetings allowed the participants to provide feedback unaffected by other participants. Some participants in the first phase of meetings did not participate in subsequent meetings because these participants lacked the time or had already given all their feedback.
Information Product Example 2—Survey Results
For full survey results, refer to tables 3.6–3.10. The total number of responses for each question may vary because respondents could opt to skip any question.
Table 3.6.
Responses to survey questions evaluating end-user engagement in information product 2 development.[Data from Clements and Wilkins (2025)]
Table 3.7.
Responses to survey questions evaluating the frequency of different types of interactions in information product 2 development.[Data from Clements and Wilkins (2025). Respondents were instructed as follows: “For types of interaction that you have not participated in, please choose “N/A.” N/A, not applicable]
Table 3.8.
Responses to a survey question evaluating the involvement level of participants in information product 2 development.[Data from Clements and Wilkins (2025)]
Table 3.9.
Responses to a survey question evaluating the overall experience with the project team in information product 2 development.[Data from Clements and Wilkins (2025)]
Table 3.10.
Responses to a survey question evaluating how end-users perceive information product 2’s functionality[Data from Clements and Wilkins (2025)]
Reference Cited
Clements, K.R., and Wilkins, E.J., 2025, Survey responses collected in 2024 measuring end-users’ and experts’ experiences being engaged in development of scientific tools: U.S. Geological Survey data release, accessed September 15, 2025, at https://doi.org/10.5066/P13TZJ7B.
Appendix 4. Questionnaire
Survey Questions
For the purpose of this survey, we are asking that you respond based on your experience with just one project, even if you have been involved in multiple.
Question 1. Please select the project with which you have been the most involved. Use this project as the basis for your answers for the rest of the questions in this survey [Project names are omitted for confidentiality].
Question 2. Please indicate your level of agreement with the following statements: (1) The project team has provided me with sufficient opportunities to provide feedback about the project.-
o Strongly disagree
-
o Disagree
-
o Somewhat disagree
-
o Neutral
-
o Somewhat agree
-
o Agree
-
o Strongly agree
-
o Strongly disagree
-
o Disagree
-
o Somewhat disagree
-
o Neutral
-
o Somewhat agree
-
o Agree
-
o Strongly agree
Question 3. For each of the following types of interaction that you have participated in, what is your perception of the frequency of this type of interaction? Interaction options: (1) emails, (2) one-on-one calls or meetings, (3) presentations (for example, updates or webinars about the project), (4) virtual group meetings, (5) in-person interactions, and (6) other (write-in). For types of interaction that you have not participated in, please choose “N/A” [not applicable].
Question 4. Please indicate your level of agreement with the following statement: The project team is engaging partners with the necessary subject-matter expertise and management perspectives to inform the project:
-
o Strongly disagree
-
o Disagree
-
o Somewhat disagree
-
o Neutral
-
o Somewhat agree
-
o Agree
-
o Strongly agree
-
o I don’t know
Question 5: Which of the following best describes your involvement in this project?
-
o I am informed about the project’s progress, final products, and outputs.
-
o I am consulted for feedback on certain aspects of the project, such as analyses, design, implementation, products, and outputs.
-
o I collaborate with the project team to formulate solutions and design final products and outputs.
-
o I am a coequal to the rest of the project team; I provide foundational input and recommendations to project development.
Question 6: How functional [original emphasis] do you believe the scientific tool(s) or product(s) this project is producing will be to support your work?
-
o Not at all (Not well-developed at all; not functional)
-
o Minimal (Very limited in scope, scale, or function)
-
o Moderate (Generally functional with notable insufficiencies or limitations)
-
o Good (Gaps may exist for minor elements)
-
o Robust (Well-developed and highly functional)
Question 7: How do you feel about your experience with this project team?
-
o Extremely dissatisfied
-
o Dissatisfied
-
o Somewhat dissatisfied
-
o Neither satisfied nor dissatisfied
-
o Somewhat satisfied
-
o Satisfied
-
o Extremely satisfied
Question 8: How can the project team better incorporate your knowledge and recommendations into current and future work?
-
________________________________________________________________
-
________________________________________________________________
-
________________________________________________________________
Question 9: What is working well in terms of how the project team has engaged you in the project?
-
________________________________________________________________
-
________________________________________________________________
-
________________________________________________________________
Question 10: Which of the following best describes your primary role in your organization?
-
o Regulatory
-
o Communication and outreach
-
o Science or research
-
o Land or resource management
-
o Program or project management
-
o Field personnel or technician
-
o Organizational leadership
-
o Other (please specify):________
Question 11: What type of organization do you work for? [This question only appears on the questionnaire sent to non-Federal employees]
-
o Local government
-
o State agency or organization
-
o Tribe or Tribal organization
-
o Territory or organization representing a territory or territories
-
o Federal agency
-
o Private or for-profit organization
-
o University or college
-
o Nongovernmental organization (Not associated with States, Tribes, territories, or universities)
-
o Other (please specify):_________
For the questionnaire sent to Federal employees:
Alternative Question 11: What Bureau or Agency do you work for? [This question only appears on the questionnaire sent to Federal employees]
-
o U.S. Army Corps of Engineers
-
o Bureau of Land Management
-
o Bureau of Reclamation
-
o Department of the Interior Office of the Secretary
-
o U.S. Fish and Wildlife Service
-
o National Oceanic and Atmospheric Administration
-
o National Park Service
-
o U.S. Department of Agriculture (USDA) Agricultural Research Service
-
o USDA Animal and Plant Health Inspection Service
-
o USDA Forest Service
-
o USDA Natural Resources Conservation Service
-
o U.S. Geological Survey (this option is included to confirm no U.S. Geological Survey employees were included in the analysis if the employee accidentally received the questionnaire)
-
o Other (please specify):________
Appendix 5. Semistructured Interview Questions
-
1. It is helpful for us to contextualize your responses based on the type of tool you are creating, such as a decision-support tool as opposed to an information product or piece of technology, or more than one of those. How would you describe [your project] in terms of what type of tool you are developing?
-
2. Can you tell me about how you engaged partners in the project?
-
3. How did you identify and recruit partners?
-
4. At what point in your project did you begin recruiting partners?
-
5. Did you communicate with your partners about what their role would be on the project?
-
6. Consider the survey question you answered about frequency of interaction through emails, one-on-one meetings or calls, presentations, virtual group meetings, and in-person interactions. What types of interaction have you had with partners?
-
7. Could you tell me about what happened during those interactions? How did you facilitate the meetings and presentations? What did you use emails to communicate about?
-
8. What have been the most meaningful interactions with partners? What made them meaningful?
-
9. Can you tell me about any specific tools and techniques you’ve used to facilitate interactions with partners?
-
A. [If examples are needed, use the following]: For example, using virtual collaboration tools like Miro or meeting polls, collaborating on documents, applying usability testing methods, prompting feedback with discussion questions.
-
B. What have you found to be the most effective tools? Least effective?
-
-
10. If you could do anything differently in how you facilitated partner engagement in the project, what would you do?
-
11. What barriers or challenges have you faced in facilitating effective partner engagement?
-
12. What guidance, tips, or resources would have been helpful to know when you began facilitating partner engagement in your project that you wish you’d known about from the beginning?
-
13. Thinking about different types of partners, for instance, end-users or consumers of the information as opposed to experts. What are the differences, and how would you approach those different types of partners?
-
14. Why did you choose…[here the interviewer was referencing interviewee responses to the three questions they were asked before the interview, and specific phrasing of this question varied based on the project lead’s responses.]
-
15. Do these results surprise you at all?
-
16. What do you think about these results?
-
17. After reviewing the survey results, is there anything that stands out to you or surprises you? Why?
-
18. Earlier, when I asked if you would do anything differently, you said [paraphrase previous response]. Now that you’ve seen your partners’ feedback, is there anything else you think you would do differently, or would you revise what you said earlier?
-
19. What lessons learned would you share with a fellow scientist embarking on a partner engagement process for a similar project?
-
20. What do you think makes a good partner for a project like yours?
Appendix 6. Codebook for Thematic Analysis of Semistructured Interviews
Table 6.1.
The codebook of themes used to analyze interview data, consisting of primary and secondary codes, code descriptions, the number of times the secondary codes were discussed in interviews, and exemplary quotations from the interviews.[Data from Clements and Wilkins (2025) at https://doi.org/10.5066/P13TZJ7B. Primary codes represent high-level themes, and secondary codes represent specific themes within the primary code. Quotations have been lightly edited for brevity and clarity, and specific names and agencies have been removed for anonymity. The interviewees were assigned an anonymized identifying number, shown in parentheses in the “Exemplary quotations” column. USGS, U.S. Geological Survey; eDNA, environmental deoxyribonucleic acid]
Reference Cited
Clements, K.R., and Wilkins, E.J., 2025, Survey responses collected in 2024 measuring end-users’ and experts’ experiences being engaged in development of scientific tools: U.S. Geological Survey data release, accessed September 15, 2025, at https://doi.org/10.5066/P13TZJ7B.
Abbreviations
COP
Community of Practice
COVID-19
coronavirus disease 2019
DOI
Department of the Interior
DST
decision-support tool
eDNA
environmental deoxyribonucleic acid
FWS
U.S. Fish and Wildlife Service
MoSCoW
must-have, should-have, could-have, and won’t-have
PRA
Paperwork Reduction Act
Q&A
questions and answers
SME
subject matter expert
USDA
U.S. Department of Agriculture
USGS
U.S. Geological Survey
For more information concerning the research in this report, contact the
Director, USGS Fort Collins Science Center
2150 Centre Ave., Bldg. C
Fort Collins, CO 80526-8118
(970) 226-9100
Or visit the Fort Collins Science Center website at:
https://www.usgs.gov/centers/fort-collins-science-center
Publishing support provided by the USGS Science Publishing Network,
Denver Publishing Service Center
Disclaimers
Any use of trade, firm, or product names is for descriptive purposes only and does not imply endorsement by the U.S. Government.
Although this information product, for the most part, is in the public domain, it also may contain copyrighted materials as noted in the text. Permission to reproduce copyrighted items must be secured from the copyright owner.
Suggested Citation
Clements, K.R., English, J.J., Wilkins, E.J., Moore, M.A., and Schuster, R., 2026, Practical guidance for engaging end-users and experts in developing scientific tools: U.S. Geological Survey Scientific Investigations Report 2026–5137, 63 p., https://doi.org/10.3133/sir20265137.
ISSN: 2328-0328 (online)
| Publication type | Report |
|---|---|
| Publication Subtype | USGS Numbered Series |
| Title | Practical guidance for engaging end-users and experts in developing scientific tools |
| Series title | Scientific Investigations Report |
| Series number | 2026-5137 |
| DOI | 10.3133/sir20265137 |
| Publication Date | May 13, 2026 |
| Year Published | 2026 |
| Language | English |
| Publisher | U.S. Geological Survey |
| Publisher location | Reston VA |
| Contributing office(s) | Fort Collins Science Center |
| Description | Report: vii, 63 p.; Data Release |
| Online Only (Y/N) | Y |