

Arsenic and Isotope Concentrations in the Lower Platte River Valley of Eastern Nebraska, early 1970s to 2023.
Links
- Document: Report (5.43 MB pdf) , HTML , XML
- Dataset: USGS National Water Quality Network
- Data Release: USGS data release
- NGMDB Index Page: National Geologic Map Database Index Page (html)
- Download citation as: RIS | Dublin Core
Acknowledgments
The U.S. Geological Survey would like to acknowledge the City of Lincoln, Nebraska, and the State of Nebraska Water Sustainability Fund for providing funding and the opportunity to cooperate with them on this sampling and data analysis of arsenic in the lower Platte River valley. The analyses of arsenic concentrations in the lower Platte River valley have been greatly improved by the City of Lincoln’s support, scientific discussions, and contribution of well information, concentrations, and pumping information.
Abstract
The City of Lincoln, Nebraska, has been monitoring concentrations of arsenic in their source water and evaluating their options for treatment and removal since at least 2002. In 2022, the City of Lincoln, Nebr., with funding assistance from the Nebraska Water Sustainability Fund, began cooperating with the U.S. Geological Survey to examine arsenic concentrations in surface water and groundwater in the lower Platte River valley and the area around the City of Lincoln Water System (LWS) well field.
Arsenic data collected from the Platte River since 1974 were examined using the “weighted regression on time, discharge, and season” model, which compared the streamflow (also referred to as “discharge”), time of year, and season to estimate concentrations of arsenic. Annual mean arsenic concentrations modeled for more than 49 years at the Platte River at Louisville, Nebr., U.S. Geological Survey streamgage (station 06805500), indicated a significant increasing trend. Arsenic concentrations in the Platte River were seasonal, with the highest concentrations being observed during mid- to late summer. When seasonal patterns and streamflow were combined with arsenic concentrations in the Platte River during low streamflow conditions, groundwater contributions, which can have higher arsenic concentrations, make up a larger portion of the streamflow.
Arsenic samples were collected from upstream rivers in 2022 and 2023 and were paired to analyze the arsenic contributions at the U.S. Geological Survey streamgage on the Platte River near Ashland, Nebr. (station 06801000), near the City of Lincoln well field. The arsenic concentrations from the streamgage on the Platte River near Ashland, Nebr., location, were higher than the U.S. Geological Survey streamgage on the Elkhorn River at Waterloo, Nebr. (station 06800500), and significantly lower than at the U.S. Geological Survey streamgage on the Platte River near Leshara, Nebr. (station 06796500), indicating that the Platte River usually contributes a higher concentration of arsenic than does the Elkhorn River as they join near Ashland, Nebr.
During 1991–2023, six groundwater monitoring wells were analyzed to identify trends in arsenic concentrations. Two of the six wells had a positive trend during the 33-year period. One monitoring well did not reveal a long-term trend during this period but showed a trend during 2019–23, correlating to a period when the island in the middle of the Platte River was connected to the east bank of the river when manganese reducing conditions were present and groundwater levels were declining in the well. Across all wells the oxidation and reduction (redox) condition during the time of sampling was assessed. Mixed anoxic and (or) oxic redox condition was the most common redox process and the highest sampled arsenic concentrations in monitoring wells were observed in anoxic conditions driven by manganese reduction. Groundwater arsenic concentrations had seasonal variation around the City of Lincoln well field, with higher arsenic concentrations tending to be further south in comparison to samples collected further north.
Isotope samples were collected and analyzed in surface water and groundwater around the LWS well field. The samples indicate that the proportion of surface water present in the LWS production wells can be higher in the spring and lower in the summer. With higher arsenic concentrations observed in the stream water during the summer period, the LWS source water can be affected by these elevated arsenic concentrations even though the proportion of surface water is lower.
Introduction
Naturally occurring arsenic can have an adverse effect on the quality of groundwater available for municipalities (Foster and Chilton, 2003). Arsenic exposure has been shown to cause some types of cancer and other health problems (Baris and others, 2016; Bulka and others, 2016; Lee and Davis, 2023). The City of Lincoln Water System (LWS) has been monitoring concentrations of arsenic in their source water and evaluating their options for treatment and removal since at least 2002 (City of Lincoln, 2023b). The City of Lincoln, Nebraska, gets its supply of drinking water from a well field near the Platte River, approximately 30 miles northeast of the city. This well field was the primary water supply for the 292,627 people in Lincoln in 2022 (U.S. Census Bureau, 2023). The wells pump an average of 40 million gallons of water per day for the City of Lincoln (City of Lincoln, 2023b), with a peak water demand in 2023 around 70 million gallons of water per day (City of Lincoln, 2023a). The City of Lincoln uses a variety of different wells to collect their source water.
In 2002, the Federal drinking water maximum contaminant level (MCL) for arsenic was lowered from 50 micrograms per liter (μg/L) to 10 μg/L (U.S. Environmental Protection Agency, 2001). After the 2002 MCL change, LWS increased their focus on arsenic. Groundwater monitoring wells around the well field historically have had elevated concentrations of arsenic, with ranges of arsenic concentrations as high as 12 μg/L (U.S. Geological Survey, 2023). LWS has blended their source water from several wells to maintain lower arsenic concentrations in supplied tap water (City of Lincoln, 2023b). The City of Lincoln meets the U.S. Environmental Protection Agency requirement of less than 10 μg/L of arsenic with typical arsenic concentrations of 6.4 to 6.5 μg/L in LWS tap water (City of Lincoln, 2023b). Additional knowledge about the sources of arsenic, trends in arsenic concentrations, and contributions to the LWS raw water supply can help the city minimize costs to treat or blend source water.
Previous U.S. Geological Survey (USGS) sampling results in monitoring wells within and around the LWS well field since 1991 show arsenic concentrations as high as 12 μg/L (U.S. Geological Survey, 2023). The LWS needed additional knowledge and understanding of the arsenic in the lower Platte River valley and alluvial aquifer to inform decisions affecting current and future operations and the construction of new wells. The goal of the LWS is to maintain the arsenic concentration in tap water below 80 percent of the MCL (8 μg/L).
In 2022, the LWS partnered with the USGS to assess isotope data and arsenic concentrations in the lower Platte River valley. Samples were collected by the USGS and provided the LWS with updated results to previous isotope sampling and arsenic sources in the lower Platte River valley (Steele, 2002). In addition to compiling historical USGS data, surface-water and groundwater samples were collected in 2022 and 2023.
Purpose and Scope
This report characterizes and assesses long-term trends in arsenic concentrations of the lower Platte River, Elkhorn River, and lower Platte River alluvial aquifer, and examines surface-water and groundwater interactions and contributions to LWS wells in relation to arsenic. The study results will assist LWS in understanding arsenic concentrations in the surface water of the Platte River and the groundwater in the lower Platte River alluvial aquifer and understand the contribution of surface water to the horizontal production wells.
This study sampled the arsenic concentration in surface water and groundwater around the Lincoln well field during 2022 and 2023. The sampled concentrations were compared to historical arsenic concentrations and between sites on the Platte and Elkhorn Rivers. Through funding from the USGS, LWS, and the Nebraska Water Sustainability Fund, 20 surface-water samples and 10 groundwater samples were collected. These samples were coordinated with other USGS sampling efforts to expand the spatial footprint of the study and to provide comparable data that aided the analysis of sampled arsenic concentrations throughout the lower Platte River valley.
Study Area Description
The study area for this report focuses on the lower Platte River valley (fig. 1). The Platte River near Ashland, Nebr., has a drainage area of 83,600 square miles (U.S. Geological Survey, 2023) that expands westward to the headwaters in the Rocky Mountains. The lower Platte River valley as defined by several state agencies is the portion of the Platte River that goes from the confluence of the Loup River near Columbus, Nebr., to the mouth of the Platte River at the Missouri River near Plattsmouth, Nebr. (Lower Platte River Corridor Alliance, 2025). Within the lower Platte River valley, tributaries with substantial drainage area and streamflow contributions include the Loup River, Shell Creek (not shown in fig. 1), the Elkhorn River, and Salt Creek.
For this study, streamflow information and arsenic concentrations collected at four streamgages were used (U.S. Geological Survey, 2023): the Platte River near Leshara, Nebr. (USGS station 06796500); Elkhorn River at Waterloo, Nebr. (USGS station 06800500); Platte River near Ashland, Nebr. (USGS station 06801000); and Platte River at Louisville, Nebr. (USGS station 06805500; fig. 1). The Platte River near Leshara, Nebr., streamgage is farthest upstream in the study, about 16 miles upstream from the LWS well field island (fig. 1). Within the Elkhorn River Basin, the Elkhorn River at Waterloo, Nebr., site (USGS station 06800500) is the furthest downstream. Within the Platte River Basin, the Platte River near Ashland, Nebr., site is the furthest downstream, and also upstream from the LWS well field (fig. 1). Prior sampling data were compiled from USGS streamgages on the Platte River at Louisville, Nebr., and the Elkhorn River at Waterloo, Nebr. This study added additional arsenic samples from the Platte River near Ashland, Nebr., and the Platte River near Leshara, Nebr., streamgages.
The LWS well field is predominantly in the Platte River alluvium near Ashland, Nebr. A USGS streamgage is on the Platte River near the LWS well field (Platte River near Ashland, Nebr. [station 06801000]). Streamflow data at this streamgage began in 1929; however, no daily streamflow values were collected in water years 1960 through 1988. The mean daily streamflow at this streamgage during the 66 years of monitoring has been 6,200 cubic feet per second. Streamflow is seasonal as observed from the 66 years of historical record (U.S. Geological Survey, 2023). The climate of eastern Nebraska is defined by cold winters, hot summers, humidity, and variable precipitation (Bathke and others, 2014).
Because of the LWS well field’s proximity to the Platte River, the wells can be susceptible to changes in water quantity and quality in the Platte River, particularly the horizontal collector wells, which are LWS production wells that pump water classified as groundwater under the direct influence of surface water (City of Lincoln, 2023a). Surface water has been shown to potentially affect the water quality in source water collected by collector wells (Haj and others, 2023).
An island bisects the Platte River into two branches (eastern and western) in the area of the LWS well field (fig. 1). LWS collector wells are on the island and on the eastern bank adjacent to the eastern branch. Severe flooding of the lower Platte River in the spring of 2019 deposited enough sand in the eastern branch to cut it off from surface flows when the flood receded. Though this is likely a transient situation that may return to a flowing condition with subsequent high flows, the eastern channel was dry during the duration of this study (late 2019 through 2023). The effects of a dry eastern branch on the water being pumped by the collector wells are uncertain and could be a potential cause of geochemical change in the supply of source water to LWS.
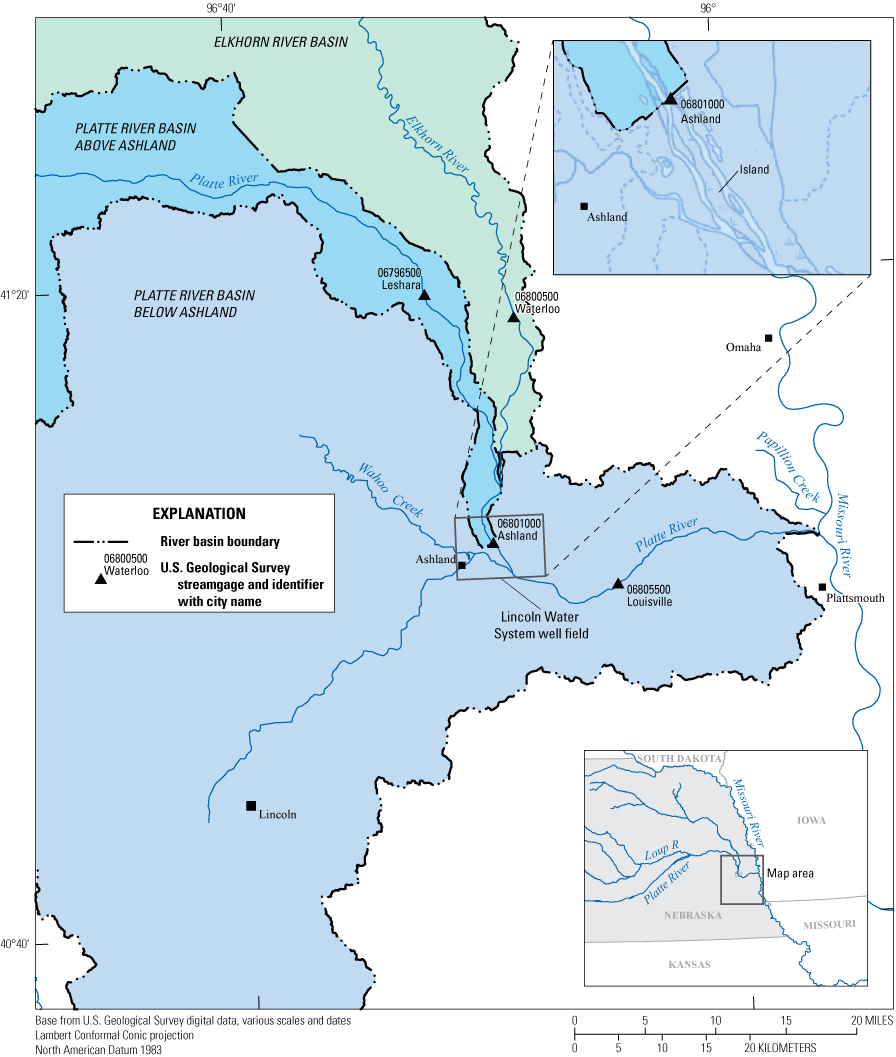
Map showing contributing area to the lower Platte River Basin of Nebraska. Data from U.S. Geological Survey (2023).
Hydrology and Hydrogeology
The Platte River receives streamflow from a large drainage area of 83,600 square miles. Most of the basin is west of the lower Platte River but only contributes around 24 percent of annual mean flows (U.S. Geological Survey, 2023). The Loup and Elkhorn Rivers drain about 25 percent of the total Platte River watershed area but contribute around 75 percent of annual mean flows to the Platte River near Ashland, Nebr. (U.S. Geological Survey, 2023). The Platte River is a braided river that is wide and shallow. With large, braided rivers, greater distances are needed to fully mix stream water (Kilpatrick and Wilson, 1989). With the mouths of the Elkhorn River and Loup River in close proximity to sampling sites, the mixing of the channel was assumed to be poor throughout the lower Platte River valley.
The Platte River valley is underlain by the Platte River alluvial aquifer, which consists of Quaternary-age gravel, sand, and silt (Verstraeten and others, 1998). Recharge to the Platte River alluvial aquifer comes predominately from precipitation, recharge from hydraulically connected surficial sand and gravel aquifers, and recharge from the Platte River (Verstraeten and others, 1998).
A previous study looking at multiple monitoring wells around the Lincoln well field estimated that the Platte River contributes between 8 and 50 percent of the surface water to the adjacent aquifer (Steele, 2002). Steele (2002) also looked at the age of the groundwater near the well field, which in 2002 was estimated to be from the mid-1980s. In general, monitoring wells that had water with the oldest apparent ages were the farthest from the Platte River and northwest of the LWS well field (fig. 1; Steele, 2002). The results of sampling for stable isotopes indicated that monitoring wells near sandpit lakes in the northwest part of the study area were recharged from the sandpit lakes (Steele, 2002). Monitoring wells to the west of the Platte River indicated recharge from precipitation. Monitoring wells on the island in the Platte River and to the east of the Platte River indicated recharge from a mix of precipitation and surface water. One monitoring well on an island in the Platte River was sampled, and results indicated modern groundwater (mid-1980s) and a stable isotopic signature consistent with precipitation (Steele, 2002).
Another previous study estimated the travel time between the Platte River and the underlying alluvial aquifer near the well field. During spring runoff events, herbicides in the Platte River traveled through the alluvial aquifer and into collector wells in 6 to 7 days (Verstraeten and others, 1999). Verstraeten and others (1999) also found that 20 to 50 percent of the water in the collector wells was surface water. The previous studies were done before two additional collector wells were installed in 2014 (fig. 1).
Geochemical Characteristics of Arsenic
Arsenic in groundwater can be from geologic sources or from anthropogenic sources. Previous studies have established an association between glaciated sediments and high arsenic groundwater concentrations (Welch and others, 2000; Erickson and Barnes, 2005). Within groundwater, elevated arsenic concentrations are associated with anoxic conditions and older groundwater samples (Welch and others, 2000; Erickson and Barnes, 2005). Groundwater with anoxic conditions such as high iron and low dissolved oxygen are indicators of high arsenic (Erickson and others, 2018, 202113). The source of arsenic under these conditions is likely iron oxides because of their abundance in aquifers. Under anoxic conditions, arsenic can be released from iron oxides through reductive desorption or dissolution (Thomas, 2007). Arsenic is also released under oxic conditions from iron oxides but at much lower concentrations (Welch and others, 2000; Smedley and Kinniburgh, 200231; Thomas, 2007). Arsenic can be mobilized across a wide range of oxidation and reduction (redox) conditions making it difficult to predict the arsenic concentration in one well using the results of neighboring wells, so accurate understanding requires sampling each well (Smedley and Kinniburgh, 2002).
Sample Collection and Analysis Methods
The following section describes methods used for sample collection of surface water and groundwater and analysis methods used to assess the sample results. For all statistical tests in the study, the result was considered significant if the probability value (p-value) of the applied test was less than 0.05.
Sample Collection
Surface-water and groundwater samples were collected and analyzed, and sample data described in this report were archived on the USGS National Water Information System (U.S. Geological Survey, 2023). The following section describes the methods by which the samples were collected.
Surface-Water Samples
Two surface-water locations (USGS streamgages on the Platte River near Leshara, Nebr. [station 06796500], and Platte River near Ashland, Nebr. [station 06801000]) were sampled for this study (fig. 1). Samples collected at a third USGS streamgage (Elkhorn River at Waterloo, Nebr. [station 06800500]; fig 1) for a national water-monitoring program, USGS National Water Quality Network (NWQN; U.S. Geological Survey, 2025), were used to coordinate the timing of the sampling at the Platte River near Leshara, Nebr., and Platte River near Ashland, Nebr. Each of the three locations were sampled 10 times during March 2022–July 2023 at a bimonthly sample interval. Sample collection followed methods described in the USGS National Field Manual (U.S. Geological Survey, 2018). Depth integrated subsamples were collected from 10 evenly spaced sampling locations across the channel width and were combined in a churn to achieve a streamflow-weighted sample. The sample was then transported to the USGS laboratory in Lincoln, Nebr., where the churn was used to mix and then split the water into sample bottles.
Water samples were collected at the Platte River near Leshara, Nebr., streamgage on days when samples concurrently were collected at the Elkhorn River at Waterloo, Nebr., streamgage for the USGS NWQN. Samples were paired by date to compare the respective rivers upstream from the LWS well field. Both locations have an approximate 24-hour time of travel to the Platte River near Ashland, Nebr., streamgage near the LWS well field that was estimated based on water velocity during base streamflow. The day after the Elkhorn River and Platte River were sampled, a sample was collected at the Platte River near Ashland, Nebr., to capture the mixed water from the upstream sources. This paired-sampling approach was designed to minimize extraneous variability and to allow the concentrations of the combined water to be referenced together to help provide insight into the sources of the arsenic present in the Platte River near the well field.
In addition to 10 samples from the USGS streamgages on the Platte River near Leshara, Nebr. (station 06796500), and Platte River near Ashland, Nebr. (station 06801000), arsenic concentrations collected for the USGS NWQN were compiled for use in statistical analysis. The NWQN has been collecting water quality data throughout the nation for decades and has two sites in the lower Platte River valley that have been routinely sampled for arsenic. Arsenic data are available for the USGS streamgage on the Platte River at Louisville, Nebr. (station 06805500), beginning in 1974, and arsenic data for the USGS streamgage on the Elkhorn River at Waterloo, Nebr. (station 06800500), are available beginning in 1970. Arsenic data were collected at both locations using the methodology mentioned above and followed the methods described in the USGS National Field Manual (U.S. Geological Survey, 2018). To evaluate arsenic trends, 343 samples from the USGS streamgage on the Platte River at Louisville, Nebr. (station 06805500), and 272 samples from the USGS streamgage on the Elkhorn River at Waterloo, Nebr. (station 06800500), were used.
Groundwater Samples
Groundwater samples were collected from 9 LWS well field monitoring wells and 4 LWS production wells. Arsenic data collected from these monitoring wells and the LWS production wells were used for the analysis.
Six monitoring wells in and around the LWS well field (fig. 1) have been sampled by the USGS since the early 1990s and were used in the analysis of this study. These include 2 monitoring wells on the west bank of the Platte River (M90–17R and M90–36R), 2 monitoring wells on an island in the middle of the Platte River (M91–38R and M90–34R), and 2 monitoring wells on the east bank of the Platte River (M90–30R and M90–33R; fig. 1). Samples have been collected approximately quarterly to annually since the early 1990s following methods described in the USGS National Field Manual (U.S. Geological Survey, 2018) and have been collected in cooperation with the LWS.
Groundwater sample collection from production wells was limited to those that were pumping at the time of sampling. Two of the production wells were sampled in May 2022, and all four production wells were sampled in August 2022. Water samples and ancillary data were collected following the methods described in the USGS National Field Manual (U.S. Geological Survey, 2018). The production wells were sampled from a spigot inside the well house designed for the collection of sample water.
For samples analyzed for isotopes, surface-water sites and groundwater monitoring wells were selected to parallel previous work done as described by Steele (2002). The deuterium (δ2H) and oxygen-18 (δ18O) isotopes of each sample were analyzed using established methods for fresh water (Revesz and Coplen, 2008). Stable isotopes of water were analyzed in 24 surface-water and groundwater samples collected in the lower Platte River valley during the summer of 2022. Surface samples came from the Platte River (9 samples) and Elkhorn River (4 samples). Groundwater samples came from monitoring wells (5 samples), and LWS production wells (6 samples).
For this study, isotopic samples were collected in April 2022 from the 4 production wells and 5 of the 6 monitoring wells. Monitoring well M90–17R, which was sampled previously, was destroyed during flooding in 2019 and thus was not sampled.
Sample Processing
All samples were processed and preserved according to the USGS National Field Manual (U.S. Geological Survey, 2018). They were shipped from the USGS office in Nebraska to be analyzed at USGS laboratories. Isotope samples were analyzed at the USGS Reston Stable Isotope Laboratory in Reston, Virginia. All other USGS samples were analyzed for nutrients, major ions, and metals (including arsenic) by the USGS National Water Quality Laboratory in Denver, Colorado.
Quality Assurance and Quality Control
For this study, all discrete surface-water and groundwater samples that were collected followed protocols outlined by the USGS National Field Manual (U.S. Geological Survey, 2018). All sample data collected for the study were reviewed and approved within the USGS Central Plains Water Science Center. To verify the accuracy of the data, all collected sample data were referenced to historical sample data to identify outliers. Additionally, replicate samples were collected to determine the repeatability of the sampling methods, and equipment and field blanks were collected to assure that no outside contamination was present that might affect the quality of the samples.
Analysis of Arsenic in the Lower Platte River
The arsenic concentration data in the Platte and Elkhorn Rivers were examined for spatial and temporal changes. These analyses were compiled and examined using the R statistical environment (R Core Team, 2016).
Weighted Regression on Time, Discharge, and Season
To assess long-term arsenic concentrations in the Platte and Elkhorn Rivers, models were constructed using the weighted regression on time, discharge, and season (WRTDS; Hirsch and others, 2010) model implemented in the Exploration and Graphics for RivEr Trends (EGRET) R package (Hirsch and De Cicco, 2015). The WRTDS model uses the variables of time, streamflow (discharge), and season as weighted variables to estimate daily concentrations for days when no data were collected (Hirsch and De Cicco, 2015). The EGRET package creates a variety of outputs that aid in the visualization of trend behavior for the selected constituent and has the capability to examine temporal trends related to streamflow. Streamflow normalization is used by WRTDS when modeling, with the option to consider stationary and nonstationary streamflow conditions. The WRTDS model was run under both stationary and nonstationary streamflow normalization to determine the effects of streamflow on the water quality.
Streamflow and sample data from two locations in the lower Platte River valley were used for the WRTDS analysis. The USGS streamgage on the Platte River at Louisville, Nebr. (station 06805500), had periodic samples that included arsenic beginning December 4, 1974, and daily streamflow values for the same period. The USGS streamgage on the Elkhorn River at Waterloo, Nebr. (station 06800500), had periodic samples that included arsenic beginning March 5, 1970. For the WRTDS analysis in this report, samples collected after July 18, 2023, were not included. The periodic samples from these sites were collected approximately monthly or quarterly for 53 years as part of a long-term USGS sampling program. The periodic sampling was interrupted by gaps during which no data were collected. Gaps in periodic monthly sampling at the Platte River at Louisville, Nebr. (station 06805500), include 1992–94 and 2001–06. Gaps in periodic monthly sampling at the Elkhorn River at Waterloo, Nebr. (station 06800500), include 1992–2011. These gaps were filled using WRTDS to estimate daily values based on existing sample data paired with the weighted season, time, and streamflow.
Streamflow Anomalies
Streamflow anomalies (Ryberg and Vecchia, 2012) are the comparison of streamflow variability during a short period to streamflow variability during a longer time. Two USGS streamgages were selected for analysis of streamflow anomalies based on the length of arsenic concentration data available for the analysis: Platte River at Louisville, Nebr. (station 06805500), and Elkhorn River at Waterloo, Nebr. (station 06800500). The two sites had a period of streamflow anomaly analysis beginning October 1, 2021, and ending July 31, 2023, to align with the study period. Three streamflow anomalies were computed for each site. The short-term streamflow anomaly compared the daily streamflow to the 10-day mean streamflow, the medium-term streamflow anomaly compared the 10-day mean streamflow to the 100-day mean streamflow, and the long-term streamflow anomaly compared the 100-day mean streamflow to the entire period of analysis.
Analysis of Variance
A multifactor analysis of variance (ANOVA) test can determine the influence of one of several factors upon the magnitude of observations while compensating for the other factors (Helsel and others, 2020). An ANOVA test was used to assess the influence of long-, medium- (10-day mean streamflow to the 100-day mean streamflow), and short-term (daily streamflow to the 10-day mean streamflow) streamflow anomalies on arsenic concentrations. The sample data and corresponding streamflow anomalies were compiled and processed using R. A multifactor ANOVA test was run to compare the influence of all factors, including streamflow anomalies, on the daily mean arsenic value. This multifactor ANOVA test was done on discretely sampled arsenic concentrations from the Platte and Elkhorn Rivers to calculate the influence of base-streamflow contributions of groundwater from March 2022 through July 2023.
Paired Sample Data
Paired surface-water sample data collected in 2022 and 2023 were analyzed to determine if the arsenic concentrations from different contributing basins were statistically different. The water samples collected from the USGS streamgages on the Platte River near Leshara, Nebr. (station 06796500), and near Ashland, Nebr. (station 06801000), and the Elkhorn River at Waterloo, Nebr. (station 06800500), were analyzed for arsenic concentrations, and the data were compared using a 2-sided paired t-tests (Helsel and others, 2020). The sample data were compiled and processed using R to compare the two surface-water sites with 10 samples at each site.
Analysis of Groundwater and Isotopic Data
The arsenic concentration in groundwater and isotopic data were examined for spatiotemporal changes. These analyses were compiled and examined using R statistical software program (R Core Team, 2016).
Analysis of Groundwater Data
Nine monitoring wells sampled by the USGS are around the LWS well field (fig. 1). Arsenic data are available from the early 1990s for 6 of these monitoring wells and from 2018 to the present for 3 monitoring wells. A simple linear regression (Helsel and others, 2020) was done on arsenic concentrations beginning in the early 1990s for samples collected at six monitoring wells surrounding the LWS well field with at least 10 years of available arsenic data to determine if any temporal trends may be occurring in the groundwater throughout the study area.
The six wells with long-term data were assessed for dominant redox processes in the monitoring wells. Knowledge of the oxidation-reduction conditions and processes present in each well at each sampling period improves understanding of the species and solubility of arsenic that may be present. The well assessments for redox followed established techniques outlined by McMahon and Chapelle (2008). These techniques use existing sample data (U.S. Geological Survey, 2023) for nitrate, manganese, iron, sulfate, iron/sulfide, and dissolved oxygen to define the redox category. The well assessments for redox were limited to wells sampled between 2008 and 2023, because previous samples did not include the complete set of required analytes.
Temporal plots were created for the different redox processes present at the time of sampling for each monitoring well. The redox processes present were identified and correlated with the arsenic concentration values, which were sampled concurrently. The temporal plots for redox processes at each monitoring well were grouped by proximity to the USGS streamgage on the Platte River near Ashland, Nebr. (station 06801000), to identify redox conditions in relation to arsenic concentrations.
To determine the seasonal change in groundwater arsenic between 2018 and 2023, arsenic concentrations across the entire study area were categorized by sampling date for four seasons: December 1–February 28, March 1–May 31, June 1–August 31, and September 1–November 30. For each season, a raster map was created based on spatial interpolation and extrapolation of the sample points using inverse distance weighting implemented in ArcGIS Pro version 3.0 (Esri, 2017).
Analysis of Isotope Data
In this study, the Global and Local Meteoric Water Line was used to compare isotope data collected from surface-water and groundwater samples to evaporative rates. As water evaporates from surface water into the atmosphere, the lighter isotopes evaporate first, which can create a negative deuterium excess (d-excess) value in the remaining water (Gibson and others, 2020). The water samples from surface water and groundwater with d-excess isotope ratios were compared based on seasonality (winter versus summer recharge) and source (stream versus precipitation). To compare isotope data between 2001 and 2022, the different climatic conditions present in the lower Platte River valley each year were considered. The Palmer Drought Severity Index was used as a comparison method between climatic years of 2001 and 2022. This index is one metric used to classify climatic and hydrologic conditions into categories that range from extremely moist to extreme drought (National Centers for Environmental Information, 2024).
Isotopic ratios can be compared between stream water and production wells to determine the proportion of surface water in the source water (Clark and Fritz, 1997). An endmember mixing model was used to determine what portion of groundwater recharge in the production wells comes from surface water or precipitation (Bowen and others, 2005, 20113). Endmember mixing models use the difference in the geochemical signatures of stream water and groundwater to aid in the tracing of source water (Christophersen and Hooper, 1992). The endmember mixing model was constructed using the stable isotopes data from a gridded national map of annual precipitation and an assumed value of −7.9 parts per thousand from Bowen and others (2005), the groundwater in the production wells, and the surface-water samples collected at the USGS streamgage on the Platte River near Ashland, Nebr. (station 06801000; U.S. Geological Survey, 2023).
Arsenic Assessments in the Lower Platte River
The results of surface-water sampling provide a perspective on the spatial and temporal trends in arsenic in the lower Platte River and help to identify possible sources of arsenic that reach the LWS well field. Arsenic concentration data from the Platte River were compared to the arsenic concentration data from the Elkhorn River to identify if any spatial differences were present. Long-term trends, defined as trends occurring during 10 years, were assessed based on data interpolation models. Paired sampled data were used to compare arsenic concentrations in surface water to better understand how it may contribute arsenic concentrations to the LWS well field. The following sections describe the results of arsenic assessments in the lower Platte River.
Long-Term Daily Arsenic Trends
Long-term statistical trends were analyzed using data collected from two USGS streamgages in the lower Platte River Basin: the Platte River at Louisville, Nebr. (station 06805500), and the Elkhorn River at Waterloo, Nebr. (station 06800500). WRTDS models were created and used the discrete sample data in regressions with streamflow, season, and year to assess trends in arsenic concentration in the rivers. The models created through WRTDS regressions with the discrete samples were then used to calculate daily estimated values of arsenic for the Platte River at Louisville, Nebr., for the entire study period of 1970–2023 (fig. 2A). The daily values were used to explore potential temporal trends in arsenic concentrations.
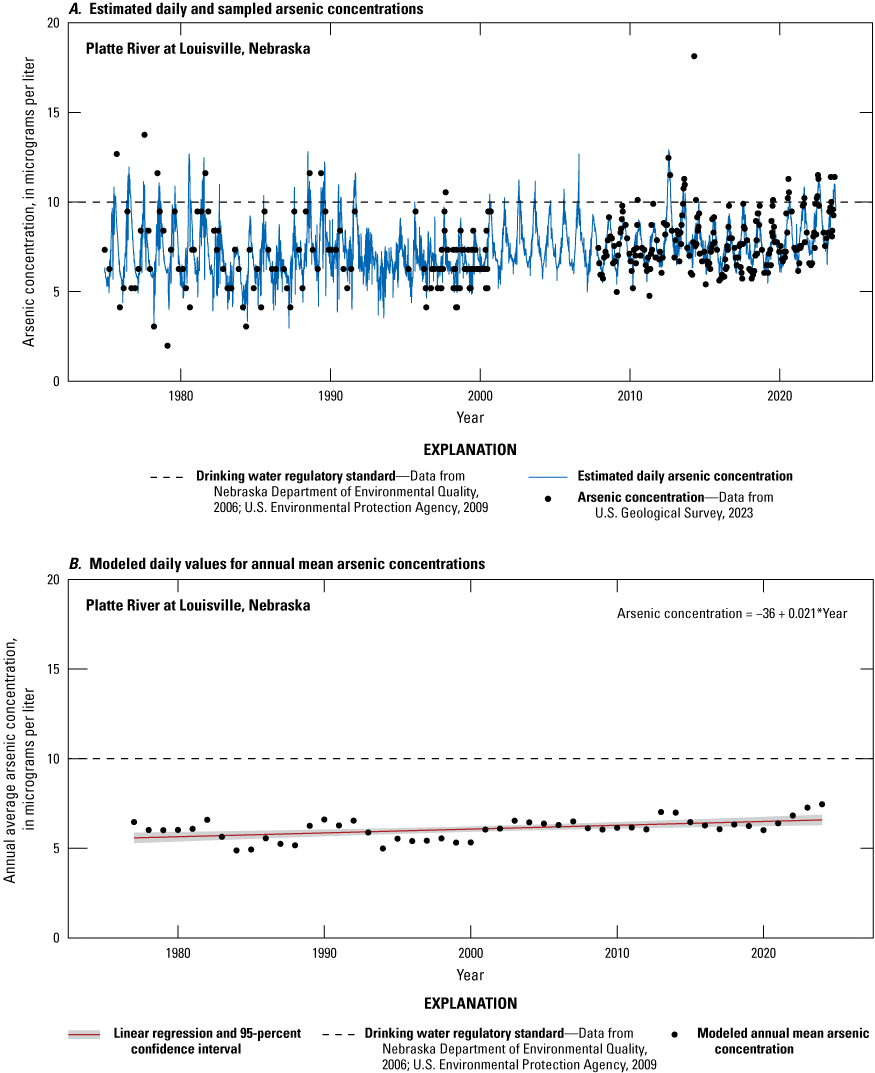
Scatterplots showing arsenic concentration trends from the U.S. Geological Survey streamgage on the Platte River at Louisville, Nebraska (station 06805500), from 1974 to 2023. A, Estimated daily and sampled arsenic concentrations. B, Modeled daily values for annual mean arsenic concentrations.
For the period of 1970 through July of 2023, 343 samples from the USGS streamgages on the Platte River at Louisville, Nebr. (station 06805500), and 272 samples from the Elkhorn River at Waterloo, Nebr. (station 06800500), were used to examine arsenic trends. A seasonal pattern of discrete arsenic concentrations in the sample data were evident for the Platte River at Louisville, Nebr. (fig. 3). Using the sampled arsenic concentrations from the stream to assess monthly averages, concentrations of arsenic were observed to be higher during the summer months and lower during the winter months (fig. 3). The seasonal pattern shows the highest arsenic concentrations present during the peak LWS pumping periods and the lowest average monthly streamflow. Mean Platte River values during the winter months were generally less than 6 μg/L, whereas during the summer months, the mean arsenic values were around LWS’s drinking water target maximum of 8 μg/L.
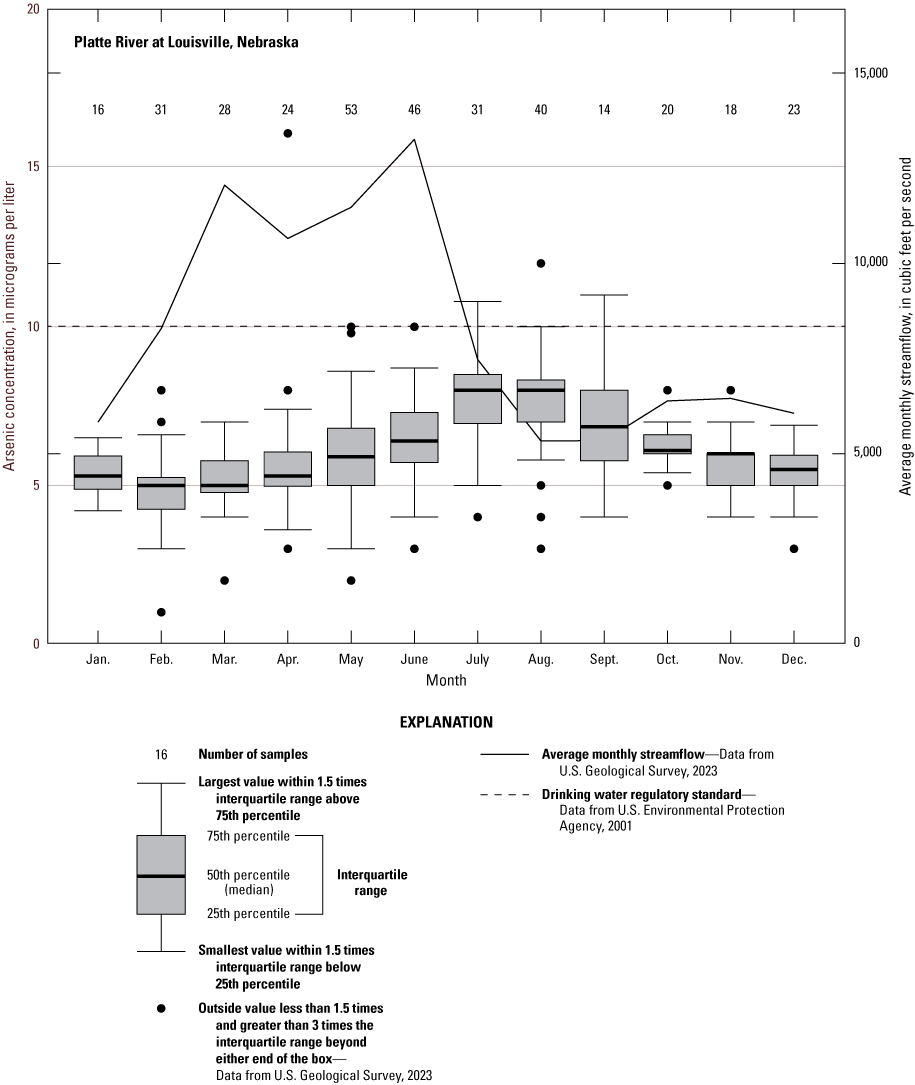
Boxplot diagram and graph showing discretely sampled arsenic concentrations at the U.S. Geological Survey streamgage on the Platte River at Louisville, Nebraska (station 06805500), from 1974 to 2023 and summarized by month.
Using the daily values of arsenic concentration in the Platte and Elkhorn Rivers that were calculated within WRTDS, annual mean concentrations were computed. A simple linear regression over time was run on these annual mean concentrations to look for any potential long-term temporal trends for arsenic in the lower Platte River. The linear regression in arsenic concentrations at the USGS streamgage on the Platte River at Louisville, Nebr. (station 06805500), showed a significant increase in arsenic concentration in the stream during 1974–2023 (p-value less than 0.001; fig. 2B), whereas the annual mean values for arsenic data at the USGS streamgage on the Elkhorn River at Waterloo, Nebr. (station 06800500), did not show trends of statistical significance during the period of 1970–2023 (p-value=0.20).
Seasonal arsenic concentrations were inverse to seasonal streamflow trends in the Platte River (fig. 3). Arsenic concentrations were observed to be the highest in the summer months and the lowest in the winter months. Results of the WRTDS model demonstrated an inverse relation between streamflow and arsenic (fig. 4.).
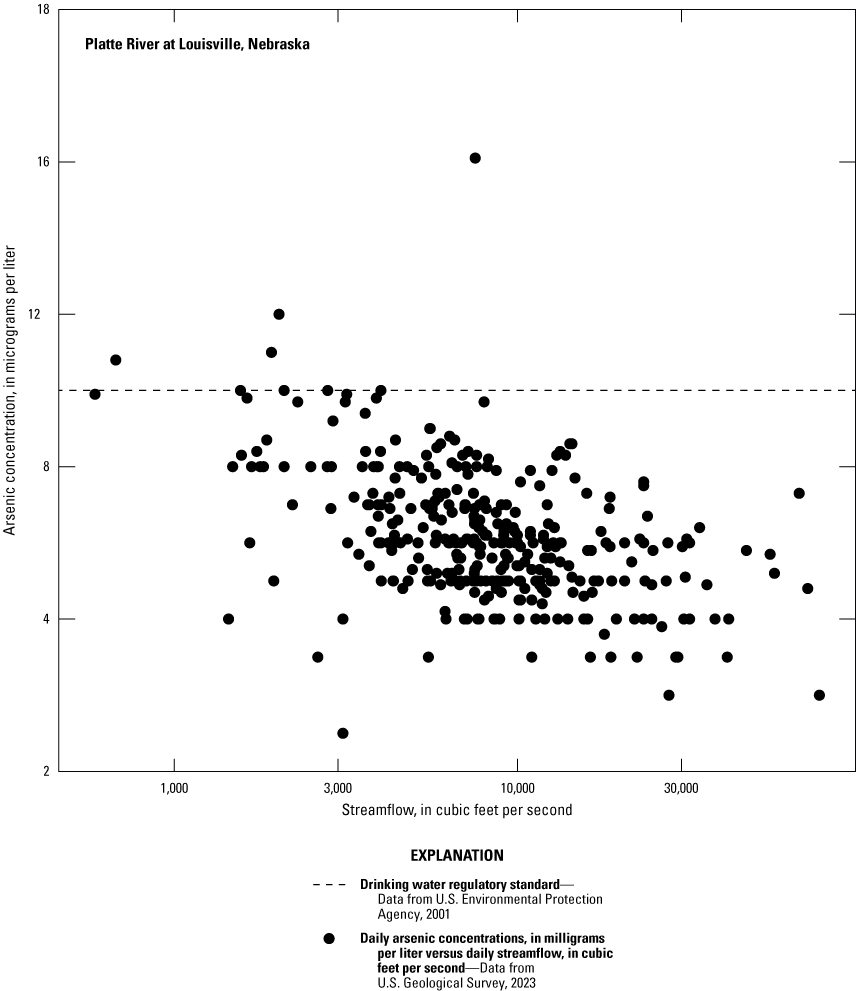
Diagram showing discretely sampled arsenic concentrations (343 results) plotted against streamflow at the U.S. Geological Survey streamgage on the Platte River at Louisville, Nebraska (station 06805500), showing an inverse relation.
The inverse relation of arsenic to streamflow observed in figure 4 led to an exploration of streamflow trends in relation to arsenic trends. Streamflow at the USGS streamgage on the Platte River at Louisville, Nebr. (station 06805500), indicated a significant positive trend in most annual low streamflows (Dietsch and Strauch, 2020) during the last 50 years. The USGS streamgage on the Elkhorn River at Waterloo, Nebr. (station 06800500), has shown significant positive trends for annual mean streamflow and low streamflow periods (Dietsch and Strauch, 2020). Dietsch and Strauch (2020) were not able to identify casual factors, including precipitation, for these trends. The EGRET WRTDS package includes functionality to analyze the annual 7-day low average streamflow in the Platte and Elkhorn Rivers. The temporal trend results from EGRET examined the lowest 7-day average of streamflow and found an increase in low streamflows that aligned with the findings reported by Dietsch and Strauch (2020). Increasing arsenic contributions may be related to increased groundwater contributions to streamflow at the Platte River at Louisville, Nebr. (station 06805500; U.S. Geological Survey, 2023) over the past 53 years.
Another indication that arsenic concentrations in the Platte and Elkhorn Rivers are determined largely by the base-streamflow contribution of groundwater is shown by the effect streamflow anomalies have on arsenic concentrations. For the ANOVA tests used to assess the influence of long-, medium-, and short-term streamflow anomalies on discretely sampled arsenic concentrations from March 2022 through July 2023, only the medium-term streamflow anomaly (10- to 100-day streamflow variability) significantly influenced arsenic concentrations at the USGS streamgages on the Platte River at Louisville, Nebr. (station 06805500; p-value=0.01), and on the Elkhorn River at Waterloo, Nebr. (station 06800500; p-value=0.02). The ANOVA tests for short-term (1- to 10-day) and long-term (100-day to the entire period of record) anomalies did not show significant influence (p-value less than 0.05) on the mean arsenic concentration. Negative medium-term streamflow anomalies (lower streamflow in the past 10 days compared to the past 100 days), a condition that would result from low streamflow contributed mostly from base streamflow, had a positive relation with arsenic concentrations, which is shown by a significant difference in the mean arsenic concentration.
The seasonality patterns and streamflow relations with the discretely sampled arsenic values support the hypothesis that groundwater-derived base streamflow is influential on arsenic concentrations in the lower Platte River. The highest stream arsenic concentrations were observed during mid to late summer (July and August; figs. 3 and 5). These months typically have higher evaporative and plant water demands and lower precipitation, leading to lower streamflow (U.S. Geological Survey, 2023). With low streamflow increasing in the several streams contributing to the lower Platte River over the past 53 years (Dietsch and Strauch, 2020), increased groundwater influences on the stream likely contribute to changes in arsenic concentrations. Several factors likely contribute to elevated arsenic concentrations in groundwater, including local geology, groundwater age, and streamflow conditions (Welch and others, 2000).
Paired Sample Data
To better understand the arsenic concentrations in surface water that contribute to the LWS well field area, samples collected during 2022 and 2023 from the USGS streamgages on the Platte River near Leshara, Nebr. (station 06796500), and the Elkhorn River at Waterloo, Nebr. (station 06800500), were compared to samples collected the following day at the Platte River near Ashland (station 06801000), based on a 24-hour travel time estimate (fig. 5). A statistical assessment was done to compare concentrations among the three sampling sites.
Using 2-sided paired t-tests (Helsel and others, 2020), arsenic concentrations from the upstream Platte and Elkhorn Rivers were compared for the 10 samples collected in 2022–23 at the USGS streamgages. The mean arsenic concentration at the USGS streamgage on the Platte River near Leshara, Nebr. (station 06796500), was the highest of the three surface-water sample sites (table 1). The arsenic concentration was significantly higher than the USGS streamgage on the Platte River near Ashland, Nebr. (station 06801000), with a mean concentration difference of 0.18 μg/L (p-value=0.04, table 1), and the arsenic concentration was higher than the Elkhorn River at Waterloo, Nebr. (station 06800500), with a mean concentration difference of 0.92 μg/L (p-value=0.06, table 1). Overall, the Elkhorn River samples also had a lower arsenic concentration than the samples from the Platte River near Ashland, Nebr., with a mean concentration difference of −0.74 μg/L (p-value=0.09, table 1), though the two streams were not significantly different and some paired samples were similar in arsenic concentrations. These results indicate that across the study period, the Platte River contributed a higher concentration of arsenic than the Elkhorn River at the confluence.
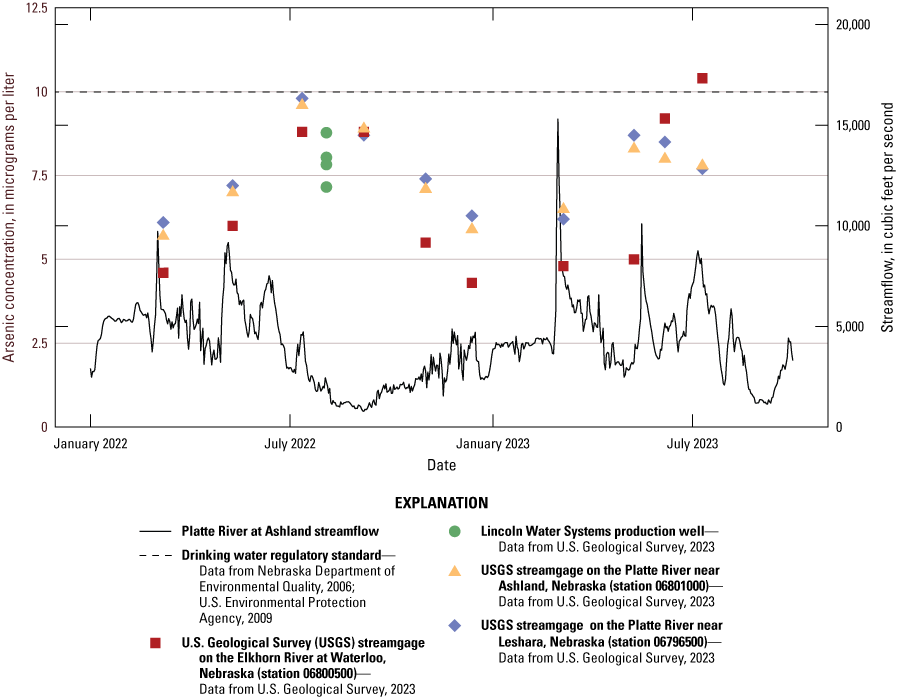
Graph showing discretely sampled arsenic concentrations and streamflow from March 2022 to July 2023 from the lower Platte River.
Table 1.
Mean difference and probability value (p-value significance less than 0.05) of paired t-tests from 10 paired samples of arsenic. Concentrations from the U.S. Geological Survey streamgages on the Elkhorn River at Waterloo, Nebraska (station 06800500), the Platte River near Leshara, Nebraska (station 06796500), and the Platte River near Ashland, Nebraska (station 06801000), March 2022 to July 2023.[USGS data accessed via U.S. Geological Survey (2023). USGS, U.S. Geological Survey; µg/L, microgram per liter; p-value, probability value]
Arsenic Concentrations in Groundwater around the Lincoln Well Field
The LWS well field draws from an alluvial aquifer that receives recharge from the Platte River. Recharge to this aquifer also comes from precipitation and inflow from hydraulically connected sand and gravel aquifers (Verstraeten and others, 1999); therefore, assessing the arsenic concentrations in the aquifer and the relative contribution of these adjacent aquifers to the alluvial aquifer is important for understanding arsenic concentrations in the collector wells. Furthermore, this relative contribution may have been affected by sedimentation from spring 2019 flooding that closed off a side channel of the Platte River on the eastern side of the river.
Groundwater Arsenic Analysis
Groundwater samples were analyzed for arsenic concentrations in nine monitoring wells in the Platte River alluvial aquifer during 2018–23. A total of 71 samples were collected during the period at a frequency of approximately quarterly. During this period, the higher arsenic concentrations tended to be further south in the LWS well field area, whereas samples collected farther north and on the east bank tended to be lower during the same season (figs. 6A–D). The concentrations varied by season, with concentrations in the south ranging 1–2 µg/L higher.
The monitoring wells also demonstrated that groundwater arsenic concentrations had seasonal variation around the LWS well field. Groundwater arsenic concentrations were approximately 1–2 µg/L higher in the summer and fall months when compared to the winter and spring months (fig. 6A–D).
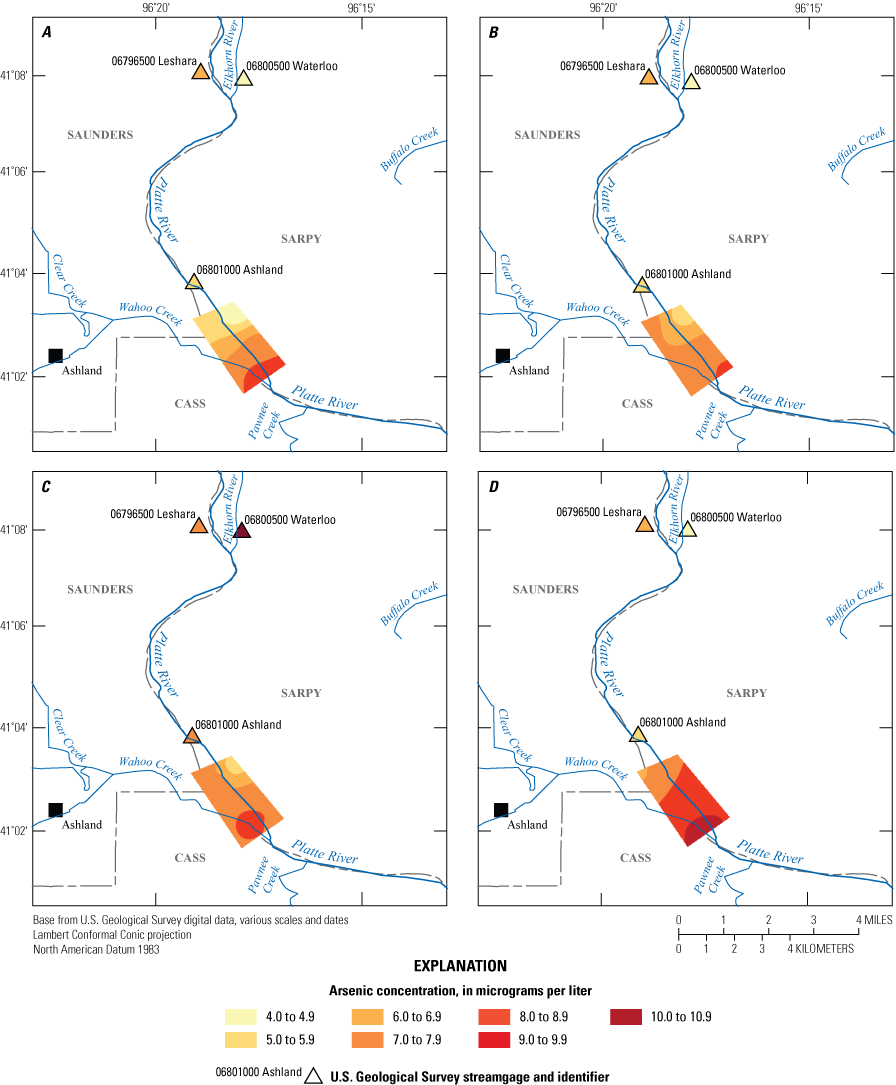
Maps showing mean surface-water and interpolated groundwater arsenic concentrations in micrograms per liter for all samples collected during 2018–2023: A, Winter months (December 1–February 28), B, Spring months (March 1–May 31), C, Summer months (June 1–August 31), and D, Fall months (September 1–November 30). Groundwater arsenic concentrations were interpolated across the City of Lincoln Water System well fields using inverse distance weighting. Data from U.S. Geological Survey, 2023.
Of the 9 monitoring wells with arsenic concentration data, 6 wells had arsenic samples available as far back as 1991. These six wells had enough historical data to explore trends in the results that might indicate changes in the aquifer surrounding the LWS well field. The arsenic concentrations for the wells were analyzed for any trends that may have been occurring from 1991 through 2023 near the LWS production wells. These six monitoring wells also had the data analyzed by redox process from 2008 to 2023. Using linear regressions on arsenic concentrations over time to determine if any trends were present, 2 of these 6 wells showed a positive trend during the periods when data were collected (fig. 7). Monitoring well M91–38R, located on the island bisecting the Platte River (fig. 1), showed a positive trend from 1993 through 2023 (p-value=0.04) and monitoring well M90–30R showed a positive trend from 1994 through 2023 (p-value=0.03). The other four wells with a long running record of data did not show any significant trend.
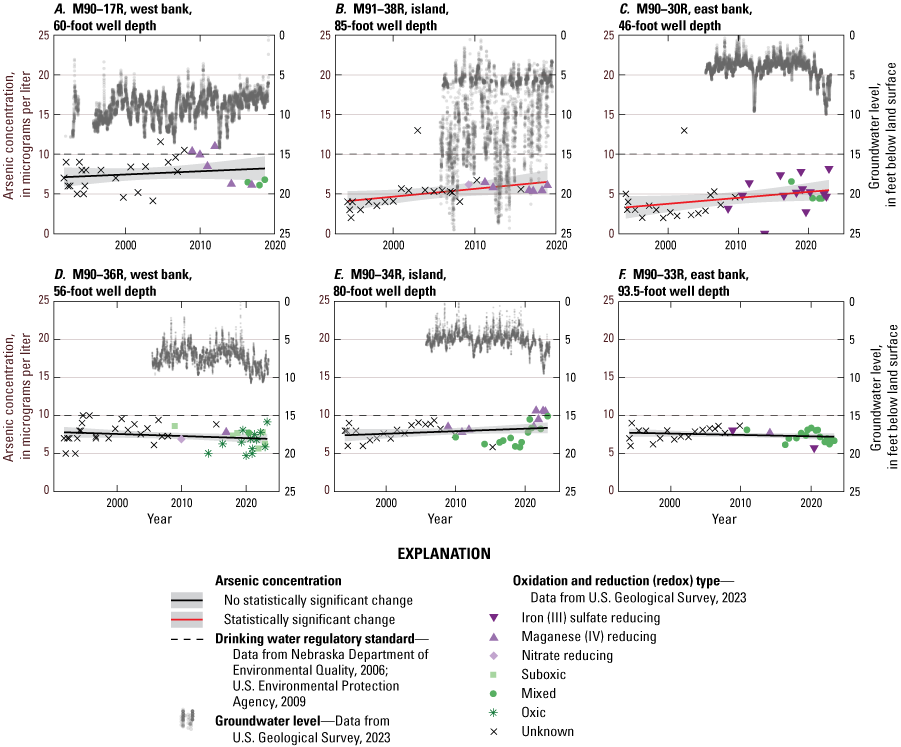
Graphs showing comparison of arsenic concentrations in water samples from six monitoring wells within the City of Lincoln Water System well field. A, M90–17R, west bank, 60-foot well depth. B, M91–38R island, 85-foot well depth. C, M90–30R, east bank, 46-foot well depth. D, M90–36R, west bank, 56-foot well depth. E, M90–34R, island, 80-foot well depth. F, M90–33R, east bank, 93.5-foot well depth. Wells are grouped together west to east by location proximity to the Platte River near Ashland, Nebraska.
The six groundwater monitoring wells examined for arsenic changes in the aquifer from 1991 to 2023 were also examined to assess their redox condition during the time of sampling (fig. 7). During 2008–23, 101 samples were obtained and provided the quantity of data necessary to assess the redox conditions present. Out of these samples, mixed anoxic/oxic redox condition was the most common (27 occurrences). Anoxic manganese reducing conditions were the next most common (23 occurrences), and the remainder of samples were in other types of redox processes. The highest arsenic concentrations in the monitoring wells were observed in anoxic reducing conditions where the manganese redox process was present. In monitoring wells M90–17R and M90–34R, five samples were analyzed with concentrations that exceeded 10 μg/L. The highest concentration observed during the study period was 11.0 μg/L from well M90–17R. Only one well (M90–36R) had samples with oxic conditions (13 occurrences) during the period, and arsenic concentrations in oxic conditions ranged from 4.7 to 9.1 μg/L (fig. 7).
Continuous water level data were available at 5 of the 6 monitoring wells (fig. 7) and examined for arsenic concentration and redox condition. The water level data varied from well to well and had no consistent trend across the well field; however, three monitoring wells (M90–36R, M90–30R, and M90–34R) showed changes in the reducing conditions as the water levels dropped during 2019 to 2023 (fig. 7). Concurrent to the water level changes during this period, only monitoring well M90–34R had an increasing trend in arsenic concentration during 2019 to 2023. The rise in arsenic concentration at that well was present during manganese and mixed anoxic/oxic conditions, whereas the other two wells had anoxic iron reducing, mixed, and oxic redox conditions.
An upward trend in arsenic concentration was observed at two monitoring wells during 1991–2023 (fig. 7). The two wells (M91–38R on the island and M90–30R on the east bank) had four different redox conditions present (fig. 7). In monitoring well M91–38R, the redox processes were manganese reducing (6 occurrences) and nitrate reducing conditions (1 occurrence). In monitoring well M90–30R, the redox processes were iron reducing (14 occurrences) and mixed anoxic/oxic conditions (4 occurrences; fig. 7).
Arsenic concentrations were correlated with reducing conditions and water levels at the four other monitoring wells. On the west bank, monitoring well M90–36R had reducing and suboxic conditions, which were associated with lower water levels and arsenic concentrations between 5 and 9 μg/L. Also, on the west bank from 1993 to 2019, monitoring well M90–17R had higher arsenic concentrations (6.1 to 11.0 μg/L) when manganese reducing conditions were present in comparison to when mixed conditions were present (4.9 to 6.8 μg/L). In monitoring well M90–17R, as water levels rose from 2012 through 2019, the conditions changed from manganese-reducing to more mixed-reducing conditions.
In monitoring well M90–34R on the island, lower water levels were associated with a shift to manganese-reducing conditions and an increase in arsenic concentration during the period with redox conditions present (2008–23). Using linear regressions to assess changes in arsenic concentrations over time, the largest rise came from monitoring well M90–34R, which had an increase in arsenic concentrations (p-value=0.01) across 16 samples collected from 2018 to 2023 (fig. 7). Values during this period rose from 5.9 µg/L in August 2018 to 9.9 µg/L in April 2023. This rise in the island monitoring well M90–34R coincides to when the east channel of the Platte River was cut off from the main streamflow of the river and connected the island to the east bank.
On the east side of the Platte River near the island (fig. 1), monitoring well M90–30R did not experience a similar rise to M90–34R during the 2018 to 2023 period (p-value=0.89) but did experience a rising trend during the entire period.
On the east side of the Platte River, mixed redox conditions were most common at monitoring well M90–33R. Monitoring well M90–33R had no observed statistical rise in arsenic concentrations in either the 1994–2023, or 2018–23 period.
With the confluence of the Elkhorn River being less than 10 miles upstream from the northern part of the LWS well field, it was assumed for the study that the Platte River is only partially mixed in the vicinity of the LWS well field. If the alluvial groundwater underneath the river was primarily composed of river water with similarly incomplete mixing, strategic pumping from the eastern side of the river could be a feasible strategy to reduce arsenic concentrations; however, the connection of the alluvial groundwater to the surrounding aquifer needs to be better understood to test that assumption.
Using Stable Isotopes to Estimate Recharge Sources
Stable isotopes of water (δ2H and δ18O) can be used to characterize the source of water at the time of recharge. If the water is more enriched with heavier isotopes relative to those in the atmosphere, it has likely undergone hydrologic processes such as evaporation (Gibson and others, 2020). In turn, a greater amount of evaporation could be associated with exposure to the land surface such as in a river. The isotopic composition of 13 surface-water samples varied throughout the summer (table 2). River samples collected in the late summer of 2022 were generally more enriched than early summer samples as shown by the percentage increases in δ2H and δ18O (table 2). The 11 groundwater samples collected in the early and late summer show this same pattern of enrichment as the summer progressed (table 2).
In the downstream direction along the sampled reach, the Platte River became more enriched in heavier isotopes for concurrent sampling events, indicating evaporation was occurring within the river (table 2). The data indicated that less evaporation occurred at the USGS streamgage on the Elkhorn River at Waterloo, Nebr. (station 06800500), than at the USGS streamgage on the Platte River near Leshara, Nebr. (station 06796500). This difference is likely because of the longer travel time of water within the Platte River Basin compared to the Elkhorn River, which is also indicated by the difference in d-excess in the two rivers (table 2). Assuming that the Platte River is poorly mixed in the area of the Lincoln well field, this difference in isotopes in surface-water sources may result in similar spatial dissimilarity in the underlying groundwater that is recharged by the river.
Table 2.
Analysis results for isotopes of surface water and groundwater near the City of Lincoln municipal well field near Ashland, Nebraska, 2022.[USGS data accessed via U.S. Geological Survey (2023). Dates shown in month/day/year format. Time of day is shown in military time. δ2H, deuterium reported in delta; δ18O, oxygen-18 reported in delta; d-excess, deuterium excess; ft, foot; USGS, U.S. Geological Survey; --, no data]
Two of the monitoring wells sampled in 2001 (Steele, 2002) were resampled for isotopes in 2022 as part of this project (M90–30R and M90–34R). Samples from 2022 were collected around the same time of year as the samples from 2001 but showed a stronger evaporative signal compared to the samples from 2001 (table 2). This difference is likely because of changes in the precipitation or timing of precipitation recharging the aquifer, based on comparisons of the Palmer Drought Severity Index. The Palmer Drought Severity Index (Palmer, 1965) for the Platte River watershed for summers (May–August) 2001 and 2022, which correspond to the time of year that the isotope sampling occurred, were compared. In 2001, most of the watershed was categorized as midrange or near normal. In 2022, the area that includes the lower Platte River was mostly categorized as midrange (except for moderate drought in August), but the upper reaches of the watershed were all categorized at some level of drought (mostly severe or extreme drought), and the intensity of the drought increased during summer 2022.
Stable isotope samples showed that in 2001, monitoring well M90–30R likely had been recharged by a nearby sandpit lake (Steele, 2002). In 2022, M90–30R was still likely being recharged by the sandpit lake, and the recharge showed an even stronger evaporative signal. The increased evaporative signal may be because 2022 was a drier year than 2001 and more evaporation occurred in the sandpit lakes.
Isotope samples were collected from four of the LWS municipal production wells in the well field during 2022. The sample results were compared to the evaporative signals from the river and monitoring well samples to determine the relative contributions from stream water or the adjacent aquifer (table 3). The isotopic ratios indicated the proportion of source water in production wells originating from stream water compared to the adjacent aquifer and appear to be dependent on the magnitude of streamflow and rate of pumping within the well field.
Table 3.
Relative contribution of stream water recharge present in water pumped from municipal wells near Ashland, Nebraska, 2022.[USGS data accessed via U.S. Geological Survey (2023). Dates shown in month/day/year format. gal/min, gallon per minute; ft3/s, cubic foot per second]
The evaporative signals in groundwater and surface-water samples collected in 2022 show similar compositions in each season indicating that the water is interconnected. The groundwater and surface-water isotope composition remains consistent throughout the period sampled, indicating no major change in seasonality or evaporation (fig. 8). Based on an endmember mixing model using the isotopic data from the production wells and Platte River samples, the fraction of groundwater recharge originating from the stream was higher in the early summer and lower in late summer (Bowen and others, 2005).
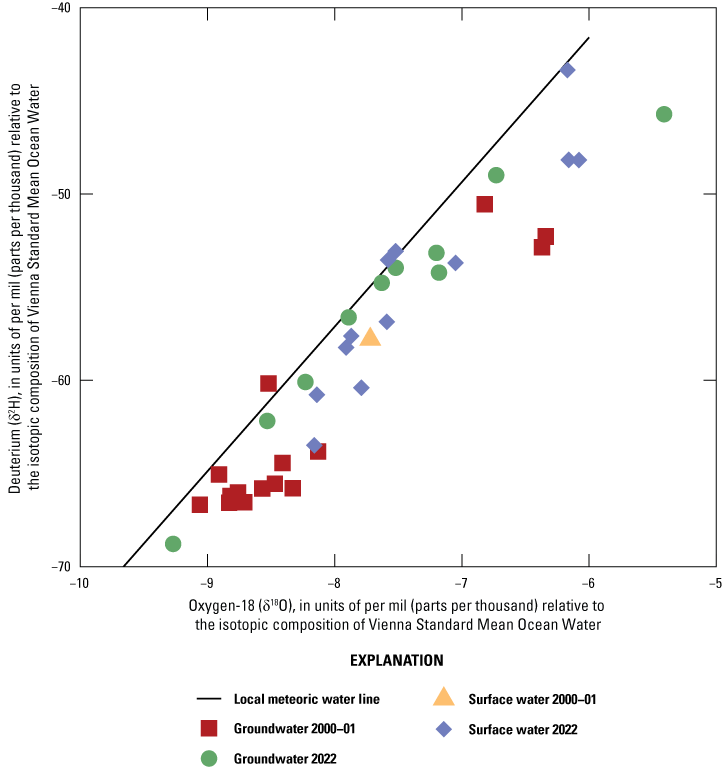
Oxygen-18 versus deuterium for water samples collected by the U.S. Geological Survey around the City of Lincoln Water System well field in 2000, 2001, and 2022. Values were compared to the Vienna Standard Mean Ocean Water.
The isotopic results indicate the proportion of municipal source water originating from stream water and the adjacent aquifer can vary from well to well. The groundwater isotopic ratios in samples from two LWS collector wells that had multiple samples collected indicated groundwater recharge rates did not show a decreasing pattern and remained consistent, indicating the municipal wells were consistent across the study periods analyzed; however, the percentage of surface-water contributions to the collector wells decreased from spring to summer.
The decrease in percentage of surface-water contributions to collector wells correlates to decreasing streamflow in summer and increased pumping rates from the collector wells. Because higher arsenic concentrations in the stream water present during the summer coincide with increased pumping in production wells, the LWS source water has a higher potential to be affected by the elevated arsenic concentrations.
Summary
The City of Lincoln, Nebraska, has been monitoring concentrations of arsenic in their source water and evaluating their options for treatment and removal since at least 2002. Arsenic contamination can be expensive to mitigate and ensure that a supply of water can be delivered to the public that meets the U.S. Environmental Protection Agency’s maximum contaminant level (MCL) requirement of 10 micrograms per liter. In 2022, the City of Lincoln, Nebr., with funding assistance from the Nebraska Water Sustainability Fund, began cooperating with the U.S. Geological Survey (USGS) to examine arsenic concentrations in the lower Platte River valley and in the area around the City of Lincoln Water System (LWS) well field. This study focused on analyzing short- and long-term data.
The long-term data included USGS-collected samples in the Platte and Elkhorn Rivers from the early 1970s through July of 2023. The data collected in 2022 and 2023 were sampled in a way that allowed the paired comparison of arsenic from upstream rivers that contribute to the LWS well field. Isotopes were also collected in 2022 and 2023 from surface water and groundwater to assess the amount of surface water present in the LWS production wells.
Using the long-term USGS sample data, arsenic concentrations were examined with an R software package to create a weighted regression on time, discharge, and season model. The weighted regression on time, discharge, and season models were created and used in the discrete sample data in regressions with streamflow, season, and year to assess trends in arsenic concentration in the rivers. The models created through weighted regression on time, discharge, and season with the discrete samples were used to calculate daily estimated values of arsenic for the entire study period (1970 to 2023). A seasonal pattern emerged where the sampled concentrations of arsenic in the Platte River were higher during the summer months and lower during the winter months. The daily estimated values of arsenic were then used to calculate annual means of arsenic concentrations at each site. Using annual means, arsenic concentrations at the USGS streamgage on the Platte River at Louisville, Nebr. (station 06805500), indicated an increasing trend for over 49 years.
Seasonal arsenic concentrations showed an inverse relation with streamflow in the Platte River. Most annual low streamflow trends in the lower Platte River of Nebraska from 1950 through 2011 have been increasing at the USGS streamgage on the Platte River at Louisville, Nebr. (station 06805500), and at the Elkhorn River at Waterloo, Nebr. (station 06800500). Increasing arsenic contributions may be related to increased groundwater contributions to streamflow at the Platte River at Louisville, Nebr. (station 06805500), over the past 53 years.
By combining seasonal patterns and streamflow relations with arsenic concentrations in the Platte River during low streamflow conditions, groundwater contributions, which can have higher arsenic concentrations, will make up a larger portion of the streamflow. The highest stream arsenic concentrations were observed during the mid- to late-summer (July and August) period that typically has higher evaporative and plant water demands and lower precipitation, leading to reduced streamflow from base-streamflow dominated conditions. The reduced streamflows are likely dominated by regional groundwater, which has a higher potential for elevated arsenic concentrations compared to surface-water runoff.
Samples collected on the same day from the USGS streamgages on the Platte River near Leshara, Nebr. (station 06796500), and the Elkhorn River at Waterloo, Nebr. (station 06800500), were compared to one another. These two sites were also compared to samples collected downstream at the USGS streamgage on the Platte River near Ashland, Nebr. (station 06801000), on the following day, about the travel time for water from the upstream sites. When comparing the individual rivers with the combined river below the confluence, the Platte River near Ashland, Nebr., had a mean arsenic concentration that was higher than the Elkhorn River at Waterloo, Nebr., though not significant. The Platte River near Ashland, Nebr., had a significantly lower mean arsenic concentration than the Platte River near Leshara, Nebr., which indicates that across the study period the Platte River contributed a higher concentration of arsenic than the Elkhorn River at the confluence.
Groundwater arsenic concentrations had some seasonal variation around the LWS well field, with values being approximately 1–2 micrograms per liter higher in the summer and fall months when compared to the winter and spring months. Higher arsenic concentrations in monitoring wells tended to be further downstream in comparison to samples that were collected further upstream and on the east bank. Six groundwater monitoring wells were analyzed for long-term trends occurring from 1991 to 2023. Two of these wells had positive trends in arsenic concentrations during this period: well M91–38R (located on the island) where manganese and nitrate reducing conditions were present, and well M90–30R (located on the east bank) where iron and mixed reducing conditions were present. Monitoring well M90–34R (located on the island) did not demonstrate an increasing trend in arsenic concentration from 1993 to 2023 but did show an increase from 2019 to 2023, which was during a period where manganese reducing conditions were present and when water levels in the well were declining. This period occurred when the island was connected to the east bank of the Platte River. The six monitoring wells were examined to assess their redox condition during the time of sampling. Out of 101 samples analyzed, mixed anoxic/oxic redox condition was the most common redox process across all wells, with anoxic manganese reducing condition being the next most common. The highest sampled arsenic concentrations in the monitoring wells were observed in anoxic reducing conditions where the manganese redox process was present.
Isotope samples were collected in 13 surface-water and 11 groundwater samples and compared to one another and to work done in the LWS well field. These samples indicate that during 2022 the proportion of surface water present in the source water within production wells can be higher in the spring and lower in the summer, and the isotopic composition can vary from well to well. Samples were collected in two wells in the spring and summer that allowed for comparison. Both wells had a higher percentage of stream water contributing to the source water in May than they had in August, which correlates to decreased streamflow in the summer and increased pumping rates from the collector wells. With base-streamflow conditions increasing in the streams and higher arsenic concentrations occurring during the summer months in the Platte River when there is increased pumping of the production wells, there is a higher potential for LWS source water to be affected by the elevated arsenic concentration.
References Cited
Baris, D., Waddell, R., Beane Freeman, L., Schwenn, M., Colt, J., Ayotte, J.D., Ward, M., Nuckols, J., Schned, A., Jackson, B., Clerkin, C., Rothman, N., Moore, L., Taylor, A., Robinson, G., Hosain, G.M., Armenti, K., McCoy, R., Samanic, C., Hoover, R.N., Fraumeni, J.F., Johnson, A., Karagas, M.R., and Silverman, D., 2016, Elevated bladder cancer in northern New England—The role of drinking water and arsenic: Journal of the National Cancer Institute, v. 108, no. 9, accessed September 10, 2024, at https://doi.org/10.1093/jnci/djw099.
Bathke, D.J., Oglesby, R.J., Rowe, C., and Wilhite, D.A., 2014, Understanding and assessing climate change—Implications for Nebraska: Lincoln, Nebr., School of Natural Resources, Institute of Agriculture and Natural Resources, University of Nebraska–Lincoln, 72 p., accessed February 6, 2025, at https://digitalcommons.unl.edu/geosciencefacpub/439/.
Bowen, G. J., Kennedy C. D., Liu Z., and Stalker J., 2011, Water balance model for mean annual hydrogen and oxygen isotope distributions in surface waters of the contiguous USA: Journal of Geophysical Research, v. 116, no. G4, 14 p., accessed June 17, 2024, at https://agupubs.onlinelibrary.wiley.com/doi/full/10.1029/2010JG001581.
Bowen, G.J., Wassenaar, L.I., and Hobson, K.A., 2005, Global application of stable hydrogen and oxygen isotopes to wildlife forensics: Oecologia, v. 143, p. 337–348, accessed June 17, 2024, at https://doi.org/10.1007/s00442-004-1813-y.
Bulka, C.M., Jones, R.M., Turyk, M.E., Stayner, L.T., and Argos, M., 2016, Arsenic in drinking water and prostate cancer in Illinois counties—An ecologic study: Environmental Research, v. 148, p. 450–456, accessed September 10, 2024, at https://doi.org/10.1016/j.envres.2016.04.030.
Clark, I.D., and Fritz, P., 1997, Environmental isotopes in hydrogeology: Boca Raton, Florida, CRC Press, 342 p., accessed June 17, 2024, at https://doi.org/10.1201/9781482242911.
City of Lincoln, 2023a, Water use, high temperature, and rainfall comparison by month: City of Lincoln, accessed November 15, 2023, at https://www.lincoln.ne.gov/City/Departments/LTU/Utilities/LWS/Water-Use/2023/September.
City of Lincoln, 2023b, 2022 Annual drinking water quality report, City of Lincoln, accessed November 14, 2023, at https://www.lincoln.ne.gov/files/sharedassets/public/v/1/ltu/utilities/water-system/quality/wqr/pdf-reports/2022.pdf.
Dietsch, B.J., and Strauch, K.R., 2020, Trends in streamflow and precipitation for selected sites in the Elkhorn River Basin and in streamflow in the Salt Creek and Platte River Basins, Nebraska, 1961–2011: U.S. Geological Survey Scientific Investigations Report 2020–5016, 20 p., accessed May 16, 2023, at https://doi.org/10.3133/sir20205016.
Erickson, M.L., and Barnes, R.J., 2005, Glacial sediment causing regional-scale elevated arsenic in drinking water: Groundwater, v. 43, no. 6, p. 796–805. [Also available at https://doi.org/10.1111/j.1745-6584.2005.00053.x.]
Erickson, M.L., Elliott, S.M., Christenson, C.A., and Krall, A.L., 2018, Predicting geogenic arsenic in drinking water wells in glacial aquifers, north‐central USA—Accounting for depth‐dependent features: Water Resources Research, v. 54, no. 12, p. 10,172–10,0187, accessed August 1, 2023, at https://doi.org/10.1029/2018WR023106.
Erickson, M.L., Elliott, S.M., Brown, C.J., Stackelberg, P.E., Ransom, K.M., and Reddy, J.E., 2021, Machine learning predicted redox conditions in the glacial aquifer system, northern continental United States: Water Resources Research, v. 54, no. 4, 19 p., accessed June 17, 2024, at https://doi.org/10.1029/2020WR028207.
Esri, 2017, ArcGIS Pro, version 3.0: Redlands, Calif., Esri software, accessed September 15, 2023, at https://www.esri.com/en-us/home.
Foster, S.S.D., and Chilton, P.J., 2003, Groundwater—The processes and global significance of aquifer degradation—Royal Society Publishing, Philosophical Transactions of the Royal Society, Series B: Biological Sciences, v. 358, no. 1440, p. 1957–1972, accessed September 10, 2024, at https://doi.org/10.1098/rstb.2003.1380.
Gibson, J.J., Holmes, T., Stadnyk, T.A., Birks, S.J., Eby, P., and Pietroniro, A., 2020, 18O and 2H in streamflow across Canada: Journal of Hydrology. Regional Studies, v. 32, article 100754, 22 p., accessed June 17, 2023, at https://doi.org/10.1016/j.ejrh.2020.100754.
Haj, A.E., Gruhn, L.R., and Kalkhoff, S.J., 2023, One Ranney well can make a difference—The impacts of a radial collector well on groundwater level and quality in the Cedar River alluvial aquifer: Ground Water Monitoring and Remediation, v. 43, no. 2, p. 51–60, accessed October 27, 2023, at https://doi.org/10.1111/gwmr.12560.
Helsel, D.R., Hirsch, R.M., Ryberg, K.R., Archfield, S.A., and Gilroy, E.J., 2020, Statistical methods in water resources: U.S. Geological Survey Techniques and Methods, book 4, chap. A3, 458 p., accessed June 1, 2023, at https://doi.org/10.3133/tm4A3. [Supersedes ver. 1.1., released in 2002].
Hirsch, R.M., Moyer, D.L., and Archfield, S.A., 2010, Weighted regressions on time, discharge, and season (WRTDS), with an application to Chesapeake Bay River inputs: Journal of the American Water Resources Association (JAWRA), v. 46, no. 5, 857–880 p. accessed June 1, 2023, at https://doi.org/10.1111/j.1752-1688.2010.00482.x.
Hirsch, R.M., and De Cicco, L.A., 2015, User guide to Exploration and Graphics for RivEr Trends (EGRET) and dataRetrieval—R packages for hydrologic data (ver. 2.0, February 2015): U.S. Geological Survey Techniques and Methods, book 4, chap. A10, 93 p., accessed October 2023, at https://doi.org/10.3133/tm4A10.
Kilpatrick, F.A., and Wilson, J.F., Jr., 1989, Measurement of time of travel in streams by dye tracing: U.S. Geological Survey, Techniques of Water-Resources Investigations, book 3, chap. A9, ver. 2, 27 p., accessed June 1, 2023, at https://pubs.usgs.gov/twri/twri3-a9/.
Lee, J.S., and Davis, J.A., 2023, 4–Arsenic risk assessment, chap. 4 of Singh Flora, S.J., ed., Handbook of Arsenic Toxicology (2d ed.): Academic Press, p. 101–131, accessed April 17, 2024, at https://doi.org/10.1016/B978-0-323-89847-8.00004-3.
Lower Platte River Corridor Alliance, 2025, About the Lower Platte River: Lower Platte River Corridor Alliance, accessed January 27, 2025, at https://www.lowerplatte.org/who_we_are/about_lower_platte_river.html.
McMahon, P.B., and Chapelle, F.H., 2008, Redox processes and water quality of selected principal aquifer systems: Groundwater, v. 46, no. 2, p. 259–271, accessed August 1, 2023, at https://doi.org/10.1111/j.1745-6584.2007.00385.x.
National Centers for Environmental Information, 2024, Historical Palmer drought indices: National Oceanic and Atmospheric Administration, accessed September 13, 2024, at https://www.ncei.noaa.gov/access/monitoring/historical-palmers/.
Nebraska Department of Environmental Quality, 2006, Title 118—Ground water quality standards and use classification (revised March 27, 2006): Nebraska Department of Environmental Quality, 95 p., accessed March 10, 2026, at https://govdocs.nebraska.gov/epubs/E6500/R015.0118-2006.pdf.
Revesz, K., and Coplen, T.B., 2008, Determination of the delta (2H/1H) of water—RSIL lab code 1574: U.S. Geological Survey Techniques and Methods, book 10, chap. C1, 27 p., accessed June 17, 2023, at https://doi.org/10.3133/tm10C1.
Ryberg, K.R., and Vecchia, A.V., 2012, waterData—An R package for retrieval, analysis, and anomaly calculation of daily hydrologic time series data, version 1.0: U.S. Geological Survey Open-File Report 2012–1168, 8 p., accessed November 20, 2023, at https://doi.org/10.3133/ofr20121168.
R Core Team, 2016, R—A language and environment for statistical computing: Vienna, Austria, R Foundation for Statistical Computing software release, 3795 p., accessed February 11, 2025, at https://www.r-project.org/.
Smedley, P.L., and Kinniburgh, D.G., 2002, A review of the source, behaviour and distribution of arsenic in natural waters: Applied Geochemistry, v. 17, no. 5, p. 517–568, accessed November 16, 2023, at https://doi.org/10.1016/S0883-2927(02)00018-5.
Steele, G.V., 2002, Age of ground water at city of Lincoln’s municipal well field near Ashland, Nebraska: U.S. Geological Survey Fact Sheet 091–02, 6 p., accessed January 13, 2023, at https://doi.org/10.3133/fs09102.
Thomas, M.A., 2007, The association of arsenic with redox conditions, depth, and ground-water age in the glacial aquifer system of the northern United States: U.S. Geological Survey Scientific Investigations Report 2007–5036, 26 p., accessed August 1, 2023, at https://doi.org/10.3133/sir20075036.
U.S. Census Bureau, 2023, Explore census data: U.S. Census Bureau database, accessed December 27, 2023, at https://data.census.gov.
U.S. Environmental Protection Agency, 2001, Technical fact sheet—Final rule for arsenic in drinking water: U.S. Environmental Protection Agency Office of Water, EPA 815–F–00–016, 6 p., accessed December 7, 2023, at https://nepis.epa.gov/Exe/ZyPdf.cgi?Dockey=20001XXE.txt.
U.S. Environmental Protection Agency, 2009, National drinking water regulations MCL booklet—May 2009 (EPA 816‑F‑09‑004): U.S. Environmental Protection Agency, Office of Water, 50 p., accessed March 10, 2026, at https://nepis.epa.gov/Exe/ZyPDF.cgi/P1005EJT.PDF?Dockey=P1005EJT.PDF.
U.S. Geological Survey, 2018, National field manual for the collection of water-quality data: U.S. Geological Survey Techniques of Water-Resources Investigations, book 9, chaps. A1–A10, accessed March 2023, at https://doi.org/10.3133/twri09.
U.S. Geological Survey, 2023, USGS water data for the Nation: U.S. Geological Survey National Water Information System database, accessed January 13, 2023, at https://doi.org/10.5066/F7P55KJN.
U.S. Geological Survey, 2025, USGS National Water Quality Network: Water Resources Mission Area database, accessed July 11, 2025, at https://www.usgs.gov/mission-areas/water-resources/science/usgs-national-water-quality-network.
Verstraeten, I.M., Atkeson, R.L., and Stanton, C.P., 1998, Selected surface-water, ground-water, and tracer data from the Elkhorn and Platte Rivers and the alluvium near Ashland, eastern Nebraska, 1991–97: U.S. Geological Survey Open-File Report 98–396, 24 p. [appendix parts separately paged], accessed January 13, 2023, at https://doi.org/10.3133/ofr98396.
Verstraeten, I.M., Carr, J.D., Steele, G.V., Thurman, E.M., Bastian, K.C., and Dormedy, D.F., 1999, Surface water-ground water interaction—Herbicide transport into municipal collector wells: Journal of Environmental Quality, v. 28, no. 5, p. 1396–1405, accessed January 13, 2023, at https://doi.org/10.2134/jeq1999.00472425002800050002x.
Welch, A.H., Westjohn, D.B., Helsel, D.R., and Wanty, R.B., 2000, Arsenic in ground water of the United States—Occurrence and geochemistry: Ground Water, v. 38, no. 4, p. 589–604, accessed January 13, 2023, at https://doi.org/10.1111/j.1745-6584.2000.tb00251.x.
Conversion Factors
U.S. customary units to International System of Units
Supplemental Information
Concentrations of chemical constituents in water are given in micrograms per liter (µg/L).
The oxygen-18 (δ18O) and deuterium (δ2H) abundances are reported in delta (δ) notation as stable isotope of δ18O and δ2H in units of per mil (parts per thousand) relative to the isotopic composition of Vienna Standard Mean Ocean Water.
For more information about this publication, contact:
Director, USGS Central Plains Water Science Center
1217 Biltmore Drive Lawrence, KS 66049
5231 South 19th Street Lincoln, NE 68512
785–842–9909
For additional information, visit: https://www.usgs.gov/centers/central-plains-water-science-center
Publishing support provided by the
USGS Science Publishing Network,
Rolla Publishing Service Center
Disclaimers
Any use of trade, firm, or product names is for descriptive purposes only and does not imply endorsement by the U.S. Government.
Although this information product, for the most part, is in the public domain, it also may contain copyrighted materials as noted in the text. Permission to reproduce copyrighted items must be secured from the copyright owner.
Suggested Citation
Moser, M.T., Cherry, M.L., and Hall, B.M., 2026, Arsenic and isotope concentrations in the lower Platte River valley of eastern Nebraska, early 1970s to 2023: U.S. Geological Survey Scientific Investigations Report 2026–5138, 23 p., https://doi.org/10.3133/sir20265138.
ISSN: 2328-0328 (online)
Study Area
| Publication type | Report |
|---|---|
| Publication Subtype | USGS Numbered Series |
| Title | Arsenic and isotope concentrations in the lower Platte River valley of eastern Nebraska, early 1970s to 2023 |
| Series title | Scientific Investigations Report |
| Series number | 2026-5138 |
| DOI | 10.3133/sir20265138 |
| Publication Date | April 09, 2026 |
| Year Published | 2026 |
| Language | English |
| Publisher | U.S. Geological Survey |
| Publisher location | Reston, VA |
| Contributing office(s) | Central Plains Water Science Center |
| Description | Report: vii; 23 p.; Data Release; Dataset |
| Country | United States |
| State | Nebraska |
| Other Geospatial | lower Platte River basin |
| Online Only (Y/N) | Y |
| Additional Online Files (Y/N) | N |