

Assessing the State of Hydrologic Science in the Upper Klamath Basin—A Comprehensive Review of Data, Tools, and Models
Links
- Document: Report (5.9 MB pdf) , HTML , XML
- Download citation as: RIS | Dublin Core
Acknowledgments
The authors would like to thank U.S. Geological Survey (USGS) alumni Marshall Gannett, John Risley, and Tamara Wood for providing additional context for reports reviewed in this study. The authors would also like to thank USGS employees Amanda Garcia and Jonathan Haynes for providing additional context and research ideas for evapotranspiration and water use, respectively.
The authors would like to thank Jonathan LaMarche, Grayson Fish, and Jordan Beamer from the Oregon Water Resources Department (OWRD) for providing context for OWRD’s efforts in the Upper Klamath River Basin.
Abstract
Water demand in the Upper Klamath Basin (UKB) from various stakeholders and ecological needs often outstrips available supply, leading to persistent management challenges. This study reviews the state of hydrologic science within the UKB as of 2025—specifically, the tools, data, and models available for assessing five key components of the water system: (1) surface water; (2) precipitation; (3) evapotranspiration; (4) groundwater; and (5) water use. The UKB water supply is critical for Native American communities, regional agriculture, and federally listed fishes and faces challenges from competing needs, climate variability, and operational/regulatory requirements. We assess existing datasets, regional and national models, and historical studies to understand the available resources and identify gaps that may hinder integrated water assessments and management. Our findings indicate areas where improvements in data collection and model precision could improve the accuracy of water-availability forecasts and support water-management practices. This review can inform near-term forecasting, assist in optimizing water-resource data collection and management strategies, and support regional water-availability assessments of the basin.
Plain Language Summary
The Upper Klamath Basin (UKB), located in southern Oregon, includes Upper Klamath Lake and its tributaries. Upper Klamath Lake forms the headwaters of the Klamath River, which flows into northern California. The UKB is essential to the region’s ecology and serves as the main water source for the surrounding area. The water resources of the UKB are used in various ways, including irrigation for agriculture, domestic and industrial use, and commercial and recreational fishing. Over time, these competing demands have contributed to increased water stress in the UKB, complicating water allocation and contributing to more variable lake levels. Accurate lake-level forecasting is needed to inform management of lake water, but these competing demands also complicate efforts to forecast lake levels. This report offers an overview of the historical and current tools and methods used to monitor and forecast hydrological conditions in the UKB. The report highlights key factors affecting water availability, such as groundwater and surface-water dynamics, climate-related effects, precipitation patterns, and evapotranspiration (the combined water loss to the atmosphere through evaporation from surfaces and transpiration from plants). The tools and methods used to monitor the UKB include statistical techniques, computer modeling, field measurements, and high-tech instrumentation, and the report highlights their strengths and weaknesses. This analysis of the state of science in the UKB offers a synthesis of existing tools, models and data to inform future research, data collection, and water-management decisions. The objectives of this analysis are to (1) facilitate the availability of high-quality data to water managers, (2) aid water-management decision-making and UKB stewardship programs, and (3) improve the accuracy of water supply forecasting.
Introduction
Water is critical to the Upper Klamath Lake region ecosystems and agriculture sector. Water in the lake is needed for endangered fish, and deliveries from the lake are used for irrigation in the Bureau of Reclamation (Reclamation) Klamath Project and for downstream fisheries needs. However, the water balance around the lake is insufficient to meet all water demands, especially during dry years (Powers and others, 2005). As a result of this insufficiency, water managers must make difficult allocation decisions, determining how much water can be retained in Upper Klamath Lake versus how much can be released downstream or delivered to irrigators (U.S. Bureau of Reclamation, 2024a). These decisions are guided by forecasts of lake elevation and inflows, which play a fundamental role in operational planning. Forecasting tools used as of 2025 involve significant uncertainty, particularly in dry years, complicating efforts to manage water that properly considers and balances competing interests. A more complete understanding of the Upper Klamath Lake water budget and improved predictive tools would help reduce uncertainty in Upper Klamath Lake water-level forecasts and provide more reliable information for water-management decisions.
In 2022, the U.S. Geological Survey (USGS) began a Regional Water Availability Assessment (U.S. Geological Survey, 2024a) of the Klamath River Basin. Regional Water Availability Assessments are designed to evaluate potential drivers of water availability in medium-sized drainage basins that are representative of large areas of the United States. Tasks include the assessment of regionally relevant threats to water availability and the evaluation of regional water supply and demand. This report is designed to be an early step in the larger Klamath Basin assessment. Cataloging the available data, tools, and models associated with the Upper Klamath Basin (UKB) and understanding the gaps in knowledge and available data are crucial for integrated water assessments of water availability.
This manuscript details the state of the science in hydrologic data, tools, and models in the UKB and surrounding area as of 2025. The analysis includes major hydrologic components relevant to forecasting and water management and an evaluation of uncertainty in the Upper Klamath Lake water budget.
Purpose and Scope
This report provides a catalog of existing data, studies, models, and tools relevant to hydrologic processes in the UKB and surrounding regions. The compilation emphasizes five key components of the hydrologic system—surface water, groundwater, precipitation, ET, and water use—with the intent of clarifying what information products are available to support scientific studies and management decisions. An additional section documents research of climate projections and nonstationarity in the UKB and surrounding regions.
For the purposes of this study, the UKB discussed consists of the watershed boundary upstream from Link River Diversion Dam (black outline in fig. 1) on the Klamath River, including Upper Klamath Lake and all inflows to Upper Klamath Lake. This report focuses on hydrologic studies within the UKB specifically, and to a lesser extent, the surrounding area, emphasizing research relevant to water budgeting, forecasting, and management. Broader regional and national studies are included when they provide insights applicable to the UKB hydrologic processes or discuss methodologies that are not location specific.
An analysis was performed to evaluate how various hydrologic components affect the overall water-budget uncertainty of Upper Klamath Lake. This analysis was based on published water-balance estimates and considered the variability, data sources, temporal resolution, and confidence associated with each budget component. We identified which components contribute the most to total system uncertainty and how uncertainty may vary depending on forecasting time scales of interest.
This report is intended to be a foundational reference for scientists, modelers, and water managers working in the Klamath Basin. This report may help inform the design of future hydrologic studies, including any potential data-gap assessments or model development efforts aimed at improving seasonal water-supply forecasting and lake-level prediction for Upper Klamath Lake.
Background
The UKB is a complex hydrologic and water management landscape. The basin is characterized by diverse terrain, snow- and spring-fed tributaries, and a high-elevation lake. The basin supports a range of competing water demands, including agriculture, fisheries, and Tribal and wildlife refuges. Longstanding legal, institutional, and ecological constraints affect how water is allocated and managed, often under conditions of pronounced interannual variability and incomplete scientific understanding (National Research Council, 2008). This background section provides information to help frame subsequent assessments of data, models, and tools used to inform water management in the basin.
Setting
Upper Klamath Lake in southern Oregon serves as the headwaters for the Klamath River (fig. 1). Horizontal and vertical coordinate information, including elevations shown on figures, are referenced to the North American Datum of 1983 (NAD 83) and the North American Vertical Datum of 1988 (NAVD 88), respectively. Upper Klamath Lake is fed by numerous rivers, most notably the Williamson River and its major tributary, the Sprague River, along with the Wood River. From Upper Klamath Lake, the Klamath River flows around 255 miles (Smith and Sullivan, 2023) predominately southwest, into northern California, and eventually terminates in the Pacific Ocean. The Klamath River Basin encompasses roughly 16,000 square miles (mi2)—an area larger than nine U.S. States (Rhode Island, Delaware, Connecticut, New Jersey, New Hampshire, Vermont, Massachusetts, Hawaii and Maryland).
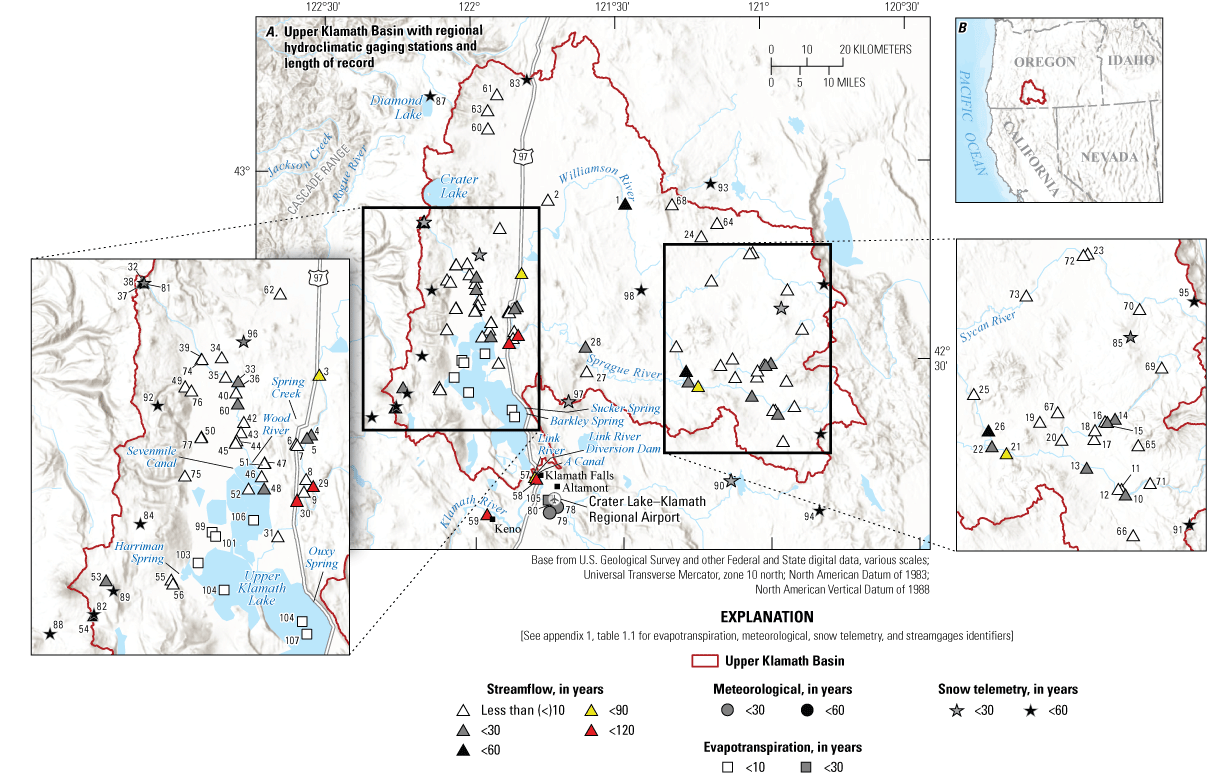
Regional and study area defined by the watershed boundary for the A, Upper Klamath Basin (UKB; dark red line); and regional hydroclimatic gaging stations and length of record; B, location of the Upper Klamath Basin within Oregon and California; C, topography; D, 30-year annual normal precipitation (1991–2020; millimeters per year [mm/year]); and E, land cover classification.
The hydrology of the UKB is shaped by a complex interplay of surface water and groundwater contributions. The basin’s primary inflows drain forested and volcanic uplands, delivering surface runoff and substantial groundwater discharge to Upper Klamath Lake (Gannett and others, 2007). Upper Klamath Lake serves as the central management point for water distribution by Reclamation, consistent with Federal and Oregon law (Oregon Legislature, 2023; State of Oregon, 2024a). Operations must balance competing demands that include maintaining minimum lake levels for federally endangered Lost River sucker (Deltistes luxatus) and shortnose sucker (Chasmistes brevirostris), supplying irrigation deliveries through Reclamation’s Klamath Project, and meeting downstream flow requirements for the Klamath River and its anadromous fisheries under the Endangered Species Act (National Research Council, 2008; U.S. National Marine Fisheries Service and U.S. Fish and Wildlife Service, 2013; National Marine Fisheries Service, 2024). Water exiting Upper Klamath Lake flows either into the A Canal (fig. 1 in Snyder and Morace, 1997) and associated infrastructure for irrigation within the Project or through the Link River Diversion Dam and continues downstream into the Klamath River where there are additional diversions for irrigation. Below Upper Klamath Lake, water management remains complex, with releases from Keno Dam affecting flows for Tribal fisheries and environmental requirements (Gannett and others, 2012).
History
A detailed timeline of UKB water history can be found in Water Education Foundation (2020). Historically, multiple Native American groups inhabited the UKB, including the Klamath Tribes, which still maintain a presence in the basin today. The river was an important food source for early native communities. Before recent declines, five species of Pacific salmon (Oncorhynchus sp.) had runs in the Klamath River and were among the largest of Pacific Ocean River systems (Bureau of Reclamation, 2016). Historically, the Lost River sucker and shortnose sucker also were a critical food source and of cultural importance for the Klamath Tribes. The endangered status of these fish species (as of 2025) directly affects management decisions, including delivery of water into and out of Upper Klamath Lake (Krause and others, 2022; Oregon Encyclopedia, 2024).
Widespread alterations to the natural hydrologic systems of the UKB began in the late 1800s. Changes include dams, diversions, ditches, wells, levees, and other modifications that affected the amount of water reaching and leaving Upper Klamath Lake, as well as the physical dimensions of the lake itself (Snyder and Morace, 1997). The U.S. Reclamation Service (now renamed as U.S. Bureau of Reclamation) started the Klamath Project to drain lakes and wetlands for cultivation in 1906. PacifiCorp’s Klamath Hydroelectric Project included eight developments constructed between 1911 and 1962. In 2021, four PacifiCorp dams were transferred to the Klamath River Renewal Corporation in anticipation of their removal (California Public Utilities Commission, 2024), and all four dams were removed by 2024 (National Oceanic and Atmospheric Administration Fisheries, 2024). The Link River Diversion Dam, which serves as the outlet to Upper Klamath Lake, is used for irrigation deliveries to the Klamath Project and other downstream water uses. Link River Diversion Dam was completed in 1947 and is not part of the Klamath Hydroelectric Project, although it was operated by PacifiCorp until fall 2024. As of 2025, Upper Klamath Lake has a capacity of 873,000 acre feet (acre-ft; U.S. Bureau of Reclamation, 2024c), which includes 73,000 acre-ft of additional capacity from Agency Lake (fig. 1 in Gannett and others, 2012) and Barnes units (not shown), which were reconnected in 2025 for wetland restoration efforts (Oregon Public Broadcasting, 2025). As a result of these and other changes in the basin, the available water in the basin is typically less than the many demands on its use, and water-related conflicts often arise among the many user-groups (National Research Council, 2008).
The National Research Council (2008) examined the hydrology and ecology of the UKB, highlighting key hydrologic constraints and ecological responses that continue to shape contemporary management efforts. This report emphasizes the importance of understanding how hydrologic variability and altered flow regimes affect fish habitat and water availability, particularly in the context of competing demands for water. Subsequent studies have refined the understanding of surface water-groundwater interactions, water budget modeling, and the effect of climate variability on hydrologic processes in Upper Klamath Lake.
An example of the water-management challenges faced in the basin is represented by the 2001–02 drought and some of its lasting consequences. A winter drought in 2001 resulted in a Federal court-ordered curtailment of surface-water irrigation to Klamath Project farms. The Reclamation reduced irrigation rates to meet the water needs of the federally endangered Lost River sucker and shortnose sucker (53 FR 27130) and the federally threatened Southern Oregon/Northern California Coast (SONCC) coho salmon (Oncorhynchus kisutch; 64 FR 24049). A protest by local farmers and other community members ensued, and by August of that same year, the Secretary of the Interior ordered 75,000 acre-ft of water to be released from Upper Klamath Lake for irrigation of Klamath Project fields (Oregon Public Broadcasting, 2024a).
Flow was restored through the irrigation canals the next year, effectively reducing the amount of water available for flows downstream into the Klamath River. By fall 2002, a large fish kill occurred, in which more than 30,000 adult salmon and thousands of juvenile salmon died prematurely in the river (Lynch and Risley, 2003; Belchik and others, 2004). The fish kill was attributed to a combination of low flows, a migration delay, crowded conditions, and warm water, which allowed for the proliferation of a parasite (Ichthyophthirius multifiliis) and bacterial pathogen (Flavobacterium columnare) to thrive and reduce fish health (Belchik and others, 2004). This event is an example of how restricted water availability can have severe ecological consequences, particularly when competing demands for Klamath Project irrigation, fisheries, and endangered species protections must be managed under hydrological uncertainty. This event had consequences for Tribal and agricultural communities. For the Yurok Tribe, of the Yurok Reservation, California; Karuk Tribe; and Hoopa Valley Tribe, California, whose economies and cultural practices are deeply tied to salmon harvests, the loss of so many fish represented an ecological and economic calamity. At the same time, agricultural producers in the Klamath Project faced economic disruption from Federal water restrictions aimed at protecting endangered fish populations. The 2002 fish kill became a flashpoint in Klamath Basin water management, prompting subsequent legal battles, regulatory decisions, and the development of collaborative agreements attempting to balance water allocation among competing users.
After the 2001–02 drought and fish kill, the lack of sufficient water available for all uses in the basin became progressively more severe, resulting in additional regulations. In 2013, the National Marine Fisheries Service (NMFS) and the U.S. Fish and Wildlife Service (USFWS), collectively known as “the Services,” issued “Biological Opinions (BiOp) on the Effects of Proposed Klamath Project Operations from May 31, 2013, through March 31, 2023, on Five Federally Listed Threatened and Endangered Species” (U.S. National Marine Fisheries Service and U.S. Fish and Wildlife Service, 2013). This BiOp details the Services’ evaluation and review of Reclamation proposed operations for the Klamath Project and their potential effects on threatened and endangered species. The BiOp covered a geographical area from Upper Klamath Lake downstream, extending into Klamath County in Oregon and Modoc and Siskiyou Counties in California. The BiOp evaluated the Lost River sucker and shortnose sucker, which were federally listed in 1988 due to their population decline, poor water quality, and reduced and degraded habitat (U.S. National Marine Fisheries Service and U.S. Fish and Wildlife Service, 2013). The BiOp also evaluated the effects of proposed operations on federally threatened species, including the southern distinct population segment (SDPS) of North American green sturgeon (Acipenser medirostris), SONCC coho salmon, and SDPS eulachon (Thaleichthys pacificus). For all federally listed species except the green sturgeon, the Klamath Basin is considered critical habitat. As part of the 2013 BiOp, Reclamation was required to maintain a minimum water elevation in Upper Klamath Lake for endangered suckers and provide sufficient downstream flow for threatened Coho salmon.
In 2013, the UKB experienced a dry spring that resulted in a summer drought. An ensuing Oregon Governor’s Executive order (State of Oregon, 2013) declared a drought emergency in Klamath County. A list of drought declarations can be found with the Oregon Water Resources Department (OWRD; Oregon Water Resources Department, 2025).
In 2013, the administration phase of the Klamath Basin General Stream Adjudication ended with the submittal of the Finding of Fact and Order of Determination with the Klamath County Circuit Court. Senior water right holders could then request regulations to protect their water rights in the basin for the first time. The Klamath Tribes have always held Federal reserved treaty rights; the adjudication defined the location, type of use, and quantity of these rights. A Federal court ruling determined that the priority date for these reserved treaty rights for hunting, fishing and gathering is time immemorial. Since 2013, insufficient water flows for senior water users have often necessitated water-use regulation by the OWRD (State of Oregon, 2024a), routinely resulting in near-total cessation of surface-water diversions above Upper Klamath Lake. Such large-scale water rights regulation, described as “curtailment,” had been nonexistent in Klamath County before the 2013 filing, but after the summer of 2013, irrigation curtailment became more commonplace (State of Oregon, 2024b).
In contrast to the 2013 BiOp, the 2024 NMFS BiOp, issued by NMFS, covers 2024–29 (National Marine Fisheries Service) and emphasizes adaptive management strategies that incorporate flexible minimum flow requirements to benefit endangered species while considering seasonal water-management forecasts (roughly 30 days to the end of the water year horizon) and near real-time water operations. The USFWS is preparing a separate, but coordinated, BiOp regarding the effects of the proposed action on federally listed species and affected critical habitat, including Lost River sucker, shortnose sucker, bull trout (Salvelinus confluentus), Oregon Spotted Frog (Amerana pretiosa), Northwestern Pond turtle (Actinemys marmorata), and other species. The 2024 NMFS BiOp incorporates Reclamation’s updated Klamath Basin Planning Model, which was used to simulate operations over a wide variety of hydrologic conditions for the 1981 through 2022 period of record (POR) of historical hydrology to obtain river flows, Upper Klamath Lake elevations, and Klamath Project diversions at daily to annual timesteps. Improvements to the Klamath Basin Planning Model included revised accretions and Upper Klamath Lake inflow datasets, new Upper Klamath Lake bathymetry, updated Upper Klamath Lake net inflow estimates for the POR, and revised daily Klamath Project diversion data and return flows for the POR. The 2024 NMFS BiOp also highlights the removal of four dams on the Klamath River, the largest dam removal project in U.S. history (East and Grant, 2023), which has introduced a rapidly changing environmental base line and opportunity for additional water-management considerations. The emphasis in the BiOps is water management for federally listed species in the UKB, sometimes at the expense of other uses in the basin, and illustrates the critical role that water management has on the basin.
In 2024, the UKB experienced substantial avian die-off. Approximately 20,000 migratory birds perished due to an outbreak of avian botulism with the bacteria Clostridium botulinum (Oregon Public Broadcasting, 2024b). The outbreak was exacerbated by warm temperatures, low water levels, and shrinking wetland habitat, which concentrated bird populations and increased disease transmission (Main, 2024). In response, Reclamation released water into key wildlife refuges to mitigate conditions favorable for bacterial growth, and wildlife organizations provided rehabilitation efforts for affected birds (Oregon Public Broadcasting, 2024b). This event underscores the vulnerability of the region’s water-dependent ecosystems and the ongoing challenges in balancing water allocations among various ecological and human needs.
The recent removal of four Klamath River dams (State of California, 2024) represents a major hydrologic change in the basin, with anticipated effects on sediment transport, downstream hydrology, and aquatic ecosystems (Greimann and others, 2011; East and Grant, 2023; McCaffery and others, 2024). These riverscape scale changes introduce new considerations for flow timing, necessitating further adjustments to reservoir management and downstream flow strategies. Although these changes are expected to affect flow timing and water quality in the lower Klamath River, their effect on Upper Klamath Lake water management is less direct. The dam removal, water adjudication, BiOps, and reduced base flow and increased irrigation demand (Van Kirk and Naman, 2008) may further affect release strategies from Upper Klamath Lake, which could affect Upper Klamath Lake elevation forecasting.
Review of Upper Klamath Basin Data, Tools, and Models
Available data, tools, modeling capabilities, and assessments of nonstationarity (shifts or trends in hydrologic patterns) were cataloged to evaluate hydrologic forecasting capabilities in the UKB and identify potential ways to increase forecast accuracies. Collectively, these elements are referred to as “information.” This state-of-the-science summary is meant to provide a detailed foundation that can be used to provide improved water-availability assessment and forecasting capabilities but is not meant to be an exhaustive catalog of all UKB information.
Water-availability components that are relatively important within the UKB, including surface water, precipitation, ET, groundwater, and human water uses, were included in this review. Water-availability components are discussed in individual sections, with each section covering these topics:
-
1. Background information regarding the role the component plays in the hydrologic cycle within the UKB,
-
2. Summary of component data availability for the UKB,
-
3. Summary of tools and models used to assess or forecast hydrologic components in the UKB, including lake level, as of 2025.
In addition, a summary of publications to evaluate nonstationarity of individual or multiple hydrologic components in the UKB is included. Some data or studies are relevant to more than one of the five sections, and when this occurs, the data or studies may be briefly mentioned, and the reader will be referred to the section in which they are discussed in more detail, or different parts of the same study may be highlighted in multiple sections. A summary of relevant studies organized by hydrologic components (for example, surface water, precipitation, ET, groundwater, and water use) is provided in appendix 2.
An ongoing study of note is the Revised Klamath River Basin Natural Flow Study (NFS) and is being led by Reclamation (U.S. Bureau of Reclamation, 2024b). The NFS integrates multiple models to evaluate all major water budget components examined in this manuscript and is designed to estimate predevelopment streamflow at specific locations within the UKB. This effort updates a similar study published by Reclamation in 2005 (Perry and others, 2005). Several individual components of the NFS are discussed in the next sections.
Upper Klamath Basin Surface Water
Surface water, usually in the form of streamflow in cubic feet per second (ft3/s) as measured at a streamgage, is a key component of the Upper Klamath Lake water budget, and therefore the lake’s deliveries downstream. Surface-water inflow and its relative proportion of lake input varies temporally, but Perry and others (2005) estimated that surface water accounts for around 86 percent of annual input into Upper Klamath Lake. However, much of the surface-water input can be attributed to groundwater discharge to streams in the form of base flow. A synthesis of published water-balance estimates, including the relative contributions of major inflow sources such as Williamson and Wood Rivers, is provided in appendix 3. Other appendix 3 estimates of surface-water contribution to the Upper Klamath Lake water-budget range from 70 to 80 percent (combination of Williamson and Wood Rivers and “other” category).
The effects of climate, geology, land use, and anthropogenic activities are important drivers of streamflow. Examples of hydrologic processes that affect streamflow quantities include precipitation, snowmelt, runoff efficiency, infiltration, surface water-groundwater interaction, and diversions or consumptive use of streamflow. Cataloging, evaluating, and forecasting streamflow is a critical component of Upper Klamath Lake level forecasting.
Data
Sub-daily, continuously recorded, and publicly available streamflow data in the UKB are primarily collected by the USGS and OWRD (fig. 1; app. 1). Although streamgage 11509500 (Klamath River at Keno; U.S. Geological Survey, 2024d) is just downstream from the UKB, as described for this study, it was included in the analysis of this section because of its long period of record (103 years). As of water year 2022, the USGS collects sub-daily streamflow data at 15 streams or canals at or upstream from Keno, Oregon (these are considered “active” streamgages because data collection was ongoing at the time of analysis; app. 1). These data are available through the USGS National Water Information System (NWIS) and the National Water Dashboard (https://doi.org/10.5066/F7P55KJN). The OWRD publishes streamflow data at 38 streams and canals actively collected by OWRD, USGS, and Reclamation through the OWRD Near Real Time Hydrographics Data webpage (Oregon Water Resources Department, 2024c; app. 1). In addition to the streamflow data, USGS and OWRD websites provide a host of other information, including other data available at the site, site location metadata, basin characteristics such as drainage area, annual peak streamflow information, and period of record for data collection.
Inactive USGS streamgage data can be found using NWIS (U.S. Geological Survey, 2024d). The OWRD Historical Streamflow and Lake Level Data webpage (Oregon Water Resources Department, 2024d) can be used to find active and inactive streamgage data from multiple agencies, primarily OWRD and USGS.
Discrete streamflow measurements for USGS data can be found using NWIS (U.S. Geological Survey, 2024e) or NWIS Mapper (https://maps.waterdata.usgs.gov/mapper/index.html) or for the OWRD, at https://apps.wrd.state.or.us/apps/sw/sw_misc_measurement_map/ (for more current measurements) or https://apps.wrd.state.or.us/apps/sw/misc_measurements_view_only/ (typically older measurements that do not include spatial metadata such as latitude and longitude).
Stage data typically are collected at all USGS and OWRD streamgages. Stage data also can be found for UKB-area lakes and reservoirs and are collected at some streams and canals where streamflow is not calculated on public-facing websites. For example, the private utility PacifiCorp collected stage data at the JC Boyle bypass as far back as December 2010.
The Pacific Northwest Streamflow Catalog (U.S. Geological Survey, 2024c) tabulates the metadata for non-USGS streamflow, discrete streamflow measurements, and stage data and provides links for publicly available data. For example, discrete streamflow measurements are available from at least 15 sites measured by the U.S. Forest Service. However, not all metadata in the catalog have publicly viewable links, and the list of data available is not updated regularly. The Klamath Tribes have an active monitoring program that focuses on water quality but also includes some streamflow data (https://klamathtribeswaterquality.com/data/). Private streamflow data were not considered or discovered during this data review.
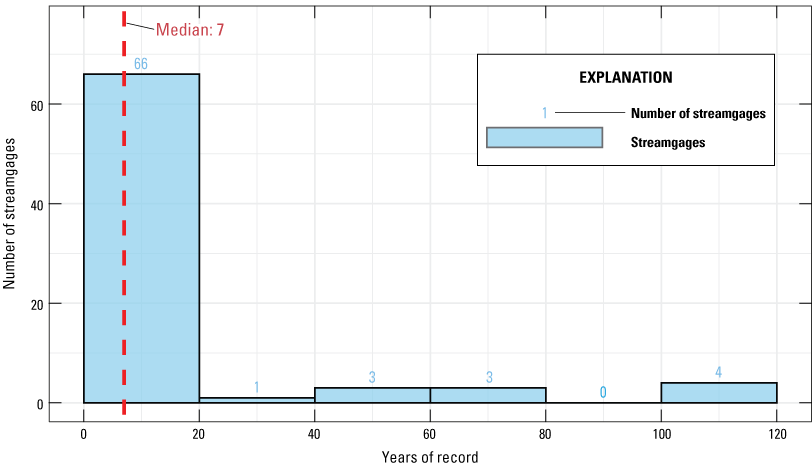
Most streamgages have records spanning fewer than 20 years (fig. 2; app. 1). Seven streamgages have records exceeding 40 years (including two with more than 100 years) and can be used to evaluate trends or other forms of nonstationarity.
Number of water years of record at streamgages in the Upper Klamath Basin as of February 2025 (Oregon Water Resources Department, 2024d; U.S. Geological Survey, 2024e).
Using classification data from the National Hydrography Dataset Plus (U.S. Environmental Protection Agency, 2014), 44.4 percent of the stream segments and 48.7 percent of the stream lengths in the UKB are of first-order streams (table 1). As stream order increases, the number of stream segments and total length of streams in the UKB decrease; 4.6 percent of stream segments and 3.5 percent of stream lengths are either classified as “zero-order” or “unclassified.”
Table 1.
Distribution of stream segment orders in the Upper Klamath Basin.[Stream orders derived from National Hydrography Dataset (U.S. Environmental Protection Agency, 2014). Abbreviations: km, kilometer; —, not applicable]
Modeling Capabilities and Similar Studies
Several tools exist for estimating or modeling streamflow into and around Upper Klamath Lake. Although there are several regional or national models that include Upper Klamath Lake, preference was given to models and tools that are smaller in geographic scope and (or) designed to model the Klamath Basin in particular. However, some larger-scale models, tools, and analyses were included when local tools were unavailable or when results were especially relevant. Prominent national-scale models not included in this analysis include the National Water Model (National Oceanic and Atmospheric Administration, 2024b) and the National Hydrologic Model (U.S. Geological Survey, 2024b). Appendix 2 provides a comparative summary of these models and other streamflow modeling approaches used in the UKB, including periods, spatial scope, and methodological notes.
In 2019, the USGS published a Precipitation-Runoff Modeling System (PRMS) tool and report that can be used to predict seasonal water availability in the UKB (Risley, 2019; Anderson and Wise, 2024). The PRMS is a deterministic, distributed-parameter, physical-process-based hydrologic modeling system that can be used to simulate streamflow, snow, solar radiation, evapotranspiration (ET), and surface-water/groundwater interaction within a basin. The model was calibrated to naturalized streamflow within plus or minus 5 percent for bias statistics. By accounting for surface water and groundwater, PRMS captures the critical role groundwater plays in maintaining streamflows during the dry season, which is particularly important for streamflow forecasting in the UKB.
The PRMS model can be used to forecast streamflow from the Sprague and Williamson River Basins into Upper Klamath Lake. Such forecasts require assembling model input datasets of anticipated daily precipitation and air temperature statistics.
Despite its capabilities, the PRMS has certain limitations. For example, inaccuracies in meteorological input data, such as precipitation and temperature, can affect model performance. Additionally, simulating groundwater/surface-water interactions remains complex, and although the PRMS can model these interactions to a high degree of precision, some uncertainties persist, particularly during extreme weather or prolonged drought conditions.
Currently (2025), Reclamation is refining the PRMS model as part of the ongoing NFS (U.S. Bureau of Reclamation, 2024b). That effort focuses on updating and improving the model calibration, incorporating newer data, and addressing known limitations. The final report from the PRMS model update is anticipated for release after 2025 and is expected to further enhance the accuracy and usability of the model for predicting seasonal water availability in the region.
In addition to the PRMS model, several other hydraulic analyses are in progress for Reclamation NFS (U.S. Bureau of Reclamation, 2024b) at the time of writing. The area capacity is the relation among lake elevation, lake volume, and surface area. The area capacity of Upper Klamath Lake and other local water bodies is being developed using updated contour maps, lidar data, bathymetric data, digital-elevation maps, and information from reports. In addition, a hydraulic model is being developed to provide a rating curve of Upper Klamath Lake water-surface elevation and Link River discharge.
Hay and others (2009) detailed a method for selecting parameter sets and input ensembles for a hydrologic model (PRMS) of the Sprague River Basin in the UKB. The sets and ensembles selected were based on an atmospheric pressure index computed using mean November through February geopotential height anomalies over northwestern North America or Pressure Index from Geopotential Heights (PIG). Water years were divided into low, medium, and high PIG years, which tend to have higher, near average, and lower than average streamflow for the period of March through May. Forecasts for the March–May period were made using different Ensemble Streamflow Prediction (ESP) sets; one ESP set used the initial parameter set, and the other used the parameter set associated with the PIG parameters set that corresponded to the given year. The results from the study indicated that ESP forecasts conditioned on PIG significantly improved accuracy, particularly in low-flow years, highlighting the strong effect of large-scale atmospheric circulation on UKB streamflow. These results underscore the potential benefits of incorporating climate-informed parameterization into hydrologic models to enhance water-management strategies in a basin where competing demands make accurate forecasting essential.
There was an attempt to estimate the effects of surface-water right curtailments on growing season streamflow into Upper Klamath Lake in two USGS studies. Hess and Stonewall (2014) developed a statistical approach using the Composite Index Year to estimate curtailment effects. The report detailed an estimated net gain of 19,600 acre-ft of gain for the combined Williamson River and Wood River Basins during July 1–September 30, 2013. Wood (2020) developed a Boosted Regression Tree (BRT) Machine-Learning model to estimate water-right curtailment effects in the Sprague River Basin, which is a tributary to the Williamson River. The BRT approach estimates unique base-flow conditions by training a model using years with no regulation and then subtracting estimates using the BRT model from measured streamflow. The report detailed an estimated net gain of 12,600 and 6,900 acre-ft at the Sprague River near Chiloquin streamgage (USGS station 11501000) in 2013 and 2014, respectively, arising from irrigation curtailment.
In 2021, the OWRD developed a tool to calculate storage and flow releases from Upper Klamath Lake (app. 3). This tool was developed pertinent to implementation of the order of the Marion County Circuit Court dated May 12 and October 13, 2020 (Klamath Irrigation District versus Water Resources Department; State of Oregon, 2020). The tool used a variety of directly and indirectly measured and estimated data, including streamflow, diversions, groundwater, and climate to evaluate key water-budget components of Upper Klamath Lake.
Cooper (2004) estimated natural UKB streamflows as part of Oregon’s water adjudication process, providing baseline flow estimates for instream water rights evaluations. Using historical streamgage records, regional regression models and flow-duration curves, the study accounted for consumptive water use and anthropogenic modifications, such as alterations to Klamath Marsh and the draining of Lower Klamath Lake. The analysis produced long-term (1958–87) monthly 50-percent exceedance natural streamflows for 157 basins, providing a reference for understanding hydrologic variability in the UKB. Although the regression models performed well in specific areas, the study also highlighted challenges in estimating streamflow in spring-fed and lake-regulated systems.
Bakke and others (1999) used a regional adjustment relationship (RAR) to estimate monthly mean streamflow into Upper Klamath Lake. The RAR approach uses the relationship between streamflow characteristics for a short period and those for a long period at multiple sites in a broadly defined geographic region to estimate long-term characteristics. The authors determined that this approach was statistically robust for the UKB. Standard errors of estimated monthly streamflows ranged from 0.069 to 0.191 in base-10 logarithmic units of cubic meters per second (m3/s).
Madadgar and others (2014) evaluated various methods of model bias correction for streamflow forecasts and performed a case study using a PRMS model of the Sprague River. The authors used PRMS to generate ensembles of monthly streamflow forecasts using a forecast horizon of 6 months. Various multi-variable post-processors were used to reduce model bias. Quantile mapping, a commonly used bias correction statistical technique for hydrologic forecasts, generally underperformed relative to the other bias correction approaches evaluated and provided worse results compared to no-bias correction in specific conditions. The authors proposed and evaluated another bias correction post-processor technique based in copula functions. The authors proposed that copula-based post processing was a more effective bias correction approach than quantile mapping, including for the case study of the Sprague River.
The National Oceanic and Atmospheric Administration (NOAA) California Nevada River Forecast Center (CNRFC) provides ensemble forecasts of net inflow into Upper Klamath Lake, referenced to the Klamath Falls weather station and forecast point (KLAO3) and is relied on by regional water managers for insight into probable hydrologic outcomes (California Nevada River Forecast Center, 2025). The CNRFC forecasts incorporate real-time streamflow observations, meteorological forecasts, and hydrologic models to estimate a range of possible inflow volumes. The forecasts account for uncertainties in precipitation, snowmelt, and hydrologic conditions, providing probabilistic guidance on expected inflows. These forecasts can be used to anticipate water availability and inform adaptive management strategies. Future improvements in surface water-groundwater interaction modeling and climate-informed hydrologic predictions could enhance the utility of these inflow forecasts for decision-making in the UKB.
Fleming and others (2021) evaluated a next-generation water-supply forecasting system developed by the Natural Resources Conservation Service (NRCS) that uses a multi-model ensemble machine learning framework (referred to as “M4”) to generate seasonal runoff forecasts across the western United States. The study results indicated substantial gains in forecast accuracy compared to legacy statistical methods, with improvements in deterministic and probabilistic skill scores across 20 diverse watersheds. The underlying approach is applicable to snowmelt-dominated and mixed hydrologic systems, such as the UKB. This new forecasting framework was adopted for operation by the NRCS in 2024, and forecasts generated by the M4 system can be accessed online through the NRCS Snow Survey and Water Supply Forecasting Program. Forecast products, including streamflow volume forecasts for select sites in the UKB (Natural Resources Conservation Service, 2026), are publicly available. These forecasts support regional water-management decisions by providing probabilistic guidance for water availability throughout the spring and summer runoff period.
Risley and others (2008) developed regression equations to estimate a suite of 46 streamflow statistics at ungaged sites across Oregon, including the UKB. The study used generalized least squares regression methods applied to data from 104 streamgages in Oregon and surrounding states, relating streamflow characteristics—for example, median annual flow, the 95th percentile of January flow, or the 0.1 annual non-exceedance for the 7-day mean flow—to physical basin attributes such as drainage area, mean elevation, and precipitation. To support application of these equations, the USGS integrated the equations into the StreamStats web application (U.S. Geological Survey, 2019), which enables users to delineate basins and compute streamflow estimates using automated geospatial-based workflows. Although the equations were developed for general planning and ecological assessments, they also can be used to assess flow regimes in ungaged catchments and identifying locations for future streamgages. These capabilities are particularly relevant in the UKB, where many tributaries and headwater streams lack long-term streamgages (fig. 1).
Upper Klamath Basin Precipitation
Precipitation in the UKB falls as snow and rain and provides recharge to the hydrologic system. The UKB is within the rain shadow at the base of the eastern slope of the Cascade Range and on the northwestern fringe of the Basin and Range physiographic region (fig. 1 in Risley and Laenen, 1999), which is characterized by strong topographic relief (fig. 1). As a result, the UKB has high spatial variability in annual precipitation and forms (Risley and Laenen, 1999; fig. 1). A water budget for the UKB simulated mean-monthly precipitation and identified peaks in December, with an average of about 21.5 inches (in.) annually for water years 1984–2015 (Risley, 2019). Risley (2019) determined that, during December and January, approximately 74 percent of total simulated precipitation was snowfall. Precipitation also falls during the summer (July–September) within the UKB, but is infrequent, with an average of one to two precipitation events greater than 0.25 in. per summer during 1949–2008 (Chiodi and others, 2016). Heavy winter precipitation within the UKB has been attributed to a synergistic interaction between frontal and orographic forces, where frontal rainstorms pass over the Cascade Range through cross-barrier flow and small-scale undulations over windward foothills (Medina and others, 2005; Woods and others, 2005; Garvert and others, 2007).
Precipitation patterns within the UKB are affected by large-scale climate features. Kennedy and others (2009) determined a revised Trans-Niño Index (TNI), a measure of the standardized sea surface temperature gradient between Niño 1 +2 and Niño 4 regions (refer to Trenberth and Stepaniak [2001] for descriptions), was significantly and positively correlated during the warm phase of the Pacific Decadal Oscillation (PDO).The averaged October–December TNI is positively correlated with November–March precipitation and April 1st snow water equivalent (SWE). During the cool phase of the PDO, when late fall and early winter TNI is negative, lower than normal winter precipitation and snow is expected within the UKB. The authors also performed a cursory evaluation of the October–December multi-month TNI, which has been identified as the most valued aggregation. They observed a homogenous pattern with low variability during 1880–1977 and a homogenous pattern of high variability starting in 1978, which they speculate could be attributed to the 1976/1977 PDO phase shift, more far-reaching climate change, variability of statistical noise, or another mechanism.
Data
The most common parameter to describe snowpack is SWE, which expresses the depth of water contained in the snow. During 1978–79, the NRCS installed eight automated Snow Telemetry Network (SNOTEL) sites that provide SWE measurements in the UKB. The network expanded to 12 sites during 2000–06 (fig. 1; app. 1). The data are available via the National Water and Climate Center's Snow and Water Interactive Map (https://www.nrcs.usda.gov/resources/data-and-reports/snow-and-water-interactive-map). In addition to SWE, SNOTEL stations also collect data on snow depth, all-season precipitation accumulation, and air temperature with daily maximums, minimums, and averages. The SNOTEL sites are spatially distributed at elevations ranging from 1,478 to 2,158 meters (m) but are below a ridge line, resulting in wind sheltering (Risley, 2019) and do not capture SWE at lower elevation ephemeral snowpack and higher elevation alpine areas within the basin (fig. 1). However, SNOTEL sites with greater wind sheltering (or lower wind speeds) combined with wet snow conditions observed in the Cascade Range result in strong consistency between SWE and accumulated precipitation (Meyer and others, 2012). To quantify the spatial extent of snow cover at the drainage basin scale, remotely sensed snow-cover data from the Moderate Resolution Imaging Spectroradiometer (MODIS) satellite platform are available at 500-m and 15-minute resolution since 2000 (https://nsidc.org/data/modis/data). The Landsat satellite network also provides a variety of snow cover metrics at 30-m and 16-day resolution since 1984 (Selkowitz and Forster, 2016).
To better capture SWE dynamics at the basin scale, several gridded high-resolution datasets that are built on ground-based observations, satellite imagery, and reanalysis products with varying spatial and temporal resolution, accessibility, and latency estimates are available. The Airborne Snow Observatories (https://www.airbornesnowobservatories.com/about-us/) have collected a late-winter gridded 50-m estimate using modeled snow density and scanning lidar depth measurements since 2013, but data are not publicly accessible for the UKB. NOAA’s National Operational Hydrologic Remote Sensing Center (NOHRSC) SNOw Data Assimilation System (SNODAS) modeling and data assimilation system generates daily and hourly gridded products and data at 1-square kilometer (km2) spatial resolution, including estimates of SWE, snow depth, snowpack temperatures, snow sublimation, snow evaporation, estimates of blowing snow, modeled and observed snow information, airborne snow data, satellite snow cover, historical snow data, and time-series for selected modeled snow products (Carroll and others, 2006). The Snow Water Artificial Neural Network Modeling System (SWANN) leverages ground-based measurements (SNOTEL and the Cooperative Observer Program [COOP]) with gridded temperature and precipitation data from the Parameter-elevation Regression on Independent Slopes Model (PRISM) and a physically based snow density model to predict daily SWE and snow depth at 4-kilometer (km) pixels back to 1980 and across the Continuous United States (CONUS; Broxton and others, 2018). The developers used this method to evaluate annual maximum SWE, snow season duration, April 1st SWE and drivers (such as October–March temperature and cumulative precipitation) from 1982 to 2016 at the CONUS scale (Zeng and others, 2018).
Precipitation data for the UKB are available from ground-based meteorological stations and simulated spatial climate datasets, both of which have strengths and limitations. Within a 250-km radius of Klamath Falls, there are records from 28 active and 52 inactive meteorological stations, with the most proximal site being at the Crater Lake–Klamath Regional Airport (fig. 1; app. 1). The NOAA National Centers for Environmental Information (NCEI) precipitation data are available via Global Surface Summary of the Day (National Oceanic and Atmospheric Administration, 2024a). These data can be downloaded, parsed, and cleaned in R Statistical Software (R Core Team, 2024) using the Global Surface Summary of the Day R (GSODR) package (Sparks and others, 2017). For within-basin measurements of precipitation, all-season daily precipitation accumulation data are available at SNOTEL sites. However, the accuracy and magnitude of snowfall measured is affected by the environment and monitoring methodology (Rasmussen and others, 2012; National Oceanic and Atmospheric Administration, 2025). For example, the Crater Lake–Klamath Regional Airport station is in a more arid part of the UKB (fig. 1; app. 1), which could be affected by wind-induced turbulence due to the lack of breaks (Rasmussen and others, 2012), and unknown deployed equipment (National Oceanic and Atmospheric Administration, 2025) could affect the accuracy and magnitude of snowfall measured in the UKB.
Modeling Capabilities and Similar Studies
Because precipitation in the UKB originates as snow and rain and contributes to surface water and groundwater, models that account for both sources and associated hydroclimatic processes are essential. As summarized by Mankin and others (2025), there are numerous CONUS-scale gridded, high-resolution hydro-climate datasets that are built on ground-based observations, satellite imagery, and (or) reanalysis products with varying spatial and temporal resolution, accessibility, and latency that affect hydrologic data analysis and modeling. The review by Mankin and others (2025) concluded that no single best source of gridded climate data exists, but they provide common themes and overall recommendations to help guide dataset selection by investigators.
At the CONUS-scale, the NOHRSC Snow Model (NSM) includes energy-and-mass-balance snow accumulation and ablation at 1-km2 spatial resolution, hourly temporal resolution, and is available near real-time (Carroll and others, 2006). The NSM relies on physically downscaled (13–1 km2) numerical weather-prediction model forcings, which includes gridded hourly estimates of air temperature, relative humidity, wind speed, precipitation, incident solar radiation and incident longwave radiation and static grids of slope, aspect, soil type, and forest type. The raw model output is verified using ground-based, airborne and satellite snow observations, differences between modeled and observed values are calculated, and the model and associated products are updated in real-time. The model has run continuously at hourly time steps in operational mode since the 2004–05 snow season.
The USGS published a PRMS tool, report, and data that can be used to predict seasonal water availability during 2000–15 in UKB (Risley, 2019; Anderson and Wise, 2024). This report focused on SWE, but the snow module in PRMS could also be used to predict additional parameters, such as snowmelt, snow depth, density, free water content, temperature, albedo, sublimation, cover area, and meltwater. As of the time of writing, the PRMS model is being updated under Reclamation’s NFS (U.S. Bureau of Reclamation, 2024b) and will include predictions of all parameters in the snow module (K. Mikkelson, Reclamation, written commun., February 2025). A consolidated list of precipitation datasets and snow modeling efforts in the UKB is provided in appendix table 2.1.
Upper Klamath Basin Evapotranspiration
Evapotranspiration is a substantial part of the hydrologic budget for Upper Klamath Lake and the surrounding marshes and is the greatest loss of water from terrestrial sites (Bidlake, 2002). However, basin-wide estimates of ET remain difficult to quantify. Some components of the hydrologic budget, such as streamflow, can be measured directly. Other components, including ET, are difficult to measure directly at large scales and must be estimated or inferred from other measurements. Because ET is a large component of the hydrologic budget, uncertainties in ET estimates can propagate into other components such as groundwater and consumptive use, making water availability predictions difficult.
Data
Reclamation maintains potential crop ET monthly averages and yearly totals for many crops, including pastureland, using meteorological data from the Agricultural Weather Network (AgriMet, https://www.usbr.gov/pn/agrimet/; fig. 1; app. 1), locally derived crop coefficients, and the American Society of Civil Engineers (ASCE) Penman-Monteith equation (ASCE-PM; Allen and others, 2005) and (or) the Kimberly-Penman equation method (Wright, 1985). The Klamath Falls station (KFLO) collected data from 1999 to present (2025). Additional sources of ET data with records of 2 or less years within the UKB and nearby wetlands are also available (Bidlake, 2000; Stannard and others, 2013; Desert Research Institute and Bureau of Reclamation, 2024); these studies collected actual ET fluxes measured from Bowen Ratio stations.
Evapotranspiration values for Klamath County for 2015 can be found in a data release (Painter and others, 2021b). This dataset uses 2015 MODIS satellite data at 1-km resolution and the Operational Simplified Surface Energy Balance (SSEBop) model (Senay and others, 2013) to estimate annual ET values for the county (agriculture and non-agriculture lands) and annual and monthly ET values for potentially irrigated areas. The ET values represent the actual amount of water lost to ET, which includes the combined effects of irrigation inputs, effective precipitation, and root uptake of shallow groundwater.
Zhao and others (2015) published total seasonal and monthly ET datasets from April to October 2013 for a large area of the UKB using the Mapping Evaporation at High Resolution and Internalized Calibration (METRIC) model. The METRIC model uses 30-m resolution Landsat imagery to quantify ET for irrigated fields.
Two Oregon House Bills, House Bill 2018 from 2021 and House Bill 2010 from 2023, were passed to help fund development of a statewide ET and water use dataset for Oregon (Oregon Water Resources Department, 2024b). The dataset includes 30-m, monthly ET raster maps, generated using the OpenET methods for years 1985–2022 and field summaries of ET at more than 250,000 agricultural field boundaries. This dataset is designed to support water planning and management and inform development of consumptive use estimates for statewide water budgets.
Open-water Evaporation and Wetland Evapotranspiration Models
Several studies have focused on estimating the open-water evaporation from Upper Klamath Lake and surrounding wetlands because this is a substantial component of the hydrologic budget of the lake. Kann and Walker (1999) used daily class A pan-evaporation measurements from the Oregon State University Experimental Station in Klamath Falls. A conversion factor of 0.7 was used to estimate open-water evaporation from Upper Klamath Lake. Total volume lost from the lake was calculated by multiplying the estimated daily open-water evaporation by the lake surface area. Evapotranspiration was estimated as 14 percent of the annual Upper Klamath Lake outflow. Walker and Kann updated ET estimates in 2012 and 2022 (Walker and others, 2012; Walker and Kann, 2022) using more current data. These later studies estimated ET at 15–17 percent of Upper Klamath Lake outflow, depending on the period evaluated.
Hubbard (1970) estimated ET from the lake and the surrounding marsh area using measured lake outflows and a water-balance equation. Hubbard (1970) concluded that ET accounted for 16 percent of the lake outflow. The Hubbard (1970), Walker and others (2012), and Walker and Kann (2022) studies have considerable uncertainty which can then propagate to other components of the water budget.
Bidlake (2000) measured ET using short-term (less than 2 days) eddy covariance data from four site visits to calibrate a Penman-Monteith model during the growing season in 1997 at one site in the wetland northwest of the lake. This study was among the first studies to use eddy covariance for inundated wetlands in the western United States. Bidlake (2000) concluded that ET accounted for the largest net water loss from the site, reinforcing the importance of reliable ET data for accurate predictions of water availability in the UKB.
Hostetler (2009) used a one-dimensional surface energy balance lake model to simulate open-water evaporation. The lake model used data from land-based sites and rafts in Upper Klamath Lake during 2005–06 to produce simulations of daily lake evaporation from 1950 to 2005. This method used weather station data from sites near Upper Klamath Lake as well as a 1949–2007 regional climate simulation over western North America. Hostetler’s analysis indicated statistically significant nonstationarity during the 56 years of the study, which are associated with a general drying pattern in the UKB and changes in meteorological forcing over Upper Klamath Lake and the radiative and moisture balances at higher elevations of the catchment (Hostetler, 2009).
Stannard and others (2013) monitored ET from two wetland sites, one site dominated by bullrush and one site with mixed vegetation, using the eddy-covariance method. The Bidlake (2000) site was about 200 m northwest of the bullrush site, with almost identical vegetation. For this study, two sensors were used to adequately measure the rapid fluctuations in wind-speed components, air temperature, and vapor density caused by movement of the smallest eddies that contribute to the turbulent flux of momentum, heat, and water vapor (Stannard and others, 2013). In the same study, open-water lake evaporation was also monitored at multiple sites bi-weekly during the warmer months from 2008 to 2010 using the Bowen-ratio energy balance method (U.S. Geological Survey, 1954). Sites included the middle of the lake, near a deep trench along the western margin of the lake, at the mouths of the Williamson and Wood Rivers and Sevenmile Canal, and at the beginning of the Link River and A Canal (fig. 1 in Risley and Laenen, 1999; fig. 1 in Stannard and others, 2013). The two wetland sites provide relatively accurate estimates of biweekly ET during the study (root-mean squared error [RMSE]=0.396- and 0.347 [millimeter per day], r2=0.962 and 0.971). Overall, the measured open-water evaporation was 20-percent greater than wetland ET during the same periods. Open-water evaporation displayed a seasonal pattern similar to wetland ET but with variance between seasons (Stannard and others, 2013).
To estimate open-water evaporation in the UKB, Reclamation has used a modified version of the Complementary Relationship Lake Evaporation (CRLE) model (Morton, 1983, 1986; Morton and others, 1985). The CRLE model requires monthly estimates of solar radiation, air temperature, and dewpoint temperature and provides estimates in locations with little weather data. The CRLE model estimates monthly evaporation and aggregates and sums to annual totals for period change and statistical analyses of monthly and annual results (Huntington and others, 2015). Huntington and others (2015) concluded that the seasonal estimates of ET derived from the CRLE model adequately simulate seasonal evaporation from Upper Klamath Lake when compared to Bowen ratio energy balance estimates reported by Stannard and others (2013).
Oregon’s statewide ET project developed open-water evaporation estimates for 83 waterbodies across the State, including Upper Klamath Lake (Huntington and others, 2025). Output from two models, CRLE and the Daily Lake Evaporation Model (DLEM), are available for Upper Klamath Lake for 1980–2021. Both CRLE and DLEM estimates were highly correlated with station estimates in Upper Klamath Lake, although the DLEM indicated better agreement with RMSE and bias (expressed as slope through origin).
Evapotranspiration Models
Bidlake (2002) estimated ET from fallow agricultural fields that had not been irrigated in a year near Tule Lake in northern California, about 45-km southeast of Klamath Falls, Oregon (fig. 1 in Bidlake, 2002). This area is outside the scope area of this report, but the agricultural field conditions are likely similar to those in the study area. This study used the Bowen-ratio energy balance from three sites from May to October 2000. Net radiation, soil heat flux, air temperature, vapor pressure, and vertical wind speed were directly measured.
Reclamation has used the ET Demands model (Huntington and others, 2015) to estimate irrigation water demand. Irrigation demand is the volume of water needed to balance potential ET, effective precipitation, and soil moisture loss over a crop’s growing season. The ET Demands model estimates crop ET of a vegetated area using a reference ET and crop coefficient. The Klamath ET Demands model domain includes the Klamath Basin in Oregon and California. Meteorological data used in the model (daily maximum and minimum temperature, daily average dewpoint temperature, daily average solar radiation, and daily average windspeed) come from Reclamation’s AgriMet station in Klamath Falls, Oregon, and the California Irrigation Management Information System. Data used to calibrate several vegetation timing parameters—such as greenup, planting, and harvest—are sourced from AgriMet stations operated by cooperators in the basin (Huntington and others, 2015). Reclamation uses ET Demands to simulate reference ET, growing-season and non-growing-season soil, and root zone water-balance components, irrigations, crop ET, and net irrigation water requirement (NIWR), all at daily time-steps (Huntington and others, 2015). Reference ET is computed at each National Weather Service Cooperative Observer Program (NWS COOP) weather station (Met Nodes), specifically the Crater Lake–Klamath Regional Airport station for the UKB (fig. 1; table 2.1), and all subsequent values are computed for each ET cell and crop type specified. ET cells incorporate spatial information, such as soil type and crop type and land areas, which are used with the Met Node estimated reference ET to estimate crop ET and NIWR for each ET cell. In the ET Demands model, ET cells are equivalent to the 8-digit hydrologic unit code (HUC8) areas.
Recent research has highlighted the increasing effects of warming and aridity on water availability in the UKB and surrounding regions. Hall and others (2023) examined long-term trends in temperature, precipitation, and aridity across the Great Basin, including parts of the UKB, using observational climate data and model simulations. Their analysis indicates that rising temperatures and increasing evaporative demand have intensified hydrologic stress, reduced soil moisture and altering seasonal runoff patterns. These changes are expected to amplify drought severity and water scarcity, with implications for streamflow, groundwater recharge, and ecosystem resilience in the UKB. The study’s findings underscore the importance of incorporating climate-driven hydrologic changes into water-resource planning, particularly as the region faces heightened competition for water among agricultural, ecological, and municipal users. Appendix table 2.3 summarizes the ET studies and models applied in the UKB, including open-water and crop-specific ET estimates.
Remotely Sensed Models of Evapotranspiration
The USGS SSEBop model is used for estimating ET using remotely sensed land surface temperature and global weather datasets (Senay and others, 2013; Senay, 2018; U.S. Geological Survey, 2026). SSEBop applies a thermal index approach, parameterizing reference conditions to estimate ET consistently across diverse landscapes and seasons (Selkowitz and Forster, 2016). SSEBop data, available for CONUS from 2000 to present (2025), at 1-km resolution, has indicated reasonable agreement with eddy covariance ET data, explaining 64 percent of the variability across ecosystems in validation tests (Senay and others, 2013). This method performs reasonably well compared to eddy covariance ET data, explaining 64 percent of the variability across diverse ecosystems in 2005 when it was tested. The 1-km resolution is appropriate for larger landscape scale analyses but may be too coarse for resolving smaller scale features, such as irrigated agricultural fields in arid to semi-arid regions.
SSEBop data are available for CONUS from 2000 to present (2025) at 1-km spatial resolution. SSEBop data include several 8-day products where the unit is total actual ET in mm per 8-day period. The 8-day products include seasonal cumulative ET anomaly, monthly ET anomaly, and yearly ET anomaly. The 8-day data can be found at U.S. Geological Survey (2026).
Daily ET data are available in mm for the CONUS from 2000 to 2022 and yearly in mm from 2000 to 2021 (Senay and Kagone, 2019). Daily ET raster images include known issues, such as missing values due to cloud cover and require an approximation of those values. Hence, the 8-day ET fraction (ETf) product was used to compute daily ET values by multiplying the ETf by a daily reference ET (ETr) obtained from the Gridded Surface Meteorological (Gridmet) dataset (Abatzoglou, 2013).
Another source of ET data, OpenET, comes from a consortium of universities, Federal agencies, and private industries that provide satellite-based estimates of actual ET from multiple satellite-driven models, which SSEBop is a part of, and also calculates a single ensemble value from those models (https://etdata.org/methods/). All models used in OpenET (table 2) have been used previously by government agencies tasked with quantifying water use and water management, and some have been used internationally. All models use Landsat data to produce 30-m ET data with additional inputs, including wind speed, humidity, air temperature, solar radiation, and at times, precipitation in gridded weather datasets from gridMET, Spatial California Irrigation Management Information System (CIMIS), Daymet, PRISM, and North American Land Data Assimilation System (NLDAS; https://openetdata.org/).
Table 2.
Models currently (2025) included in OpenET.[Models tabulated from https://etdata.org/methods/]
| Model acronym | Model name | Primary references |
|---|---|---|
| ALEXI/DisALEXI, v 0.0.32 | Atmosphere-Land Exchange Inverse/Disaggregation of the Atmosphere-Land Exchange Inverse | Anderson and others (2007, 2018) |
| eeMETRIC, v 0.20.26 | Google Earth Engine implementation of the Mapping Evapotranspiration at high Resolution with Internalized Calibration model | Allen and others (2005, 2007, 2011) |
| geeSEBAL, v 0.2.2 | Google Earth Engine implementation of the Surface Energy Balance Algorithm for Land | Bastiaanssen and others (1998); Laipelt and others (2021) |
| PT-JPL, v 0.2.1 | Priestley-Taylor Jet Propulsion Laboratory | Fisher and others (2008) |
| SIMS, v 0.1.0 | Satellite Irrigation Management Support | Melton and others (2012); Pereira and others (2020) |
| SSEBop, v 0.2.6 | Operational Simplified Surface Energy Balance | Senay and others (2013); Senay (2018) |
Most of the models that make up the OpenET ensemble are based on full or simplified implementations of the surface energy balance (SEB) approach (https://etdata.org/methods/#calculating-openet-ensemble-value). The SEB approach accounts for the energy used to transform liquid water in plants and soil into vapor that is released to the atmosphere. The SEB approach relies on satellite measurements of surface temperature and surface reflectance combined with other key land surface and weather variables to estimate components of the energy balance—net radiation, sensible heat flux, ground heat flux, and latent heat flux, which is the energy consumed through ET (https://openetdata.org/). OpenET data in mm and in. from 2018 to present (2025; and from earlier using Application Programming Interface [API]) can be obtained at different spatial scales from individual fields to the gridded raster, or the scale can be chosen by the individual based on user-defined boundaries. Individual field data includes crop type, actual ET based on the results of the model ensemble, field size, and a graph of annual ET data. Raster data includes monthly, daily, and cumulative ET data in inches or mm for the ensemble as well as each individual model since 2018.
The accuracies of the satellite-derived ET data were evaluated by comparing the satellite-derived data with data from 152 eddy covariance stations and 4 lysimeters located throughout the conterminous United States. Nearly all models determined high-accuracy ET measures for croplands, but the ensemble generally outperformed any individual model across most accuracy metrics (OpenET, 2021; Volk and others, 2024). The ensemble ET data are highly accurate over large areas, within about 15-percent error for a growing season for well-watered cropland such as regularly irrigated fields in the UKB. Minimal systematic bias was observed in croplands, especially at seasonal and annual timescales in arid or semi-arid climate regions (Volk and others, 2024). Goodness-of-fit statistics between OpenET derived ET data and eddy covariance station ET data for the daily, monthly, and seasonal timestep include the slope of the linear regression through the origin which measures bias, the mean bias error (MBE), the mean absolute error (MAE) and the root-mean squared error (RMSE), and the coefficient of determination (r2) between OpenET and closed energy balance eddy covariance station ET data (Supplementary tables 2–6 in Volk and others, 2024). The accuracy of the growing season is much lower for other land types, such as evergreen forests (25–38-percent error), grasslands (2–43-percent error), mixed forest (22–27-percent error), shrublands (4–46-percent error), and wetlands (8–44-percent error). Monthly ET accuracy between ensemble derived ET data and ground-based ET data are generally less accurate than the growing season comparison (OpenET, 2021). As of 2025, satellite-derived ET data in OpenET does not agree with measured ET data over open-water and riparian or marsh sites because most models overpredicted ET (Volk and others, 2024).
The OpenET eeMETRIC model has been used by Desert Research Institute and Reclamation to estimate ET for Reclamation’s NFS. The model uses optical and thermal data from the Landsat series of satellites combined with local weather stations to measure actual ET, which is often less than potential ET (Kilic and others, 2020). The model estimates monthly net ET at a 30-m resolution from 1985 to 2020, which has been used in conjunction with other methods to estimate deep percolation recharge by field. The model was chosen for the NFS because of its prior use in the basin (Snyder and others, 2012; Cuenca and others, 2013; Zhao and others, 2015), its accuracy in estimating ET from crops grown in the basin, and its suitability for complex terrain. The model was applied to agricultural lands and wetlands, with different methods used to account for water inputs. ET was estimated as ET minus effective precipitation for agricultural areas, and ET was estimated as ET minus total precipitation for wetlands. Additionally, phreatophyte ET estimates for areas in Nevada were calculated using the Beamer-Minor method (Bromley and others, 2023). The Beamer-Minor method uses a statistical relation between mid-summer vegetation indices and groundwater ET, incorporating gridded climate data to account for spatiotemporal climate variability (Bromley and others, 2023).
As part of the Reclamation NFS (U.S. Bureau of Reclamation, 2024b), Reclamation revised the open-water evaporation model to update open-water evaporation rates and volumetric evaporation from lake and reservoirs in the Klamath Basin (K. Mikkelson, Reclamation, written commun., February 2025). The revised evaporation rates are used in modeling lakes and reservoirs in the RiverWare mass balance model (Zagona and others, 2001), and evaporation from Upper Klamath Lake is used during calibration of the surface hydrology model (K. Mikkelson, Reclamation, written commun., February 2025). The open-water ET rates for the NFS are calculated using a revised Penman equation that includes an equilibrium temperature algorithm (Zhao and Gao, 2019), which accounts for heat storage in the reservoir. This new model is called the “Lake Evaporation Model” (LEM). Reclamation is using a version of the LEM, called “Daily Lake Evaporation Model” (DLEM), that accounts for daily fluctuations in lake depth and thus heat storage (K. Mikkelson, Reclamation, written commun., February 2025). The DLEM was run from water years 1981 to 2020. When results of the DLEM were compared to Stannard and others (2013) field measurements of open-water evaporation, the results were similar. In Upper Klamath Lake, DLEM has an overall positive percentage bias (computed as simulated minus observed divided by observed) and tends to overestimate evaporation by 2.1 percent (K. Mikkelson, Reclamation, written commun., February 2025). Meteorological data, except atmospheric pressure, for the DLEM model are from the Gridded Surface Meteorological dataset (gridMET; Abatzoglou, 2013). The gridMET dataset included daily values at a 4-km spatial resolution. Atmospheric pressure at the waterbody is derived using the ASCE-PM (Allen and others, 2005) and daily mean reservoir elevation. Daily average depth of the reservoirs is determined by a combination of methods, including water elevation, time series and area-capacity curves, objective water levels, or operating procedures.
Cuenca and others (2013) compared ground-based ET data collected using the Bowen Ratio at two pasture sites in the Wood River Valley north of Upper Klamath Lake, one irrigated and one non-irrigated, and compared those data to estimates of ET using the METRIC model and Landsat 7 imagery for four dates that covered the range in growing conditions during the 2004 irrigation season (April through September). Although the results between the two methods generally agreed, this study reported the utility of discerning the latent heat flux signal (ET rates) from irrigated and unirrigated lands in the same basin using the higher resolution Landsat data.
Upper Klamath Basin Groundwater and Storage
Groundwater is a substantial part of the hydrological budget in the UKB. Typical groundwater sources to surface water in the basin are seeps and springs, base-flow contributions to streamflow, and subsurface inflows into Upper Klamath Lake. According to Hubbard (1970), groundwater inflow accounts for about 16 percent of all inputs into Upper Klamath Lake. More recent estimates range from 13 to 21 percent (app. 3). Refer to fig. 1 in Gannett and others (2007), Palmer and others (2007), and Kennedy and others (2024) for geographic features described in this section.
The groundwater system in the UKB is composed of a system of variously interconnected aquifers of late Tertiary to Quaternary aged relatively permeable volcanic rocks, with transmissivity estimates ranging from 1,000 to 100,000 square feet per day (Gannett and others, 2007). Groundwater recharge areas are in the Cascade Range, in the western part of the basin and interior upland areas, and groundwater generally flows toward stream valleys and interior subbasins. Most streams throughout the basin have some component of groundwater discharge, commonly referred to as “base flow.” Some streams such as Wood River, Spring Creek, and the lower Williamson River are predominantly groundwater (spring) fed and have relatively constant flows throughout the year. Much of the surface-water flow into Upper Klamath Lake can be attributed to groundwater discharge to streams and major spring complexes within about a dozen miles from the lake. There also are groundwater discharge areas in the upper Williamson River and Sprague River subbasins (Gannett and others, 2007). Several springs along the northern rim of Upper Klamath Lake are considered important as spawning areas for Lost River suckers. These locations include Barkley Spring, Harriman Spring, Ouxy Spring, Sucker Spring, and some smaller springs. In contrast to the springs, recharge from irrigation water is uncertain within the UKB (Palmer and others, 2007).
The groundwater system in the UKB responds to external stresses such as climate, pumping, variations in lake stage, and canal operation, which results in fluctuations in the water-table surface (hydraulic head) and variations in groundwater discharge to springs (Gannett and others, 2007). Near the Cascade Range, fluctuations in groundwater levels associated with climate cycles have been as much as 12 ft and decadal-scale fluctuations of 5 ft are common throughout the basin. In addition to the fluctuations in the water table due to climate cycles, groundwater pumping commonly causes annual drawdown and recovery cycles of 1–10 ft near pumping sites (Gannett and others, 2007). As of 2025, parts of the basin are experiencing long-term drawdown effects, where the water table has been unable to recover to date. These drawdowns have been attributed to increases in ET and land-use change rather than groundwater pumping (Kennedy and others, 2024).
The groundwater system in UKB is complex and interconnected. There is no evidence of subsurface groundwater flow entering the UKB from neighboring basins (Gannett and others, 2007), but head gradient data indicate some groundwater may flow into the Tule Lake subbasin (not shown) and continue south toward the Pit River Basin (not shown; Gannett and others, 2007).
The USGS maintains a website documenting relevant UKB groundwater quantity studies conducted by the USGS. The information can be found at https://www.usgs.gov/centers/oregon-water-science-center/science/upper-klamath-basin-groundwater-studies#publications.
Data
Almost all groundwater data sources in the UKB are available through the USGS Upper Klamath Basin Well Mapper and the National Groundwater Monitoring Network. The USGS Upper Klamath Basin Well Mapper is an interactive web-based tool that identifies groundwater wells monitored in the UKB (note that the geographic boundary of the UKB is defined differently by this tool), in Oregon and California by the USGS, OWRD, and the California Department of Water Resources (https://www.usgs.gov/tools/usgs-upper-klamath-basin-well-mapper). Information contained in the mapper includes well name and location, whether the well is active or not, dates of activity, and links to the well hydrograph, well construction, and well lithology. The National Groundwater Monitoring Network (NGWMN) contains similar data and can be accessed through the NGWMN Data Portal (https://cida.usgs.gov/ngwmn/).
The OWRD Groundwater Section maintains a Groundwater Information System (GWIS) database (https://apps.wrd.state.or.us/apps/gw/gw_info/gw_info_report/Default.aspx). The database is a subset of wells from the larger state-wide well report database. GWIS information varies but can include groundwater site information, such as measured water levels, geochemistry, reported water use, lithologic data from well logs, stratigraphic interpretations, and more. Spring locations and outcrop and stratigraphic section locations also are included in GWIS.
Evaluating and quantifying base flow contribution to springs and streams can be difficult in the UKB. Gannett and others (2007) provided some estimates. But aside from Wood River and Spring Creek, gaged streams that are solely spring fed are rare. There are some streamgages where records overlap temporally, which geographically bracket a reach with groundwater discharge and may provide an estimate of groundwater discharge; however, many of these reaches have ungaged diversions or tributaries. Comparing streamflow from streamgages in late summer or fall, when flow is dominated by groundwater, can help inform comparisons of groundwater fluctuations from year to year. Information about accessing these data is described in the “Upper Klamath Lake Surface Water” section.
Data for 10 pairs of groundwater piezometers and lake stilling wells used to measure the vertical hydraulic gradient (VHG) of groundwater beneath Upper Klamath Lake during May–October 2017 are available from Corson-Dosch (2020a, 2020b). These data include instrument location, lake and groundwater depth to water at each site, and weekly mean VHG. These data were collected to understand groundwater inflow into the lake through the lakebed sediments. A previous attempt to install piezometers in Upper Klamath Lake to calculate the VHG and estimate vertical discharge to the lake was unsuccessful because of shifting positions of the pressure transducers likely caused by wave action (Kuwabara and others, 2016).
Essaid and others (2021) evaluated groundwater dynamics in the UKB using a combination of field measurements, hydrologic modeling, and statistical analyses. Their study quantified seasonal and spatial variations in groundwater levels and assessed groundwater contributions in Upper Klamath Lake. By integrating long-term groundwater monitoring data with regional hydrologic models, the authors identified key groundwater inflow zones and analyzed the response of the aquifer system to climatic and hydrologic variability. Their findings indicated that groundwater accounted for 21 percent of Upper Klamath Lake inflow during the period of study and was greatest in spring and near shore.
Recent legislative efforts have aimed to improve groundwater data collection and analysis in Oregon. House Bill 2018 (2021; Relating to assessment of groundwater resources, 2025) directs the OWRD, in collaboration with the USGS, to develop groundwater budgets for all major hydrologic basins, expand groundwater level monitoring, and enhance consumptive water-use reporting. These initiatives are expected to provide more comprehensive data to support groundwater-management decisions in the UKB and across the State.
Groundwater Models
Gannett and others (2012) developed a regional groundwater model of the UKB using a coupled groundwater and surface-water flow modeling system (GSFLOW) that integrated Modular Finite-Difference Groundwater Flow Model (MODFLOW)-2000 (Harbaugh and others, 2000; Hill and others, 2000) with PRMS to estimate groundwater recharge. The model covers the area upstream from the Iron Gate Dam in California. Model capabilities include simulating the spatial distribution of hydraulic head throughout the basin, estimating groundwater discharges to stream reaches and spring complexes, and simulating the effects of external stresses, such as pumping or climate variations, on the water levels and groundwater discharge to streams, lakes, drains, and other boundaries (Gannett and others, 2012). Gannett and others (2012) also developed a groundwater optimization model that used the groundwater flow model and constrained optimization techniques to identify operations that met water user needs and not negatively impact groundwater levels and streamflow. The wells used for the simulated pumping in this model are all downstream from the area of interest in this report, and most of the response in groundwater drawdown took place near the area that was being pumped. However, this model is included in this report because of the complex interconnectedness of groundwater and the close interaction between surface water and groundwater in the UKB.
The most comprehensive assessment of groundwater hydrology in the UKB was conducted by Gannett and others (2007), who characterized the hydrogeologic framework, groundwater flow patterns, and the interactions between surface water and groundwater. This study established a conceptual model of basin-wide groundwater movement, detailing recharge sources, discharge zones, and the role of permeable volcanic formations in sustaining regional groundwater flow. The findings from Gannett and others (2007) have informed subsequent groundwater modeling efforts and remain a foundational reference for understanding how groundwater dynamics affect hydrologic conditions across the UKB.
Reclamation, in collaboration with the USGS, is developing a UKB Groundwater Flow Model (UKBGFM) to simulate groundwater in pre-European settlement conditions (Traum and Boyce, 2022). The UKBGFM is based on the MODFLOW-2000 discussed previously (Gannett and others, 2012) but updated to MODFLOW-OWHM, which is designed for conjunctive-use management (Hanson and others, 2014; Boyce and others, 2020). Conjunctive use is the combined use of surface water and groundwater to sustain a reliable supply (Hanson and others, 2014). The UKBGFM uses an updated PRMS model to simulate recharge precipitation. Datasets derived from Desert Research Institute will be used to simulate evapotranspiration and groundwater pumping for irrigation and recharge from irrigation return. Urban groundwater pumping rates will be estimated using a variety of public data sources, and the remaining features of the UKBGFM will be simulated by packages based on the original MODFLOW-2000 (Gannett and others, 2012). This new groundwater model for the basin, projected to be released sometime in 2025, will produce daily output datasets for base flow to streams and seepage to and from lakes and reservoirs.
Bailey and others (2016) used a coupled Soil and Water Assessment Tool-Modular Finite-Difference Ground-Water Flow Model (SWAT-MODFLOW), groundwater levels, and field-estimated groundwater discharge rates to explore surface water-groundwater interactions in the Sprague River Basin of the UKB during 1970–2003. Results indicated high spatial variability in groundwater discharge rates and a mean annual groundwater discharge of 20.5 m3/s. Maximum groundwater discharge occurred September–October, and minimum rates were observed March–April. Changes in annual rates were negligible during the 34-year period evaluated.
Groundwater modeling efforts in the UKB have included subregional hydrologic dynamics, including those within the Tule Lake subbasin. A study by Pischel and Gannett (2015) evaluated the effects of groundwater pumping on agricultural drains in the Tule Lake subbasin, quantifying the hydrologic interactions between groundwater extraction and surface drain flow. Although this study provides insight into localized surface water-groundwater interactions, its findings are specific to the heavily managed Tule Lake area and do not extend to broader groundwater flow dynamics across the UKB. However, the study results highlight the complexity of water management in the region and underscore the importance of understanding how groundwater withdrawals affect surface hydrology at various spatial scales.
Upper Klamath Basin Water Use
Water use is an important component of the water budget in the UKB. Surface water and groundwater are withdrawn upstream and upgradient from Upper Klamath Lake, affecting lake levels directly or indirectly. Most of the water use in the United States falls into one of eight categories: irrigation, public supply, self-supplied domestic, thermoelectric, industrial, mining, aquaculture, or livestock (Dieter and others, 2018).
Nationally, the three most common uses of water are thermoelectric power (41 percent), irrigation (37 percent), and public supply (12 percent; Dieter and others, 2018). All other uses combined account for less than 10 percent of national water use. The breakdown of water use in the UKB differs from national patterns on account of the regional importance of agriculture and the lack of thermoelectric power. This section will outline those uses to the extent that such information is available.
For the purposes of this study, “water use” refers to water withdrawal and subsequent consumption, where consumption denotes the ET of withdrawn water, primarily through agricultural crops. Water may be withdrawn from surface or groundwater sources. The water-use data and studies discussed here overlap substantially with those in other sections, particularly the “Evapotranspiration” section. This section focuses on consumptive ET associated with water use rather than non-consumptive forms, such as open-water evaporation. For further details on these ET data and studies, refer to the “Evapotranspiration” section.
Data
Water-rights data for the UKB are publicly available on the OWRD “Frequently Used Mapping Tools” page (https://www.oregon.gov/owrd/access_data/pages/maps.aspx; Oregon Water Resources Department, 2024a). However, not all water rights allocations are used to their full extent, and actual water use typically is not directly monitored or publicly reported. This discrepancy between authorized and actual water use has been documented in multiple studies. Cooper (2002) compared the 1985 census of irrigated acres in Oregon to the total acres authorized by water rights and determined that actual irrigation ranged from 40 to 75 percent of the authorized acres statewide. Further, the report noted that only 43 percent of the water diverted for irrigation in 1990 was consumptively used by crops, indicating that a substantial part of allocated water is either unused or returned to the system. More recently, Schibel and Grondin (2023) highlighted similar challenges in water-use reporting, emphasizing that limitations in monitoring complicate efforts to quantify actual water use at the field scale. Multiple approaches can be used to estimate water use that are not monitored and reported.
Public-supply water refers to water that is withdrawn by public and private water suppliers and is distributed to at least 25 people or to a minimum of 15 connections (Dieter and others, 2018). Public-supply water is delivered for commercial, domestic, irrigation, industrial and thermoelectric uses, and for public services and system losses.
Public entities are required by State law (ORS 537.099; Oregon Legislature, 2023) to annually report water use to the OWRD. Procedures and requirements for reporting can be found in OAR 690-085 (Water Resources Department, 2023). Recently issued water-right permits have water-use reporting requirements.
User-reported water-use records can be viewed through the OWRD Water Use Reporting query tool (Oregon Water Resources Department, 2023). Approximately one-fifth (about 20 percent) of water rights are required to report use, and the data reported are not rigorously assessed (J. Beamer, Oregon Water Resources Department, written commun., May 8, 2025). The query tool allows the user to search by water user, point of diversion, or water right and obtain annual reports of water use reported by month. The query tool also allows the user to download a “Summary/Statistical Report,” which can be used to evaluate specific geographic areas defined by county, watermaster district, hydrologic unit code (HUC), or other areas of interest.
IrrMapper (University of Montana, 2023) is an online tool that can be used to estimate agricultural irrigation status for the years 1986–2023 in 11 western States, including Oregon and California. The land-cover database developed for IrrMapper includes four irrigated and non-irrigated classes, including human-verified irrigated fields (more than 50,000), dryland fields (38,000) and more than 193,000 mi2 of uncultivated lands.
OpenET (2023) is an online platform and collaborative effort to map ET at the scale of individual fields. The platform uses publicly available data, including satellite data, to estimate field-scale ET, which serves as a key component of consumptive water use. OpenET estimates consumptive use in 17 States, including Oregon and California, and operates at a spatial resolution of 30 m. Temporally, OpenET data can be viewed on a daily or larger timestep. More information on OpenET can be found in the “Upper Klamath Basin Evapotranspiration” section.
Recent studies have sought to increase accuracies of estimates of actual water use in the UKB by quantifying consumptive water losses. Huntington and others (2025) evaluated crop ET and open-water evaporation, providing high-resolution estimates of water consumption across different land-cover types. Their findings highlight seasonal and spatial variability in ET rates, with differences observed among crop types and climatic conditions. Additionally, the study quantified evaporation losses from open-water bodies, further refining estimates of non-irrigation water use. These results underscore the importance of accurate ET and evaporation data in assessing actual water use versus authorized allocations, informing water management and forecasting efforts in the region. The Huntington report was supported by the USGS Water-Use Data and Research Program (WUDR). The WUDR provides financial assistance through cooperative agreements with State water resource agencies, such as the OWRD. The project is designed to facilitate the collection and distribution of national water-use data and assessments.
USGS water-use publications of national scope may be available through the appropriate USGS ScienceBase webpage (https://www.sciencebase.gov/catalog/item/603fbeacd34eb12031185f37).
Modeling Capabilities and Similar Studies
Water-use modeling generally is performed on a national or regional scale. However, output typically is at smaller scales, such as the HUC12 scale. Water-use models can be more general or focus on specific aspects of water use (for example, irrigation and public supply). A summary of the datasets and modeling tools used to estimate water use and irrigation efficiency at different spatial scales is included in appendix table 2.5.
Tang and others (2009) used a satellite-based ET estimation system combined with the Variable Infiltration Capacity hydrological model (Liang and others, 1994) to estimate irrigation consumption in the UKB. These results were then used to assess the effects of irrigated agriculture on lake storage volumes and water levels. Tang and others (2009) estimated that for the 2001–05 period, irrigation results indicated a decrease of 0.3 m in annual Upper Klamath Lake water levels, with a decrease of 0.5 m in Upper Klamath Lake water levels for the month of October.
Painter and others (2021a) estimated ET values for specific geographic areas, including potentially irrigated areas for each county, total county areas, and irrigated lands within each county in 2015. Sources of information used to estimate ET include the number of irrigated hectares (ha) by irrigation system type, consumed-water values, and withdrawal values by water-source type.
U.S. Geological Survey professional series reports that include water-use data were completed once every 5 years, from 1950 to 2015 (for example, refer to Dieter and others [2018]), which includes the evaluation of water use for 2015). Water-use estimates are calculated for each State using a method that depends on data availability in the State. Data tables from all analyses from 1985 to 2015 can be found in a data release by Houston and others (2022).
Martin and others (2023) developed monthly irrigation water-use estimates for 2000–20 for HUC12 drainage basins in the conterminous United States (fig. 3). Results at the HUC12 scale include effective precipitation, reference ET, ET, irrigated areas, and consumptive use.
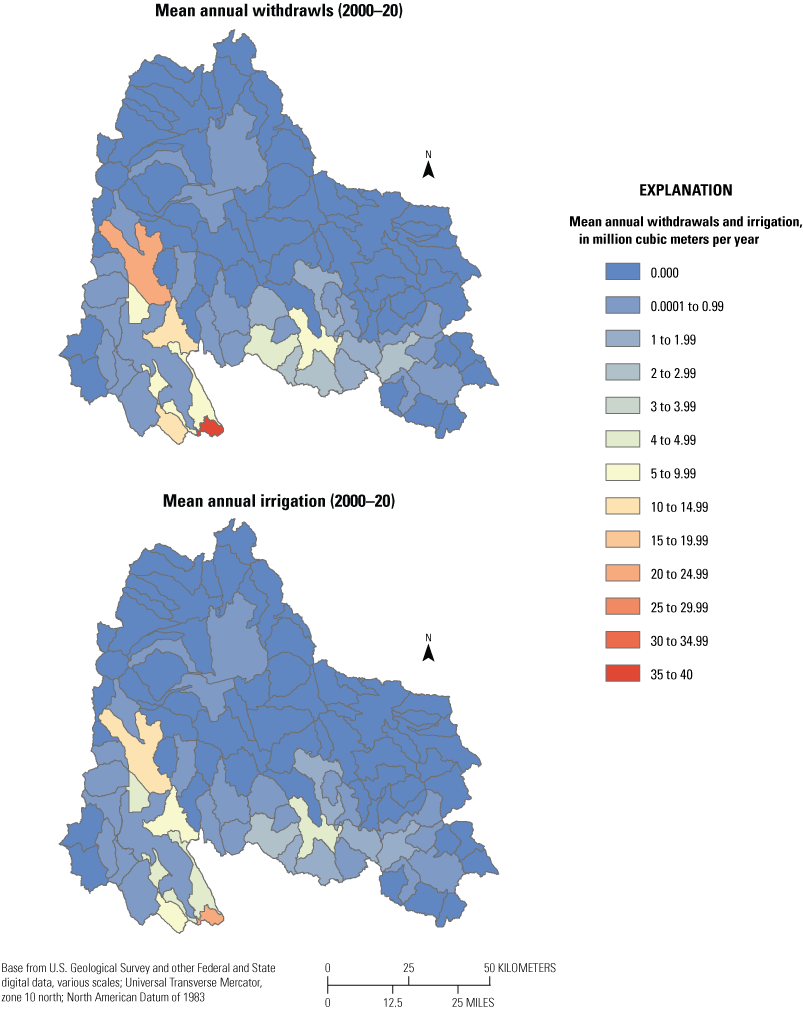
Mean annual withdrawals and irrigation in the Upper Klamath Basin 2000–20 (Martin and others, 2023).
Haynes and others (2023) estimated monthly crop withdrawals and efficiencies for all HUC12 drainage basins in the conterminous United States for 2000–20 (fig. 3). The withdrawals were calculated using modeled irrigation consumptive use, irrigation efficiencies, and source-water proportions. Irrigation efficiencies were calculated using irrigation system types and conveyances.
Brandt and others (2021) developed a nation-wide map of irrigated lands using remote-sensing techniques. The Geographic Information System geodatabase published in Brandt and others (2021) can be used for model training or validation for future water-use irrigation models. Periods varied between States but generally included some period during 2002–17.
Multiple researchers have attempted to assess public-water supply use in Oregon or for the conterminous United States. Luukkonen and others (2024) developed a national water-use model that includes a nationally consistent approach to estimating water use for communities that are serviced by public-supply water systems in the conterminous United States for 2002–20. Model data are output by HUC12 area.
The following studies complement direct water-use estimations by evaluating irrigation management, water-rights curtailments, and conservation strategies in the UKB. Although these estimates do not directly quantify total water-use volumes, they offer critical insights into the effects of water-management decisions. Cuenca and others (2013) used Landsat satellite data to evaluate the effects of irrigation management in the Wood River Valley during the 2004 growing season, during a time in which 4,674 ha of previously flood-irrigated pasture was managed as dryland pasture. Four Landsat scenes of the Wood River Valley were evaluated using an early version of the METRIC program (Allen and others, 2007). Results indicated a difficulty in resolving the latent heat flux in irrigated and unirrigated fields within 10- and 20-percent error, respectively. The authors estimated a volume of water conserved by the irrigation management of 6,527 acre-ft.
Velpuri and others (2020) used Landsat-based ET data obtained from the Operational Simplified Surface Energy Balance model (Senay and others, 2013), gridded precipitation data, and USGS streamgaging data to evaluate the effects of the water-right curtailment from 2013 to 2016 in the UKB. Analyses also were performed on base years 2004, 2006, and 2008–10, in addition to the curtailment years of 2013–16. Results indicated that curtailment had the greatest effect in 2013 and declined in subsequent years. Total on-field water savings were 0.060, 0.060, 0.044, and 0.032 km3 for 2013, 2014, 2015 and 2016, respectively.
Owens and others (2014) developed a physically based hydrologic model using MIKE SHE/MIKE 11 (Abbott and others, 1986a, b; Refsgaard, 1997) to evaluate the effects of two end-member scenarios to determine the limits of water-conservation strategies (basin-wide irrigation without any curtailment and no irrigation) between 2002 and 2009. Two intermediate scenarios also were simulated. Results indicated an additional 0.0740 km3 (60,000 acre-ft) of water would flow to Upper Klamath Lake in the no-irrigation scenario compared to the full-irrigation scenario.
Climate Projections and Nonstationarity
Numerous studies have evaluated future climate scenarios for the UKB and (or) evaluated trends and other forms of nonstationarity in basin hydroclimatic time series. The next section lists studies that were identified as relevant to future UKB water-budget considerations, either through direct modeling or analysis of the basin or through regional efforts. In addition, appendix table 2.6 provides a summary of climate and nonstationarity studies relevant to the Klamath Basin.
In 2010, the OWRD presented a poster that included the evaluation of trends in the UKB using an expanded monitoring network that was current at that time (La Marche and others, 2011). The OWRD detected lower than average precipitation levels in 8 of the 10 years before publication. Although precipitation returned to normal for a few years, base flows and groundwater levels were still declining. Below Upper Klamath Lake, the anthropogenic stresses were more evident on groundwater levels. Based on previous work, the authors also reported that an estimated 70 percent of gross annual streamflow into Upper Klamath Lake originates from groundwater discharge.
Van Kirk and Naman (2008) used a comparative-basin approach to estimate the relative contributions of climatic and non-climatic factors to recent declines in base flow in the Scott River, in the Klamath Basin (downstream from Upper Klamath Lake). The authors used permutation tests to compare 5 streams and 16 snow courses between historical and modern periods, which were defined by cool and wet phases of the PDO (respectively). Van Kirk and Naman (2008) estimated that about 39 percent of the decline is due to climatic factors, and the remaining 61 percent of the decline is due to local factors, such as increased irrigation.
Dettinger and others (2015) evaluated four western U.S. river systems, including the Klamath Basin, for future conditions, such as streamflow, SWE, and precipitation. The study is a distillation of other research findings and was used to illustrate specific conditions facing the region. Research highlighted by Dettinger and others (2015) suggests that in the future, the Klamath Basin will have a lower percentage of precipitation fall as snow and will have decreased summer streamflows.
Kennedy and others (2009) evaluated six large-scale climatic indices for their ability to explain interannual variation of major hydrologic inputs into Upper Klamath Lake. The six indices evaluated were the Pacific North American pattern, Southern Oscillation Index, PDO, Multivariate El Niño-Southern Oscillation Index, Niño 3.4, and a revised TNI. Of the indices analyzed, only the TNI exhibited statistically significant correlation during the warm phase of the PDO (the PDO was in the warm phase at the time of publication). The TNI for April to September was reported to be correlated with streamflow for April through September. This climatic signal was found throughout the region and not limited to Upper Klamath Lake.
Risley and others (2005) analyzed statistical approaches for seasonal flow forecasting in the UKB, incorporating long-term climate-trend variables to improve prediction accuracy. During this study, principal components regression, non-autoregressive artificial neural networks, and autoregressive artificial neural networks to forecast spring and summer streamflows for major hydrologic sites were evaluated, including in Upper Klamath Lake, Williamson River, and Sprague River. The inclusion of long-term climate indicators, such as SWE, precipitation trends, and interannual variability, resulted in mixed improvements in model accuracy, with reductions in forecasting error observed in some but not all cases. The persistence of groundwater contributions and antecedent climatic conditions also were examined, and regional groundwater effects may introduce multi-year lags in hydrologic response, which traditional forecasting models struggle to capture.
Stern and others (2022) tested the range of five gridded datasets typically used as a baseline for climate change impact studies against observations from 1,231 weather stations. Downscaled grids were used as inputs for a mechanistic hydrology model and assessed for spatial results of six hydrological variables across California and into the Klamath Basin of southern Oregon. The authors noted that the Klamath Mountains ecoregion (along with the Sierra Nevada ecoregion) had the highest variability in climate data, SWE, runoff, and recharge. The authors note that hydrologic studies of the Klamath Basin require thoughtful selection of gridded datasets used as inputs because of large interdataset spread and higher bias in precipitation and minimum temperature.
Mayer and Naman (2011) examined the streamflow response in 25 predominately unregulated basins to climatic perturbations in and around the Klamath Basin during the previous half century. The authors concluded that decreases in warm-weather base flow were substantially greater for groundwater-dominated basins compared to surface-water-dominated basins. The authors also concluded that net inflows to Upper Klamath Lake had decreased by 16 percent from 1961 to the time of publication (2011), with summer months displaying more decline than spring months.
Houston and others (2003) evaluated trends in historical water use in the western United States, including a case study in the UKB. The authors examined socioeconomic factors that affect water demand and identified past, current, and future surface-water withdrawals in Oregon, California, Idaho, and Washington. The authors also evaluated projected demands for nonconsumptive instream use. The authors note that general circulation models indicate that the UKB should receive more precipitation in future years, which may help alleviate conflicting water demands. However, increases in winter temperature would result in less precipitation falling as snow, potentially resulting in lower summer base flows.
Siegel (2009) evaluated trends in precipitation, temperature, and streamflow in the UKB. The author notes an increasing trend in temperature of about 1.0 degree Celsius per decade during the month of December. Other findings include that the drier eastern part of the UKB is warming faster than the west side, and streamflow has decreased in Upper Klamath Lake throughout spring, summer, and autumn.
Malevich and others (2013) reconstructed the hydroclimate of the UKB using tree-ring data. The authors reconstructed water-year precipitation for Klamath Falls, Oregon, extending from 1564 to 2004 and from 1000 to 2010 Common Era. The authors determined that the instrumented record (1896–2011) had included extreme droughts of moderate to long duration (6–20 years) but not short (1–3 years) or very long droughts (50 years), the latter of which were more severe in the 11th–13th century. The authors also detail the late-16th century “mega drought” that manifested in the region.
Kennedy and others (2024) evaluated historical changes of surface-water extent within the Klamath Marsh from 1985 to 2021. The authors processed Landsat imagery to create a time series of annual maximum surface-water extents. Their analysis revealed a 50-percent decrease in mean surface area of annual total open-water extent during the latter half of the study period, corresponding to an increase in dry land coverage. Kennedy and others (2024) identified statistically significant declines in regional groundwater levels and streamflow into the marsh. A statistically significant increase in annual mean temperature also was identified, indicating that climatic and hydrologic changes are contributing to the observed reduction in open-water extent.
Gannett and Breen (2015) performed a comprehensive assessment of groundwater levels, long-term trends, and their relation to pumping within Reclamation’s Klamath Project in Oregon and California. Historical groundwater level data was analyzed during the study, revealing declining groundwater levels in areas with concentrated pumping and seasonal fluctuations driven by irrigation demand. The authors highlighted the connectivity between surface water and groundwater, emphasizing that increased pumping can reduce streamflow contributions from groundwater discharge. Their findings underscore the importance of integrating groundwater management strategies with surface-water allocations to mitigate the effects of pumping on hydrologic sustainability in the Klamath Project area.
Upper Klamath Lake Water-budget Uncertainty—Insights on Data Needs
Uncertainty is inherent in hydrologic modeling and water-budget analyses, particularly for complex systems such as Upper Klamath Lake. Various water sources and sinks such as surface inflows, ET, groundwater, and agricultural use affect Upper Klamath Lake water levels. Accurately quantifying these components is essential for real-time water budgeting and forecasting but is complicated by the interdependencies among hydrologic processes and the limitations of existing data and models.
An uncertainty analysis for the major components of Upper Klamath Lake water budget was completed for this study. This effort was meant to serve as a preliminary analysis and was performed using estimated or easily obtainable water-budget values and associated uncertainties. Further analysis would be needed to develop recommendations for new data, tools, or models that should be collected or developed to reduce water budget and forecasting uncertainty. Such an analysis is beyond the scope of this study, but the preliminary analysis presented here may provide an initial framework for future efforts.
Each major Upper Klamath Lake water-budget component was evaluated for uncertainty. When feasible, water-budget component uncertainties were estimated from academic studies or reports. One of the key, early evaluations of uncertainty in lake water budgets was conducted by Winter (1981), who examined the reliability of various water-budget components, including precipitation, evaporation, surface-water inflows and outflows, and groundwater exchange. Though published several decades ago, this study remains an informative reference for understanding the limitations of traditional measurement techniques, such as precipitation gages, and how these uncertainties affect water-balance assessments.
Winter’s (Winter, 1981) synthesis of 23 lake water-balance studies indicated that error in individual components—precipitation, evaporation, streamflow, and groundwater—can individually exceed 10–30 percent, and that compounding these errors without explicit analysis can lead to residual terms that differ from actual values by more than 100 percent. Winter (1981) argued that unmeasured terms such as groundwater inflow are often inferred from residuals without accounting for accumulated uncertainty in measured inputs. This use of residuals to estimate groundwater has direct implications for Upper Klamath Lake, where groundwater and overland flow components are not routinely measured and must often be derived from closing the water balance. The study by Winter (1981) remains one of the most rigorous calls for incorporating error propagation and measurement design into water-balance studies and reinforces the need for transparency and redundancy in evaluating hydrologic uncertainties.
Primary water-budget component quantities from Hubbard (1970) were used for water-balance analysis in this study. Hubbard (1970) is the most comprehensive investigation into the Upper Klamath Lake hydrologic budget discovered in this study, although specific aspects of Reclamation’s forthcoming NFS may be considered more comprehensive when published (U.S. Bureau of Reclamation, 2024b). The USGS maintained 13 continuous streamgages between March 1965 and April 1966 (Miller and Tash, 1967), and Hubbard (1970) used these records and other data to develop an accounting of major water-budget components of Upper Klamath Lake (table 3). This study utilizes water-budget components from the analysis in Hubbard (1970) for this uncertainty evaluation, but the hydrologic and management conditions in the Klamath Basin have undergone substantial changes since the mid-1960s. These changes include increased water demands, wetland reconnection, changing climate conditions, and shifts in regulatory frameworks, which collectively affect the current dynamics of the water system (National Research Council, 2008). Consequently, although the data in Hubbard (1970) provides a valuable historical baseline, updated and comprehensive investigations are necessary to characterize contemporary conditions and to reduce uncertainty in water-budget analyses and forecasting.
Table 3.
Annual water inputs and outputs in Upper Klamath Lake.[Values for annual quantity are from Hubbard (1970). “Percentage of total outputs” represents the percentage contribution of individual water-budget components relative to gross outputs (surface outflow plus evapotranspiration [ET]). “Estimated measurement uncertainty” is the estimated uncertainty assigned to each water-budget component. “Estimated system uncertainty” represents the amount of uncertainty of a water-budget component on the full water budget and is calculated as “Percentage of all outputs” multiplied by “Estimated measurement uncertainty.” “Percentage of total system uncertainty” represents how much each component contributes to the total water-budget uncertainty and is calculated as “Estimated system uncertainty” divided by the sum of all “Estimated system uncertainties” that are inputs or ET. Abbreviations: km3, cubic kilometer; n/a, not applicable]
Although this study utilizes the analysis from Hubbard (1970) as a baseline for evaluating water-budget components, the uncertainty estimates presented here do not assume that the methods used in that study—such as pan evaporation for ET—must be relied upon exclusively. Instead, modern hydrologic techniques, including remote sensing, energy-balance modeling, and advanced statistical forecasting provide improved ways to quantify variability and uncertainty for each component of the water budget.
Inputs from Hubbard (1970) can be categorized as either surface water, precipitation, or groundwater (seeps and springs), whereas the outputs from Hubbard (1970) are primarily ET and surface-water outflows. Quantifying the uncertainty of each component allows for a systematic approach to assessing the overall uncertainty around real-time Upper Klamath Lake water budgeting. The third column of table 3 presents the annual percentage contribution of each budget component relative to total Upper Klamath Lake output. Total output was used as a denominator instead of total input because the former is a larger value, ensuring that the sum of input or output percentages does not exceed 100 percent. Because net change in Upper Klamath Lake storage accounts for only about 1 percent of the total water budget, using total input as the denominator would have resulted in nearly identical values.
Uncertainty for each water-budget component was evaluated in this study for water budgeting, short-term forecasting (defined as “less than one month”), and seasonal forecasting (1–6 months). Systemic real-time uncertainties were estimated because these are effectively the uncertainties around measurement error. No such systematic analysis was applied to forecasting uncertainties because of the added numerical complexities of time series forecasting errors (input data uncertainty), hydrologic interdependencies, model uncertainties (for example, model structure errors or parameterization uncertainty), process uncertainties, and other potential sources of uncertainties and errors.
Upper Klamath Lake Surface Water
Hubbard (1970) calculated surface-water inflow as 79 percent of net Upper Klamath Lake output, which represented the largest component of the Upper Klamath Lake water budget in 1967–69 (table 3). As of 2025, the major surface-water inflows are gaged. The Williamson River, which accounted for 62 percent of all surface-water inflow, is gaged near the mouth, farther upstream, and at multiple tributaries, including the Sprague River, Sycan River, and Spring Creek. The Wood River (20 percent of surface-water inflow into Upper Klamath Lake) also is gaged. Multiple canals are gaged, including Fourmile and Sevenmile Canals (table 3).
Real-time Water-budget Uncertainty
For real-time water budgeting, the uncertainty in the Williamson River streamflow was assigned a value of 6.5 percent. This level of uncertainty is probably an overestimate because streamflow measurements made at the Williamson River near the Chiloquin site (USGS station number 11502500) typically are rated by the hydrographers who make the measurements as either good (±5 percent) or fair (±8 percent; Turnipseed and Sauer, 2010; U.S. Geological Survey, 2024e). Even with this low level of uncertainty, the Williamson River represents one of the largest sources of uncertainty to the system (21 percent of total uncertainty, table 3), where total uncertainty is the sum of all Upper Klamath Lake inputs plus ET. Surface outflow was omitted from this summation to avoid double-counting because it is already represented in the net surface water flux and contributes symmetrically to both sides of the lake’s water balance.
The largest unmeasured surface-water inputs are the agricultural drainages (collectively, roughly 4 percent of Upper Klamath Lake outflow; table 3) and small ungaged creeks and canals. These drainages were measured by the Federal Water Pollution Control Administration in 1965–66 (Miller and Tash, 1967) but have been largely ungaged since. The agricultural drainage was given an uncertainty of 50 percent, representing the most uncertainty of any individual water-budget component. This uncertainty accounts for the lack of gaging of agricultural drainage and the high temporal variability around agricultural practices (for example, weather, crop prices, and so on). Because of this large level of uncertainty, agricultural drainage is estimated to contribute the fourth-largest amount of uncertainty to the system (13 percent of total uncertainty, table 3).
The smaller surface-water inputs are largely ungaged, except for a brief period for water years 1965–67 (Hubbard, 1970). The creeks (Rock, Fourmile, Varney, Moss, and Denny Creeks) were selectively given an uncertainty of 20 percent because of the lack of data. Despite this high level of uncertainty, these inputs contribute minimally (2 percent of total annual uncertainty) to the total system uncertainty because of their small quantity of annual input to Upper Klamath Lake. Reestablishing streamgages on these small creeks would not likely provide substantial improvements for forecasting or real-time water budgeting but could be used for other purposes, such as understanding habitat for fish or for calculating nutrient loading.
An uncertainty value of 15 percent was given to canal flows, which represents a combination of canals in which flow estimates are good or fair (5–8 percent uncertainty) and ungaged (unknown uncertainty). The canals represent 9 percent of Upper Klamath Lake outflow (table 3). It should be noted that the return flows for all canals listed in table 3 generally return to Upper Klamath Lake.
Not addressed in this analysis is the change in volume of Upper Klamath Lake. Although the net change in Upper Klamath Lake volume is typically a small percentage of the total annual water budget, short-term fluctuations can be substantial. Daily and sub-weekly variations in lake volume can result from changes in precipitation, inflows, outflows, and wind-driven seiching effects (Bartholow and others, 2005), all which introduce additional uncertainty in real-time and short-term water balance estimates. These rapid fluctuations highlight the need for high-resolution data in real-time forecasting and management decisions.
In addition to being variable, the change in storage term can introduce disproportionate uncertainty into daily or sub-weekly water balances, particularly when calculated as a residual. Real-time water budgets computed at a daily time step are often dominated by noise in the storage term, making it difficult to distinguish signal from measurement artifacts. In contrast, aggregating over periods of 2 weeks or longer tends to dampen this variability and improves interpretability of other flux terms, such as groundwater exchange and precipitation. For this reason, caution is advised when evaluating short-term residuals, and where possible, multi-week averaging is recommended for operational or research applications.
Upper Klamath Lake Short-term Forecasting
Improvements to short-term, surface-water input forecasting would be driven primarily through a combination of additional data inputs and improvements to forecasting techniques. Additional data improvements could include more and (or) better ground-based monitoring for precipitation, snowpack, groundwater, and soil moisture data. These additional data would in turn allow for improvements to gridded climate products derived through remote sensing. Additional streamflow data (spatial and temporal) also can be beneficial, primarily for model calibration. A more thorough accounting of the amount of current water use may also prove beneficial.
Upper Klamath Lake Seasonal Forecasting
Improvements to seasonal surface-water forecasting could be realized through advances detailed in the previous subsection (short-term forecasting) and improvements in long-term weather and climate forecasting. For example, improvements in forecasting could help assess how PDO and other climatic drivers affect streamflow patterns.
Precipitation
Hubbard (1970) calculated precipitation as 7 percent of net Upper Klamath Lake output, which represented the smallest component of the Upper Klamath Lake water budget in 1967–69 (table 3). Precipitation data used for hydrologic analyses are typically estimated by means of spatial interpolations and temporal averages between precipitation gages. Even when other approaches such as radar or remote sensing are used, these methods typically are calibrated using precipitation gages. Although temporal density is relatively easy to achieve, the lack of spatial density of precipitation gages can result in an under-representation of spatial variability (Weng and others, 2017; Paul and Buytaert, 2018). In addition, precipitation gage inaccuracy has been identified as a substantial source of precipitation bias, typically as underestimation (Segovia-Cardozo and others, 2021).
Real-time Water-budget Uncertainty
Precipitation gage analyses and comparisons commonly yield differences between gages and precipitation estimates that have been adjusted using calibration techniques (calibrated inputs) of 5–15 percent, although differences can be larger under specific conditions (Sevruk and others, 2009). Winter (1981) cited studies reporting that different interpolation methods can yield precipitation estimates differing from 9 to 18 percent. For this analysis, precipitation measurement uncertainty was set at 10 percent. The 10 percent uncertainty estimate assumes moderately accurate precipitation estimation techniques and that the flat topography of the lake results in less variation than would occur upstream from Upper Klamath Lake.
Between the low amount of precipitation input and the reasonable level of uncertainty prescribed, this results in precipitation data only accounting for 5 percent of total uncertainty for real-time Upper Klamath Lake water budgeting. However, uncertainty is presumed to be higher in upstream areas because they have more topographic variability and lower precipitation gage density covering a larger area (fig. 1). Although upstream precipitation has little effect on real-time water budgeting, its variability becomes more critical in short-term and seasonal forecasting efforts (sections “Precipitation Short-term Forecasting” and “Precipitation Seasonal Forecasting”).
Precipitation Short-term Forecasting
Precipitation forecasts over short timeframes are generally more reliable than seasonal forecasts, particularly for common and (or) major storm events. However, the accuracy of short-term forecasts can still be limited by topographic effects and the transitional nature of rain-snow events in the basin. Improvements in numerical weather prediction and radar data integration may enhance near-term forecasting.
Precipitation Seasonal Forecasting
Although Upper Klamath Lake-area direct precipitation measurements are presumed to be adequate, there is more uncertainty around forecasting precipitation rates. In addition, because precipitation as both rain and snow is a major component of Upper Klamath Lake hydrologic modeling and a driver of streamflow, its importance for forecasting is presumed to be substantially greater than for real-time water budgeting.
Open-water Evaporation and Evapotranspiration
Hubbard (1970) calculated ET as 16 percent of net Upper Klamath Lake output, which represented the second-largest component of the Upper Klamath Lake water budget in 1967–69 (table 3). Open-water evaporation can be estimated using physically based modeling approaches that account for radiative and aerodynamic principles, water depth, heat storage, and fetch effects (Huntington and others, 2025). Real-time or forecasted ET values can be estimated using a variety of methods, including (1) empirical methods (for example, Penman-Monteith Method [Monteith, 1965]) and Hargreaves Method [Hargreaves and Samani, 1985]), energy-balance models (for example, METRIC [Allen and others, 2007] and geeSEBAL [Bastiaanssen and others, 1998]); (2) remote sensing methods (for example, Normalized Difference Vegetation Index [Maselli and others, 2020]), Landsat-based methods such as METRIC; (3) mass transfer methods (for example, Mass Transfer Equation or other methods that use Dalton’s Law [Dalton, 1802]); (4) soil moisture balance methods (for example, using lysimeters to estimate soil moisture); and (5) direct measurements (for example, eddy covariance [Baldocchi and others, 1988], lysimeters) or any combination thereof. The accuracy of ET measurements varies between methods and different landscape types (for example, open-water, agricultural fields, forests).
Real-time Water-budget Uncertainty
Prescribing a precise level of ET measurement uncertainty for Upper Klamath Lake is challenging because of the heterogeneous landscapes, evolving measurement techniques, and recent landscape modifications. Although Hubbard’s (Hubbard, 1970) ET estimates were derived from pan evaporation tests and are not designed for real-time water budgeting, modern approaches, such as energy balance and remote sensing methods, provide improved ET estimates and can be used for real-time calculations. Additionally, ET in Upper Klamath Lake has changed over time because of the disconnection and reconnection of adjacent areas, such as Agency-Barnes, which was disconnected in 1962 but reconnected in 2025 as part of the Agency-Barnes wetland restoration project (Smith, 2025), which resulted in altered evaporation and transpiration patterns.
Ezenne and others (2023) suggest that ground-based techniques for measuring ET typically have uncertainties ranging from 10 to 30 percent. For Oregon, Huntington and others (2025) determined that uncertainty for monthly ET estimates is 10–20 percent, approaching field-based in situ methods. Approaches such as METRIC have been reported to be within 5–10 percent of field values for well-calibrated fields in arid and semi-arid regions (Allen and others, 2007). Therefore, an uncertainty value of 20 percent was assigned to ET estimates, representing the median value of Ezenne and others (2023) range. Uncertainty from ET represents 3.1 percent of the estimated system uncertainty or 21 percent of the total uncertainty in the Upper Klamath Lake water budget (table 3).
Around 76 percent of the UKB is classified as “forest” and “shrub lands” (fig. 1). Estimating forest ET is considered more difficult than open-water ET because of issues with the complexity of the canopy structure (Brenner and Incoll, 1997), heterogeneous surface conditions (Xu and others, 2017), seasonal dynamics (Derardja and others, 2024), remote sensing issues (Li and others, 2024), and soil moisture and root zone complexities (Sahaar and Niemann, 2024). Li and others (2024) estimated ET uncertainty in forested areas to range from 15 to 30 percent. ET usage varies across forested areas and other land uses in Upper Klamath Lake (agricultural areas, wetlands and open water). In addition, forest ET is not directly part of the Upper Klamath Lake water budget because this water does not reach the lake. Consequently, the addition of forest ET modeling capabilities will not directly improve real-time Upper Klamath Lake water-budget accounting. Instead, improved forest ET estimates could help in forecasting by influencing surface and groundwater inputs into Upper Klamath Lake.
Open-water Evaporation and Evapotranspiration Short-term Forecasting
Increases to accuracies of ET forecasts primarily rely on increasing the temporal and spatial resolution of ET model inputs. Short-term ET forecasting depends on weather forecasts (for example, temperature, solar radiation, wind speed). As weather models become increasingly accurate through additional data and enhanced methodologies, accuracy of ET forecasting also will increase.
Accuracy of short-term ET forecasts also can increase because of improved characterization of antecedent land surface and vegetation conditions, including soil moisture, crop and canopy phenology, and snow cover. Incorporating remote-sensing products into forecasting frameworks may increase the responsiveness of ET models to rapidly changing environmental conditions. In addition, ensemble-based modeling approaches, which propagate uncertainty from weather inputs through to ET outputs, can support more probabilistic and adaptive decision-making. These increases in accuracy are particularly relevant for transitional periods (for example, spring melt or the onset of drought), when short-term deviations from climatology can significantly affect available water supplies in the UKB.
Open-water Evaporation and Evapotranspiration Seasonal Forecasting
Seasonal forecasting is predicated on similar inputs but also more medium-term climate models that consider climate periodicities (for example, El Niño-Southern Oscillation and PDO) and other climate forcings (for example, wildfires). Seasonal ET models may also consider agricultural systems, which would inform Upper Klamath Lake water budgeting where irrigation withdrawals or curtailments occur in drainage basins of the Wood River, Williamson River, and other creeks upstream from the lake, as well as for refining estimates of Upper Klamath Lake deliveries needed in the Klamath Project and for downstream needs.
Groundwater
Hubbard (1970) calculated groundwater inflow from seeps and springs as 14 percent of net Upper Klamath Lake output, although groundwater levels also affect streamflow inputs to Upper Klamath Lake as base flow (Gannett and others, 2007; La Marche and others, 2011). Groundwater (seeps and springs) represented the third-largest component of the Upper Klamath Lake water budget in 1967–69 (table 3). The inputs of groundwater seeps and springs were estimated by Hubbard (1970) using the residuals from the remaining water-budget components, including changes in lake storage. Consequently, the uncertainty in the groundwater inputs is a function of all other budget components. The two major categories for reducing uncertainty in the groundwater budget would be to (1) reduce uncertainty in other water-budget components or (2) introduce methods for directly measuring or estimating groundwater inputs.
Real-time Water-budget Uncertainty
Because of this indirect method of quantification, uncertainty for groundwater inputs could not be estimated directly using the literature search process used for other Upper Klamath Lake water-budget components. Because of this approach, groundwater input uncertainty was set at a conservative 25 percent. This uncertainty was chosen to represent the possibility that the uncertainty of other budget components could result in a compounding of error for the groundwater estimate.
The uncertainty of groundwater springs and seeps represents 23 percent of the total water-budget uncertainty, which is close to the other two largest contributors (Williamson River and ET, both at 21 percent). Because this component of the water budget is represented as a residual to all other components, the main ways to improve this uncertainty are either reducing the uncertainty of all other budget components or incorporating a new technique and (or) technology to estimate real-time seep and spring contributions (Levin and others, 2023).
Groundwater Short-term Forecasting
Groundwater levels can be an important component for estimating base flow, which is an important component of stream forecasting. It was beyond the scope of this work to evaluate how an enhanced groundwater monitoring network (more spatial resolution) or more real-time groundwater data might improve forecasting; however, more real-time groundwater data may assist with short-term forecasting because USGS and OWRD groundwater well data typically are updated quarterly.
Groundwater Seasonal Forecasting
Groundwater levels typically follow seasonal patterns but also are affected by anthropogenic depletion. An analysis of trends and other forms of nonstationarity may result in improved groundwater forecasting. Other potential methods for improvement include improved groundwater models, a greater understanding and incorporation of land use and water-management practices, and the use of remote sensing data (Adams and others, 2022).
Water Use
Although municipal and industrial water use typically is gaged because of regulatory requirements, agricultural water use is less consistently monitored (Dieter and others, 2018; Painter and others, 2021a). Large-scale irrigation diversions, such as those managed by the Klamath Irrigation District and other smaller districts within the UKB, are often gaged. In contrast, smaller individual farm withdrawals, whether through surface water diversions or groundwater pumping, are often not consistently measured, contributing to uncertainties in total water use. Some groundwater wells are metered, although unpermitted or unreported wells are sources of uncertainty.
Real-time Water-budget Uncertainty
Water use is not directly incorporated into the real-time Upper Klamath Lake water budget. However, water use is indirectly accounted for through agricultural drainage and canal outputs that contribute to surface-water inflows and managed outflows, including irrigation deliveries to the Klamath Project, which diverts water from Upper Klamath Lake to irrigated lands downstream. The effect of improved water-use data on real-time budgeting is complex. Although water use is partially represented in streamflow data indirectly through springs and seeps, directly measuring water withdrawals, especially for agricultural uses, could provide a clearer picture of real-time water dynamics. As groundwater pumping increases, base-flow contributions from aquifers and spring discharge tend to decrease due to lower hydraulic gradients, reducing inflows to surface waters. Conversely, reducing groundwater withdrawals can lead to increased base flow and spring contributions. In contrast, surface-water withdrawals may partially offset groundwater use by increasing infiltration or seepage but simultaneously reduce surface-water availability, affecting overall hydrologic conditions in the UKB.
Some diversion gages operated by irrigation districts may have outdated relations between stage and flow. This outcome can arise from scour or fill at the diversion gaging locations. Confirming and (or) updating these stage-flow relations could result in more accurate diversion estimates.
Water Use Short-term Forecasting
Improvements in forecasting water use could improve Upper Klamath Lake water-level forecasting considerably. Hess and Stonewall (2014) and Wood (2020) determined that the curtailment of surface-water diversion during low-flow conditions resulted in substantial increases in flow to Upper Klamath Lake tributaries, demonstrating the connection between water use and Upper Klamath Lake water levels. Moreover, improvements in the ability to quantify water use in the UKB are often associated with better estimates of ET, which is a major component of the basin's water budget (Ott and others, 2024).
Potential avenues for improved water-use forecasting for inflows to Upper Klamath Lake include improved modeling and demand forecasting, expanding the groundwater observation well network and incorporating it into predictive tools, expanded use of remote sensing, integration of ecosystems needs, and the adaptation of ensemble forecasting.
Considerations for Future Research
This preliminary uncertainty analysis of the Upper Klamath Lake water budget highlights several areas where additional data collection and model refinement could substantially reduce uncertainty and improve real-time water budgeting and forecasting. Expanding the monitoring network to include more comprehensive measurements of agricultural drainage and developing an improved understanding of groundwater inflows could reduce uncertainties because these components currently contribute substantial uncertainty due to little direct data (table 3). Additionally, reestablishing streamgages on smaller tributaries and under-monitored canals could enhance the precision of surface-water inflow estimates, though the overall effect on total system uncertainty of these two sources, especially the smaller tributaries, may be limited.
General recommendations to increase the accuracies of short-term and seasonal forecasting include the integration of enhanced precipitation, snowpack, and soil-moisture data into forecasting models. Advances in remote sensing and radar technologies may provide a pathway for better capturing spatial variability in precipitation and ET, particularly in areas with sparse gage density. Moreover, improved climate forecasting techniques—incorporating factors such as PDO and other large-scale climatic drivers—could increase the accuracy of short-term and seasonal forecasts.
Summary and Conclusions
Water is a critical resource in the Upper Klamath Basin (UKB), primarily for ecosystems and agricultural uses. Dry years result in insufficient water allocation for competing water demands. Upper Klamath Lake water managers need better predictive tools that reduce uncertainty in lake elevation forecasts to make more informed water-management decisions directed at Klamath Project water deliveries and flows in the Klamath River for salmon (especially Southern Oregon/Northern California Coast coho salmon [Oncorhynchus kisutch] and water in Upper Klamath Lake for suckers (Lost River sucker [Deltistes luxatus] and shortnose sucker [Chasmistes brevirostris]).
The U.S. Geological Survey (USGS) began a Regional Integrated Water Availability Assessment of the Klamath Basin in 2022 to evaluate potential drivers of water availability. This assessment includes identifying relevant risks to water availability and the evaluation of regional water supply and demand. As part of that effort, this manuscript attempts to catalog available data, tools, and models associated with the UKB and surrounding area. This manuscript details the state of science for the UKB as of 2025 by evaluating resources available to estimate surface water (streamflow), precipitation, evapotranspiration (ET), groundwater, and anthropogenic water use. The study also included an uncertainty analysis that highlighted data limitations within certain water-budget components, emphasizing the need for enhanced monitoring and model refinement to improve predictive accuracy across water-management decisions.
Surface water typically accounts for around 86 percent of annual input into Upper Klamath Lake, primarily as streamflow (and 79 percent of all outputs, which includes ET). The major streamflow inputs into Upper Klamath Lake such as the Williamson and Wood Rivers are monitored using gaging stations. Around 38 streams or canals are actively gaged (as of 2025), providing a reasonable estimate of real-time surface-water input into Upper Klamath Lake. Many smaller streams remain ungaged. Seven streamgages with at least 40 years of record are particularly important because they provide a historical record of flow variation over time.
Hydrologic modeling efforts of streamflow have primarily been performed using the Precipitation-Runoff Modeling System (PRMS) tool. Other hydrologic modeling efforts include attempts to quantify the effects of water-right curtailment, a coupled Soil and Water Assessment Tool-Modular Finite-Difference Ground-Water Flow Model (SWAT-MODFLOW) and various statistical models or model improvements.
Precipitation in the UKB occurs as both rain and snow, with high spatial variability resulting from geographic conditions. Precipitation patterns are affected by large-scale climate features such as the Trans-Niño Index and the Pacific Decadal Oscillation. There are 12 automated Snow Telemetry Network (SNOTEL) sites and 28 National Oceanic and Atmospheric Administration (NOAA) weather stations with precipitation data that are active in and around the UKB. However, the UKB has little SNOTEL coverage at high and low elevations, which may affect hydrologic modeling accuracy. In addition to meteorological stations, estimated precipitation data are available through gridded, high-resolution hydro-climate datasets that incorporate ground-based observations, satellite imagery, and reanalysis products. These datasets vary in spatial and temporal resolution, accessibility, and latency, which affect hydrologic data analysis and modeling. Precipitation modeling efforts include the NOAA National Operational Hydrologic Remote Sensing Center (NOHRSC) Snow Model and PRMS.
ET represents a substantial component of the Upper Klamath Lake water budget but also is a component that can be difficult to quantify. ET is difficult to measure directly and is often estimated or inferred through indirect measurements, such as remote-sensing imagery. ET data and estimates are available through the cooperative Agricultural Weather Network (AgriMet), including the Klamath Falls station, which has been continuously operational since 1999. Other estimates of historical ET and actual evapotranspiration (Eta) have been developed using remote sensing and modeling approaches from various sources and studies.
Several models have attempted to quantify ET or specific elements of ET, such as open-water ET or marsh ET. These models often are developed using pan-evaporation methods, water-balance equations, eddy covariance data, energy balance models, and (or) other techniques and methods to estimate ET. In recent years, many efforts to quantify ET are focused on remote sensing. Efforts of note include Open ET and the natural flow model under development from U.S. Bureau of Reclamation (Reclamation).
Estimates of groundwater flowing directly into the lake typically account for around 14 percent of all inputs into Upper Klamath Lake but is more difficult to quantify than surface water. Groundwater also is a major component of surface-water inputs, such as in the Williamson River and Wood River, especially during the low-flow season. The UKB groundwater system responds to external stresses, such as drought, pumping, variations in lake stage, and canal operations. At the time of writing (2025), there is no evidence of groundwater flow entering the UKB from neighboring basins, although some groundwater may flow into the Tule Lake subbasin and continue south toward the Pit River Basin. Real-time and historical groundwater data are available through the USGS Upper Klamath Basin Well Mapper, which includes data from the USGS, Oregon Water Resources Department (OWRD), and the California Department of Water Resources. Prominent groundwater modeling efforts include MODFLOW models by the USGS and Reclamation.
Water use, including irrigation, also is an important component of the UKB water budget. Water is withdrawn from surface water and groundwater sources and can affect lake levels directly or indirectly. Water-rights data for the UKB are available through the OWRD “Frequently Used Mapping Tools” page. Not all water right allocations are used to the full extent allowable, and the quantity of water used for a typical water right is not routinely monitored. Consequently, water use often is estimated using indirect methods. Estimates of water use and (or) irrigation status are available through IrrMapper, OpenET, and various USGS publications (https://www.sciencebase.gov/catalog/item/603fbeacd34eb12031185f37). OWRD developed water-use estimates with support from the USGS Water-Use Data and Research Program.
Efforts to model water use are typically completed at national or regional scales, with outputs at smaller scales. Most water-use modeling uses satellite or other remote sensing data or is performed using physically based models. In addition, water-use data are compiled and estimated by the USGS every 5 years.
Numerous studies have investigated nonstationarity and (or) the effects of climate projections on UKB time series. Common findings among these studies include declines in base flows, increased human water use, including groundwater pumping, reduced snowpack, and rising air temperatures.
The forthcoming Reclamation Revised Klamath River Basin Natural Flow Study (NFS) is expected to be an important study for increasing accuracies of Upper Klamath Lake water forecasting. By integrating multiple modeling approaches to estimate predevelopment streamflows and refine hydrologic budget components, the NFS will provide a comprehensive assessment of natural water availability in the basin. Given its scope and methodological advancements, this study will likely serve as a key reference for Upper Klamath Lake forecasters, offering critical insights into long-term water-balance dynamics, regulatory planning, and adaptive management strategies.
This manuscript is meant to inform researchers and water managers working in the UKB. Subsequent research could focus on quantifying the effects of data gaps or developing additional tools that can be used in lake elevation forecasting. This review identifies key data gaps and limitations in existing tools and highlights targeted areas where enhanced monitoring and refined modeling could substantially improve water-resource assessments, directly supporting adaptive management strategies and more sustainable decision-making in the UKB.
References Cited
Abatzoglou, J.T., 2013, Development of gridded surface meteorological data for ecological applications and modelling: International Journal of Climatology, v. 33, no. 1, p. 121–131, accessed September 25, 2024, at https://doi.org/10.1002/joc.3413.
Abbott, M.B., Bathurst, J.C., Cunge, J.A., O’Connell, P.E., and Rasmussen, J., 1986a, An introduction to the European Hydrological System—Systeme Hydrologique Europeen, “SHE”, 1—History and philosophy of a physically-based, distributed modelling system: Journal of Hydrology, v. 87, nos. 1–2, p. 45–59. [Available at https://doi.org/10.1016/0022-1694(86)90114-9.]
Abbott, M.B., Bathurst, J.C., Cunge, J.A., O’Connell, P.E., and Rasmussen, J., 1986b, An introduction to the European Hydrological System—Systeme Hydrologique Europeen, “SHE”, 2—Structure of a physically-based, distributed modelling system: Journal of Hydrology, v. 87, nos. 1–2, p. 61–77. [Available at https://doi.org/10.1016/0022-1694(86)90115-0.]
Adams, K.H., Reager, J.T., Rosen, P., Wiese, D.N., Farr, T.G., Rao, S., Haines, B.J., Argus, D.F., Liu, Z., Smith, R., Famiglietti, J.S., and Rodell, M., 2022, Remote sensing of groundwater—Current capabilities and future directions: Water Resources Research, v. 58, no. 10, 27 p., accessed February 11, 2025, at https://doi.org/10.1029/2022WR032219.
Allen, R., Irmak, A., Trezza, R., Hendrickx, J.M.H., Bastiaanssen, W., and Kjaersgaard, J., 2011, Satellite-based ET estimation in agriculture using SEBAL and METRIC: Hydrological Processes, v. 25, no. 26, p. 4011–4027, accessed July 29, 2024, at https://doi.org/10.1002/hyp.8408.
Allen, R.G., Tasumi, M., and Trezza, R., 2007, Satellite-based energy balance for mapping evapotranspiration with internalized calibration (METRIC)—Model: Journal of Irrigation and Drainage Engineering, v. 133, no. 4, p. 380–394, accessed July 29, 2024, at https://doi.org/10.1061/(ASCE)0733-9437(2007)133:4(380).
Allen, R.G., Walter, I.A., Elliott, R.L., Howell, T.A., Itenfisu, D., Jensen, M.E., and Snyder, R.L, 2005, The ASCE Standardized Reference Evapotranspiration Equation: Reston, Va., American Society of Civil Engineers, 59 p., accessed September 17, 2025, at https://doi.org/10.1061/9780784408056.
Anderson, C.W., and Wise, D.R., 2024, Input and output data for the Precipitation-Runoff Modeling System (PRMS) used to predict seasonal water availability during 2000–2015 in the Upper Klamath River Basin, Oregon and California: U.S. Geological Survey data release, accessed October 23, 2024, at https://doi.org/10.5066/P9P6IY21.
Anderson, M., Gao, F., Knipper, K., Hain, C., Dulaney, W., Baldocchi, D., Eichelmann, E., Hemes, K., Yang, Y., Medellin-Azuara, J., and Kustas, W., 2018, Field-scale assessment of land and water use change over the California Delta using remote sensing: Remote Sensing, v. 10, no. 6, 28 p., accessed July 29, 2024, at https://doi.org/10.3390/rs10060889.
Anderson, M.C., Norman, J.M., Mecikalski, J.R., Otkin, J.A., and Kustas, W.P., 2007, A climatological study of evapotranspiration and moisture stress across the continental United States based on thermal remote sensing—1. Model formulation: Journal of Geophysical Research—Atmospheres, v. 112, no. D10, 17 p., accessed July 29, 2024, at https://doi.org/10.1029/2006JD007506.
Bailey, R.T., Wible, T.C., Arabi, M., Records, R.M., and Ditty, J., 2016, Assessing regional-scale spatio-temporal patterns of groundwater-surface water interactions using a coupled SWAT-MODFLOW model: Hydrological Processes, v. 30, no. 23, p. 4420–4433, accessed July 26, 2024, at https://doi.org/10.1002/hyp.10933.
Bakke, P.D., Thomas, R., and Parrett, C., 1999, Estimation of long-term discharge statistics by regional adjustment: Journal of the American Water Resources Association, v. 35, no. 4, p. 911–921, accessed July 26, 2024, at https://doi.org/10.1111/j.1752-1688.1999.tb04184.x.
Baldocchi, D.D., Hincks, B.B., and Meyers, T.P., 1988, Measuring biosphere-atmosphere exchanges of biologically related gases with micrometeorological methods: Ecology, v. 69, no. 5, p. 1331–1340. [Available at https://doi.org/10.2307/1941631.]
Bartholow, J.M., Heasley, J., Hanna, B., Sandelin, J., Flug, M., Campbell, S., Henriksen, J., and Douglas, A., 2005, Evaluating water management strategies with the Systems Impact Assessment Model—SIAM version 4: U.S. Geological Survey Open-File Report 2003–82, 122 p., accessed February 26, 2025, at https://doi.org/10.3133/ofr0382.
Bastiaanssen, W.G.M., Menenti, M., Feddes, R.A., and Holtslag, A.A.M., 1998, A remote sensing surface energy balance algorithm for land (SEBAL)—1, Formulation: Journal of Hydrology, v. 212–213, p. 198–212, accessed July 29, 2024, at https://doi.org/10.1016/S0022-1694(98)00253-4.
Belchik, M., Hillemeier, D., and Pierce, R.M., 2004, The Klamath River fish kill of 2002—Analysis of contributing factors: Yurok Tribal Fisheries Program PCFFA-155, 42 p., accessed October 24, 2024, at https://brucerettig.com/wp-content/uploads/2019/06/pcffa_155.pdf.
Bidlake, W.R., 2000, Evapotranspiration from a Bulrush-dominated wetland in the Klamath Basin, Oregon: Journal of the American Water Resources Association, v. 36, no. 6, p. 1309–1320, accessed July 29, 2024, at https://doi.org/10.1111/j.1752-1688.2000.tb05728.x.
Bidlake, W.R., 2002, Evapotranspiration from selected fallowed agricultural fields on the Tule Lake National Wildlife Refuge, California, during May to October 2000: U.S. Geological Survey Water-Resources Investigations Report 2002–4055, 59 p., accessed July 29, 2024, at https://doi.org/10.3133/wri024055.
Boyce, S.E., Hanson, R.T., Ferguson, I., Schmid, W., Henson, W.R., Reimann, T., Mehl, S.W., and Earll, M.M., 2020, One-water hydrologic flow model—A MODFLOW based conjunctive-use simulation software: U.S. Geological Survey Techniques and Methods, book 6, chap. A60, 435 p. [Available at https://doi.org/10.3133/tm6A60.]
Brandt, J.T., Caldwell, R.R., Haynes, J.V., Painter, J.A., and Read, A.L., 2021, Verified irrigated agricultural lands for the United States, 2002–17: U.S. Geological Survey data release, accessed September 26, 2024, at https://doi.org/10.5066/P9NAWU1U.
Brenner, A.J., and Incoll, L.D., 1997, The effect of clumping and stomatal response on evaporation from sparsely vegetated shrublands: Agricultural and Forest Meteorology, v. 84, nos. 3–4, p. 187–205, accessed October 8, 2024, at https://doi.org/10.1016/S0168-1923(96)02368-4.
Bromley, M., Minor, B.A., Russell, C.E., Huntington, J.L., and Carrara, K.O., 2023, Remote sensing of evapotranspiration at the Nevada Environmental Response Trust Site and nearby properties: Desert Research Institute publication no. 41296, 27 p., accessed May 12, 2026, at https://www.dri.edu/publication/15090/.
Broxton, P., Zeng, X., and Dawson, N., 2018, Daily 4 km gridded SWE and snow depth from assimilated in-situ and modeled data over the conterminous U.S., version 1 user guide: National Snow and Ice Data Center Distributed Active Archive Center, accessed July 26, 2024, at https://nsidc.org/data/nsidc-0719/versions/1.
Bureau of Reclamation, 2016, Klamath River Basin study: Bureau of Reclamation Technical Memorandum 86-68210-2016-06, 324 p., accessed October 24, 2024, at https://www.usbr.gov/watersmart/bsp/docs/klamath/fullreport.pdf.
California Nevada River Forecast Center, 2025, California Nevada River Forecast Center: California Nevada River Forecast Center web page, accessed February 7, 2025, at https://www.cnrfc.noaa.gov/ensembleProduct.php?id=KLAO3&prodID=9.
California Public Utilities Commission, 2024, CPUC Approves transfer of four dams from Pacific Power to Klamath River renewal corporation: California Public Utilities Commission web page, accessed October 23, 2024, at https://www.cpuc.ca.gov/news-and-updates/all-news/cpuc-approves-transfer-of-four-dams-from-pacific-power-to-klamath-river-renewal-corporation.
Carroll, T., Cline, D., Olheiser, C., Rost, A., Nilsson, A., Fall, G., Bovitz, C., and Li, L., 2006, NOAA’s national snow analyses, in Proceedings of the 74th annual meeting of the western snow conference: National Operational Hydrologic Remote Sensing Center, National Weather Service, NOAA, 14 p., accessed September 17, 2025, at https://www.nohrsc.noaa.gov/technology/pdf/WSC_2006.pdf.
Chiodi, A.M., Bond, N.A., Larkin, N.K., and Barbour, R.J., 2016, Summertime rainfall events in eastern Washington and Oregon: American Meteorological Society, v. 31, no. 5, p. 1465–1480, accessed July 26, 2024, at https://doi.org/10.1175/WAF-D-16-0024.1.
Cooper, R.M., 2002, Determining surface water availability in Oregon: State of Oregon Water Resources Department Open File Report SW 02-002, 158 p., accessed February 26, 2025, at https://www.oregon.gov/owrd/WRDPublications1/DeterminingSurfaceWaterAvailabilityInOregon.pdf.
Cooper, R.M., 2004, Natural flow estimates for streams in the Klamath Basin: State of Oregon Water Resources Department Open File Report SW 04-001, 233 p., accessed February 3, 2025, at https://www.oregon.gov/owrd/wrdreports/Open_File_SW_04_-_001.pdf.
Corson-Dosch, N., 2020a, Benthic vertical hydraulic gradients in Upper Klamath Lake, Oregon, 2017: U.S. Geological Survey Scientific Investigations Report 2020–5029, 22 p., accessed July 29, 2024, at https://doi.org/10.3133/sir20205029.
Corson-Dosch, N.T., 2020b, Depth-to-water data and calculated vertical hydraulic gradient at the sediment-water interface in Upper Klamath Lake, Oregon, 2017: U.S. Geological Survey data release, accessed July 29, 2024, at https://doi.org/10.5066/F7668CGD.
Cuenca, R.H., Ciotti, S.P., and Hagimoto, Y., 2013, Application of landsat to evaluate effects of irrigation forbearance: Remote Sensing, v. 5, no. 8, p. 3776–3802, accessed July 29, 2024, at https://doi.org/10.3390/rs5083776.
Dalton, J., 1802, Experimental essays, on the constitution of mixed gases; on the force of steam or vapour from water and other liquids in different temperatures, both in a Torricellian vacuum and in air; on evaporation; and on the expansion of elastic fluids by heat: Memoirs of the Literary and Philosophical Society of Manchester, v. 5, no. 2, p. 535–602. [Available at https://www.biodiversitylibrary.org/part/308525.]
Derardja, B., Khadra, R., Abdelmoneim, A.A.A., El-Shirbeny, M.A., Valsamidis, T., De Pasquale, V., Deflorio, A.M., and Volden, E., 2024, Advancements in remote sensing for evapotranspiration estimation—A comprehensive review of temperature-based models: Remote Sensing, v. 16, no. 11, 26 p., accessed October 8, 2024, at https://doi.org/10.3390/rs16111927.
Desert Research Institute and Bureau of Reclamation, 2024, Upper Klamath Lake evaporation study—Eddy covariance and hydrometeorological data website: Desert Research Institute and Bureau of Reclamation web page, accessed April 17, 2025, at https://klamath.dri.edu/user/login.
Dettinger, M., Udall, B., and Georgakakos, A., 2015, Western water and climate change: Ecological Applications, v. 25, no. 8, p. 2069–2093, accessed July 26, 2024, at https://doi.org/10.1890/15-0938.1.
Dieter, C.A., Maupin, M.A., Caldwell, R.R., Harris, M.A., Ivahnenko, T.I., Lovelace, J.K., Barber, N.L., and Linsey, K.S., 2018, Estimated use of water in the United States in 2015: U.S. Geological Survey Circular 1441, 65 p., accessed September 25, 2024, at https://doi.org/10.3133/cir1441.
East, A.E., and Grant, G.E., 2023, A watershed moment for western U.S. dams: Water Resources Research, v. 59, no. 10, 9 p., accessed March 4, 2025, at https://doi.org/10.1029/2023WR035646.
Essaid, H.I., Kuwabara, J.S., Corson-Dosch, N.T., Carter, J.L., and Topping, B.R., 2021, Evaluating the dynamics of groundwater, lakebed transport, nutrient inflow and algal blooms in Upper Klamath Lake, Oregon, USA: Science of the Total Environment, v. 765, accessed February 7, 2025, at https://doi.org/10.1016/j.scitotenv.2020.142768.
Ezenne, G.I., Eyibio, N.U., Tanner, J.L., Asoiro, F.U., and Obalum, S.E., 2023, An overview of uncertainties in evapotranspiration estimation techniques: Journal of Agrometeorology, v. 25, no. 1, p. 173–182, accessed October 8, 2024, at https://doi.org/10.54386/jam.v25i1.2014.
Fisher, J.B., Tu, K.P., and Baldocchi, D.D., 2008, Global estimates of the land–atmosphere water flux based on monthly AVHRR and ISLSCP-II data, validated at 16 FLUXNET sites: Remote Sensing of Environment, v. 112, no. 3, p. 901–919, accessed July 29, 2024, at https://doi.org/10.1016/j.rse.2007.06.025.
Fleming, S.W., Garen, D.C., Goodbody, A.G., McCarthy, C.S., and Landers, L.C., 2021, Assessing the new Natural Resources Conservation Service water supply forecast model for the American West—A challenging test of explainable, automated, ensemble artificial intelligence: Journal of Hydrology, v. 602, 64 p., accessed April 11, 2025, at https://doi.org/10.1016/j.jhydrol.2021.126782.
Gannett, M.W., and Breen, K.H., 2015, Groundwater levels, trends, and relations to pumping in the Bureau of Reclamation Klamath Project, Oregon and California: U.S. Geological Survey Open-File Report 2015–1145, 19 p., accessed February 7, 2025, at https://doi.org/10.3133/ofr20151145.
Gannett, M.W., Lite, K.E., Jr., La Marche, J.L., Fisher, B.J., and Polette, D.J., 2007, Ground-water hydrology of the upper Klamath Basin, Oregon and California: U.S. Geologic Survey Scientific Investigations Report 2007–5050, 85 p., accessed July 29, 2024, at https://doi.org/10.3133/sir20075050.
Gannett, M.W., Wagner, B.J., and Lite, K.E., Jr., 2012, Groundwater simulation and management models for the upper Klamath Basin, Oregon and California: U.S. Geological Survey Scientific Investigations Report 2012–5062, 92 p., accessed September 25, 2024, at https://doi.org/10.3133/sir20125062.
Garvert, M.F., Smull, B., and Mass, C., 2007, Multiscale mountain waves influencing a major orographic precipitation event: Journal of the Atmospheric Sciences, v. 64, no. 3, p. 711–737, accessed August 11, 2025, at https://doi.org/10.1175/JAS3876.1.
Hall, D.K., Kimball, J.S., Larson, R., DiGirolamo, N.E., Casey, K.A., and Hulley, G., 2023, Intensified warming and aridity accelerate terminal lake desiccation in the Great Basin of the western United States: Earth and Space Science (Hoboken, N.J.), v. 10, no. 1, 20 p., accessed February 7, 2025, at https://doi.org/10.1029/2022EA002630.
Hanson, R.T., Lockwood, B., and Schmid, W., 2014, Analysis of projected water availability with current basin management plan, Pajaro Valley, California: Journal of Hydrology, v. 519, p. 131–147, accessed September 25, 2024, at https://doi.org/10.1016/j.jhydrol.2014.07.005.
Harbaugh, A.W., Banta, E.R., Hill, M.C., and McDonald, M.G., 2000, MODFLOW-2000, The U.S. Geological Survey modular ground-water model—User guide to modularization concepts and the ground-water flow process: U.S. Geological Survey Open-File Report 00–92, 121 p., accessed September 25, 2024, at https://doi.org/10.3133/ofr200092.
Hargreaves, G.H., and Samani, Z.A., 1985, Reference crop evapotranspiration from temperature: Applied Engineering in Agriculture, v. 1, no. 2, p. 96–99. [Available at https://doi.org/10.13031/2013.26773.]
Hay, L.E., McCabe, G.J., Clark, M.P., and Risley, J.C., 2009, Reducing streamflow forecast uncertainty—Application and qualitative assessment of the upper Klamath River Basin, Oregon: Journal of the American Water Resources Association, v. 45, no. 3, p. 580–596, accessed July 26, 2024, at https://doi.org/10.1111/j.1752-1688.2009.00307.x.
Haynes, J.V., Read, A.L., Chan, A.Y., Martin, D.J., Regan, R.S., Henson, W.R., Niswonger, R.G., and Stewart, J.S., 2023, Monthly crop irrigation withdrawals and efficiencies by HUC12 watershed for years 2000–2020 within the conterminous United States (ver. 2.0, September 2024): U.S. Geological Survey data release, accessed September 26, 2024, at https://doi.org/10.5066/P9LGISUM.
Hess, G.W., and Stonewall, A.J., 2014, Comparison of historical streamflows to 2013 streamflows in the Williamson, Sprague, and Wood Rivers, Upper Klamath Lake Basin, Oregon: U.S. Geological Survey Open-File Report 2014–1128, 23 p., accessed July 26, 2024, at https://doi.org/10.3133/ofr20141128.
Hill, M.C., Banta, E.R., Harbaugh, A.W., and Anderman, E.R., 2000, MODFLOW-2000, The U.S. Geological Survey modular ground-water model; User guide to the observation, sensitivity, and parameter-estimation processes and three post-processing programs: U.S. Geological Survey Open-File Report 2000–184, 209 p., accessed September 25, 2024, at https://doi.org/10.3133/ofr00184.
Hostetler, S.W., 2009, Use of models and observations to assess trends in the 1950–2005 water balance and climate of Upper Klamath Lake, Oregon: Water Resources Research, v. 45, no. 12, 14 p., accessed July 29, 2024, at https://doi.org/10.1029/2008WR007295.
Houston, L.L., Watanabe, M., Kline, J.D., and Alig, R.J., 2003, Past and future water use in Pacific Coast states: Portland, Oreg., U.S. Department of Agriculture, Forest Service General Technical Report PNW-GTR-588, 37 p., accessed July 26, 2024, at https://doi.org/10.2737/PNW-GTR-588.
Houston, N.A., Merriman, K.R., Dieter, C.A., and York, B.C., 2022, Data tables associated with an analysis of the U.S. Geological Survey’s historical water-use data, 1985–2015: U.S. Geological Survey data release, accessed September 26, 2024, at https://doi.org/10.5066/P94Y93BW.
Hubbard, L.L., 1970, Water budget of Upper Klamath Lake, southwestern Oregon: U.S. Geological Survey Hydrologic Atlas 351, accessed July 29, 2024, at https://doi.org/10.3133/ha351.
Huntington, J., Gangopadhyay, S., Spears, M., Allen, R., King, D., Morton, C., Harrison, A., McEvoy, D., and Joros, A., 2015, West-wide climate risk assessments—Irrigation demand and reservoir evaporation projections: Bureau of Reclamation Technical Memorandum 68-68210-2014-01, 223 p., accessed July 29, 2024, at https://doi.org/10.13140/RG.2.1.1209.8647.
Huntington, J., Minor, B., Bromley, M., Pearson, C., Beamer, J., Ingwersen, K., Carrara, K., Atkin, J., Brito, J., Morton, C., Dunkerly, C., Volk, J., and Ott, T., ReVelle, P., Fellows, A., and Hoskinson, M., 2025, Crop evapotranspiration, consumptive use, and open water evaporation for Oregon: Desert Research Institute and Oregon Water Resources Department, Publication no. 41306, 94 p., accessed February 26, 2025, at https://s3-us-west-2.amazonaws.com/webfiles.dri.edu/Labs/Huntington/owrd/Huntington_et_al_2025_DRI_Report_41306.pdf.
Kann, J., and Walker, W.W., Jr., 1999, Nutrient and hydrologic loading to Upper Klamath Lake, Oregon, 1991–1998: Ashland, Oreg., Aquatic Ecosystem Sciences LLC, 39 p., accessed July 29, 2024, at https://klamath-water-quality-app.s3-us-west-2.amazonaws.com/Kann%20and%20Walker1999.pdf.
Kennedy, A.M., Garen, D.C., and Koch, R.W., 2009, The association between climate teleconnection indices and Upper Klamath seasonal streamflow—Trans-Niño Index: Hydrological Processes, v. 23, no. 7, p. 973–984, accessed July 26, 2024, at https://doi.org/10.1002/hyp.7200.
Kennedy, J.J., Johnson, H.M., and Gingerich, S.B., 2024, Assessment of long-term changes in surface-water extent within Klamath Marsh, south-central Oregon, 1985–2021: U.S. Geological Survey Scientific Investigations Report 2024–5033, 32 p., accessed February 7, 2025, at https://doi.org/10.3133/sir20245033.
Kilic, A., Allen, R.G., Blankenau, P., Revelle, P., Ozturk, D., and Huntington, J., 2020, Global production and free access to landsat-scale evapotranspiration with EEFlux and eeMETRIC: San Diego, Calif., 6th Decennial National Irrigation Symposium, December 2020, ASABE, 9 p. [Available at https://doi.org/10.13031/irrig.2020-038.]
Krause, J.R., Janney, E.C., Burdick, S.M., Harris, A.C., and Hayes, B.S., 2022, Water and endangered fish in the Klamath River Basin—Do Upper Klamath Lake surface elevation and water quality affect adult lost river and shortnose sucker survival?: North American Journal of Fisheries Management, v. 42, no. 6, p. 1414–1432, accessed January 31, 2025, at https://doi.org/10.1002/nafm.10850.
Kuwabara, J.S., Topping, B.R., Carter, J.L., Carlson, R.A., Parchaso, F., Fend, S.V., Stauffer-Olsen, N., Manning, A.J., and Land, J.M., 2016, Benthic processes affecting contaminant transport in Upper Klamath Lake, Oregon: U.S. Geological Survey Open-File Report 2016–1175, 103 p., accessed July 29, 2024, at https://doi.org/10.3133/ofr20161175.
La Marche, J.L., Gates, E.B., and Lite, K.E., Jr., 2011, Hydrologic monitoring and trends in the Upper Klamath Basin over the last decade: Oregon Department of Water Resources, 30 p., accessed February 26, 2025, at https://ir.library.oregonstate.edu/concern/conference_proceedings_or_journals/9k41zf34c.
Laipelt, L., Henrique Bloedow Kayser, R., Santos Fleischmann, A., Ruhoff, A., Bastiaanssen, W., Erickson, T.A., and Melton, F., 2021, Long-term monitoring of evapotranspiration using the SEBAL algorithm and Google Earth Engine cloud computing: ISPRS Journal of Photogrammetry and Remote Sensing, v. 178, p. 81–96, accessed July 29, 2024, at https://doi.org/10.1016/j.isprsjprs.2021.05.018.
Levin, S.B., Briggs, M.A., Foks, S.S., Goodling, P.J., Raffensperger, J.P., Rosenberry, D.O., Scholl, M.A., Tiedeman, C.R., and Webb, R.M., 2023, Uncertainties in measuring and estimating water-budget components—Current state of the science: WIREs Water, v. 10, no. 4, 33 p., accessed February 11, 2025, at https://doi.org/10.1002/wat2.1646.
Li, X., Sun, H., Yang, Y., Sun, X., Xiong, M., Ouyang, S., Li, H., Qin, H., and Zhang, W., 2024, Different vegetation covers leading to the uncertainty and consistency of ET estimation—A case study assessment with extended triple collocation: Remote Sensing, v. 16, no. 13, 25 p., accessed October 8, 2025, at https://doi.org/10.3390/rs16132484.
Liang, X., Lettenmaier, D.P., Wood, E.F., and Burges, S.J., 1994, A simple hydrologically based model of land surface water and energy fluxes for general circulation models: Journal of Geophysical Research—Atmospheres, v. 99, no. D7, p. 14415–14428. [Available at https://doi.org/10.1029/94JD00483.]
Luukkonen, C.L., Alzraiee, A.H., Larsen, J.D., Martin, D.J., Herbert, D.M., Buchwald, C.A., Houston, N.A., Valseth, K.J., Paulinski, S., Miller, L.D., Niswonger, R.G., Stewart, J.S., Dieter, C.A., and Miller, O.L., 2024, Public supply water use reanalysis for the 2000–2020 period by HUC12, month, and year for the conterminous United States (ver. 2.0, August 2024): U.S. Geological Survey data release, accessed September 26, 2024, at https://doi.org/10.5066/P9FUL880.
Lynch, D.D., and Risley, J.C., 2003, Klamath River Basin hydrologic conditions prior to the September 2002 die-off of Salmon and Steelhead: U.S. Geological Survey Water Resources Investigations Report 2003–4099, 10 p., accessed January 31, 2025, at https://doi.org/10.3133/wri034099.
Madadgar, S., Moradkhani, H., and Garen, D., 2014, Towards improved post-processing of hydrologic forecast ensembles: Hydrological Processes, v. 28, no. 1, p. 104–122, accessed July 26, 2024, at https://doi.org/10.1002/hyp.9562.
Main, D., 2024, Nearly 100,000 birds dead in botulism outbreak linked to climate change, water diversions: The New Lede, accessed January 30, 2025, at https://www.thenewlede.org/2024/10/nearly-100000-birds-dead-in-botulism-outbreak-linked-to-climate-change-water-diversions/.
Malevich, S.B., Woodhouse, C.A., and Meko, D.M., 2013, Tree-ring reconstructed hydroclimate of the Upper Klamath Basin: Journal of Hydrology, v. 495, p. 13–22, accessed July 26, 2024, at https://doi.org/10.1016/j.jhydrol.2013.04.048.
Mankin, K.R., Mehan, S., Green, T.R., and Barnard, D.M., 2025, Review of gridded climate products and their use in hydrological analyses reveals overlaps, gaps, and the need for a more objective approach to selecting model forcing datasets: Hydrology and Earth System Sciences Discussions, v. 29, no. 1, p. 85–108. [Available at https://doi.org/10.5194/hess-29-85-2025.]
Martin, D.J., Regan, R.S., Haynes, J.V., Read, A.L., Henson, W.R., Stewart, J.S., Brandt, J.T., and Niswonger, R.G., 2023, Irrigation water use reanalysis for the 2000–20 period by HUC12, month, and year for the conterminous United States (ver. 2.0, September 2024): U.S. Geological Survey data release, accessed September 26, 2024, at https://doi.org/10.5066/P9YWR0OJ.
Maselli, F., Chiesi, M., Angeli, L., Fibbi, L., Rapi, B., Romani, M., Sabatini, F., and Battista, P., 2020, An improved NDVI-based method to predict actual evapotranspiration of irrigated grasses and crops: Agricultural Water Management, v. 233, accessed March 6, 2025, at https://doi.org/10.1016/j.agwat.2020.106077.
Mayer, T.D., and Naman, S.W., 2011, Streamflow response to climate as influenced by geology and elevation: Journal of the American Water Resources Association, v. 47, no. 4, p. 724–738, accessed July 26, 2024, at https://doi.org/10.1111/j.1752-1688.2011.00537.x.
McCaffery, R., Duda, J.J., Soissons, L., and Roussel, J.-M., 2024, Large-scale dam removal and ecosystem restoration: Frontiers in Ecology and Evolution, v. 12, 6 p. [Available at https://doi.org/10.3389/fevo.2024.1471146.]
Medina, S., Smull, B.F., Houze, R.A., Jr., and Steiner, M., 2005, Cross-barrier flow during orographic precipitation events—Results from MAP and IMPROVE: Journal of the Atmospheric Sciences, v. 62, no. 10, p. 3580–3598, accessed July 26, 2024, at https://doi.org/10.1175/JAS3554.1.
Melton, F.S., Johnson, L.F., Lund, C.P., Pierce, L.L., Michaelis, A.R., Hiatt, S.H., Guzman, A., Adhikari, D.D., Purdy, A.J., Rosevelt, C., Votava, P., Trout, T.J., Temesgen, B., Frame, K., Sheffner, E.J., and Nemani, R.R., 2012, Satellite irrigation management support with the terrestrial observation and prediction system—A framework for integration of satellite and surface observations to support improvements in agricultural water resource management: IEEE Journal of Selected Topics in Applied Earth Observations and Remote Sensing, v. 5, no. 6, p. 1709–1721, accessed July 29, 2024, at https://doi.org/10.1109/JSTARS.2012.2214474.
Meyer, J.D.D., Jin, J., and Wang, S.-Y., 2012, Systematic patterns of the inconsistency between snow water equivalent and accumulated precipitation as reported by the snowpack telemetry network: Journal of Hydrometeorology, v. 13, no. 6, p. 1970–1976, accessed July 26, 2024, at https://doi.org/10.1175/JHM-D-12-066.1.
Miller, W.E., and Tash, J.C., 1967, Interim report—Upper Klamath Lake studies, Oregon: Corvallis, Oreg., Federal Water Pollution Control Administration Report WP-20-8, 39 p., accessed May 12, 2026, at https://klamath-water-quality-app.s3-us-west-2.amazonaws.com/Miller%20and%20Tash%201967.pdf.
Morton, F.I., 1983, Operational estimates of lake evaporation: Journal of Hydrology, v. 66, nos. 1–4, p. 77–100, accessed July 29, 2024, at https://doi.org/10.1016/0022-1694(83)90178-6.
Morton, F.I., 1986, Practical estimates of lake evaporation: Journal of Applied Meteorology and Climatology, v. 25, no. 3, p. 371–387, accessed July 29, 2024, at https://doi.org/10.1175/1520-0450(1986)025<0371:PEOLE>2.0.CO;2.
National Marine Fisheries Service, 2024, Endangered Species Act Section 7(a)(2) Biological Opinion, and Magnuson–Stevens Fishery Conservation and Management Act Essential Fish Habitat Response for Klamath Project Operations from October 1, 2024, through September 30, 2029: NOAA Fisheries, 410 p., accessed March 5, 2025, at https://www.fisheries.noaa.gov/resource/document/2024-klamath-project-biological-opinion.
National Oceanic and Atmospheric Administration, 2024a, Global Surface Summary of the Day: National Oceanic and Atmospheric Administration, accessed July 26, 2024, at https://www.ncei.noaa.gov/access/metadata/landing-page/bin/iso?id=gov.noaa.ncdc:C00516.
National Oceanic and Atmospheric Administration, 2024b, The National Water Model: National Oceanic and Atmospheric Administration, accessed July 25, 2024, at https://water.noaa.gov/about/nwm.
National Oceanic and Atmospheric Administration, 2025, Historical Observing Metadata Repository: National Oceanic and Atmospheric Administration, National Centers for Environmental Information, accessed February 26, 2025, at https://www.ncei.noaa.gov/access/homr/#ncdcstnid=20015721&tab=PHR.
National Oceanic and Atmospheric Administration Fisheries, 2024, Final step in Klamath River Dam removal opens path for returning salmon: National Oceanic and Atmospheric Administration Fisheries, accessed October 23, 2024, at https://www.fisheries.noaa.gov/feature-story/final-step-klamath-river-dam-removal-opens-path-returning-salmon.
Natural Resources Conservation Service, 2026, BOR outlook reports: Natural Resources Conservation Service web page, accessed March 12, 2026, at https://www.wcc.nrcs.usda.gov/ftpref/nwcc/basin-rpt/.
OpenET, 2021, Intercomparison and accuracy assessment report: OpenET, 10 p., accessed September 25, 2024, at https://openetdata.org/wp-content/uploads/2021/10/Intercomparison-and-Accuracy-Assessment-Report.pdf.
OpenET, 2023, OpenET—Filling the biggest gap in water data: OpenET web page, accessed November 16, 2023, at https://etdata.org/.
Oregon Encyclopedia, 2024, Endangered Klamath suckers: Oregon Encyclopedia, accessed July 25, 2024, at https://www.oregonencyclopedia.org/articles/klamath-sucker/.
Oregon Legislature, 2023, Chapter 537—Appropriation of water generally—2023 Edition: Oregon Legislature, accessed September 25, 2024, at https://www.oregonlegislature.gov/bills_laws/ors/ors537.html.
Oregon Public Broadcasting, 2024a, The world’s largest dam removal will touch many lives in the Klamath River Basin: Oregon Public Broadcasting, November 18, 2022, accessed July 25, 2024, at https://www.opb.org/article/2022/11/18/klamath-river-dam-removal-southern-oregon-dams-northern-california-drought/.
Oregon Public Broadcasting, 2024b, A botulism outbreak in the Klamath Basin has killed about 20,000 migratory birds this summer: Oregon Public Broadcasting, August 30, 2024, accessed January 30, 2025, at https://www.opb.org/article/2024/08/30/southern-oregon-klamath-basin-migratory-birds-die-botulism/?utm_source=chatgpt.com.
Oregon Public Broadcasting, 2025, Water flows as part of a massive habitat restoration in the Upper Klamath Basin: Oregon Public Broadcasting, January 25, 2025, accessed January 31, 2025, at https://www.opb.org/article/2025/01/25/water-flows-as-part-of-a-massive-habitat-restoration-in-the-upper-klamath-basin/.
Oregon Water Resources Department, 2023, Water use report: Oregon Water Resources Department web page, accessed November 1, 2023, at https://apps.wrd.state.or.us/apps/wr/wateruse_query/.
Oregon Water Resources Department, 2024a, Water rights mapping tool: Oregon Water Resources Department web page, accessed January 26, 2024, at https://apps.wrd.state.or.us/apps/gis/wr/Default.aspx.
Oregon Water Resources Department, 2024b, Oregon’s integrated water resources strategy–Draft 1, March 2024: Oregon Water Resources Department, 215 p., accessed September 25, 2024, at https://www.oregon.gov/owrd/Documents/2024.03.11_IWRS%20Draft%201.pdf.
Oregon Water Resources Department, 2024c, Near real time hydrographics data: Oregon Water Resources Department web page, accessed November 11, 2024, at https://apps.wrd.state.or.us/apps/sw/hydro_near_real_time/.
Oregon Water Resources Department, 2024d, Historical streamflow and lake level data*: Oregon Water Resources Department web page, accessed November 11, 2024, at https://apps.wrd.state.or.us/apps/sw/hydro_report/.
Oregon Water Resources Department, 2025, Public declaration status report: Oregon Water Resources Department web page, accessed January 31, 2025, at https://apps.wrd.state.or.us/apps/wr/wr_drought/declaration_status_report.aspx.
Ott, T.J., Majumdar, S., Huntington, J.L., Pearson, C., Bromley, M., Minor, B.A., ReVelle, P., Morton, C.G., Sueki, S., Beamer, J.P., and Jasoni, R.L., 2024, Toward field-scale groundwater pumping and improved groundwater management using remote sensing and climate data: Agricultural Water Management, v. 302, accessed February 11, 2025, at https://doi.org/10.1016/j.agwat.2024.109000.
Owens, J.M., Hagimoto, Y., and Cuenca, R.H., 2014, Hydrologic responses to irrigation management in the Wood River Basin, Klamath County, Oregon: American Society of Civil Engineers, p. 1896–1905, accessed July 29, 2024, at https://doi.org/10.1061/9780784413548.190.
Painter, J.A., Brandt, J.T., Caldwell, R.R., Haynes, J.V., and Read, A.L., 2021a, Documentation of methods and inventory of irrigation information collected for the 2015 U.S. Geological Survey estimated use of water in the United States: U.S. Geological Survey Scientific Investigations Report 2020–5139, 39 p., accessed July 29, 2024, at https://doi.org/10.3133/sir20205139.
Painter, J.A., Caldwell, R.R., Brandt, J., Haynes, J.V., and Read, A.L., 2021b, 2015 calendar-year county-level estimates of actual evapotranspiration for the conterminous United States and Hawaii: U.S. Geological Survey data release, accessed July 29, 2024, at https://doi.org/10.5066/P9O1TMR6.
Palmer, P.C., Gannett, M.W., and Hinkle, S.R., 2007, Isotopic characterization of three groundwater recharge sources and inferences for selected aquifers in the upper Klamath Basin of Oregon and California, USA: Journal of Hydrology, v. 336, no. 1, p. 17–29, accessed April 18, 2025, at https://doi.org/10.1016/j.jhydrol.2006.12.008.
Pereira, L.S., Paredes, P., Melton, F., Johnson, L., Wang, T., López-Urrea, R., Cancela, J.J., and Allen, R.G., 2020, Prediction of crop coefficients from fraction of ground cover and height—Background and validation using ground and remote sensing data: Agricultural Water Management, v. 241, accessed July 29, 2024, at https://doi.org/10.1016/j.agwat.2020.106197.
Perry, T., Lieb, A., Harrison, A., Spears, M., Mull, T., Cohen, E., Rasmussen, J., Hicks, J., Holz, D., and Lyons, J., 2005, Natural flow of the upper Klamath River: Western Waters Digital Library, 79 p., accessed October 8, 2024, at http://westernwaters.org/record/view/80340.
Pischel, E.M., and Gannett, M.W., 2015, Effects of groundwater pumping on agricultural drains in the Tule Lake subbasin, Oregon and California: U.S. Geological Survey Scientific Investigations Report 2015–5087, 44 p., accessed February 26, 2025, at https://doi.org/10.3133/sir20155087.
R Core Team, 2024, R—A language and environment for statistical computing: Vienna, Austria, R foundation for statistical computing, accessed July 26, 2024, at https://www.R-project.org/.
Rasmussen, R., Baker, B., Kochendorfer, J., Meyers, T., Landolt, S., Fischer, A.P., Black, J., Thériault, J.M., Kucera, P., Gochis, D., Smith, C., Nitu, R., Hall, M., Ikeda, K., and Gutmann, E., 2012, How well are we measuring snow—The NOAA/FAA/NCAR Winter precipitation test bed: Bulletin of the American Meteorological Society, v. 93, no. 6, p. 811–829, accessed February 26, 2025, at https://doi.org/10.1175/BAMS-D-11-00052.1.
Refsgaard, J.C., 1997, Parameterisation, calibration and validation of distributed hydrological models: Journal of Hydrology, v. 198, nos. 1–4, p. 69–97. [Available at https://doi.org/10.1016/S0022-1694(96)03329-X.]
Risley, J.C., 2019, Using the precipitation-runoff modeling system to predict seasonal water availability in the upper Klamath River basin, Oregon and California: U.S. Geological Survey Scientific Investigations Report 2019–5044, 37 p., accessed July 26, 2024, at https://doi.org/10.3133/sir20195044.
Risley, J.C., Gannett, M.W., Lea, J.K., and Roehl, E.A., Jr., 2005, An analysis of statistical methods for seasonal flow forecasting in the Upper Klamath River basin of Oregon and California: U.S. Geological Survey Scientific Investigations Report 2005–5177, 53 p., accessed February 25, 2025, at https://doi.org/10.3133/sir20055177.
Risley, J.C., and Laenen, A., 1999, Upper Klamath Lake Basin nutrient-loading study—Assessment of historic flows in the Williamson and Sprague rivers: U.S. Geological Survey Water-Resources Investigation Report 98–4198, 22 p. [Available at https://doi.org/10.3133/wri984198.]
Risley, J., Stonewall, A.J., and Haluska, T., 2008, Estimating flow-duration and low-flow frequency statistics for unregulated streams in Oregon: U.S. Geological Survey Scientific Investigations Report 2008–5126, accessed April 11, 2025, at https://doi.org/10.3133/sir20085126.
Sahaar, S.A., and Niemann, J.D., 2024, Estimating rootzone soil moisture by fusing multiple remote sensing products with machine learning: Remote Sensing, v. 16, no. 19, 28 p., accessed October 8, 2024, at https://doi.org/10.3390/rs16193699.
Schibel, H.J., and Grondin, G.H., 2023, Methods and results for estimating 1930–2018 well pumpage in the Harney Basin, Oregon: Salem, Oregon, Oregon Water Resources Department, Open File Report 2023–01, 84 p., accessed February 26, 2025, at https://www.oregon.gov/owrd/WRDReports/OWRD_OFR_2023_01.pdf.
Segovia-Cardozo, D.A., Rodríguez-Sinobas, L., Díez-Herrero, A., Zubelzu, S., and Canales-Ide, F., 2021, Understanding the mechanical biases of tipping-bucket rain gauges—A semi-analytical calibration approach: Water (Basel), v. 13, no. 16, 18 p., accessed October 11, 2024, at https://doi.org/10.3390/w13162285.
Selkowitz, D.J., and Forster, R.R., 2016, Automated mapping of persistent ice and snow cover across the western U.S. with Landsat: ISPRS Journal of Photogrammetry and Remote Sensing, v. 117, p. 126–140. [Available at https://doi.org/10.1016/j.isprsjprs.2016.04.001.]
Senay, G.B., 2018, Satellite psychrometric formulation of the operational simplified surface energy balance (SSEBop) model for quantifying and mapping evapotranspiration: Applied Engineering in Agriculture, v. 34, no. 3, p. 555–566, accessed July 29, 2024, at https://doi.org/10.13031/aea.12614.
Senay, G., and Kagone, S., 2019, Daily SSEBop evapotranspiration data from 2000 to 2018: U.S. Geological Survey web page, accessed July 29, 2024, at https://earlywarning.usgs.gov/ssebop/modis.
Senay, G.B., Bohms, S., Singh, R.K., Gowda, P.H., Velpuri, N.M., Alemu, H., and Verdin, J.P., 2013, Operational evapotranspiration mapping using remote sensing and weather datasets—A new parameterization for the SSEB approach: Journal of the American Water Resources Association, v. 49, no. 3, p. 577–591, accessed July 29, 2024, at https://doi.org/10.1111/jawr.12057.
Sevruk, B., Ondrás, M., and Chvíla, B., 2009, The WMO precipitation measurement intercomparisons: Atmospheric Research,, v. 92, no. 3, p. 376–380, accessed October 11, 2024, at https://doi.org/10.1016/j.atmosres.2009.01.016.
Siegel, J., 2009, Examining monthly relationships between temperature, precipitation, snowpack, and streamflow in the Upper Klamath Basin over a 26 year SNOTEL record: Vassar University, 42 p., accessed May 12, 2026, at https://facultysites.vassar.edu/macunningham/past_theses/Jared_Siegel_2009_Thesis.pdf.
Smith, K., 2025, Agency-Barnes phase 1 restoration completed with native plants seeding; phase 2 and 3 funding paused, stalling project—For now: Klamath Tribes News, April 30, 2025, accessed May 14, 2025, at https://www.klamathtribesnews.org/2025/04/30/agency-barnes-phase-1-restoration-completed-with-native-plants-seeding-phase-2-and-3-funding-paused-stall ing-project-for-now/.
Smith, E.A., and Sullivan, A.B., 2023, Modeling the water-quality effects to the Klamath River from recirculation in drains and canals, Oregon and California, 2006–15: U.S. Geological Survey Scientific Investigations Report 2023–5059, 87 p., accessed October 23, 2024, at https://doi.org/10.3133/sir20235059.
Snyder, D.T., and Morace, J.L., 1997, Nitrogen and phosphorus loading from drained wetlands adjacent to Upper Klamath and Agency lakes, Oregon: U.S. Geological Survey Water-Resources Investigations Report 97–4059, 67 p., accessed January 31, 2025, at https://doi.org/10.3133/wri974059.
Snyder, D.T., Risley, J.C., and Haynes, J.V., 2012, Hydrological information products for the Off-Project Water Program of the Klamath Basin Restoration Agreement: U.S. Geological Survey Scientific Investigations Report 2012–1199, 27 p., accessed July 29, 2024, at https://doi.org/10.3133/ofr20121199.
Sparks, A.H., Hengl, T., and Nelson, A., 2017, GSODR—Global summary daily weather data in R: The Journal of Open Source Software, v. 2, no. 10, article 177. [Available at https://doi.org/10.21105/joss.00177.]
Stannard, D.I., Gannett, M.W., Polette, D.J., Cameron, J.M., Waibel, M.S., and Spears, J.M., 2013, Evapotranspiration from marsh and open-water sites at Upper Klamath Lake, Oregon, 2008–2010: U.S. Geological Survey Scientific Investigations Report 2013–5014, 65 p., accessed July 29, 2024, at https://doi.org/10.3133/sir20135014.
State of California, 2024, Klamath River dams fully removed ahead of schedule, Press release, October 2, 2024: Governor of California, accessed February 26, 2025, at https://www.gov.ca.gov/2024/10/02/klamath-river-dams-fully-removed-ahead-of-schedule/.
State of Oregon, 2013, Determination of a drought emergency in Klamath County due to drought and low water conditions: Executive Order No. 13-05, Office of the Governor, accessed July 25, 2024, at https://www.oregon.gov/gov/eo/eo-13-05.pdf.
State of Oregon, 2020, Klamath Irrigation District V: Oregon Water Resources Department, 15 p., accessed July 26, 2024, at http://www.klamathbasincrisis.org/kid/2020/KIDvsOWRD_051420.pdf.
State of Oregon, 2024a, Klamath River Basin general stream adjudication—Corrected findings of fact and order of determination: Oregon Water Resources Department, accessed July 26, 2024, at https://www.oregon.gov/OWRD/programs/WaterRights/Adjudications/KlamathAdj/KBA_ACFFOD_00001.PDF.
State of Oregon, 2024b, Klamath River Basin adjudication: Oregon Water Resources Department, accessed July 26, 2024, at https://www.oregon.gov/owrd/programs/WaterRights/Adjudications/KlamathRiverBasinAdj/Pages/default.aspx.
Stern, M.A., Flint, L.E., Flint, A.L., Boynton, R.M., Stewart, J.A.E., Wright, J.W., and Thorne, J.H., 2022, Selecting the optimal fine-scale historical climate data for assessing current and future hydrological conditions: Journal of Hydrometeorology, v. 23, p. 293–308, accessed July 26, 2024, at https://doi.org/10.1175/JHM-D-21-0045.1.
Tang, Q., Rosenberg, E.A., and Lettenmaier, D.P., 2009, Use of satellite data to assess the impacts of irrigation withdrawals on Upper Klamath Lake, Oregon: Hydrology and Earth System Sciences, v. 13, no. 5, p. 617–627, accessed July 29, 2024, at https://doi.org/10.5194/hess-13-617-2009.
Traum, J.A., and Boyce, S.E., 2022, Klamath natural flow study, Upper Klamath Basin groundwater flow model: U.S. Bureau of Reclamation Fact Sheet, 2 p. [Available at https://pubs.usgs.gov/publication/70237895.]
Trenberth, K.E., and Stepaniak, D.P., 2001, Indices of El Niño evolution: Journal of Climate, v. 14, no. 8, p. 1697–1701. [Available at https://doi.org/10.1175/1520-0442(2001)014<1697:LIOENO>2.0.CO;2.]
Turnipseed, D.P., and Sauer, V.B., 2010, Discharge measurements at gaging stations: U.S. Geological Survey Techniques and Methods, book 3, chap. A8, 87 p., accessed November 12, 2024, at https://doi.org/10.3133/tm3A8.
University of Montana, 2023, Montana climate office—IRRMAPPER: Montana Climate Office, accessed September 25, 2024, at https://www.umt.edu/climate/progress/irrmapper/default.php.
U.S. Bureau of Reclamation, 2024a, 2024 Annual operations plan: U.S. Bureau of Reclamation, 12 p., accessed February 11, 2025, at https://www.usbr.gov/mp/kbao/docs/2024-klamath-project-annual-operations-plan.pdf.
U.S. Bureau of Reclamation, 2024b, Natural flow study | KBAO: U.S. Bureau of Reclamation, accessed July 26, 2024, at https://www.usbr.gov/mp/kbao/nfs.html.
U.S. Bureau of Reclamation, 2024c, Link River diversion dam: U.S. Bureau of Reclamation, accessed October 23, 2024, at https://www.usbr.gov/projects/index.php?id=172.
U.S. Environmental Protection Agency, 2014, NHDPlus (National Hydrography Dataset Plus): U.S. Environmental Protection Agency, accessed July 26, 2024, at https://www.epa.gov/waterdata/nhdplus-national-hydrography-dataset-plus.
U.S. Geological Survey, 1954, Water-loss investigations—Lake Hefner studies, technical report: U.S. Geological Survey Professional Paper 269, 158 p., accessed July 29, 2024, at https://doi.org/10.3133/pp269.
U.S. Geological Survey, 2019, StreamStats: U.S. Geological Survey web page, accessed February 26, 2026, at https://streamstats.usgs.gov/ss/.
U.S. Geological Survey, 2024a, Integrated water availability assessments: U.S. Geological Survey website, accessed July 25, 2024, at https://www.usgs.gov/mission-areas/water-resources/science/integrated-water-availability-assessments.
U.S. Geological Survey, 2024b, USGS National Hydrologic Model (NHM): U.S. Geological Survey data release, accessed July 26, 2024, at https://www.sciencebase.gov/catalog/item/4f4e4773e4b07f02db47e234.
U.S. Geological Survey, 2024c, Streamflow Data Catalog: U.S. Geological Survey web page, accessed September 25, 2024, at https://tableau.usgs.gov/views/Streamflow_Catalog/Introduction?%3Aembed=y&%3AisGuestRedirectFromVizportal=y.
U.S. Geological Survey, 2024d, USGS Surface water for USA—Streamflow measurements: U.S. Geological Survey website, accessed November 11, 2024, at https://waterdata.usgs.gov/nwis/measurements/?site_no=11502500&agency_cd=USGS.
U.S. Geological Survey, 2024e, Water data for the Nation: U.S. Geological Survey National Water Information System database, accessed November 11, 2024, at https://doi.org/10.5066/F7P55KJN.
U.S. Geological Survey, 2026, US SSEBop Evapotranspiration—Early Warning and Environmental Monitoring Program: U.S. Geological Survey web page, accessed at March 12, 2026, at https://earlywarning.usgs.gov/ssebop/modis/8-day/.
U.S. National Marine Fisheries Service and U.S. Fish and Wildlife Service, 2013, Biological opinion on the effects of proposed Klamath Project Operations from May 31, 2013, through March 31, 2023, on five federally listed threatened and endangered species: Fisheries, N.O.A.A., Endangered Species Act Section 7(a)(2) Biological Opinion-NMFS Consultation Number: SWR-2012-9372; USFWS Consultation Number: 08EKLA00-2013-F-0014, 690 p., accessed July 25, 2024, at https://www.fisheries.noaa.gov/resource/document/biological-opinion-effects-proposed-klamath-project-operations-may-31-2013.
Van Kirk, R.W., and Naman, S.W., 2008, Relative effects of climate and water use on base-flow trends in the Lower Klamath Basin: Journal of the American Water Resources Association, v. 44, no. 4, p. 1035–1052, accessed July 26, 2024, at https://doi.org/10.1111/j.1752-1688.2008.00212.x.
Velpuri, N.M., Senay, G.B., Schauer, M., Garcia, C.A., Singh, R.K., Friedrichs, M., Kagone, S., Haynes, J., and Conlon, T., 2020, Evaluation of hydrologic impact of an irrigation curtailment program using Landsat satellite data: Hydrological Processes, v. 34, no. 8, p. 1697–1713, accessed July 29, 2024, at https://doi.org/10.1002/hyp.13708.
Volk, J.M., Huntington, J.L., Melton, F.S., Allen, R., Anderson, M., Fisher, J.B., Kilic, A., Ruhoff, A., Senay, G.B., Minor, B., Morton, C., Ott, T., Johnson, L., Comini de Andrade, B., Carrara, W., Doherty, C.T., Dunkerly, C., Friedrichs, M., Guzman, A., Hain, C., Halverson, G., Kang, Y., Knipper, K., Laipelt, L., Ortega-Salazar, S., Pearson, C., Parrish, G.E.L., Purdy, A., ReVelle, P., Wang, T., and Yang, Y., 2024, Assessing the accuracy of OpenET satellite-based evapotranspiration data to support water resource and land management applications: Nature Water, v. 2, no. 2, p. 193–205, accessed July 29, 2024, at https://doi.org/10.1038/s44221-023-00181-7.
Walker, J.D., and Kann, J., 2022, Water and nutrient balances of Upper Klamath Lake, water years 1992–2018: Zenodo web page, accessed September 12, 2024, at https://doi.org/10.5281/ZENODO.6607800.
Walker, W.W., Walker, J.D., and Kann, J., 2012, Evaluation of water and nutrient balances for the Upper Klamath Lake Basin in water years 1992–2010: Aquatic Ecosystem Sciences LLC, 55 p., accessed April 11, 2025, at https://wwwalker.net/ukl/klamath_nutrientbudget_2012_final.pdf.
Water Education Foundation, 2020, Klamath River Basin chronology: Water Education Foundation web page, accessed December 2, 2024, at https://www.watereducation.org/aquapedia/klamath-river-basin-chronology.
Water Resources Department, 2023, Chapter 690-85—Annual reports and serious water management problem areas: Oregon Secretary of State web page. [Available at https://secure.sos.state.or.us/oard/displayDivisionRules.action?selectedDivision=3174.]
Weng, S., Zhai, D., Yang, X., and Hu, X., 2017, A ZigBee wireless networking for remote sensing applications in hydrological monitoring system, in Seventh International Conference on Electronics and Information Engineering, Nanjing, China, 2017 [Proceedings]: Bellingham, Washington, Seventh International Conference on Electronics and Information Engineering, v. 10322. [Available at https://doi.org/10.1117/12.2265347.]
Winter, T.C., 1981, Uncertainties in estimating the water balance of lakes: Journal of the American Water Resources Association, v. 17, no. 1, p. 82–115. [Available at https://doi.org/10.1111/j.1752-1688.1981.tb02593.x.]
Wood, T.M., 2020, Use of boosted regression trees to quantify cumulative instream flow resulting from curtailment of irrigation in the Sprague River Basin, Oregon: U.S. Geological Survey Scientific Investigations Report 2019–5130, 25 p., accessed July 26, 2024, at https://doi.org/10.3133/sir20195130.
Woods, C.P., Stoelinga, M.T., Locatelli, J.D., and Hobbs, P.V., 2005, Microphysical processes and synergistic interaction between frontal and orographic forcing of precipitation during the 13 December 2001 IMPROVE-2 event over the Oregon Cascades: Journal of the Atmospheric Sciences, v. 62, no. 10, p. 3493–3519. [Available at https://doi.org/10.1175/JAS3550.1.]
Xu, F., Wang, W., Wang, J., Xu, Z., Qi, Y., and Wu, Y., 2017, Area-averaged evapotranspiration over a heterogeneous land surface—Aggregation of multi-point EC flux measurements with a high-resolution land-cover map and footprint analysis: Hydrology and Earth System Sciences, v. 21, no. 8, p. 4037–4051, accessed October 8, 2024, at https://doi.org/10.5194/hess-21-4037-2017.
Zagona, E.A., Fulp, T.J., Shane, R., Magee, T., and Goranflo, H.M., 2001, Riverware—A generalized tool for complex reservoir system modeling1: Journal of the American Water Resources Association, v. 37, no. 4, p. 913–929. [Available at https://doi.org/10.1111/j.1752-1688.2001.tb05522.x.]
Zeng, X., Broxton, P., and Dawson, N., 2018, Snowpack change from 1982 to 2016 over conterminous United States: Geophysical Research Letters, v. 45, no. 23, p. 12940–12947, accessed July 26, 2024, at https://doi.org/10.1029/2018GL079621.
Zhao, W., Allen, R., Trezza, R., and Robison, C., 2015, Evapotranspiration in the Upper Klamath Basin for the 2013 growing season (April–October): U.S. Geological Survey data release, accessed July 29, 2024, at https://doi.org/10.5066/F72J68ZW.
Zhao, G., and Gao, H., 2019, Estimating reservoir evaporation losses for the United States—Fusing remote sensing and modeling approaches: Remote Sensing of Environment, v. 226, p. 109–124, accessed July 29, 2024, at https://doi.org/10.1016/j.rse.2019.03.015.
Appendix 1. Summary of Hydroclimatic Gaging Stations for the Upper Klamath Basin
Table 1.1.
Summary of hydroclimatic gaging stations for the Upper Klamath Basin.[Horizontal coordinate information is referenced to the North American Datum of 1983 (NAD 83). Status: A, active; I, inactive. Abbreviations: ASOS, Automated Surface Observing System; FAA, Federal Aviation Administration; NA, not applicable; NOAA, National Oceanic and Atmospheric Administration; NRCS, Natural Resources Conservation Service; OWRD, Oregon Water Resources Department; Reclamation, Bureau of Reclamation; USGS, U.S. Geological Survey]
Appendix 2. Summary of Upper Klamath Basin Models and Studies
Table 2.1.
Summary of surface-water models and studies for the Upper Klamath Basin (UKB).[PRMS, Precipitation-Runoff Modeling System; Reclamation, Bureau of Reclamation; SHE, Système Hydrologique Européen; UKL, Upper Klamath Lake; USGS, U.S. Geological Survey]
| Source | Type | Area within the United States |
Period | Focus |
|---|---|---|---|---|
| Bakke and others (1999) | Regional adjustment model | Upper Klamath Basin (UKB) | 1961–95 | Ungaged streamflow estimates. |
| Cooper (2002) | Regional regression model | Oregon | 1961–90 | Natural streamflow estimates |
| Natural Resources Conservation Service (2007) | Forecast model | UKB/national | Ongoing | Predict inflow/levels at UKL and others |
| Risley and others (2008) | Regional regression model | Oregon | 1891–2005 | Ungaged streamflow estimates |
| Hay and others (2009) | PRMS model | Sprague River, Oregon | 1980–2004 | Parameterization optimization based on climate state |
| Tang and others (2009) | Variable Infiltration Capacity model | UKB | 2001–05 | Irrigation effects on UKL stage |
| Hess and Stonewall (2014) | Statistical approach | Williamson and Wood Rivers, Oregon | 2013 | Curtailment effects |
| Madadgar and others (2014) | PRMS model | Sprague River, Oregon | 1980–2000 | Bias correction for model output |
| Owens and others (2014) | MIKE SHE/MIKE 11 model | Wood River, Oregon | 2002–09 | Irrigation effects on UKL inflow |
| Risley (2019) | PRMS model | UKB | 1989–2015 | Water availability prediction. |
| Wood (2020) | Regression tree machine learning model | Sprague River, Oregon | 2013–16 | Curtailment effects |
| California Nevada River Forecast Center (2025) | Forecast model | UKB/national | Ongoing | Predict inflow/levels at UKL and others |
| USGS for Reclamation’s revised Klamath River Basin Natural Flow Study (in development) | PRMS model | UKB | 1980–2020 | Groundwater recharge estimation |
Table 2.2.
Summary of precipitation data for the Upper Klamath Basin.Table 2.3.
Summary of evapotranspiration (ET) models and studies for the Upper Klamath Basin (UKB) and surrounding region.[ET, evapotranspiration; METRIC, Mapping EvapoTranspiration at High Resolution with Internalized Calibration; UKB, Upper Klamath Basin; UKL, Upper Klamath Lake; —, not applicable]
| Source | Type | Area | Period | Focus |
|---|---|---|---|---|
| Hubbard (1970) | Pan evaporation | UKL | 1964–68 | Open-water evaporation |
| Kann and Walker (1999); Walker and Kann (2022) | Pan evaporation | UKL | 1991–2018 | Open-water evaporation |
| Bidlake (2000) | Eddy covariance and Penman–Monteith | UKL | 1997 | Wetland ET |
| Bidlake (2002) | Bowen ratio energy balance | Tule Lake, California | 2000 | Agricultural ET |
| Hostetler (2009) | One-dimensional surface energy balance | UKL | 1950–2006 | Open-water evaporation |
| Cuenca and others (2013) | METRIC | Wood River, Oregon | 2004 | Agricultural ET |
| Stannard and others (2013) | Eddy covariance (wetland) and Bowen ratio energy balance (lake) | UKL | 2008–10 | Open-water evaporation and wetland ET |
| Desert Research Institute (DRI) for Oregon Water Resources Department (Huntington and others, 2025) | Daily Lake Evaporation Model (DLEM) and Complementary Relationship Lake Evaporation (CRLE) model | Oregon | 1980–2021 | Open-water evaporation |
| DRI for Reclamation Klamath River Revised Natural Flow Study (in development) | eeMETRIC, ET demands, Beamer-Minor method | UKB | 1985–2020 | Agricultural, wetland, and phreatophyte ET |
| OpenET/DRI | Six remote sensing models plus ensemble | Western United States | 1985–present | Landscape ET |
| Reclamation/DRI | CRLE model | UKB | — | Open-water evaporation |
| Reclamation/DRI | DLEM | UKB | 1979–2020 | Open-water evaporation |
| U.S. Geological Survey | Operational Simplified Surface Energy Balance (SSEBop) | National | 2000–present | Landscape ET |
Table 2.4.
Summary of groundwater models and studies for the Upper Klamath Basin (UKB).[UKL, Upper Klamath Lake]
| Source | Type | Area | Period | Focus |
|---|---|---|---|---|
| Gannett and others (2012) | Modular Finite-Difference Groundwater Flow Model (MODFLOW) | UKB | 1970–2004 | Pumping response and optimization |
| Bailey and others (2016) | Soil and Water Assessment Tool (SWAT)-MODFLOW | Sprague River, Oregon | 1970–2003 | Surface-groundwater interactions |
| Essaid and others (2021) | One-dimensional flow and heat transport model; Two-dimensional flow model | UKL | 2013–17 (varies by analysis) | Groundwater and nutrient fluxes |
| U.S. Geological Survey (USGS) for Reclamation Klamath River Revised Natural Flow Study (in development) | MODFLOW | UKB | 1980–2020 | Historical scenario development |
| USGS for Oregon Water Resources Department (in development) | Precipitation-Runoff Modeling System (PRMS) | Oregon | 1980s–2020s | Groundwater recharge |
Table 2.5.
Summary of water-use datasets for the Upper Klamath Basin (UKB).[ET, evapotranspiration; HUC, Hydrologic Unit Code]
| Source | Approach | Area | Period | Focus |
|---|---|---|---|---|
| Brandt and others (2021) | Remote sensing | National | 2002–17 | Irrigation status of fields |
| Haynes and others (2023) | Irrigation area, type, efficiency datasets | National | 2000–20 | Agricultural withdrawals and efficiency by HUC-12 |
| Desert Research Institute for Oregon Water Resources Department (OWRD; Huntington and others, 2025) | OpenET, ETDemands | Oregon | 1985–22 | Agricultural ET and consumptive use by field |
| Luukkonen and others (2024) | Machine learning model | National | 2000–20 | Public-supply use by HUC-12 |
| Martin and others (2023) | Operational Simplified Surface Energy Balance (SSEBop) and integrated hydrologic model | National | 2000–20 | Agricultural ET and consumptive use by HUC-12 |
| IrrMapper | Random forest model | Western United States | 1986–2023 | Irrigation status of 30-meter pixels |
| OWRD Water Right Mapping Tool | Water rights | Oregon | Varied | Water rights |
| OWRD Water Use Query Tool | Reported use | Oregon | Varied | Water use by local/State/Federal entities and irrigation/special districts |
| Reclamation Klamath River Revised Natural Flow Study | Varies by use type | UKB | 1980–2020 | Water use |
| U.S. Geological Survey | Varies by State | State/national | 1950–2015 | Water use by type, county |
Table 2.6.
Summary of climate and nonstationarity studies for the Klamath Basin.[ET, evapotranspiration; TNI, Trans-Niño Index; UKB, Upper Klamath Basin; UKL, Upper Klamath Lake]
| Source | Area | Period | Key trends |
|---|---|---|---|
| Houston and others (2003) | Klamath Basin, Pacific Coast states | For water use: 1960–95 data, projections through 2050 | Global models show increasing air temperatures, potentially increasing precipitation and runoff in the Klamath River Basin; increasing use demands |
| Van Kirk and Naman (2008) | Scott River, California (Lower Klamath Basin) | 1942–2005 | Decreasing start-of-April snow water equivalent (SWE), baseflows at lower elevations |
| Kennedy and others (2009) | UKL | 1951–2004 | Correlation between October and December TNI, with April–September streamflow during warm phase of Pacific Decadal Oscillation: higher variability in TNI after 1976/1977 phase shift |
| Siegel (2009) | UKB | 1982–2008 | Increasing December temperatures, decreasing early year SWE, decreasing streamflow; greater changes in the eastern side of the basin |
| La Marche and others (2011) | UKL | Data through 2010 | Declining summer baseflows, groundwater levels around UKL, related to below-normal precipitation |
| Mayer and Naman (2011) | Klamath Basin, UKL | 1961–2009 | Decreasing UKL inflows, declining summer baseflows |
| Malevich and others (2013) | UKB | 1000–2011 | Drought cyclicities |
| Dettinger and others (2015) | Klamath Basin, western United States | 1900s–2070s | Increasing temperatures, ET, irrigation demands; unclear precipitation changes, potential increase; decreasing snowpack and summer streamflow |
| Gannett and Breen (2015) | UKB | 2000–14 | Increasing groundwater use, decreasing groundwater levels |
| Stern and others (2022) | Klamath Basin, California basins | 1981–2010 | Larger biases and interdataset spreads in gridded climate data for the Klamath River Basin, necessitating caution when used in hydrological models |
| Kennedy and others (2024) | Klamath Marsh, Oregon | 1985–2021 | Declining groundwater, streamflow, open-water extent; increasing temperature, ET |
References Cited
Bailey, R.T., Wible, T.C., Arabi, M., Records, R.M., and Ditty, J., 2016, Assessing regional-scale spatio-temporal patterns of groundwater-surface water interactions using a coupled SWAT-MODFLOW model: Hydrological Processes, v. 30, no. 23, p. 4420–4433, accessed July 26, 2024, at https://doi.org/10.1002/hyp.10933.
Bakke, P.D., Thomas, R., and Parrett, C., 1999, Estimation of long-term discharge statistics by regional adjustment: Journal of the American Water Resources Association, v. 35, no. 4, p. 911–921, accessed July 26, 2024, at https://doi.org/10.1111/j.1752-1688.1999.tb04184.x.
Bidlake, W.R., 2000, Evapotranspiration from a Bulrush-dominated wetland in the Klamath Basin, Oregon: Journal of the American Water Resources Association, v. 36, no. 6, p. 1309–1320, accessed July 29, 2024, at https://doi.org/10.1111/j.1752-1688.2000.tb05728.x.
Bidlake, W.R., 2002, Evapotranspiration from selected fallowed agricultural fields on the Tule Lake National Wildlife Refuge, California, during May to October 2000: U.S. Geological Survey Water-Resources Investigations Report 2002–4055, 59 p., accessed July 29, 2024, at https://doi.org/10.3133/wri024055.
Brandt, J.T., Caldwell, R.R., Haynes, J.V., Painter, J.A., and Read, A.L., 2021, Verified irrigated agricultural lands for the United States, 2002–17: U.S. Geological Survey data release, accessed September 26, 2024, at https://doi.org/10.5066/P9NAWU1U.
California Nevada River Forecast Center, 2025, California Nevada River Forecast Center: California Nevada River Forecast Center web page, accessed February 7, 2025, at https://www.cnrfc.noaa.gov/ensembleProduct.php?id=KLAO3&prodID=9.
Cooper, R.M., 2002, Determining surface water availability in Oregon: State of Oregon Water Resources Department Open File Report SW 02-002, 157 p., accessed February 26, 2025, at https://www.oregon.gov/owrd/WRDPublications1/DeterminingSurfaceWaterAvailabilityInOregon.pdf.
Cuenca, R.H., Ciotti, S.P., and Hagimoto, Y., 2013, Application of landsat to evaluate effects of irrigation forbearance: Remote Sensing, v. 5, no. 8, p. 3776–3802, accessed July 29, 2024, at https://doi.org/10.3390/rs5083776.
Dettinger, M., Udall, B., and Georgakakos, A., 2015, Western water and climate change: Ecological Applications, v. 25, no. 8, p. 2069–2093, accessed July 26, 2024, at https://doi.org/10.1890/15-0938.1.
Essaid, H.I., Kuwabara, J.S., Corson-Dosch, N.T., Carter, J.L., and Topping, B.R., 2021, Evaluating the dynamics of groundwater, lakebed transport, nutrient inflow and algal blooms in Upper Klamath Lake, Oregon, USA: Science of the Total Environment, v. 765, accessed February 7, 2025, at https://doi.org/10.1016/j.scitotenv.2020.142768.
Gannett, M.W., Wagner, B.J., and Lite, K.E., Jr., 2012, Groundwater simulation and management models for the upper Klamath Basin, Oregon and California: U.S. Geological Survey Scientific Investigations Report 2012–5062, 92 p., accessed September 25, 2024, at https://doi.org/10.3133/sir20125062.
Gannett, M.W., and Breen, K.H., 2015, Groundwater levels, trends, and relations to pumping in the Bureau of Reclamation Klamath Project, Oregon and California: U.S. Geological Survey Open-File Report 2015–1145, 19 p., accessed February 7, 2025, at https://doi.org/10.3133/ofr20151145.
Hay, L.E., McCabe, G.J., Clark, M.P., and Risley, J.C., 2009, Reducing streamflow forecast uncertainty—Application and qualitative assessment of the upper Klamath River Basin, Oregon: Journal of the American Water Resources Association, v. 45, no. 3, p. 580–596, accessed July 26, 2024, at https://doi.org/10.1111/j.1752-1688.2009.00307.x.
Haynes, J.V., Read, A.L., Chan, A.Y., Martin, D.J., Regan, R.S., Henson, W.R., Niswonger, R.G., and Stewart, J.S., 2023, Monthly crop irrigation withdrawals and efficiencies by HUC12 watershed for years 2000–2020 within the conterminous United States (ver. 2.0, September 2024): U.S. Geological Survey data release, accessed September 26, 2024, at https://doi.org/10.5066/P9LGISUM.
Hess, G.W., and Stonewall, A.J., 2014, Comparison of historical streamflows to 2013 streamflows in the Williamson, Sprague, and Wood Rivers, Upper Klamath Lake Basin, Oregon: U.S. Geological Survey Open-File Report 2014–1128, 23 p., accessed July 26, 2024, at https://doi.org/10.3133/ofr20141128.
Hostetler, S.W., 2009, Use of models and observations to assess trends in the 1950–2005 water balance and climate of Upper Klamath Lake, Oregon: Water Resources Research, v. 45, no. 12, 14 p., accessed July 29, 2024, at https://doi.org/10.1029/2008WR007295.
Houston, L.L., Watanabe, M., Kline, J.D., and Alig, R.J., 2003, Past and future water use in Pacific Coast states: Portland, Oreg., U.S. Department of Agriculture, Forest Service General Technical Report PNW-GTR-588, 37 p., accessed July 26, 2024, at https://doi.org/10.2737/PNW-GTR-588.
Hubbard, L.L., 1970, Water budget of Upper Klamath Lake, southwestern Oregon: U.S. Geological Survey Hydrologic Atlas 351, accessed July 29, 2024, at https://doi.org/10.3133/ha351.
Huntington, J., Minor, B., Bromley, M., Pearson, C., Beamer, J., Ingwersen, K., Carrara, K., Atkin, J., Brito, J., Morton, C., Dunkerly, C., Volk, J., and Ott, T., ReVelle, P., Fellows, A., and Hoskinson, M., 2025, Crop evapotranspiration, consumptive use, and open water evaporation for Oregon: Desert Research Institute and Oregon Water Resources Department, Publication no. 41306, 94 p., accessed February 26, 2025, at https://s3-us-west-2.amazonaws.com/webfiles.dri.edu/Labs/Huntington/owrd/Huntington_et_al_2025_DRI_Report_41306.pdf.
Kann, J., and Walker, W.W., Jr., 1999, Nutrient and hydrologic loading to Upper Klamath Lake, Oregon, 1991–1998: Ashland, Oreg., Aquatic Ecosystem Sciences LLC, 39 p., accessed July 29, 2024, at https://klamath-water-quality-app.s3-us-west-2.amazonaws.com/Kann%20and%20Walker1999.pdf.
Kennedy, A.M., Garen, D.C., and Koch, R.W., 2009, The association between climate teleconnection indices and Upper Klamath seasonal streamflow—Trans-Niño Index: Hydrological Processes, v. 23, no. 7, p. 973–984, accessed July 26, 2024, at https://doi.org/10.1002/hyp.7200.
Kennedy, J.J., Johnson, H.M., and Gingerich, S.B., 2024, Assessment of long-term changes in surface-water extent within Klamath Marsh, south-central Oregon, 1985–2021: U.S. Geological Survey Scientific Investigations Report 2024–5033, 32 p., accessed February 7, 2025, at https://doi.org/10.3133/sir20245033.
La Marche, J.L., Gates, E., and Lite Jr., K.E., 2011, Hydrologic monitoring and trends in the Upper Klamath Basin over the last decade—Oregon Water Conference, Corvallis, Oregon, May 24–25, 2011, PowerPoint Presentation: Oregon Water Conference, 30 slides. [Available at https://ir.library.oregonstate.edu/concern/conference_proceedings_or_journals/9k41zf34c.]
Luukkonen, C.L., Alzraiee, A.H., Larsen, J.D., Martin, D., Herbert, D.M., Buchwald, C.A., Houston, N.A., Valseth, K.J., Paulinski, S., Miller, L.D., Niswonger, R., Stewart, J.S., Dieter, C.A., and Miller, O.L., 2024, Public supply water use reanalysis for the 2000–2020 period by HUC12, month, and year for the conterminous United States (ver. 2.0, August 2024): U.S. Geological Survey data release, accessed September 26, 2024, at https://doi.org/10.5066/P9FUL880.
Madadgar, S., Moradkhani, H., and Garen, D., 2014, Towards improved post-processing of hydrologic forecast ensembles: Hydrological Processes, v. 28, no. 1, p. 104–122, accessed July 26, 2024, at https://doi.org/10.1002/hyp.9562.
Malevich, S.B., Woodhouse, C.A., and Meko, D.M., 2013, Tree-ring reconstructed hydroclimate of the Upper Klamath Basin: Journal of Hydrology, v. 495, p. 13–22, accessed July 26, 2024, at https://doi.org/10.1016/j.jhydrol.2013.04.048.
Martin, D.J., Regan, R.S., Haynes, J.V., Read, A.L., Henson, W.R., Stewart, J.S., Brandt, J.T., and Niswonger, R.G., 2023, Irrigation water use reanalysis for the 2000–20 period by HUC12, month, and year for the conterminous United States (ver. 2.0, September 2024): U.S. Geological Survey data release, accessed September 26, 2024, at https://doi.org/10.5066/P9YWR0OJ.
Mayer, T.D., and Naman, S.W., 2011, Streamflow response to climate as influenced by geology and elevation: Journal of the American Water Resources Association, v. 47, no. 4, p. 724–738, accessed July 26, 2024, at https://doi.org/10.1111/j.1752-1688.2011.00537.x.
Natural Resources Conservation Service, 2007, Statistical techniques used in the VIPER water supply forecasting software: Natural Resources Conservation Service Technical Note, 18 p., accessed August 12, 2025, at https://www.nrcs.usda.gov/sites/default/files/2023-02/Statistical%20Techniques%20Used%20in%20the%20VIPER%20Water%20Supply%20Forecasting%20Software%20- %20Technical%20Note_0.pdf.
Owens, J.M., Hagimoto, Y., and Cuenca, R.H., 2014, Hydrologic responses to irrigation management in the Wood River Basin, Klamath County, Oregon: American Society of Civil Engineers, p. 1896–1905, accessed July 29, 2024, at https://doi.org/10.1061/9780784413548.190.
Risley, J.C., 2019, Using the precipitation-runoff modeling system to predict seasonal water availability in the upper Klamath River basin, Oregon and California: U.S. Geological Survey Scientific Investigations Report 2019–5044, 37 p., accessed July 26, 2024, at https://doi.org/10.3133/sir20195044.
Risley, J., Stonewall, A.J., and Haluska, T., 2008, Estimating flow-duration and low-flow frequency statistics for unregulated streams in Oregon: U.S. Geological Survey Scientific Investigations Report 2008–5126, accessed April 11, 2025, at https://doi.org/10.3133/sir20085126.
Siegel, J., 2009, Examining monthly relationships between temperature, precipitation, snowpack, and streamflow in the Upper Klamath Basin over a 26 year SNOTEL record: Vassar University, 42 p., accessed May 12, 2026, at https://facultysites.vassar.edu/macunningham/past_theses/Jared_Siegel_2009_Thesis.pdf.
Stannard, D.I., Gannett, M.W., Polette, D.J., Cameron, J.M., Waibel, M.S., and Spears, J.M., 2013, Evapotranspiration from marsh and open-water sites at Upper Klamath Lake, Oregon, 2008–2010: U.S. Geological Survey Scientific Investigations Report 2013–5014, 65 p., accessed July 29, 2024, at https://doi.org/10.3133/sir20135014.
Stern, M.A., Flint, L.E., Flint, A.L., Boynton, R.M., Stewart, J.A.E., Wright, J.W., and Thorne, J.H., 2022, Selecting the optimal fine-scale historical climate data for assessing current and future hydrological conditions: Journal of Hydrometeorology, v. 23, p. 293–308, accessed July 26, 2024, at https://doi.org/10.1175/JHM-D-21-0045.1.
Tang, Q., Rosenberg, E.A., and Lettenmaier, D.P., 2009, Use of satellite data to assess the impacts of irrigation withdrawals on Upper Klamath Lake, Oregon: Hydrology and Earth System Sciences, v. 13, no. 5, p. 617–627, accessed July 29, 2024, at https://doi.org/10.5194/hess-13-617-2009.
Van Kirk, R.W., and Naman, S.W., 2008, Relative effects of climate and water use on base-flow trends in the Lower Klamath Basin: Journal of the American Water Resources Association, v. 44, no. 4, p. 1035–1052, accessed July 26, 2024, at https://doi.org/10.1111/j.1752-1688.2008.00212.x.
Walker, J.D., and Kann, J., 2022, Water and nutrient balances of Upper Klamath Lake, water years 1992–2018: Zenodo web page, accessed September 12, 2024, at https://doi.org/10.5281/ZENODO.6607800.
Wood, T.M., 2020, Use of boosted regression trees to quantify cumulative instream flow resulting from curtailment of irrigation in the Sprague River Basin, Oregon: U.S. Geological Survey Scientific Investigations Report 2019–5130, 25 p., accessed July 26, 2024, at https://doi.org/10.3133/sir20195130.
Appendix 3. Published Estimates of Upper Klamath Lake Water Balance
Table 3.1.
Published estimates of Upper Klamath Lake water balance.[Percentages may not sum exactly to 100 due to rounding and unit conversion. Difference between total inflows and outflows reflects change in storage. Kann and Walker (1999) and Walker and others (2012) are as summarized in Essaid and others (2021) supplementary tables [104]. “Other” inflows include small tributaries, runoff, and canals/drains. When non-evaporative outflow was reported by a source as a lumped term, it was assumed to represent combined Link River and A-Canal flows. Abbreviations: taf, thousand acre-feet; CY, calendar year; WY, water year; +, plus]
| Inflow or outflow | Source | ||||||
|---|---|---|---|---|---|---|---|
| Hubbard (1970) |
Hostetler (2009) |
Kann and Walker (1999) |
Walker and others (2012) |
Walker and others (2012) |
Essaid and others (2021) |
Oregon Water Resources Department (written commun., 2022)n |
|
| Period | |||||||
| WY 1965–67 |
CY 1950–2005 |
WY 1992–98 |
WY 1992–2010 |
WY 2002–10 |
WY 2013–15 |
CY 2021 |
|
| Williamson River | a913 (49) | a819 (50) | a743 (51) | a686 (50) | a610 (49) | a485 (44) | a380 (39) |
| Wood River | a292 (16) | a227 (14) | a238 (16) | a258 (19) | a270 (22) | a251 (23) | a242 (25) |
| Seeps/springs | b251 (14) | c,d268 (16) | b233 (16) | b226 (16) | b164 (13) | c,d,e,f,j229 (21) | c,j167 (17) |
| Other | a,g262 (14) | c203 (12) | c,g138 (9) | b120 (9) | b112 (9) | b,g29 (3) | a,b117 (12) |
| Precipitation | f128 (7) | h113 (7) | f102 (7) | f92 (7) | f86 (7) | f101 (9) | f76 (8) |
| Total inflow | 1,846 (100) | 1,630 (100) | 1,455 (100) | 1,382 (100) | 1,242 (100) | 1,096 (100) | 981 (100) |
| Link River + A-Canal | a1,532 (82) | a1,330 (81) | a1,232 (86) | a1,167 (85) | a1,030 (83) | a769 (72) | a622 (65) |
| Evaporation + wetland evapotranspiration (ET) | i,j292 (16) | k316 (19) | i,j202 (14) | i,j,k208 (15) | f,i,k208 (17) | l299 (28) | f,l321 (33) |
| Direct irrigation | a34 (2) | m0 (0) | m0 (0) | m0 (0) | m0 (0) | m0 (0) | n21 (2) |
| Total outflow | 1,824 (100) | 1,646 (100) | 1,434 (100) | 1,375 (100) | 1,238 (100) | 1,068 (100) | 964 (100) |
Based on Hubbard (1970).
Based on Perry and others (2005).
Weather station data (for example, Klamath Falls, Chiloquin, Agency Lake, Fourmile, and [or] Fort Klamath).
References Cited
Essaid, H.I., Kuwabara, J.S., Corson-Dosch, N.T., Carter, J.L., and Topping, B.R., 2021, Evaluating the dynamics of groundwater, lakebed transport, nutrient inflow and algal blooms in Upper Klamath Lake, Oregon, USA: Science of the Total Environment, v. 765, accessed February 7, 2025, at https://doi.org/10.1016/j.scitotenv.2020.142768.
Hostetler, S.W., 2009, Use of models and observations to assess trends in the 1950–2005 water balance and climate of Upper Klamath Lake, Oregon: Water Resources Research, v. 45, no. 12, 14 p., accessed July 29, 2024, at https://doi.org/10.1029/2008WR007295.
Hubbard, L.L., 1970, Water budget of Upper Klamath Lake, southwestern Oregon: U.S. Geological Survey Hydrologic Atlas 351, accessed July 29, 2024, at https://doi.org/10.3133/ha351.
Kann, J., and Walker, W.W., Jr., 1999, Nutrient and hydrologic loading to Upper Klamath Lake, Oregon, 1991–1998: Ashland, Oreg., Aquatic Ecosystem Sciences LLC, 39 p., accessed July 29, 2024, at https://klamath-water-quality-app.s3-us-west-2.amazonaws.com/Kann%20and%20Walker1999.pdf.
Perry, T., Lieb, A., Harrison, A., Spears, M., Mull, T., Cohen, E., Rasmussen, J., Hicks, J., Holz, D., and Lyons, J., 2005, Natural flow of the upper Klamath River: Western Waters Digital Library, 79 p., accessed October 8, 2024, at http://westernwaters.org/record/view/80340.
Walker, W.W., Walker, J.D., and Kann, J., 2012, Evaluation of water and nutrient balances for the Upper Klamath Lake Basin in water years 1992–2010: Aquatic Ecosystem Sciences LLC, 55 p., accessed April 11, 2025, at https://wwwalker.net/ukl/klamath_nutrientbudget_2012_final.pdf.
Conversion Factors
U.S. customary units to International System of Units
International System of Units to U.S. customary units
Temperature in degrees Celsius (°C) may be converted to degrees Fahrenheit (°F) as follows:
°F = (1.8 × °C) + 32.
Datums
Horizontal coordinate information is referenced to the North American Datum of 1983 (NAD 83).
Vertical coordinate information is referenced to the North American Vertical Datum of 1988 (NAVD 88).
Supplemental Information
A water year is the 12-month period from October 1 through September 30 of the following year and is designated by the calendar year in which it ends.
Groundwater transmissivity estimates are reported in square foot per day (ft2/day).
Abbreviations
AgriMet
Agricultural Weather Network
ALEXI
Atmosphere-Land Exchange Inverse
API
Application Programming Interface
ASCE
American Society of Civil Engineers
ASCE-PM
American Society of Civil Engineers Penman-Monteith equation
BiOp
Biological Opinion
BRT
Boosted Regression Tree
CIMIS
Spatial California Irrigation Management Information System
CNRFC
California Nevada River Forecast Center
CONUS
Contiguous United States
COOP
Cooperative Observer Program
CRLE
Complementary Relationship Lake Evaporation
DisALEXI
Disaggregation of the Atmosphere-Land Exchange Inverse
DLEM
Daily Lake Evaporation Model
DRI
Desert Research Institute
eeMETRIC
Google Earth Engine implementation of Mapping Evapotranspiration at High Resolution with Internalized Calibration
ENSO
El Niño-Southern Oscillation
ESP
Ensemble Streamflow Prediction
ET
evapotranspiration
Eta
actual evapotranspiration
ETf
ET fraction
geeSEBAL
Google Earth Engine implementation of the Surface Energy Balance Algorithm for Land
GridMET
Gridded Surface Meteorological dataset
GSODR
Global Surface Summary of the Day R
GWIS
Groundwater Information System
HUC
hydrologic unit code
KFLO
Klamath Falls station
KLAO3
Klamath Falls weather station
m4
multi-model machine-learning metasystem
MAE
mean absolute error
MBE
mean bias error
METRIC
Mapping Evapotranspiration at High Resolution with Internalized Calibration
MODFLOW
Modular Finite-Difference Groundwater Flow Model
MODIS
Moderate Resolution Imaging Spectroradiometer
NCEI
National Centers for Environmental Information
NFS
Revised Klamath River Basin Natural Flow Study
NGWMN
National Groundwater Monitoring Network
NIWR
net irrigation water requirement
NLDAS
North American Land Data Assimilation System
NMFS
National Marine Fisheries Service
NOAA
National Oceanic and Atmospheric Administration
NOHRSC
NOAA’s National Operational Hydrologic Remote Sensing Center
NRCS
Natural Resources Conservation Service
NSM
NOHRSC Snow Model
NWIS
U.S. Geological Survey National Water Information System
OWRD
Oregon Water Resources Department
PIG
Pressure Index from Geopotential Heights
PDO
Pacific Decadal Oscillation
POR
period of record
PRISM
Parameter-elevation Regressions on Independent Slopes Model
PRMS
Precipitation-Runoff Modeling System
PT-JPL
Priestley-Taylor Jet Propulsion Laboratory model
r2
coefficient of determination
RAR
regional adjustment relationship
Reclamation
Bureau of Reclamation
RMSE
root-mean squared error
SDPS
southern distinct population segment
SEB
surface energy balance
SIMS
Satellite Irrigation Management Support
SNODAS
SNOw Data Assimilation System
SONCC
Southern Oregon/Northern California Coast
SNOTEL
Snow Telemetry Network
SSEBop
Operational Simplified Surface Energy Balance
SWANN
Snow Water Artificial Neural Network Modeling System
SWAT
Soil and Water Assessment Tool
SWE
snow water equivalent
TNI
Trans-Niño Index
UKB
Upper Klamath Basin
UKBGFM
Upper Klamath Basin Groundwater Flow Model
USGS
U.S. Geological Survey
USFWS
U.S. Fish and Wildlife Service
VHG
vertical hydraulic gradient
WDFN
Water Data for the Nation
WUDR
Water-Use Data and Research Program
For more information about this publication, contact:
Director, Oregon Water Science Center
U.S. Geological Survey
601 SW 2nd Avenue, Suite 1950
Portland, OR 97204
For additional information, visit:
https://www.usgs.gov/centers/oregon-water-science-center
Publishing support provided by the USGS Science Publishing Network,
Sacramento Publishing Service Center
Disclaimers
Any use of trade, firm, or product names is for descriptive purposes only and does not imply endorsement by the U.S. Government.
Although this information product, for the most part, is in the public domain, it also may contain copyrighted materials as noted in the text. Permission to reproduce copyrighted items must be secured from the copyright owner.
Suggested Citation
Stonewall, A.J., Harden, T.M., Reale, J.K., and Cameron, C.R., 2026, Assessing the state of hydrologic science in the Upper Klamath Basin—A comprehensive review of data, tools, and models: U.S. Geological Survey Scientific Investigations Report 2026–5139, 56 p., https://doi.org/10.3133/sir20265139.
ISSN: 2328-0328 (online)
| Publication type | Report |
|---|---|
| Publication Subtype | USGS Numbered Series |
| Title | Assessing the state of hydrologic science in the Upper Klamath Basin—A comprehensive review of data, tools, and models |
| Series title | Scientific Investigations Report |
| Series number | 2026-5139 |
| DOI | 10.3133/sir20265139 |
| Publication Date | June 16, 2026 |
| Year Published | 2026 |
| Language | English |
| Publisher | U.S. Geological Survey |
| Publisher location | Reston, VA |
| Contributing office(s) | Oregon Water Science Center |
| Description | Report: ix, 56 p. |
| Online Only (Y/N) | Y |
| Additional Online Files (Y/N) | N |