

Analyses of Meteorological and Hydrological Records Support Tribal Members’ Accounts of Changing Climate on the Fort Apache Reservation, East–Central Arizona
Links
- Document: Report (24.7 MB pdf) , HTML , XML
- Data Release: USGS data release - U.S. Historical Climatology Network version 2.5 dataset for station Whiteriver 1 SW, Arizona, from 1873 to 2024, used in Analysis of Meteorological and Hydrological Records Support Tribal Members’ Accounts of Changing Climate on the Fort Apache Reservation, east–central Arizona
- NGMDB Index Page: National Geologic Map Database Index Page (html)
- Download citation as: RIS | Dublin Core
Acknowledgments
The author extends his appreciation to the White Mountain Apache Tribe of the Fort Apache Reservation, Arizona, Water Resources Program for their cooperation and support of this study.
Abstract
The Fort Apache Reservation in east–central Arizona, home to the White Mountain Apache Tribe of the Fort Apache Reservation, Arizona, contains several climate zones because of the large variation in surface elevation within the reservation. This study was carried out in cooperation with the White Mountain Apache Tribe of the Fort Apache Reservation, Arizona, to raise awareness of how the changing climate affects the Fort Apache Reservation. This report documents the evaluation of existing multidecadal meteorological and hydrological datasets for the Fort Apache Reservation, used to evaluate the effects of a changing climate on the reservation. In this evaluation, near-surface air temperature, snow depth, snow water equivalent, precipitation, and streamflow datasets were analyzed for monotonic trends indicative of changing climatic conditions during specified periods of time. The results of these trend analyses were then compared with the Tribal community's memories of the changing climate.
Trend analysis of near-surface air temperatures from a U.S. Historical Climatological Network station on the Fort Apache Reservation at Whiteriver, Arizona, indicated that mean annual air temperatures have increased by an average of 2.48 degrees Fahrenheit from 1980 to 2023. Records from the same station also indicated that average monthly maximum temperatures recorded for March increased by 5.39 degrees Fahrenheit for the same time period.
Annual precipitation at the five precipitation stations used in this study decreased greatly from the 1980s to 2023. The largest total decrease was 10.07 inches, or 34.7 percent. However, only one of the two precipitation stations with longer term data available prior to 1980 had a significant negative trend when data from the entire period of record, from 1901 to 2023, were analyzed.
Trend analyses show a decrease in the annual maximum snow water equivalent and an earlier disappearance of the snowpack at two Natural Resources Conservation Service snow telemetry stations in the mountainous region just east of the Fort Apache Reservation from 1981 to 2023. Based on the trend analyses, the average annual maximum snow water equivalent has decreased by more than 40 percent at both stations, and the average date when the snowpack was fully melted at the stations in the spring has moved earlier in time from late April to early April or late March. However, a statistically significant trend was not determined for the early April snow water equivalent measured at a nearby Natural Resources Conservation Service snow course across its period of record, indicating that the history of mountain snowpack in this area is not fully understood. Analysis of snowfall data from a National Oceanic and Atmospheric Administration Cooperative Observer Program network station on the Fort Apache Reservation at McNary 2N, AZ (station 025412) indicated that, on average, the measured total annual snowfall at the station decreased 42.4 percent from 1935 to 2023.
Streamflow data from six U.S. Geological Survey streamgages on the Fort Apache Reservation were analyzed for trends. For most streamflow gages, statistically significant trends were not determined for tested parameters when the entire streamflow period of record was used for stations with records going back to at least the 1960s. However, when the data from 1980 to 2023 was tested, most of the streamflow parameters had statistically significant negative trends. All six streamgages showed a decrease in average annual runoff of at least 50 percent from 1980 to 2023; one streamgage showed an 81.8 percent decrease.
A similar statistical finding was observed in the analysis of the annual spring snowmelt peak from one of the six streamgages used in the study and located in an area receiving measurable amounts of snowmelt runoff. When data from the entire period of record (1958–2023) was used, no trend in streamflow was determined; however, a significant negative trend was determined from 1980 to 2023, indicating a decrease in average annual springtime runoff of 62.6 percent. Statistical analysis on the timing of the annual spring snowmelt peak at the same streamgage indicated the snowmelt peak is happening on average about 12 days earlier now (2023) than it did in the past. The trend results for the timing of the annual spring snowmelt peak were the same and statistically significant for both periods tested (1958–2023 and 1980–2023). Two of the streamflow records from the Fort Apache Reservation were compared to the Palmer Hydrological Drought Index computed for Arizona Climate Division 4 (East Central) by the National Centers for Environmental Information. The comparison showed that the streamflow records generally tracked the Palmer Hydrological Drought Index.
In interviews, Tribal community members living on the Fort Apache Reservation described the changes in climate that they observed during their lifetimes. Common themes reported were that air temperatures have become warmer, and the weather is less predictable with changes in seasonal patterns. Drier conditions, lower snowfall, shorter winters, and lower river levels were also reported. These community member observations align with the results of this study.
Introduction
The Fort Apache Reservation spans more than 2,600 square miles (mi2) in east–central Arizona and is home to the White Mountain Apache Tribe of the Fort Apache Reservation, Arizona (fig. 1). The reservation contains a diverse landscape in part because it lies partially within the “Transition Zone,” a physiographic province in central Arizona (Spencer and Reynolds, 1989). This zone serves as a transitional boundary between the mostly flat-lying or slightly dipping layered sedimentary rocks of the Colorado Plateau Physiographic Province to the northeast and the heavily faulted, folded, and eroded Basin and Range Physiographic Province to the west and south (fig. 2; Fenneman, 1931). The eastern part of the reservation is in the White Mountains, which, although considered part of the Colorado Plateau, are nonetheless rugged with high alpine peaks, further adding to this diverse landscape (fig. 1).
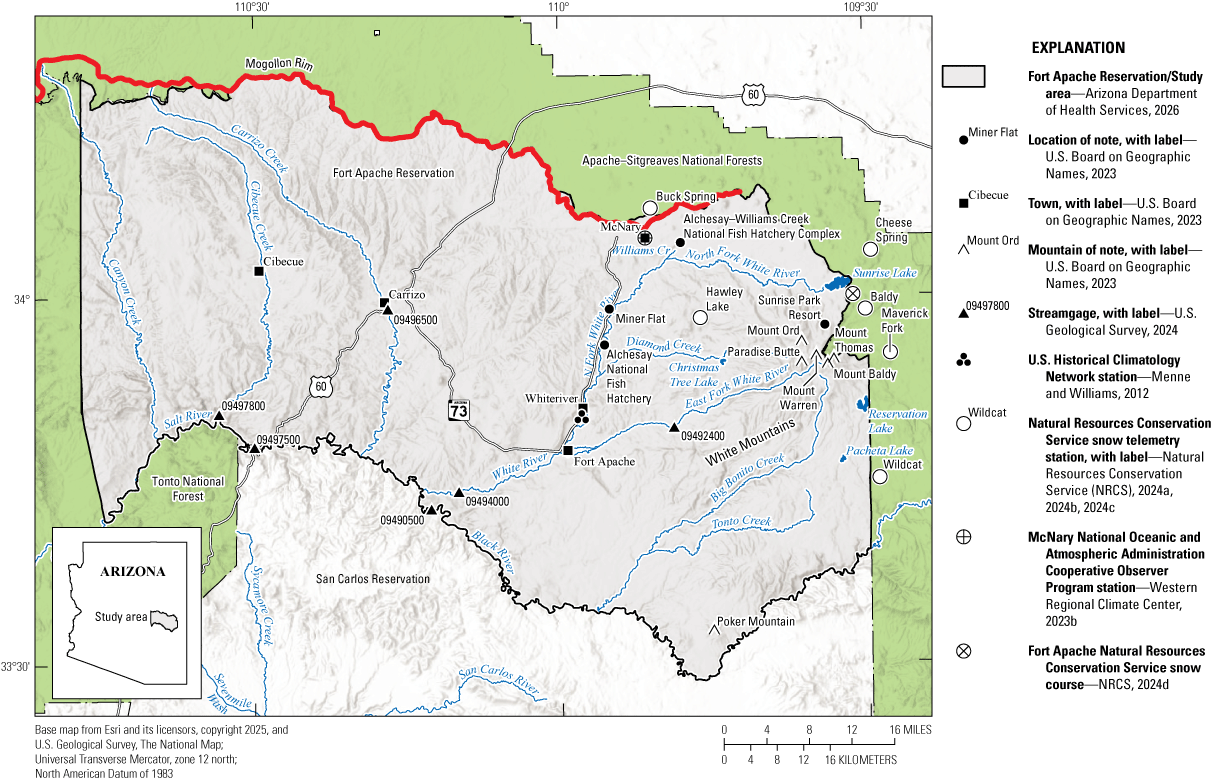
Map showing Fort Apache Reservation study area, Arizona.
According to Gonzalez and others (2018, p. 1121), “Traditional foods, natural resource-based livelihoods, cultural resources, and spiritual well-being of Indigenous peoples in the Southwest are increasingly affected by drought, wildfire, and changing ocean conditions.” In 2017, Gauer (2019) interviewed members of the White Mountain Apache Tribe of the Fort Apache Reservation, Arizona, about their experiences with climate change and their ability to adapt. The results from these interviews indicated that Tribal members were experiencing increases in extreme weather events, changes in water quantity and quality, reductions in long-term water and food security, and reduced access to traditional resources and practices. In an effort to quantify the meteorological and hydrological effects of climate change experienced on the Fort Apache Reservation, the U.S. Geological Survey (USGS) in cooperation with the White Mountain Apache Tribe of the Fort Apache Reservation, Arizona, completed a study to analyze available long-term meteorological and hydrological datasets. Trend analyses were performed on the datasets to test if statistically significant changes had occurred in the meteorological and hydrological parameters recorded through the time periods available. The longest record assessed went from 1901 to 2023; in contrast, the shortest record assessed went from 1985 to 2023. The datasets used included near-surface air temperature and precipitation records from a National Centers for Environmental Information (NCEI) U.S. Historical Climatology Network (USHCN) station, precipitation data from three Natural Resources Conservation Service (NRCS) snow telemetry (SNOTEL) stations, snow water equivalent (SWE) data from two of the SNOTEL stations and one NRCS snow course, snow depth and precipitation records from a National Oceanic and Atmospheric Administration (NOAA) Cooperative Observer Program (COOP) network station, and streamflow data from six USGS streamgages. Additionally, the Palmer Hydrological Drought Index (PHDI) computed for Arizona Climate Division 4 (East Central) by the NCEI was used.
The results of this study are discussed in terms of “climate change.” This report interprets climate change based on 30-year (or more) averages of weather and hydrological changes in the Fort Apache Reservation region. The trends identified in this report may be part of natural climatic oscillations, such as the El Niño-Southern Oscillation, and not part of long-term climate change. However, the change in climate during the lifetime of the current population living on the Fort Apache Reservation is relevant for that population, regardless of the cause.
Purpose and Scope
This report describes the compilation and evaluation of existing long-term meteorological and hydrological datasets for the Fort Apache Reservation. Datasets including near-surface air temperature, SWE, snow depth, annual and monthly precipitation, and streamflow were evaluated for possible statistical trends. Although no new data were collected as part of this effort, new analyses of existing data were performed. These analyses aimed to quantify the meteorological and hydrological effects of climate change experienced on the Fort Apache Reservation described by Gauer (2019) and Gauer and others (2021).
Previous Investigations
This study grew from previous work by Gauer (2019) and Gauer and others (2021). Gauer (2019) is a master’s thesis describing perceptions of climate change effects experienced by the Stó:lō Nation of British Columbia and the White Mountain Apache Tribe of the Fort Apache Reservation, Arizona, on the Fort Apache Reservation in Arizona. On the Fort Apache Reservation, Gauer (2019) interviewed board members and staff of the Fort Apache Heritage Foundation, key community members, and natural resources management staff about their perceptions of climate change. Gauer (2019) also developed recommendations for helping these communities adapt to climate change. Gauer and others (2021) is a scholarly article based on the work of Gauer (2019).
Baldys and Bayles (1990) described basin and climatic characteristics at streamgages, analyzed data from streamgages, and an analysis to assess the stationarity of streamflow and precipitation patterns at selected sites for the Fort Apache and San Carlos Reservations in east–central Arizona. They also provided selected estimates of mean annual streamflow at streamgages for the base period from 1930 to 1986 and described results and methods for estimating mean annual streamflow at ungaged sites.
The USGS has operated several streamgages on the Fort Apache Reservation. Data from these streamgages are available from the USGS National Water Information System (NWIS) database (U.S. Geological Survey, 2024).
Description of Study Area
The study area consists of the Fort Apache Reservation. However, some data sources used in the investigation came from adjacent areas within a few miles of the reservation boundary.
Physiography and Vegetation
The physiographic regions of Arizona are illustrated in figure 2. Most of northern Arizona lies within the Colorado Plateau, characterized by high elevation and mostly flat-lying or slightly dipping layered sedimentary rocks. In contrast, southern and far western Arizona fall within the generally lower elevation Basin and Range, characterized by a heavily faulted, folded, and eroded landscape. Between these two physiographic provinces is a topographically rugged area known as the Transition Zone (fig. 2; Spencer and Reynolds, 1989). Also referred to as the Central Arizona Highlands, the Transition Zone makes up about 15 percent of Arizona’s total land area but contributes about 50 percent of the streamflow originating within the State (Montgomery and Harshbarger, 1989). The Fort Apache Reservation straddles the boundary between the Transition Zone and the Colorado Plateau Physiographic Province (fig. 2). The western part of the reservation, within the Transition Zone, is characterized by heavily eroded, sloping terrain with deep canyons and stream valleys. The eastern part of the reservation, within the Colorado Plateau, is also rugged—despite the Colorado Plateau’s typical flat-lying sedimentary rocks—because this area is overlain by the eroded remnants of a volcanic field.
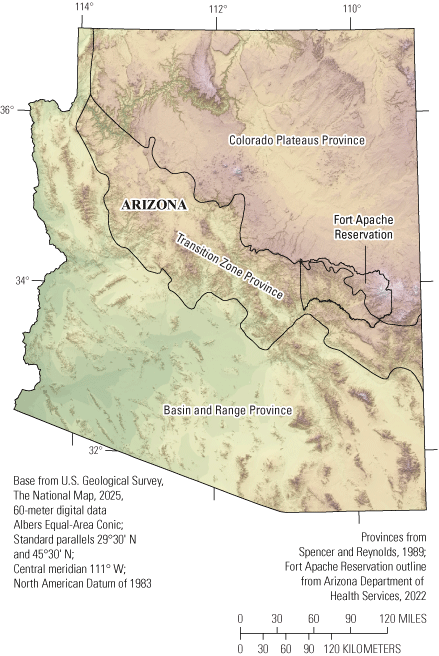
Physiographic map of Arizona showing the location of the Fort Apache Reservation, Arizona.
A large escarpment called the Mogollon Rim and the Apache-Sitgreaves National Forests form much of the northern boundary of the Fort Apache Reservation (fig. 1). Where the Mogollon Rim is present, it forms the boundary between the Colorado Plateau Province and the Transition Zone. The Fort Apache Reservation borders the Apache-Sitgreaves National Forests to the northeast and east within part of the White Mountains (fig. 1). The White Mountains are the erosional remnants of a volcanic field that was actively erupting lava, volcanic cinders, and volcanic ash between 9 and 2 million years ago (Bezy and Trevena, 2003). The largest feature in the volcanic field is Mount Baldy, the erosional remnant of a large stratovolcano (Bezy and Trevena, 2003). The summit of Mount Baldy (Baldy Peak) at 11,422 feet (ft; USGS, 2025), is the highest point in the White Mountains and on the Fort Apache Reservation (fig. 1). The Salt and Black Rivers form the southern boundary of the Fort Apache Reservation and separate it from the adjoining San Carlos Reservation (fig. 1). The Tonto National Forest forms the western boundary of the reservation (fig. 1).
The topography of the Fort Apache Reservation is diverse, featuring elevations that range from 11,422 ft at the summit of Mount Baldy (Baldy Peak) near the reservation’s eastern boundary, down to about 2,600 ft along the Salt River where it leaves the reservation to the west (USGS, 2025; fig. 1). The headwaters of several substantial streams are entirely or partially within the Fort Apache Reservation. These streams include the Black, White, and Salt Rivers, and Carrizo, Cibecue, and Canyon Creeks (fig. 1). Numerous smaller tributaries to these streams are also present on the Fort Apache Reservation (fig. 1).
Moore (1968) identified four physiographic subprovinces within the Fort Apache Reservation (fig. 3). These four subprovinces are characterized below based on the descriptions from Moore (1968) and by using the Landscape Fire and Resource Management Planning Tools (LANDFIRE) to identify vegetation types for the subprovinces (LANDFIRE, 2024).
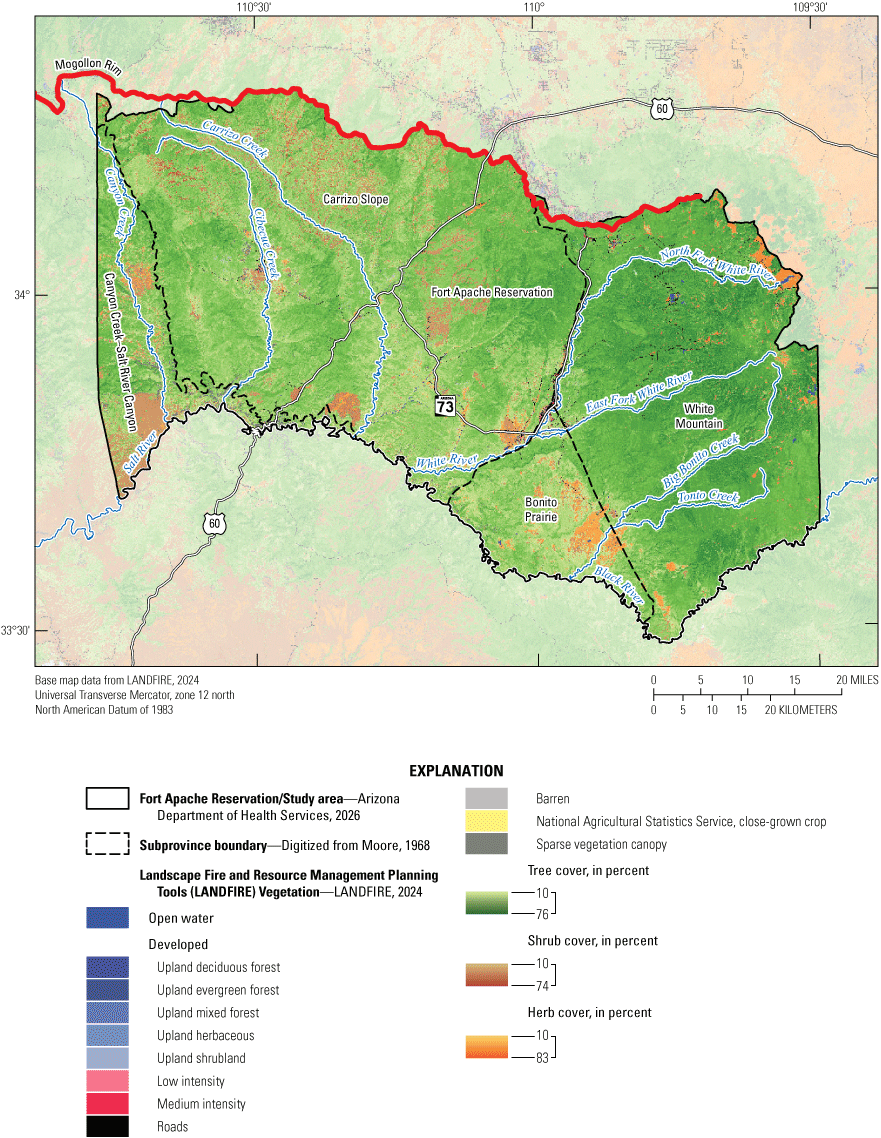
Map showing physiographic subprovinces and vegetation cover, Fort Apache Reservation, Arizona. Modified from Moore (1968). Landscape Fire and Resource Management Planning Tools (LANDFIRE).
Moore (1968) called the deep canyons of the Salt River, Canyon Creek, and lower parts of their tributary canyons, at the west and southwest edges of the reservation, the Canyon Creek–Salt River Subprovince (fig. 3). Within the canyons, the main vegetation types are cacti and scrub—narrow bands of riparian areas parallel streams where water is sufficient. The main vegetation types in the uplands above the canyons are woodlands containing pinyon, juniper, and oak trees (LANDFIRE, 2024).
East of the Canyon Creek–Salt River Subprovince, Moore (1968) identified an area extending east to Highway 73 and the White River, which he called the Carrizo Slope Subprovince (fig. 3). He described this area as a south-southwest-facing slope that has been incised into a badlands topography. The dominant vegetation types in this area are woodlands containing pinyon, juniper, ponderosa, and oak trees. Grasslands are also present to a lesser extent, and riparian areas parallel streams where water is sufficient (LANDFIRE, 2024).
Moore (1968) referred to the area containing large volumes of volcanic rock in the form of lava flows and pyroclastic material that were extruded and piled up to form mountains east of Highway 73 and bounded by a line from Fort Apache to Poker Mountain, as the White Mountain Subprovince. The dominant vegetation types in this subprovince are subalpine spruce-fir forest and woodland, upper montane conifer-oak forest and woodland, Ponderosa pine woodland, aspen forest and woodland, and subalpine-montane mesic meadow (LANDFIRE, 2024).
The fourth subprovince identified by Moore (1968) is a roughly triangular-shaped area south of the White River called the Bonito Prairie Subprovince. The Black River forms its southern boundary. The Bonito Prairie Subprovince is a gently rolling plain floored by basalt flows (fig. 3). The dominant vegetation types in this area are pinyon-juniper woodland, semidesert grassland, juniper savanna, and warm desert lower montane riparian woodland (LANDFIRE, 2024).
Geology
This diversity of the landscape of the Fort Apache Reservation is due to the complex geologic history of the region. Although some rocks on the reservation date back to the Proterozoic, more recent geologic events probably have a greater impact on the present landscape. Two relatively recent geologic events that helped shape the current landscape of the Fort Apache Reservation are the nearby crustal extension that began in the Miocene, which formed the Basin and Range Physiographic Province south of the reservation, and the prolific volcanism in the region that started during the Miocene and ended in the Pleistocene (Bezy and Trevena, 2003; Merrill and Péwé, 1977).
The oldest rock formations that are present at or near the surface on the reservation are Proterozoic in age (Richard and others, 2000). The rocks, which have been heavily metamorphosed, faulted, and folded, are present in the Canyon Creek–Salt River Canyon area of the reservation. Moore (1968) postulated that even though these rocks are exposed only in this area of the reservation, similar rocks are presumed to underlie the entire reservation. Proterozoic rock types present include intrusive and extrusive igneous rocks, sedimentary rocks, and metamorphic rocks.
The surficial geology of the Carrizo Slope area of the reservation consists primarily of dissected sedimentary rocks ranging in age from Paleozoic to Cenozoic (Richard and others, 2000). The slope forms a connection between the higher Colorado Plateau Province to the north and the Salt River at the southern boundary of the Fort Apache Reservation. The slope likely began to form during the Miocene in response to faulting and eroding associated with the Basin and Range Province’s crustal extension. The top of the slope is marked by the Mogollon Rim, which is the southern edge of the Colorado Plateau Physiographic Province.
For this report, the physiographic subprovince called the “White Mountain Area” in Moore (1968) is used to delineate the boundaries of the White Mountains. However, the boundaries of the White Mountains tend to be variable depending on the source referenced. The geologic report describing the White Mountains by Merrill and Péwé (1977) limits their extent to the area covered by Mount Baldy. Likewise, the U.S. Board on Geographic Names (2023) limits its extent to the Mount Baldy area, as does the map of physiographic areas in Arizona by Trapp and Reynolds (1995). However, the extent of the White Mountains on some U.S. Forest Service maps has a considerably larger area, including Mount Baldy and large adjacent areas.
Mount Baldy is a large stratovolcano that erupted predominantly between 9 and 2 million years ago, although earlier volcanic activity in the area dates back to the Eocene and Oligocene (Merrill and Péwé, 1977). Despite being heavily eroded, Mount Baldy is still the highest feature in the region; Baldy Peak reaches an elevation of 11,422 ft. Several other features near Baldy Peak also have elevations above 11,000 ft, including Mount Ord, Mount Warren, Mount Thomas, and Paradise Butte (fig. 1). Although these features have their own names, they are still part of a single stratovolcano which some geologists have unofficially called the “Mount Baldy Volcano” (Merrill and Péwé, 1977; Bezy and Trevena, 20034). Eruptions of this volcano were often explosive, blasting large amounts of volcanic ash into the atmosphere and periodically leading to ash-rich mud flows (lahars) that carried loose material from the slopes to the base of the volcano. No glaciers are in the White Mountains today, but glaciers were present on Mount Baldy during Pleistocene ice ages (Merrill and Péwé, 1977).
The Bonito Prairie Subprovince is relatively flat, topographically, compared to the rest of the reservation. The flat terrain is mainly formed by lava flows that have experienced less erosion than other reservation areas. Based on adjacent mapping by Wrucke and others (2004), the rock units at or near the surface in this area appear to be primarily Miocene lava flows. Moore (1968) reported that the volcanic rocks in this area overlie Paleozoic and Mesozoic sedimentary rocks.
Climate
The Fort Apache Reservation spans several climate zones because of its wide range of surface elevations. This report uses the Köppen climate classification system (Kottek and others, 2006) to describe the climate variability within the reservation. Based on empirical relationships between climate and vegetation, the Köppen system provides a way to describe climatic conditions defined by multiple variables and seasonality (Chen and Chen, 2013).
The Köppen climate classifications within the reservation boundary are illustrated in figure 4 using a 2.5-mile (4 kilometer) grid. These classifications are based on data computed by Godfrey (1999) for the conterminous United States, using gridded estimates of average precipitation, temperature, and elevation from the Parameter-elevation Regressions on Independent Slopes Model (PRISM; PRISM Climate Group, 1999). The averages for precipitation and temperature were estimated for the 30 years from 1961 to 1990. Five climate classifications—midlatitude steppe (BSk), interior Mediterranean (Csa), coastal Mediterranean (Csb), humid continental (Dsb), and continental subarctic (Dsc)—are shown in figure 4 and described in more detail below. Their distribution across the Fort Apache Reservation roughly parallels the elevation contours of the landscape.
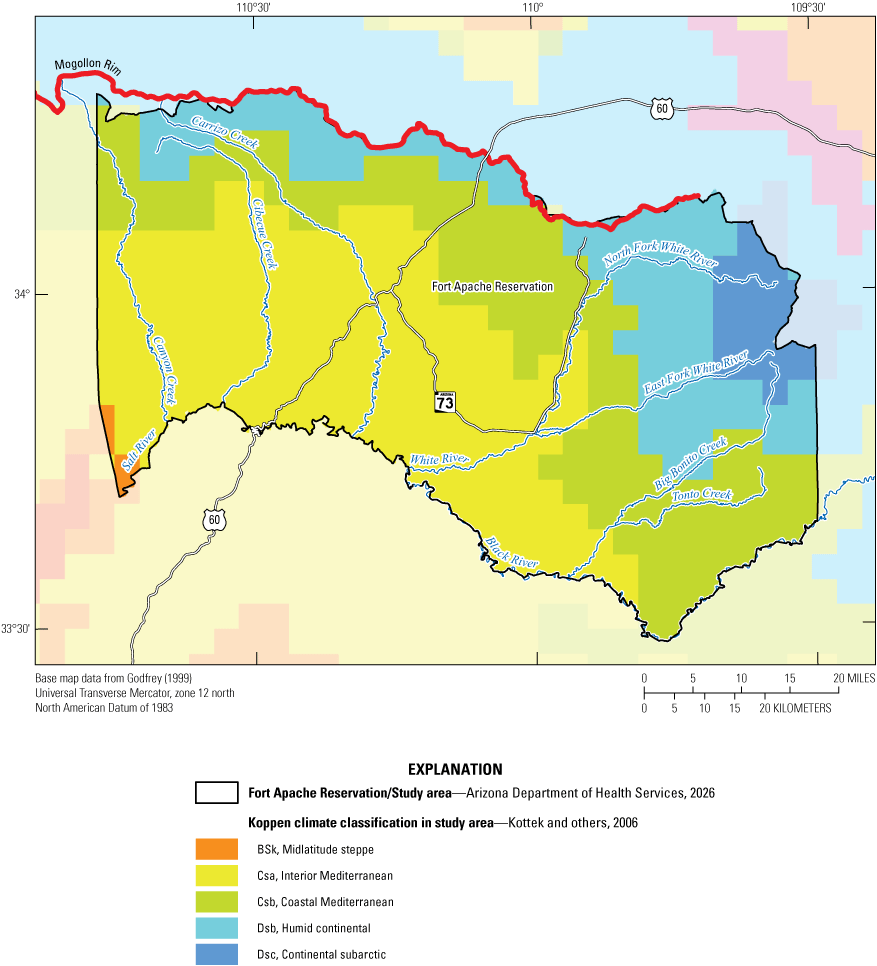
Köppen climate classifications map of Fort Apache Reservation, Arizona.
A small part of the southwestern corner of the Fort Apache Reservation with the lowest surface elevation is classified as midlatitude steppe (BSk), which represents a cold semiarid climate (fig. 4). The use of “cold” here means the annual average temperature is below 64 degrees Fahrenheit (°F). Semiarid implies the zone receives less precipitation than the potential for evapotranspiration but more precipitation than a desert climate (Critchfield, 1983).
The remaining part of the reservation’s southwestern area is classified as interior Mediterranean (Csa), which represents a hot-summer, Mediterranean-like climate (fig. 4). These zones typically experience hot, dry summers, in which the warmest month averages temperatures above 72 °F. Winters are milder and wetter; the wettest winter month receives about three times more precipitation than the driest summer month (Critchfield, 1983).
To the north and east of the Csa zone is an area that roughly forms a band classified as Csb for coastal Mediterranean (fig. 4). This Csb classification represents a warm-summer Mediterranean-like climate similar to the Csa classification except that monthly average summer temperatures remain below 72 °F (Critchfield, 1983). The Csb zone has higher elevations than the Csa zone along the slope below the Mogollon Rim and on the west side of the White Mountains (fig. 4), so lower temperatures are expected. The Csb classification also implies that at least three times as much precipitation falls in the wettest month of winter as in the driest month of summer (Critchfield, 1983).
Paralleling the Csb zone (fig. 4) to the north and east is the humid continental zone (Dsb). The Dsb classification represents a climate with dry cool summers, in which the average temperature of the warmest month is greater than 50 °F. In comparison, the average temperature of the coldest month is less than 32 °F. As with the Csa and Csb classifications, at least three times as much precipitation falls in the wettest month of winter as in the driest month of summer (Critchfield, 1983). Winters are severe with snowstorms, strong winds, and bitter cold. The Dsb zone is higher in elevation on the slope below the Mogollon Rim and on the west side of the White Mountains than the Csb zone (fig. 4).
The continental subarctic zone (Dsc) is the highest in elevation of all the Köppen climate regions on the Fort Apache Reservation, covering the highest parts of Mount Baldy in the northeast part of the reservation (fig. 4). A subarctic climate implies long, cold winters and warm to cool summers. The Dsc classification also implies that at least three times as much precipitation falls in the wettest month of winter as in the driest month of summer, and winters are severe with snowstorms, strong winds, and bitter cold (Critchfield, 1983).
Estimated temperature data available from the PRISM Climate Group (2023) indicated that the 30-year (1991–2020) mean annual temperatures on the Fort Apache Reservation varied, in degrees Fahrenheit, from the high 30s to mid-60s, depending on elevation (fig. 5A). The 30-year mean annual precipitation on the Fort Apache Reservation, according to the PRISM Climate Group (2023), varied from around 15 to 45 inches (in.), again largely depending on elevation (fig. 5B). Mean annual temperature and precipitation for the Fort Apache Reservation were estimated using spatial regression methods that incorporated data from traditional weather stations and high-altitude meteorological sites (Daly and others, 1994).
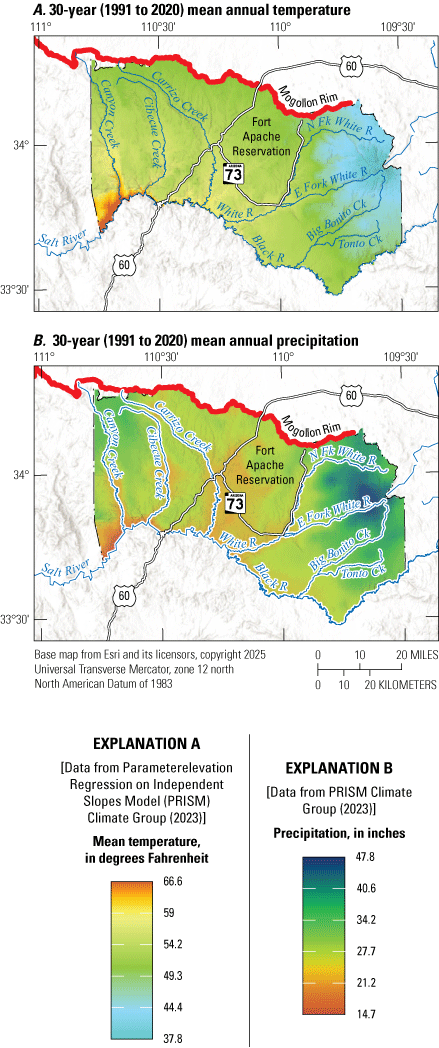
Maps showing mean annual temperature and precipitation within and near the Fort Apache Reservation, Arizona. A, 30-year (1991–2020) mean annual temperature. B, 30-year (1991–2020) mean annual precipitation. N, north; Fk, fork; Ck, creek; R, river; E, east.
Hydrology
As described in the “Physiography and Vegetation” and “Climate” sections, the topography of the reservation has considerable relief and is dominated by dendritic (branching) patterns of stream erosion (fig. 1). Much of that erosion is powered by the high elevations of the White Mountains and Mogollon Rim. About 8,800 ft of relief separates the highest reaches of the White Mountains from the point where the Salt River leaves the reservation (fig. 1). The straight-line distance between these features is only about 70 miles (mi), resulting in steep stream gradients. The elevation change between the point where the Salt River exits the reservation and the crest of the Mogollon Rim exceeds 4,000 ft across much of the reservation. Streams originating at higher elevations have dissected the terrain as they flow toward lower elevations.
The major streams on the reservation are the Salt River and its large tributaries, the White and Black Rivers. The Black River and its continuation as the Salt River form the boundary between the Fort Apache and San Carlos Reservations (fig. 1). The North Fork White River currently supplies municipal water to communities around Whiteriver through a centralized water system that also uses groundwater. A new rural water system is planned that will receive water from an 8,600 acre-feet (acre-ft) reservoir to be constructed on the North Fork White River about 10 mi north of Whiteriver (Bureau of Reclamation, 2022). The reservation is also crossed by many smaller tributary streams, including Big Bonito, Canyon, Carrizo, Cibecue, Diamond, and Tonto Creeks (fig. 1).
The clear, cool headwaters of the White and Black Rivers on the reservation provide critical habitat for Oncorhynchus apache (Miller, 1972; Apache trout), a species sacred to the White Mountain Apache Tribe of the Fort Apache Reservation, Arizona, and is the State fish of Arizona (U.S. Department of the Interior, 2024). The Apache trout is one of only two trout species native to the State (the other is Oncorhynchus gilae [Miller, 1950; Gila trout]). Originally listed as endangered under the Federal Endangered Species Preservation Act of 1966 (Public Law 89–669), the Apache trout later became federally protected with the passage of the Endangered Species Act in 1973 (16 U.S.C. 1531–1544). In 1975, the Apache trout was downlisted to threatened, and in 2024, delisted from the Federal list of endangered and threatened species—becoming the first American sportfish to achieve delisting (U.S. Fish and Wildlife Service, 2024a; 2024b). This remarkable recovery is due in large part to the management and conservation efforts of the White Mountain Apache Tribe of the Fort Apache Reservation, Arizona (U.S. Fish and Wildlife Service, 2024a; 2024b). Cool mountain streams are rare in Arizona, making the cold-water habitats on the Fort Apache Reservation critical for the continued long-term survival of the species in its native range.
The Williams Creek Unit of the Alchesay-Williams Creek National Fish Hatchery Complex at the head of Williams Creek on the Fort Apache Reservation (fig. 1) is the only facility in the Nation that has a captive breeding population of Apache trout. Other fish species produced at the Williams Creek Unit include brook, brown, and rainbow trout (U.S. Fish and Wildlife Service, 2024c). The hatchery is fed by large springs issuing from basalt flows that at times have a combined flow of about 1,800 gallons per minute. In recent years, flow from the springs has been lower than in the past. In 2022, flow rates reached their lowest levels since recordkeeping began in the 1960s. Additionally, in recent years, the Williams Creek Unit has found it challenging to meet the requirements of its National Pollutant Discharge Elimination System permit for the concentration of total phosphorus (Bradly Clarkson, U.S. Fish and Wildlife Service, oral commun., 2023).
The Alchesay National Fish Hatchery, about 7 mi north of Whiteriver, Arizona, along the North Fork White River (fig. 1), is the other unit of the Alchesay-Williams Creek National Fish Hatchery Complex. Water for this hatchery comes from the North Fork White River. Large springs issuing from Paleozoic sedimentary rocks on the east side of the river, less than a mile upstream from the hatchery, contribute to the streamflow. The Alchesay facility serves as a “grow-out rearing unit” for brown and rainbow trout fingerlings that are transferred from the Williams Creek facility. Fish from the Alchesay National Fish Hatchery are used to stock Tribal reservoirs, lakes, and rivers annually across the southwest.
Many natural springs emerge on the Fort Apache Reservation, in addition to the large springs previously mentioned in association with the Alchesay-Williams Creek National Fish Hatchery Complex. The density of springs is especially high on and below the Mogollon Rim and in the White Mountains area (fig. 3). These springs provide critical habitat for vegetation and wildlife.
The Fort Apache Reservation has numerous lakes, providing habitat for aquatic and other species as well as recreation for Tribal members and guests. Some of the larger lakes are Hawley Lake, Sunrise Lake, Reservation Lake, Pacheta Lake, and Christmas Tree Lake (fig. 1). Fishing permits and camping and lodging fees are important sources of revenue for the White Mountain Apache Tribe of the Fort Apache Reservation, Arizona (Javis Davis and Emery Hoffman, White Mountain Apache Tribe of the Fort Apache Reservation, Arizona, Water Resources Program, oral commun., 2023).
Groundwater is not widely used across the Fort Apache Reservation, even though geologic maps (Wilson and others, 1959; Finnell, 1966a, b; McKay, 1972; Skotnicki, 2002) indicate that Paleozoic formations, which are typically good aquifers where present in Arizona, are found under much of the reservation. Additionally, Merrill and Péwé (1977) suggested the pre-Oligocene stratigraphy of the White Mountains likely contains Paleozoic and Mesozoic formations in at least some areas under the younger volcanic deposits.
The largest use of groundwater on the reservation is for the centralized water system that supplies water to Whiteriver and surrounding communities (Javis Davis, White Mountain Apache Tribe of the Fort Apache Reservation, Arizona, Water Resources Program, oral commun., 2024). Water for this system comes from surface water from the North Fork White River and by groundwater from a wellfield on Miner Flat approximately 11 mi north of Whiteriver. The wells in the Miner Flat wellfield draw water from the regional Coconino aquifer. Although the Coconino aquifer is a large regional aquifer, Kaczmarek (2002) reported drawdown and depletion in the Miner Flat area was caused by over pumping required to meet the water demands of the local population. Although wellfield production rates have continued to decline, groundwater from Miner Flat continues to be an important source of water for the Tribe’s centralized water system and is planned to be part of the new rural water system currently under development (Bureau of Reclamation, 2022).
Additional groundwater uses include supplying water for the communities of Carrizo and Cibecue through wells installed in stream alluvium and partially in rocks of the lower part of the Supai Group (Kaczmarek, 2015). The Sunrise Park Resort in the White Mountains uses groundwater from wells completed in volcanic rock. Several wells equipped with solar pumps are used for stock watering; however, many of these wells are now dry or go dry for at least part of the year (Javis Davis and Emery Hoffman, White Mountain Apache Tribe of the Fort Apache Reservation, Arizona, Water Resources Program, oral commun., 2024).
Data Sources and Methods of Analysis
This study used existing multidecadal meteorological and hydrological datasets to quantify the hydrologic ramifications of climate change on the Fort Apache Reservation. These results were subsequently evaluated alongside the lived experiences and climate-related observations shared by Tribal community members.
Analysis of Long-Term Meteorological and Hydrological Datasets
Several long-term meteorological and hydrological datasets for the Fort Apache Reservation area were identified for trend analyses. The meteorological datasets used include near-surface air temperature and precipitation records from a station in the NCEI USHCN, precipitation records from three NRCS SNOTEL network stations, SWE from two NRCS SNOTEL network stations and one NRCS snow course station, and precipitation and snowfall records from a NOAA COOP network station (table 1). The hydrological datasets used include records of mean daily streamflow from six USGS streamgages on the Fort Apache Reservation (table 1). In addition, the statewide PHDI computed by NCEI (2024) for Arizona Climate Division 4 (East Central) is compared to selected streamflow records.
Time-series analysis for monotonic trends (one direction, either increasing or decreasing) was performed using the nonparametric Mann-Kendall trend test (Mann, 1945; Kendall, 1975; Helsel and others, 2020). This rank-based test determines not only the statistical significance of a monotonic trend in a measured attribute, but also the direction of the change. The Mann-Kendall trend test is not affected by extreme values or outliers and does not require the data to be normally distributed. Time-series data are often autocorrelated because adjacent days can have more similar values than days further apart in time. For this reason, the significance of trends was determined by calculating an adjusted p-value (p) using a Mann-Kendall trend test modified for autocorrelated data by employing the Zhang method of data pre-whitening using the Zyp R package (Zhang and others, 2000; Bronaugh and others, 2023) when autocorrelation was detected in a dataset.
Depending on the application, the Mann-Kendall test was performed using one of several R packages: the Kendall (Hipel and McLeod, 1994; McLeod, 2022), Exploration and Graphics for River Trends (EGRET) (Hirsch and De Cicco, 2015), or the Seasonal and Regional Kendall Tests (RKT) (Marchetto, 2024). Streamflow records analyzed using the EGRET R package had a modified locally weighted scatterplot smoothing (LOWESS) trend line applied to log-transformed data (Hirsch and De Cicco, 2015; Hirsch and others, 2023). All other records were analyzed using a Theil-Sen line and slope estimate (Helsel and others, 2020) using the Nondetects and Data Analysis for environmental data (NADA) R package (Lee, 2020). This included streamflow data that were analyzed for seasonal effects from snowmelt. The Theil-Sen line, closely related to Kendall’s tau, was computed for monthly and annual statistics by comparing each data pair to all others in a pairwise fashion. The median of all pairwise slopes served as the nonparametric Theil-Sen slope estimate. The significance test for the Theil-Sen slope estimate is identical to the test for Kendall’s tau, and the estimated slope always has the same sign as Kendall’s tau (Helsel and others, 2020). The Theil-Sen slope estimate was used to calculate the average change in meteorological or hydrological parameters through time of the various time-series datasets used in this study. The Kendall, EGRET, RKT, and NADA R packages were executed using R Project for Statistical Computing (R Core Team, 2024).
Hypothesis testing assessed the presence of a trend in the data. The null hypothesis was that no positive or negative trend existed in the data over time, whereas the alternative hypothesis was that a positive or negative trend did exist. Trends in datasets described above were considered statistically significant, and the null hypothesis was rejected when the p-value from the Mann-Kendall test was less than 0.05. A p-value of less than 0.05 (p<0.05), or a 95-percent confidence interval, is a high bar to set for trend detection, and p-values above 0.05 do not necessarily mean a trend is absent (Helsel and others, 2020).
Periods Used for Trend Analyses
Multiple time periods were used for trend analyses. In most cases, a period of record data analysis was done for each dataset using all available data beginning with the first complete year for which data are available (assuming no subsequent gaps in the data) and ending in 2023. If there were gaps in the data, the analyses started with the first complete year of data after the final year containing a gap. For datasets going back to at least 1980, the data from 1980 to 2023 were chosen for additional trend analyses.
The main reason for selecting this period is that the temperature dataset used in the study has two distinct trends for mean annual air temperature; a breakpoint between the two trends happened in the late 1970s. The timing of this breakpoint coincides with a known shift in the rate of change of air temperatures for the continental United States (Meehl and others, 2016; Vose and others, 2017; U.S. Environmental Protection Agency, 2025). Streamflow trends showed inflection points in the late 1980s when data were analyzed for the entire period of record. For these reasons, the trend analyses of a variety of climate metrics from 1980 to 2023 were used to test whether the rate of change on the Fort Apache Reservation was also stronger than that for the preceding decades. Trends identified from 1980 to 2023 may be part of natural climatic oscillations and not part of a long-term change in climate. However, because the purpose of this study is to specifically look at the change in climate during the lifetime of the current population living on the Fort Apache Reservation, the 1980 to 2023 period is important. If datasets extended back to the 1930s or earlier, the period from the beginning of their relevant records to 1979 was analyzed for trends. Again, trends seen during these periods may be part of natural climatic oscillations and not part of a long-term change in climate, but nonetheless affected the current population, either directly or because of ecological responses.
Another complication with the time periods used in the trend analyses is that three different types of years (calendar year, water year, and climate year) were used depending on the type of data analyzed. Calendar year is self-explanatory. A water year is the 12-month period from October 1 through September 30 of the following calendar year. The water year is designated by the calendar year in which it ends; for example, water year 1981 was the period from October 1, 1980, through September 30, 1981. A climate year is the 12-month period from April 1 through March 31 of the following calendar year. The climate year is designated by the calendar year in which it ends; for example, climate year 1981 was the period from April 1, 1980, through March 31, 1981.
Near-Surface Air Temperature Record
Near-surface air temperature data analyzed for this study came from the USHCN monthly data version 2.5 dataset (Menne and others, 2009; Menne and Williams, 2012; Mason, 202637). Only data from station Whiteriver 1 SW, Arizona (NCEI USHCN station USH00029271) were used for trend analysis (table 1) because this is the only USHCN station on the Fort Apache Reservation (fig. 1) and because long-term air temperature records can be subject to several forms of systematic bias (Menne and Williams, 2009; Menne and others, 2009, 2010). The raw values for this dataset came from the NOAA COOP station with the same name (Whiteriver 1 SW). The NCEI USHCN Whiteriver 1 SW station (USH00029271) is a virtual version of the NOAA Whiteriver 1 SW COOP station that uses the COOP station’s location and available raw data to construct a bias-corrected dataset and to provide estimated data for periods when raw data are missing. The NOAA Whiteriver 1 SW COOP station was located in the community of Whiteriver in the east–central part of the Fort Apache Reservation at an elevation of approximately 5,120 ft (fig. 1) and had temperature data from 1900 to 2008 (Western Regional Climate Center, 2023a). The station was discontinued in 2008. Although actual data collection at Whiteriver 1 SW occurred from 1900 to 2008, the USHCN version 2.5 dataset contains temperature data from 1893 to the present (2023). Data outside the 1900 to 2008 period were estimated, as described below. Estimated data from 2009 to 2023 were used in this study, but estimated data from 1893 to 1900 were excluded because of some missing monthly data. Data available from the USHCN version 2.5 dataset include monthly maximum, minimum, and average temperature, and monthly total precipitation.
Table 1.
Meteorological and hydrological datasets and associated periods of record used for trend analyses in this report, Fort Apache Reservation, Arizona, varying periods from 1901 to 2023.[NCEI, National Centers for Environmental Information; U.S., United States; SW, southwest; NOAA, National Oceanic and Atmospheric Administration; AZ, Arizona; NRCS, Natural Resources Conservation Service; SWE, snow water equivalent; USGS, U.S. Geological Survey; Az., Arizona; AZ., Arizona]
When deemed necessary, the NCEI adjusted USHCN version 2.5 data from the raw value to account for things like changes in the timing or location of observations; location, replacement, or recalibration of instruments; and alterations to the land use or land cover surrounding a measurement site (Menne and Williams, 2009). According to the NCEI (Menne and Williams, 2012), the version 2.5 data are either (1) raw (nonadjusted, though flagged for possible data-quality issues), (2) adjusted because of time of observation bias, or (3) put through the pairwise homogenization algorithm.
Menne and others (2009) reported that in many cases, the timing of daily observations has changed through time. Prior to 1940, observers recorded temperature data near sunset in accordance with U.S. Weather Bureau instructions, resulting in a slight positive (warm) bias during the first half of the century. Since then, a switch to morning observation times has become more common to satisfy operational hydrological requirements and has resulted in a broad-scale reduction in mean temperatures (Menne and others, 2009). Adjustments for this time of observation bias have been applied to USHCN version 2.5 data when detected.
A pairwise homogenization algorithm is used to make these adjustments to the USHCN version 2.5 data. The rationale and methodology used to apply adjustments to station data are described in Menne and Williams (2009). In short, an automated homogenization algorithm using a pairwise comparison between the target station dataset and a reference series is used to apply corrections to the target dataset. The reference series is commonly constructed by averaging values from other measurement stations near the target station that have fully adjusted temperature values (Menne and Williams, 2009).
Estimates for missing monthly temperature values were added to the USHCN version 2.5 data by NCEI when data were missing from the raw dataset. The estimates are generated using an optimal interpolation technique, which makes use of the fully adjusted temperature values at neighboring measurement stations (Menne and Williams, 2009). Data from USHCN version 2.5 are being adjusted as new data are collected. This creates a time series going back in time that reflects the current status of a station’s configuration (for example, current instrumentation, observation time, and site characteristics), but without the localized inhomogeneities detected by the pairwise homogenization algorithm. This can cause the data to change slightly depending on when it is obtained, but ideally, the overall climate trend of the adjusted record should be reasonably stable through time. The USHCN version 2.5 data used in this study was downloaded on August 21, 2024 (Mason, 2026).
The adjusted monthly temperature record from Whiteriver 1 SW was used to test for trends in the average monthly mean, maximum, and minimum, near-surface air temperature at the station using a Mann-Kendall test. The Theil-Sen slope estimate was used to compute the average change in temperature between the record’s beginning and ending periods. In addition, the average monthly mean, maximum, and minimum near-surface air temperatures for each year were used to analyze trends in the average annual mean, maximum, and minimum near-surface air temperatures.
Another possible source of temperature data for this study was NOAA’s Monthly U.S. Climate Gridded Dataset (NClimGrid; Vose and others, 2014). NClimGrid contains gridded data for the continental United States containing precipitation and maximum, minimum, and average temperature records. The data are based on stations in the Global Historical Climatology Network daily (GHCNd). The Whiteriver 1 SW station used in this study is part of the GHCNd. The Whiteriver 1 SW data were used exclusively instead of NClimGrid data because the comparisons of interest were changes through time, rather than spatial comparisons. Also, no other stations in the area offer a similar length of source records within the GHCNd. Because of the lack of other stations, useful or statistically valid differentiation of temporal trends across gridded locations within the scale of the study area is not feasible.
Precipitation Records
Nine sets of precipitation records were analyzed for this study. These records came from three NRCS SNOTEL stations, one NRCS snow course, one NCEI USHCN station, and one NOAA COOP network station (table 1).
Natural Resources Conservation Service Snow Telemetry (SNOTEL) Stations
One NRCS SNOTEL station is within the reservation at Hawley Lake (station 1271; hereafter, Hawley Lake 1271) and three stations are just east of the reservation in the White Mountains (Baldy [NRCS station 310; hereafter, Baldy 310], Maverick Fork [NRCS station 617; hereafter, Maverick Fork 617], and Wildcat [NRCS station 866; hereafter, Wildcat 866]; fig. 1). However, only data from Baldy 310, Maverick Fork 617, and Wildcat 866 were analyzed because the record from Hawley Lake 1271 did not begin until water year 2016.
Trend analyses were done on the monthly and total annual precipitation recorded at Baldy 310, Maverick Fork 617, and Wildcat 866. At a SNOTEL station, the annual accumulated precipitation consists of the rain and snow (also known as SWE) that have entered the precipitation gage. Precipitation data were obtained from the NRCS Air and Water Database Report Generator (NRCS, 2024a, b, c5253). The precipitation increment element from the database was used for the analyses. Another option would have been to use the precipitation increment snow-adjusted element, but this element was not used for the analyses because it contained more derived data (Lexi Landers, NRCS National Water and Climate Center, written commun., 2024). The snow-adjusted precipitation increment adjusts the precipitation increment using the observed SWE data to account for potential undercatch by the precipitation gage. However, factors such as wind redistribution could affect the SWE sensor and inflate the snow-adjusted increment. A Mann-Kendall test was used to assess whether trends existed for the annual and monthly precipitation through the period of record. The Theil-Sen slope estimate was used to compute the average change between the record’s beginning and ending years.
The SWE records from January 1 through June 30 of each year from Baldy 310 and Maverick Fork 617 were assessed to pick the annual maximum SWE, the annual day of the year when the maximum SWE occurred, and the annual day of the year when the SWE or snowpack at the stations reached zero. The SWE data from Wildcat 866 was not analyzed because the station is about 1,300 ft lower in elevation than Baldy 310 and Maverick Fork 617 and has years with essentially no snowpack or extremely low snowpack. Data were obtained from the NRCS Air and Water Database Report Generator (NRCS, 2024a, b52). Data for SWE extend back to 1981 for both stations, whereas data for actual snow depth only extend back to 2003. Snow water equivalent was chosen for the analysis because the record was longer.
Maximum SWE values and the dates when the maximum SWE occurred were determined using the dplyr R package (Wickham and others, 2023). Converting actual dates to the day of the year on a scale of 1–366 when maximum SWE occurred was done using the Lubridate R package (Grolemund and Wickham, 2011). The R packages were run using RStudio (R Core Team, 2024). A Mann-Kendall test was then used to assess whether a trend existed in either the annual maximum SWE or the day of year on which the maximum occurred. The Theil-Sen slope estimate was used to compute the average change between the beginning and ending years of the trend analysis periods.
The date when the station’s snowpack reached zero was determined manually by either picking the first day with zero SWE after the peak SWE for the season occurred, or, in cases where multiple peaks occurred, the first day with zero SWE after the last peak occurred. When two or more periods with recorded SWE were separated by days with zero SWE, a subjective decision had to be made on when to call the end of the seasonal snowpack. About 40 percent of the years (1981–2023) from Baldy 310 (NRCS, 2024a) had multiple SWE peaks with zero SWE recorded in between them, as did about 33 percent of the years (1981–2023) from Maverick Fork 617 (NRCS, 2024b). Although more than one SWE peak was often present in a calendar year, the peaks were usually small and close together at the end of the season, so the date of zero SWE was not affected much, or they could be ignored all together because they were short in duration (lasting only a day to a few days) and considered snowfall rather than sustained snowpack. Once the annual dates for zero SWE were determined, the dates were converted to day of the year for each year, as described above. A Mann-Kendall test was then used to assess whether a trend existed for the day of the year on which SWE reached zero through the period of record. The Theil-Sen slope estimate was used to compute the average day of year when SWE reached zero for the record’s beginning and ending periods.
Natural Resources Conservation Service Snow Courses
At NRCS snow courses, monthly or semimonthly data are collected manually. Snow water equivalent data collected at snow courses during early April are often used as a predictor of spring streamflow because the snowpack represented by early April SWE is considered snowpack that will turn into streamflow (Mote and others, 2005). No active NRCS snow courses are on the Fort Apache Reservation, but three courses are nearby (Fort Apache station 09R05; hereafter, Fort Apache 09R05, Cheese Springs, and Buck Spring [fig. 1]). Of the three snow courses, only Fort Apache 09R05 had measurable early April snowpack for most years during its operational period from 1951 to 2023 (1959, 1971, and 1972 have zero early April SWE, and the 2020 value for early April SWE is missing). Early April SWE values from Fort Apache 09R05 (NRCS, 2024d) were analyzed for a trend through time using the Mann-Kendall test. Baldy 310, Maverick Fork 617, and Fort Apache 09R05 are all within about 7 mi of each other (fig. 1), so their records would be expected to be similar.
National Centers for Environmental Information, U.S. Historical Climate Network, and National Oceanic and Atmospheric Administration Cooperative Observer Program Network Stations
As described in the “Near-Surface Air Temperature” section, NOAA COOP station Whiteriver 1 SW (029271) operated on the reservation from 1900 to 2008. Adjusted and estimated precipitation data for this station are available from the USHCN version 2.5 dataset (Menne and others, 2009; Menne and Williams, 2012; Mason, 202637). In the USHCN version 2.5 dataset the station is called Whiteriver 1 SW USH00029271. As previously noted in the “Near-Surface Air Temperature” section, the USHCN version 2.5 dataset goes through additional quality-control tests beyond what is done for standard NOAA COOP station data. In addition, even though actual data collection at Whiteriver 1 SW was only from 1900 to 2008, the USHCN version 2.5 dataset contained precipitation data from 1873 to 2023. Estimates of monthly precipitation for the station were generated using an optimal interpolation technique, which makes use of precipitation values from neighboring measurement stations (Menne and Williams, 2009). The estimated data from 2009 to 2023 were used in this study. The estimated data from 1873 to 1900 were not used because, in part, of missing data during this interval and because all data during this time were estimated values predating the actual station operation from 1900 to 2008. Annual and monthly precipitation totals from the USHCN version 2.5 dataset for Whiteriver 1 SW were tested for trends using the Mann-Kendall test. The Theil-Sen slope estimate was used to compute the average change between the beginning and ending years of the precipitation period that was tested for trends.
The NOAA McNary 2N, AZ (025412; hereafter, McNary 2N) COOP station is the only other COOP station on the Fort Apache Reservation with extensive and complete precipitation data available, including snowfall but not SWE data, which were unavailable. Monthly and total annual snowfall data were available from 1935 to 2023, and monthly and annual precipitation data were available from 1934 to 2023. Datasets were obtained from the Western Regional Climate Center (2023b). The annual snowfall data are based on years that begin in July of one year and end in June of the following year. This prevents the winter season from being broken into two separate periods with a long period of no snow in between. The year assigned to snowfall data in plots used in this report is the calendar year in which the period (July–June) ended. The annual precipitation data were computed for calendar year.
Individual years were not used for annual statistics if any month in that year had more than 5 days of missing data, and individual months were not used for monthly statistics if more than 5 days of data were missing. Trend analyses were performed on the total annual snowfall, annual precipitation, and monthly precipitation using the Mann-Kendall test. The Theil-Sen slope estimate was used to compute the average change between the records' beginning and ending periods.
Streamflow Records
Daily mean streamflow values from six USGS streamgages that capture flow originating from the Fort Apache Reservation were used in this study. In addition, the PHDI also was used to assess drought through time.
General Streamflow Statistics
The six USGS streamgages that were used are listed in table 1. Analyses were done on daily mean streamflow from these six stations using R Project for Statistical Computing (R Core Team, 2024) and the EGRET R package (Hirsch and De Cicco, 2015; Hirsch and others, 2023). Low-flow statistics (1-day minimum, 7-day minimum, and 30-day minimum) were computed for the climate year. The use of climate year, rather than water year, for low-flow statistics is a common practice in hydrology because it minimizes the probability that individual drought events will span multiple water years (Riggs, 1982; Gordon and others, 1991). A water year was used for the calculation of all other annual streamflow statistics (annual median, annual mean, 1-day maximum, 7-day maximum, and 30-day maximum).
A Mann-Kendall test was performed on all annual streamflow statistics to detect significant trends. A smooth line was used on the streamflow plots rather than the Theil-Sen line used for other data types. This choice was made not only because a smooth line is the default in the EGRET R package (Hirsch and De Cicco, 2015; Hirsch and others, 2023), but also because many of the plots appear to have more than one trend present over time. A LOWESS smoothing method that used a log-transformed value for the flow statistic was used for general streamflow statistical plots. Streamflow data are typically highly skewed, so applying a logarithm transformation results in weighted regressions in which the residuals are more nearly normal. This transformation reduces the effect of individual extreme values on the estimates (Hirsch and De Cicco, 2015; Hirsch and others, 2023). Streamflow plots that are compared to the PHDI use a similar smoothing technique called locally estimated scatterplot smoothing (LOESS; as opposed to LOWESS). The streamflow data were not log transformed to create these smooth lines that were generated using the ggplot2 R package (Wickham, 2016; Wickham and others, 2024).
Snow-Derived Streamflow Statistics
Statistics on the annual spring streamflow center of mass were computed for USGS streamgage East Fork White River Near Fort Apache, Arizona (station 09492400; hereafter, East Fork White River Near Fort Apache). This streamgage was chosen to examine the magnitude and timing of streamflow associated with the annual spring snowmelt period because it lies within the White Mountain Physiographic Subprovince identified by Moore (1968). Snowmelt peak statistics were not computed for data from the other five streamgages because although they all receive some flow from snowmelt, they receive enough rain runoff during the winter and spring months to confound the timing and magnitude of annual snowmelt runoff.
The total volume of streamflow during the months of March through June for each year and the day of the year when the center of mass of that volume occurred were analyzed. The March through June timeframe used to capture the spring snowmelt runoff was chosen by visually inspecting annual streamflow hydrographs from this streamgage and assessing which months typically had snowmelt runoff. The analysis included a Mann-Kendall test and Theil-Sen slope estimate applied to the data using the same methods described in the “Precipitation Records” section above.
Using the streamflow record from this streamgage to look for trends in snowmelt runoff is confounded by the fact that flow at this streamgage is periodically influenced by rain on snowpack events that can occur in the winter and spring in this region. In some years, the highest daily mean streamflow recorded during the winter to spring months can be rain on snowpack events. An example is the January 8, 1993, peak that occurred likely as a result of rain on the snowpack. House and Hirschboeck (1997) provide a description of the rainstorms of January and February 1993 in Arizona and their interaction with snowpack. A hydrograph of daily mean streamflow at USGS streamgage East Fork of the White River Near Fort Apache, from December 1, 1992, through June 30, 1993, is shown in figure 6. The steepness and magnitudes of the rising and falling limbs of the January and February peaks (fig. 6) are a good indicator that these peaks are affected by rain and not just snowmelt. The peaks in April and May are more typical of peaks generated by the more gradual process of melting snow due to solar radiation and above-freezing air temperatures. This becomes even more obvious when you look at streamflow collected from the same time span but collected at 15-minute intervals (fig. 6B). Fifteen-minute data are only available from this streamgage starting in 1987; therefore, daily mean values are used in the analysis because they extend back to August 1957. Not only does the steepness of the rain-runoff-generated peaks become more pronounced, but the daily diurnal peaks, caused by the changes in solar radiation and air temperature between day and night, also become visible in the snowmelt peaks from mid-March through May. Another thing illustrated in figure 6B is the relatively small area under the hydrograph from rain or rain on snowpack peaks compared to the overall area under the hydrograph from mid-March through early June. Because the area under the hydrograph curve is directly proportional to the volume of streamflow, the volume of streamflow generated by snowmelt is considerably larger than the volume generated by the rain-associated peaks. The use of the total streamflow volume for the snowmelt months and that volume’s center of mass as indicators of change through time lessens the effect that rain on snowpack peaks has on the analysis of change. Although the January and February peaks of 1993 are not a factor in the analyses because the period used was March through June of each water year, a handful of possible rain on snowpack peaks that occurred through the period of record during the months included in the analyses were identified.
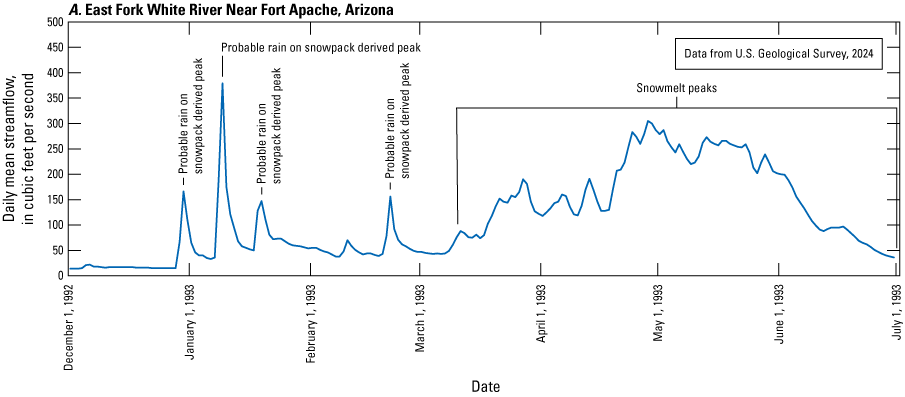
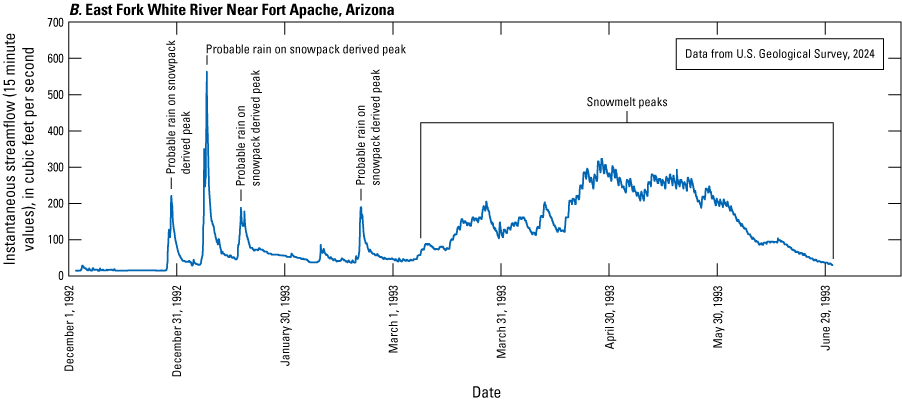
Hydrographs showing the daily mean streamflow from U.S. Geological Survey streamgage East Fork of the White River Near Fort Apache, Arizona (station 09492400) for December 1, 1992, through June 30, 1993. A, Daily mean values. B, 15-minute values.
The total streamflow volume was computed by converting daily mean streamflow in cubic feet per second into daily acre-feet and then summing all the daily acre-feet values for March through June of each water year. The center of mass for this volume was computed using the following equation:
whereA Mann-Kendall test and Theil-Sen slope estimate were applied to the data using the same methods described in the “Precipitation Records” section.
Palmer Hydrological Drought Index
The PHDI computed for Arizona by the NCEI (NCEI, 2024) was also used to assess drought through time. The PHDI is a water-balance model that analyzes precipitation and temperature to measure hydrological drought across space and time and reflects changes in surface and groundwater supplies. Because this index accounts for storage effects of surface water and groundwater, it responds more slowly to changing conditions than the Palmer Drought Severity Index from which it is derived.
Results of Trend Analyses
This section discusses results from trend analyses of multidecadal meteorological and hydrological datasets. The types of data analyzed included near-surface air temperature, precipitation, snowfall and snowpack, streamflow, and the PHDI.
Annual and Monthly Near-Surface Air Temperatures
The near-surface air temperature data analyzed for this study from the USHCN version 2.5 dataset is only available as the monthly mean, maximum, and minimum (Menne and others, 2009; Menne and Williams, 2012; Mason, 202637). Annual near-surface air temperatures were calculated from the monthly values as described below.
Annual Near-Surface Air Temperature
The annual mean, maximum, and minimum near-surface air temperatures from 1901 to 2023 from the USHCN version 2.5 dataset for Whiteriver 1 SW (Menne and Williams, 2012; Mason, 2026)37) were analyzed for statistical trends using the Mann-Kendall test and Theil-Sen slope estimate. The annual mean, maximum, and minimum near-surface air temperatures were calculated by summing the average monthly values from the USHCN version 2.5 dataset and dividing by 12. The monthly averages from the USHCN version 2.5 dataset themselves were calculated from daily averages. For all three temperature parameters, the annual data are not distributed evenly when plotted (fig. 7), and an apparent inflection in the plotted data points occurs around 1980 (fig. 7A, D, G). For this reason, in addition to examining data from 1901 to 2023, additional analyses were done for data from 1901 to 1979 (fig. 7B, E, H) and 1980 to 2023 (fig. 7C, F, I).
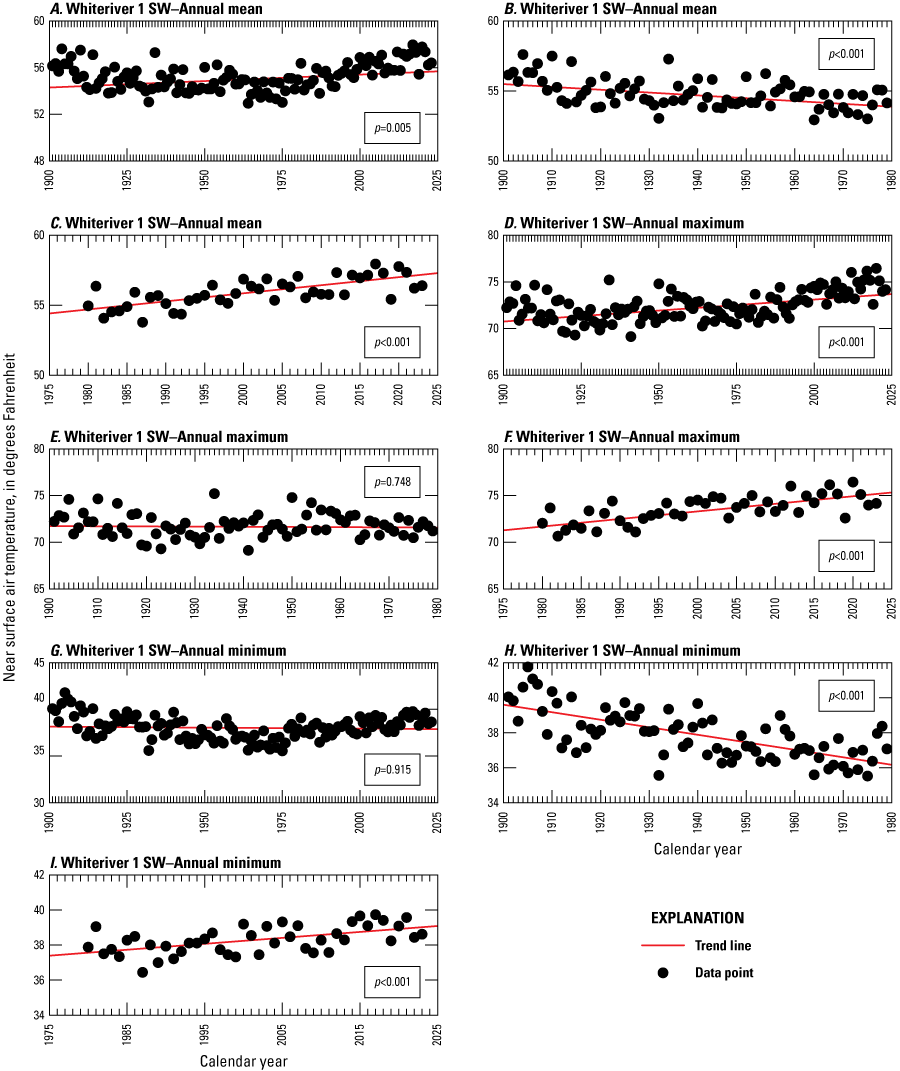
Scatterplots showing the annual mean near-surface air temperature from U.S. Historical Climatology Network (USHCN) version 2.5 dataset for station Whiteriver 1 SW, Arizona (USHCN station USH00029271) for A, 1901–2023, B, 1901–79, and C, 1980–2023. Annual maximum near-surface air temperature for D, 1901–2023, E, 1901–79, and F, 1980–2023. Annual minimum near-surface air temperature for G, 1901–2023, H, 1901–79, and I, 1980–2023.
The annual mean near-surface air temperature from 1901 to 2023, using adjusted data from the U.S. Historical Climatology Network version 2.5 dataset for Whiteriver 1 SW, is presented in Figure 7A. The Theil-Sen slope estimate line is shown along with the p-value from a Mann-Kendall test. The slope of the Theil-Sen line is positive, and the p-value from the Mann-Kendall test indicates this trend is significant (p<0.05). The slope of the line indicates that mean annual temperatures have increased by 1.35 °F during this period (fig. 7A; table 2). Average mean annual air temperature from 1901 to 1979 decreased by 1.57 °F (fig. 7B; table 2), whereas average mean annual air temperature from 1980 to 2023 increased by 2.48 °F (fig. 7C; table 2).
Table 2.
Change in average annual mean near-surface air temperatures, as measured by the Theil-Sen slope estimate on U.S. Historical Climatology Network version 2.5 dataset for Whiteriver 1 SW, Arizona (USHCN station USH00029271), 1901–79, 1901–2023, and 1980–2023.[Data from National Centers for Environmental Information (2024). All data given for the indicated analysis period. ˚F, degrees Fahrenheit; p-value, probability value]
The average annual maximum near-surface air temperature from 1901 to 2023 is presented in Figure 7D. The Theil-Sen slope estimate line is shown along with the p-value from a Mann-Kendall test. The slope of the Theil-Sen line is positive, and the p-value from the Mann-Kendall test indicates this trend is significant (p<0.05). The slope of the line indicates that average annual maximum near-surface air temperatures have increased by 2.87 °F during this period (fig. 7D; table 3). Average annual maximum near-surface air temperatures from 1901 to 1979 are listed in table 3 and are plotted along with a fitted Theil-Sen slope line in fig. 7E. The line has a slightly negative slope, but the p-value from the Mann-Kendall test indicates this trend is not significant (p>0.05). Average annual maximum near-surface air temperatures from 1980 to 2023 increased significantly (p<0.05) and by 3.48 °F during this time period (fig. 7F; table 3).
Table 3.
Change in annual average maximum near-surface air temperatures, as measured by the Theil-Sen slope estimate on U.S. Historical Climatology Network version 2.5 dataset for Whiteriver 1 SW, Arizona (USHCN station USH00029271), 1901–79, 1901–2023, and 1980–2023.[Data from National Centers for Environmental Information (2024). ˚F, degrees Fahrenheit; p-value, probability value]
The average annual minimum near-surface air temperature from 1901 to 2023 is presented in Figure 7G. The Theil-Sen slope estimate line is shown along with the p-value from a Mann-Kendall test. The slope of the Theil-Sen line is negative, but the p-value from the Mann-Kendall test indicates the trend is not significant (p>0.05; table 4). Average annual minimum near-surface air temperature from 1901 to 1979 decreased by 3.34 °F (fig. 7H; table 4), whereas the average annual minimum near-surface air temperature from 1980 to 2023 increased by 1.45 °F (fig. 7I; table 4).
Table 4.
Change in average annual minimum near-surface air temperatures, as measured by the Theil-Sen slope estimate on U.S. Historical Climatology Network version 2.5 dataset for station Whiteriver 1 SW, Arizona (USHCN station USH00029271), 1901–79, 1901–2023, and 1980–2023.[Data from National Centers for Environmental Information (2024). ˚F, degrees Fahrenheit; p-value, probability value]
Monthly Near-Surface Air Temperatures
The average monthly near-surface air temperatures from 1980 to 2023, using adjusted data from the USHCN version 2.5 dataset for Whiteriver 1 SW, are presented in Figure 8A. This period was chosen for analysis based on the observed inflection point detected in the annual air temperature data described in the “Annual Near-Surface Air Temperature” section. The Theil-Sen slope estimate line is shown, along with the p-value from a Mann-Kendall test. Twelve plots, one for each month of the year, are shown in figure 8A. The Theil-Sen slope lines are positive for all of the months, and significant trends (p-values<0.05) were determined for the months of March and June–November (fig. 8A). Among the months with significant trends, June had the largest monthly average temperature increase (3.91 ˚F) from 1980 to 2023 (table 5).
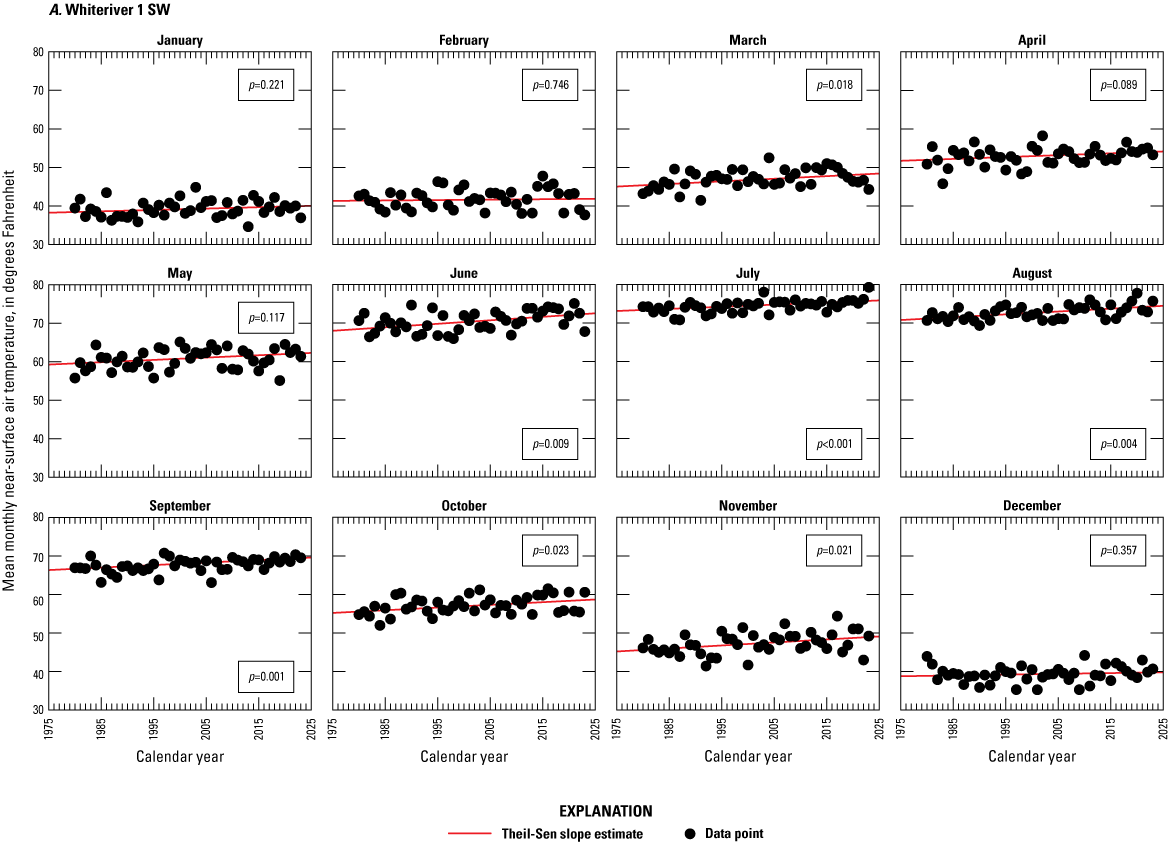
Scatterplots showing monthly near-surface air temperatures from U.S. Historical Climatology Network station version 2.5 dataset for station Whiteriver 1 SW, Arizona (USHCN station USH00029271), for 1980–2023. A, average monthly near-surface air temperature, B, average monthly maximum air temperature, and C, average monthly minimum near-surface air temperature.
Table 5.
Change in average monthly near-surface air temperatures, as measured by the Theil-Sen slope estimate on U.S. Historical Climatology Network version 2.5 dataset for station Whiteriver 1 SW, Arizona (USHCN station USH00029271), 1980–2023.[Data from National Centers for Environmental Information (2024). Air temperatures given in degrees Fahrenheit, ˚F. Jan., January; Feb., February; Mar., March; Apr., April; Aug., August; Sep., September; Oct., October; Nov., November; Dec., December; p-value, probability value]
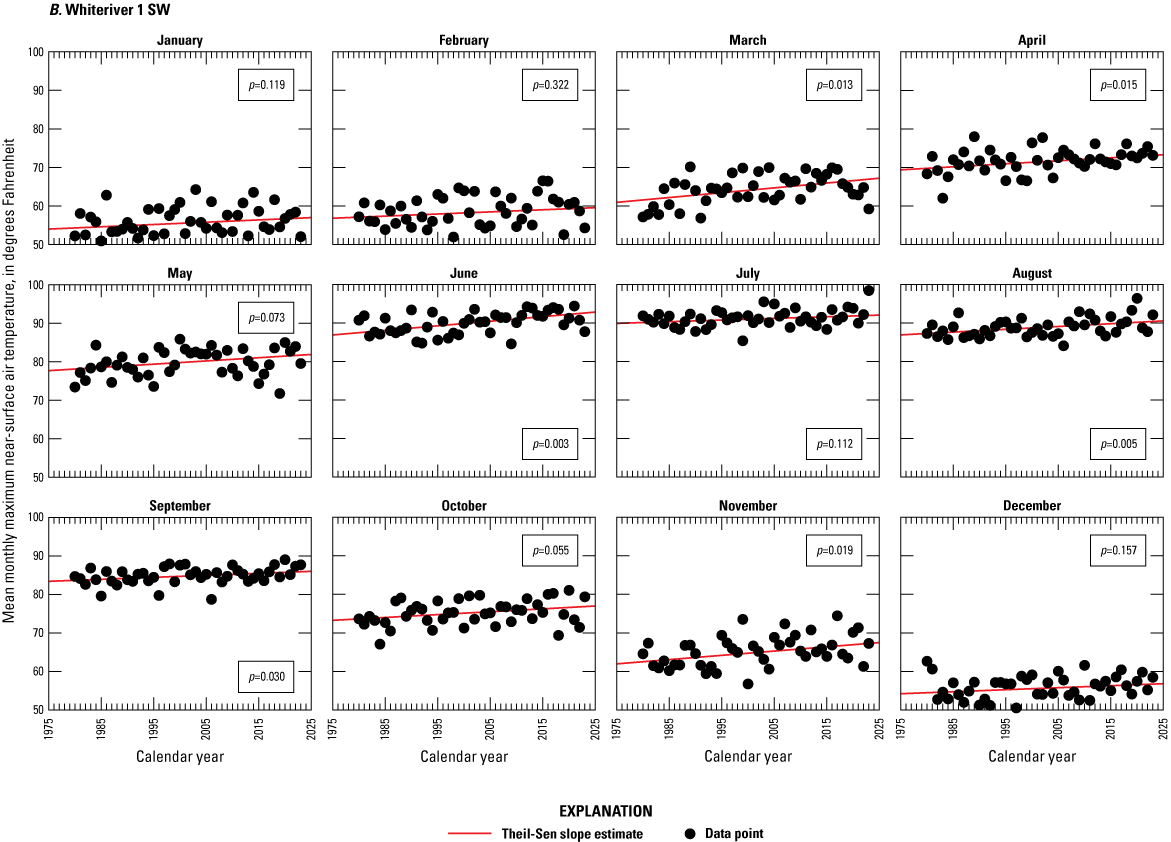
Similar plots for average monthly maximum near-surface air temperatures are shown in figure 8B. The Theil-Sen line slopes are positive for all months, and significant trends (p-values<0.05) were determined for half of the months (March, April, June, August, September, and November). March had the largest average monthly maximum temperature increase (5.39 °F) from 1980 to 2023, as predicted by the Theil-Sen lines for months with significant trends (p<0.05; table 6).
Table 6.
Change in average monthly maximum near-surface air temperatures, as measured by the Theil-Sen slope estimate on U.S. Historical Climatology Network version 2.5 dataset for Whiteriver 1 SW, Arizona (USHCN station USH00029271), 1980–2023.[Data from National Centers for Environmental Information (2024). Air temperatures given in degrees Fahrenheit, ˚F. Jan., January; Feb., February; Mar., March; Apr., April; Aug., August; Sep., September; Oct., October; Nov., November; Dec., December; p-value, probability value]
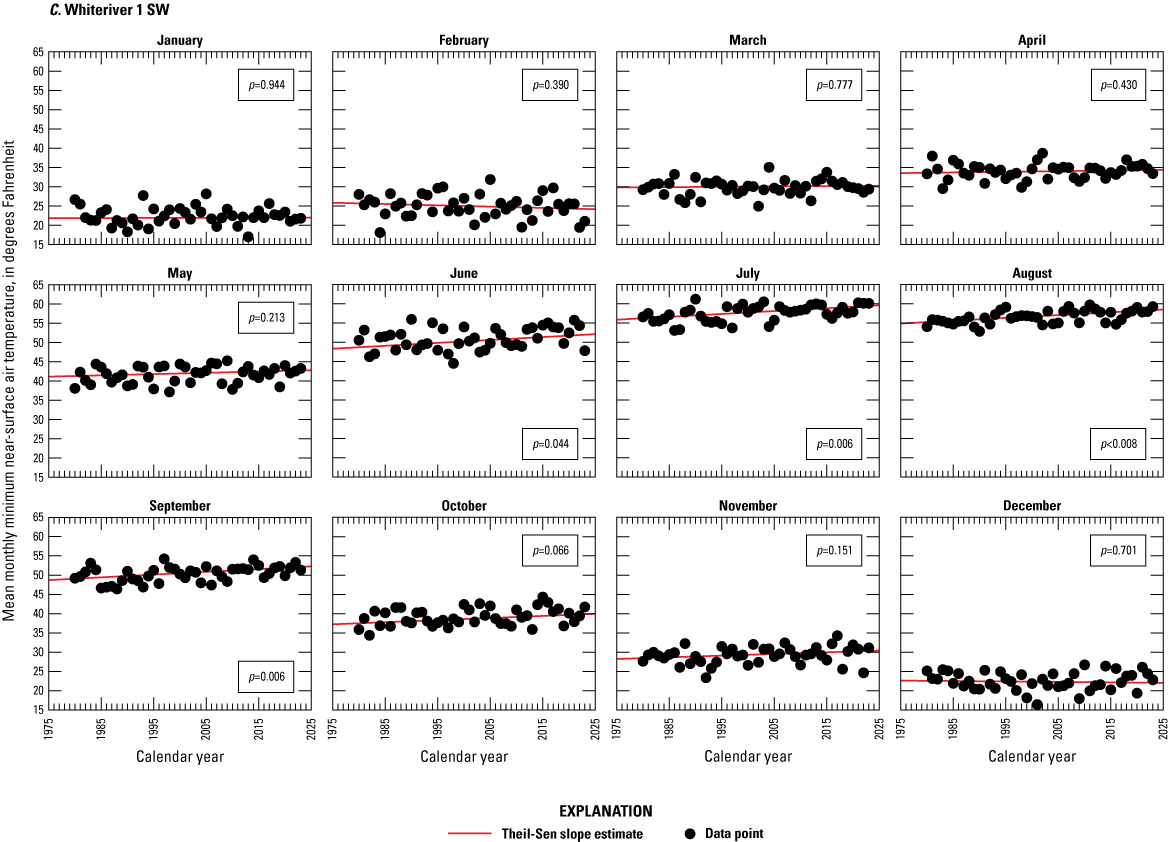
Plots with Theil-Sen lines for the change in average monthly minimum near-surface air temperatures from 1980 to 2023 are shown in Figure 8C. All months have Theil-Sen lines with positive slopes except for February and December, which have Theil-Sen lines with negative slopes. However, only the months of June through September had significant trends (p<0.05; table 7). All four of these months had increases in average monthly minimum near-surface temperatures of at least 3 °F, and June had the largest increase (3.25° F; table 7).
Table 7.
Change in average monthly minimum near-surface air temperatures, as measured by the Theil-Sen slope estimate on U.S. Historical Climatology Network version 2.5 dataset for Whiteriver 1 SW, Arizona (USHCN station USH00029271), 1980–2023.[Data from National Centers for Environmental Information (2024). Air temperatures given in degrees Fahrenheit, ˚F. Jan., January; Feb., February; Mar., March; Apr., April; Aug., August; Sep., September; Oct., October; Nov., November; Dec., December; p-value, probability value]
Annual and Monthly Precipitation
Annual precipitation records were analyzed using a Mann-Kendall test and the Theil-Sen slope estimate to look for distinctive positive or negative trends in annual precipitation from Whiteriver 1 SW (NCEI, 2024), Baldy 310, Maverick Fork 617, and Wildcat 866 (NRCS, 2024a, b, c5253) and McNary 2N (fig. 9, tables 8–10; Western Regional Climate Center, 2023b). Monthly precipitation records were also analyzed using a Mann-Kendall test and the Theil-Sen slope estimate to detect notable positive or negative trends in average monthly total precipitation from the five stations (fig. 10, table 11).
Annual Precipitation
The average total annual precipitation from 1901 to 2023, using adjusted data from Whiteriver 1 SW, is presented in Figure 9A. The Theil-Sen slope estimate is negative, and the Mann-Kendall test indicated the trend is significant (p<0.05). Using the Theil-Sen slope estimate, the average total annual precipitation decreased from 19.10 in. in 1901 to 15.30 in. in 2023, a 19.9 percent decrease (fig. 9A; table 8). As with the annual near-surface air temperature record, the annual precipitation record from Whiteriver 1 SW was broken into two periods (1901–79 and 1980–2023) to further analyze for trends. The Theil-Sen slope estimate was positive from 1901 to 1979, but the Mann-Kendall test indicated there was no significant trend (p=0.454; fig. 9B; table 8). The data from 1980 to 2023 had a negative Theil-Sen slope estimate, and the Mann-Kendall test indicated the trend was significant (p<0.001; table 8). Using the Theil-Sen slope estimate, average total annual precipitation decreased from 20.7 in. in 1980 to 10.98 in. in 2023, a 47.0 percent decrease (fig. 9C; table 8).
Table 8.
Change in average total annual precipitation, as measured by the Theil-Sen slope estimate on U.S. Historical Climatology Network version 2.5 dataset for Whiteriver 1 SW, Arizona (USHCN station USH00029271), 1901–79, 1901–2023, and 1980–2023.[Data from National Centers for Environmental Information (2024). in, inches; p-value, probability value]
Total annual precipitation data from Baldy 310, Maverick Fork 617, and Wildcat 866 were found to have significant negative trends (p<0.05; fig. 9D, E, F; table 9). Baldy 310 and Maverick Fork 617 had precipitation data available from 1981 to 2023, whereas Wildcat 866 had data available from 1985 to 2023. The decrease in average total annual precipitation calculated using the Theil-Sen slope estimates ranged from 5.70 in. at Baldy 310 to 10.07 in. at Wildcat 866 (table 9). These decreases were 18.7 and 34.7 percent, respectively, for these two stations.
Table 9.
Change in average total annual precipitation, as measured by the Theil-Sen slope estimate, for Natural Resources Conservation Service (NRCS) snow telemetry stations Baldy (NRSC 310) and Maverick Fork (617), and Wildcat (NRCS 866) near the Fort Apache Reservation, Arizona, 1981–2023, and 1985–2023.[Data from Natural Resources Conservation Service (2023a, b, c). in, inches; p-value, probability value]
The total annual precipitation from 1934 to 2023, as recorded at McNary 2N, is displayed in Figure 9G. The Theil-Sen slope estimate is negative, but the trend was not significant (p>0.05; fig. 9G; table 10). As with the total annual precipitation record from Whiteriver 1 SW, the record from McNary 2N was broken into two periods (1934–79 and 1980–2023) to further analyze for trends. The Theil-Sen slope estimate was positive from 1934 to 1979, but the trend was not significant because the p-value for the Mann-Kendall test was 0.079, which is slightly greater than the p<0.05 threshold (fig. 9H; table 10). The period from 1980 to 2023 had a negative Theil-Sen slope estimate, and the p-value from the Mann-Kendall test (p=0.010) indicated the trend was significant (p<0.05; fig. 9I; table 10). Using the Theil-Sen slope estimate, average total annual precipitation decreased from 29.11 in. in 1980 to 20.53 in. in 2023, a 29.5 percent decrease (fig. 9I; table 10).
Table 10.
Change in average total annual precipitation, as measured by the Theil-Sen slope estimate for National Oceanic and Atmospheric Administration Cooperative Observer Program station McNary 2N (025412), Arizona, 1934–79, 1934–2023, and 1980–2023.[Data from Western Regional Climate Center (2023b). All data given for the indicated analysis period. in, inches; p-value, probability value]
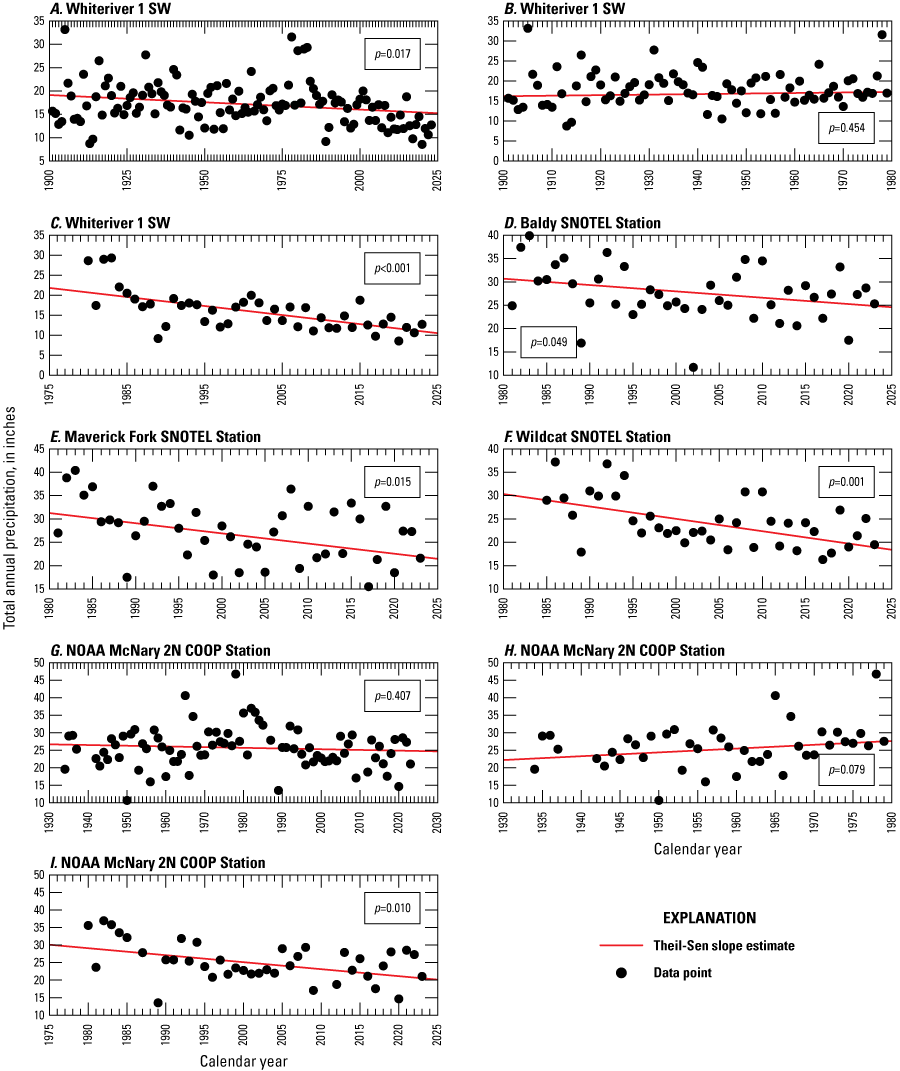
Scatterplots showing the total annual precipitation from U.S. Historical Climatology Network version 2.5 dataset for station Whiteriver 1 SW, Arizona, for A, 1901–2023, B, 1901–79, and C, 1980–2023. D, Snow telemetry (SNOTEL) stations Baldy (Natural Resources Conservation Service [NRCS] 310) for 1981–2023, E, Maverick Fork (NRCS 617) for 1981–2023, and F, Wildcat (NRCS 866) for 1985–2023. G, National Oceanic and Atmospheric Administration (NOAA) McNary 2N Cooperative Observer Program (COOP) station for 1934–2023, H, for 1934–79, and I, for 1980–2023.
Monthly Precipitation
Monthly precipitation data from 1980 to 2023 for Whiteriver 1 SW (NCEI, 2024) were analyzed. This period was chosen for analysis because of the apparent inflection point in the annual total precipitation data around 1980, as described in the “Annual Precipitation” section. March, April, and August were the only months with significant trends (p<0.05) in average monthly total precipitation (fig. 10A; table 11). All three trends were negative, but August had the largest average decrease (1.86 in.) from 1980 to 2023 (table 11).
Baldy 310 and Maverick Fork 617 each had data available from 1981 to 2023, whereas Wildcat 866 had data from 1985 to 2023 (NRCS, 2024a, b, c5253). For Baldy 310, the only month with a significant trend (p<0.05) for average monthly total precipitation was April (fig. 10B; table 11). The trend was negative and indicated an average decrease in April precipitation of 0.88 in. (table 11). Monthly precipitation recorded at Maverick Fork 617 had significant trends (p<0.05) for the months of March and April (fig. 10C; table 11). The trends were negative for both months and indicated average decreases in monthly precipitation of 1.61 and 1.02 in., respectively. Monthly precipitation recorded at Wildcat 866 only had a significant trend (p<0.05) for April (fig. 10D; table 11). The trend was negative and indicated an average decrease in April precipitation of 1.01 in. (table 11).
McNary 2N (Western Regional Climate Center, 2023b) had precipitation data available from 1934 to 2023. However, only data from 1980 to 2023 were chosen for analysis because of an apparent inflection point in the annual total precipitation data occurring around 1980, as described in the “Annual Precipitation” section. The only months with significant trends (p<0.05) for this period were March, April, and November (fig. 10E; table 11). All three trends were negative, but March had the largest decrease in average monthly total precipitation (2.08 in.) from 1980 to 2023.
Table 11.
Change in average monthly total precipitation, as measured by the Theil-Sen slope estimate for five precipitation stations on or near the Fort Apache Reservation, Arizona, for periods spanning from 1980 to 2023.[Data from National Centers for Environmental Information (2024), Natural Resources Conservation Service (2024a, b, c), and Western Regional Climate Center (2023a, b)82. Jan., January; Feb., February; Mar., March; Apr., April; Aug., August; Sep., September; Oct., October; Nov., November; Dec., December; USHCN, U.S. Historical Climatology Network; SW, southwest; in, inches; p-value, probability value; NRCS, Natural Resources Conservation Service; SNOTEL, snow telemetry; NOAA, National Oceanic and Atmospheric Administration; COOP, Cooperative Observer Program]
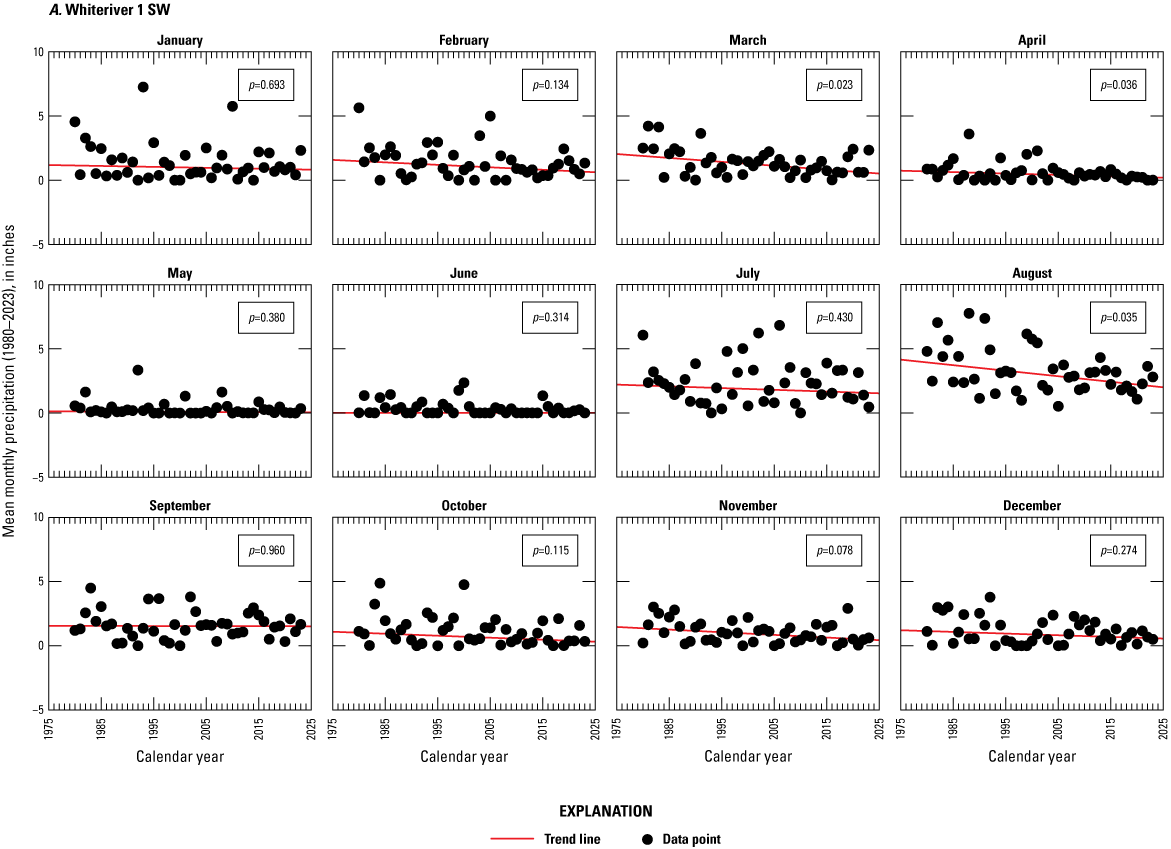
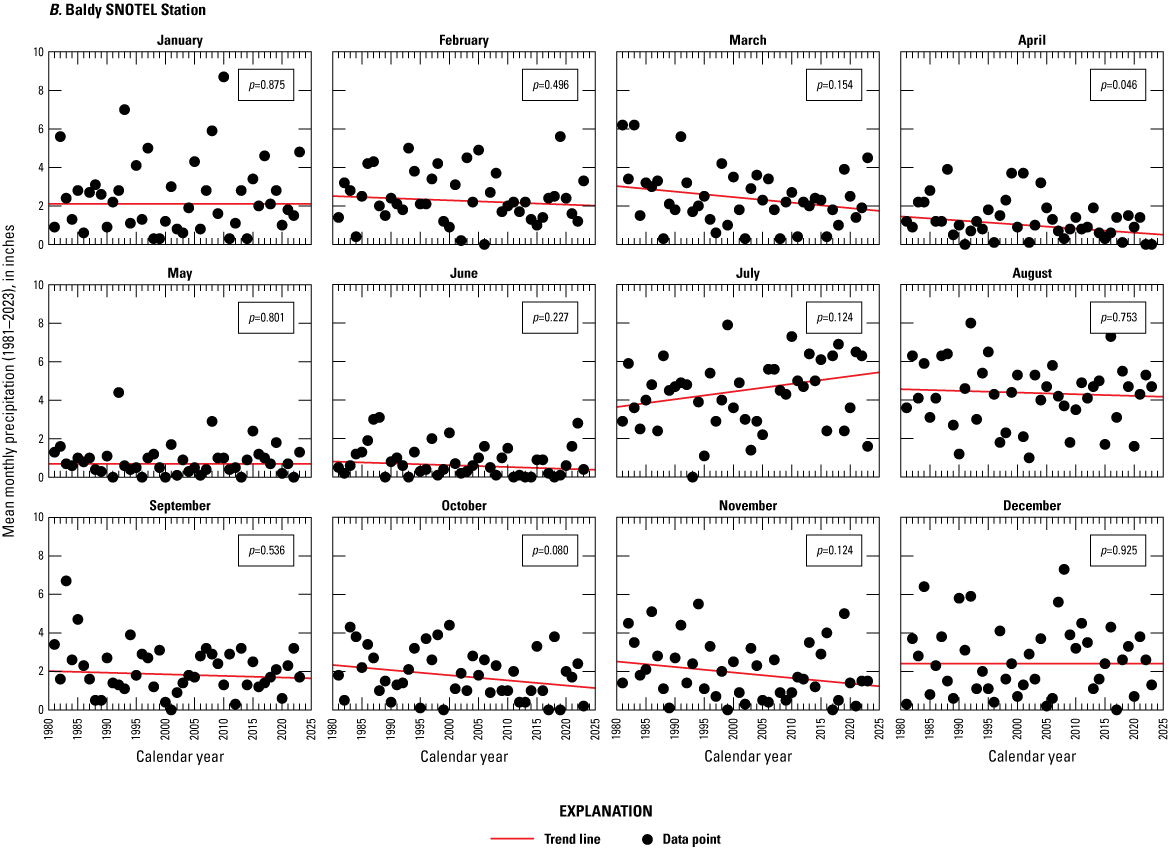
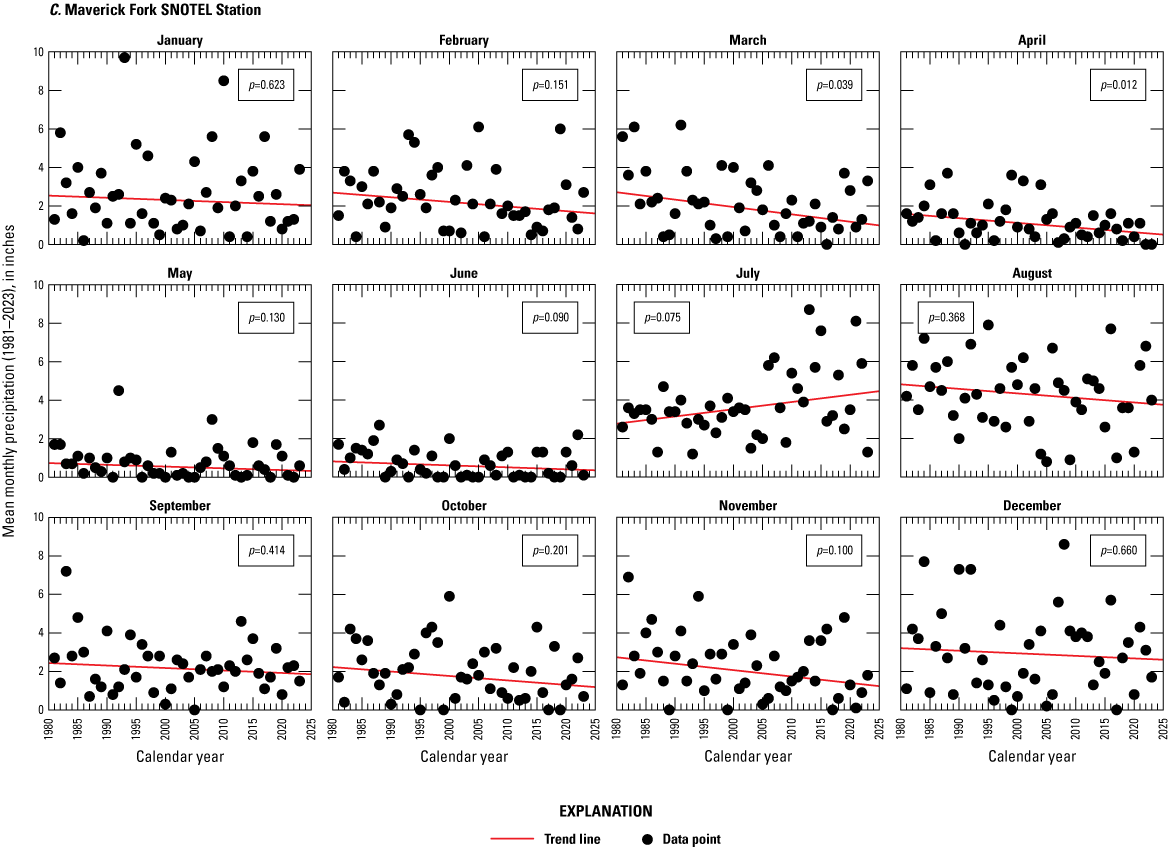
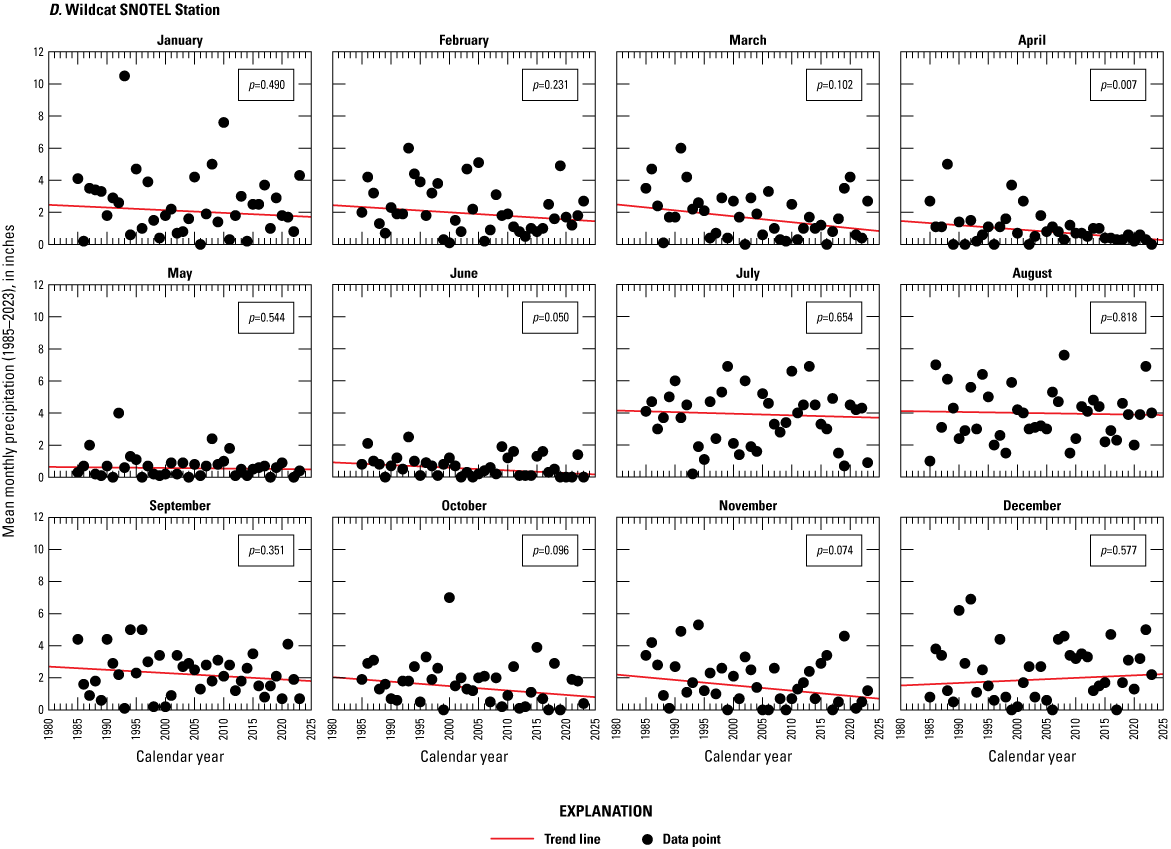
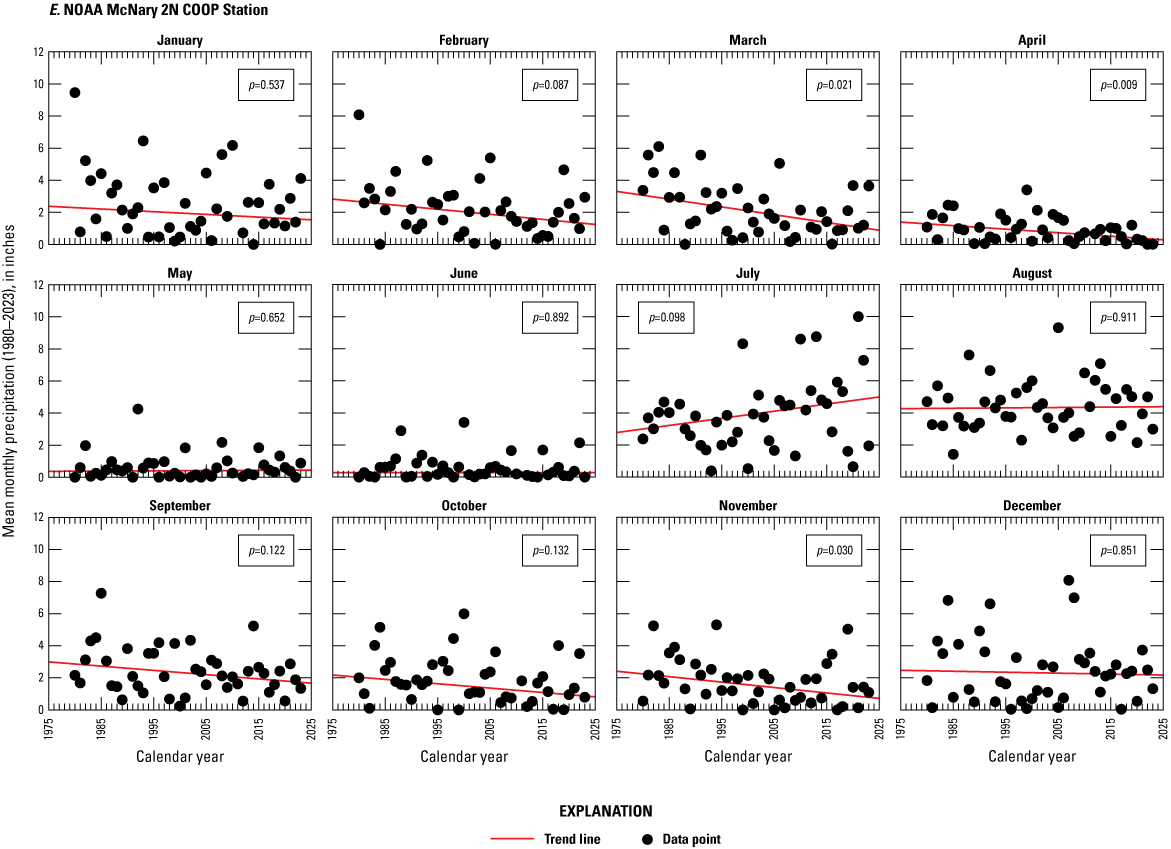
Scatterplots showing the average monthly total precipitation from A, U.S. Historical Climate Network version 2.5 dataset for station Whiteriver 1 SW, Arizona, for 1980–2023, B, Baldy (Natural Resources Conservation Service [NRCS] 310) snow telemetry (SNOTEL) station for 1981–2023, C, NRCS Maverick Fork SNOTEL station for 1981–2023, D, NRCS Wildcat SNOTEL station for 1985–2023, and E, National Oceanic and Atmospheric Administration McNary 2N Cooperative Observer Program station for 1980–2023.
Snowfall and Snowpack
Snowfall and snowpack records were analyzed using a Mann-Kendall test and the Theil-Sen slope estimate to detect significant positive or negative trends at Baldy 310 and Maverick Fork 617, Fort Apache 09R05 (NRCS, 2024a, b, c5253), and McNary 2N (Western Regional Climate Center, 2023b).
Annual maximum SWE values and the day of year when the annual maximum SWE occurred at Baldy 310 and Maverick Fork 617 were analyzed for trends. In addition, an analysis was performed on the day of year when SWE at both stations went to zero.
The analyses of peak SWE from Baldy 310 and Maverick Fork 617 resulted in Theil-Sen slope estimates with negative trends, but only the trend from Baldy 310 was significant (p<0.05; fig. 11A, B). The trend from Baldy 310 indicated a decrease in the average peak SWE of 4.5 in., or a 45.0 percent decrease from 1981 to 2023 (table 12). The p-value from Maverick Fork 617’s trend analysis (p=0.055) was close to the p<0.05 threshold (table 12). The decrease in annual peak SWE calculated from Maverick Fork 617 was 4.9 in. (table 12), or a 45.0 percent decrease from 1981 to 2023.
Table 12.
Change in annual peak snow water equivalent (SWE), change in the date when annual maximum SWE occurred, and change in date when annual SWE went to zero, as measured by the Theil-Sen slope estimate for two Natural Resources Conservation Service snow telemetry stations near the Fort Apache Reservation, Arizona, 1981–2023.[Data from Natural Resources Conservation Service (2024a, b). max., maximum; SWE, snow water equivalent; beg., beginning; p-value, probability value; NRCS, Natural Resources Conservation Service; SNOTEL, snow telemetry; Mar., March; Feb., February; Apr., April]
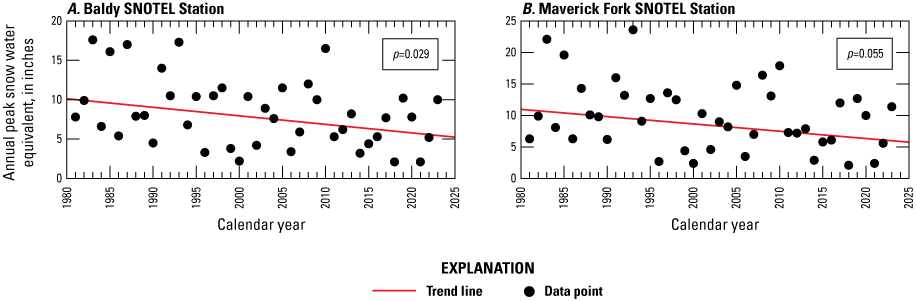
Scatterplot showing the annual peak snow water equivalent from A, Natural Resources Conservation Service (NRCS) Baldy snow telemetry (SNOTEL) station 310, and B, NRCS Maverick Fork SNOTEL station 617, Arizona, for 1981–2023.
The trend analyses performed on the day of year when peak SWE was reached at Baldy 310 and Maverick Fork 617 also produced negative Theil-Sen slope estimates for both stations, but only the trend for Baldy 310 was significant (p<0.05; fig. 12A, B; table 12). The trend from Baldy 310 indicated the average date of peak SWE from 1981 to 2023 was around March 18 early in the record, but by 2023, the average date of peak SWE was around February 13. This shift to an earlier date for peak SWE is about 33 days for this period (table 12).
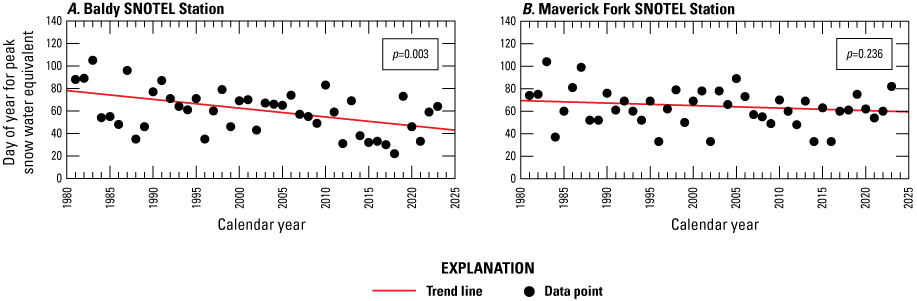
Scatterplot showing the day of year for peak snow water equivalent from A, Natural Resources Conservation Service (NRCS) Baldy snow telemetry (SNOTEL) station 310, and B, NRCS Maverick Fork SNOTEL station 617, Arizona, for 1981–2023 (Natural Resources Conservation Service, 2024a, b).
Trend analyses of the day of year when SWE reached zero at Baldy 310 and Maverick Fork 617 produced negative Theil-Sen slope estimates, and both trends were significant (p<0.05; fig. 13A, B). At Baldy 310, the trend indicates that the average date the SWE reached zero early in the record was around April 25, but by 2023, this date had shifted to around March 25. This shift to an earlier date for zero SWE is about 31 days for this period (table 12). Similarly, at Maverick Fork 617, the average date when the SWE went to zero early in the record was around April 28, shifting to around April 2 by 2023, 26 days earlier table 12).
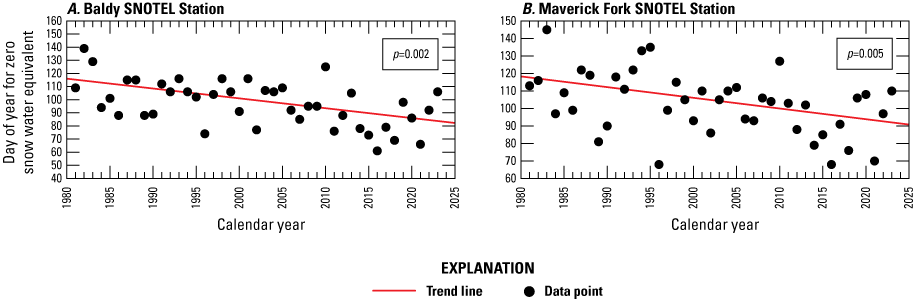
Scatterplot showing the day of the year for zero snow water equivalent from A, Natural Resources Conservation Service (NRCS) Baldy snow telemetry (SNOTEL) station, and B, NRCS Maverick Fork SNOTEL station, 1981–2023.
Trend analyses of early April SWE from Fort Apache 09R05 resulted in negative Theil-Sen slope estimates for the two periods tested (1951–2023 and 1981–2023), but the trends were not significant (p>0.05; fig. 14; table 13). A trend analysis was also done on the total annual snowfall recorded at McNary 2N, indicating a significant (p<0.05) decrease in annual snowfall between 1935 and 2023 (fig. 15). Average annual snowfall during this time period decreased from 106.3 in. to 61.2 in., representing a 42.4 percent decline (table 14).
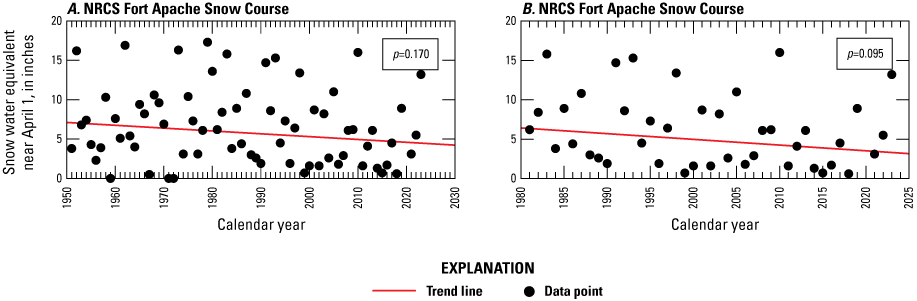
Scatterplots showing the early April snow water equivalent from Natural Resources Conservation Service Fort Apache snow course (station 09R05) for A, 1951–2023, and B, 1981–2023.
Table 13.
Change in early April snow water equivalent, as measured by the Theil-Sen slope estimate, for Natural Resources Conservation Service Fort Apache snow course (station 09R05), near Fort Apache Reservation, Arizona, 1951–2023.[Data from Natural Resources Conservation Service (2024d). SWE, snow water equivalent; in, inches; p-value, probability value]
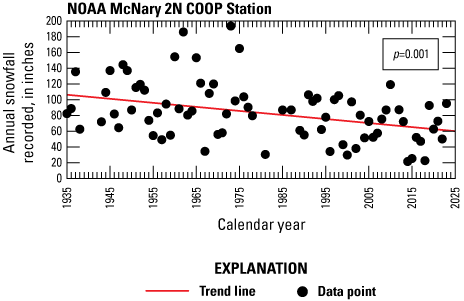
Scatterplot showing the annual snowfall from National Oceanic and Atmospheric Administration Cooperative Observer Program station McNary 2N (025412), 1935–2023.
Table 14.
Change in total annual snowfall, as measured by the Theil-Sen slope estimate, for National Oceanic and Atmospheric Administration Cooperative Observer Program station McNary 2N (025412) near the Fort Apache Reservation, Arizona, 1935–2023.[Data from Western Regional Climate Center (2023b). in, inches; p-value, probability value]
Streamflow Records
Daily mean streamflow values from six USGS streamgages (U.S. Geological Survey, 2024) were evaluated for trends. Statistical analyses were done using daily mean streamflow data that were grouped by climate year to test for low-flow trends and grouped by water year to test for trends in high flows and for trends in the annual median and mean flows. The Mann-Kendall test was used to detect significant trends (p<0.05) in the 1-, 7-, and 30-day minimum streamflow, the 1-, 7-, and 30-day maximum streamflow, the annual median streamflow, and the annual mean streamflow. Plots of the streamflow data include the calculated p-value along with a LOWESS-based smoothed trend line, as described in Hirsch and De Cicco (2015) and Hirsch and others (2023). A list of the streamgages, their periods of record analyzed, and the p-values from the Mann-Kendall tests appear in table 15. Additional trend analyses were done on the day of year for the center of springtime streamflow and on the volume of springtime streamflow occurring between March 1 and June 30 of each water year for East Fork White River Near Fort Apache (table 15).
The White River Near Fort Apache (USGS station 09494000) streamgage is downstream from East Fork White River Near Fort Apache, and the Salt River Near Chrysotile, Arizona, (USGS station 09497500; hereafter, Salt River Near Chrysotile) streamgage is downstream from all the other streamgages except for the Cibecue Creek Near Chrysotile, Arizona, (USGS station 09497800) streamgage (fig. 1). This means that when discussing changes in total annual runoff measured at streamgages in the following sections, the total changes from each streamgage cannot be summed to find an overall change because two of the streamgages measure runoff that has already been partially measured by one or more upstream streamgages. This also means that trends in records from downstream gages are partially accounted for in trends at upstream gages.
Table 15.
Period of record data used for trends analysis and p-values from Mann-Kendall tests performed on mean daily streamflow values for six U.S. Geological Survey streamgages on the Fort Apache Reservation, Arizona, during periods spanning from 1925 to 2023.[Data from the U.S. Geological Survey National Water Information System database (U.S. Geological Survey, 2024). p-value, probability value; min., minimum; max., maximum; Az., Arizona; AZ., Arizona; AZ, Arizona]
East Fork White River Near Fort Apache Streamgage
The East Fork White River Near Fort Apache streamgage has been in continuous operation since August 1957. The streamflow measured at this streamgage should largely represent natural conditions with minimal human-made interference. The streamgage is about 15 mi southeast of Baldy Peak (fig. 1) at an elevation of 6,050 ft in the White Mountain physiographic subprovince identified by Moore (1968). The drainage area upstream from the streamgage is 38.8 square miles (mi2; U.S. Geological Survey, 2024). The drainage area upstream from the streamgage is primarily undeveloped forested land (LANDFIRE, 2024; fig. 3). No known regulation or diversions of the East Fork of the White River occur upstream from the streamgage.
Statistical analyses were done using daily mean streamflow data from 1958 to 2023. Plots of the 1-, 7-, and 30-day minimum streamflow, the 1-, 7-, and 30-day maximum streamflow, the annual median and annual mean streamflow, along with the p-value and a LOWESS-based smoothed trend line (using a 30-year smooth window) are presented in figure 16A. No trends were significant (all p-values>0.05), but the p-value for the annual 30-day maximum streamflow trend (p=0.050) was equal to the threshold of p<0.05 (table 15).
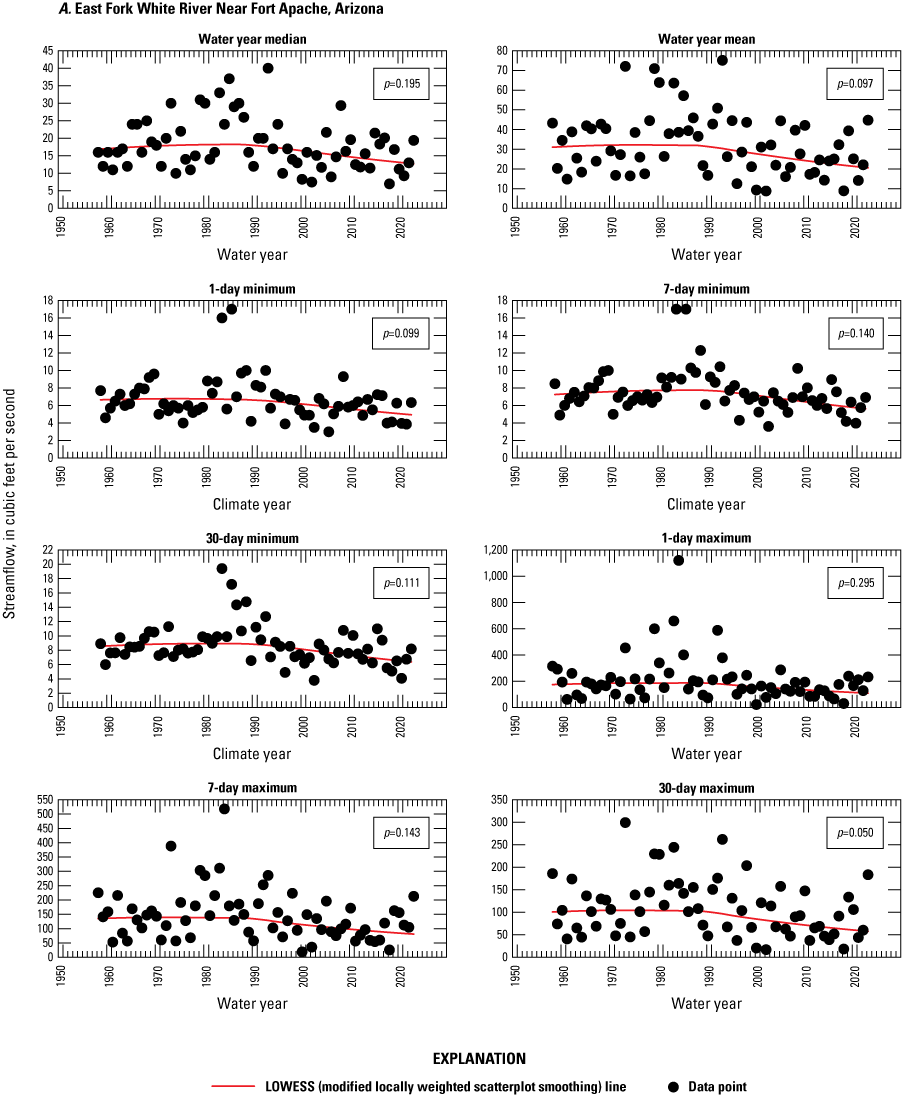
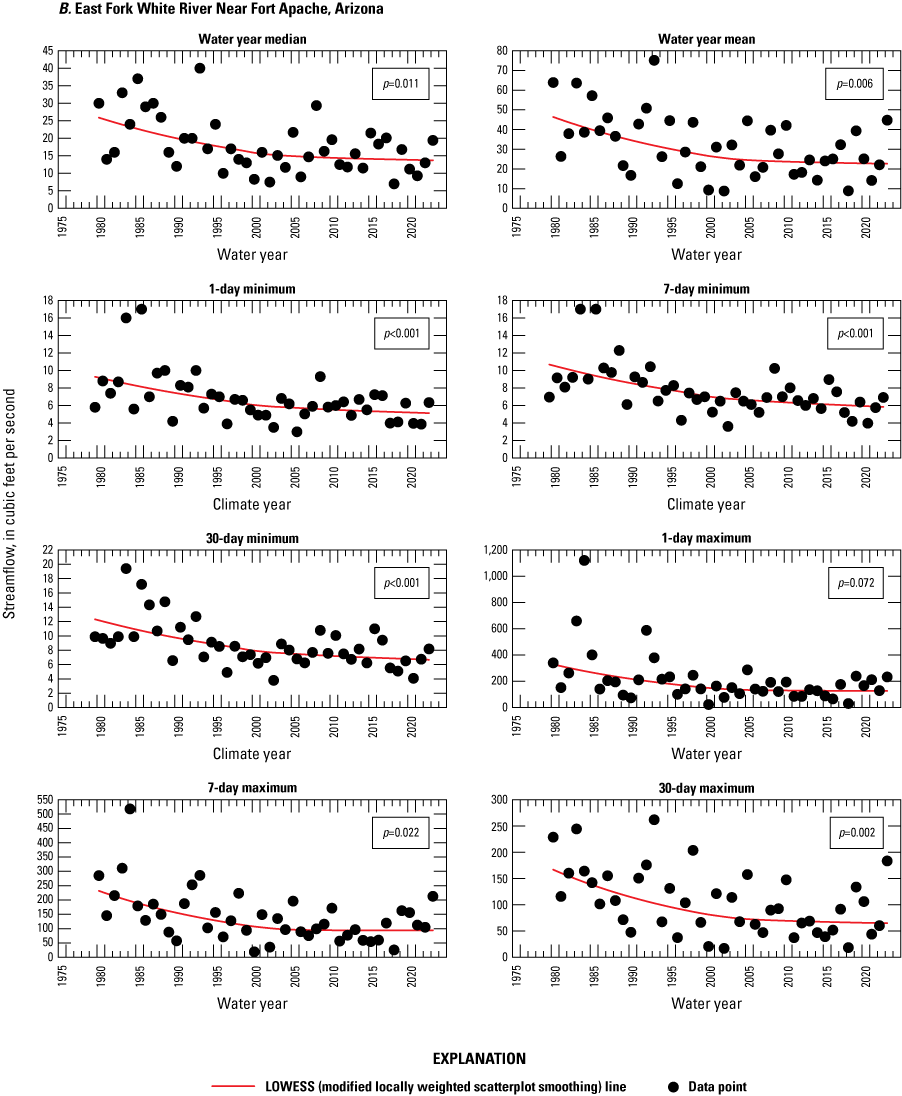
Scatterplots showing the statistical analyses for annual median, mean, and 1-, 7-, and 30-day minimum and maximum streamflow from U.S. Geological Survey streamgage East Fork White River Near Fort Apache, Arizona (station 09492400) for A, years 1958–2023, and B, 1980–2023.
For all annual streamflow plots analyzed, an inflection point appears in the smoothed trend line in the late 1980s (fig. 16). Prior to the late 1980s, the trend lines are mostly flat; however, after this period, the lines have a clear negative slope. For this reason, additional trend analyses were done for the record from 1980 to 2023. For this period, all trends were negative and significant (p<0.05) except for the 1-day maximum streamflow; although the 1-day maximum streamflow did have a p-value near the p<0.05 threshold (p=0.072; fig. 16B; table 15). The annual mean streamflow in cubic feet per second can be converted into annual runoff in acre-feet. Using the equation for the LOWESS smooth line with a 20-year smooth window, the annual runoff decreased from about 33,590 acre-ft in 1980 to about 16,360 acre-ft in 2023—a reduction of 17,230 acre-ft, or 51.3 percent (table 16).
Table 16.
Estimated change in average annual runoff calculated using the Theil-Sen slope estimate for six U.S. Geological Survey streamgages on the Fort Apache Reservation, Arizona, 1980–2023.[All data are from the U.S. Geological Survey National Water Information System database (U.S. Geological Survey, 2024). acre-ft, foot per acre; p-value, probability value; Az., Arizona; AZ., Arizona; AZ, Arizona]
Snowmelt Peaks
Because the headwaters of the East Fork White River originate in the White Mountains (fig. 1), streamflow data from East Fork White River Near Fort Apache were analyzed to identify potential trends related to mountain snowmelt runoff. The center of mass for the total streamflow from March through June of each calendar year was used to represent the annual snowmelt peak. The “Data Sources and Methods of Analysis” section provides a detailed description of how the center of mass was calculated. In addition, the total springtime flow volume was analyzed for possible trends.
Using data from 1958 to 2023, the Mann-Kendall test applied to the day of year when the spring snowmelt peak occurred at this streamgage identified a significant (p<0.05) negative Theil-Sen slope estimate (fig. 17A; table 17). The Theil-Sen line indicates that the average date of the spring snowmelt peak was around May 4 early in the record, but by 2023, it had shifted to around April 22 (fig. 17A). This represents a shift of 12 days to an earlier date for the spring snowmelt peak (table 17).
A similar analysis was done to look for a trend in the day of year for the annual spring snowmelt peak from 1980 to 2023 because other significant trends were detected in streamflow data from this period. Again, the Mann-Kendall test produced a negative Theil-Sen slope estimate that was significant (p<0.05; table 17). The Theil-Sen line indicates the average date of the spring snowmelt peak was around May 2 early in the record, but by 2023 the average date of the peak has been occurring around April 20 (fig. 17B). This is a shift to an earlier date for spring snowmelt peak of 12 days (table 17).
The total annual springtime (March–June) streamflow volume from 1958 to 2023 was tested for a trend using the Mann-Kendall test. Although this test produced a negative Theil-Sen slope estimate, the trend was not significant (p>0.05; fig. 17C; table 17).
An analysis of data from 1980 to 2023 revealed a significant negative trend (p<0.05) in the total annual springtime (March–June) volume of streamflow (fig. 17D; table 17). Despite the variability in the data for this period, the trend line indicates that the average volume of springtime streamflow early in the period was about 17,900 acre-ft, but by 2023, the average volume of springtime streamflow had decreased to about 6,700 acre-ft (table 17). This is a 62.6 percent decrease in the average volume of springtime streamflow. During this period, the smallest volume of recorded springtime streamflow was about 1,700 acre-ft in 2002, whereas the largest volume of recorded springtime streamflow was about 38,200 acre-ft in 1993 (fig.17D).
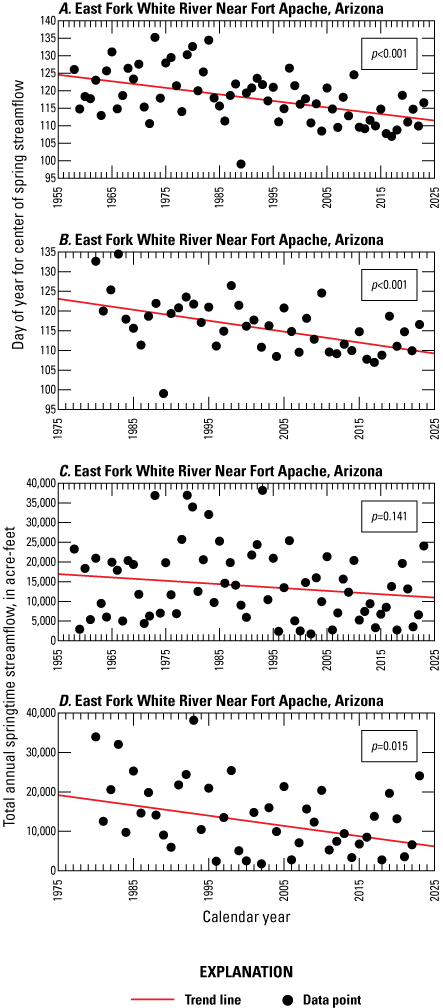
Scatterplots showing the day of year for the occurrence of the center of springtime (March–June) streamflow from U.S. Geological Survey (USGS) streamgage East Fork of the White River Near Fort Apache, Arizona (station 09492400) for A, 1958–2023, and B, 1980–2023. Total annual springtime (March–June) streamflow from USGS streamgage East Fork of the White River Near Fort Apache, Arizona (09492400) for C, 1958–2023, and D, 1980–2023.
Table 17.
Change in the timing and magnitude of the spring snowmelt peak, using Mann-Kendall test and Theil-Sen slope estimate, for U.S. Geological Survey streamgage East Fork White River Near Fort Apache, Arizona (station 09492400), 1958–2023 and 1980–2023.[All data are from the U.S. Geological Survey National Water Information System database (U.S. Geological Survey, 2024). p-value, probability value; acre-ft, acre feet; beg., beginning]
Palmer Hydrological Drought Index
The PHDI computed for Arizona Climate Division 4 (East Central) by the National Centers for Environmental Information (NCEI, 2024) was compared to streamflow data from East Fork White River Near Fort Apache. The PHDI is a water-balance model that analyzes precipitation, temperature, and surface and groundwater supplies to detect long-term drought. The PHDI for Arizona Climate Division 4 (East Central) and the annual mean streamflow measured at East Fork White River Near Fort Apache from 1958 to 2023 are plotted in fig. 18. Both parts of the figure contain a LOESS smooth line that was generated using the ggplot2 R package (Wickham, 2016; Wickham and others, 2024), in contrast to the other streamflow figures described in this section that contain a modified LOWESS smooth line that was generated using the EGRET R package (Hirsch and De Cicco, 2015; Hirsch and others, 2023). The LOESS smooth line for the Arizona Climate Division 4 (East Central) PHDI data (fig. 18A) is shaped similarly to the LOESS smooth line for the streamflow data (fig. 18B). Both curves show a positive slope from the beginning of the period in 1958 to sometime in the early 1980s, followed by a negative slope that eventually starts to gradually increase again around 2010 and continues to increase through the end of the period in 2023. One notable difference between the two smooth lines is that the line for PHDI ends considerably lower in 2023 than the level at which it started in 1958 (fig. 18A). In contrast, the line for annual mean streamflow begins and ends at roughly the same level (fig. 18B). Nonetheless, the similarities in the two smooth lines likely indicates the streamflow recorded at East Fork White River Near Fort Apache was, at least in part, responding to climate trends that were occurring in Arizona Climate Division 4 (East Central).
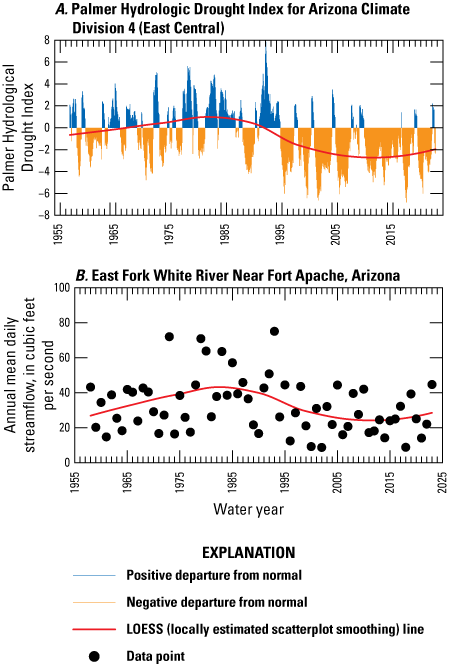
Graphs showing A, Palmer Hydrologic Drought Index for Arizona Climate Division 4 (East–Central; National Centers for Environmental Information, 2024), and B, annual mean streamflow from U.S. Geological Survey East Fork White River Near Fort Apache streamgage (station 09492400) for water years 1958–2023.
White River Near Fort Apache, Arizona, Streamgage
The White River Near Fort Apache, Arizona, streamgage has been in continuous operation since October 1957. Several small, man-made recreational lakes receive streamflow upstream from the streamgage, and some water is diverted upstream from the streamgage for irrigation (U.S. Geological Survey, 2024). In addition, surface water from the North Fork of the White River is used as a municipal water supply for communities around Whiteriver, Arizona. The design capacity for the intake used in this system is about 4 million gallons per day, or 6 cubic feet per second (ft3/s; Bureau of Reclamation, 2022). Because of these anthropogenic water uses, streamflow measured at this streamgage does not represent natural conditions. However, the record from this streamgage is still informative for assessing whether the perceived decrease in water availability on the Fort Apache Reservation could be quantified using existing hydrologic data. The streamgage is about 4.5 mi upstream from the White River’s confluence with the Black River and about 1 mi west of Fort Apache (fig. 1) at an elevation of 4,368 ft in the Carrizo Slope Physiographic Subprovince identified by Moore (1968). The drainage area upstream from the streamgage is 632 mi2 (U.S. Geological Survey, 2024). Most of this area is covered with ponderosa pine and pinyon-juniper woodlands; however, there are areas with other vegetative cover and areas of urban development as well (LANDFIRE, 2024; fig. 3).
Statistical analyses were done using daily mean streamflow data from 1958 to 2023. Plots of the 1-, 7-, and 30-day minimum streamflow, the 1-, 7-, and 30-day maximum streamflow, and the annual median and annual mean streamflow, along with the p-value and a LOWESS-based smoothed trend line (using a 30-year smooth window) are presented in figure 19A. Only the 30-day maximum streamflow showed a significant trend (p<0.05). However, the 30-day minimum, 7-day maximum, annual median, and annual mean streamflows had p-values near the p<0.05 threshold (table 15).
For all annual streamflow plots analyzed, an inflection point in the smoothed trend line occurs in the late 1980s. Prior to the late 1980s, trend lines are mostly flat or slightly positive, but after this period, they show clear negative slopes. For this reason, additional trend analyses were done for the data from 1980 to 2023. For this period, all trends were negative and significant at the p<0.05 level except for the 1-day maximum streamflow (fig. 19B; table 15). Using the equation for the LOWESS smooth line with a 20-year smooth window, the annual runoff decreased from about 200,760 acre-ft in 1980 to about 69,280 acre-ft in 2023—a reduction of 131,480 acre-ft, or 65.5 percent (table 16).
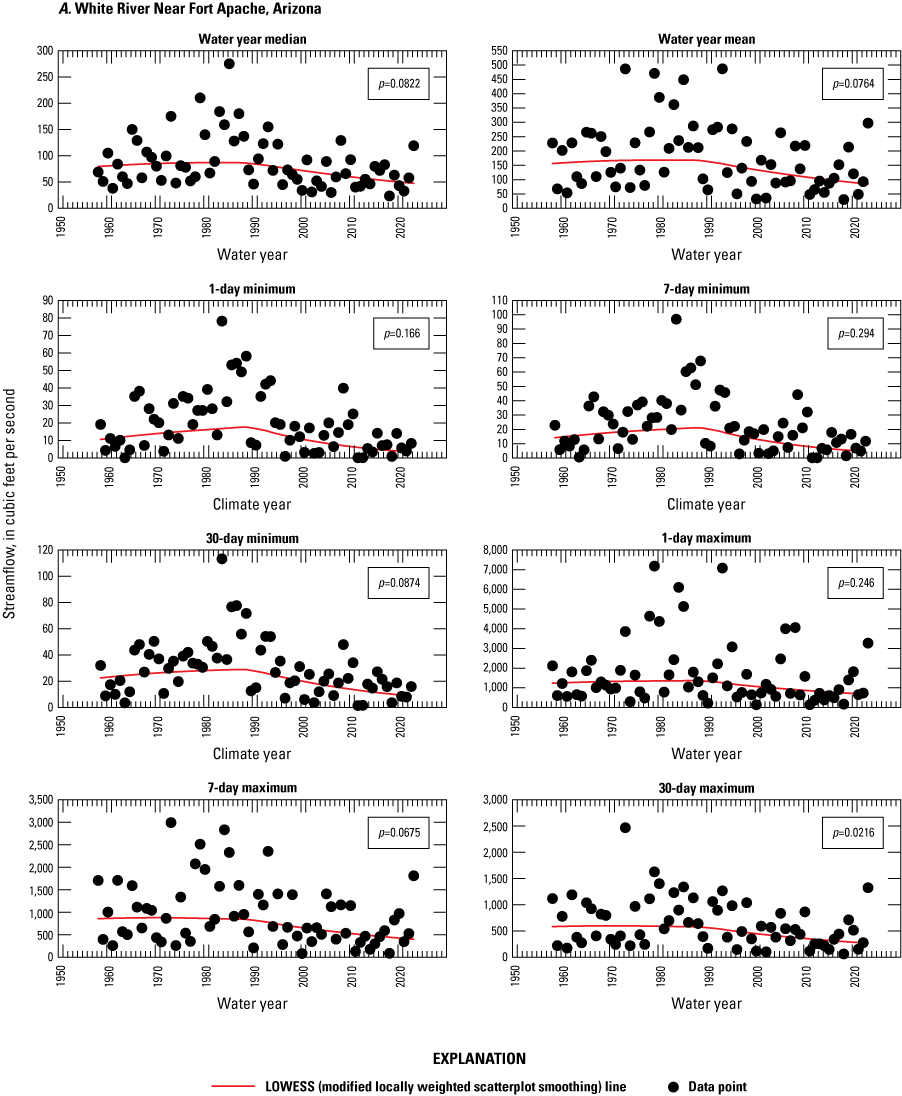
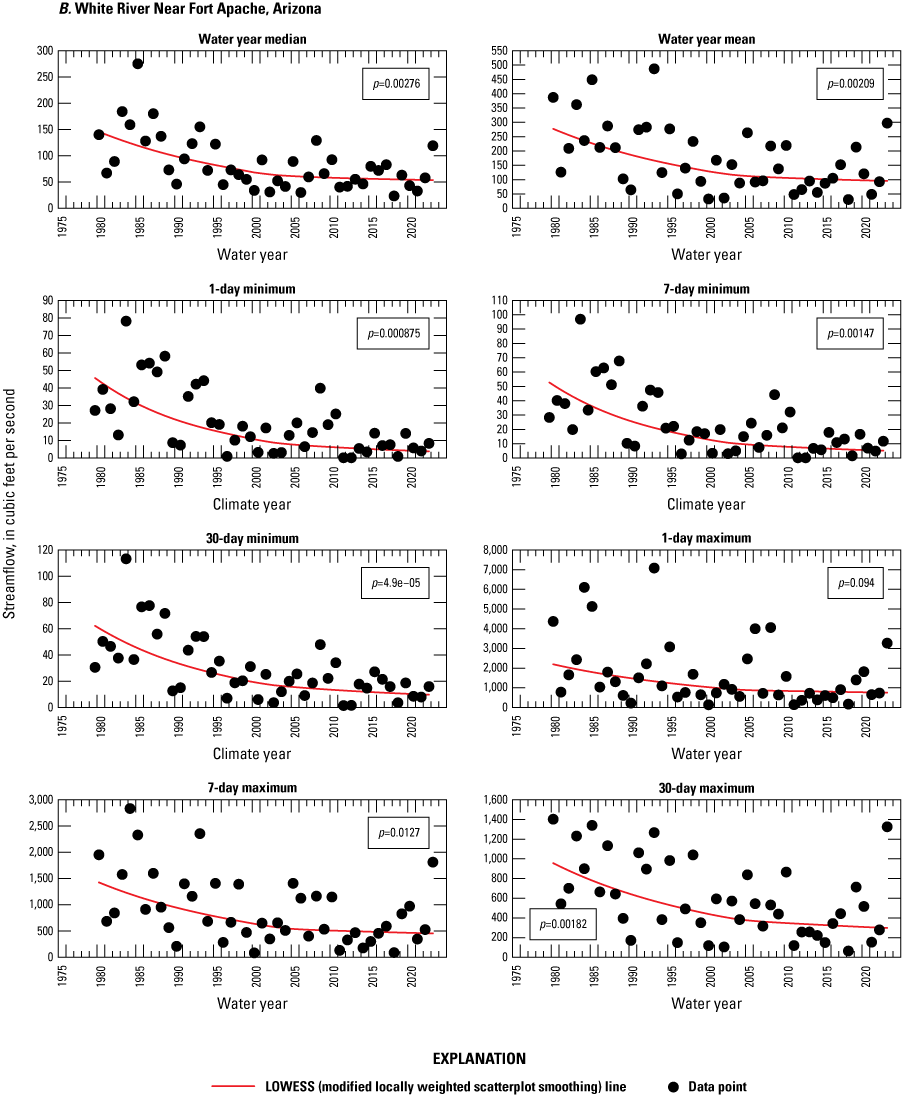
Scatterplots showing the statistical analyses for annual median, mean, and 1-, 7-, and 30-day minimum and maximum streamflow from U.S. Geological Survey streamgage White River Near Fort Apache, Arizona (station 09494000) for the calendar years A, 1958–2023, and B, for water years 1980–2023.
Black River Near Fort Apache, Arizona, Streamgage
The Black River Near Fort Apache, Arizona, streamgage (USGS station 09490500; fig. 1) has been in continuous operation since October 1957. There is negligible storage in several small recreational lakes upstream from the streamgage and one transbasin diversion (Willow Creek diversion) that removes water from the river for industrial and municipal use at the Black River pump station, about 0.4 mi downstream from the Black River’s confluence with Freezeout Creek (fig. 1). Flow in the diversion was measured from 1945 to 2002 by the Black River streamgage. During this time period, maximum daily mean diversion flows ranged from 0 to 28 ft3/s (U.S. Geological Survey, 2024). Because of this diversion, streamflow measured at the Black River streamgage cannot be considered to represent the natural condition. However, the record from this streamgage is still informative for assessing whether the perceived decrease in water availability on the Fort Apache Reservation could be quantified using existing hydrologic data.
The streamgage is about 5 mi upstream from the Black River’s confluence with the White River and about 14 mi west of Fort Apache (fig. 1) at an approximate elevation of 4,345 ft in the Carrizo Slope Physiographic Subprovince identified by Moore (1968). The drainage area of the stream upstream from the streamgage is 1,232 mi2 (U.S. Geological Survey, 2024). Much of the drainage area upstream from the streamgage is covered with ponderosa pine and pinyon-juniper woodlands, and some grasslands; however, smaller areas have other vegetative cover (LANDFIRE, 2024).
Statistical analyses were done using daily mean streamflow data from 1958 to 2023. Plots of the 1-, 7-, and 30-day minimum streamflow, the 1-, 7-, and 30-day maximum streamflow, and the annual median and annual mean streamflow, along with the p-value and a LOWESS-based smoothed trend line (using a 30-year smooth window), are presented in figure 20A. No trends were significant at the p<0.05 level (table 15).
For all annual streamflow plots analyzed, an inflection point in the smoothed trend line occurs in the late 1980s. Prior to the late 1980s, the trend line is either mostly flat or has a positive slope, but after this period, the line has a clear negative slope. For this reason, additional trend analyses were done from 1980 to 2023. For this period, all slope estimates were negative, and all trends were significant (p<0.05) except for the 1-, 7-, and 30-day maximum streamflow and the annual mean streamflow. However, the annual mean streamflow had a p-value near the p<0.05 threshold (p=0.070; fig. 20B; table 15). Using the equation for the LOWESS smooth line with a 20-year smooth window, the annual runoff decreased from about 351,850 acre-ft in 1980 to about 154,930 acre-ft in 2023—a reduction of 196,920 acre-ft, or 56.0 percent (table 16).
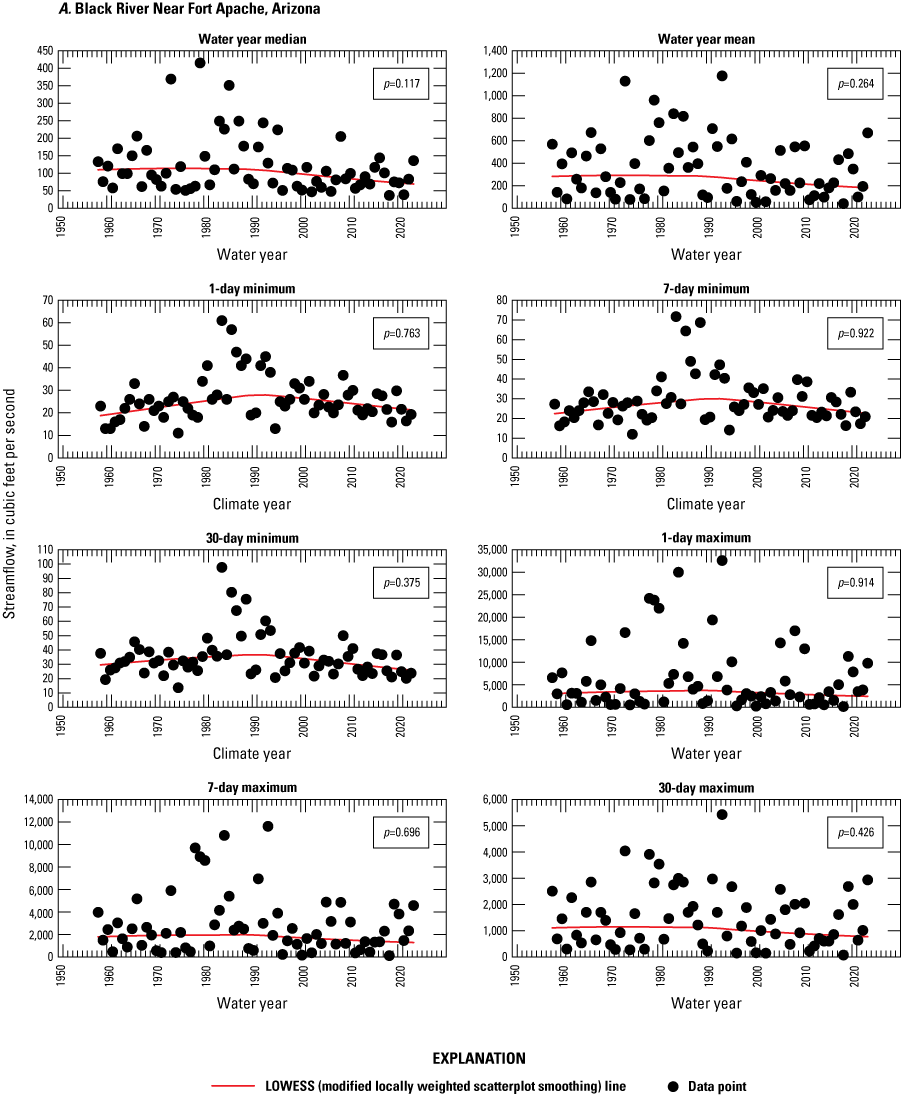
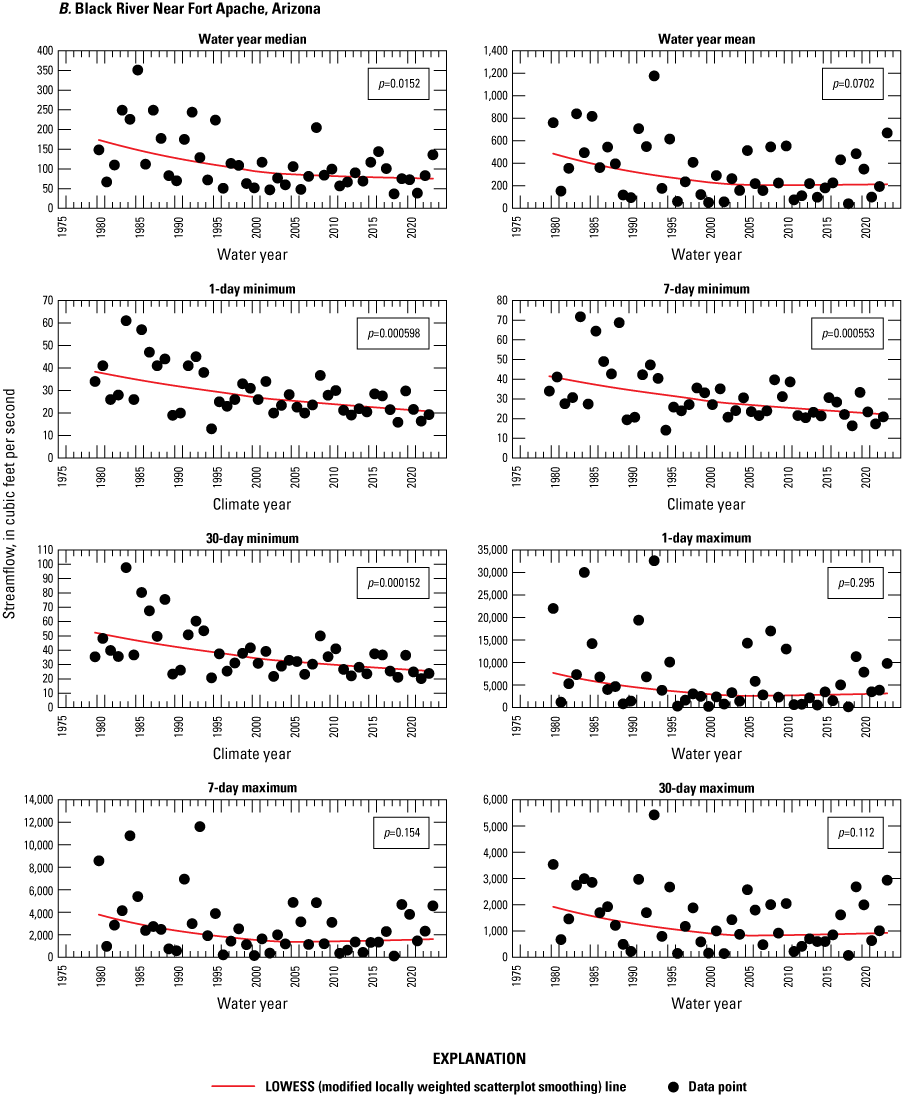
Scatterplots showing the statistical analyses for annual median, mean, and 1-, 7-, and 30-day minimum and maximum streamflow from U.S. Geological Survey streamgage Black River Near Fort Apache, Arizona (station 09490500) for A, 1958–2023, and B, 1980–2023.
Cibecue Creek near Chrysotile, Arizona, Streamgage
The Cibecue Creek near Chrysotile streamgage (fig. 1) has been in continuous operation since May 1959. Small diversions are reported upstream from the streamgage near Cibecue, Arizona (diversions not shown in fig. 1). Streamflow measured at this streamgage might not be considered the natural condition because of these small diversions. However, the record from this streamgage is still informative for assessing whether the perceived decrease in water availability on the Fort Apache Reservation could be quantified using existing hydrologic data. The streamgage is about half a mile upstream from Cibecue Creek’s confluence with the Salt River and about 7 mi north of the former mining town of Chrysotile, Arizona (fig. 1) at an elevation of 3,185 ft in the Canyon Creek–Salt River Canyon Physiographic Subprovince identified by Moore (1968). The drainage area upstream from the streamgage is 295 mi² (U.S. Geological Survey, 2024). Upstream from the streamgage, the drainage area consists of woodlands containing pinyon pine, juniper, and oak trees (LANDFIRE, 2024).
Statistical analyses were done using daily mean streamflow data from 1961 to 2023. Plots of the 1-, 7-, and 30-day minimum streamflow, the 1-, 7-, and 30-day maximum streamflow, and the annual median and annual mean streamflow, along with the p-value and a LOWESS-based smoothed trend line (using a 30-year smooth window), are presented in Figure 21A. Only the 7- and 30-day maximum streamflow and annual mean streamflow had a significant trend (p<0.05; table 15).
For most annual streamflow plots analyzed, an inflection point in the smoothed trend line occurs around 1990. Prior to 1990, most trend lines are mostly flat or have a positive slope, but after this period, the line has a clear negative slope. For this reason, additional trend analyses were done for data from 1980 to 2023. For this period, all trends were negative and significant at the p<0.05 level except for the 1-, 7-, and 30-day maximum streamflow, although the 30-day maximum streamflow had a p-value (p=0.082) slightly above the p<0.05 threshold (fig. 21B; table 15). Using the equation for the LOWESS smooth line with a 20-year smooth window, the average annual runoff decreased from about 38,590 acre-ft in 1980 to about 14,480 acre-ft in 2023—a reduction of 24,110 acre-ft, or 62.5 percent (table 16).
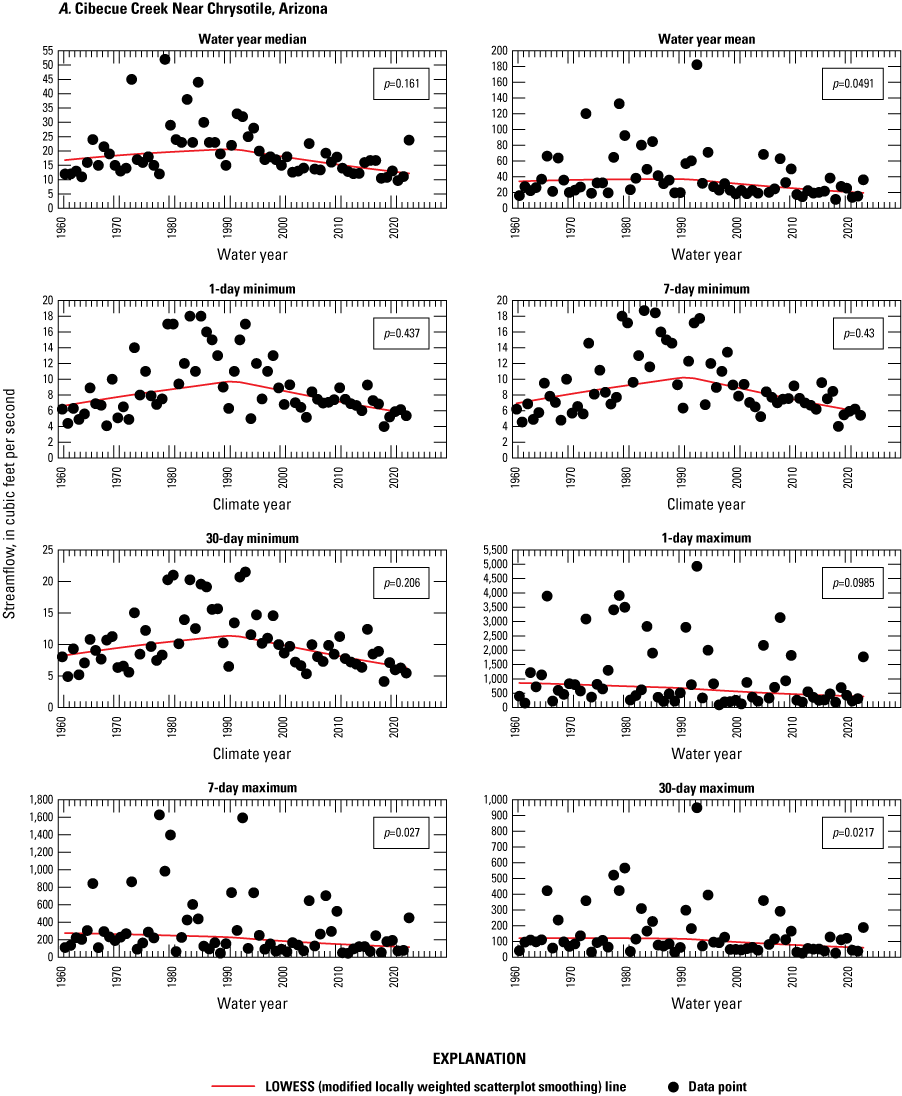
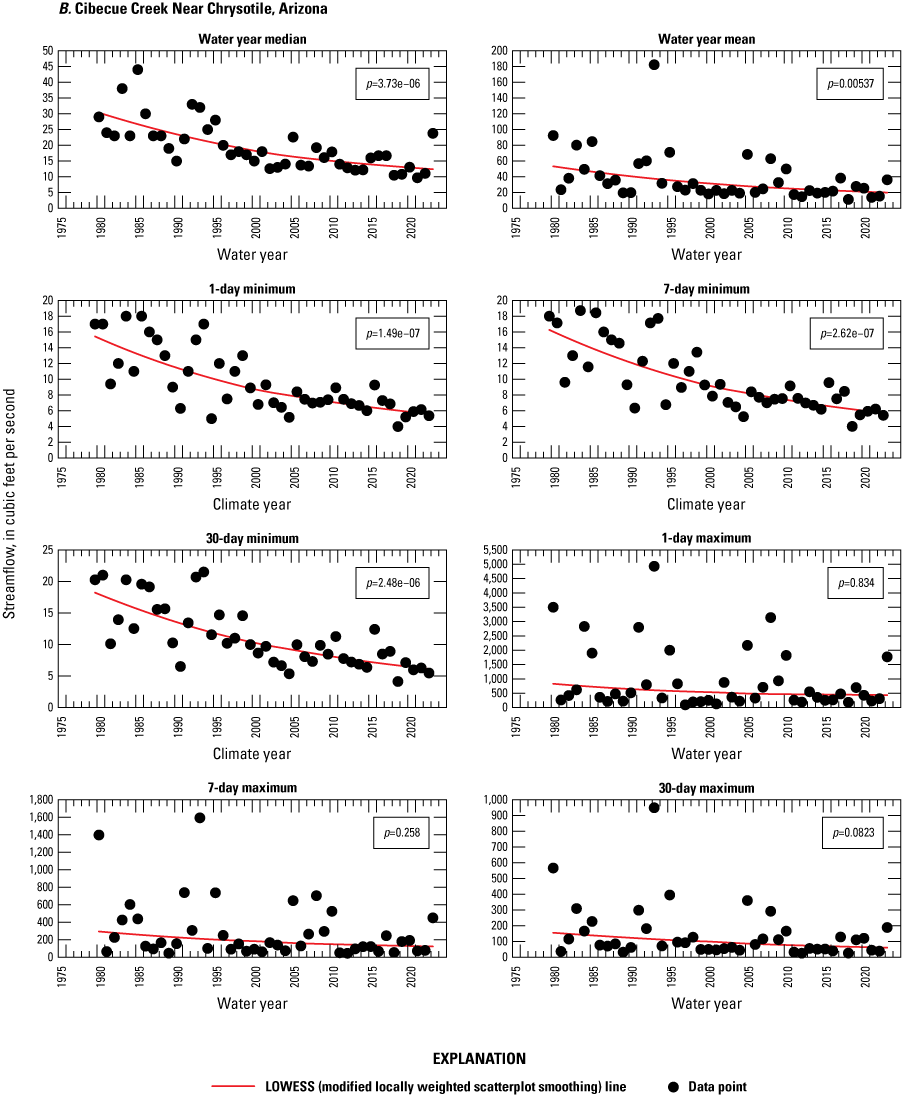
Scatterplots showing the statistical analyses for annual median, mean, and 1-, 7-, and 30-day minimum and maximum streamflow from U.S. Geological Survey streamgage Cibecue Creek near Chrysotile, Arizona, (station 09497800) for A, 1961–2023, and B, 1980–2023.
Carrizo Creek near Show Low, Arizona, Streamgage
The Carrizo Creek Near Show Low, Arizona (USGS station 09496500; hereafter, Carrizo Creek streamgage) streamgage has been in continuous operation since April 1977. The streamgage is near the intersection of U.S. Highway 60 and State Highway 73 (fig. 1) at an elevation of 4,750 ft in the Carrizo Slope Physiographic Subprovince identified by Moore (1968). The drainage area upstream from the streamgage is 439 mi2 (U.S. Geological Survey, 2024) and primarily consists of woodlands containing juniper, pinyon pine, ponderosa pine, and oak trees (LANDFIRE, 2024). A transbasin diversion from Show Low Creek affected the streamflow record from this streamgage prior to 2006. Additionally, diversions for irrigation of areas less than 300 acres are reported upstream from the streamgage (U.S. Geological Survey, 2024). Because of these diversions, streamflow measured at the Carrizo Creek streamgage cannot be considered to represent the natural condition. However, the record from this streamgage is still informative for assessing whether the perceived decrease in water availability on the Fort Apache Reservation could be quantified using existing hydrologic data.
Statistical analyses were done using daily mean streamflow data from 1978 to 2023. Plots of the 1-, 7-, and 30-day minimum streamflow, the 1-, 7-, and 30-day maximum streamflow, and the annual median and annual mean streamflow, along with the p-value and a LOWESS-based smoothed trend line (using a 20-year smooth window), are presented in figure 22. The trends were all negative and significant (p<0.05) apart from the 1-day maximum streamflow (p=0.214; table 15). For consistency, the equation for the LOWESS smooth line was used to calculate how much the annual runoff has changed from 1980 to 2023 (in contrast to using the full record from 1978 to 2023). The average annual runoff decreased from about 35,140 acre-ft in 1980 to about 6,380 acre-ft in 2023—a reduction of 28,760 acre-ft, or 81.8 percent (table 16).
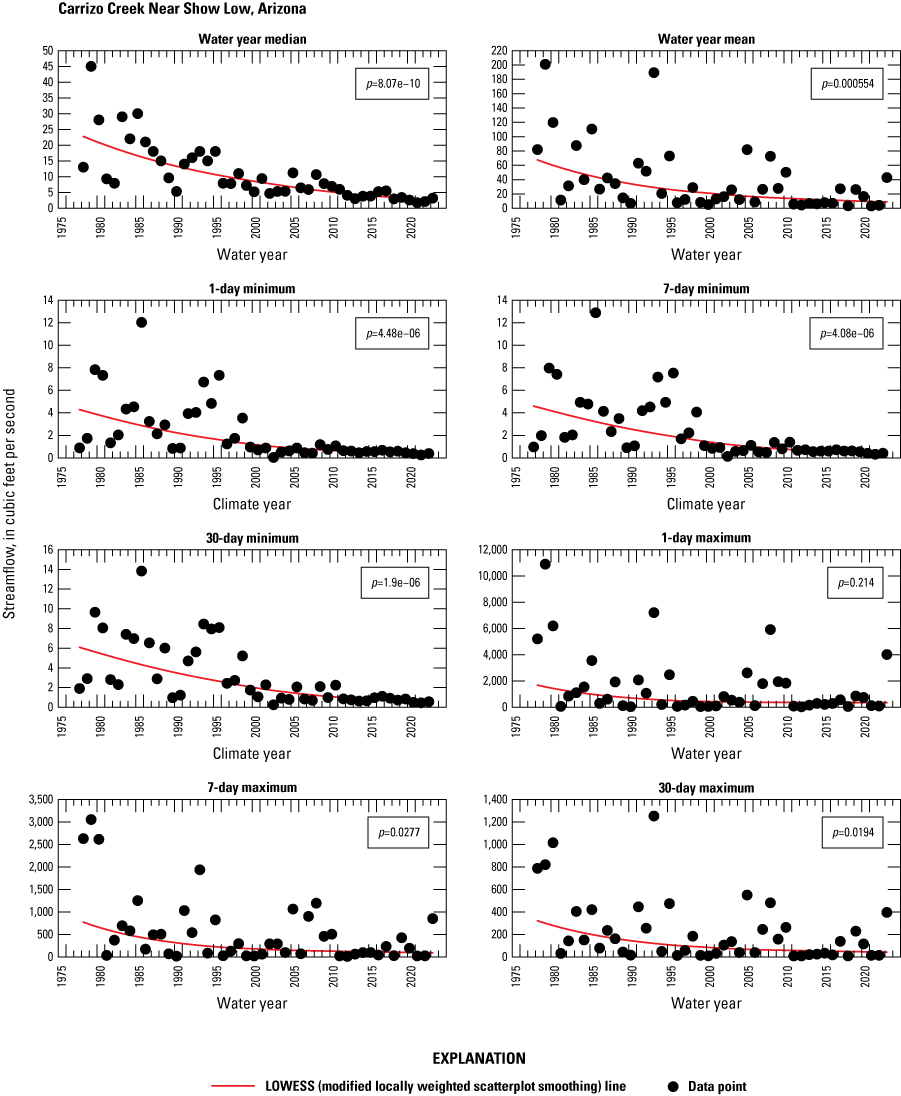
Scatterplots showing the statistical analyses for annual median, mean, and 1-, 7-, and 30-day minimum and maximum streamflow from U.S. Geological Survey streamgage Carrizo Creek Near Show Low, Arizona (station 09496500), for 1978–2023.
Salt River Near Chrysotile, Arizona, Streamgage
The Salt River Near Chrysotile streamgage has been in continuous operation since September 1924. The streamgage is 5.7 mi northeast of Chrysotile and upstream from the U.S. Highway 60 bridge (fig. 1) at an elevation of 3,355 ft in the Canyon Creek–Salt River Canyon Physiographic Subprovince identified by Moore (1968). The drainage area upstream from the streamgage is 2,849 mi2 (U.S. Geological Survey, 2024). The drainage area upstream from the streamgage is primarily forest and grassland (LANDFIRE, 2024).
The Salt River Near Chrysotile record has been affected by minor irrigation diversions from tributary streams, a transbasin inflow from Show Low Lake, and a transbasin outflow from the Black River to Willow Creek in the Gila River Basin. For these reasons, streamflow measured at Salt River Near Chrysotile cannot be considered to represent the natural condition. However, the record from this streamgage is still informative for assessing whether the perceived decrease in water availability on the Fort Apache Reservation could be quantified using existing hydrologic data.
Statistical analyses were done using daily mean streamflow data from 1925 to 2023. Plots of the 1-, 7-, and 30-day minimum streamflow, the 1-, 7-, and 30-day maximum streamflow, and the annual median and annual mean streamflow, along with the p-value and a LOWESS-based smoothed trend line (using a 30-year smooth window), are presented in Figure 23A. In all cases, the overall slopes of the smoothed trend lines were negative, and the 7- and 30-day minimum streamflow trends were significant (p<0.05). In addition, the p-value for the annual 1-day minimum streamflow (p=0.074) was close to the p<0.05 threshold (table 15).
Two obvious inflection points are in the smooth lines of all the annual streamflow plots analyzed from 1925 to 2023. The first inflection point, which occurs around 1960, is discussed in later report sections. The second inflection point occurs in the mid- to late-1980s, the same period observed in most of the other streamflow records described in this section. Between about 1960 and the 1980s, the trend lines either have positive slopes or are mostly flat, but after this period, the lines have clear negative slopes. For this reason, additional trend analyses were done for the period from 1980 to 2023. For this period, all trends were negative and were significant (p<0.05), except for the 1-, 7-, and 30-day maximum streamflow; although, the 30-day maximum streamflow had a p-value (p=0.061) near the p<0.05 threshold (fig. 23B; table 15). Using the equation for the LOWESS smooth line with a 20-year smooth window, the average annual runoff decreased from about 658,810 acre-ft in 1980 to about 273,660 acre-ft in 2023—a reduction of 385,150 acre-ft, or 58.5 percent (table 16).
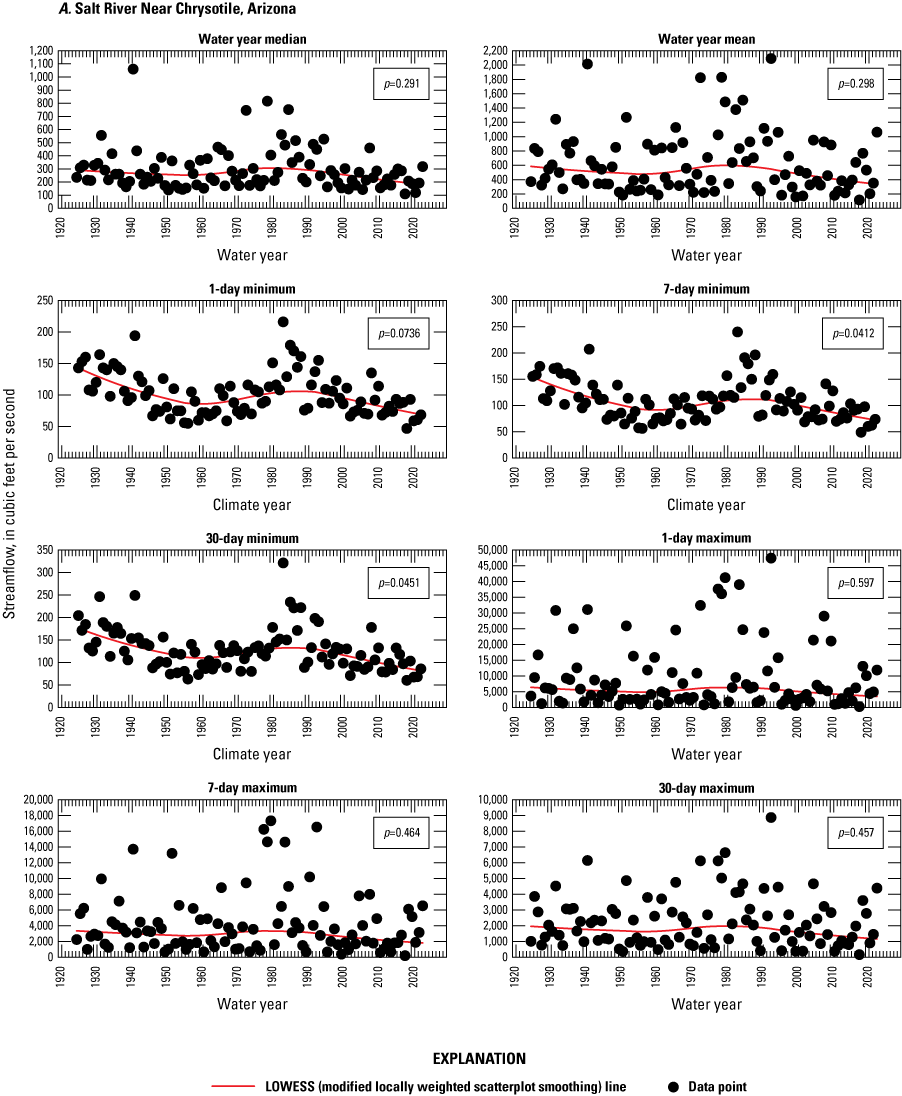
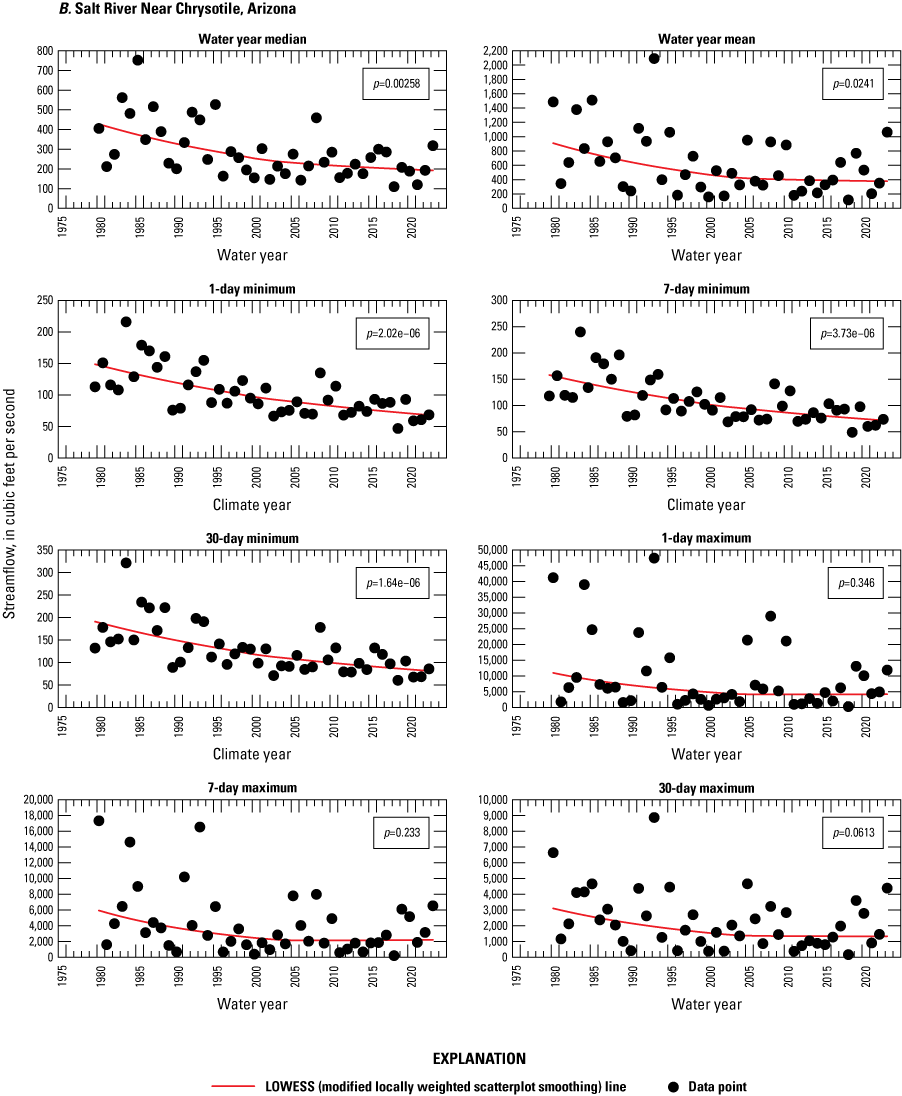
Scatterplots showing the statistical analyses for annual median, mean, and 1-, 7-, and 30-day minimum and maximum streamflow from U.S. Geological Survey streamgage Salt River Near Chrysotile, Arizona (station 09497500) for A, 1925–2023, and B, 1980–2023.
Palmer Hydrological Drought Index
The PHDI computed for Arizona Climate Division 4 (East Central) by the National Centers for Environmental Information (2024) was compared to streamflow data from Salt River Near Chrysotile. Although the streamflow record from Salt River Near Chrysotile is affected by irrigation diversions and transbasin inflows and outflows, a comparison of the record with the PHDI is nonetheless informative. Plots and LOESS smooth lines of the PHDI for Arizona Climate Division 4 (East Central) and annual mean streamflow at Salt River Near Chrysotile from 1925 to 2023 are shown in Figure 24. The smooth lines in both plots have similar shapes (fig. 24). Both smooth lines indicate negative trends from the beginning of the period in 1925 to sometime around 1960, followed by a positive trend until the mid-1980s, and then another negative trend until the end of the period, in 2023. This comparison indicates that the streamflow at Salt River Near Chrysotile was likely responding, at least in part, to regional climate trends across Arizona Climate Division 4 (East Central).
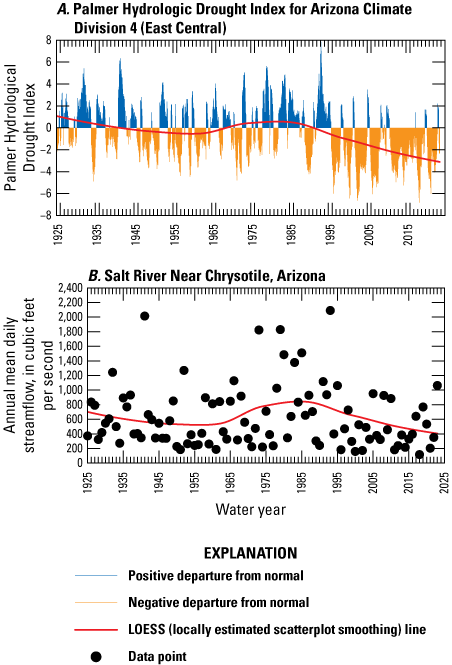
Graphs showing the A, Palmer Hydrological Drought Index for Arizona Climate Division 4 (East Central; National Centers for Environmental Information, 2024), and B, annual mean streamflow from U.S. Geological Survey streamgage Salt River Near Chrysotile, Arizona (station 09497500), for 1925–2023 (U.S. Geological Survey, 2024).
Discussion
According to the Intergovernmental Panel on Climate Change (IPCC), “Many weather and climate extremes are the result of natural climate variability (including phenomena such as El Niño), and natural decadal or multidecadal variations in the climate provide the backdrop for anthropogenic climate changes,” and “[e]ven if there were no anthropogenic changes in climate a wide variety of natural weather and climate extremes would still occur” (IPCC, 2012, p. 115). However, evidence indicates that some weather extremes “have changed as a result of anthropogenic influences, including increases in atmospheric concentrations of greenhouse gases” (IPCC, 2012, p. 112). In addition, it is likely “that anthropogenic influences have led to warming of extreme daily minimum and maximum temperatures at the global scale,” and that “there is medium confidence that anthropogenic influences have contributed to intensification of extreme precipitation at the global scale” (IPCC, 2012, p. 112). Given the complexities of understanding natural climate variability versus human-caused climate change, assessing the causes of the climate change identified in this study was considered beyond the scope of the study. The following report sections will instead compare the findings of this study with other published literature on the southwest climate and will also compare the results of this and other studies with the memories of White Mountain Apache Tribal members as they relate to climate change on the Fort Apache Reservation.
Climate in the Southwest
Vose and others (2017) reported the observed change in annual average near-surface air temperature for the southwestern United States. The change was measured by computing the difference between the average near-surface air temperature in the southwestern United States from 1986 to 2016 and the average temperature from 1901 to 1960. Using this method, Vose and others (2017) found that the annual average, annual maximum, and annual minimum, near-surface air temperature in the southwestern United States all increased by 1.61 °F between the two time periods. Other temperature characteristics they evaluated using the same difference method included changes in the year's coldest and warmest days. They found that for the southwestern United States, the average coldest day of the year increased by 3.99 °F and the average warmest day increased by 0.50 °F between the two periods.
According to Williams and others (2020), southwestern North America has been anomalously dry and warm in the 21st century relative to the 20th century, resulting in reduced snowpack, reduced river flow and lake levels, declines in groundwater availability, shifts in agricultural activities, forest drought stress, increased wildfire activity, and reduced vegetation carbon uptake. In addition to natural climate variability, they found that an important factor leading to prolonged drought in the southwest was increasing annual mean atmospheric vapor-pressure deficit caused by anthropogenic warming, which leads to an increase in the mean annual total evaporative demand. An increase in evaporative demand would require an increase in annual precipitation to counteract the effects of anthropogenic warming (Williams and others, 2020).
Abatzoglou and Williams (2016) concluded that human-influenced climate change caused more than half of the documented increases in wildfire fuel aridity in the western United States since the 1970s and doubled the cumulative forest fire area beyond that expected from natural climate variability alone between 1984 and 2015. In addition to losses through fire, other effects on forests from climate change include loss of biodiversity, threats to culturally valued native plants and animals, and increases in invasive species or pathogens (Voggesser and others, 2013).
Several studies have documented a shift toward earlier spring snowmelt-derived streamflow (Wahl, 1992; Stewart and others, 2004; Regonda and others, 2005). Stewart and others (2005) analyzed streamflow records from 302 sites in western North America that had snowmelt-dominated flow. Using several different measures, they found widespread shifts toward earlier onsets of springtime snowmelt and streamflow across most of western North America. They concluded that the shifts represented an advance to earlier streamflow timing by one to four weeks in recent decades relative to conditions that prevailed in the 1950s through the mid-1970s (Stewart and others, 2005).
Climate on the Fort Apache Reservation
Through interviews with community members of the White Mountain Apache Tribe of the Fort Apache Reservation, Arizona, Gauer (2019) identified four categories of climate change effects on the Fort Apache Reservation—climate and seasonal patterns, aridification, increased risks, and traditional resources.
Climate and Seasonal Patterns
Examples of perceived changes in climate and seasonal patterns recorded by Gauer (2019) from interviews of White Mountain Apache Tribe of the Fort Apache Reservation, Arizona, community members are shown in table 18. Warmer temperatures with less predictable weather and changes in seasonal patterns are a common theme among the community members interviewed. The statistical analyses of near-surface air temperature recorded at Whiteriver 1 SW described in the “Trend Analyses Results” section support these observations. These results show that this station's overall average annual air temperature increased by 1.35 °F from 1901 to 2023 (fig. 7; table 2). However, a more striking change was observed when that period was broken into two periods, from 1901 to 1979 and from 1980 to 2023. The average annual temperature decreased by 1.57 °F from 1901 to 1979, then increased by 2.48 °F from 1980 to 2023 (fig. 7; table 2), indicating that recent warming has been greater than earlier in the record. Another notable observation is that the average monthly mean and average monthly maximum temperatures from March for this station increased significantly during the period from 1980 to 2023. The average monthly mean temperature for March increased by 2.91 °F, whereas the average monthly maximum temperature for March increased by 5.39 °F (fig. 8A, B; tables 5, 6).
Table 18.
Effects of climate change on the White Mountain Apache Tribe of the Fort Apache Reservation, Arizona, Tribal community as documented by Gauer (2019).Warming temperatures alone can affect the character of winter precipitation. Knowles and others (2006) evaluated seasonal (November–March) snowfall liquid water equivalent from NOAA COOP stations in the 11 westernmost states from 1949 to 2004 and compared it to the seasonal total precipitation. The largest reductions in snowfall liquid water equivalent they documented appeared to be shifts from snowfall to rainfall, driven by warming at temperate, low to moderate elevations. This pattern is apparent in observed changes in snowfall amounts and the timing of snowmelt-derived runoff on the Fort Apache Reservation described in the following four sections.
Aridification
Examples of perceived aridification and its effects reported by Gauer (2019) are listed in table 18. Nine community members reported lower snowfall as an example of aridification. Specific examples described in interviews include a shorter ski season in recent years at the Sunrise Park Resort with an earlier end to the snowpack on Mount Baldy. Other examples included perceived decreases in snowfall or persistence of snow in community areas like McNary. Seven community members reported drier weather and five reported lower rainfall. One member reported that soaking summer rains are decreasing in frequency. Five community members reported lower river water levels. In addition, the Director of the White Mountain Apache Tribe of the Fort Apache Reservation, Arizona’s Water Resources Program reported that changes in the flow regimes of streams and increasing water temperatures are causing increased algal growth, which has led to challenges operating part of the Tribe’s drinking water system that relies on flows from the North Fork of the White River (Cheryl Pailzote, White Mountain Apache Tribe of the Fort Apache Reservation, Arizona, Water Resources Program, oral commun., 2023).
Lower Snowfall
The statistical analyses described in the “Snowfall and Snowpack” section provide evidence that there has been a decrease in the annual maximum SWE and an earlier disappearance of the snowpack on Mount Baldy at Baldy 310 and Maverick Fork 617 since measurements began. Based on the trend analyses, the average annual peak SWE has decreased more than 40 percent at both stations and the average date when the snowpack was fully melted in the spring has moved earlier in time from late April to late March (figs. 11A, B, 13A, B; table 12). However, the fact that early April SWE measured at nearby Fort Apache 09R05 did not have a statistically significant trend (p<0.05) across its period of record (1951–2023; fig. 14; table 13) indicates that the history of mountain snowpack in the Mount Baldy area is not fully understood. The perceived decrease in snowfall at lower elevations, particularly in the McNary area, is supported by the negative trend detected in total annual snowfall data collected at McNary 2N. On average, the measured total annual snowfall at the station decreased by 42.4 percent from 1935 to 2023 (fig. 15; table 14).
Drier Conditions
Perceived drier conditions reported by community members are supported by the analyses of annual total precipitation from the five precipitation stations used in this study (tables 8–10). A statistically significant (p<0.05) negative trend in annual precipitation was determined for all five stations using periods from the 1980s to the present (fig. 9C–F, I). The results are more nuanced for the two stations with records dating back to the first half of the 20th century. Using the period from 1901 to 2023 from Whiteriver 1 SW, a significant negative trend (p<0.05) was present. However, no significant trend was found using data from 1934 to 2023, available from McNary 2N (025412; fig. 9G; table 10). As previously stated, McNary 2N does have a significant negative trend in precipitation from 1980 to 2023 (fig. 9I).
Lower River Water Levels
Most plots of streamflow statistics with records going back to at least 1961 have inflection points in their smooth lines that occur in the late 1980s (figs. 16A, 19A, 20A, 21A, 23A). Prior to the late 1980s, most smooth lines are mostly flat or in some cases have a positive slope, whereas after 1990 most smooth lines have a negative slope. However, most of these plots have Mann-Kendall test results with a p-value >0.05, indicating a significant trend was not found using the criteria described in the “Data Sources and Methods of Analysis” section (table 15). Evidence supports that a change in hydrologic drought condition occurred around this late 1980s timeframe since the PHDI for Arizona Climate Division 4 (East Central) also has a similar inflection point around this time (fig. 18A). In addition, all six streamflow records have significant negative trends (p<0.05) for most of the streamflow statistics calculated using the data from 1980 to 2023 (1978–2023 for Carrizo Creek near Show Low; figures 16B, 19B, 20B, 21B, 22, and 23B; table 15). The finding of decreasing streamflow since around 1980 supports the community members’ perception that river water levels are lower now than they remember. The declines in average annual runoff calculated for the six streamgages included in table 16 highlight that these decreased flows are substantial. Annual runoff at all six gages decreased by at least 50 percent from 1980 to 2023. The Carrizo Creek near Show Low streamgage had the largest decrease as a percentage of streamflow (81.8 percent). The Salt River Near Chrysotile streamgage includes streamflows measured upstream by all other study streamgages except for Cibecue Creek near Chrysotile. The estimated decrease in average annual runoff from 1980 to 2023 for Salt River Near Chrysotile is 385,150 acre-ft (table 16). This substantial decrease in annual runoff reduces the availability of a valuable resource for ecological and anthropogenic uses. Furthermore, decreases in streamflow can affect other stream characteristics such as stream temperature, which can, in turn, affect the size and occurrence of nuisance algal blooms and the habitat available for cold-water fish species, such as trout. All the streamflow gages used in this study, except East Fork White River Near Fort Apache, have or had some form of anthropogenic alteration affecting streamflow, so the documented decreases in annual flow cannot be solely attributed to climate change. However, in most cases, the anthropogenic alterations to flow were small relative to the decreases in flow seen.
A similar statistical finding was observed in the analysis of the annual spring snowmelt peak from East Fork White River Near Fort Apache. When data from the entire period of record (1958–2023) was used, no significant trend was detected (fig. 17C; table 17). However, a significant negative trend was detected from 1980 to 2023, indicating a change in average springtime runoff from 17,900 acre-ft in 1980 to 6,700 acre-ft in 2023, a 62.6 percent decrease (fig. 17D; table 17). This further supports the observation that river water levels on the Fort Apache Reservation have become lower during the lifespan of the current residents.
The statistical analysis on the timing of the annual spring snowmelt peak from East Fork White River Near Fort Apache also supports the observations that streamflow regimes have changed. Both periods analyzed (1958–2023 and 1980–2023) indicate that the annual snowmelt peak is happening about 12 days earlier now than it did in the past (fig. 17A, B; table 17). The fact that the annual spring snowmelt peak is occurring 12 days earlier for both periods analyzed (1958–2023 and 1980–2023) indicates that most of this change has happened since around 1980.
Increased Risks
The increased risk most often reported to Gauer (2019) was more frequent wildfires (table 18). This observation is supported by several other recent studies that show the annual area burned by wildfire in the western United States has increased since the mid-1980s (Dennison and others, 2014; Abatzoglou and Williams, 2016; Westerling, 2016; Holden and others, 2018). A couple of examples of recent findings are Mueller and others (2020) and Parks and Abatzoglou (2020). Mueller and others (2020) looked for climate relationships with increasing wildfire in Arizona and New Mexico from 1984 to 2015. They found that the total burned area increased at a rate of 9.5 percent annually, or about 11,000 acres per year, whereas the rate of increase for areas burned at high severity was 17.3 percent, or about 2,000 acres annually (Mueller and others, 2020). Similarly, Parks and Abatzoglou (2020) found that areas burned at high severity had an eightfold increase in western United States forests from 1985 to 2017.
A common theme in many studies examining the increase in wildland fires in the western United States is the rise in vapor pressure deficit (VPD) of the atmosphere, partly driven by anthropogenic temperature increases. Like relative humidity (RH), VPD measures the atmosphere’s ability to hold water vapor. Seager and others (2015) explain that VPD is a more useful absolute measure of the atmospheric moisture state, unlike RH, which is a ratio of two known quantities expressed as a percentage. RH is the ratio, expressed in percent, of the amount of atmospheric moisture present relative to the amount that would be present if the air were saturated. Because RH depends on temperature, it is not a consistent metric to describe the potential loss of water by plants to air and by direct evaporation of other terrestrial water reservoirs. For example, an RH of 20 percent at an air temperature of 60 °F provides much less evaporation potential than an RH of 20 percent at an air temperature of 100 °F.
Vapor pressure deficit is the calculated difference between the saturating pressure (water vapor at equilibrium with condensation) of water in air and the actual water vapor pressure of the air, measured in units of pressure. Although VPD is affected by air temperature, the calculation of VPD is done in such a way that the calculated VPD has the same evaporation potential regardless of air temperature. For example, if the calculated VPD is 0.7 kilopascal (kPa; a value suitable for healthy plant growth), the evaporation potential is the same whether the air temperature is 60 °F or 100 °F. This makes using VPD to assess the atmospheric moisture state more straightforward.
Plants use evapotranspiration to move water and nutrients from the roots through the shoots, so some degree of evaporation potential is desirable. Additionally, excessively wet conditions can lead to the growth of plant pathogens. In general, a VPD between 0.7 to 1.5 kPa is considered good for most plant growth, whereas a VPD greater than 1.5 kPa is considered dry air that can lead to rapid water loss from plants, leaving them more susceptible to wildfires. Seager and others (2015) reported that VPD was extremely high in advance of the June 2002 Rodeo–Chediski fire that burned 468,600 acres in east–central Arizona, including part of the Fort Apache Reservation. Ffolliott and others (2010, p. 27) reported that the fire “damaged or destroyed ecosystem resources, disrupted hydrologic functioning, and altered loadings of flammable fuels in much of the ponderosa pine (Pinus ponderosa) forests exposed to the burn.”
Traditional Resources
Tribal community members reported a decrease in the availability of traditional plants and medicines and a decline in the elk and deer populations (table 18; Gauer, 2019). No readily citable dataset records changes in traditional resources on the Fort Apache Reservation, but the observed climate and seasonal changes, aridification, and wildland fires previously discussed have the potential to affect the availability of traditional resources.
Summary and Conclusions
The U.S. Geological Survey (USGS) in cooperation with the White Mountain Apache Tribe of the Fort Apache Reservation, Arizona, completed a study to analyze available long-term meteorological and hydrological datasets for the Fort Apache Reservation to quantify the climatic and hydrologic effects of climate change experienced on the Fort Apache Reservation. The datasets included near-surface air temperature and precipitation records from a National Centers for Environmental Information U.S. Historical Climatology Network (USHCN) station, precipitation data from three Natural Resources Conservation Service (NRCS) snow telemetry (SNOTEL) stations, snow water equivalent (SWE) data from two of the SNOTEL stations and one NRCS snow course, snow depth and precipitation records from a National Oceanic and Atmospheric Administration Cooperative Observer Program (COOP) network station, and streamflow data from six USGS streamgages. In addition, the Palmer Hydrological Drought Index for Arizona Climate Division 4 (East Central) was compared to selected long-term climate and hydrologic records collected on or near the Fort Apache Reservation.
Several data analysis findings support observations reported by community members during interviews held in 2017. The statistical analyses of near-surface air temperature recorded at Whiteriver 1 SW, Arizona (USHCN station USH00029271) indicated that average annual air temperature increased by 2.48 degrees Fahrenheit (°F) from 1980 to 2023. Air temperature analysis also indicated that average monthly maximum temperatures recorded for March increased by an average of 5.39 °F from 1980 to 2023. In the White Mountains and on the Mogollon Rim, March is often an important month for the accumulation of snowpack. This substantial increase in average monthly maximum air temperature has the potential to alter the character of March precipitation by shifting more of it to rain and causing existing snowpack to thaw more than it has in the past.
Total annual precipitation from 1980 to 2023 decreased significantly (p<0.05) at all five precipitation stations tested for trends in this study. The largest decrease was 10.07 in., or 34.7 percent, at the NRCS Wildcat SNOTEL station 866. Trends testing results were more nuanced for the two stations with records dating back to the first half of the 20th century. Using the period from 1901 to 2023, a significant (p<0.05) negative trend in precipitation was determined for Whiteriver 1 SW. However, no significant trend in precipitation was determined for the NOAA McNary 2N, AZ (025412; hereafter, McNary 2N) COOP station when data from the full period of record (1934–2023) for the station was used for trend testing.
Although the Theil-Sen slope estimate was negative for most of the monthly total precipitation values from all five stations, only the month of April had a significant (p<0.05) negative trend at all five stations. The other months with significant negative trends were March for Maverick Fork (NRCS station 617; hereafter, Maverick Fork 617), Whiteriver 1 SW, Arizona (USHCN station USH00029271), and McNary 2N; August for Whiteriver 1 SW; and November for McNary 2N. The apparent discontinuity between the annual and monthly total precipitation results indicates a lot of variability in the data, but the cumulative effect is a statistical decrease in total precipitation, at least since around 1980.
Statistical analyses indicate a decrease in the annual maximum SWE and an earlier disappearance of the snowpack on Mount Baldy at Baldy (NRCS station 310), and Maverick Fork 617 SNOTEL stations since measurements began. Based on the trend analyses, the average annual peak SWE has decreased by more than 40 percent at both stations, and the average date when the snowpack was fully melted in the spring has moved from late April to late March. However, the fact that early April SWE measured at the nearby NRCS Fort Apache snow course (station 09R05) did not have a statistically significant trend across its period of record indicates that the history of mountain snowpack in the Mount Baldy area is not fully understood. Analysis of snowfall data from McNary 2N indicates that, on average, the measured total annual snowfall at the station decreased by 42.4 percent during its period of record, from 1935 to 2023. The fact that no significant trend in total annual precipitation was detected for McNary 2N, but a significant negative trend in snowfall was detected for the station, highlights the possible effect increasing air temperatures are having on snowfall and snowpack in the region.
Most of the streamflow statistics calculated for the 1-, 7-, and 30-day minimum streamflow, the 1-, 7-, and 30-day maximum streamflow, the annual median streamflow, and the annual mean streamflow from 1980 to 2023 from six USGS streamgages (1978 to 2023 for Carrizo Creek Near Show Low, Arizona [USGS station 09496500; hereafter, Carrizo Creek streamgage]) on the reservation had significant negative trends. Annual runoff at all six streamgages decreased by at least 50 percent from 1980 to 2023. The Carrizo Creek streamgage had the largest percentage decrease (81.8 percent) in annual runoff. The largest change in average annual runoff volume occurred at the Salt River Near Chrysotile, Arizona, (USGS station 09497500) streamgage, which includes flows measured upstream by all other study streamgages except Cibecue Creek near Chrysotile, Arizona (USGS station 09497800). The annual runoff decreased by an estimated 385,150 acre-ft, or 58.5 percent, from 1980 to 2023.
A similar statistical finding was observed in the analysis of the annual spring snowmelt peak from the East Fork White River Near Fort Apache, Arizona (station 09492400; hereafter, East Fork White River Near Fort Apache) streamgage from 1980 to 2023. A significant negative trend was detected and indicated springtime runoff at the streamgage decreased from 17,900 acre-ft in 1980 to 6,700 acre-ft in 2023, a 62.6 percent decrease.
The statistical analysis on the timing of the annual spring snowmelt peak from East Fork White River Near Fort Apache also supports the observation that streamflow regimes have changed. Both periods analyzed (1958–2023 and 1980–2023) indicate that the annual snowmelt peak is happening about 12 days earlier now than it did in the past. The fact that both analyzed periods indicate that the annual spring snowmelt peak is occurring 12 days earlier provides evidence that most of this change has happened since around 1980.
The statistical trends detected in meteorological and hydrological data collected on or near the Fort Apache Reservation align well with the observations of Tribal community members living on the reservation. In Gauer’s (2019) interviews, Tribal community members reported that during their lifetimes, air temperatures have become warmer, whereas winters have become shorter. They also reported a change to drier weather with lower rainfall and snowfall, and lower river levels. These conditions have led to an increased risk for wildfires on the reservation, which was also reported by community members.
References Cited
Abatzoglou, J.T., and Williams, A.P., 2016, Impact of anthropogenic climate change on wildfire across western US forests: Proceedings of the National Academy of Sciences of the United States of America, v. 113, no. 42, p. 11770–11775, accessed February 8, 2025, at https://doi.org/10.1073/pnas.1607171113.
Arizona Department of Health Services, 2026, American Indian Reservations in Arizona: Arizona Department of Health Services spatial dataset, accessed January 2026 at https://geodata-adhsgis.hub.arcgis.com/datasets/ADHSGIS::american-indian-reservations-in-arizona/about.
Baldys, S., and Bayles, J.A., 1990, Flow characteristics of streams that drain the Fort Apache and San Carlos Indian Reservations, east-central Arizona, 1930–86: U.S. Geological Survey Water-Resources Investigations Report 90–4053, 59 p., accessed February 8, 2025, at https://doi.org/10.3133/wri904053.
Bezy, J.V., and Trevena, A.S., 2003, A guide to the geology of the White Mountains and the Springerville Volcanic Field, Arizona: Arizona Geological Survey Down-to-Earth Series DTE–16, 56 p., accessed February 2023 at https://repository.arizona.edu/handle/10150/629332.
Bronaugh, D., Schoeneberg, A., and Zeman, L., 2023, Zhang + Yue-Pilon trends package, (version 0.11-1): R package, accessed June 11, 2024, at https://cran.r-project.org/web/packages/zyp/zyp.pdf.
Bureau of Reclamation, 2022, White Mountain Apache Tribe rural water system draft environmental impact statement: Bureau of Reclamation, Phoenix Area Office, 474 p., accessed July 1, 2024, at https://www.wmat-rws-eis.com/documents/WMAT_RWS_DEIS_July%202022_508.pdf.
Chen, D., and Chen, H.W., 2013, Using the Köppen classification to quantify climate variation and change—An example for 1901–2010: Environmental Development, v. 6, p. 69–79, accessed February 8, 2025, at https://doi.org/10.1016/j.envdev.2013.03.007.
Daly, C., Neilson, R.P., and Phillips, D.L., 1994, A statistical-topographic model for mapping climatological precipitation over mountainous terrain: Journal of Applied Meteorology, v. 33, no. 2, p. 140–158, accessed February 12, 2025, at https://doi.org/10.1175/1520-0450(1994)033<0140:ASTMFM>2.0.CO;2.
Dennison, P.E., Brewer, S.C., Arnold, J.D., and Moritz, M.A., 2014, Large wildfire trends in the western United States, 1984–2011: Geophysical Research Letters, v. 41, no. 8, p. 2928–2933, accessed February 8, 2025, at https://doi.org/10.1002/2014GL059576.
Ffolliott, P.F., Stropki, C.L., Chen, H., and Neary, D.G., 2010, Rodeo-Chediski wildfire—A summary of impacts: Hydrology and water resources in Arizona and the Southwest, v. 40, p. 27–30, accessed February 8, 2025, at https://www.fs.usda.gov/research/treesearch/61210.
Finnell, T.L., 1966a, Geologic quadrangle map of the United States—Geologic map of the Chediski Peak quadrangle, Navajo County, Arizona: Washington, D.C., U.S. Geological Survey Geologic Quadrangle Map GQ–544, 1 sheet, scale 1:62,500, accessed February 8, 2025, at https://doi.org/10.3133/gq544.
Finnell, T.L., 1966b, Geologic quadrangle map of the United States—Geologic map of the Cibecue quadrangle, Navajo County, Arizona: Washington, D.C., U.S. Geological Survey Geologic Quadrangle Map GQ–545, 1 sheet, scale 1:62,500, accessed February 8, 2025, at https://doi.org/10.3133/gq545.
Gauer, V.H., 2019, Adaptive capacity creation in the Stó:lō Research and Resource Management Centre (Stó:lō Nation, BC) and the Fort Apache Heritage Foundation (White Mountain Apache Tribe, AZ): Burnaby, British Columbia, Canada, Simon Fraser University, master’s thesis, 137 p., accessed February 8, 2025, at https://rem-main.rem.sfu.ca/theses/GauerVivianeHippmann_2019_MRM730.pdf.
Gauer, V.H., Schaepe, D.M., and Welch, J.R., 2021, Supporting Indigenous adaptation in a changing climate—Insights from the Stó:lō Research and Resource Management Centre (British Columbia) and the Fort Apache Heritage Foundation (Arizona): Elementa, v. 9, no. 1, article 00164, accessed February 2023 at https://doi.org/10.1525/elementa.2020.00164.
Godfrey, B., 1999, Koppen climate classification for the conterminous United States: Moscow, Idaho, Idaho State Climate Services, raster digital data, accessed September 2024 at https://www.sciencebase.gov/catalog/item/520a7005e4b0026c2bc3da03.
Gonzalez, P., Garfin, G.M., Breshears, D.D., Brooks, K.M., Brown, H.E., Elias, E.H., Gunasekara, A., Huntly, N., Maldonado, J.K., Mantua, N.J., Margolis, H.G., McAfee, S., Middleton, B.R., and Udall, B.H., 2018, Southwest, in Reidmiller, D.R., Avery, C.W., Easterling, D.R., Kunkel, K.E., Lewis, K.L.M., Maycock, T.K., and Stewart, B.C., eds., Impacts, Risks, and Adaptation in the United States: Fourth National Climate Assessment, Volume II: Washington, D.C., U.S. Global Change Research Program, p. 1101–1184, accessed February 2023 at https://nca2018.globalchange.gov/chapter/25/. [Also available in full at https://repository.library.noaa.gov/view/noaa/19487.]
Grolemund, G., and Wickham, H., 2011, Dates and times made easy with lubridate: Journal of Statistical Software, v. 40, no. 3, p. 1–25, accessed February 8, 2025, at https://doi.org/10.18637/jss.v040.i03.
Helsel, D.R., Hirsch, R.M., Ryberg, K.R., Archfield, S.A., and Gilroy, E.J., 2020, Statistical methods in water resources: U.S. Geological Survey Techniques and Methods, book 4, chap. A3, 458 p., https://doi.org/10.3133/tm4A3. [Supersedes USGS Techniques of Water-Resources Investigations, book 4, chap. A3, version 1.1.]
Hirsch, R.M., De Cicco, L.A., and Murphy, J., 2023, Exploration and Graphics for RivEr Trends (EGRET), version 3.0.9, accessed May 28, 2024, at https://CRAN.R-project.org/package=EGRET.
Hirsch, R.M., and De Cicco, L.A., 2015, User guide to Exploration and Graphics for RivEr Trends (EGRET) and dataRetrieval—R packages for hydrologic data (version 2.0, February 2015): U.S. Geological Survey Techniques and Methods, book 4, chap. A10, 93 p., accessed May 23, 2024, at https://doi.org/10.3133/tm4A10. [Also available at https://pubs.usgs.gov/tm/04/a10/.]
Holden, Z.A., Swanson, A., Luce, C.H., Jolly, W.M., Maneta, M., Oyler, J.W., Warren, D.A., Parsons, R., and Affleck, D., 2018, Decreasing fire season precipitation increased recent western US forest wildfire activity: Proceedings of the National Academy of Sciences of the United States of America, v. 115, no. 36, p. E8349–E8357, accessed February 8, 2025, at https://doi.org/10.1073/pnas.1802316115.
House, P.K., and Hirschboeck, K.K., 1997, Hydroclimatological and paleohydrological context of extreme winter flooding in Arizona, 1993, in Larson, R.A., and Slosson, J.E., eds., Storm-induced geologic hazards—Case histories from the 1992–1993 winter in southern California and Arizona v. XI: Boulder, Colo., Geological Society of America Reviews in Engineering Geology. [https://doi.org/10.1130/REG11-p1.]
Intergovernmental Panel on Climate Change [IPCC], 2012, Managing the risks of extreme events and disasters to advance climate change adaptation, in Field, C.B., Barros, V., Stocker, T.F., Qin, D., Dokken, D.J., Ebi, K.L., Mastrandrea, M.D., Mach, K.J., Plattner, G.-K., Allen, S.K., Tignor, M., and Midgley, P.M., eds., A special report of Working Groups I and II of the Intergovernmental Panel on Climate Change: Cambridge, United Kingdom, and New York, Cambridge University Press, 582 p.
Knowles, N., Dettinger, M.D., and Cayan, D.R., 2006, Trends in snowfall versus rainfall in the western United States: Journal of Climate, v. 19, no. 18, p. 4545–4559, accessed February 8, 2025, at https://doi.org/10.1175/JCLI3850.1.
Kottek, M., Grieser, J., Beck, C., Rudolf, B., and Rubel, F., 2006, World map of the Köppen-Geiger climate classification updated: Meteorologische Zeitschrift (Berlin), v. 15, no. 3, p. 259–263, accessed February 8, 2025, at http://koeppen-geiger.vu-wien.ac.at/pdf/Paper_2006.pdf.
Landscape Fire and Resource Management Planning Tools [LANDFIRE], 2024, Conterminous U.S. LANDFIRE—LF 2024 (LF_250)—us_250 Existing vegetation type layer (ver. 2.0.0): U.S. Department of the Interior, U.S. Department of Agriculture, and U.S. Geological Survey dataset, accessed February 8, 2024, at https://www.landfire.gov/viewer.
Lee, L., 2020, NADA—Nondetects and data analysis for environmental data, package (ver. 1.6-1.1): R package, accessed October 25, 2024, at https://cran.r-project.org/package=NADA.
Mann, H.B., 1945, Nonparametric tests against trend: Econometrica, v. 13, no. 3, p. 245–259, at https://doi.org/10.2307/1907187.
Marchetto, A., 2024, rkt—Mann-Kendall test, seasonal and regional Kendall tests: R package, version 1.7, accessed May 23, 2024, at https://CRAN.R-project.org/package=rkt.
Mason, J.P., 2026, U.S. Historical Climatology Network version 2.5 dataset for station Whiteriver 1 SW, Arizona, from 1873 to 2024, used in Analysis of Meteorological and Hydrological Records Support Tribal Members’ Accounts of Changing Climate on the Fort Apache Reservation, East–Central Arizona: U.S. Geological Survey data release, https://doi.org/10.5066/P144FN7Q.
McKay, E.J., 1972, Geologic quadrangle map of the United States—Geologic map of the Show Low quadrangle, Navajo County, Arizona: Washington, D.C., U.S. Geological Survey Geologic Quadrangle Map GQ–973, 1 sheet, scale 1:62,500, accessed February 8, 2025, at https://doi.org/10.3133/gq973.
McLeod, A.I., 2022, Kendall—Kendall rank correlation and Mann-Kendall trend test: R package version 2.2.1, accessed May 23, 2024, at https://CRAN.R-project.org/package=Kendall.
Meehl, G.A., Tebaldi, C., and Adams-Smith, D., 2016, US daily temperature records past, present, and future: Proceedings of the National Academy of Sciences of the United States of America, v. 113, no. 49, p. 13977–13982, accessed February 2025 at https://doi.org/10.1073/pnas.1606117113.
Menne, M.J., and Williams, C.N., Jr., 2009, Homogenization of temperature series via pairwise comparisons: Journal of Climate, v. 22, no. 7, p. 1700–1717, accessed February 7, 2025, at https://doi.org/10.1175/2008JCLI2263.1.
Menne, M.J., and Williams, C.N., Jr., 2012, United States Historical Climatology Network (USHCN), Version 2.5.5.20240821: NOAA [National Oceanic and Atmospheric Administration] National Centers for Environmental Information dataset, accessed August 21, 2024, at https://doi.org/10.7289/V56W98B4.
Menne, M.J., Williams, C.N., Jr., and Palecki, M.A., 2010, On the reliability of the U.S. surface temperature record: Journal of Geophysical Research—Atmospheres, v. 115, article D11108, 9 p., accessed February 7, 2025, at https://doi.org/10.1029/2009JD013094.
Menne, M.J., Williams, C.N., Jr., and Vose, R.S., 2009, The U.S. historical climatology network monthly temperature data, version 2: Bulletin of the American Meteorological Society, v. 90, no. 7, p. 993–1008, accessed February 7, 2025, at https://doi.org/10.1175/2008BAMS2613.1.
Merrill, R.K., and Péwé, T.L., 1977, Late Cenozoic geology of the White Mountains, Arizona: University of Arizona, Arizona Bureau of Geology and Mineral Technology, Special Paper no. 1, 65 p., 2 pls., accessed February 11, 2025, at https://repository.arizona.edu/handle/10150/630759.
Moore, R.T., 1968, Mineral deposits of the Fort Apache Indian Reservation, Arizona: Tucson, Ariz., Arizona Bureau of Mines Bulletin 177, 84 p., 2 sheets, scale 1:250,000. [Also available at https://azmemory.azlibrary.gov/nodes/view/261685?keywords=arizona+blue+book&type=all&highlights=WyJhcml6b25hIiwiYmx1ZSIsImJvb2siXQ%3D%3D.]
Mote, P.W., Hamlet, A.F., Clark, M.P., and Lettenmaier, D.P., 2005, Declining mountain snowpack in western North America: Bulletin of the American Meteorological Society, v. 86, no. 1, p. 39–49, accessed February 8, 2025, at https://doi.org/10.1175/BAMS-86-1-39.
Mueller, S.E., Thode, A.E., Margolis, E.Q., Yocom, L.L., Young, J.D., and Iniguez, J.M., 2020, Climate relationships with increasing wildfire in the southwestern US from 1984 to 2015: Forest Ecology and Management, v. 460, article 117861, 14 p., accessed February 8, 2025, at https://doi.org/10.1016/j.foreco.2019.117861.
National Centers for Environmental Information [NCEI], 2024, Climate at a glance divisional time series: National Oceanic and Atmospheric Administration, accessed July 8, 2024, at https://www.ncei.noaa.gov/access/monitoring/climate-at-a-glance/divisional/time-series.
Natural Resources Conservation Service [NRCS], 2024a, Report generator—Air & water database report generator [Baldy 310]: Natural Resources Conservation Service, accessed June 25, 2024, at https://wcc.sc.egov.usda.gov/reportGenerator/.
Natural Resources Conservation Service [NRCS], 2024b, Report generator—Air & water database report generator [Maverick Fork 617]: Natural Resources Conservation Service Air & Water Database Report Generator, accessed June 25, 2024, at https://wcc.sc.egov.usda.gov/reportGenerator/.
Natural Resources Conservation Service [NRCS], 2024c, Report generator—Air & water database report generator [Wildcat 866]: Natural Resources Conservation Service, accessed June 24, 2024, at https://wcc.sc.egov.usda.gov/reportGenerator/.
Natural Resources Conservation Service [NRCS], 2024d, Report generator—Air & water database report generator [Fort Apache 09R05]: Natural Resources Conservation Service, accessed June 27, 2024, at https://wcc.sc.egov.usda.gov/reportGenerator/.
Parks, S.A., and Abatzoglou, J.T., 2020, Warmer and drier fire seasons contribute to increases in area burned at high severity in western US forests from 1985 to 2017: Geophysical Research Letters, v. 47, no. 22, article e2020GL089858, 10 p., accessed February 8, 2025, at https://doi.org/10.1029/2020GL089858.
PRISM Climate Group, 1999, PRISM weather data [30-year normals (1961–1990)]: Northwest Alliance for Computational Science & Engineering, Oregon State University website, accessed March 1, 2023, at https://prism.oregonstate.edu.
PRISM Climate Group, 2023, PRISM weather data [Norm81m]: Northwest Alliance for Computational Science & Engineering, Oregon State University website, accessed March 1, 2023, at https://prism.oregonstate.edu.
R Core Team, 2024, The R project for statistical computing, version 4.4.0: The R Foundation, accessed September 2024 at https://www.r-project.org/.
Regonda, S.K., Rajagopalan, B., Clark, M., and Pitlick, J., 2005, Seasonal cycle shifts in hydroclimatology over the western United States: Journal of Climate, v. 18, no. 2, p. 372–384, accessed February 8, 2025, at https://doi.org/10.1175/JCLI-3272.1.
Richard, S.M., Reynolds, S.J., Spencer, J.E., and Pearthree, P.A., 2000, Geologic map of Arizona: Arizona Geological Survey Map 35, 1 sheet, scale 1:1,000,000, accessed February 12, 2025, at http://hdl.handle.net/10150/630741.
Riggs, H.C., 1982, Low-flow investigations: U.S. Geological Survey Techniques of Water-Resources Investigations Report, book 4, chap. B1, 23 p. [Also available at https://pubs.usgs.gov/twri/twri4b1/.]
Seager, R., Hooks, A., Williams, P.A., Cook, B., Nakamura, J., and Henderson, N., 2015, Climatology, variability, and trends in the U.S. vapor pressure deficit, an important fire-related meteorological quantity: Journal of Applied Meteorology and Climatology, v. 54, no. 6, p. 1121–1141. [Also available at https://www.jstor.org/stable/26178331.]
Skotnicki, S.J., 2002, Geologic map of the Sierra Ancha, central Arizona: Arizona Geological Survey, Digital Geologic Map, DGM–24, 2 sheets, scale 1:100,000, 29 p. pamphlet. [Also available at https://data.azgs.arizona.edu/api/v1/collections/ADGM-1552430165912-850/DGM-24plate2-xsects.pdf.]
Stewart, I.T., Cayan, D.R., and Dettinger, M.D., 2004, Changes in snowmelt runoff timing in western North America under a “business as usual” climate change scenario: Climatic Change, v. 62, p. 217–232, at https://doi.org/10.1023/B:CLIM.0000013702.22656.e8.
Stewart, I.T., Cayan, D.R., and Dettinger, M.D., 2005, Changes toward earlier streamflow timing across western North America: Journal of Climate, v. 18, no. 8, p. 1136–1155, accessed February 8, 2025, at https://doi.org/10.1175/JCLI3321.1.
Trapp, R.A., and Reynolds, S.J., 1995, Map showing names and outlines of physiographic areas in Arizona used by the Arizona Geological Survey with base map showing township and range only: Arizona Geological Survey Open File Report OFR–95–2b, 1 map sheet, scale 1:1,000,000, accessed July 2023 at https://repository.arizona.edu/handle/10150/629812.
U.S. Board on Geographic Names, 2023, Geographic Names Information System: U.S. Geological Survey interactive web application, accessed July 2023 at https://edits.nationalmap.gov/apps/gaz-domestic/public/search/names.
U.S. Department of the Interior, 2024, Secretary Haaland announces removal of Apache trout, Arizona’s state fish, from Endangered Species List due to collaborative conservation efforts: Department of the Interior, accessed December 2024 at https://www.doi.gov/pressreleases/secretary-haaland-announces-removal-apache-trout-arizonas-state-fish-endangered.
U.S. Environmental Protection Agency, 2025, Climate change indicators: U.S. and global temperature: U.S. Environmental Protection Agency web page, accessed February 2025 at https://www.epa.gov/climate-indicators/climate-change-indicators-us-and-global-temperature.
U.S. Fish and Wildlife Service, 2024a, Apache Trout: U.S. Fish and Wildlife Service webpage, accessed December 2024 at https://www.fws.gov/species/apache-trout-oncorhynchus-apache.
U.S. Fish and Wildlife Service, 2024b, Removal of Apache Trout from endangered species list: U.S. Fish and Wildlife Service press release, accessed May 1, 2025, at https://www.fws.gov/press-release/2024-09/removal-apache-trout-endangered-species-list.
U.S. Fish and Wildlife Service, 2024c, Williams Creek National Fish Hatchery—Featured species: U.S. Fish and Wildlife Service webpage, accessed December 2024 at https://www.fws.gov/fish-hatchery/williams-creek/species.
U.S. Geological Survey, 2024, USGS water data for the Nation: U.S. Geological Survey National Water Information System database, accessed September 26, 2024, at https://doi.org/10.5066/F7P55KJN.
U.S. Geological Survey, 2025, The national map: U.S. Geological Survey, accessed May 1, 2025, at https://www.usgs.gov/programs/national-geospatial-program/national-map.
Voggesser, G., Lynn, K., Daigle, J., Lake, F.K., and Ranco, D., 2013, Cultural impacts to Tribes from climate change influences on forests: Climatic Change, v. 120, no. 3, p. 615–626, accessed July 2023 at https://doi.org/10.1007/s10584-013-0733-4.
Vose, R.S., Applequist, S., Squires, M., Durre, I., Menne, M.J., Williams, C.N., Jr., Fenimore, C., Gleason, K., and Arndt, D., 2014, NOAA Monthly U.S. Climate Gridded Dataset (NClimGrid), Version 1: NOAA National Centers for Environmental Information, accessed February 18, 2025, at https://doi.org/10.7289/V5SX6B56.
Vose, R.S., Easterling, D.R., Kunkel, K.E., LeGrande, A.N., and Wehner, M.F., 2017, Temperature changes in the United States, chap. 6 of Wuebbles, D.J., Fahey, D.W., Hibbard, K.A., Dokken, D.J., Stewart, B.C., and Maycock, T.K., eds., Climate science special report—Fourth National Climate Assessment, volume I: Washington, D.C., U.S. Global Change Research Program, p. 185–206, accessed July 2023 at https://science2017.globalchange.gov/chapter/6/.
Wahl, K.L., 1992, Evaluation of trends in runoff in the western United States, in Herrmann, R., ed., Managing water resources during global change, AWRA 28th Annual Conference and Symposium, American Water Resources Association, Reno, Nevada, November 1–5, 1992, Technical publication series: American Water Resources Association, v. 92–4, p. 701–710.
Westerling, A.L., 2016, Increasing western US forest wildfire activity—Sensitivity to changes in the timing of spring: Philosophical Transactions of the Royal Society B, v. 371, no. 1696, accessed February 8, 2025, at https://doi.org/10.1098/rstb.2015.0178.
Western Regional Climate Center, 2023a, Whiteriver 1 SW, Arizona (029271)— Average of average temperature (degrees Fahrenheit): Western Regional Climate Center database, accessed May 2, 2025, at https://wrcc.dri.edu/cgi-bin/cliMAIN.pl?az9271.
Western Regional Climate Center, 2023b, McNary, Arizona (025412)—Total of snowfall (inches): Western Regional Climate Center database, accessed August 2, 2023, at https://wrcc.dri.edu/cgi-bin/cliMAIN.pl?az5412.
Wickham, H., François, R., Henry, L., Müller, K., and Vaughan, D., 2023, dplyr—A grammar of data manipulation: R package version 1.1.4, accessed July 18, 2024, at https://CRAN.R-project.org/package=dplyr.
Wickham, H., Chang, W.M., Henry, L., Pedersen, T.L., Takahashi, K., Wilke, C., Woo, K., Yutani, H., Dunnington, D., and van den Brand, T., 2024, ggplot2—Create elegant data visualizations using the grammar of graphics: R package version 3.5.1, accessed May 23, 2024, at https://CRAN.R-project.org/package=ggplot2.
Williams, P.A., Cook, E.R., Smerdon, J.E., Cook, B.I., Abatzoglou, J.T., Bolles, K., Baek, S.H., Badger, A.M., and Livneh, B., 2020, Large contribution from anthropogenic warming to an emerging North American megadrought: Science, v. 368, no. 6488, p. 314–318, accessed February 12, 2025, at https://doi.org/10.1126/science.aaz9600.
Wilson, E.D., Moore, R.T., Peirce, H.W., Darton, N.H., Peterson, N.P., Ransome, F.L., Shride, A.F., Wrucke, C.T., and Gastil, G., 1959, Geologic map of Gila County, Arizona: Tucson, Ariz., Arizona Bureau of Mines, County Geologic Map Series M–3–3, 1 sheet, scale 1:375,000. [Also available at https://data.azgs.arizona.edu/api/v1/collections/AGMS-1552426862276-214/map-03-03_gilacounty.pdf.]
Wrucke, C.T., Bromfield, C.S., Simons, F.S., Greene, R.C., Houser, B.B., Miller, R.J., and Gray, F., 2004, Geologic map of the San Carlos Indian Reservation, Arizona: U.S. Geological Survey Geologic Investigations Series Map I–2780, 2 sheets, scale 1:125,000, 29 p. pamphlet, accessed February 8, 2025, at https://pubs.usgs.gov/imap/i2780/.
Zhang, X., Vincent, L.A., Hogg, W.D., and Niitsoo, A., 2000, Temperature and precipitation trends in Canada during the 20th century: Atmosphere-ocean, v. 38, no. 3, p. 395–429, accessed May 13, 2025, at https://doi.org/10.1080/07055900.2000.9649654.
Conversion Factors
U.S. customary units to International System of Units
Temperature in degrees Celsius (°C) may be converted to degrees Fahrenheit (°F) as follows:
°F = (1.8 × °C) + 32.
Temperature in degrees Fahrenheit (°F) may be converted to degrees Celsius (°C) as follows:
°C = (°F – 32) / 1.8.
Datums
Vertical coordinate information is referenced to the North American Vertical Datum of 1988 (NAVD 88).
Horizontal coordinate information is referenced to the North American Datum of 1983 (NAD 83).
Elevation, as used in this report, refers to distance above the vertical datum.
Supplemental Information
Unless otherwise indicated, all years are given in calendar years, the 12-month period from January 1 to December 31.
Climate year is the 12-month period from April 1 to March 31 and is designated by the year in which it ends; for example, climate year 1981 was from April 1, 1980, to March 31, 1981.
Water year is the 12-month period from October 1 to September 30 and is designated by the year in which it ends; for example, water year 2020 was from October 1, 2019, to September 30, 2020.
Abbreviations
BSk
midlatitude steppe climate
COOP
Cooperative Observer Program
Csa
interior Mediterranean climate
Csb
coastal Mediterranean climate
Dsb
humid continental climate
Dsc
continental subarctic climate
EGRET
Exploration and Graphics for RivEr Trends
LANDFIRE
Landscape Fire and Resource Management Planning Tools
LOESS
locally estimated scatterplot smoothing
LOWESS
modified locally weighted scatterplot smoothing
NADA
nondetects and data analysis
NCEI
National Centers for Environmental Information
NOAA
National Oceanic and Atmospheric Administration
NClimGrid
NOAA’s monthly U.S. climate gridded dataset
NRCS
Natural Resources Conservation Service
PHDI
Palmer Hydrological Drought Index
PRISM
Parameter-elevation Regressions on Independent Slopes Model
p-value
probability value
RH
relative humidity
RKT
regional Kendall test
SNOTEL
snow telemetry
SWE
snow water equivalent
USGS
U.S. Geological Survey
USHCN
U.S. Historical Climatology Network
VPD
vapor pressure deficit
For information about the research in this report, contact
Director, Arizona Water Science Center
U.S. Geological Survey
520 N. Park Avenue, Suite 221
Tucson, AZ 85719
https://www.usgs.gov/centers/arizona-water-science-center
Publishing support provided by the U.S. Geological Survey, Science Publishing Network, Baltimore Publishing Service Center
Edited by Bree McCloskey
Illustration support and layout by Trisha Zalesak
Disclaimers
Any use of trade, firm, or product names is for descriptive purposes only and does not imply endorsement by the U.S. Government.
Although this information product, for the most part, is in the public domain, it also may contain copyrighted materials as noted in the text. Permission to reproduce copyrighted items must be secured from the copyright owner.
Suggested Citation
Mason, J.P., 2026, Analyses of meteorological and hydrological records support Tribal members’ accounts of changing climate on the Fort Apache Reservation, east–central Arizona: U.S. Geological Survey Scientific Investigations Report 2026–5140, 58 p., https://doi.org/10.3133/sir20265140.
ISSN: 2328-0328 (online)
Study Area
| Publication type | Report |
|---|---|
| Publication Subtype | USGS Numbered Series |
| Title | Analyses of meteorological and hydrological records support Tribal members’ accounts of changing climate on the Fort Apache Reservation, east–central Arizona |
| Series title | Scientific Investigations Report |
| Series number | 2026-5140 |
| DOI | 10.3133/sir20265140 |
| Publication Date | April 15, 2026 |
| Year Published | 2026 |
| Language | English |
| Publisher | U.S. Geological Survey |
| Publisher location | Reston, VA |
| Contributing office(s) | Arizona Water Science Center |
| Description | Report: x, 58 p.; Data Release |
| Country | United States |
| State | Arizona |
| Other Geospatial | Fort Apache Reservation |
| Online Only (Y/N) | Y |
| Additional Online Files (Y/N) | N |