

Phytoplankton Responses to Experimental Nitrogen and Phosphorus Loading in the Eutrophic and Colored Caloosahatchee River, Florida
Links
- Document: Report (10.63 MB pdf) , HTML , XML
- Data Releases:
- USGS Data Release - Water-quality profiles within the Caloosahatchee River and twelve fiberglass tanks, during experimental nutrient addition treatments, 2020
- USGS Data Release - Caloosahatchee River nutrient enrichment mesocosms—Phytoplankton taxonomic quantification September 2019, June 2020, September 2020, February 2021
- USGS Data Release - Water-quality profiles within the Caloosahatchee River and twelve fiberglass tanks, during experimental nutrient addition treatments, 2021 (ver. 1.1, August 2024)
- NGMDB Index Page: National Geologic Map Database Index Page (html)
- Download citation as: RIS | Dublin Core
Acknowledgments
This study was supported by funding from the U.S. Army Corps of Engineers Aquatic Nuisance Species Research Program (IAA # 7600A-2019-El-325) and the U.S. Geological Survey (USGS) Toxic Substances Hydrology Program, which is part of the USGS Environmental Health Program. The authors acknowledge the dedicated staff at the USGS Caribbean-Florida Water Science Center, Fort Myers field office, for installing, removing, and storing the mesocosm infrastructure during each deployment and for taking the water-quality sonde measurements. The authors wish to thank Brett D. Johnston and James H. Larson for their review of this manuscript.
Abstract
The Caloosahatchee River, located in southwest Florida, is a eutrophic and colored river that flows from Lake Okeechobee westward into its estuary and the Gulf of America. Cyanobacterial harmful algal blooms (HABs) are a documented problem along this freshwater-to-marine waterway where nutrient enrichment has been identified as a key factor in bloom occurrence but has not been experimentally tested in the river. This study is the first to test the effects of inorganic nutrient loading on phytoplankton assemblages in the Caloosahatchee River and the effects of different nutrient sources on phytoplankton dynamics at different times of the year. Three independent, in situ experiments were conducted to test the effects of daily, incrementally increased ammonium, nitrate, and phosphate loading on phytoplankton at different times of the year (summer, fall, winter). Over the 72-hour enclosure period, phytoplankton abundance metrics (cell concentration, chlorophyll-a, and phycocyanin), dissolved oxygen, and pH increased, and fluorescent dissolved organic matter and turbidity decreased in all treatments and controls. Increased phytoplankton abundance metrics relative to controls were observed after 72 hours of exposure to elevated ammonium and nitrate in summer and only ammonium in winter, suggesting periodic nitrogen limitation; however, no treatment effects on phytoplankton assemblage structure in terms of resemblance and diversity metrics were found. Increases in total cell concentrations were driven by elevated growth rates of already dominant taxa but not sufficiently to form a visible bloom. Cyanobacteria consistently dominated the phytoplankton, particularly Aphanocapsa and Merismopedia, whereas the common HAB-forming Microcystis maintained consistently low abundance. This study provides new information on the ecology of phytoplankton assemblages in the Caloosahatchee River and could be used by water resources managers to evaluate strategies for controlling cyanobacterial HABs in the river.
Introduction
Cultural eutrophication, the enrichment of aquatic systems with nitrogen and phosphorus caused by human activities, is linked to global increases in the frequency and intensity of harmful algal blooms (HABs) in fresh and marine waters (Glibert and others, 2005; Elser and others, 2007; Heisler and others, 2008; Glibert and Burford, 2017; Wurtsbaugh and others, 2019; Glibert, 2020). However, the relationship between nutrient enrichment and HABs is complex (Glibert and others, 2005; Glibert and Burford, 2017). For example, the concept of nitrogen and phosphorous limitation of phytoplankton assemblages in eutrophic-hypereutrophic systems where both nutrients are present at high concentrations is unclear. Algae have maximum cell quotas representing the internal concentration that saturates the cell’s capacity for further nutrient uptake and growth (Reynolds, 2006). If concentrations of nitrogen and phosphorous in the surrounding water simultaneously supersaturate algal growth requirements, neither nutrient should be limiting, regardless of which one is in lowest relative abundance (Reynolds, 1992, 1998, 1999; Davidson and others, 2012; Yang and others, 2020; Chorus and Spijkerman, 2021). Reynolds (1992, 1998) proposed saturation concentrations for dissolved inorganic nitrogen (DIN) and soluble reactive phosphorus (SRP) of 0.10–0.13 and 0.03–0.10 milligrams per liter (mg/L), respectively (Chorus and Spijkerman, 2021). Under supersaturating concentrations of nitrogen and phosphorous, other factors such as light (low water clarity or self-shading during high biomass blooms), top-down control (grazing), or micronutrients (for example, silica, iron, manganese) limit algal growth and production (Reynolds, 2006).
Eutrophication, as well as the total maximum daily load and numerical nutrient criteria used for ecosystem management and restoration, is typically defined based on total nitrogen (TN) and total phosphorus (TP) rather than on specific nutrient forms (Organization for Economic Cooperation and Development, 1982; Dodds and others, 1998; Gibson and others, 2000; Florida Department of Environmental Protection [FDEP], 2012, 2020). Total nutrient measurements, however, include an assortment of different dissolved and particulate inorganic and organic forms (American Public Health Association and others, 2023) for which algae might have differential preferences or nutritional capabilities to exploit (Reynolds, 2006). These include DIN and SRP, the least energetically costly forms for autotrophic algae to assimilate (Reynolds, 2006). Although dissolved organic nutrient sources, such as urea, and more complex organic forms, such as amino acids, proteins, and humic substances, can be used by many algal taxa, more energy is required for cellular uptake and assimilation than would be needed for uptake and assimilation of inorganic forms (Glibert and Legrand, 2006). Furthermore, total nutrient measurements contain pools of potentially unavailable forms for most algae, including intracellular nutrients in the plankton themselves that are only available to heterotrophic algae able to ingest other microbes, as well as refractory particulate organic compounds and suspended-sediment-bound phosphorous (Reynolds, 2006). Understanding phytoplankton responses to specific nutrient sources rather than relying on measures of TN and TP is important when assessing nutrient limitation and eutrophication links to HABs (Ptacnik and others, 2010; Glibert and Burford, 2017).
The U.S. Geological Survey (USGS), in cooperation with the U.S. Army Corps of Engineers, Nova Southeastern University, and Florida Gulf Coast University, tested the concept of DIN and SRP limitation of phytoplankton assemblages in eutrophic-hypereutrophic systems with in situ nutrient enrichment mesocosms in the Caloosahatchee River, southwest Florida, where cyanobacterial HABs are a major concern (Rosen and others, 2017; Kramer and others, 2018; Metcalf and others, 2018; Lapointe and others, 2024; Krausfeldt and others, 2024; Badylak and others, 2025; Phlips and others, 2025). The short-term (72-hour incubation period) effects of ammonium (NH4+), nitrate (NO3−), and phosphate (PO43−) enrichment on phytoplankton dynamics were tested at three different times of the year corresponding to generalized algal growing seasons: pre-bloom (winter), bloom (spring/summer), and post-bloom (fall). We hypothesized that phytoplankton assemblages in the Caloosahatchee River will respond to pulses of excess inorganic nutrients over time scales ranging from hours to days with increased abundance and shifts in community structure. Particularly, we expected nitrogen to be limiting rather than phosphorous and that NH4+ would cause a greater growth response than NO3−. We also hypothesized that the effects of nutrient enrichment would differ across the three experiments due to variances in the natural phytoplankton assemblages present as inoculum and the meteorological and water-quality conditions during the season the mesocosms were conducted.
Study Area
The Caloosahatchee River in southwest Florida flows westward from its headwater at Lake Okeechobee, the largest lake in the southeastern United States, into the Caloosahatchee estuary and the Gulf of America (fig. 1A). The mesocosm experiments were installed at the W.P. Franklin Lock and Dam (S-79, USGS station no. 02292900), the furthest downstream water control structure before the Caloosahatchee River discharges into the estuary (fig. 1B). The distance between S-79 and its connection to Lake Okeechobee at Moore Haven (S-77) is approximately 68 river kilometers; this stretch of the river from S-77 to S-79 is also called the C-43 canal (Taylor and others, 2022).
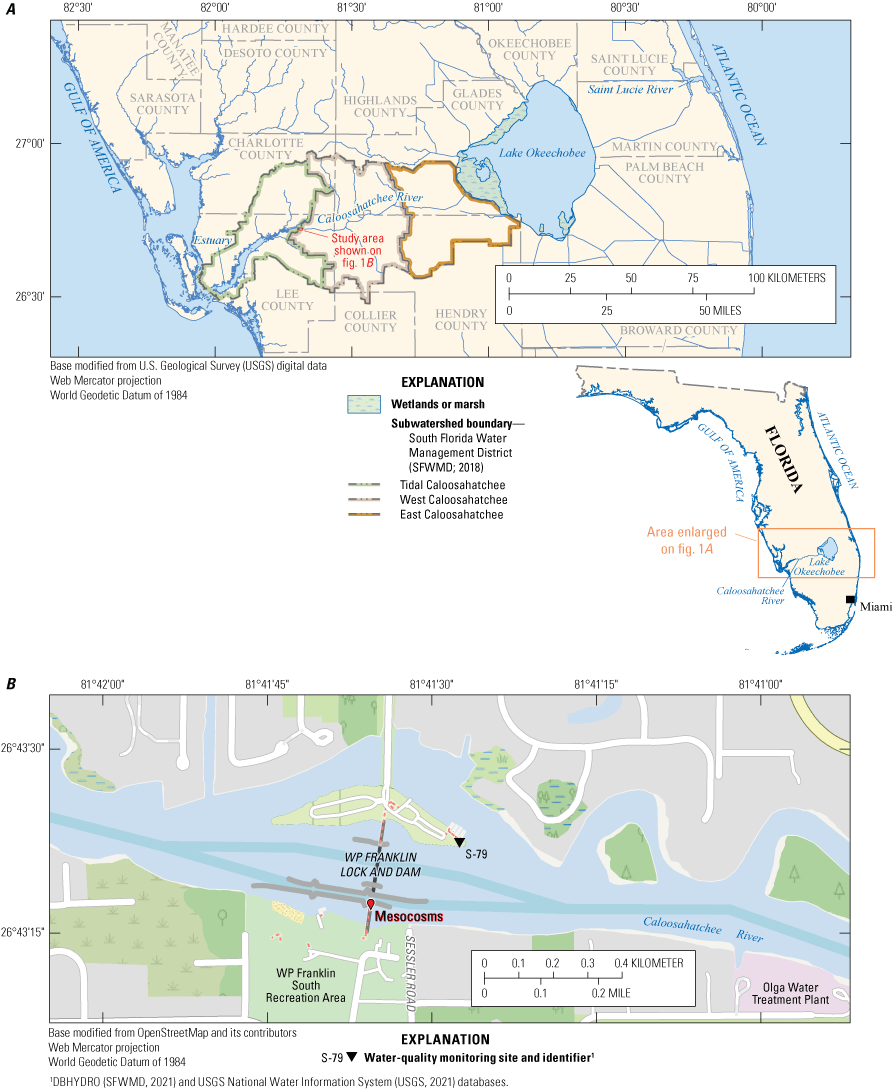
A, The Caloosahatchee River in southwest Florida which flows from Lake Okeechobee westward and discharges into its estuary at the W.P. Franklin Lock and Dam (S-79) where the mesocosms were conducted. B, Zoomed view of the W.P. Franklin Lock and Dam showing the location of mesocosm installations and the S-79 water-quality monitoring site. C, Mesocosm tanks being filled with river water by USGS staff. D, The mesocosm setup installed on the east side of the W.P. Franklin Lock and Dam structure. Photographs by Viviana Mazzei, U.S. Geological Survey, 2020.
The Caloosahatchee River is an important environmental and economic resource for the State and local communities (South Florida Water Management District [SFWMD] and others, 2009). As a Class III waterbody, the river must meet water-quality standards that support its designated uses for recreation, fish consumption, and the “propagation and maintenance of a healthy, well-balanced population of fish and wildlife” (FDEP, 2020, p. 16). However, cyanobacterial HABs are a major problem in the river where noteworthy incidents occurred in 2016, 2018, 2021, and 2023 (Rosen and others, 2017; Kramer and others, 2018; Metcalf and others, 2018; Lapointe and others, 2024; Krausfeldt and others, 2024; Phlips and others, 2025). The Caloosahatchee River is classified as eutrophic to hypereutrophic based on TN, TP, chlorophyll-a (Chl-a), dissolved oxygen, and fecal indicator bacteria metrics (Bailey and others, 2009; Lapointe and others, 2018; Kahn and Betts, 2021; Taylor and others, 2022). Additionally, high concentrations of dissolved organic matter (DOM) color the river and reduce water clarity (fig. 1D; Liu and others, 2009; Chen and others, 2015; Badylak and others, 2025). To achieve water-quality restoration goals through nutrient total maximum daily load reductions, the FDEP implemented the Caloosahatchee Estuary Basin Management Action Plan in 2012 and published an updated version in 2020 (FDEP, 2020).
The Caloosahatchee River receives freshwater inflows and nutrient loading from Lake Okeechobee regulatory water releases and from local runoff and groundwater seepage from its watershed, the Caloosahatchee River Basin (Serna and others, 2020; Kahn and Betts 2021; Taylor and others, 2022). The Caloosahatchee River Basin has five subwatersheds. The W.P. Franklin Lock and Dam where the mesocosms were installed is at the boundary between the West Caloosahatchee and the Tidal Caloosahatchee subwatersheds and essentially demarcates the river from the estuary (fig. 1A; Taylor and others, 2022). Land use in the nontidal portions of the river basin (upstream of the W.P. Franklin Lock and Dam) is primarily citrus and sugar cane farms, natural areas, and improved pastures (SFWMD and others, 2009). Studies have shown that water quality and quantity in the Caloosahatchee River and its estuary are more strongly influenced by runoff from the tributaries within the Caloosahatchee River Basin than lake discharges, particularly during the wet season (Rumbold and Doering, 2020; Kahn and Betts, 2021; Taylor and others, 2022; Montefiore and others, 2024). However, others, have demonstrated that lake discharges have important effects on downstream phytoplankton dynamics and that cyanobacterial HABs might be seeded from Lake Okeechobee rather than originating in the river (Phlips and others, 2023, 2025; Urakawa and others, 2023; Badylak and others, 2025).
Methods
Field and Laboratory Methods
Three independent, 4-day nutrient enrichment mesocosm experiments were conducted during June 8–11, 2020 (summer); September 14–17, 2020 (fall); and February 22–25, 2021 (winter) to capture the natural seasonal variability in phytoplankton assemblages and water quality. The experimental installation consisted of three floating metal cradles, each containing four fiberglass tanks. These tanks had diameters of 0.75 meter (m) (2.5 feet [ft]) and were 1.5 m (5 ft) deep, open at the top, and closed at the bottom (fig. 1C). The tanks were filled with local river water up to the 1.2-m (4-ft) mark to avoid spillover; the total volume added was 556 liters (L) (fig. 1C). River water was pumped from just below the water surface into the tanks; all tanks were rinsed with ambient water prior to filling. The four tanks in each of the three cradles were randomly assigned as a control (C) or as an ammonium (A), nitrate (N), or phosphate (P) treatment—resulting in three replicates per treatment. Henceforth, when not part of a chemical formula, “N” and “P” refer specifically to the nitrate and phosphate treatments, respectively; elsewhere, nitrogen and phosphorous are spelled out. Environmentally relevant target dosing concentrations for each nutrient treatment were selected by examining nutrient concentrations at the S-79 continuous water-quality monitoring site at the W.P. Franklin Lock and Dam during the 5 years before the experiments began (2015–19). These data were downloaded from the SFWMD’s environmental database DBHYDRO (SFWMD, 2021). The target concentration for the treatments on day 1 was set to half of the maximum concentration of the target nutrient recorded between 2015 and 2019. On day 2, the target was set to the maximum concentration, and on day 3, it was set to 1.5 times the maximum concentration, resulting in incrementally higher dosing solutions applied each day (tables 1, 2). Dosing solutions were not applied on day 4, the final day of the deployment. Nutrient dosing solutions were prepared in the laboratory the week before each deployment by using liquid ammonium hydroxide (NH4OH) for the A treatments, anhydrous sodium nitrate (NaNO3) for the N treatment, and 98.5 percent dibasic dodecahydrate sodium phosphate (Na2HPO4·12H2O) for the P treatment. The total quantity of each nutrient needed to raise the 556-L mesocosm tanks to the target concentrations were dissolved in 100 milliliters (mL) of deionized water and transported to the site of the in situ mesocosms in 250-mL high-density polyethylene amber bottles. The same nitrogen targets were set for the N and A treatments. The maximum concentration of nitrogen in nitrate ions (NO3−–N) was much higher than that of nitrogen in ammonium ions (NH4+–N) at the S-79 monitoring site (fig. 1.1); therefore, to assess differences in phytoplankton responses to the chemical species added rather than to differences in the concentration of nitrogen, the same concentration of nitrogen was used for the N and A treatments (tables 1, 2).
Table 1.
Maximum concentrations of nitrate-N (NO3−–N), ammonium-N (NH4+–N), and phosphate-P (PO43−–P) measured at the S-79 water-quality monitoring site, 2015–19, W.P. Franklin Lock and Dam, Caloosahatchee River, southwest Florida, and the dosing concentrations for each nutrient at each sampling interval.[mg/L, milligrams per liter. DBHYDRO data are from the South Florida Water Management District (2021). Target concentrations for each sampling interval: T0 (time = 0 hours), T24 (time = 24 hours), and T48 (time = 48 hours). The maximum (max) concentrations were converted to molarity (µM) and rounded to the nearest whole number for simplicity. The same target nitrogen concentration was used for both NO3− and NH4+ for comparison of the effects of the different nitrogen species at the same concentration]
Table 2.
The dosing solution concentrations applied to achieve target concentrations for each treatment in the 556-liter mesocosm tanks and the measured concentrations in each treatment averaged across the three replicates for each sampling interval, 2020 and 2021, Caloosahatchee River, southwest Florida.[mg/L, milligrams per liter; µM, micromolar; g tank−1, grams per tank; A, ammonium; N, nitrate; P, phosphate; NaNO3, anhydrous sodium nitrate; NH4OH, ammonium hydroxide; Na2HPO4·12H2O, 98.5 percent dibasic dodecahydrate sodium phosphate. Target concentrations for each sampling interval: T0 (time = 0 hours), T24 (time = 24 hours), and T48 (time = 48 hours). Additional 500-milliliter samples only for inorganic nutrient analysis were collected 30 minutes after the nutrient solutions were added (T030, T2430, T4830)]
The mesocosms were sampled over a time (T) of approximately 24-hour intervals during a 72-hour incubation period as follows: baseline pre-dose (T0), after approximately 24 hours (T24), after approximately 48 hours (T48), after approximately 72 hours (T72). Two 1-L surface-water grab samples were collected from each of the 12 tanks in high-density polyethylene bottles at approximately the same time each day before the nutrient dosing solutions were added. T0 represented a baseline background measurement, and subsequent samples captured responses to dosing after an approximate 24-hour incubation period. Additional 500-mL samples only for inorganic nutrient analysis were collected 30 minutes after the nutrient solutions were added (T030, T2430, T4830) to measure the concentrations attained by the addition of the dosing solutions. An ambient river water sample was also collected each day to serve as a “no tank” control. The mesocosm tanks were manually agitated by rotating the tanks in a circular back-and-forth motion several times to homogenize the enclosed water before collecting samples and after applying the dosing solutions. The tanks were also, to some extent, constantly being mixed because they were free to move within the metal cradles with wind and wave action (fig. 1D).
Water samples collected at T0, T24, T48, and T72 were split and processed the same day for later analysis of phytoplankton assemblage structure and TN, TP, NO3−–N, NH4+–N, and SRP concentrations. The samples collected at T030, T2430, and T4830 were only analyzed for NO3−–N, NH4+–N, and SRP. Nutrient analysis was conducted by Florida International University’s CAChE Nutrient Analysis Core Facility (accredited by the National Environmental Laboratory Accreditation Program) in Miami, Florida, using standard operating procedures based on the following methods: TN [ASTM D5176], TP [EPA 365.1], NO3−+NO2−–N [EPA 353.4], NO2−–N [EPA 353.4], NH3/NH4+–N [EPA 349.0], SRP [EPA 365.1]. Daily measurements of Chl-a, phycocyanin (PC), water temperature, dissolved oxygen (DO), pH, specific conductance, turbidity, and fluorescent dissolved organic matter (fDOM) were taken at the start of each day with a YSI EXO2 multiparameter water-quality sonde (YSI Incorporated, Yellow Springs, Ohio). Measurements were taken at three depths within each tank and in the river: near the surface (~30 centimeters [cm] deep), near the middle of the water column, (~60 cm deep), and near the bottom (~90 cm deep). Depth-integrated averages were calculated for each variable (Knight, 2023; Montgomery, 2023). At the end of the 4-day experiment, the tanks were disassembled, sanitized by scrubbing and rinsing with Liquinox, and stored until the next deployment.
Ancillary environmental data for S-79 from the period January 2015–March 2021 were downloaded from the DBHYDRO (SFWMD, 2021) and USGS National Water Information System (NWIS) (USGS, 2021) databases for the examination of historical water-quality conditions during the 5 years before the first experiment (2015–19) and the period during which the three experiments were conducted (June 2020–February 2021). TN, TP, NO3−+NO2−–N, NH4+–N, SRP, and river color concentrations were downloaded from DBHYDRO. Chl-a data were downloaded from DBHYDRO and NWIS.
Phytoplankton community structure was characterized using flow cytometry for taxa classification and enumeration following the methods of PhycoTech, Inc. (St. Joseph, Michigan; https://www.phycotech.com/). A 125-mL aliquot of the original 1-L sample collected from the tanks at T0, T24, T48, and T72 was transferred into a plastic amber bottle for analysis of live algae. As a backup to the live samples, a second 125-mL aliquot was transferred into a separate plastic amber bottle and fixed with 1.25 mL glutaraldehyde. The bottles were placed on ice in a cooler and shipped overnight to the PhycoTech, Inc., facility. Immediately upon arrival at the facility, the live samples were run through an Imaging FlowCytobot (McLane Research Laboratories, Inc.), which captures images of particulates between 2 and 250 micrometers (µm) as they pass through a flow cell. Laser-induced fluorescence and light scattering from individual particles are measured and used to trigger targeted image acquisition allowing for the discrimination between algal cells, detritus, zooplankton, and other particulates. Algae were identified by an automated classifier which identifies algal units larger than 9 µm to genus level. When image resolution was insufficient for genus-level identification, phytoplankton were classified at higher taxonomic or morphological groups (for example, chlorophytes, centric diatoms, etc.) or placed into the “unclassified” category used for all algae that were counted but could not be identified. Algal taxa smaller than 9 µm were counted but not identified and were placed in a separate category. The automated algal classifications were then validated by a two-analyst verification system. Abundance measurements for each taxon were calculated as cells per milliliter (cells/mL). The net rate of population increase (cells/mL/hour) for all taxa identified was calculated as the difference between cell concentration at the end of the experiments (T72) and the start of the experiment (T0) divided by the 72-hour enclosure period.
Statistical Analysis
Statistical analysis of water quality data was performed in RStudio 12.0 (R Core Team, 2022) using the rstatix package (Kassambara, 2023). Two-way repeated measures analysis of variance (RM ANOVA) was performed individually for each nutrient (NO3−, NH4+, and SRP), water-quality variable (DO, pH, turbidity, fDOM, temperature, and specific conductance), and phytoplankton abundance metric (total phytoplankton cell concentration, Chl‑a, and PC) to test for differences among treatments (C, A, N, P) over time (T0, T24, T48, T72). Ambient samples had no replication and were not included in the tests. Bonferroni-corrected post hoc pairwise comparisons were performed when significant (α=0.05) main or interaction effects were found.
Phytoplankton data were analyzed in PRIMER-e v7 software (Anderson and others, 2008; Clarke and Gorley, 2015). Bray-Curtis resemblance matrices were constructed from square-root-transformed absolute abundance data of all taxa for each of the three mesocosm deployments separately. Two-way repeated measures permutational multivariate analysis of variance (RM PERMANOVA) tests were performed on each of the three resemblance matrices to examine the changes in phytoplankton assemblage structure among treatments over time during each of the three deployments individually. The RM PERMANOVA design consisted of three factors: treatment (fixed), time (fixed), and subject (in other words, replicate) nested within treatment (random). Post hoc pairwise comparisons were performed when significant main or interaction effects were returned. RM PERMANOVA only indicates whether assemblages differ across factors but does not specify how they differ; therefore, the effects of treatment and time on phytoplankton assemblage structure was further examined by looking at diversity metrics (Maurer and McGill, 2011) including total number of species (S), total number of individuals (N), Margalef’s species richness (d), Pielou’s evenness (J′), Shannon diversity (H′), and Simpson diversity (1-λ) (Gini-Simpson index). Similarity percentages (SIMPER) analysis was used to determine the contribution of each taxon to the assemblage dissimilarity among treatments. The natural temporal variability of phytoplankton assemblages in the Caloosahatchee River was examined by analysis of similarities (ANOSIM) to compare mean abundances for the 12 baseline (T0) samples collected at the start of each of the 3 mesocosm deployments.
Phytoplankton data are available in a USGS data release (Mazzei and Sullivan, 2022). Water-quality data are available in the following USGS data releases: Knight (2023) and Montgomery (2023). The mesocosm nutrient data are available through the Nova Southeastern University’s Biological Sciences Faculty Datasets collections (Krausfeldt and others, 2023, https://nsuworks.nova.edu/lopez_lab/4/).
Results
Water Quality Conditions in the Caloosahatchee River at S-79, 2015–21
Mean TN (1.33 mg/L) and TP (0.13 mg/L) concentrations at S-79 were within the hypereutrophic category (>1.2 mg/L and >0.1 mg/L, respectively), whereas mean Chl‑a concentration (15.2 micrograms per liter [µg/L]) was within the eutrophic classification (8–25 µg/L) (fig. 1.1A, B; Organization for Economic Cooperation and Development, 1982; Dodds and others, 1998; Gibson and others, 2000; FDEP, 2012). TP concentrations at S-79 were always greater than 0.05 mg/L, with peaks during rainy season months between 0.10 and 0.34 mg/L (fig. 1.1B). TN concentrations ranged from 1.33 to 2.52 mg/L. Mean NO3−+NO2−–N concentration was 0.22 mg/L, with a maximum concentration of 0.66 mg/L (fig. 1.1C). The mean NH4+–N concentration was 0.005 mg/L, with maximum values reaching 0.19 mg/L. Mean orthophosphate was 0.009 mg/L, with a maximum of 0.27 mg/L. These DIN and SRP concentrations are above Reynolds’ saturation thresholds of 0.10–0.13 mg/L for DIN and 0.03–0.10 mg/L for SRP (Reynolds, 1992, 1998; Chorus and Spijkerman, 2021). Chl-a concentrations at S-79 ranged from 1 µg/L to 236 µg/L. The highest Chl-a value was recorded in June 2018 coinciding with a major HAB event in the Lake Okeechobee system (fig. 1.1A; SFWMD, 2021; USGS, 2021). River color at S-79 ranged from 34.0 to 234.0 platinum-cobalt units, with higher values generally occurring during summer, rainy seasons. The Caloosahatchee River watershed was a greater contributor to freshwater inflows and TN and TP loading to the Caloosahatchee River than Lake Okeechobee during water years 2020 and 2021 when the mesocosm experiments took place (Taylor and others, 2022).
Water Quality Conditions in the Mesocosms
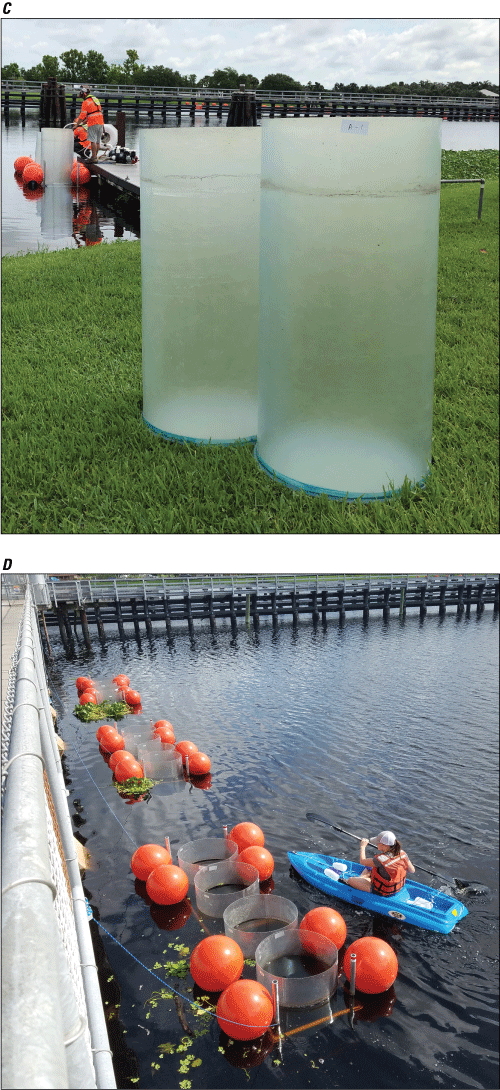
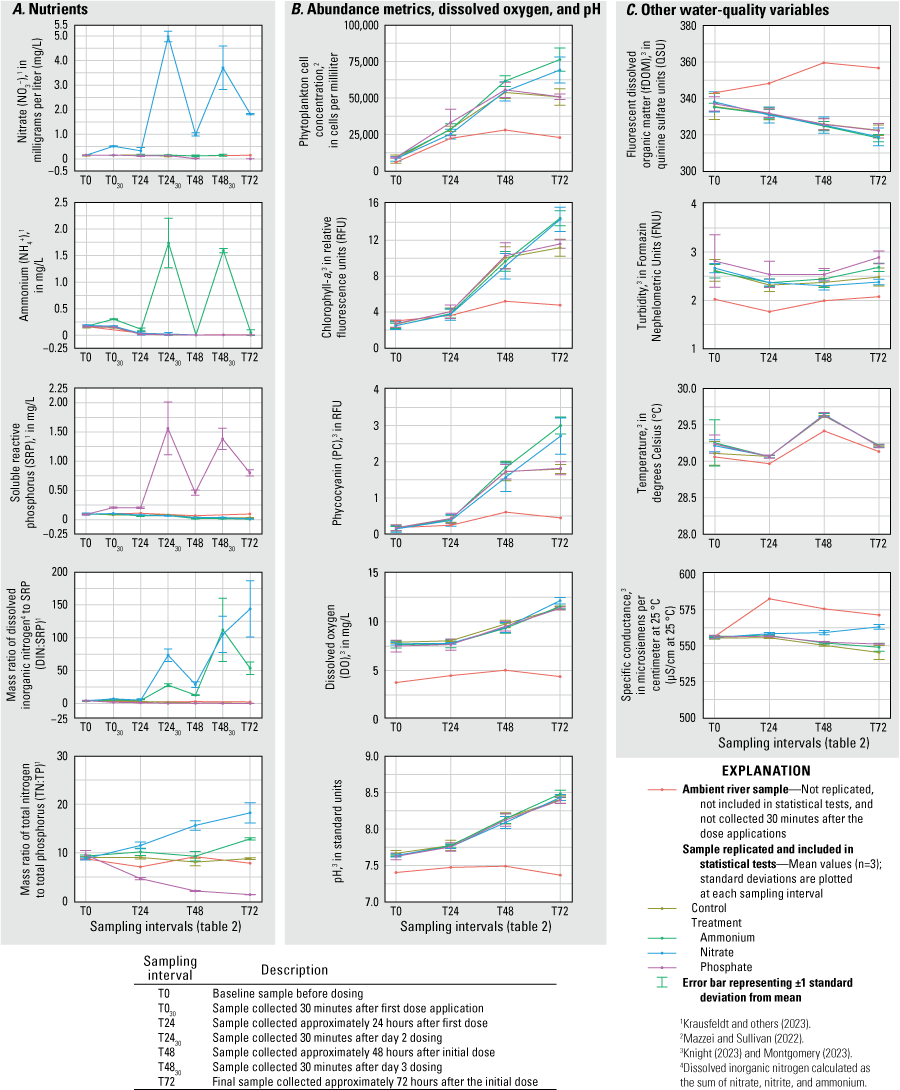
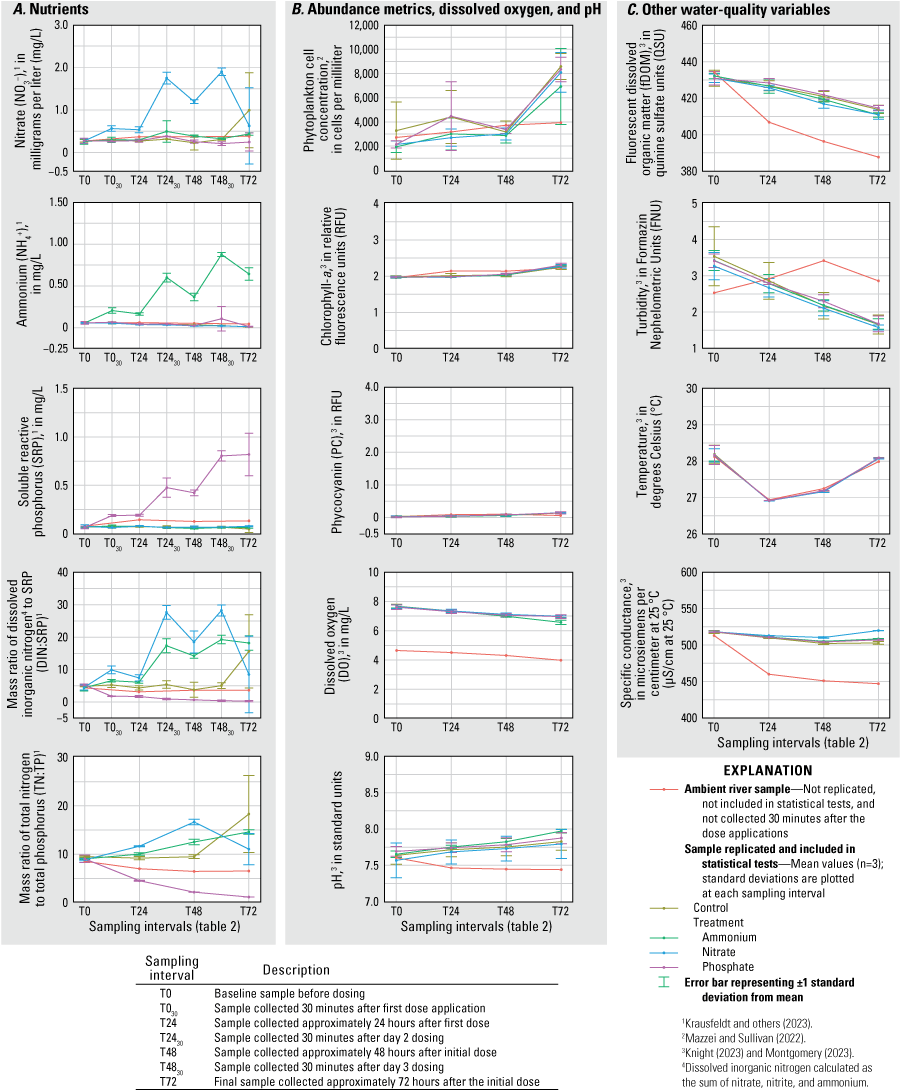
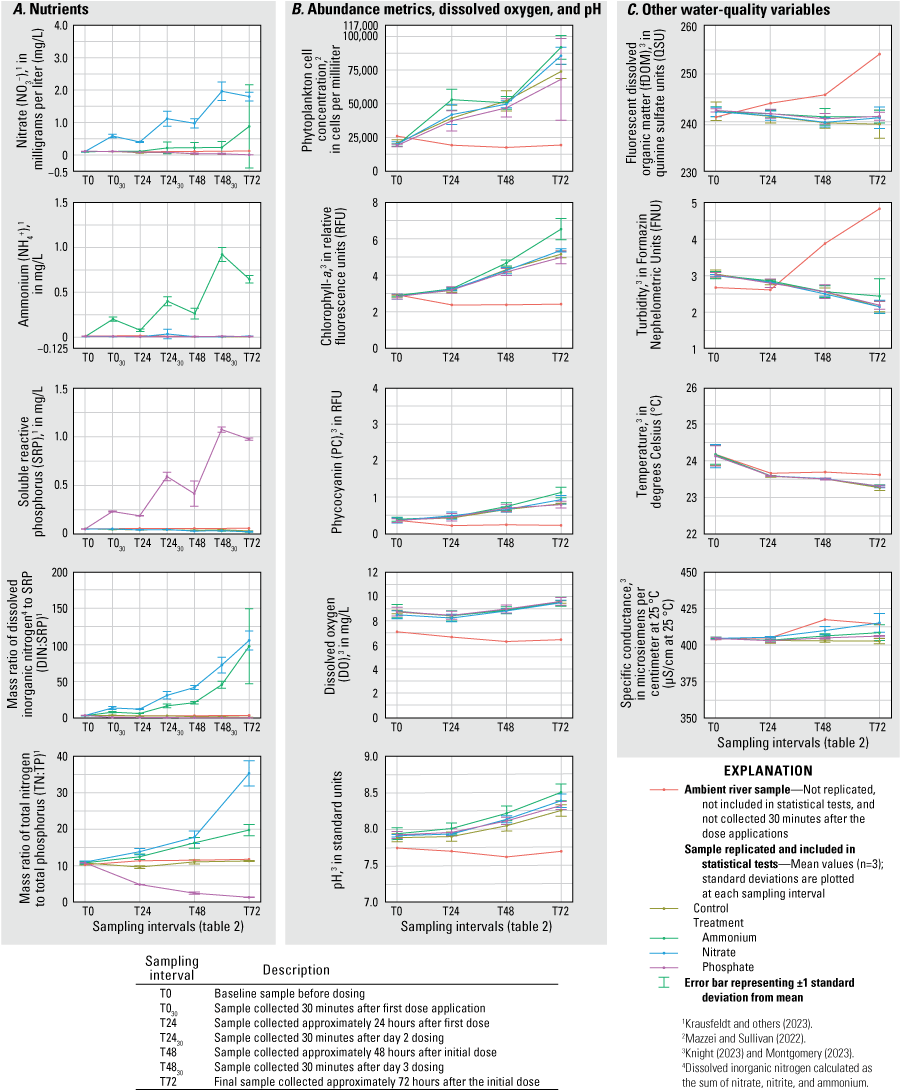
The concentrations of NO3−, NH4+, and SRP were significantly elevated (RM ANOVA α=0.05) in their corresponding treatment tanks (N, A, and P) relative to concentrations in controls and all other treatment tanks after each dosing during all three deployments (figs. 2–4; table 1.1). During the June 2020 deployment, the N and A treatments had higher total phytoplankton cell density (probability [p]=0.010; p=0.002), Chl-a (p=0.004; p=0.003), and PC (p=0.006; p=0.001) by T72 compared to controls (fig. 2). Treatments had no effect on total phytoplankton cell concentration or pigment concentrations during the September 2020 deployment (fig. 3). During the February 2021 deployment, Chl-a and PC were greater at T72 in the A treatment (p=0.002; p=0.006) compared to the control; total phytoplankton cell concentration was also higher in A but was not statistically different from the concentration in the control (fig. 4). Total cell concentration, Chl-a, PC, DO, and pH increased over the 72-hour enclosure period (p<0.001) in all treatment and control tanks during all three deployments (figs. 2–4). Turbidity and fDOM decreased (p<0.05) over time in all tanks during all three deployments (figs. 2–4). Mean water temperature and specific conductance in the mesocosm tanks were 29.2 degrees Celsius (°C) and 554.6 microsiemens per centimeter at 25 degrees Celsius (µS/cm at 25 °C), respectively, in June 2020; 27.7 °C and 511.1 µS/cm, respectively, in September 2020; and 23.7 °C and 405.6 µS/cm, respectively, in February 2021 (figs. 2–4).
June 2020 A, concentrations of nutrients, B, measurements of phytoplankton abundance metrics, dissolved oxygen, and pH, and C, measurements of other water-quality variables for each treatment and ambient river samples at each sampling interval, Caloosahatchee River, southwest Florida.
September 2020 A, concentrations of nutrients, B, measurements of phytoplankton abundance metrics, dissolved oxygen, and pH, and C, measurements of other water-quality variables for each treatment and ambient river samples at each sampling interval, Caloosahatchee River, southwest Florida.
February 2021 A, concentrations of nutrients, B, measurements of phytoplankton abundance metrics, dissolved oxygen, and pH, and C, measurements of other water-quality variables for each treatment and ambient river samples at each sampling interval, Caloosahatchee River, southwest Florida.
Phytoplankton Assemblage Dynamics
Baseline phytoplankton assemblages in the river were different across the three deployments (ANOSIM R=0.981, p=0.001). The highest baseline cell concentration occurred during the winter deployment, with a mean of 20,000 cells/mL at T0 in February 2021 (fig. 5). Mean baseline cell concentration was 8,500 cells/mL during the summer (June 2020) deployment and 2,300 cells/mL during the fall (September 2020) deployment (fig. 5). Although cyanobacteria dominated the phytoplankton assemblage during all three deployments, both Shannon (H′) and Simpson (1−λ) diversities differed across the three seasons (ANOSIM R=0.745, p=0.001), with the greatest diversity occurring in June (H′=2.26, 1−λ=0.83) and lowest in September (H′=1.59, 1−λ=0.61).
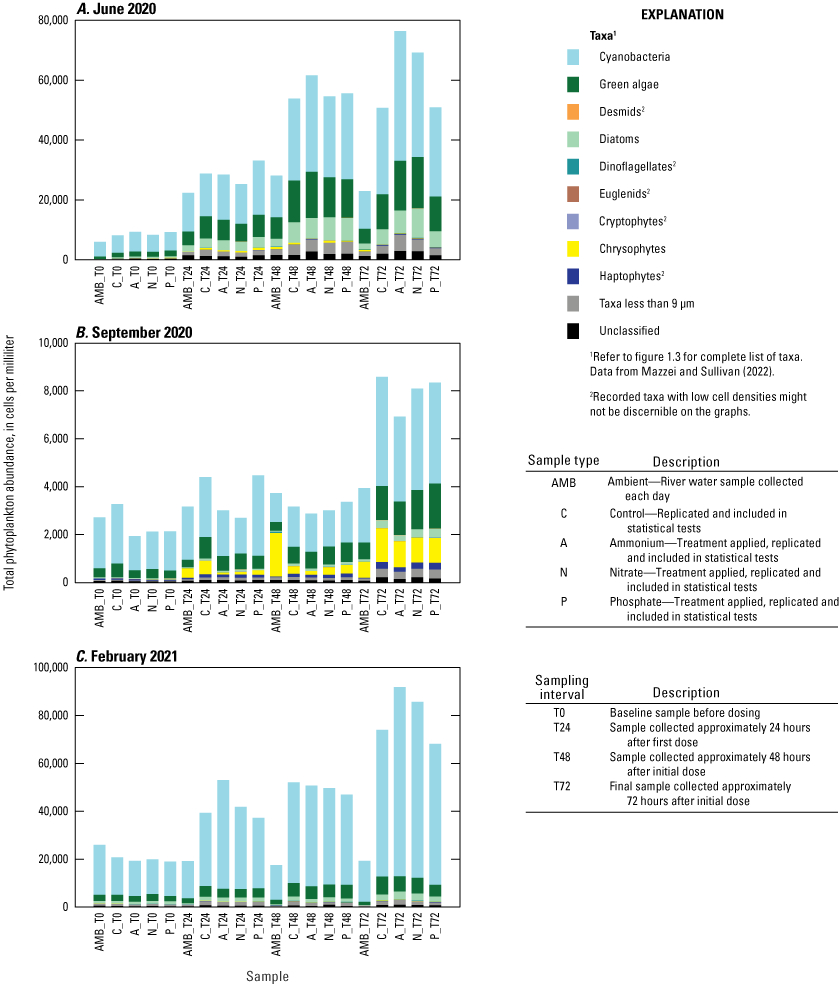
Total phytoplankton abundance grouped by algal functional groups for each treatment and the ambient river samples at each sampling interval for the A, June 2020, B, September 2020, and C, February 2021 mesocosm deployments, Caloosahatchee River, Florida.
The RM PERMANOVAs performed independently for each of the three experiments indicated that neither the A, N, or P treatments had a significant (α=0.05) effect on phytoplankton assemblage structure (Bray-Curtis resemblance) relative to controls during any of the three deployments (table 3). Although a significant treatment by time interaction effect was found for the June 2020 deployment (table 3), post hoc pairwise tests showed no statistical difference between treatments at any sampling interval. Similarly, for the February 2021 deployment a significant treatment main effect was indicated (table 3), but the post hoc pairwise test showed no statistical difference between any pair of treatments. Sampling interval (time) had a significant effect on phytoplankton assemblage structure for all three deployments (table 3), with statistical dissimilarity occurring between every pair of sampling times in post hoc pairwise tests.
Table 3.
Results of two-way repeated measures permutational multivariate analysis of variance (RM PERMANOVA) tests performed to measure the effects of treatment and time on phytoplankton assemblage structure during the three mesocosm deployments in June 2020, September 2020, and February 2021, Caloosahatchee River, southwest Florida.[df, degrees of freedom; SS, sums of squares; MS, mean sums of squares; pseudo-F, pseudo-F ratio; P(perm), permutation probability value; perms, number of random permutations performed]
Treatment had no significant effect on any diversity metric relative to controls during any of the three deployments, except for the increase in total number of individuals in the N and A treatments relative to controls during the June 2020 deployment (fig. 1.2). Time, however, significantly affected several diversity measures (fig. 1.2). The number of individuals increased over time during all three deployments (fig. 1.2). During the June 2020 and September 2020 deployments, there was a general decrease from T0 to T72 in Margalef’s species richness (d) and an increase in Pielou’s evenness (J′) metric as well as in Shannon (H′) and Simpson diversities (1˗λ; fig. 1.2). During the February 2021 deployment, there was no change in species richness over time, but species evenness significantly declined driving the lower Shannon and Simpson diversity measures from T0 to T72 (fig. 1.2).
The results of the SIMPER analysis further indicated that the A, N, and P treatments did not result in significant shifts in phytoplankton assemblage structure over the 72-hour exposure periods of the three deployments. There was almost complete overlap in the taxa identified by the SIMPER analysis as characteristic of treatment groups (table 1.2). The colonial cyanobacteria Aphanocapsa and Merismopedia, along with green algae (chlorophytes), taxa less than 9 µm, and unclassified taxa, dominated all treatments during all three deployments and exhibited the greatest rates of net population increase over time (figs. 5, 1.3; table 1.2). However, some overall differences in influential species across seasonal deployments were observed. The non-heterocystous, filamentous cyanobacteria Planktolyngbya and Pseudanabaena were significant contributors to phytoplankton abundance during the June 2020 deployment (fig. 6A; table 1.2). Planktolyngbya exhibited the greatest net population increase rates in the A treatments of the June 2020 deployment but Pseudanabaena increase rates were consistent across all treatments (fig. 1.3). During the September 2020 deployment, Aphanocapsa and Merismopedia were the only influential cyanobacteria contributors, but chrysophytes and haptophytes were characteristic of the September assemblages (fig. 5B; table 1.2). The heterocystous, HAB-forming cyanobacteria Aphanizomenon and Dolichospermum were important contributors to the phytoplankton during the February 2021 deployment (fig. 6C; table 1.2) despite their relatively minor net population increases (fig. 1.3C). Microcystis, one of the most common bloom-forming cyanobacteria in freshwaters including the Lake Okeechobee system (Metcalf and others, 2018; Wilhelm and others, 2020; Krausfeldt and others, 2024; Lapointe and others, 2024; Phlips and others, 2025), was not a significant contributor to the phytoplankton assemblage during any of the deployments and only displayed positive population increase rates in the A treatment during the June 2020 deployment and in the P treatment in the September 2020 deployment (figs. 6, 1.3).
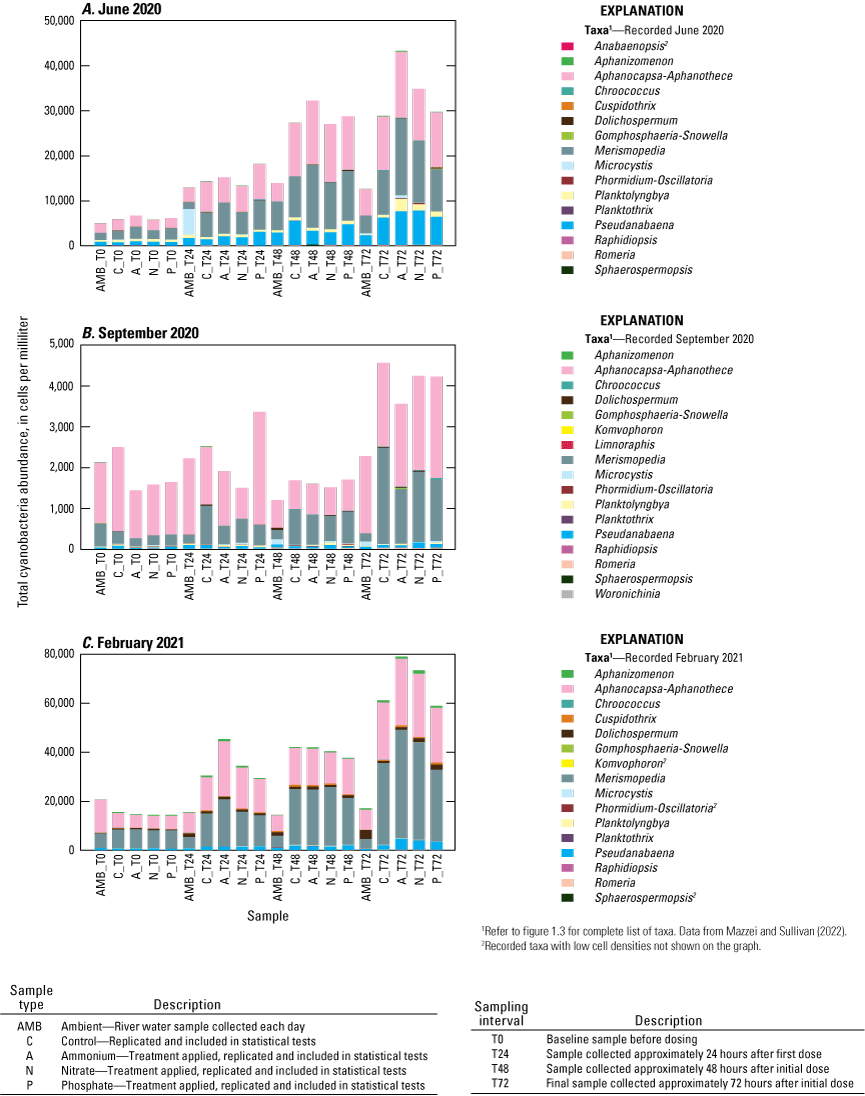
Total cyanobacteria abundance grouped by taxa for each treatment and ambient river samples at each sampling interval for the A, June 2020, B, September 2020, and C, February 2021 deployments, Caloosahatchee River, Florida.
Discussion and Conclusions
In situ nutrient enrichment mesocosms were conducted to test phytoplankton responses to NO3−, NH4+, and PO43− enrichment above background levels to better understand how pulsed nutrient loading influences phytoplankton dynamics in the hypereutrophic and colored Caloosahatchee River. During all three deployments, the concentrations of NO3−, NH4+, and PO43− added to the mesocosm tanks declined within 24 hours of dosing, but this was not always accompanied by increases in phytoplankton abundance metrics. The effects of nutrient enrichment varied across the three seasons during which the experiments were conducted—summer (June), fall (September), and winter (February). Phytoplankton abundance metrics were significantly elevated in the A treatments after 72 hours of exposure in the June 2020 and February 2021 deployments, whereas N treatments had a significant effect only in June 2020, supporting the hypothesis that NH4+ has a stronger influence on phytoplankton dynamics than NO3−. Furthermore, the hypothesis that nitrogen rather than phosphorus would be limiting was supported by the absence of significant responses to P treatments during any deployment. Despite increased abundance with A and N treatments, no significant shifts in phytoplankton assemblage structure were observed during the 72-hour experiments. Growth-rate measurements confirmed that only taxa which were already dominant at the start of the experiments exhibited increased growth rates that were driving elevated total abundance. Furthermore, the results of this study demonstrated that Microcystis, the dominant HAB-former in Lake Okeechobee (Paerl and others, 2020; Lapointe and others, 2024; Krausfeldt and others, 2025), maintained relatively low baseline cell concentrations in the Caloosahatchee River at the time of these experiments and that Microcystis population growth was not stimulated by NO3−, NH4+, or PO43− enrichment during the 72-hour exposure period. The strongest effect on phytoplankton dynamics in all mesocosms was due to enclosure time, with significant shifts in community structure and increased abundance from T0 to T72 in all treatments, including the controls, during all three deployments. This suggests that nutrients are not the primary limiting resource for phytoplankton in the Caloosahatchee River. We hypothesize that an enclosure effect improved water clarity in the tanks and potentially released phytoplankton from light limitation. The Caloosahatchee River has high levels of DOM which color the river causing low water clarity and potentially light-limiting conditions for phytoplankton (Liu and others, 2009; Chen and others, 2015).
Mean DIN and SRP concentrations in the Caloosahatchee River at water-quality monitoring site S-79 during 2015–21 were above the saturation thresholds proposed by Reynolds (0.10–0.13 mg/L for DIN and 0.03–0.10 mg/L for SRP), suggesting that phytoplankton in the river should not be limited by either nutrient. Reynolds (1992, 1998, 1999) stated that above these saturation thresholds, limitation of algal growth by either nutrient is highly improbable and the ratio of nitrogen to phosphorus is irrelevant because the cell reaches its maximum quota for both nitrogen and phosphorus in the optimal ratio before either becomes depleted enough in the water to be considered limiting (Chorus and Spijkerman, 2021). Cells have limits on how fast they can take up and assimilate nutrients, as described by the Michaelis-Menten, Droop, and Monod equations (Reynolds, 2006; Dodds and Whiles, 2020), and it follows that above saturating concentrations, additional nutrients will not be taken up if maximum cell quotas and optimal stoichiometry have been met. However, NH4+, NO3−, and PO43− added to the mesocosms were significantly drawn out of solution within 24 hours after each dosing application even though baseline (T0) concentrations of DIN (NO3−+NO2−+ NH4+) and SRP were above the Reynolds’ saturation thresholds during all three experiments, indicating that the microbial assemblages were not saturated in their uptake potential for DIN or SRP. Luxury uptake and storage of nutrients by phytoplankton might explain why removal of added nutrients from the water column did not always translate to increased phytoplankton abundance, such as in the September 2020 deployment and with P treatments during any deployment (Kromkamp, 1987; Reynolds, 2006; Flores and others, 2019; Solovchenko and others, 2019). Uptake by bacterioplankton and sorption to abiotic particles can also deplete inorganic DIN and SRP (Kirchman, 1994; Hampel and others, 2020; Sörenson and others, 2020). Nevertheless, significant increases in phytoplankton abundance in the A and N treatments demonstrate periodic nitrogen limitation in the Caloosahatchee River despite its eutrophic status and inorganic nutrient concentrations exceeding Reynolds’ saturation thresholds (Paerl and others, 2020). Though our study is the first nutrient enrichment experiment conducted in the Caloosahatchee River, previous nutrient enrichment studies in Lake Okeechobee and the Saint Lucie River, the lake’s eastward riverine outflow, also documented nitrogen limitation in mesocosms incubated over 24 hours (Kramer and others, 2018) or 72 hours (Havens and others, 1996; Havens and East, 1997; Kramer and others, 2018). Similarly, Ma and others (2015) reported nitrogen rather than phosphorus limitation of phytoplankton from mesocosm experiments conducted in Lake Taihu, China, a hypereutrophic lake comparable to Lake Okeechobee; however, significant biomass increases in nitrogen versus control treatments were not evident until day 12 of the incubation in the Lake Taihu study, whereas we observed significant increases starting at T72 in two of our three deployments.
Light limitation in the highly colored, DOM-rich Caloosahatchee River is a possible explanation for the observed nitrogen limitation despite background concentrations of DIN above saturation concentrations because light-limited cells are less able to use available nutrients. Without adequate light for photosynthesis, cells cannot produce sufficient glucose to fuel cellular respiration and produce enough ATP to power the transport of nutrients across the cell membrane, an active process requiring energy (Falkowski and Raven, 2007). Light limitation has been documented as another driving factor of phytoplankton dynamics in Lake Okeechobee (Philips and others, 1997; Havens and others, 2003) but has not been tested explicitly in the Caloosahatchee River and was outside the scope of our experiments. However, enclosure in the mesocosm tanks seems to have improved water clarity, as inferred by reductions in fDOM and turbidity over time, potentially releasing phytoplankton from light limitation and allowing them to use available background nutrients for growth, resulting in the significant increases in phytoplankton abundance in controls and all treatment tanks during the 72-hour period. The stronger influence of enclosure time than nutrient treatments on phytoplankton growth in this study suggests that nutrients are not the primary limiting resource for phytoplankton in the Caloosahatchee River. Flocculation and sedimentation of fDOM, suspended sediments and other turbidity causing particles is a potential mechanism for improved water clarity in the tanks along with potentially higher incident photosynthetically active radiation on algal cells from light quanta entering the tanks from above and being reflected off the side and bottom walls of the plexiglass tanks. Significantly greater phytoplankton abundance in the A and N treatments at T72 relative to T72 controls indicates that additional nitrogen inputs, particularly NH4+, supports growth beyond what is achieved using ambient nitrogen once the primary limiting resource has been supplied. However, even with the added nitrogen, phytoplankton abundance in the A and N treatments did not increase enough to result in a visible accumulation of biomass that could be defined as a bloom. Observations from this study allude to the potential effects of water clarity on phytoplankton response to inorganic nutrient loading in the Caloosahatchee River.
Consistent with other phytoplankton studies in the Lake Okeechobee system, cyanobacteria dominated the phytoplankton assemblages during all three deployments (McPherson and La Rose, 1982; Havens and others, 1996, 2003; Philips and others, 1997). The hypothesis that the relative abundance of cyanobacteria, compared to other algal groups, would shift with nutrient amendments and that diazotrophic cyanobacteria would be favored when nitrogen:phosphorous ratios declined (P treatments), was not supported. Havens and East (1997) also did not observe significant shifts in the relative abundance of cyanobacteria compared to other algal groups with nutrient amendments, possibly because the systems were already dominated by cyanobacteria, the group that would be expected to outcompete others under warm, eutrophic, low water-clarity conditions such as those in the Lake Okeechobee system (Paerl and others, 2001). Shifts in cyanobacterial assemblages were not observed either. The non-heterocystous, colonial genera Aphanocapsa and Merismopedia were always the dominant cyanobacteria in our study. Both genera belong to the family Microcystaceae in the order Chroococcales. Although Aphanocapsa and Merismopedia are not as well known for causing freshwater HABs compared to other species such as Microcystis, studies have documented that these species can form toxic HABs (Jakubowska and Szelag-Wasielewska, 2015; de J. Magalhães and others, 2019; Keliri and others, 2021). Kramer and others (2018) reported abundant Aphanocapsa during the state of emergency Microcystis bloom of 2018 in Lake Okeechobee and the Saint Lucie River. Microcystis, also a non-heterocystous, colonial genus in the family Microcystaceae, has been reported as the dominant taxa during blooms in Lake Okeechobee (Paerl and others, 2020; Lapointe and others, 2024; Krausfeldt and others, 2025). In our study, Microcystis exhibited relatively low baseline cell concentrations, and the NH4+, NO3−, or PO43− enrichments did not stimulate a burst in population growth within a 72-hour period. Microcystis failure to respond to experimental nutrient additions could simply indicate that more than 72 hours is needed to trigger a Microcystis bloom or that it is limited by a resource other than nitrogen or phosphorus. The drivers or processes that enable Microcystis to gain a competitive advantage resulting in a population explosion from relatively low baseline concentrations to a HAB formation remain poorly understood (Wilhelm and others, 2020). The results of our experiments contribute to our knowledge of Microcystis ecology and bloom dynamics in the Caloosahatchee River that may be relevant to HAB management strategies.
In conclusion, the results of our study indicate that phytoplankton in the Caloosahatchee River is co-limited by nitrogen and a second unknown factor, which we hypothesize is light in this colored, DOM-rich system. The NH4+, NO3−, and PO43− added to enclosed Caloosahatchee River water were rapidly removed from solution, but the fate of those nutrients within algal cells (such as use for growth and replication or kept in storage compounds), their relative uptake by different algal taxa or compartments (bacterioplankton or sorption to sediments), and their role in triggering a HAB event are still not well understood. Longer experiments could be useful to capture population and assemblage responses along the full range of the algal growth curve from the lag phase through the exponential phase, the stationary phase, and senescence. This could allow identification of nutrient threshold levels leading to bloom initiation, lag times between initial exposure and response, and assemblage successional patterns which can support effective management and prediction of HABs. This study offers insights into the relationship between inorganic nutrient loading and phytoplankton dynamics in the Caloosahatchee River, which had not been previously tested, and revealed the potential role of water clarity in hindering HAB formation despite supersaturating nutrient levels. The study results could be used to evaluate future strategies for controlling cyanobacterial HABs in the Caloosahatchee River, where it remains unclear if HAB events are independent of HABs in its headwater, Lake Okeechobee, or whether they are transported to the river through necessary regulatory water releases.
References Cited
Anderson, M.J., Gorley, R.N., and Clarke, K.R., 2008, PERMANOVA+ for PRIMER—Guide to software and statistical methods: Plymouth, UK, PRIMER-e. [Also available at https://learninghub.primer-e.com/.]
Badylak, S., Phlips, E.J., Milbrandt, E.C., Morrison, E.S., Stelling, B.D., Lee, S.-A., Frankovich, T.A., and Kaplan, D., 2025, Influence of regulated water discharges on phytoplankton composition and biomass in a subtropical canal: Journal of Environmental Management, v. 373, article 123470. [Also available at https://doi.org/10.1016/j.jenvman.2024.123470.]
Bailey, N., Magley, W., Mandrup-Poulsen, J., O’Donnell, K., and Peets, R., 2009, FINAL TMDL Report—Nutrient TMDL for the Caloosahatchee estuary (WBIDs 3240A, 3240B, and 3240C): Tallahassee, Fla., Florida Department of Environmental Protection, 119 p., accessed September 8, 2025, at https://floridadep.gov/sites/default/files/tidal-caloosa-nutr-tmdl_0.pdf.
Chen, Z., Doering, P.H., Ashton, M., and Orlando, B.A., 2015, Mixing behavior of colored dissolved organic matter and its potential ecological implication in the Caloosahatchee River estuary, Florida: Estuaries and Coasts, v. 38, no. 5, p. 1706–1718. [Also available at https://doi.org/10.1007/s12237-014-9916-0.]
Chorus, I., and Spijkerman, E., 2021, What Colin Reynolds could tell us about nutrient limitation, N:P ratios and eutrophication control: Hydrobiologia, v. 848, no. 1, p. 95–111. [Also available at https://doi.org/10.1007/s10750-020-04377-w.]
Clarke, K.R., and Gorley, R.N., 2015, PRIMER v7—User manual/tutorial: Plymouth, UK, PRIMER-e. [Also available at https://learninghub.primer-e.com/.]
Davidson, K., Gowen, R.J., Tett, P., Bresnan, E., Harrison, P.J., McKinney, A., Milligan, S., Mills, D.K., Silke, J., and Crooks, A.-M., 2012, Harmful algal blooms—How strong is the evidence that nutrient ratios and forms influence their occurrence?: Estuarine, Coastal and Shelf Science, v. 115, p. 399–413. [Also available at https://doi.org/10.1016/j.ecss.2012.09.019.]
de J. Magalhães, A.A., da Luz, L.D., and de Aguiar, T.R., Jr., 2019, Environmental factors driving the dominance of the harmful bloom‐forming cyanobacteria Microcystis and Aphanocapsa in a tropical water supply reservoir: Water Environment Research : A Research Publication of the Water Environment Federation, v. 91, no. 11, p. 1466–1478. [Also available at https://doi.org/10.1002/wer.1141.]
Dodds, W.K., Jones, J.R., and Welch, E.B., 1998, Suggested classification of stream trophic state—Distributions of temperate stream types by chlorophyll, total nitrogen, and phosphorus: Water Research, v. 32, no. 5, p. 1455–1462. [Also available at https://doi.org/10.1016/S0043-1354(97)00370-9.]
Dodds, W.K., and Whiles, M.R., 2020, Nutrient use and remineralization, chapter 17 of Freshwater ecology (3d ed.): Elsevier, p. 503–535. [Also available at https://doi.org/10.1016/B978-0-12-813255-5.00017-X.]
Elser, J.J., Bracken, M.E.S., Cleland, E.E., Gruner, D.S., Harpole, W.S., Hillebrand, H., Ngai, J.T., Seabloom, E.W., Shurin, J.B., and Smith, J.E., 2007, Global analysis of nitrogen and phosphorus limitation of primary producers in freshwater, marine and terrestrial ecosystems: Ecology Letters, v. 10, no. 12, p. 1135–1142. [Also available at https://doi.org/10.1111/j.1461-0248.2007.01113.x.]
Flores, E., Arévalo, S., and Burnat, M., 2019, Cyanophycin and arginine metabolism in cyanobacteria: Algal Research, v. 42, article 101577. [Also available at https://doi.org/10.1016/j.algal.2019.101577.]
Florida Department of Environmental Protection [FDEP], 2012, Development of numeric nutrient criteria for Florida lakes, spring vents, and streams: Florida Department of Environmental Protection Technical Support Document, 219 p., accessed September 8, 2025, at https://floridadep.gov/sites/default/files/tsd-nnc-lakes-springs-streams.pdf.
Florida Department of Environmental Protection [FDEP], 2020, Caloosahatchee River and Estuary Basin Management Action Plan, 152 p., accessed September 8, 2025, at https://publicfiles.dep.state.fl.us/DEAR/DEARweb/BMAP/NEEP_2020_Updates/Caloosahatchee%20BMAP_01-31-2020.pdf.
Gibson, G., Carlson, R., Simpson, J., Smeltzer, E., Gerritson, J., Chapra, S., Heiskary, S., Jones, J., and Kennedy, R., 2000, Nutrient criteria technical guidance manual—Lakes and reservoirs (1st ed.): U.S. Environmental Protection Agency, EPA-822-B00-001, [variously paged; 232 p.], accessed September 8, 2025, at https://www.epa.gov/sites/default/files/2018-10/documents/nutrient-criteria-manual-lakes-reservoirs.pdf.
Glibert, P.M., 2020, Harmful algae at the complex nexus of eutrophication and climate change: Harmful Algae, v. 91, article 101583. [Also available at https://doi.org/10.1016/j.hal.2019.03.001.]
Glibert, P.M., and Burford, M.A., 2017, Globally changing nutrient loads and harmful algal blooms—Recent advances, new paradigms, and continuing challenges: Oceanography (Washington, D.C.), v. 30, no. 1, p. 58–69. [Also available at https://www.jstor.org/stable/24897842.]
Glibert, P.M., and Legrand, C., 2006, The diverse nutrient strategies of harmful algae—Focus on osmotrophy, in Granéli, E., and Turner, J.T., eds., Ecology of harmful algae: Berlin, Heidelberg, Springer Berlin Heidelberg, p. 163–175. [Also available at https://doi.org/10.1007/978-3-540-32210-8_13.]
Glibert, P.M., Seitzinger, S., Heil, C.A., Burkholder, J.M., Parrow, M.W., Codispoti, L.A., and Kelly, V., 2005, The role of eutrophication in the global proliferation of harmful algal blooms: Oceanography (Washington, D.C.), v. 18, no. 2, p. 198–209. [Also available at https://doi.org/10.5670/oceanog.2005.54.]
Hampel, J.J., McCarthy, M.J., Aalto, S.L., and Newell, S.E., 2020, Hurricane disturbance stimulated nitrification and altered ammonia oxidizer community structure in Lake Okeechobee and St. Lucie estuary (Florida): Frontiers in Microbiology, v. 11, article 1541. [Also available at https://doi.org/10.3389/fmicb.2020.01541.]
Havens, K.E., and East, T., 1997, In situ responses of Lake Okeechobee (Florida, USA) phytoplankton to nitrogen, phosphorus, and Everglades Agricultural Area canal water: Lake and Reservoir Management, v. 13, no. 1, p. 26–37. [Also available at https://doi.org/10.1080/07438149709354293.]
Havens, K.E., East, T.L., Meeker, R.H., Davis, W.P., and Steinman, A.D., 1996, Phytoplankton and periphyton responses to in situ experimental nutrient enrichment in a shallow subtropical lake: Journal of Plankton Research, v. 18, no. 4, p. 551–566. [Also available at https://doi.org/10.1093/plankt/18.4.551.]
Havens, K.E., James, R.T., East, T.L., and Smith, V.H., 2003, N:P ratios, light limitation, and cyanobacterial dominance in a subtropical lake impacted by non-point source nutrient pollution: Environmental Pollution, v. 122, no. 3, p. 379–390. [Also available at https://doi.org/10.1016/S0269-7491(02)00304-4.]
Heisler, J., Glibert, P.M., Burkholder, J.M., Anderson, D.M., Cochlan, W., Dennison, W.C., Dortch, Q., Gobler, C.J., Heil, C.A., Humphries, E., Lewitus, A., Magnien, R., Marshall, H.G., Sellner, K., Stockwell, D.A., Stoecker, D.K., and Suddleson, M., 2008, Eutrophication and harmful algal blooms—A scientific consensus: Harmful Algae, v. 8, no. 1, p. 3–13. [Also available at https://doi.org/10.1016/j.hal.2008.08.006.]
Jakubowska, N., and Szelag-Wasielewska, E., 2015, Toxic picoplanktonic cyanobacteria—Review: Marine Drugs, v. 13, no. 3, p. 1497–1518. [Also available at https://doi.org/10.3390/md13031497.]
Kahn, A., and Betts, A., 2021, Caloosahatchee River watershed protection plan annual progress report, Chapter 8D of 2021 South Florida Environmental Report, volume 1: South Florida Water Management District, 63 p., accessed September 8, 2025, at https://sfer-docs.sfwmd.gov/2021_sfer_final/v1/chapters/v1_ch8d.pdf.
Kassambara, A., 2023, rstatix—Pipe-friendly framework for basic statistical tests: R package version 0.7.2, accessed September 8, 2025, at https://CRAN.R-project.org/package=rstatix.
Keliri, E., Paraskeva, C., Sofokleous, A., Sukenik, A., Dziga, D., Chernova, E., Brient, L., and Antoniou, M.G., 2021, Occurrence of a single-species cyanobacterial bloom in a lake in Cyprus—Monitoring and treatment with hydrogen peroxide-releasing granules: Environmental Sciences Europe, v. 33, article 31, 14 p. [Also available at https://doi.org/10.1186/s12302-021-00471-5.]
Kirchman, D.L., 1994, The uptake of inorganic nutrients by heterotrophic bacteria: Microbial Ecology, v. 28, no. 2, p. 255–271. [Also available at https://doi.org/10.1007/BF00166816.]
Knight, T.M., 2023, Water-quality profiles within the Caloosahatchee River and twelve fiberglass tanks, during experimental nutrient addition treatments, 2020: U.S. Geological Survey data release, https://doi.org/10.5066/P900BQZR.
Kramer, B.J., Davis, T.W., Meyer, K.A., Rosen, B.H., Goleski, J.A., Dick, G.J., Oh, G., and Gobler, C.J., 2018, Nitrogen limitation, toxin synthesis potential, and toxicity of cyanobacterial populations in Lake Okeechobee and the St. Lucie River estuary, Florida, during the 2016 state of emergency event: PLoS One, v. 13, no. 5, article e0196278. [Also available at https://doi.org/10.1371/journal.pone.0196278.]
Krausfeldt, L.E., Mazzei, V., Karnacki, E., Samuel, P., and Lopez, J.V., 2023, Understanding harmful algal blooms—Temporal and spatial characterization of microbial communities from Lake Okeechobee: Nova Southeastern University dataset, accessed September 8, 2025, at https://nsuworks.nova.edu/lopez_lab/4/.
Krausfeldt, L.E., Samuel, P.S., Smith, R.P., Urakawa, H., Rosen, B.H., Colwell, R.R., and Lopez, J.V., 2025, Transcriptional profiles of Microcystis reveal gene expression shifts that promote bloom persistence in in situ mesocosms: Microbiology Spectrum, v. 13, no. 1, article e01369-24. [Also available at https://doi.org/10.1128/spectrum.01369-24.]
Krausfeldt, L.E., Shmakova, E., Lee, H.W., Mazzei, V., Loftin, K.A., Smith, R.P., Karwacki, E., Fortman, P.E., Rosen, B.H., Urakawa, H., Dadlani, M., Colwell, R.R., and Lopez, J.V., 2024, Microbial diversity, genomics, and phage–host interactions of cyanobacterial harmful algal blooms: mSystems, v. 9, no. 7, article e00709-23. [Also available at https://doi.org/10.1128/msystems.00709-23.]
Kromkamp, J., 1987, Formation and functional significance of storage products in cyanobacteria: New Zealand Journal of Marine and Freshwater Research, v. 21, no. 3, p. 457–465. [Also available at https://doi.org/10.1080/00288330.1987.9516241.]
Lapointe, B.E., Brewton, R.A., McFarland, M.N., and Stockley, N., 2024, Nutrient availability in a freshwater-to-marine continuum—Cyanobacterial blooms along the Lake Okeechobee Waterway: Harmful Algae, v. 139, article 102710. [Also available at https://doi.org/10.1016/j.hal.2024.102710.]
Lapointe, B.E., Wilking, L.E., Brewton, R.A., and Herren, L.W., 2018, Caloosahatchee River–North Fort Myers Nutrient and Bacteria Source Identification Study: Fort Pierce, Fla., Harbor Branch Oceanographic Institute, Florida Atlantic University, 78 p., accessed September 8, 2025, at https://www.leegov.com/naturalresources/Documents/4-30-19-Worksession/Final_LapointeNorthFortMyers_11.2.2018_reducedsize.pdf.
Liu, Z., Choudhury, S.H., Xia, M., Holt, J., Wallen, C.M., Yuk, S., and Sanborn, S.C., 2009, Water quality assessment of coastal Caloosahatchee River watershed, Florida: Journal of Environmental Science and Health. Part A, Toxic/Hazardous Substances & Environmental Engineering, v. 44, no. 10, p. 972–984. [Also available at https://doi.org/10.1080/10934520902996872.]
Ma, J., Qin, B., Wu, P., Zhou, J., Niu, C., Deng, J., and Niu, H., 2015, Controlling cyanobacterial blooms by managing nutrient ratio and limitation in a large hyper-eutrophic lake—Lake Taihu, China: Journal of Environmental Sciences (China), v. 27, p. 80–86. [Also available at https://doi.org/10.1016/j.jes.2014.05.042.]
Mazzei, V., and Sullivan, K., 2022, Caloosahatchee River nutrient enrichment mesocosms—Phytoplankton taxonomic quantification September 2019, June 2020, September 2020, February 2021: U.S. Geological Survey data release, https://doi.org/10.5066/P99ELCEC.
McPherson, B.F., and La Rose, H.R., 1982, Algal conditions in the Caloosahatchee River (1975–79), Lake Okeechobee to Franklin Lock, Florida: U.S. Geological Survey Water-Resources Investigations Report 81–81, 28 p., accessed September 8, 2025, at https://doi.org/10.3133/wri8181.
Metcalf, J.S., Banack, S.A., Powell, J.T., Tymm, F.J.M., Murch, S.J., Brand, L.E., and Cox, P.A., 2018, Public health responses to toxic cyanobacterial blooms—Perspectives from the 2016 Florida event: Water Policy, v. 20, no. 5, p. 919–932. [Also available at https://doi.org/10.2166/wp.2018.012.]
Montefiore, L.R., Kaplan, D., Phlips, E.J., Milbrandt, E.C., Arias, M.E., Morrison, E., and Nelson, N.G., 2024, Downstream nutrient concentrations depend on watershed inputs more than reservoir releases in a highly engineered watershed: Water Resources Research, v. 60, no. 3, article e2023WR035590. [Also available at https://doi.org/10.1029/2023WR035590.]
Montgomery, M.D., 2023, Water-quality profiles within the Caloosahatchee River and twelve fiberglass tanks, during experimental nutrient addition treatments, 2021 (ver. 1.1, August 2024): U.S. Geological Survey data release, https://doi.org/10.5066/P9JX9NA1.
Paerl, H.W., Fulton, R.S., Moisander, P.H., and Dyble, J., 2001, Harmful freshwater algal blooms, with an emphasis on cyanobacteria: TheScientificWorldJournal, v. 1, p. 76–113. [Also available at https://doi.org/10.1100/tsw.2001.16.]
Paerl, H.W., Havens, K.E., Xu, H., Zhu, G., McCarthy, M.J., Newell, S.E., Scott, J.T., Hall, N.S., Otten, T.G., and Qin, B., 2020, Mitigating eutrophication and toxic cyanobacterial blooms in large lakes—The evolution of a dual nutrient (N and P) reduction paradigm: Hydrobiologia, v. 847, no. 21, p. 4359–4375. [Also available at https://doi.org/10.1007/s10750-019-04087-y.]
Philips, E.J., Cichra, M., Havens, K., Hanton, C., Badylak, S., Rueter, B., Randall, M., and Hansen, P., 1997, Relationships between phytoplankton dynamics and the availability of light and nutrients in a shallow sub-tropical lake: Journal of Plankton Research, v. 19, no. 3, p. 319–342. [Also available at https://doi.org/10.1093/plankt/19.3.319.]
Phlips, E.J., Badylak, S., Mathews, A.L., Milbrandt, E.C., Montefiore, L.R., Morrison, E.S., Nelson, N., and Stelling, B., 2023, Algal blooms in a river-dominated estuary and nearshore region of Florida, USA—The influence of regulated discharges from water control structures on hydrologic and nutrient conditions: Hydrobiologia, v. 850, no. 20, p. 4385–4411. [Also available at https://doi.org/10.1007/s10750-022-05135-w.]
Phlips, E.J., Badylak, S., Milbrandt, E.C., Stelling, B., Arias, M., Armstrong, C., Behlmer, T., Chappel, A., Foss, A., Kaplan, D., Landauer, L., Landauer, P., Lee, S.-A., Morrison, E.S., Olabarrieta, M., and Sun, D., 2025, Fate of a toxic Microcystis aeruginosa bloom introduced into a subtropical estuary from a flow-managed canal and management implications: Journal of Environmental Management, v. 375, article 124362, 20 p. [Also available at https://doi.org/10.1016/j.jenvman.2025.124362.]
Ptacnik, R., Andersen, T., and Tamminen, T., 2010, Performance of the Redfield ratio and a family of nutrient limitation indicators as thresholds for phytoplankton N vs. P limitation: Ecosystems (New York, N.Y.), v. 13, no. 8, p. 1201–1214. [Also available at https://doi.org/10.1007/s10021-010-9380-z.]
R Core Team, 2022, R—A language and environment for statistical computing, version 4.2.0: Vienna, Austria, R Foundation for Statistical Computing, accessed September 8, 2025, at https://www.R-project.org/.
Reynolds, C.S., 1992, Eutrophication and the management of planktonic algae—What Vollenweider couldn’t tell us, in Sutcliffe, D.W., and Jones, J.G., eds., Eutrophication—Research and application to water supply: Ambleside, Cumbria, The Freshwater Biological Association, p. 4–29, accessed September 8, 2025, at https://www.researchgate.net/publication/277214921.
Reynolds, C.S., 1998, What factors influence the species composition of phytoplankton in lakes of different trophic status?: Hydrobiologia, v. 369, p. 11–26. [Also available at https://doi.org/10.1023/A:1017062213207.]
Reynolds, C.S., 1999, Non-determinism to probability, or N:P in the community ecology of phytoplankton: Fundamental and Applied Limnology, v. 146, no. 1, p. 23–35. [Also available at https://doi.org/10.1127/archiv-hydrobiol/146/1999/23.]
Rosen, B.H., Davis, T.W., Gobler, C.J., Kramer, B.J., and Loftin, K.A., 2017, Cyanobacteria of the 2016 Lake Okeechobee and Okeechobee Waterway harmful algal bloom: U.S. Geological Survey Open-File Report 2017–1054, 33 p., accessed September 8, 2025, at https://doi.org/10.3133/ofr20171054.
Rumbold, D.G., and Doering, P.H., 2020, Water quality and source of freshwater discharge to the Caloosahatchee estuary, Florida: 2009–2018: Florida Scientist, v. 83, no. 1, p. 1–20. [Also available at https://www.jstor.org/stable/26975620.]
Serna, A., Kahn, A., Chen, Z., and Sun, D., 2020, St. Lucie and Caloosahatchee River watersheds annual report, Chapter 8C of South Florida Environmental Report, volume 1: South Florida Water Management District, 47 p., accessed September 8, 2025, at https://apps.sfwmd.gov/sfwmd/SFER/2020_sfer_final/v1/chapters/v1_ch8c.pdf.
Solovchenko, A.E., Ismagulova, T.T., Lukyanov, A.A., Vasilieva, S.G., Konyukhov, I.V., Pogosyan, S.I., Lobakova, E.S., and Gorelova, O.A., 2019, Luxury phosphorus uptake in microalgae: Journal of Applied Phycology, v. 31, no. 5, p. 2755–2770. [Also available at https://doi.org/10.1007/s10811-019-01831-8.]
Sörenson, E., Farnelid, H., Lindehoff, E., and Legrand, C., 2020, Resource partitioning between phytoplankton and bacteria in the coastal Baltic Sea: Frontiers in Marine Science, v. 7, article 608244. [Also available at https://doi.org/10.3389/fmars.2020.608244.]
South Florida Water Management District [SFWMD], 2018, North/South Everglades NEEPP boundaries: South Florida Water Management District dataset, accessed September 8, 2025, at https://geo-sfwmd.hub.arcgis.com/datasets/a5de3c10105f4e33a67b97f3b15ffcc4_0/explore?location=26.746023%2C-81.787226%2C9.28.
South Florida Water Management District [SFWMD], 2021, Station information, S79, in DBHYDRO: South Florida Water Management District environmental database, accessed September 8, 2025, at https://my.sfwmd.gov/dbhydroplsql/show_dbkey_info.main_menu. [Site information directly accessible at https://my.sfwmd.gov/dbhydroplsql/show_dbkey_info.show_station_info?v_station=S79&v_lower_lat=&v_upper_lat=&v_lower_long=&v_upper_long=&v_lower_x=&v_u pper_x=&v_lower_y=&v_upper_y=&v_js_flag=Y.]
South Florida Water Management District [SFWMD], Florida Department of Environmental Protection, and Florida Department of Agriculture and Consumer Services, 2009, Caloosahatchee River watershed protection plan: South Florida Water Management District [variously paged; 276 p.], accessed September 8, 2025, at https://www.sfwmd.gov/sites/default/files/documents/ne_crwpp_main_123108.pdf.
Taylor, D., Parker, M., and Bobsein, J., 2022, Caloosahatchee River watershed protection plan annual progress report, Chapter 8D of South Florida Environmental Report, volume 1: South Florida Water Management District, [variously paged; 87 p.], accessed September 8, 2025, at https://sfer-docs.sfwmd.gov/2022_sfer_final/v1/chapters/v1_ch8d.pdf.
Urakawa, H., Steele, J.H., Hancock, T.L., Dahedl, E.K., Schroeder, E.R., Sereda, J.V., Kratz, M.A., Garcia, P.E., and Armstrong, R.A., 2023, Interaction among spring phytoplankton succession, water discharge patterns, and hydrogen peroxide dynamics in the Caloosahatchee River in southwest Florida: Harmful Algae, v. 126, article 102434. [Also available at https://doi.org/10.1016/j.hal.2023.102434.]
U.S. Geological Survey, [USGS], 2021, USGS water data for the Nation: U.S. Geological Survey National Water Information System database, accessed March 1, 2021, at https://doi.org/10.5066/F7P55KJN.
Wilhelm, S.W., Bullerjahn, G.S., and McKay, R.M.L., 2020, The complicated and confusing ecology of Microcystis blooms: mBio, v. 11, no. 3, article e00529-20, 5 p. [Also available at https://doi.org/10.1128/mBio.00529-20.]
Wurtsbaugh, W.A., Paerl, H.W., and Dodds, W.K., 2019, Nutrients, eutrophication and harmful algal blooms along the freshwater to marine continuum: WIREs Water, v. 6, no. 5, article e1373, 27 p. [Also available at https://doi.org/10.1002/wat2.1373.]
Yang, Y., Pan, J., Han, B.-P., and Naselli-Flores, L., 2020, The effects of absolute and relative nutrient concentrations (N/P) on phytoplankton in a subtropical reservoir: Ecological Indicators, v. 115, article 106466. [Also available at https://doi.org/10.1016/j.ecolind.2020.106466.]
Appendix 1. Supplemental Tables and Figures
Table 1.1.
Measured nitrate (NO3−), ammonium (NH4+), and soluble reactive phosphorus (SRP) concentrations averaged across the three replicate tanks for the control (C), nitrate (N), ammonium (A), and phosphate (P) treatments at 0 hours (T0), 30 minutes after initial dose (T030), 24 hours (T24), 30 minutes after day 2 dosing (T2430), 48 hours (T48), 30 minutes after day 3 dosing (T4830), and 72 hours (T72) during the three mesocosm deployments in June 2020, September 2020, and February 2021, Caloosahatchee River, southwest Florida. Nutrients were not added on day 4 (T72).[Superscript letters (a, b) indicate results of repeated measures analysis of variance (ANOVA) post hoc tests (values with the same letter were not significantly different from each other). Bold numbers highlight the mean concentration measured of the nutrient added to each treatment. mg/L, milligrams per liter; ND = no data]
Table 1.2.
Results of the similarity percentages (SIMPER) analysis showing the contribution of typical taxa within control tanks (Group C), ammonium treatment tanks (Group A), nitrate treatment tanks (group N), and phosphate treatment tanks (Group P) across sampling intervals (T0, T24, T48, T72) during the June 2020, September 2020, and February 2021 mesocosm deployments, Caloosahatchee River, Florida.[Average similarity, average within-group Bray-Curtis similarity; Av.Abund, average square-root-transformed taxa abundance; Av.Sim, taxa contribution to group similarity; Sim/SD, ratio of average to standard deviation of similarity; Contrib%, percent contribution of taxa to the total within-group similarity; <, less than; µm, micrometer]
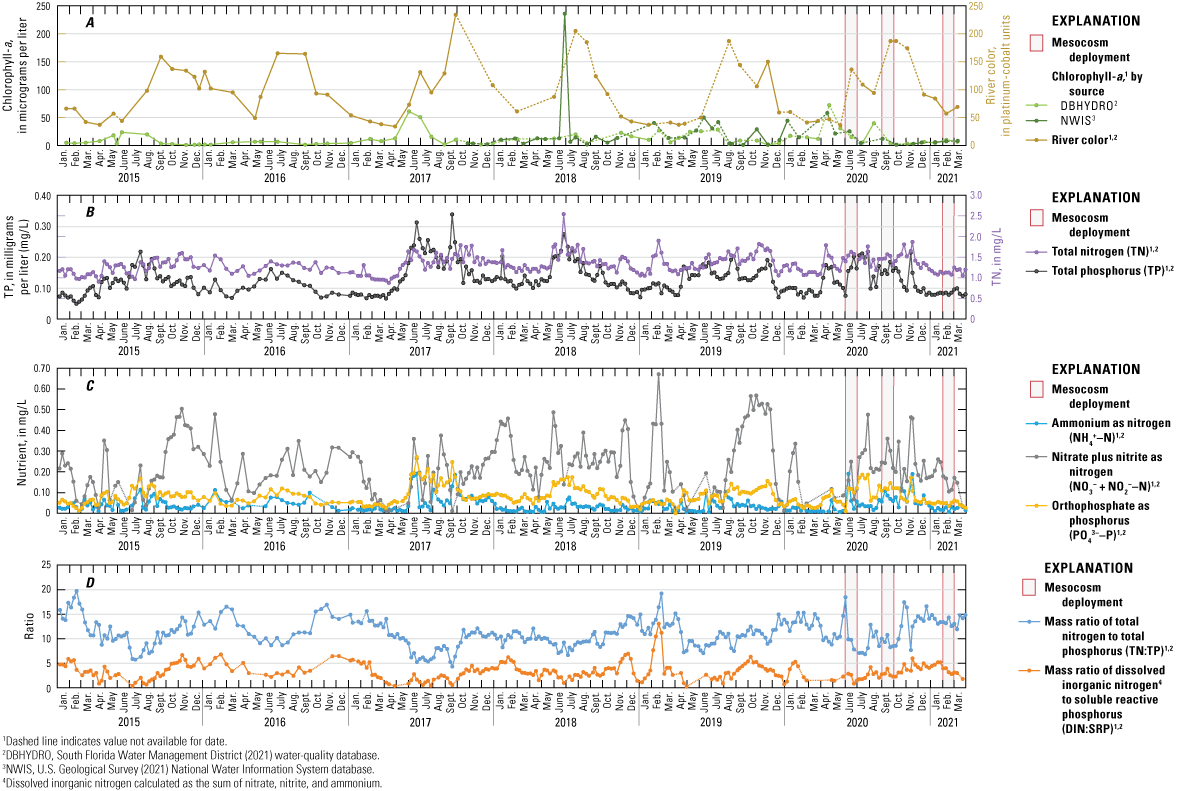
A–D, Water-quality trends at the S-79 monitoring site at the W.P. Franklin Lock and Dam, January 2015–March 2021. Data were downloaded from the South Florida Water Management District DBHYDRO environmental database (South Florida Water Management District, 2021) and the U.S. Geological Survey National Water Information System (NWIS; U.S. Geological Survey, 2021).
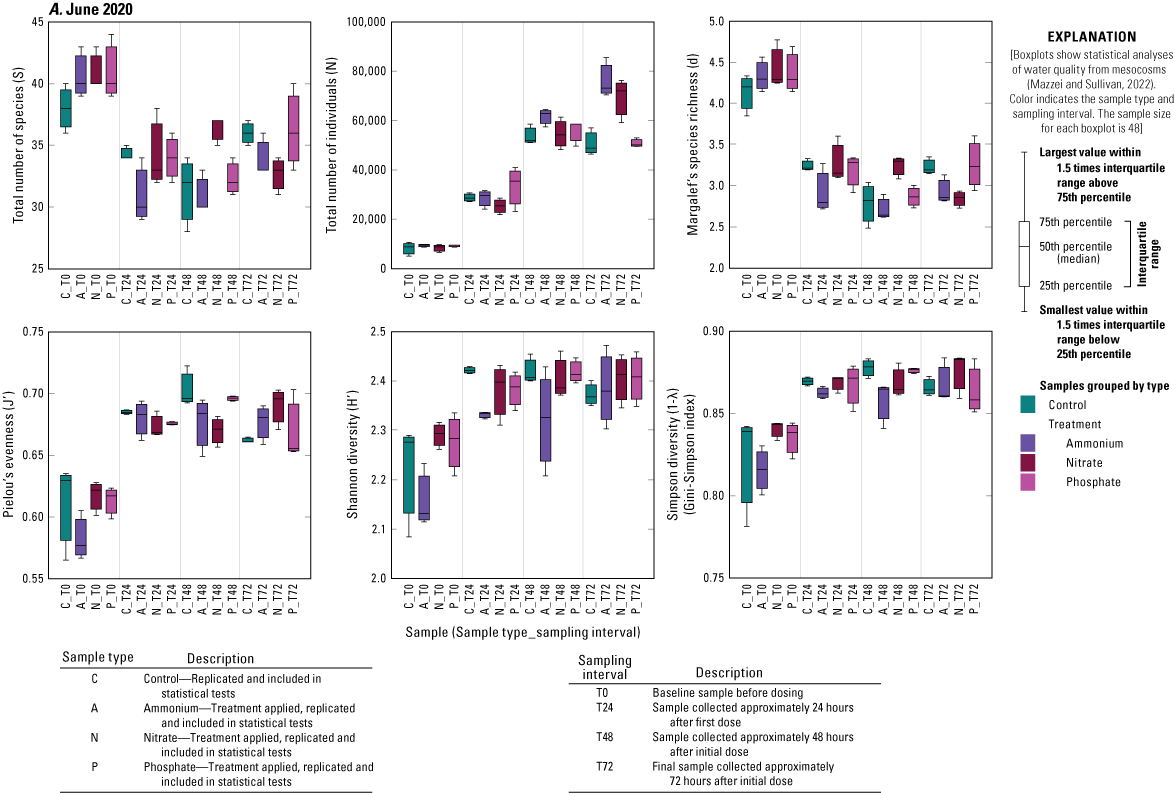
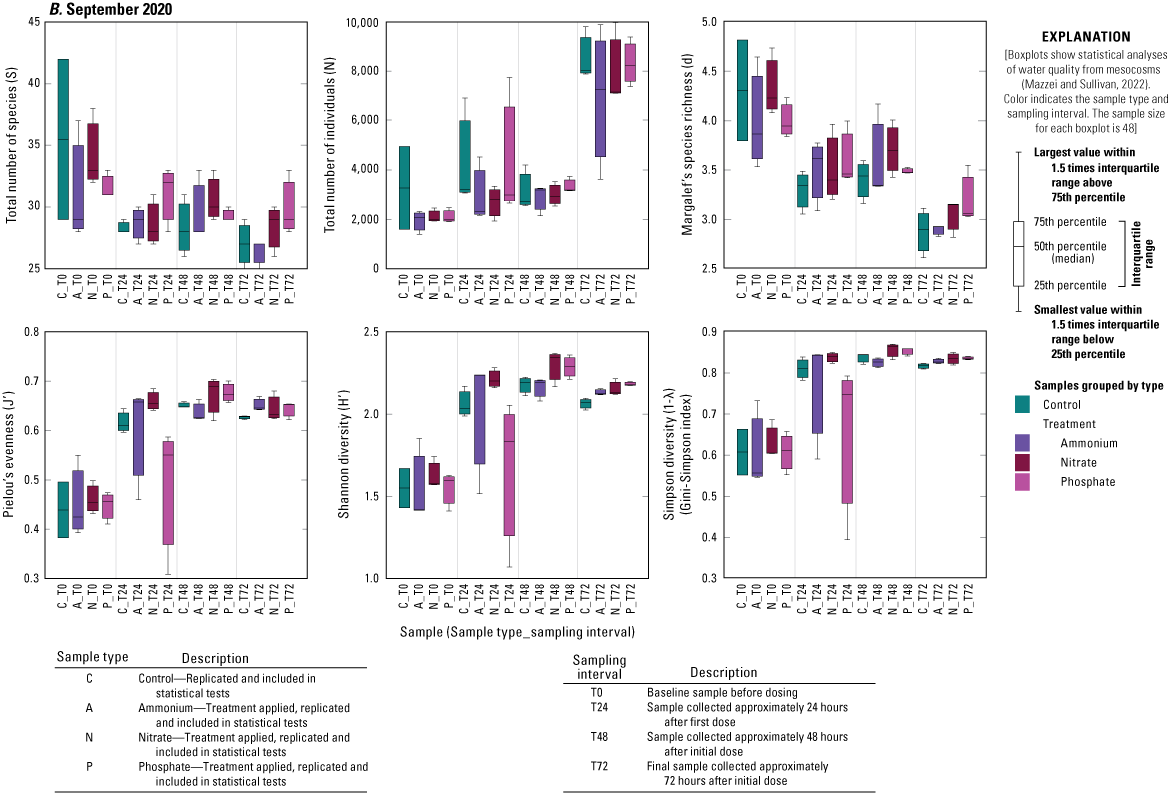
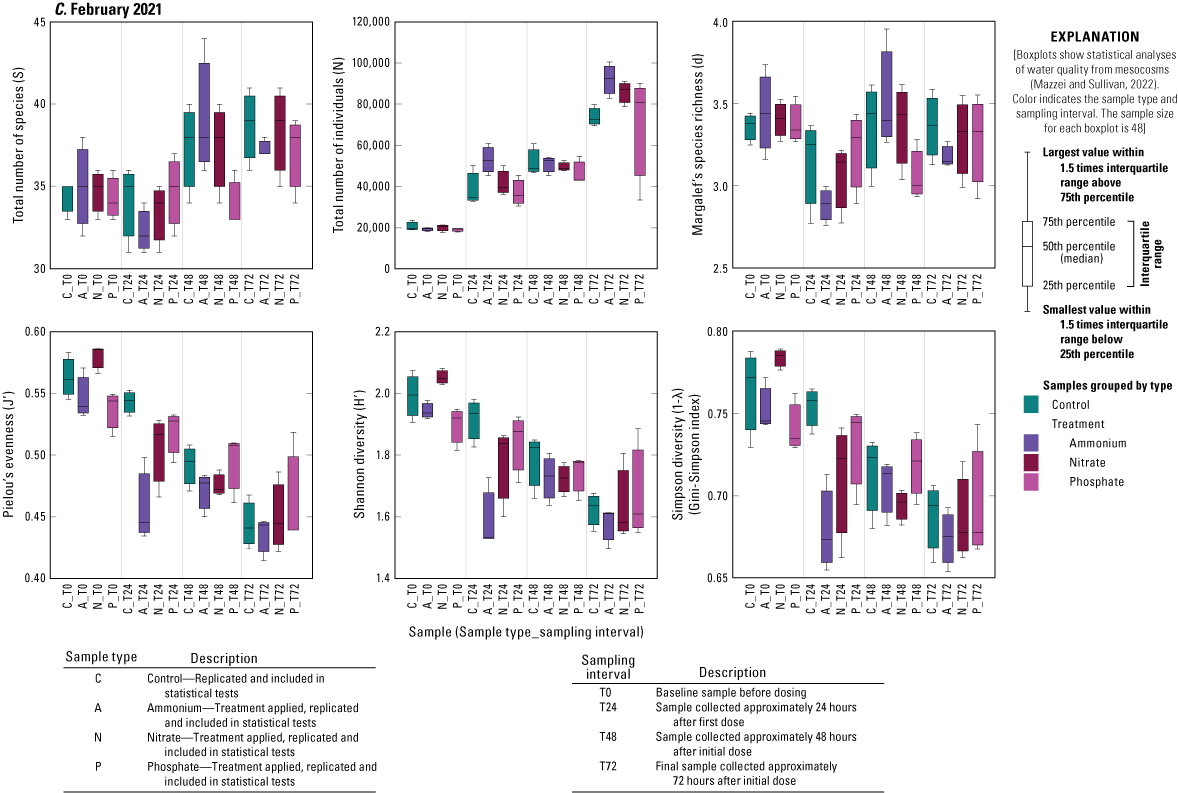
Diversity measures, including total number of species (S), total number of individuals (N), Margalef’s species richness (d), Pielou’s evenness (J′), Shannon diversity (H′), and Simpson diversity (1-λ), across treatments and time for A, June 2021, B, September 2020, and C, February 2021 mesocosm deployments, Caloosahatchee River, southwest Florida.
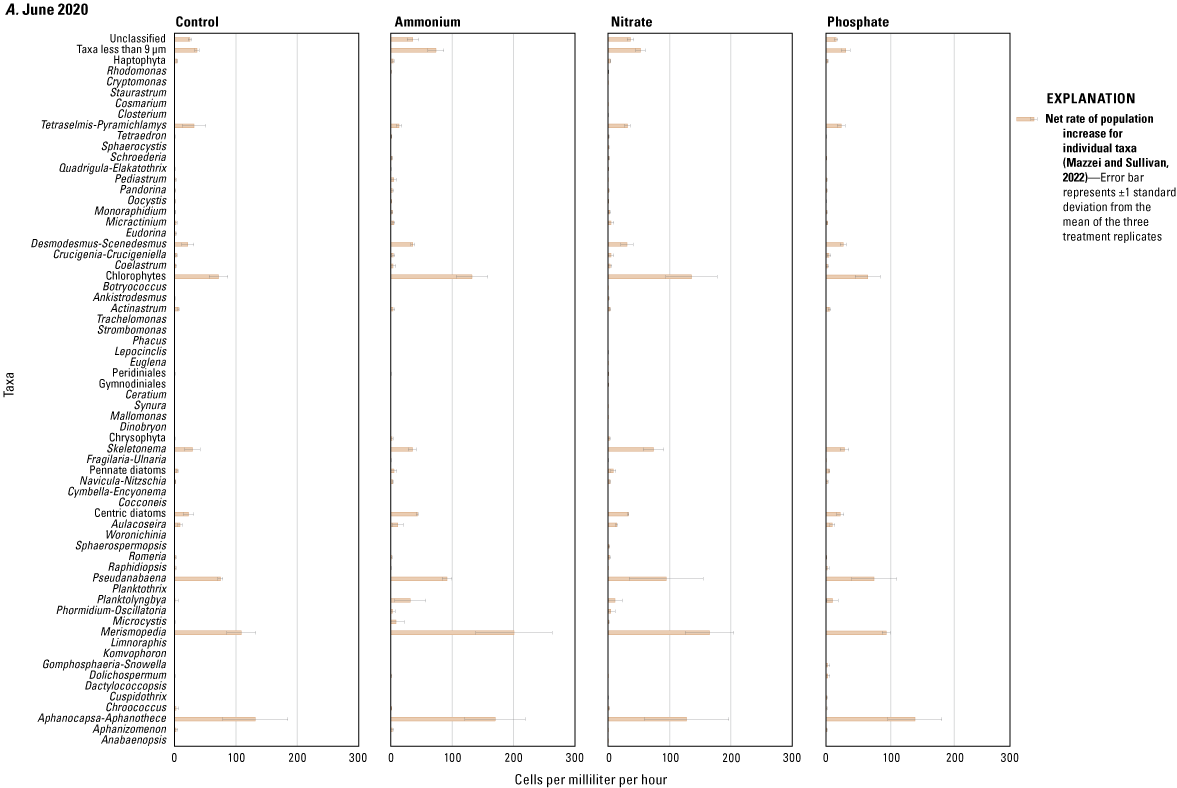
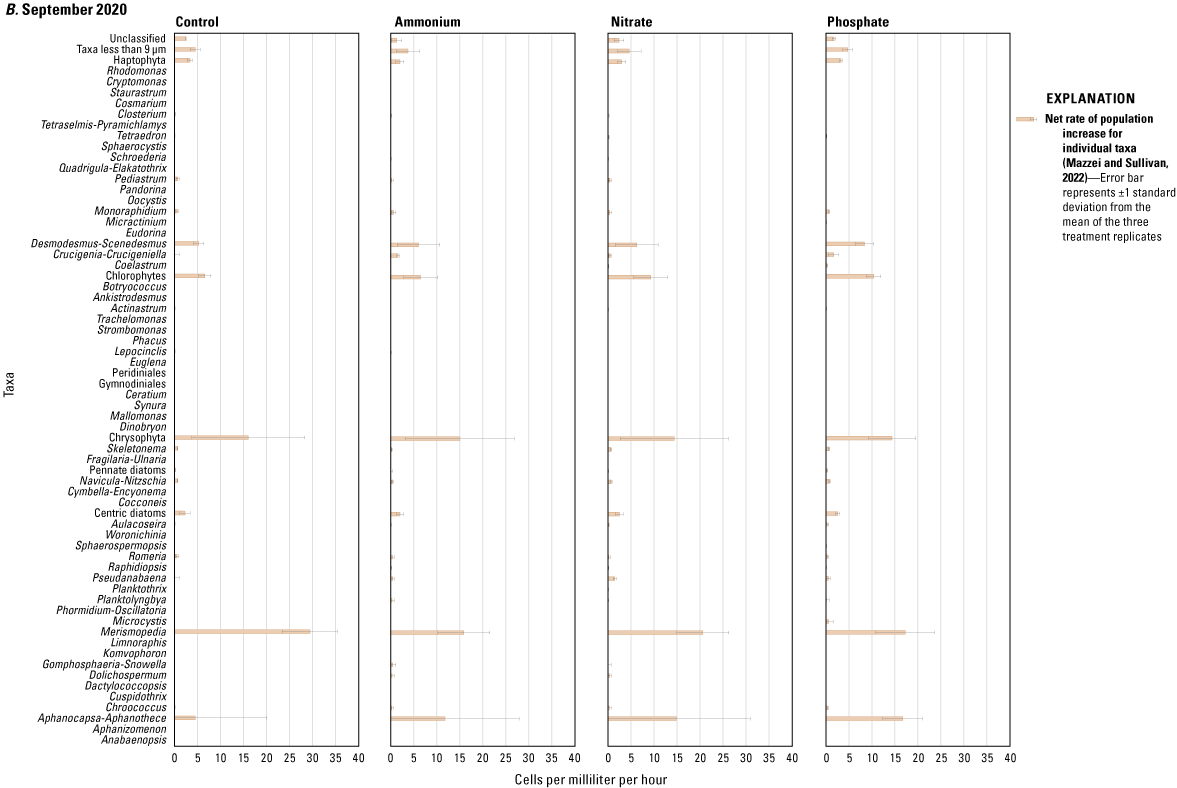
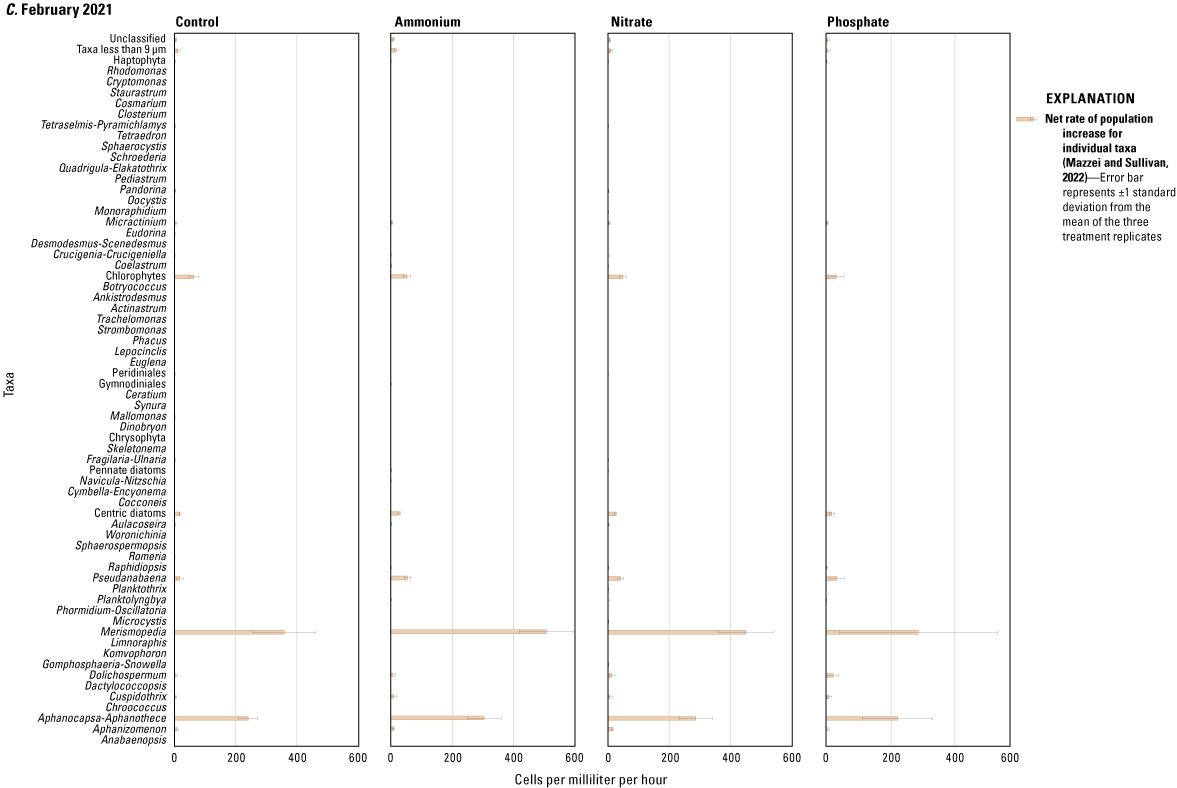
Net rate of population increase for individual taxa measured as change in cells per milliliter per hour in ammonium, nitrate, phosphate, and control treatments during the A, June 2020, B, September 2020, and C, February 2021 mesocosm deployments. Rates were calculated as the difference in mean cell concentration of the three replicates per treatment at the end of the experiments (T72) and the start of the experiment (T0) divided by the 72-hour enclosure period. Error bars are the standard deviations of treatment replicates. Note that x-axes scales differ for the three mesocosm deployments, Caloosahatchee River, southwest Florida.
Conversion Factors
International System of Units to U.S. customary units
Temperature in degrees Celsius (°C) may be converted to degrees Fahrenheit (°F) as follows:
°F = (1.8 × °C) + 32.
Temperature in degrees Fahrenheit (°F) may be converted to degrees Celsius (°C) as follows:
°C = (°F – 32) / 1.8.
Supplemental Information
The cell concentration for each taxon was calculated in units of cells per milliliter (cells/mL).
The net rate of population increase (cells per milliliter per hour [cells/mL/hour]) for all taxa identified was calculated as the difference in cell concentration at the end of the experiments (T72) and the start of the experiment (T0) divided by the 72-hour enclosure period.
Specific conductance is in microsiemens per centimeter at 25 degrees Celsius (µS/cm at 25 °C).
Concentrations of chemical constituents in water are in either milligrams per liter (mg/L) or micrograms per liter (µg/L).
A water year is the 12-month period from October 1 through September 30 of the following year and is designated by the calendar year in which it ends.
Abbreviations
>
greater than
<
less than
1−λ
Simpson diversity (Gini-Simpson index)
α
alpha (represents significance level)
A
ammonium (treatment in the mesocosm tanks)
ANOSIM
analysis of similarities
C
control
Chl-a
chlorophyll-a
d
Margalef’s species richness
DBHYDRO
South Florida Water Management District’s environmental database
DIN
dissolved inorganic nitrogen
DO
dissolved oxygen
DOM
dissolved organic matter
EPA
U.S. Environmental Protection Agency
FDEP
Florida Department of Environmental Protection
fDOM
fluorescent dissolved organic matter
H′
Shannon diversity
HAB
harmful algal bloom
J′
Pielou’s evenness
mL
milliliter
µM
molarity
µm
micrometer
N
nitrate (treatment in the mesocosm tanks)
NH4+
ammonium
NH4+–N
nitrogen content of the ammonium ion
NO3−
nitrate
NO3−–N
nitrogen content of the nitrate ion
NO3−+NO2−–N
nitrogen content of the nitrate ion plus nitrite ion
NWIS
National Water Information System
P
phosphate (treatment in the mesocosm tanks)
PC
phycocyanin
PO43−
phosphate
PO43−–P
phosphorus content of the phosphate ion
RM ANOVA
repeated measures analysis of variance
RM PERMANOVA
repeated measures permutational multivariate analysis of variance
S
total number of species
SFWMD
South Florida Water Management District
SIMPER
similarity percentages
SRP
soluble reactive phosphorus
T
time
T0
baseline sample before dosing
T030
sample collected 30 minutes after first dose application
T24
sample collected approximately 24 hours after first dose
T2430
sample collected 30 minutes after day 2 dosing
T48
sample collected approximately 48 hours after the initial dose
T4830
sample collected 30 minutes after day 3 dosing
T72
final sample collected approximately 72 hours after the initial dose
TN
total nitrogen
TP
total phosphorus
USGS
U.S. Geological Survey
For more information about this publication, contact
Director, Caribbean-Florida Water Science Center
U.S. Geological Survey
7595 SW 33d St.
Davie, FL 33314
For additional information, visit
https://www.usgs.gov/centers/car-fl-water
Publishing support provided by
U.S. Geological Survey Science Publishing Network,
Lafayette Publishing Service Center
Disclaimers
Any use of trade, firm, or product names is for descriptive purposes only and does not imply endorsement by the U.S. Government.
Although this information product, for the most part, is in the public domain, it also may contain copyrighted materials as noted in the text. Permission to reproduce copyrighted items must be secured from the copyright owner.
Suggested Citation
Mazzei, V., Loftin, K.A., Karwacki, E., Lopez, J.V., Krausfeldt, L.E., Rosen, B.H., and Urakawa, H., 2026, Phytoplankton responses to experimental nitrogen and phosphorus loading in the eutrophic and colored Caloosahatchee River, Florida: U.S. Geological Survey Scientific Investigations Report 2026–5141, 32 p., https://doi.org/10.3133/sir20265141.
ISSN: 2328-0328 (online)
Study Area
| Publication type | Report |
|---|---|
| Publication Subtype | USGS Numbered Series |
| Title | Phytoplankton responses to experimental nitrogen and phosphorus loading in the eutrophic and colored Caloosahatchee River, Florida |
| Series title | Scientific Investigations Report |
| Series number | 2026-5141 |
| DOI | 10.3133/sir20265141 |
| Publication Date | April 10, 2026 |
| Year Published | 2026 |
| Language | English |
| Publisher | U.S. Geological Survey |
| Publisher location | Reston, VA |
| Contributing office(s) | Caribbean-Florida Water Science Center |
| Description | Report: x, 32 p.; 3 Data Releases |
| Country | United States |
| State | Florida |
| Other Geospatial | Caloosahatchee River |
| Online Only (Y/N) | Y |
| Additional Online Files (Y/N) | N |