

Assessment of Long-Term Trends in Streamflow Statistics Within and Near the Mobile Bay and Perdido Bay Watersheds, United States, 1950–2022
Links
- Document: Report (8.31 MB pdf) , HTML , XML
- Data Release: USGS Data Release - Monotonic trend computations for streamflow statistics within and near the Mobile Bay and Perdido Bay watersheds, United States, 1950–2022
- NGMDB Index Page: National Geologic Map Database Index Page (html)
- Download citation as: RIS | Dublin Core
Acknowledgments
We would like to acknowledge the Gulf Coast Ecosystem Restoration Council for funding this work.
Abstract
The U.S. Geological Survey, in cooperation with the Gulf Coast Ecosystem Restoration Council, assessed monotonic trends for a variety of streamflow statistics for 69 long-term U.S. Geological Survey streamgages within either the Mobile Bay or Perdido Bay watersheds that were active through at least at the end of calendar year 2019. Long-term data were defined for this investigation as having at least 50 years of cumulative record within the period since January 1, 1950, with a requirement for a complete record of streamflow during the 2010s (2010–19). The 69 streamgages have at least 54 years and as many as 73 years of daily mean streamflow data; the median period of record is 72 years; and 15 of the streamgages are identified as “major nodes” on the basis of the criteria described. The occurrence of statistically monotonic significant trends for the 69 streamgages at the 0.05 significance level is spatially shown for six statistics. For the major node streamgages, the study depicts (1) time-series graphics of annual mean, annual harmonic mean, decadal 10th, 50th, and 90th-percentile streamflows, and (2) a variation on Quantile-Kendall plots of Kendall’s tau and streamflow nonexceedance probabilities for each of the 365 days of a year. Trend assessment synthesis shows that, except for a few streamgages with relatively greater counts of statistically significant trends than others, the majority (about 93 percent) of individual trend tests indicate no trend in the streamflow and ecological metrics considered.
Introduction
Streamflow resources and their usages are important to the ecological and economic vitality of a region (Dieter and others, 2018). Streamflow statistics for stream and river reaches are used in resource assessments, such as water-supply studies, and contribute to various types of scientific studies by water managers, biologists, ecologists, and other disciplines interested in hydrologic conditions. Long-term streamflow data are used for evaluation of hydrologic change; that is, trends, in streamflow. Causative factors for trends could include combinations of systematic land-use changes, changes in groundwater gains or losses, climatic cycles, consumptive use, and statistical vagaries. Out of about 1,300 historical sites inventoried for streamflow and (or) streamgaging or surface-water-quality monitoring in 2024, the U.S. Geological Survey (USGS) operated about 240 continuous streamgages in and near the Mobile Bay and Perdido Bay watersheds in the south-central gulf coast United States. Proximity to the Mobile Bay and Perdido Bay watersheds (fig. 1A) is defined later in this report. The streamflow data and ancillary site information are accessible in the USGS National Water Information System (NWIS) database (USGS, 2024).
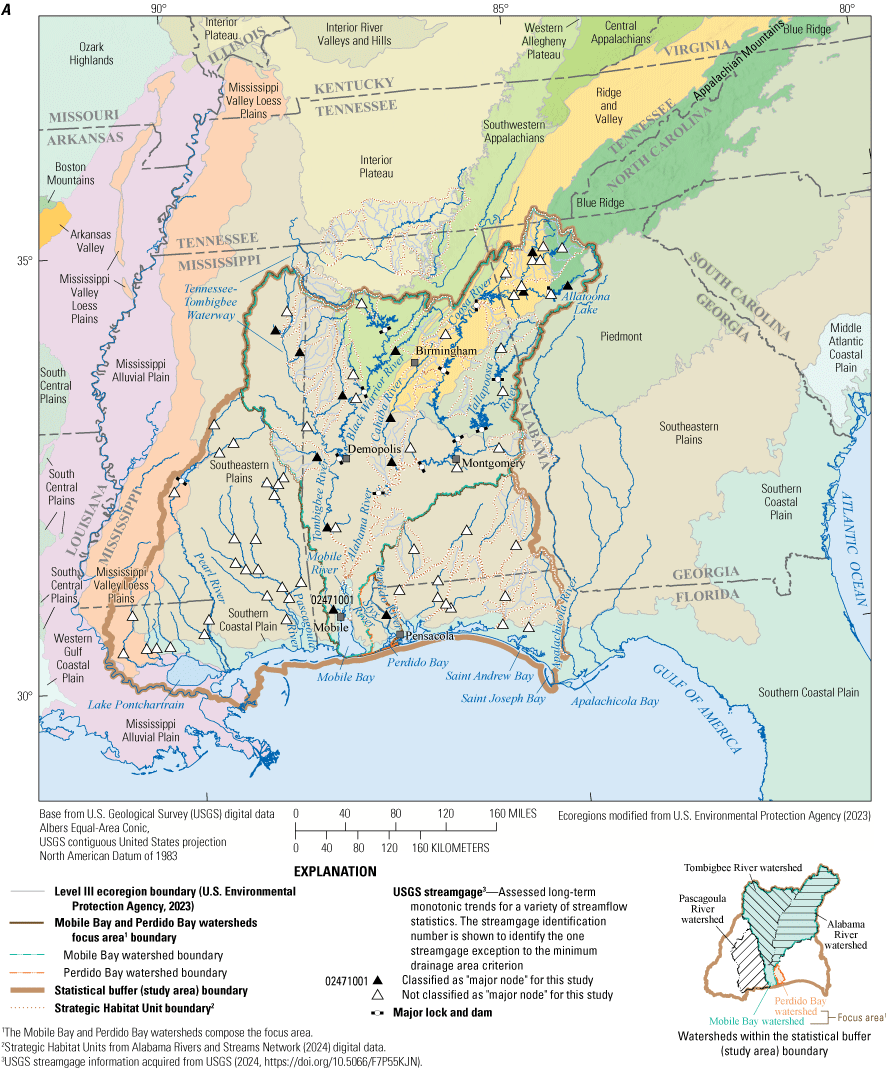
A, Locations of 69 long-term U.S. Geological Survey streamgages, inclusive of those streamgages identified as “major nodes” unique to this study providing streamflow information to statistical trend assessment within the study area (“statistical buffer”), focus area (Mobile Bay and Perdido Bay watersheds), Level III Ecoregions, Strategic Habit Units, major reservoirs, and other features mentioned in the text. B, Physiographic provinces.
The USGS, in cooperation with the Gulf Coast Ecosystem Restoration Council, assessed monotonic trends for a variety of streamflow statistics for 69 selected, long-term USGS streamgages within and adjacent to Mobile Bay and Perdido Bay watersheds that were active at least to the end of calendar year 2019. Long-term data were defined for this study as having at least 50 years of cumulative record from January 1, 1950, to December 31, 2022, with a requirement for a complete record of streamflow during the 2010s (2010–19). The 2010s criterion, representing a period nearly contemporaneous to the time of this study, ensures that recently operational long-term streamgages would be represented. A total of 62 streamgages had records extending through the 2022 calendar year, but because 2019 concludes the 2010s decade, it was used as an auxiliary criterion for this study. To help avoid potential confusion regarding the stated 2019 and 2022 endpoints, and for some annual analyses described, data from 2020–22 were used when these data were available for a given streamgage. The 69 streamgages have record ranging from 54 to 73 years of daily mean streamflow data; the median period of record is 72 years.
About 300 recently operational streamgages throughout the entire study area were initially considered as candidates for inclusion in this study; the 69 streamgages selected by the aforementioned criteria are shown in figure 1A. The map depicts both a focus area (Mobile Bay and Perdido Bay watersheds) and a “statistical buffer” defining proximity to the two watersheds for the purposes of this report. For streamgages considered in this study, the minimum contributing drainage area (CDA) is about 52.1 square miles (mi2), the median CDA is about 613 mi2, and the maximum CDA is about 18,417 mi2. Lastly, the figure 1A map also identifies and refers to some streamgages as “major nodes,” which is a term and intent unique to this study and described later in the section “Major Node Streamgage Selection.”
Purpose and Scope
The purposes of this report are to (1) describe the results of statistical tests for monotonic trends using the Mann–Kendall test for common streamflow and specific ecological metrics (26 trend tests per streamgage) for the 69 long-term streamgages, (2) present a detailed review of monotonic trends for 15 of the 69 streamgages identified by criteria herein as the major nodes in the greater Mobile Bay and Perdido Bay watersheds, and (3) present visualization of trends in the full streamflow regime by a variant of so-called Quantile-Kendall plots. The basic data are daily mean streamflows from which all subsequent streamflow metrics were computed. The general statistical scope includes assessing monotonic trends as part of the nonparametric Mann–Kendall and related tests, which test for independence with time and specifically quantify whether statistically significant monotonic changes in each streamflow metric have occurred over time.
Study Area and Physical Setting
For this investigation, the study area is inclusive of the Mobile Bay and Perdido Bay watersheds, sourcing parts of Alabama, Florida, Georgia, and Mississippi. These watersheds are considered herein as a focus area (Tatum and others, 2024, geospatial file mobile_bnd.zip) (fig. 1A), with the addition of (1) some lesser coastal hydrologic units extending as far east as Saint Andrew and Saint Joseph Bays but not to the Apalachicola River and Apalachicola Bay and (2) the hydrologic areas west through the Pascagoula and Pearl Rivers, and other western drainages into Lake Pontchartrain. The study area is coincident and within the so-termed “buffer for statistical analysis” geospatial product provided by Tatum and others (2024, geospatial file mobile_bnd_buffer.zip) (fig. 1A). Use of streamflow data that spatially extend beyond the core focus area facilitates comprehensive review of streamflow statistics and trends and provides opportunities to compare findings within the Mobile Bay and Perdido Bay watersheds to the greater region.
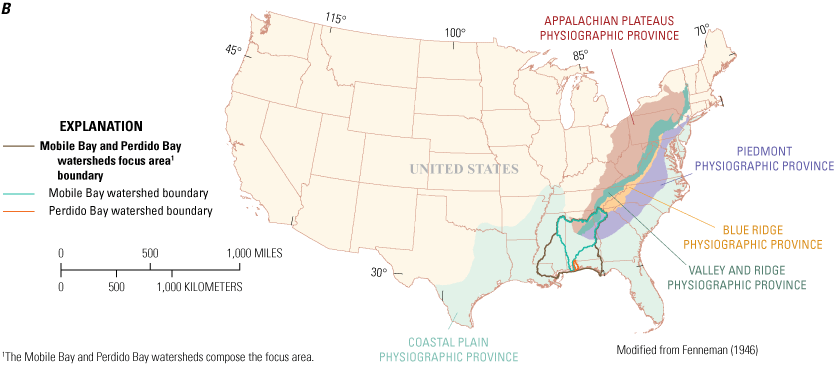
The study area encompasses the watersheds draining to the gulf coast of Alabama, specifically the Mobile Bay and Perdido Bay watersheds (fig. 1A). From west to east, the principal inland watersheds include those of the Tombigbee, Alabama, and Perdido Rivers. Notably, this report excludes the easternmost portion of the Pascagoula River watershed, which primarily discharges to the Mississippi coast. The coastal watersheds under investigation cover a substantial portion, approximately 65 percent, of the total land area of Alabama. Furthermore, these coastal watersheds extend beyond State boundaries into parts of eastern Mississippi, northern Georgia, and southeastern Tennessee, comprising a total study area of about 45,800 mi2. General background on surface-water resources for the states overlapping this study can be found in Jeffcoat and Mooty (1986). Five physiographic provinces overlap the study area (fig 1B): the Coastal Plain (60 percent), Piedmont (14 percent), Valley and Ridge (14 percent), Appalachian Plateaus (11 percent), and Blue Ridge (1 percent) (Fenneman, 1946; Fenneman and Johnson, 1946).
Year-round precipitation patterns and quantities experienced in the study area are substantially influenced by both the Gulf of America (hereinafter referred to as “the gulf”) and the Appalachian Mountains. Rainfall typically coincides with the passage of warm and cold fronts between November and April, as well as sporadic thunderstorms from May to October (Anderson, 2020). During the period from June to September, tropical storms or hurricanes occasionally enter the southern portion of the study area along the gulf coast, leading to increased precipitation totals there compared to the rest of the study area. In Alabama, the annual average precipitation is about 55 inches, with a relatively consistent distribution throughout the year, except for the period during August–October, which typically marks the onset of droughts (National Centers for Environmental Information, 2022). However, the timing and severity of droughts in the study area are influenced by the cumulative meteorological effects of decreased precipitation, heightened solar radiation, and extreme heat on soil recharge (Jeffcoat and others, 1991).
The Mobile Bay watershed (about 45,800 mi2) principally comprises the Alabama River and Tombigbee River watersheds. The Alabama River watershed is approximately 22,800 mi2 and originates in northwestern Georgia. Both primary tributaries of the Alabama—the Coosa and Tallapoosa Rivers—host major dams supporting water supply, flood control, and hydroelectric power generation, particularly beyond the extent of the Coastal Plain physiographic province where topography is generally characterized by steeper slopes and higher elevations. The Coosa and Tallapoosa Rivers confluence is located near Montgomery, Alabama, approximately 100 miles (mi) upstream from the confluence with the Tombigbee River. Among its principal tributaries is the Cahaba River, which originates northeast of Birmingham, Ala., and flows about 195 mi southward to join the Alabama River.
The Tombigbee River watershed encompasses approximately 22,000 mi2, including the Tombigbee River, originating in northeastern Mississippi and flowing southward into Alabama, where it joins the Alabama River to form the Mobile River some 45 mi north of Mobile, Ala. The Mobile River flows another 6 mi south of the confluence, where it then branches into a network of distributary channels that ultimately discharge into Mobile Bay, located in the gulf near Mobile, Ala. The Black Warrior River, a primary tributary of the Tombigbee River, flows southwestward from Birmingham, Ala. and converges with the Tombigbee River at Demopolis, Ala. Several lock and dam complexes along these rivers support industrial transport, primarily of coal, lumber, and other timber products to Mobile, Ala. Moreover, livestock production and row crops are substantial economic drivers within the watershed, particularly following the completion of the Tennessee-Tombigbee Waterway in 1984 (USGS, 1986). This waterway has since served as a critical route for waterborne commerce and recreational activities (Tennessee Tombigbee Waterway Development Authority, 2024).
The Perdido River, which forms the State line between Alabama and Florida, is the primary freshwater tributary of Perdido Bay, a shallow estuary approximately 15 mi west of Pensacola, Florida. The Perdido River and Perdido Bay watersheds when combined encompass about 1,500 mi2. Contiguous land adjoining the Perdido River is characterized by forestry cultivation and designated conservation zones to promote water-quality conditions conducive to healthy aquatic habitats for a diverse array of economically and recreationally important species in the bay, whereas the areas surrounding the Styx River, the primary tributary of the Perdido River, have undergone considerable residential development (Handley and others, 2007).
Previous Studies
Previous investigations have examined streamflow trends within the study area to enhance understanding of how streamflow is changing along the gulf coast. Rodgers and others (2020) used a trend departure index in the southeastern United States to identify and quantify nonclimatic trends in streamflow. The trend departure index quantifies the departure of the identified location from a temporally and spatially similar reference site. Trends were computed on mean monthly and seasonal streamflow using Mann–Kendall trend analysis and Quantile-Kendall plots using 139 streamgages aggregated into five clusters having similar temporal variability. A conclusion for the current (2025) study (fig. 1A) that can be drawn from Rodgers and others (2020, figs. 6, 7, 8, 14) is that volume and volumetric-like streamflow (statistics measured in cubic feet per second) trends are few.
The U.S. Environmental Protection Agency (2024) used data from a collection of streamgages in watersheds having minimal human effects, designated as “reference streamgages” (Lins, 2012), to show trend directions for select streamflow statistics, although without indicating statistical significance of long-term rates of change for 1940–2022. The streamflow statistics reviewed included 7-day low streamflows, 3-day high streamflows, and annual mean streamflows. A U.S. Environmental Protection Agency (2024) streamflow trend graphic is provided in figure 2 showing long-term rates of change, and these trend results indicate and contextualize an absence of substantial trends in bulk water volume over extended periods of time for reference streamgages in coastal Alabama and Mississippi.
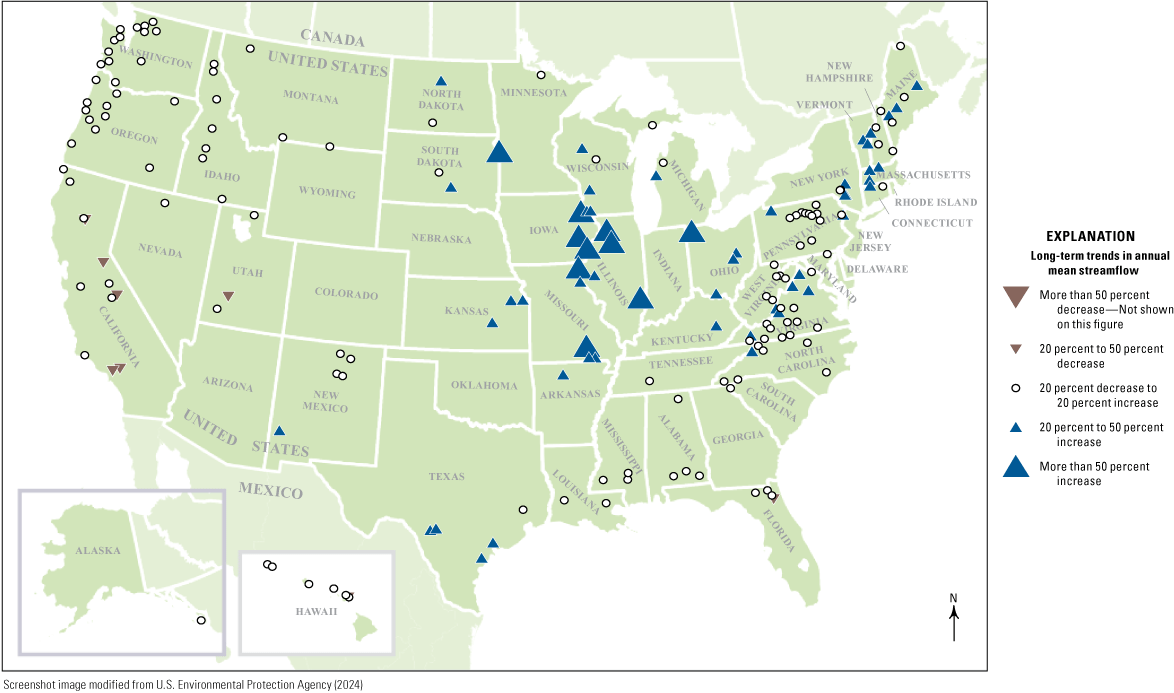
Long-term (1940–2022) trends in annual mean streamflow (time series by year of mean streamflow) for reference U.S. Geological Survey streamgages with minimal human effects. Modified from U.S. Environmental Protection Agency (2024) for long-term rates of change.
Streamflow Statistics, Major Node Streamgage Identification, and Approaches for Trend Assessment
Streamflow Statistics
Streamflow statistics and other metrics having biological, ecological, and hydrologic importance from Henriksen and others (2006) are bundled into the term “statistic.” As a result, many definitions of streamflow-statistic characteristics exist. Choices of data features or statistics for trend assessment depend partly on what hydrologic topics are under study. Some, such as 1-day annual maxima, are focused on daily flood volumes derived from a time series of maximum daily streamflow for a given year, and many years of such data representing flow from storms are then studied. Conversely, other statistics, such as the 7-day 10-year low flow (Feaster and Lee, 2017), are focused on drought-like conditions to establish regulatory flows for environmental permitting (Alabama Department of Environmental Management, 2024), which can be derived by moving 7-day windows (intervals) through the 365 days of streamflow for a given year and finding the minimum mean flow within that week-long period. Such low-flow data represent periods lacking abundant rainfall.
Annual mean streamflow data, which represent many individual years of mean streamflow can be used to compute mean annual streamflow, and such data represent the expected annual volume of water measured by streamgages. Other streamflow statistics, such as (1) the 90th-percentile daily high flow from a flow-duration curve (FDC) and (2) the annual harmonic mean that emphasizes low flows, can be used for a variety of disciplines and can be informative to ecological science and environmental resource managers. Annual harmonic mean is defined as a mean specifically weighted toward the low end of the flow regime (Asquith and Heitmuller, 2008). An FDC depicts the probability with which a given streamflow for a study period will be either greater than or less than a given value. For example, if a decade of flows for a streamgage has a 10th percentile of 62 cubic feet per second (ft3/s), then for 10 percent of the days within that decade, daily streamflows will be less than or equal to 62 ft3/s, whereas for 90 percent of the days within the decade, streamflow will be equal to or greater than 62 ft3/s. Crowley-Ornelas and others (2023) summarize that decadal FDCs provide an efficient means of describing the distribution of streamflow at a site and are commonly used as a means of depicting central tendency, variation (interquartile range), extremely low- or high-flow regimes, and depending on the site, the percentage of no-flow days. Crowley-Ornelas and others (2023) also study relations between 6 decades (1950s through 2010s) and components of decadal FDCs, but do not assess trends such as those covered in the current (2025) study.
For this study, FDCs at decadal time scales provide the DF10 (low flow), DF50 (median, middle-range flow), and DF90 (high flow) for the 10th, 50th, and 90th percentiles, respectively. These three percentiles are streamflow metrics subject to trend assessment and time-series depiction for several of the streamgages. Annual FDCs, conversely, were used to construct Quantile-Kendall plots for the 15 major node streamgages. The Quantile-Kendall plots are defined in the “Quantile-Kendall Plots” section. The abbreviations shown (DF10, DF50, and DF90) for the three quantiles of the FDC are further defined in table 1 along with the other 23 metrics.
Table 1.
Streamflow metrics used in this report.[Chosen for this study and (or) modified from Henriksen and others (2006)]
| Identifier1 | Statistic/Metric | Computation method | Unit of measure |
|---|---|---|---|
| ANN_MEAN | Annual mean streamflow | Arithmetic mean of individual daily mean streamflows for the year | Cubic feet per second |
| ANN_HARM | Annual harmonic mean streamflow | Harmonic mean of individual daily mean streamflows for the year | Cubic feet per second |
| DF10 | Decadal flow-duration curve (10th percentile, low streamflow) |
Streamflow having a 0.10 nonexceedance probability of individual daily mean streamflows for a given decade | Cubic feet per second |
| DF50 | Decadal flow-duration curve (50th percentile, median streamflow) |
Streamflow having a 0.50 nonexceedance probability of individual daily mean streamflows for a given decade | Cubic feet per second |
| DF90 | Decadal flow-duration curve (90th percentile, high streamflow |
Streamflow having a 0.90 nonexceedance probability of individual daily mean streamflows for a given decade | Cubic feet per second |
| SMK | Seasonal Mann–Kendall test | Refer to Helsel and others (2020, sec. 12.4.1) | Dimensionless |
| ML07 | Mean minimum July streamflows | Arithmetic mean of individual July minimum daily mean streamflows for a given decade | Cubic feet per second |
| ML09 | Mean minimum September streamflows | Arithmetic mean of individual September minimum daily mean streamflows for a given decade | Cubic feet per second |
| ML15 | Mean of the ratios of minimum annual streamflows to the mean streamflow | Arithmetic mean of individual yearly minimum daily mean streamflows for a given decade | Dimensionless |
| FL01 | Low flood pulse count | Arithmetic mean number of events with streamflows below the 25th percentile of streamflows for a given decade | Number of events per year |
| FL03 | Frequency of low streamflow pulse spells | Average number of events with streamflows below the 5th percentile of arithmetic mean streamflow for a given decade | Number of events per year |
| TL01 | Julian date of annual minimum. Date of minimum streamflows for each year | Transform dates to relative values on circular scale (radians or degrees). Compute x and y components for each year and average them across all years. Compute the mean angle as the arc tangent of y-mean per x-mean. Transform angle back to Julian date. Make computations for a given decade | Julian day |
| DL14 | Low exceedance streamflows (75 percent) | Compute the 75-percent exceedance value for a given decade record. DL14 is the exceedance value divided by the median streamflow for a given decade | Cubic feet per second |
| DL15 | Low exceedance streamflows (90 percent) | Compute the 90-percent exceedance value for a given decade record. DL15 is the exceedance value divided by the median streamflow for a given decade | Cubic feet per second |
| MH08 | Mean maximum streamflows for August across all years | Compute the arithmetic streamflow mean of individual daily maximums for each August for a given decade | Cubic feet per second |
| MH10 | Mean maximum streamflows for October across all years | Compute the streamflow maximums for each October for a given decade | Cubic feet per second |
| MH13 | Variability (coefficient of variation) across maximum monthly streamflows | Compute the arithmetic mean and standard deviation for the maximum monthly streamflows for a given decade. MH13 is the standard deviation times 100 divided by the arithmetic mean maximum monthly streamflow for all years (year count equals 10 because of decadal basis) | Percent |
| FH03 | High flood pulse count (3 times median streamflow) | Compute the arithmetic mean number of days per year that the streamflow is above a threshold equal to three times the median streamflow for the entire record. FH03 is the arithmetic mean number of days for all years for a given decade | Number of days per year |
| FH04 | High flood pulse count (7 times median streamflow) | Compute the average number of days per year that the streamflow is above a threshold equal to seven times the median streamflow for the entire record. FH04 is the arithmetic mean number of days for a given decade | Number of days per year |
| FH07 | Flood frequency | Compute the arithmetic mean number of events with streamflows above a threshold equal to seven times the median streamflow for the entire record. FH07 is the arithmetic mean number of events for a given decade | Number of events per year |
| DH16 | Variability in high-streamflow pulse duration | Compute the standard deviation for the yearly arithmetic mean high pulse durations. DH16 is 100 times the standard deviation divided by the arithmetic mean of the yearly average high pulse durations for a given decade | Percent |
| RA02 | Variability in rise rate | Compute the standard deviation for the positive streamflow changes. RA02 is 100 times the standard deviation divided by the arithmetic mean for a given decade | Percent |
| RA04 | Variability in fall rate | Compute the standard deviation for the negative streamflow changes. RA04 is 100 times the standard deviation divided by the arithmetic mean for a given decade | Percent |
| RA06 | Change of streamflow (positive) | Compute the log10 of the streamflows for the record for a given decade. Compute the change in log of streamflow for days in which the change is positive for the entire record. RA06 is the median of these log values | log10 cubic feet per second |
| RA07 | Change of streamflow (negative) | Compute the log10 of the streamflows for the record for a given decade. Compute the change in log of streamflow for days in which the change is negative for the entire record. RA07 is the median of these log values | log10 cubic feet per second per day |
Identifiers for streamflow metrics in this report are all-upper-case style. Some literature uses an all-lower-case style, including the Gain and others (2025) data release supporting this report. There is no difference in meaning between the nomenclature styles. The left-zero padding in the trailing number for applicable identifiers ensures computer-based alphabetical sorting coherence and is consistent with Gain and others (2025).
Major Node Streamgage Selection
“Major node” streamgages (table 2) were chosen to represent long-term data-collection sites using a set of criteria unique to this study: (1) at least 5 decades of data record after January 1, 1950; (2) a complete dataset for the 2010s decade; and (3) data collection within the Mobile Bay and Perdido Bay watersheds. The decision to include complete 2010–19 record was made to ensure the most recent conditions and streamgages in current operation. Additional criteria included (1) a minimum drainage area of 200 mi2 (with one exception) and (2) stream reaches south of the Tennessee-Tombigbee Waterway (USGS, 1986), if a streamgage was located on the Tombigbee River. The one streamgage exception to the minimum drainage area criterion was USGS site number 02471001 Chickasaw Creek near Kushal, Ala. (CDA of 125 mi2) (fig. 1A); the exception was made because USGS site number 02471001 (USGS, 2024) is near the head of Mobile Bay and was included as part of the near-contemporary study by Asquith and others (2023) on long-term coastal salinity statistical learning and prediction applications. The term “major” does not necessarily represent total streamflow prominence in the greater study area—other factors were considered.
Table 2.
U.S. Geological Survey (USGS) streamgages identified as major nodes in the Mobile Bay and Perdido Bay watersheds, Alabama, where major node criteria included representation of substantially long-term sites having at least 5 decades of data record after January 1, 1950, with a complete dataset for the 2010s decade.[Streamgage site information and data products are available from USGS (2024); NAD 83, North American Datum of 1983; mi2, square mile; Fla., Florida; Ga., Georgia; Ala., Alabama; Miss., Mississippi]
Additional factors included a streamgage representing Level III and IV Ecoregions (U.S. Environmental Protection Agency, 2023), location within Strategic Habitat Units (SHUs; Alabama Rivers and Streams Network, 2024), and close downstream proximity to major reservoirs (U.S. Army Corps of Engineers, 2024). The ecoregions, major reservoirs, and SHUs are shown in figure 1A. The minimum, median, and maximum CDA of the 15 major node streamgages are 125, 798, and 18,417 mi2, respectively.
Regardless of the major node designation for this study, trend analyses were completed for all sites meeting the aforementioned requirements of at least 50 years of data and complete record for the 2010s decade. Additional resources to aid in major node identification included consultation of streamgages selected by others for previous depictions of hydrologic history or critical for statistical modeling of coastal salinities (USGS, 1986, 1991; Rodgers and others, 2020; Asquith and others, 2023).
Approaches for Monotonic Trend Assessment
Trend assessments made for this study are primarily based on the application of hypothesis tests, with a given test applied to a particular sample streamflow statistic. Specifically, the Mann–Kendall test was used, and the test uses the relation between time and a ranked streamflow statistic for computations rather than the magnitude of a streamflow statistic. Kendall’s tau is a correlation coefficient (measure of association) of the Mann–Kendall family of tests (Hollander and Wolfe, 1973; Helsel and others, 2020). The description of Kendall’s tau and its use that follows draws from Asquith and Barbie (2014), who studied monotonic trends in annual mean streamflow in Texas. The streamflow statistics of this study are listed in table 1 and similarly documented in Gain and others (2025).
In this study, statistical hypothesis tests were used to evaluate trends in streamflow statistics at major nodes in the study area. The goal of the selection criteria for the major node streamgages was to get broad representation of conditions in the study area with the longest streamflow records. Computation of streamflow (for instance, decadal 10th, 50th, and 90th streamflow percentiles) and other hydrologic metrics are broadly associated with ecological studies. Kendall’s tau statistics and probability values (p-values) were computed using the R language (R Core Team, 2024, function stats::cor.test) and Pohlert (2023, function trend::smk.test for seasonal Mann–Kendall). Hereinafter, the term “year” refers exclusively to the conventional calendar year and is not related to “water year” as some USGS datasets and other investigations are organized. For clarity, a water year is defined as the 12-month period between October 1 and September 30. The water year is designated by the calendar year in which it ends, and thus, the year ending September 30, 2020, is referred to as the “2020 water year.”
Kendall’s tau was used in this study for general monotonic trend analyses of various streamflow statistics. The trend analyses in this report (unless otherwise noted) refer to the direction but not the magnitude of streamflow change. A statistically significant positive Kendall’s tau indicates an upward streamflow trend; conversely, a statistically significant negative tau indicates a downward streamflow trend. The p-value of Kendall’s tau is a measure of the statistical significance of the trend, assuming a null hypothesis that no trend is present. For this investigation, a p-value less than 0.05 (p-value < 0.05) indicated the presence of a statistically significant trend (alpha = 0.05); conversely, a p-value greater than or equal to 0.05 indicated the absence of a statistically significant trend. This study uses the two-tailed version of the Kendall’s tau statistical test. If an inquiry into the actual direction of the trend was needed, then the p-values require a division by 2, because the Kendall’s tau statistical test is inherently two-tailed. The p-values reported in Gain and others (2025) for this study are those for the two-tailed test.
To compute the Kendall’s tau statistics and p-values, the R statistical language (R Core Team, 2024) was used. Specifically, the R function cor.test(..., method=“kendall”), and its associated features and documentation were used. For this study, a decision was made and justified by maximum interpretability to only compute the Theil–Sen slope for the annual mean streamflow statistic in cubic feet per second per year. The Theil–Sen slope is defined as the median of all unique pair-wise slopes that can be computed for a sample (Helsel and others, 2020, p. 267–270).
Quantile-Kendall Plots
Quantile-Kendall plots are a scheme describing overall trend direction and significance for the entire flow regime (Hirsch and DeCicco, 2015). The Quantile-Kendall plots were computed using the R language (R Core Team, 2024), and the Quantile-Kendall plot variation used for this study were plots of Kendall’s tau and streamflow nonexceedance probabilities for each of the 365 days of a year. This approach creates a fixed and common coordinate system between plotting extents in the horizontal and vertical dimensions ranging from 0 to 1. In effect, for the period of record analyzed for a streamgage, trends throughout the annually based FDC are visualized. The far-left edge of the plot represents the nonparametric association of the annual minimum daily streamflow through the years of record. Conversely, the far-right edge of the plot represents the nonparametric association of annual maximum daily streamflow (the 365th order statistic) having a nonexceedance probability of 1 based on a 365-day year. The Weibull plotting positions (Asquith and others, 2017, p. 68) of the 365 or 366 days in an observation year were used and from which the requisite probabilities were extracted. Quantile-Kendall plots for this study also depict the threshold lines of Kendall’s tau for the available sample size for a given statistical significance, and data points are shaded to contrast between statistically significant and nonsignificant values of Kendall’s tau. Quantile-Kendall plots permit simultaneous view into the low-flow regime, middle or base-flow regime, and the high- or flood-volume regime, but because the association in time is measured by Kendall’s tau, the plots are invariant to absolute magnitude of streamflow.
Assessment of Long-Term Trends of Streamflow Statistics Within and Near the Mobile Bay and Perdido Bay Watersheds
Long-term trend assessment, synthesis, and discussion are provided in this section. This section consists of the following three parts: (1) a presentation and discussion of the spatial distribution of statistically significant (p-value < 0.05) Mann–Kendall trends for annual mean, annual harmonic mean, and 10th-, 50th-, and 90th-percentile decadal flow as well as significant (p-value < 0.05) seasonal Mann–Kendall test results; (2) a presentation and discussion of joint (a) time-series plots for the 15 major nodes of the five statistics in the first part and (b) Quantile-Kendall plots for the 15 major node streamgages; and (3) a general discussion about the statistical trend tests and potential interpretations for this investigation. All Kendall’s taus, p-values, and associated metadata are listed in the USGS data release by Gain and others (2025, file monotrnd_1hyp.txt). By streamgage and by test, all the results and additional quantifications of significant trends (p-value < 0.05) are listed in Gain and others (2025, files monotrnd_2stn.txt and monotrnd_3cnt.txt) where these additional files therein organize trend counts by hypothesis and trend detections by streamgage.
Monotonic Trend Detections by Mann–Kendall Hypothesis Test
The monotonic trend results of the Mann–Kendall test for streamflow statistics for the 69 streamgages are discussed in this section. Figure 3 areally depicts the results of the Mann–Kendall tests for 7 of the 26 statistics tested by streamgage. The six volume-related streamflow statistics are the focus (annual mean streamflows [ANN_MEAN]; annual harmonic mean [ANN_HARM]; 10th percentile of decadal FDCs [DF10]; 50th percentile of decadal FDCs [DF50]; 90th percentile of decadal FDCs [DF90]; and seasonal Mann–Kendall [SMK]), followed by a seventh statistic, RA07, the median declining days streamflow recession metric. The SMK test for this study is restricted to monthly streamflows computed from the daily mean streamflows. On the figure 3 map, the 15 major node streamgages are identified and numerically cross-referenced to additional figures in this report.
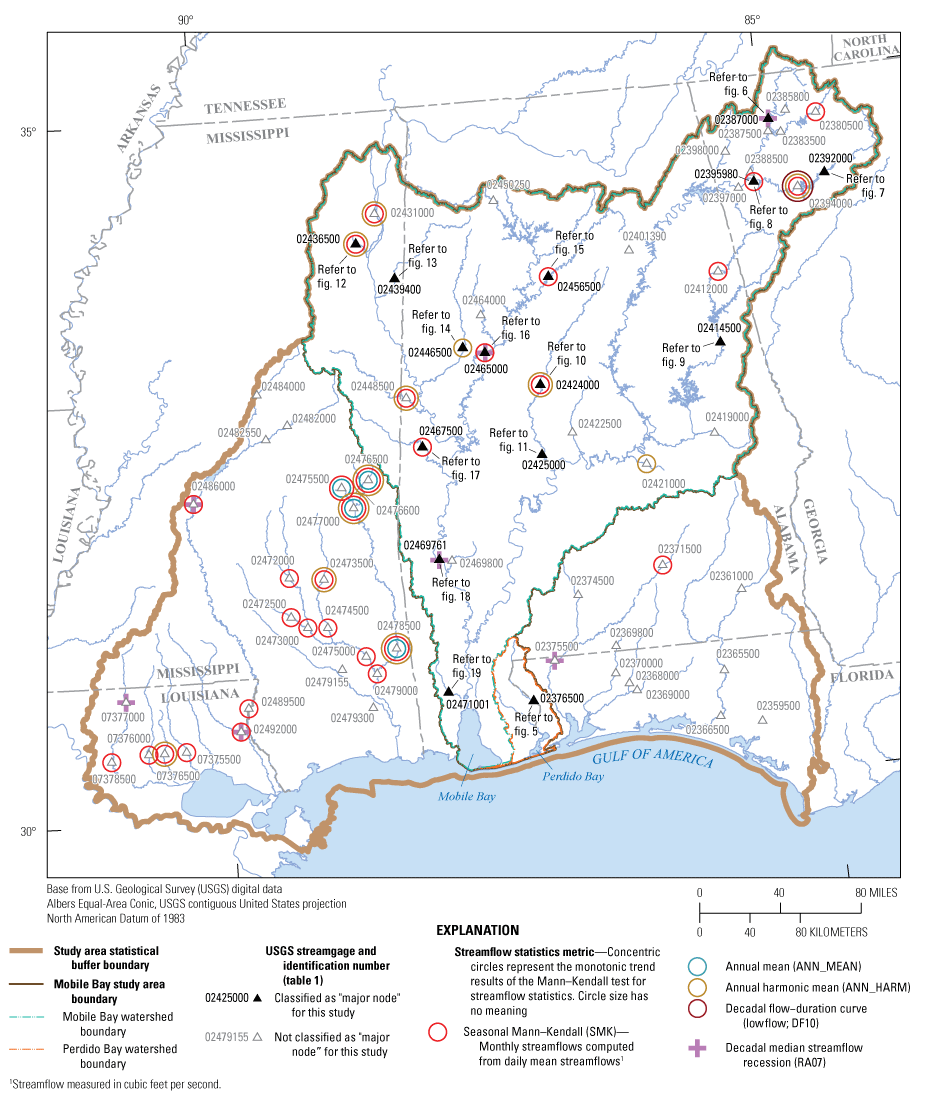
Long-term trend detections at U.S. Geological Survey streamgages included in the study, as determined by Mann–Kendall monotonic trend test and by five streamflow statistics that include annual mean streamflow, annual harmonic mean streamflow, and decadal streamflows for 10th (low-flow), 50th (median), and 90th (high-flow) percentiles.
Figure 3 shows that across the 69 streamgages, the most common statistically significant trend (p-value < 0.05) was for the SMK (30 trends), followed by the annual harmonic mean (12 trends) streamflow. For the remaining streamflow-volume statistics, the annual mean streamflow (total volume) had 4 trends and the 10th-percentile decadal FDC had 1 trend. The RA07 statistic is a measure of streamflow recession and there are seven streamgages with trends. These counts are listed in Gain and others (2025, file monotrnd_3cnt.txt). It is unknown whether the SMK test is particularly more sensitive to changes than the others, and further statistical study and determination are outside the scope of this report.
Although the streamgages reside within a complex drainage network, some observations about the spatial distribution of the trends can be made using figure 3. Within the Mobile Bay and Perdido Bay watershed boundary, USGS site number 02394000 Etowah River at Allatoona Dam above Cartersville, Ga., has the most trends of the statistics considered and is the only location with a change detected in one of the decadal FDC measures, which is the 10th-percentile (low flow). One contributing influence could be attributable to varying control and releases from the dam. U.S. Army Corps of Engineers (2025) provides a history of Allatoona Lake (fig. 1A) impounded by the Allatoona Dam and indicates that the lake was considered fully operational in January 1950, which coincides exactly with the beginning of the period of record for the Etowah River streamgage considered in this study. As a result, all streamflow records for this streamgage are post-impoundment, and trends therefore can be attributed to changes in releases, dam operation, inflows, or other factors, but not because the records for the streamgage span periods before and after the construction of Lake Allatoona itself. Lastly, in the southeastern part of the area mapped (fig. 3), few statistically significant trends were detected in the seven statistics considered, but there seems to be a relative increase in trends toward the southwest and toward areas outside of the Mobile Bay and Perdido Bay watersheds.
A comprehensive summary of the trend assessments for all 26 tests and 69 streamgages throughout the entire study area is shown in figure 4 by depiction of the relation between CDA and the presence, absence, and indicated direction of statistically significant monotonic trends. Results of each of the 26 trend tests are shown on the figure. Some of the bars indicating test results visibly overlap, because the corresponding drainage areas are similar and plot close to each other. One feature of figure 4 is that the range and distribution of drainage areas for the 69 streamgages are shown, which is not fully evident on the figure 3 map; thus, figure 4 helps contextualize the results shown on figure 3. There is a preponderance of positive signs in the test statistics (indicating upward trends), especially for those tests whose results were statistically significant. Further discussion is provided in the “Syntheses of Monotonic Trend Assessments” section.
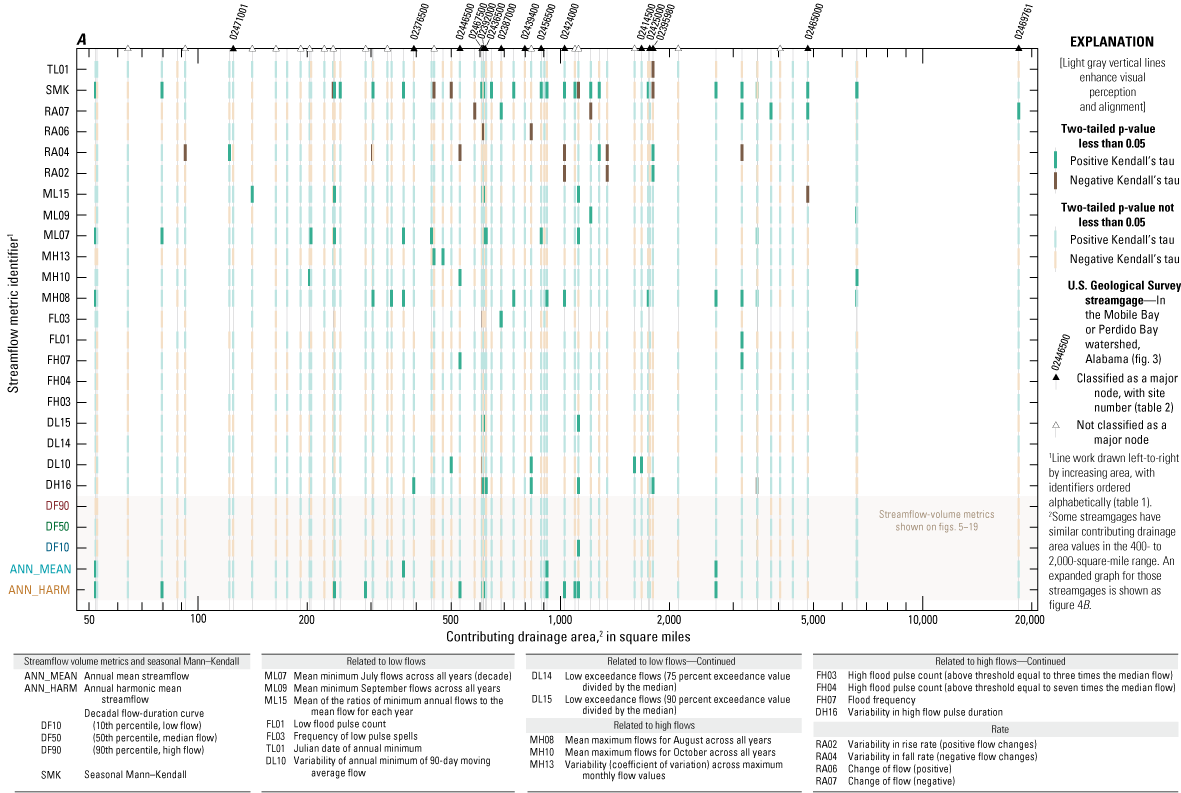
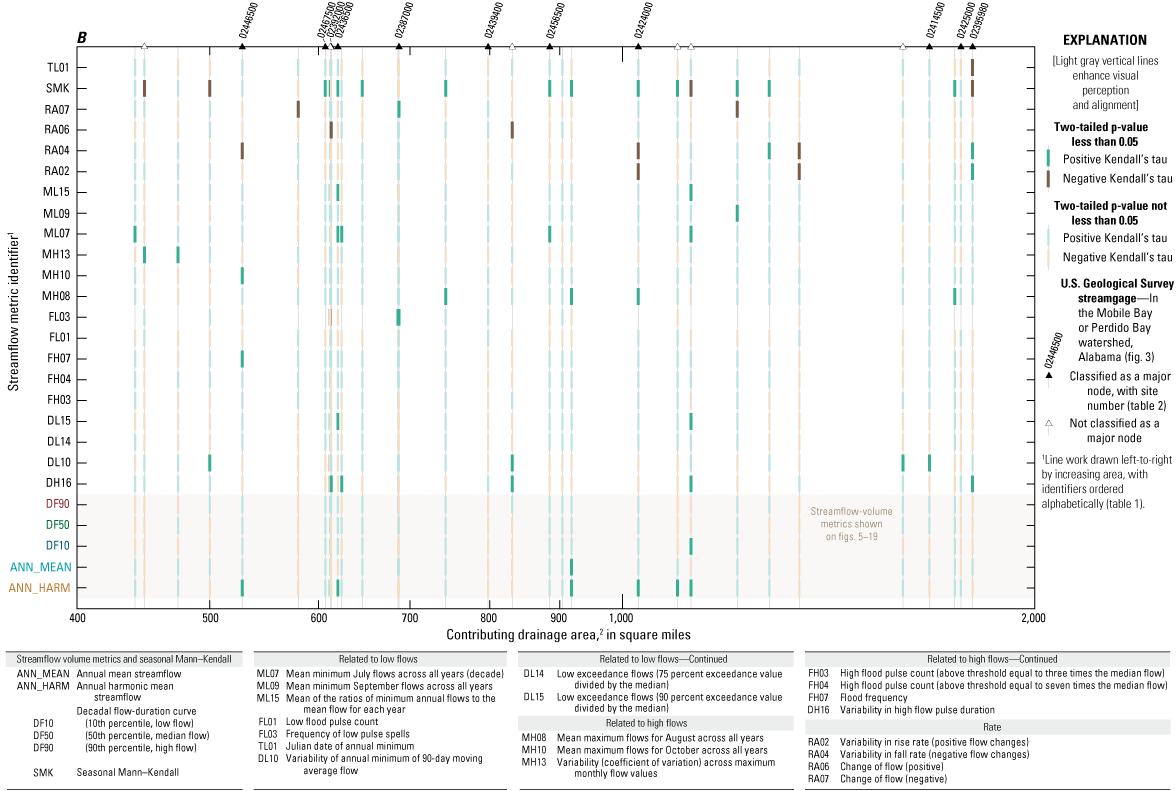
Relation between contributing drainage area of the 69 U.S. Geological Survey (USGS) streamgages to the comprehensive results of the 26 trend assessments showing range and distribution of drainage area, sign of Kendall’s tau (or the statistic for the seasonal Mann–Kendall test), and those tests that indicated statistically significant trends (p-value < 0.05). A, 50–10,000 square miles; B, 400–2,000 square miles. All Kendall’s taus, p-values, and associated metadata are listed in the USGS data release by Gain and others (2025, file monotrnd_1hyp.txt). Contributing drainage areas from USGS (2024).
Time Series of Five Streamflow Statistics and Trends and Quantile-Kendall Plots for Major Node Streamgages
Time series of seven streamflow statistics for the 15 major node streamgages are shown in figures 5A–19A. Quantile-Kendall plots for these same streamgages are shown in figures 5B–19B. Daily mean streamflows are plotted in figures 5A–19A for the sole purpose of enhancing visualization, but the daily means themselves were not subjected to the trend analyses; these streamflows have no further role in this investigation. Interpretations are made for each of the 15 major node streamgages.
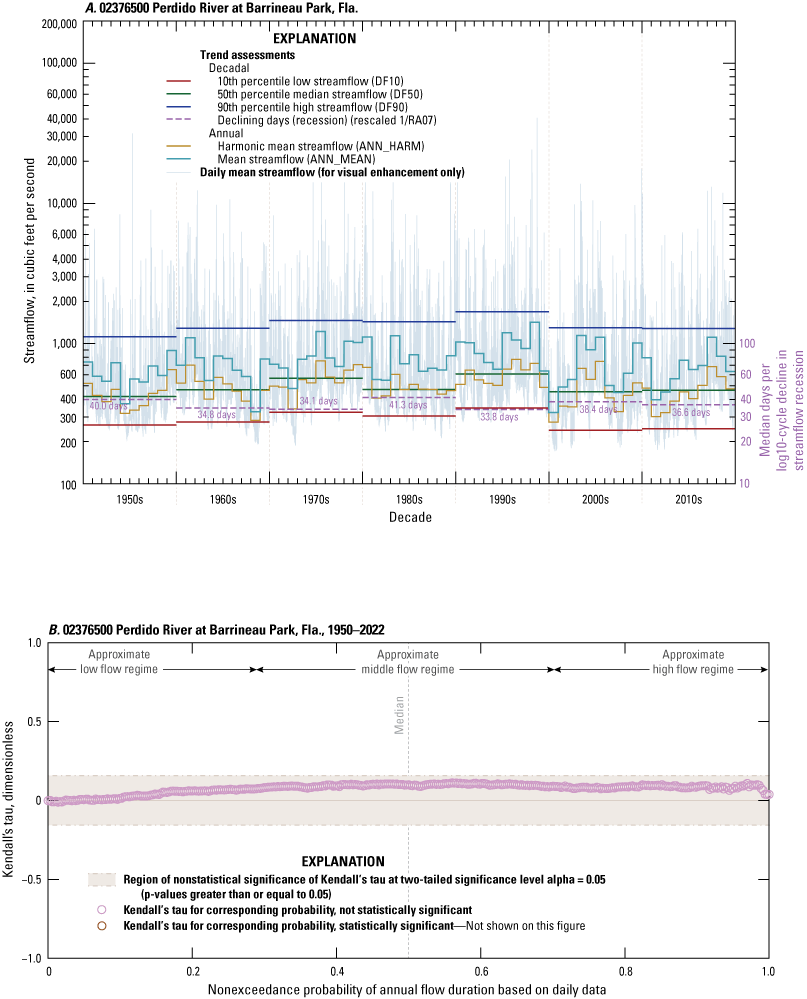
Summary of six trend assessments for “major node” streamgage, U.S. Geological Survey (USGS) site number 02376500 Perdido River at Barrineau Park, Florida, showing (A) time series of daily mean streamflows and computed annual arithmetic and annual harmonic mean streamflows and three decadal flow-duration curve quantiles as well as median days per log10-cycle decline in streamflow recession, and (B) Quantile-Kendall plot for the indicated periods of record showing results of Mann–Kendall test for each of 365 days defining a year based on quantile estimation by Weibull plotting position of available data for each year. Streamflow data source from USGS (2024) and trend information from the USGS data release by Gain and others (2025, file monotrnd_1hyp.txt).
_________________________________________________________________________________________________________________
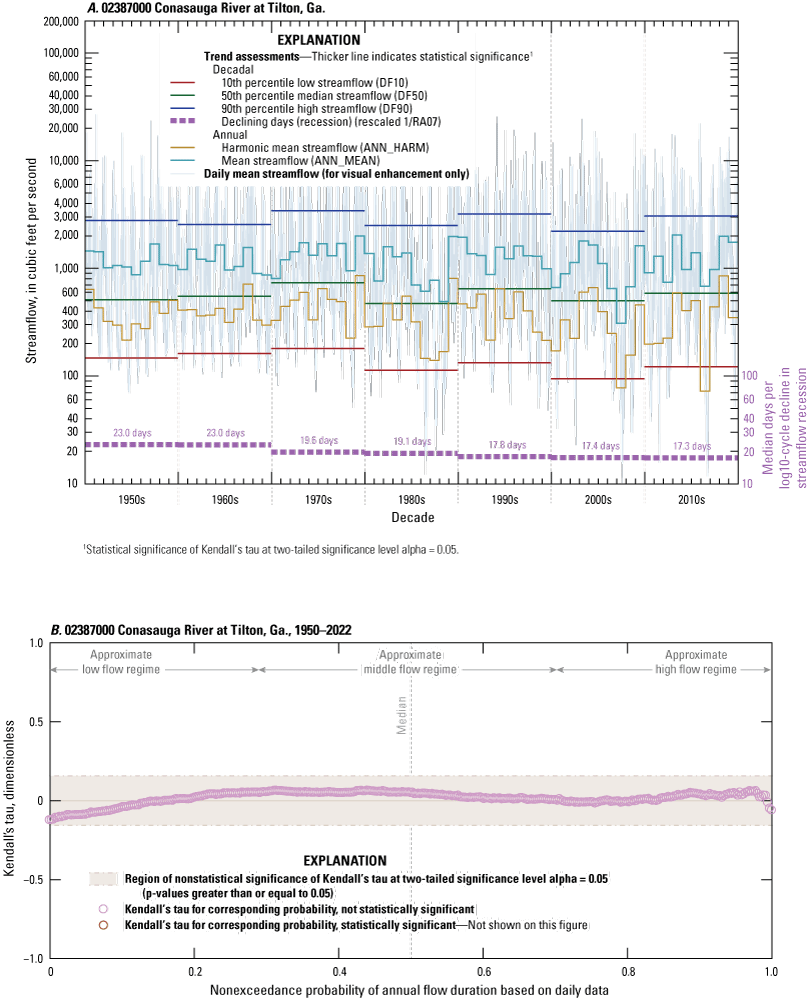
Summary of six trend assessments for “major node” streamgage, U.S. Geological Survey (USGS) site number 02387000 Conasauga River at Tilton, Georgia, showing (A) time series of daily mean streamflows and computed annual arithmetic and annual harmonic mean streamflows and three decadal flow-duration curve quantiles as well as median days per log10-cycle decline in streamflow recession, and (B) Quantile-Kendall plot for the indicated periods of record showing results of Mann–Kendall test for each of 365 days defining a year based on quantile estimation by Weibull plotting position of available data for each year. Streamflow data source from USGS (2024) and trend information from the USGS data release by Gain and others (2025, file monotrnd_1hyp.txt).
_________________________________________________________________________________________________________________
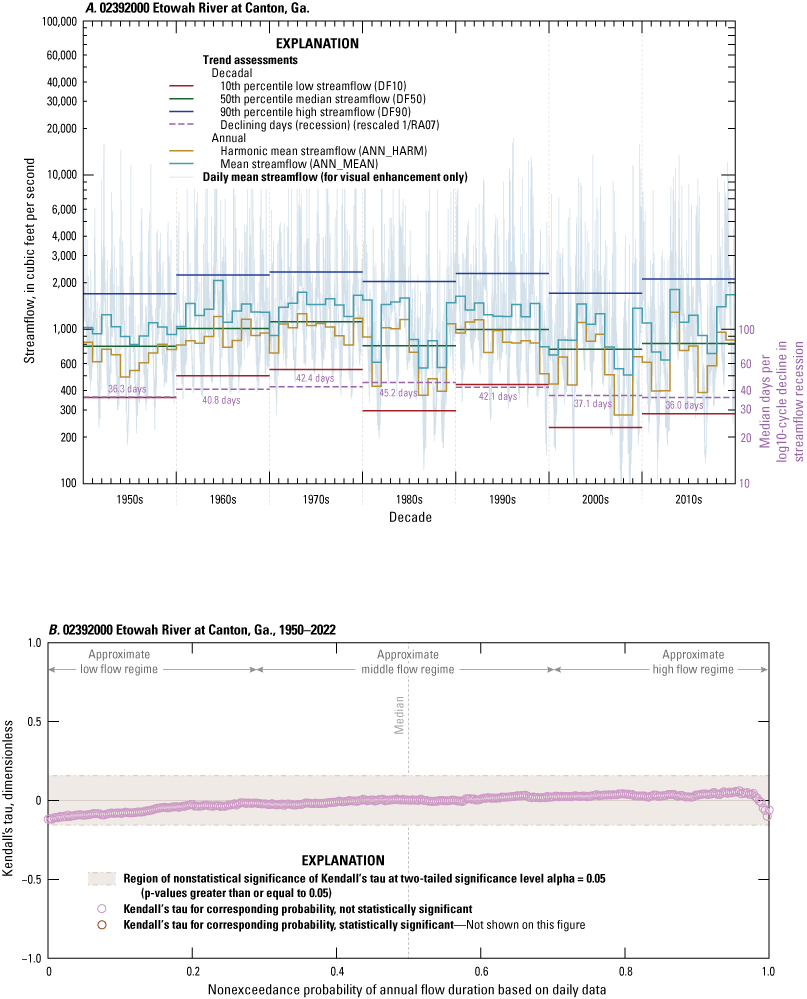
Summary of six trend assessments for “major node” streamgage, U.S. Geological Survey (USGS) site number 02392000 Etowah River at Canton, Georgia, showing (A) time series of daily mean streamflows and computed annual arithmetic and annual harmonic mean streamflows and three decadal flow-duration curve quantiles as well as median days per log10-cycle decline in streamflow recession, and (B) Quantile-Kendall plot for the indicated periods of record showing results of Mann–Kendall test for each of 365 days defining a year based on quantile estimation by Weibull plotting position of available data for each year. Streamflow data source from USGS (2024) and trend information from the USGS data release by Gain and others (2025, file monotrnd_1hyp.txt).
_________________________________________________________________________________________________________________
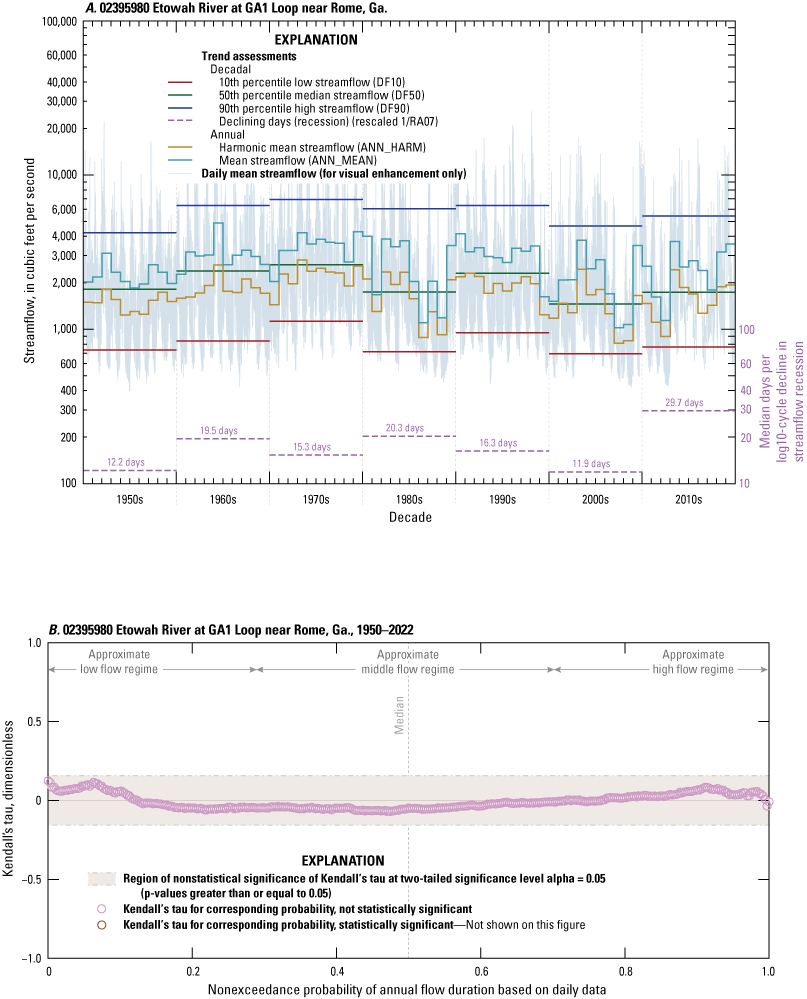
Summary of six trend assessments for “major node” streamgage, U.S. Geological Survey (USGS) site number 02395980 Etowah River at GA1 Loop near Rome, Georgia, showing (A) time series of daily mean streamflows and computed annual arithmetic and annual harmonic mean streamflows and three decadal flow-duration curve quantiles as well as median days per log10-cycle decline in streamflow recession, and (B) Quantile-Kendall plot for the indicated periods of record showing results of Mann–Kendall test for each of 365 days defining a year based on quantile estimation by Weibull plotting position of available data for each year. Streamflow data source from USGS (2024) and trend information from the USGS data release by Gain and others (2025, file monotrnd_1hyp.txt).
_________________________________________________________________________________________________________________
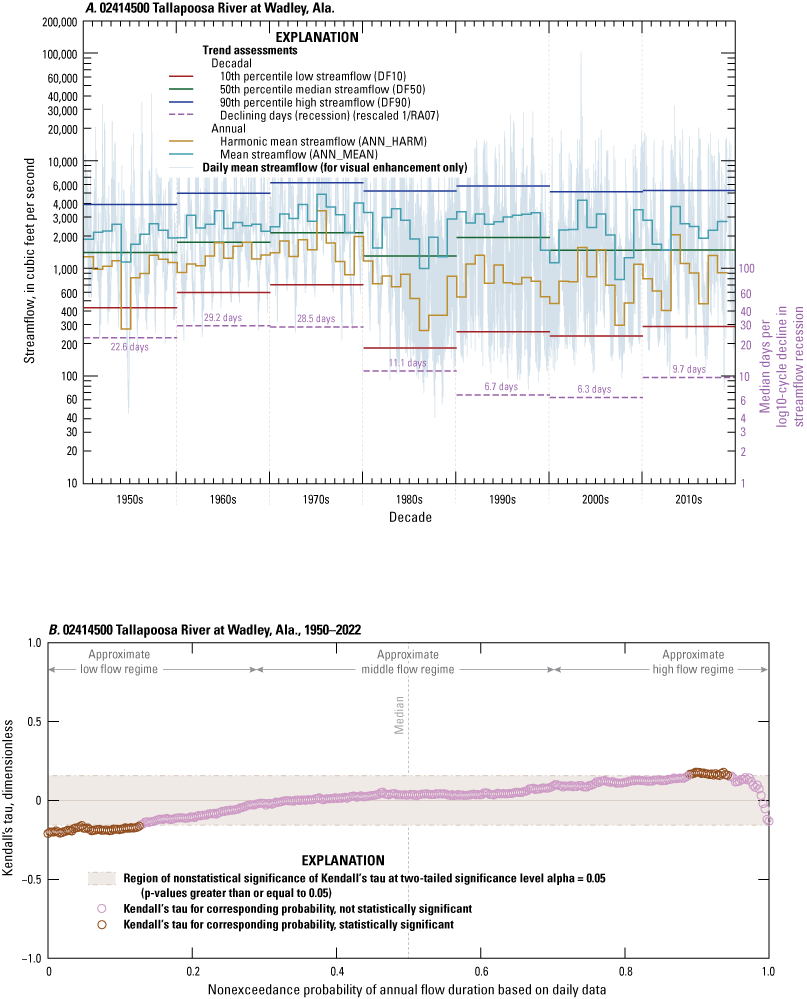
Summary of six trend assessments for “major node” streamgage, U.S. Geological Survey (USGS) site number 02414500 Tallapoosa River at Wadley, Alabama, showing (A) time series of daily mean streamflows and computed annual arithmetic and annual harmonic mean streamflows and three decadal flow-duration curve quantiles as well as median days per log10-cycle decline in streamflow recession, and (B) Quantile-Kendall plot for the indicated periods of record showing results of Mann–Kendall test for each of 365 days defining a year based on quantile estimation by Weibull plotting position of available data for each year. Streamflow data source from USGS (2024) and trend information from the USGS data release by Gain and others (2025, file monotrnd_1hyp.txt).
_________________________________________________________________________________________________________________
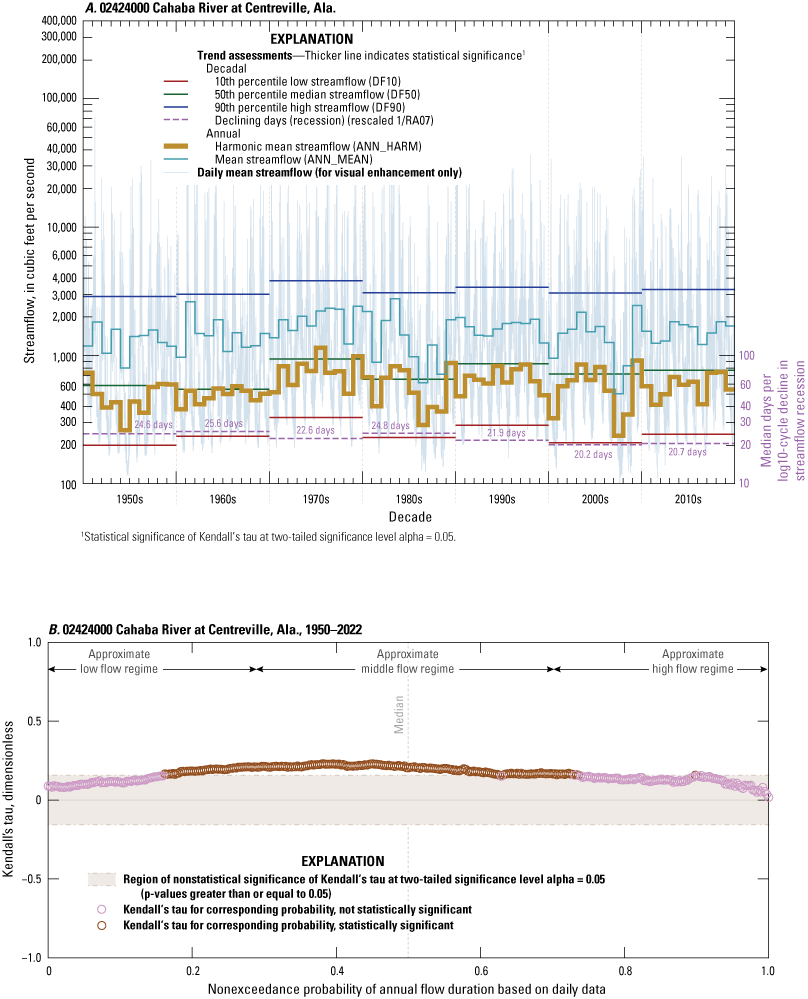
Summary of six trend assessments for “major node” streamgage, U.S. Geological Survey (USGS) site number 02424000 Cahaba River at Centreville, Alabama, showing (A) time series of daily mean streamflows and computed annual arithmetic and annual harmonic mean streamflows and three decadal flow-duration curve quantiles as well as median days per log10-cycle decline in streamflow recession, and (B) Quantile-Kendall plot for the indicated periods of record showing results of Mann–Kendall test for each of 365 days defining a year based on quantile estimation by Weibull plotting position of available data for each year. Streamflow data source from USGS (2024) and trend information from the USGS data release by Gain and others (2025, file monotrnd_1hyp.txt).
_________________________________________________________________________________________________________________
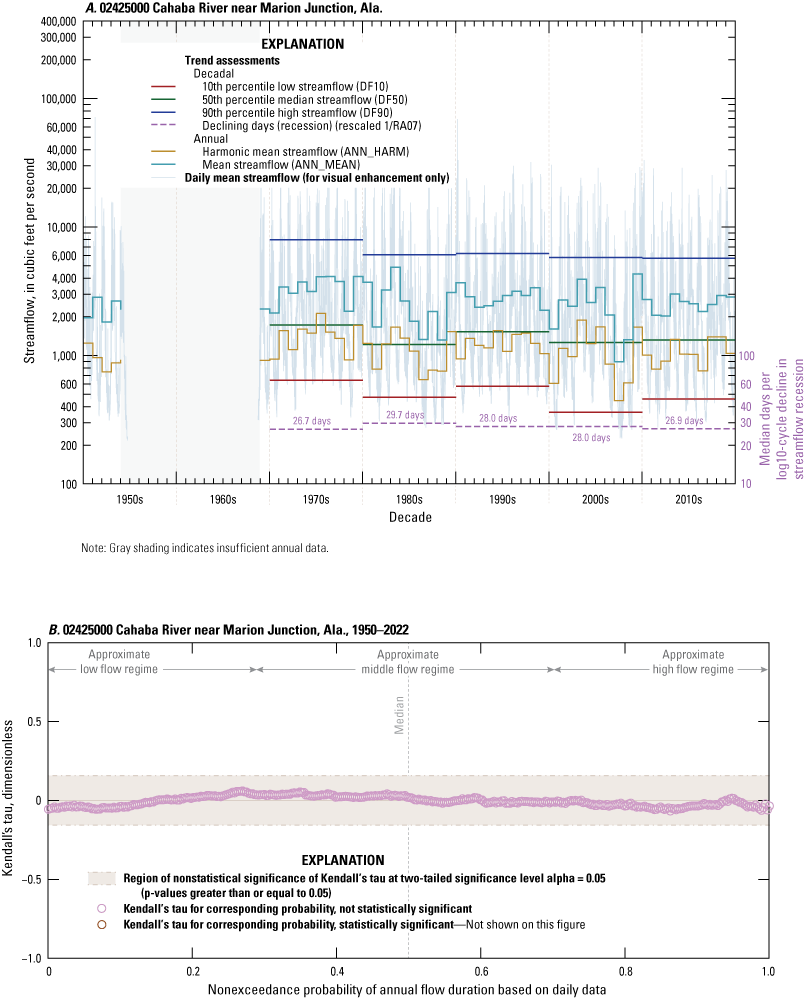
Summary of six trend assessments for “major node” streamgage, U.S. Geological Survey (USGS) site number 02425000 Cahaba River near Marion Junction, Alabama, showing (A) time series of daily mean streamflows and computed annual arithmetic and annual harmonic mean streamflows and three decadal flow-duration curve quantiles as well as median days per log10-cycle decline in streamflow recession, and (B) Quantile-Kendall plot for the indicated periods of record showing results of Mann–Kendall test for each of 365 days defining a year based on quantile estimation by Weibull plotting position of available data for each year. Streamflow data source from USGS (2024) and trend information from the USGS data release by Gain and others (2025, file monotrnd_1hyp.txt).
_________________________________________________________________________________________________________________
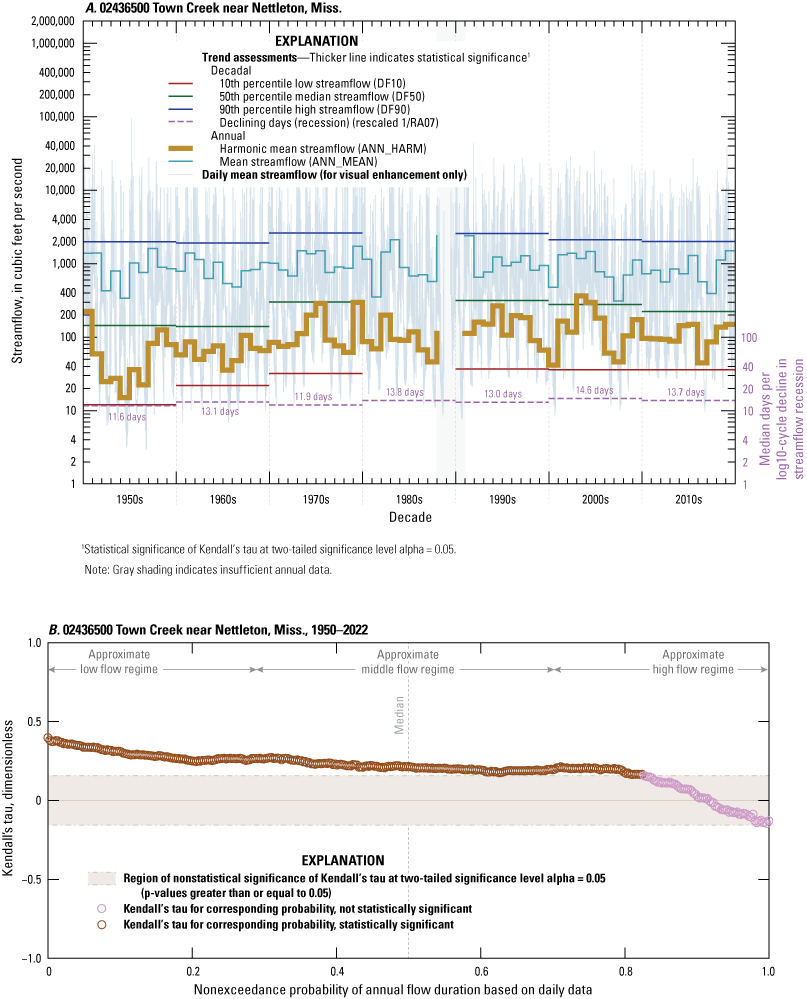
Summary of six trend assessments for “major node” streamgage, U.S. Geological Survey (USGS) site number 02436500 Town Creek near Nettleton, Mississippi, showing (A) time series of daily mean streamflows and computed annual arithmetic and annual harmonic mean streamflows and three decadal flow-duration curve quantiles as well as median days per log10-cycle decline in streamflow recession, and (B) Quantile-Kendall plot for the indicated periods of record showing results of Mann–Kendall test for each of 365 days defining a year based on quantile estimation by Weibull plotting position of available data for each year. Streamflow data source from USGS (2024) and trend information from the USGS data release by Gain and others (2025, file monotrnd_1hyp.txt).
_________________________________________________________________________________________________________________
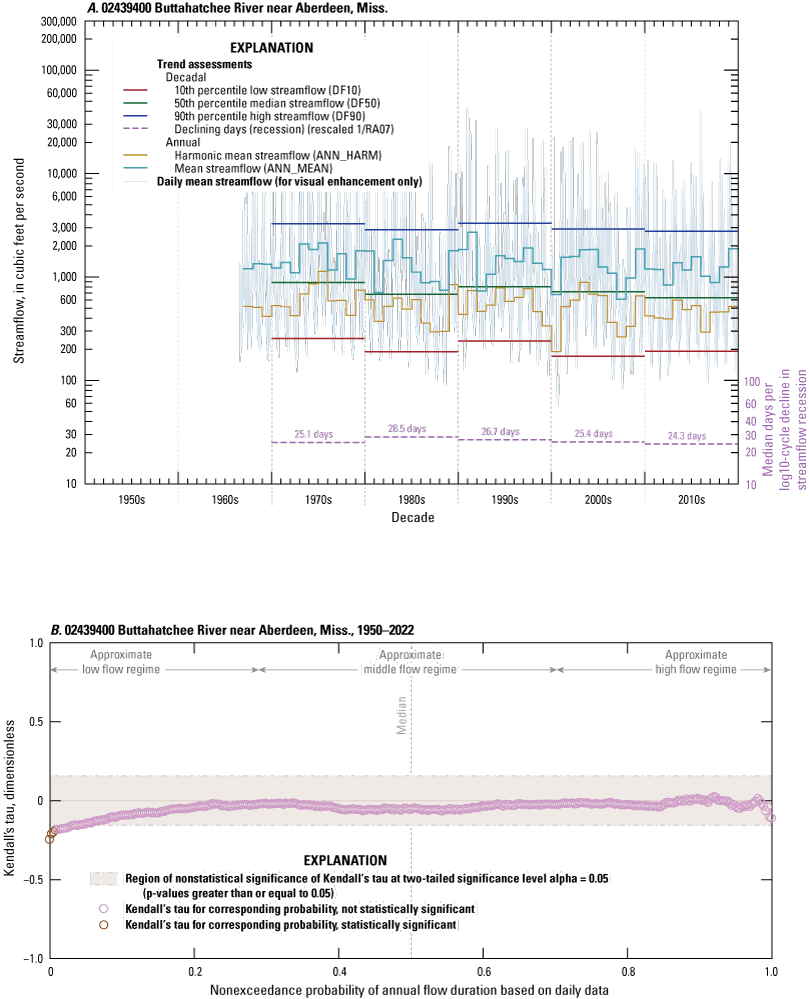
Summary of six trend assessments for “major node” streamgage, U.S. Geological Survey (USGS) site number 02439400 Buttahatchee River near Aberdeen, Mississippi, showing (A) time series of daily mean streamflows and computed annual arithmetic and annual harmonic mean streamflows and three decadal flow-duration curve quantiles as well as median days per log10-cycle decline in streamflow recession, and (B) Quantile-Kendall plot for the indicated periods of record showing results of Mann–Kendall test for each of 365 days defining a year based on quantile estimation by Weibull plotting position of available data for each year. Streamflow data source from USGS (2024) and trend information from the USGS data release by Gain and others (2025, file monotrnd_1hyp.txt).
_________________________________________________________________________________________________________________
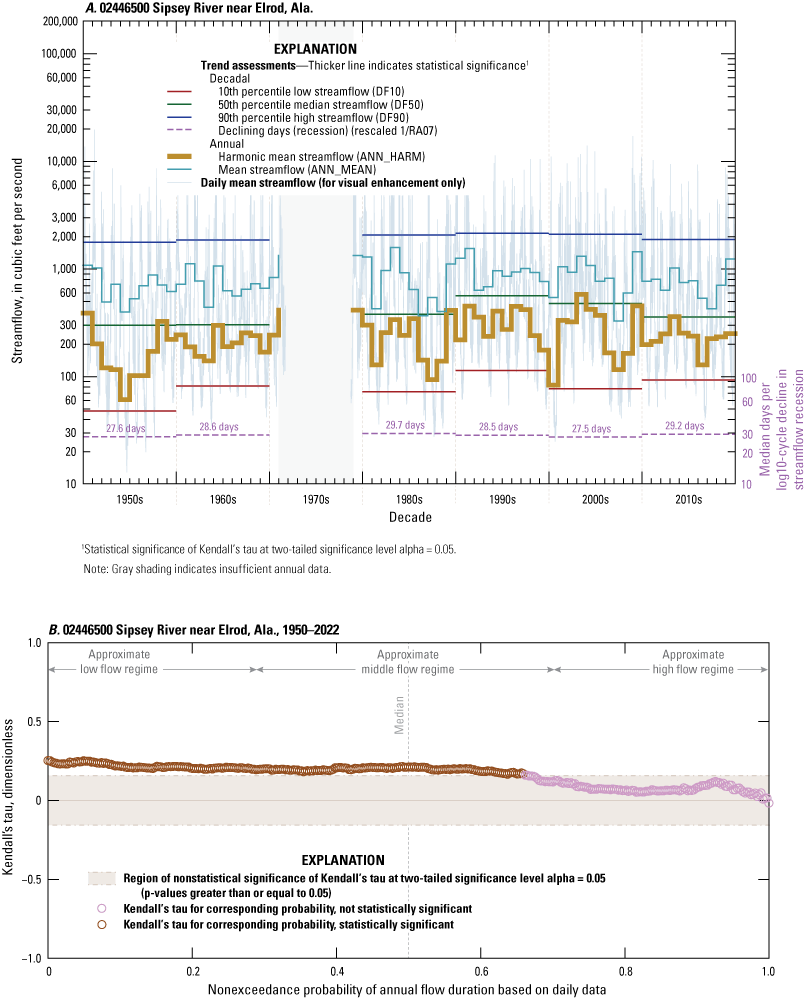
Summary of six trend assessments for major node streamgage, U.S. Geological Survey (USGS) site number 02446500 Sipsey River near Elrod, Alabama, showing (A) time series of daily mean streamflows and computed annual arithmetic and annual harmonic mean streamflows and three decadal flow-duration curve quantiles as well as median days per log10-cycle decline in streamflow recession, and (B) Quantile-Kendall plot for the indicated periods of record showing results of Mann–Kendall test for each of 365 days defining a year based on quantile estimation by Weibull plotting position of available data for each year. Streamflow data source from USGS (2024) and trend information from the USGS data release by Gain and others (2025, file monotrnd_1hyp.txt).
_________________________________________________________________________________________________________________
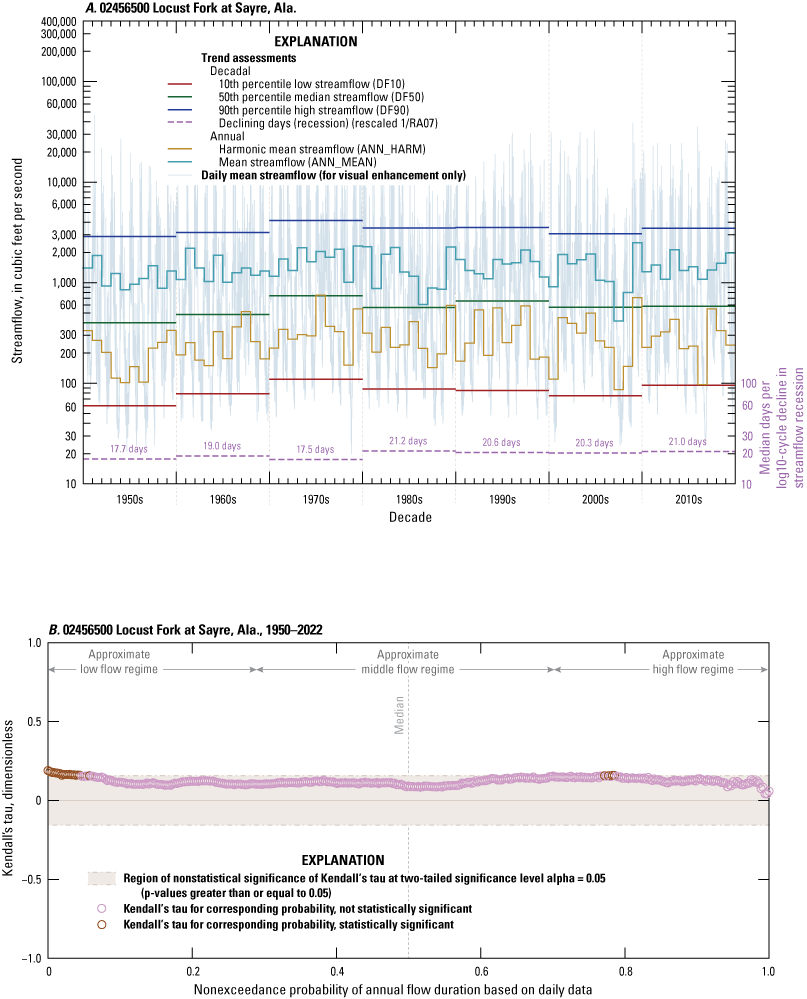
Summary of six trend assessments for “major node” streamgage, U.S. Geological Survey (USGS) site number 02456500 Locust Fork at Sayre, Alabama, showing (A) time series of daily mean streamflows and computed annual arithmetic and annual harmonic mean streamflows and three decadal flow-duration curve quantiles as well as median days per log10-cycle decline in streamflow recession, and (B) Quantile-Kendall plot for the indicated periods of record showing results of Mann–Kendall test for each of 365 days defining a year based on quantile estimation by Weibull plotting position of available data for each year. Streamflow data source from USGS (2024) and trend information from the USGS data release by Gain and others (2025, file monotrnd_1hyp.txt).
_________________________________________________________________________________________________________________
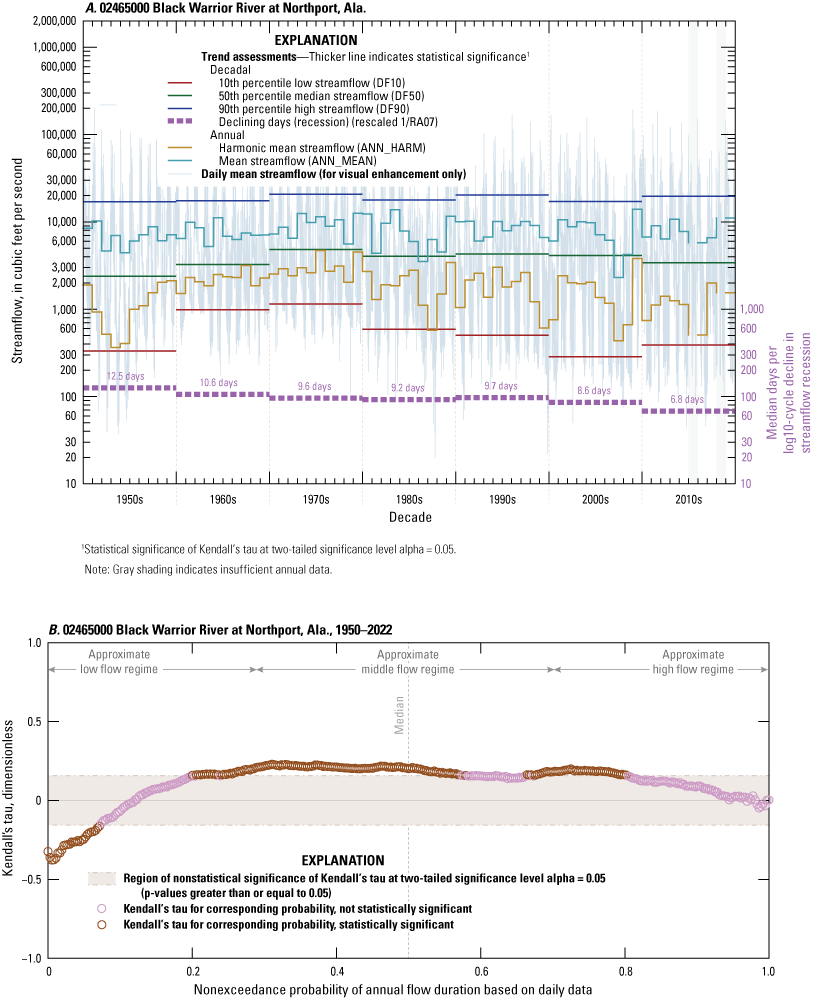
Summary of six trend assessments for “major node” streamgage, U.S. Geological Survey (USGS) site number 02465000 Black Warrior River at Northport, Alabama, showing (A) time series of daily mean streamflows and computed annual arithmetic and annual harmonic mean streamflows and three decadal flow-duration curve quantiles as well as median days per log10-cycle decline in streamflow recession, and (B) Quantile-Kendall plot for the indicated periods of record showing results of Mann–Kendall test for each of 365 days defining a year based on quantile estimation by Weibull plotting position of available data for each year. Streamflow data source from USGS (2024) and trend information from the USGS data release by Gain and others (2025, file monotrnd_1hyp.txt).
_________________________________________________________________________________________________________________
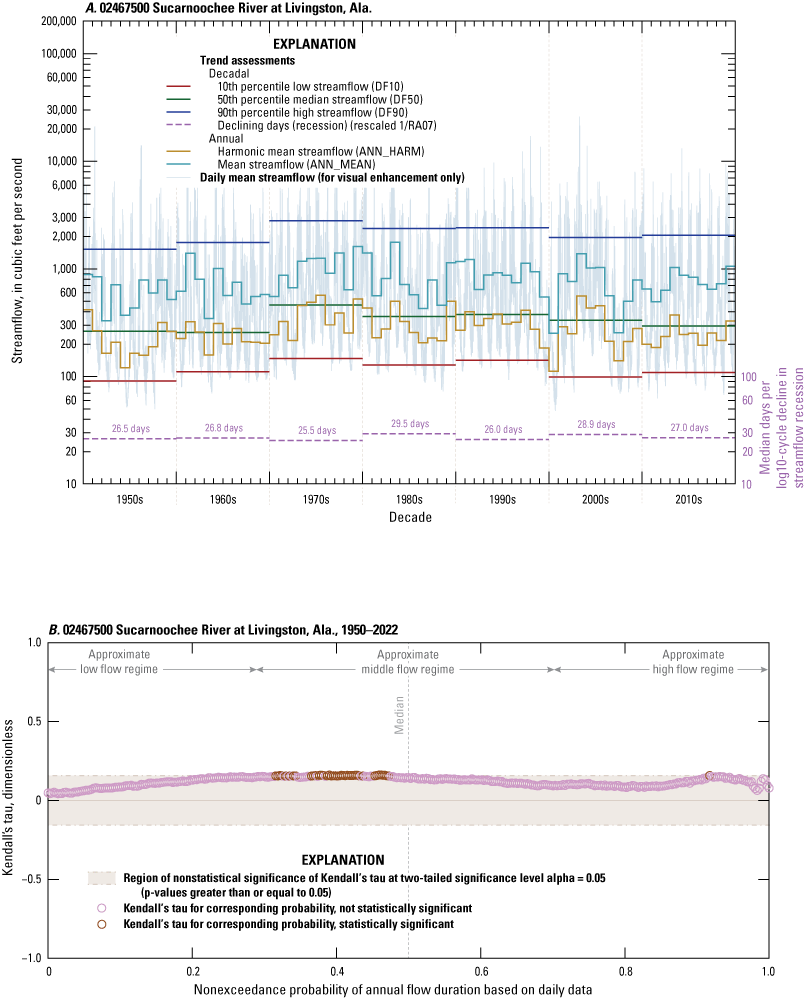
Summary of six trend assessments for “major node” streamgage, U.S. Geological Survey (USGS) site number 02467500 Sucarnoochee River at Livingston, Alabama, showing (A) time series of daily mean streamflows and computed annual arithmetic and annual harmonic mean streamflows and three decadal flow-duration curve quantiles as well as median days per log10-cycle decline in streamflow recession, and (B) Quantile-Kendall plot for the indicated periods of record showing results of Mann–Kendall test for each of 365 days defining a year based on quantile estimation by Weibull plotting position of available data for each year. Streamflow data source from USGS (2024) and trend information from the USGS data release by Gain and others (2025, file monotrnd_1hyp.txt).
_________________________________________________________________________________________________________________
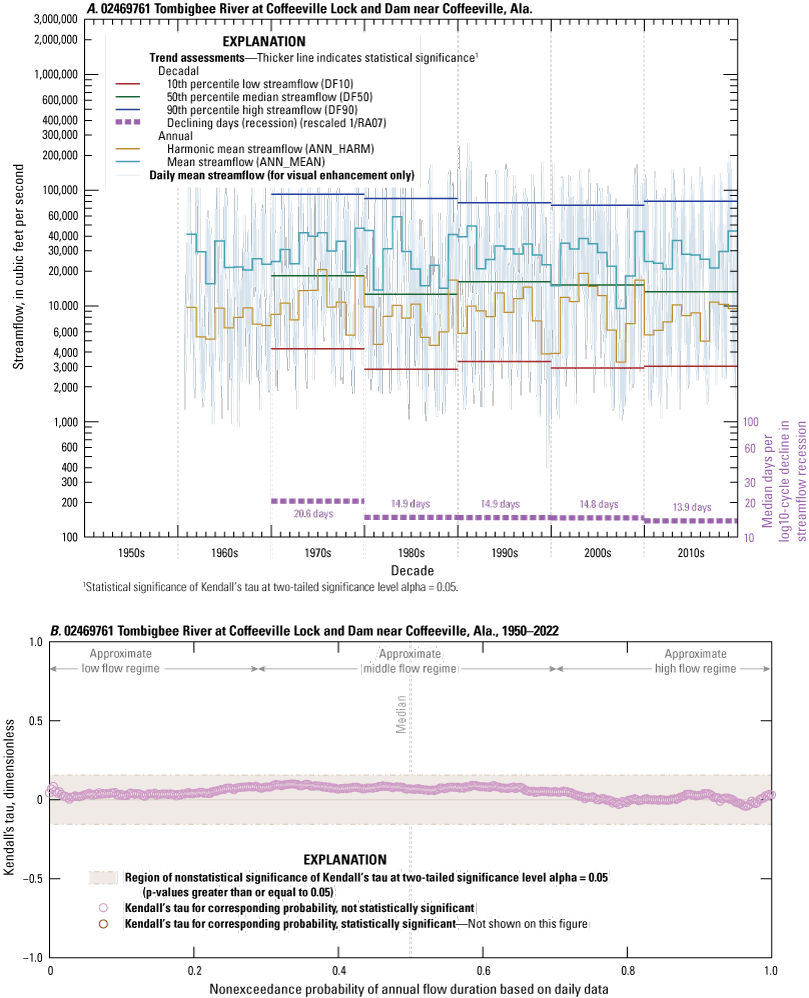
Summary of six trend assessments for “major node” streamgage, U.S. Geological Survey (USGS) site number 02469761 Tombigbee River at Coffeeville Lock and Dam near Coffeeville, Alabama, showing (A) time series of daily mean streamflows and computed annual arithmetic and annual harmonic mean streamflows and three decadal flow-duration curve quantiles as well as median days per log10-cycle decline in streamflow recession, and (B) Quantile-Kendall plot for the indicated periods of record showing results of Mann–Kendall test for each of 365 days defining a year based on quantile estimation by Weibull plotting position of available data for each year. Streamflow data source from USGS (2024) and trend information from the USGS data release by Gain and others (2025, file monotrnd_1hyp.txt).
_________________________________________________________________________________________________________________
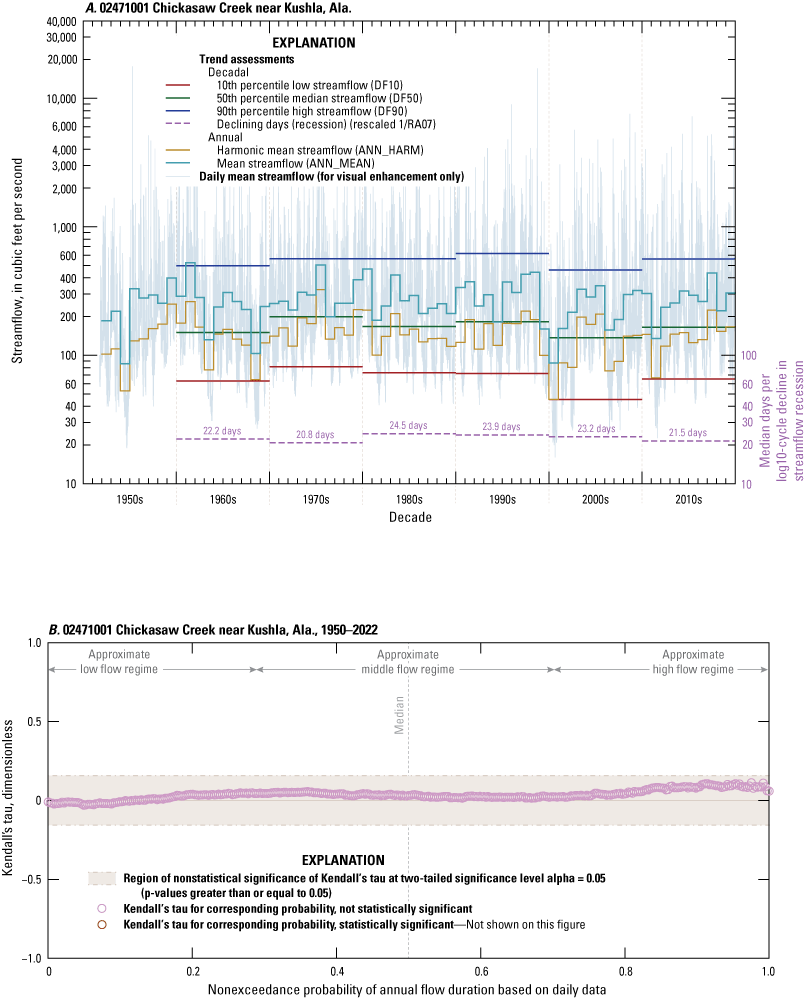
Summary of six trend assessments for “major node” streamgage, U.S. Geological Survey (USGS) site number 02471001 Chickasaw Creek near Kushla, Alabama, showing (A) time series of daily mean streamflows and computed annual arithmetic and annual harmonic mean streamflows and three decadal flow-duration curve quantiles as well as median days per log10-cycle decline in streamflow recession, and (B) Quantile-Kendall plot for the indicated periods of record showing results of Mann–Kendall test for each of 365 days defining a year based on quantile estimation by Weibull plotting position of available data for each year. Streamflow data source from USGS (2024) and trend information from the USGS data release by Gain and others (2025, file monotrnd_1hyp.txt).
The time-series figures depict the daily mean streamflows, annual mean and harmonic mean streamflows, and three selected quantiles of the decadal FDC (figs. 5A–19A). These statistics are associated in various ways with streamflow volume, although only annual mean streamflow is by definition a direct measure of total annual streamflow volume. Both short and extended gaps are present in the daily streamflow records. Consequently, some decades were excluded from these decadal statistics in this study because the available data for those periods were not sufficient to support reliable analysis. Some data gaps documented in this study could be periods before the commencement of streamgage operations. Examples of record gaps for the major nodes exist for streamgages identified by USGS site numbers 02425000 (fig. 11, gap from middle 1950s to late 1960s), 02436500 (fig. 12, brief gap during late 1980s), 02439400 (fig. 13, gap from 1950 to middle 1960s), 02446500 (fig. 14, gap from early to late 1970s), 02469761 (fig. 18, gap from 1950 to early 1960s), and 02471001 (fig. 19, brief gap [about a year] at beginning of 1950s).
Quantile-Kendall plots of the period of record annual FDC for the 15 major node streamgages were constructed using data for all available complete calendar years from January 1, 1950, through at most December 31, 2022. Figures 5B–19B display the results. Like all other tests used for this study, the Mann–Kendall test for statistical significance was set at p-values < 0.05 for each of the 365 days defining a year.
A necessary syntax distinction is provided here for clarity. There are 26 Mann–Kendall monotonic trend tests at the core of this study (Gain and others, 2025). The Quantile-Kendall plots portray the results of another Mann–Kendall test made for each of 365 days of the period of record annual FDC. Lastly, the discussion of figures 5B–19B includes synthesis and cross-references, to varying degrees, with figure 3 along with the streamflow time series shown in figures 5A–19A.
As part of the discussion of figures 5A–19A, we isolated 16 of 26 streamflow statistics for which at least one statistically significant (p-value < 0.05) monotonic trend was detected across the 15 streamgages. In alphanumeric order, these are ANN_HARM, DH16, DL10, DL15, FH07, FL03, MH08, MH10, ML07, ML15, RA02, RA04, RA06, RA07, SMK, and TL01, each having a respective brief description listed in table 1.
A time-series graph depicting the five streamflow-volume statistics for USGS site number 02376500 is shown in figure 5A along with the reciprocal 1/RA07 as a streamflow recession statistic measured in days per log10-cycle decline and not as RA07 in units of log10-cycle per day. The unit system of days per log10-cycle decline is a measure of how many days it takes for streamflow to decline by one order of magnitude (one power of 10). None of the six statistics show statistically significant trends (fig. 5A). Gain and others (2025, file monotrnd_2stn.txt) show that this streamgage only has a trend in the DL16 statistic. The Quantile-Kendall plot (fig. 5B) shows no trends in the entire annual FDC.
Time series depicting the five streamflow-volume statistics for USGS site number 02387000 are shown in figure 6A along with the 1/RA07 streamflow recession statistic. Only streamflow recession shows a decreasing trend, which implies that hydrograph recessions steepen in a statistically significant manner. To clarify, a steeper hydrograph recession means that streamflow declines faster, and therefore there are fewer days per log10-cycle decline. Gain and others (2025, file monotrnd_2stn.txt) show that this streamgage only has statistically significant trends in the FL03 and RA07 statistics. The Quantile-Kendall plot (fig. 6B) shows no trends in the entire annual FDC.
Time series depicting the five streamflow-volume statistics for USGS site number 02392000 are shown in figure 7A along with the 1/RA07 streamflow recession statistic in units of days per log10-cycle decline. None of these six statistics has detected trends, and Gain and others (2025, file monotrnd_2stn.txt) show that this streamgage has statistically significant trends in the DH16 and RA06 statistics. The Quantile-Kendall plot (fig. 7B) shows no trends in the entire annual FDC.
USGS site number 02395980 (fig. 8) has five statistically significant trends (Gain and others, 2025, file monotrnd_2stn.txt, statistics DH16, RA02, RA04, SMK, and TL01), but none of the five trends are for the volumetric and recession statistics shown in figure 8A. The Quantile-Kendall plot (fig. 8B) shows no trends in the entire annual FDC.
USGS site number 02414500 (fig. 9) has just one statistic with a statistically significant trend (Gain and others, 2025, file monotrnd_2stn.txt, statistics DH16, RA02, RA04, SMK, and TL01); therefore, no trends are present in the volumetric and recession statistics shown in figure 9A. The Quantile-Kendall plot (fig. 9B) shows decreasing trends in about the lowest 10 percent of streamflows during the year, and there is evidence of increasing flow in a narrow approximate range near the 90th percentile and therefore high flows within the annual FDC. The fluctuation in daily mean streamflow, indicated by the visual “blueness” of the daily mean streamflow values shown on figure 9A, increases at about 1982–83; this change in daily streamflow fluctuation coincides with information within the USGS station manuscript (USGS, 2023) under the “Remarks” section: “Flow regulated since 1982 by Harris Reservoir (station 02412950).” The Harris Reservoir named in the USGS station manuscript is “R.L. Harris Reservoir” (fig. 1).
USGS site number 02424000 (fig. 10A) shows that ANN_HARM has an increasing trend detected and that the other streamflow statistics shown on the figure do not have detected trends. In total, five trends were detected (statistics ANN_HARM, MH08, RA02, RA04, and SMK within Gain and others, 2025, file monotrnd_2stn.txt). The Quantile-Kendall plot (fig. 10B) shows from about the 15th through 75th percentiles that increasing trends were detected in the annual FDC.
USGS site number 02425000 (fig. 11A) has no detected trends (Gain and others, 2025, file monotrnd_2stn.txt). Gaps in record from the middle 1950s to late 1960s exist, which means these decades were not available for trend assessment. The Quantile-Kendall plot (fig. 11B) also shows no trends in the entire annual FDC.
USGS site number 02436500 (fig. 12A) has an increasing ANN_HARM trend detected, but the other four volume and one recession statistics in the figure do not have detected trends. In total, five trends were detected (statistics ANN_HARM, DL15, ML07, ML15, and SMK within Gain and others, 2025, file monotrnd_2stn.txt). A small gap in record exists in the late 1980s, which means this decade was not available for trend assessment. The Quantile-Kendall plot (fig. 12B) shows throughout about the lower 80 percent of streamflows that increasing trends were detected. Figure 12B, through the distribution of the data points, suggests that the top 20 percent of streamflows might be generally trending toward decreasing magnitudes, though without statistical significance, and streamflow volumes are being partitioned to quantiles in about the lower 80th percentile and could partly explain the increasing streamflows for approximately the lower 80 percent of days.
USGS site number 02439400 (fig. 13A) has no detected trends (Gain and others, 2025, file monotrnd_2stn.txt). Gaps in record for the 1950s and for much of the 1960s mean these decades were not available for trend assessment. The Quantile-Kendall plot (fig. 13B) shows that just a few of the lowest-flow days have decreasing trends and that the remainder of the annual FDC seems stable.
USGS site number 02446500 (fig. 14A) has an increasing ANN_HARM trend detected, but the other four streamflow-volume and recession statistics in the figure do not have detected trends. In total, four trends were detected (statistics ANN_HARM, FH07, MH10, and RA04 within Gain and others, 2025, file monotrnd_2stn.txt). A large gap in record during the 1970s means this decade was not available for trend assessment. The Quantile-Kendall plot (fig. 14B) shows that increasing trends were detected through about the lower 65 percent of streamflows.
USGS site number 02456500 (fig. 15A) has no detected trends in the five streamflow-volume statistics as well as no trend in the recession statistic RA07. Gain and others (2025, file monotrnd_2stn.txt) show that this streamgage has trends in just the ML07 and SMK statistics. The Quantile-Kendall (fig. 15B) plot shows increasing trends below the 5th percentile and (for a few days) at about the 75th percentile, and overall, the figure shows a tendency for increasing streamflows throughout the annual FDC. This tendency might be related to a visually assessed (fig. 15A) increasing trend in the ANN_MEAN between about the early 1950s and about the late 1970s. This remark for the 1950s–1970s is made because this 20-year period might be sufficiently long and occurring at the beginning of the processed streamflow records to cause figure 15B to show an increasing streamflow tendency but not statistically significant for the entire period of record.
Time series depicting the five streamflow-volume statistics for USGS site number 02465000 are shown in figure 16A, along with a statistically significant 1/RA07 streamflow recession statistic, which implies that hydrograph recessions become steeper. In total, three trends were detected (statistics ML15, RA07, and SMK within Gain and others, 2025, file monotrnd_2stn.txt). The Quantile-Kendall plot (fig. 16B) shows decreasing trends for about the 5th and lower percentiles and increasing trends between about the 20th- to 55th-percentile streamflows and between about the 65th- to 80th-percentile streamflows of the annual FDC.
USGS site number 02467500 (fig. 17A) has no detected trends. Only SMK shows a statistically significant trend (Gain and others, 2025, file monotrnd_2stn.txt). The Quantile-Kendall plot (fig. 17B) shows increasing trends from about the 35th to 45th percentiles, and overall, the plot shows a tendency for streamflows to increase throughout the entire annual FDC. This tendency might be related to a visually assessed increasing trend in ANN_MEAN between about the middle 1950s to about the middle 1970s; this might be a sufficiently long period at the beginning of the processed streamflow records to make figure 15B show an increasing streamflow tendency for the entire annual FDC, as previously remarked.
Time series depicting the five streamflow-volume statistics for USGS site number 02469761 are shown in figure 18A along with the 1/RA07 streamflow recession statistic. Only streamflow recession shows a trend (decreasing), which implies that hydrograph recessions become steeper. Gain and others (2025, file monotrnd_2stn.txt) show that this streamgage has just this trend in RA07. The Quantile-Kendall plot (fig. 18B) shows no trends in the entire annual FDC.
USGS site number 02471001 (fig. 19A) has no detected trends (Gain and others, 2025, file monotrnd_2stn.txt). The gap in record for the early 1950s means this decade was not available for trend assessment. The Quantile-Kendall plot (fig. 19B) also shows no trends in the entire annual FDC.
Syntheses of Monotonic Trend Assessments
Syntheses of trend assessments are made in this section. In brief, most (about 93 percent) of trend tests on streamflow and ecological metrics at each of the streamgages do not indicate statistically significant trends. The exception is a few streamgages having greater counts of significant trends. The most common trend was in the SMK test (fig. 3), which suggests that changes in the timing of differing streamflow regimes are the most common in the study area, as evidenced by SMK test results, but also by ML07 (July low flows) and MH08 (August high flows) for instance (fig. 4). The same cannot be said, however, for ML09 (September low flows), TL01 (Julian date of annual minimum), and MH10 (October high flows). A total of 26 tests for monotonic trend with time (years or decades as applicable) were made for each of the 69 streamgages, equaling 1,794 individual tests. Because there are 365 Mann–Kendall tests for each streamgage represented by a Quantile-Kendall plot (figs. 5B–19B), these are not counted in the 1,794 total. The test results indicate there are 127 statistically significant trends (Gain and others, 2025, file monotrnd_3cnt.txt [summation of column named “value” for rows containing string “_pvl”]). The p-value < 0.05 implies—if assumptions of the Mann–Kendall test are otherwise satisfied and all tests were independent—that about 0.05 × 1,794 = 90 false positives (type I statistical error) would result (Helsel and others, 2020).
The trend results in figure 5 highlight that about 93 percent of the test results do not indicate a statistically significant trend, as previously stated. To reiterate a previous observation about figure 4, there is a preponderance of positive signs in the test statistics (indicating upward trends), especially for those tests whose results were statistically significant, because about 60 percent of the test results yielded a positive Kendall’s tau or the SMK test statistic. Importantly, these tests are not all independent of each other, and complex overlap between the tests complicates overall interpretation of their results for the Mobile Bay and Perdido Bay watersheds and the gulf coast (fig. 1A). For example, the harmonic mean (ANN_HARM) and the 10th percentile of the decadal FDC (DF10) are both inherently sensitive to low-flow conditions, making them particularly responsive to protracted periods of limited rainfall. As a result, overall and (or) relative counts of significant trends have limited interpretability. Gain and others (2025, file monotrnd_3cnt.txt) report no trends (0 percents) for DF50, DF90, DL14, FH03, and FH04, and these constitute the bottom five in total counts of significant trends for the 69 streamgages. Further, Gain and others (2025) also report that the top five in total counts of significant trends are RA04 (9/69 = 13.0 percent), ML07 (11/69 = 15.9 percent), ANN_HARM (12/69 = 17.4 percent), MH08 (12/69 = 17.4 percent), and SMK (30/69 = 43.5 percent).
Scrutiny of the monotonic trends map (fig. 3) provides some general insights about the spatial distribution of trends in the study area. The southeastern one-third of the study area has fewer trends than the other parts. This is especially true for the SMK test results shown in figure 3. The remainder of the study area shows that ANN_HARM trends have some general association with SMK trend occurrence, USGS site number 022446500 (near the center of the map) being an exception. Other spatial patterns on figure 3 were difficult to discern. Specific attributions for trends are beyond the scope of this report.
Lastly, the results provided in this report indicate that for a broad range of streamflow statistics, overall trends in the hydrologic regime are generally absent for streamgages in the study area having long record lengths of at least 50 years. The more extreme streamflow conditions—both low and high flows—are more likely to have statistically significant trends, though such trends seem relatively uncommon. Example Quantile-Kendall plots for the major nodes (figs. 5B–19B) show that considerable relative variation in flows exists among streamgages and that nuances in streamflow changes since the 1950s exist on a streamgage-by-streamgage basis.
Summary
The U.S. Geological Survey (USGS), in cooperation with the Gulf Coast Ecosystem Restoration Council, assessed monotonic trends for a variety of streamflow statistics for 69 selected, long-term USGS streamgages within and adjacent to Mobile Bay and Perdido Bay watersheds that were active at least to the end of calendar year 2019. Long-term data were defined for this study as having at least 50 years of cumulative record from January 1, 1950, to December 31, 2022, with a requirement for a complete record of streamflow during the 2010s (2010–19). Some 62 streamgages had record extending through the 2022 calendar year, but because 2019 concludes the 2010s decade, it was used as an auxiliary criterion for this study. To help avoid potential confusion regarding stated 2019 and 2022 endpoints, and for some described annual analyses, data from 2020–22 were used when these data were available for a given streamgage. The 69 streamgages have at least 54 years and as many as 73 years of daily mean streamflow data; the median period of record is 72 years.
The study area is inclusive of the Mobile Bay and Perdido Bay watersheds, sourcing parts of Alabama, Florida, Georgia, and Mississippi. These watersheds are considered herein as a focus area, with the addition of (1) some lesser coastal hydrologic units extending as far east as Saint Andrew and Saint Joseph Bays but not to the Apalachicola River and Apalachicola Bay and (2) the hydrologic areas west through the Pascagoula and Pearl Rivers, and other western drainages into Lake Pontchartrain. The study area is coincident and within the so-termed “buffer for statistical analysis.” Use of streamflow data that spatially extend beyond the core focus area facilitates comprehensive review of streamflow statistics and trends and provides opportunities to compare findings within the Mobile Bay and Perdido Bay watersheds to the greater region.
Streamflow statistics and other metrics having biological, ecological, and hydrologic importance are bundled into the term “statistic.” As a result, many definitions of streamflow-statistic characteristics exist. Choices of data features or statistics for trend assessment depend partly on what hydrologic topics are under study.
Annual mean streamflow data, which represent many individual years of mean streamflow can be used to compute mean annual streamflow, and such data represent the expected annual volume of water measured by streamgages. Other streamflow statistics, such as (1) the 90th-percentile daily high flow from a flow-duration curve (FDC) and (2) the annual harmonic mean that emphasizes low flows, can be used for a variety of disciplines and are especially informative to ecological science and environmental resource managers. FDCs at decadal time scales provide the DF10 (low flow), DF50 (median, middle-range flow), and DF90 (high flow) for the 10th, 50th, and 90th percentiles, respectively. These three percentiles are streamflow metrics subject to trend assessment and time-series depiction for several of the streamgages. Annual FDCs, conversely, were used to construct Quantile-Kendall plots for the 15 major node streamgages.
“Major node” streamgages were chosen to represent long-term data-collection sites using a set of criteria unique to this study: (1) at least 5 decades of data record after January 1, 1950; (2) a complete dataset for the 2010s decade; and (3) data collection within the Mobile Bay and Perdido Bay watersheds. The decision to include complete 2010–19 record was made to ensure the most recent conditions and streamgages in current operation would be represented. Additional and minor considerations were made for contributing drainage area and streamgages used in other studies. Additional factors included streamgages representing Level III and IV Ecoregions, location within Strategic Habitat Units, and close downstream proximity to major reservoirs. Regardless of the major node designation for this study, trend analyses were completed for all sites meeting the aforementioned requirements of at least 50 years of data and complete record for the 2010s decade.
Trend assessments made for this study are primarily based on the application of hypothesis tests, with a given test applied to a particular sample streamflow statistic. Specifically, the Mann–Kendall test was used for this study, and the test uses the relation between time and a ranked streamflow statistic for computations, rather than the magnitude of a streamflow statistic. Kendall’s tau is a correlation coefficient (measure of association) of the Mann–Kendall family of tests. A statistically significant positive Kendall’s tau indicates an upward streamflow trend; conversely, a statistically significant negative tau indicates a downward streamflow trend. The probability value (p-value) of Kendall’s tau is a measure of the statistical significance of the trend, assuming a null hypothesis that no trend is present. For this investigation, a p-value less than 0.05 indicated the presence of a statistically significant trend (alpha = 0.05); conversely, a p-value greater than or equal to 0.05 indicated the absence of a statistically significant trend.
Quantile-Kendall plots are a scheme describing overall trend direction and significance for the entire flow regime. For this study, a specific Quantile-Kendall plot variation was used for plots of Kendall’s tau and streamflow nonexceedance probabilities for each of the 365 days of a year. This approach creates a fixed and common coordinate system between plotting extents in the horizontal and vertical dimensions ranging from 0 to 1. In effect, for the period of record analyzed for a streamgage, trends throughout the annually based FDC are visualized.
Quantile-Kendall plots for this study also depict the threshold lines of Kendall’s tau for the available sample size for a given statistical significance, and data points are shaded to contrast between statistically significant and nonsignificant values of Kendall’s tau. Quantile-Kendall plots permit simultaneous view into the low-flow regime, middle or base-flow regime, and the high- or flood-volume regime, but because the association in time is measured by Kendall’s tau, the plots are invariant to absolute magnitude of streamflow.
All of the Kendall’s tau, p-values, and associated metadata are listed in the associated USGS data release. Monotonic trend results from the Mann–Kendall test for streamflow statistics for the 69 streamgages are discussed. The six volumetric-related streamflow statistics are the primary focus (annual mean streamflows; annual harmonic mean; 10th, 50th, and 90th percentiles of decadal FDCs; seasonal Mann–Kendall), followed by a seventh statistic, RA07, the median declining days streamflow recession metric. A map of these trends shows that across the 69 streamgages the most common statistically significant trend (p-value < 0.05) was for the seasonal Mann–Kendall (30 trends), followed by the annual harmonic mean (12 trends) streamflow. For the remaining streamflow-volume statistics, the annual mean streamflow (total volume) had 4 trends and the 10th-percentile decadal FDC (DF10) had 1, and there are seven streamgages with detected RA07 trends.
Although the streamgages reside within a complex drainage network, some observations about the spatial distribution of the trends can be made. Within the Mobile Bay and Perdido Bay watershed boundary, USGS site number 02394000 Etowah River at Allatoona Dam above Cartersville, Ga., has the most trends of the statistics considered and is the only location with a change detected in one of the decadal FDC measures, which is the 10th-percentile (low flow). In the southeastern part of the area mapped, few statistically significant trends were detected in the seven statistics considered, but there seems to be a relative increase in trends toward the southwest and toward areas outside of the Mobile Bay and Perdido Bay watersheds.
A comprehensive summary of the trend assessments for all 26 tests and 69 streamgages throughout the entire study area is shown by depiction of the relation between contributing drainage area and the presence, absence, and indicated direction of statistically significant monotonic trends. Time series of seven streamflow statistics for the 15 major node streamgages are shown along with Quantile-Kendall plots. Interpretations are made for each of the 15 major node streamgages.
Syntheses of trend assessments were made, and most (about 93 percent) of trend tests on streamflow and ecological metrics at each of the streamgages do not indicate statistically significant trends. The exception is a few streamgages having greater counts of significant trends. There is a preponderance of positive signs in the test statistics (indicating upward trends), especially for those tests whose results were statistically significant, because about 60 percent of the test results yielded a positive Kendall’s tau or the seasonal Mann–Kendall test statistic. Importantly, these tests are not all independent of each other, and complex overlap between the tests complicates overall interpretation of their results for the Mobile Bay and Perdido Bay watersheds and the gulf coast.
The results provided in this report indicate that for a broad range of streamflow statistics, overall trends in the hydrologic regime are generally absent for streamgages in the study area having long record lengths of at least 50 years. The more extreme streamflow conditions—both low and high flows—are more likely to have statistically significant trends, though such trends seem relatively uncommon. Example Quantile-Kendall plots for the major nodes show that considerable relative variation in flows exists among streamgages and that nuances in streamflow changes since the 1950s exist on a streamgage-by-streamgage basis.
References Cited
Alabama Department of Environmental Management, 2024, Permitting info: Alabama Department of Environmental Management web page, accessed December 30, 2025, at https://adem.alabama.gov/permit-information. [Top-level information on environmental permitting in Alabama.]
Alabama Rivers and Streams Network, 2024, Strategic habitat and river reach units for aquatic species of conservation concern in Alabama and adjoining States: Alabama Rivers and Streams Network web page, accessed October 5, 2024, at https://www.alh2o.org/shus/.
Anderson, B.T., 2020, Magnitude and frequency of floods in Alabama, 2015: U.S. Geological Survey Scientific Investigations Report 2020–5032, 148 p., accessed May 15, 2024, at https://doi.org/10.3133/sir20205032.
Asquith, W.H., and Barbie, D.L., 2014, Trend analysis and selected summary statistics of annual mean streamflow for 38 selected long-term streamflow-gaging stations in Texas, water years 1916–2012: U.S. Geological Survey Scientific Investigations Report 2013–5230, 16 p., accessed May 15, 2024, at https://doi.org/10.3133/sir20135230.
Asquith, W.H., and Heitmuller, F.T., 2008, Summary of annual mean and annual harmonic mean statistics of daily mean streamflow for 620 U.S. Geological Survey streamflow-gaging stations in Texas through water year 2007: U.S. Geological Survey Data Series 372, 1,259 p., accessed May 15, 2024, at https://doi.org/10.3133/ds372.
Asquith, W.H., Kiang, J.E., and Cohn, T.A., 2017, Application of at-site peak-streamflow frequency analyses for very low annual exceedance probabilities: U.S. Geological Survey Scientific Investigation Report 2017–5038, 93 p., accessed May 15, 2024, at https://doi.org/10.3133/sir20175038.
Asquith, W.H., Sanks, K.M., Banks, S.M., Rodgers, K.D., Roland, V.L., II, and Crowley-Ornelas, E.R., 2023, RESTORE/covESTUSAL—Source code for construction of covariates bound to daily salinity and specific conductance data for purposes of statistical modeling in coastal regions of the Gulf of Mexico, United States: U.S. Geological Survey software release, accessed May 15, 2024, at https://doi.org/10.5066/P9SYRY79. [Software home page located at https://code.usgs.gov/water/restore/covESTUSAL.]
Crowley-Ornelas, E.R., Asquith, W.H., and Worland, S.C., 2023, Generalized additive model estimation of no-flow fractions and L-moments to support flow-duration curve quantile estimation using selected probability distributions for bay and estuary restoration in the Gulf States: U.S. Geological Survey Scientific Investigations Report 2022–5051, 35 p., accessed December 30, 2025, at https://doi.org/10.3133/sir20225051.
Dieter, C.A., Maupin, M.A., Caldwell, R.R., Harris, M.A., Ivahnenko, T.I., Lovelace, J.K., Barber, N.L., and Linsey, K.S., 2018, Estimated use of water in the United States in 2015: U.S. Geological Survey Circular 1441, 65 p., accessed December 30, 2025, at https://doi.org/10.3133/cir1441.
Feaster, T.D., and Lee, K.G., 2017, Low-flow frequency and flow-duration characteristics of selected streams in Alabama through March 2014: U.S. Geological Survey Scientific Investigations Report 2017–5083, 371 p., accessed December 30, 2025, at https://doi.org/10.3133/sir20175083.
Fenneman, N.M., 1946, Physical divisions of the United States: U.S. Geological Survey, unnumbered, 1 pl., scale 1:7,000,000, accessed May 15, 2024, at https://doi.org/10.3133/70207506. [Also available at https://pubs.usgs.gov/unnumbered/70207506/plate-1.pdf.]
Fenneman, N.M., and Johnson, D.W., 1946, Physiographic divisions of the conterminous U.S.: U.S. Geological Survey data release, accessed May 15, 2024, at https://doi.org/10.5066/P9B1S3K8.
Gain, E.G., Asquith, W.H., Crowley-Ornelas, E.R., and Whaling, A.R., 2025, Monotonic trend computations for streamflow statistics within and near the Mobile Bay and Perdido Bay watersheds, United States, 1950–2022: U.S. Geological Survey data release, https://doi.org/10.5066/P14NLI2K.
Handley, L., Altsman, D., and DeMay, R., eds., 2007, Seagrass status and trends in the northern Gulf of Mexico, 1940–2002: U.S. Geological Survey Scientific Investigations Report 2006–5287, 267 p., accessed May 15, 2024, at https://doi.org/10.3133/sir20065287.
Helsel, D.R., Hirsch, R.M., Ryberg, K.R., Archfield, S.A., and Gilroy, E.J., 2020, Statistical methods in water resources: U.S. Geological Survey Techniques and Methods, book 4, chap. A3, 458 p., accessed May 15, 2024, at https://doi.org/10.3133/tm4a3. [Supersedes USGS Techniques of Water-Resources Investigations, book 4, chap. A3, version 1.1.]
Henriksen, J.A., Heasley, J., Kennen, J.G., and Nieswand, S., 2006, Users’ manual for the hydroecological integrity assessment process software (including the New Jersey Assessment Tools): U.S. Geological Survey Open-File Report 2006–1093, 71 p., accessed May 15, 2024, at https://doi.org/10.3133/ofr20061093.
Hirsch, R.M., and DeCicco, L.A., 2015, User guide to Exploration and Graphics for RivEr Trends (EGRET) and dataRetrieval—R packages for hydrologic data (ver. 2.0, February 2015): U.S. Geological Survey Techniques and Methods, book 4, chap. A10, 93 p., accessed May 15, 2024, at https://doi.org/10.3133/tm4A10.
Jeffcoat, H.H., Atkins, J.B., Adams, D.B., and Williams, S.F., 1991, Alabama surface-water supply and use, in Paulson, R.W., Chase, E.B., Roberts, R.S., and Moody D.W., compilers, National water summary 1988–89—Hydrologic events and floods and droughts: U.S. Geological Survey Water-Supply Paper 2375, 591 p., accessed May 15, 2024, at https://doi.org/10.3133/wsp2375.
Jeffcoat, H.H., and Mooty, W.S., 1986, Alabama surface-water resources, in National water summary 1985—Hydrologic events and surface-water resources: U.S. Geological Survey Water-Supply Paper 2300, p. 131–136, accessed May 15, 2024, at https://doi.org/10.3133/wsp2300.
Lins, H.F., 2012, USGS Hydro-Climatic Data Network 2009 (HCDN–2009): U.S. Geological Survey Fact Sheet 2012–3047, 4 p., accessed May 15, 2024, at https://doi.org/10.3133/fs20123047.
National Centers for Environmental Information, 2022, Alabama State climate summary 2022: National Oceanic and Atmospheric Administration, National Centers for Environmental Information, 4 p., accessed May 15, 2024, at https://statesummaries.ncics.org/downloads/Alabama-StateClimateSummary2022.pdf.
Pohlert, T., 2023, trend—Non-parametric trend tests and change-point detection (R package, ver. 1.1.6): R Project for Statistical Computing software release, accessed May 15, 2024, at https://doi.org/10.32614/CRAN.package.trend.
R Core Team, 2024, R—A language and environment for statistical computing (ver. 4.4.0): Vienna, Austria, R Foundation for Statistical Computing software release, accessed May 15, 2024, at https://www.R-project.org.
Rodgers, K.D., Roland, V.L., II, Hoos, A.B., Crowley-Ornelas, E.R, and Knight, R.R., 2020, An analysis of streamflow trends in the southern and southeastern US from 1950–2015: Water, v. 12, no. 3345, 28 p., accessed May 15, 2024, at https://doi.org/10.3390/w12123345.
Tatum, T.A., Crowley-Ornelas, E.R., and Asquith, W.H., 2024, Geospatial extent of the study area and statistical buffer for Mobile and Perdido bays contributing watersheds in the southeastern United States: U.S. Geological Survey data release, accessed October 5, 2024, at https://doi.org/10.5066/P13SVHUN.
Tennessee Tombigbee Waterway Development Authority, 2024, Tennessee-Tombigbee Waterway: Tennessee Tombigbee Waterway Development Authority web page, accessed October 5, 2024, at https://www.tenntom.org.
U.S. Army Corps of Engineers, 2024, National Inventory of Dams: U.S. Army Corps of Engineers database, accessed October 6, 2024, at https://nid.sec.usace.army.mil/#/.
U.S. Army Corps of Engineers, 2025, Allatoona Lake: U.S. Army Corps of Engineers web page, accessed April 14, 2025, at https://www.sam.usace.army.mil/Missions/Civil-Works/Recreation/Allatoona-Lake/.
U.S. Environmental Protection Agency, 2023, Level III and IV Ecoregions of the continental United States: U.S. Environmental Protection Agency database, accessed November 29, 2023, at https://www.epa.gov/eco-research/level-iii-and-iv-ecoregions-continental-united-states.
U.S. Environmental Protection Agency, 2024, Climate change indicators—Streamflow: U.S. Environmental Protection Agency web page, accessed October 8, 2024, at https://www.epa.gov/climate-indicators/climate-change-indicators-streamflow.
U.S. Geological Survey [USGS], 1986, National water summary 1985—Hydrologic events and surface-water resources: U.S. Geological Survey Water Supply Paper 2300, 506 p., April 17, 2024, at https://doi.org/10.3133/wsp2300.
U.S. Geological Survey [USGS], 1991, National water summary 1988–89—Hydrologic events and floods and droughts: U.S. Geological Survey Water-Supply Paper 2375, 591 p., April 17, 2024, at https://doi.org/10.3133/wsp2375.
U.S. Geological Survey [USGS], 2023, Manuscript for site 02414500 Tallapoosa River at Wadley, Alabama, 2023 Water Year, in USGS water data for the Nation: U.S. Geological Survey National Water Information System database, accessed December 30, 2025, at https://doi.org/10.5066/F7P55KJN. [Site manuscript accessed December 30, 2025, at https://rconnect.usgs.gov/water-year-summary/?_inputs_&render_button=0&site_no_select=%2202414500%22&wateryear_select=%222023%22.]
U.S. Geological Survey [USGS], 2024, USGS water data for the Nation: U.S. Geological Survey National Water Information System database, accessed March 8, 2024, at https://doi.org/10.5066/F7P55KJN.
For more information about this publication, contact
Director, Lower Mississippi-Gulf Water Science Center
U.S. Geological Survey
640 Grassmere Park, Suite 100
Nashville, TN 37211
For additional information, visit
https://www.usgs.gov/centers/lmg-water/
Publishing support provided by
U.S. Geological Survey Science Publishing Network,
Lafayette Publishing Service Center
Disclaimers
Any use of trade, firm, or product names is for descriptive purposes only and does not imply endorsement by the U.S. Government.
Although this information product, for the most part, is in the public domain, it also may contain copyrighted materials as noted in the text. Permission to reproduce copyrighted items must be secured from the copyright owner.
Suggested Citation
Asquith, W.H., Crowley-Ornelas, E.R., and Whaling, A.R., 2026, Assessment of long-term trends in streamflow statistics within and near the Mobile Bay and Perdido Bay watersheds, United States, 1950–2022: U.S. Geological Survey Scientific Investigations Report 2026–5142, 35 p., https://doi.org/10.3133/sir20265142.
ISSN: 2328-0328 (online)
Study Area
| Publication type | Report |
|---|---|
| Publication Subtype | USGS Numbered Series |
| Title | Assessment of long-term trends in streamflow statistics within and near the Mobile Bay and Perdido Bay watersheds, United States, 1950–2022 |
| Series title | Scientific Investigations Report |
| Series number | 2026-5142 |
| DOI | 10.3133/sir20265142 |
| Publication Date | April 30, 2026 |
| Year Published | 2026 |
| Language | English |
| Publisher | U.S. Geological Survey |
| Publisher location | Reston, VA |
| Contributing office(s) | Lower Mississippi-Gulf Water Science Center, Oklahoma-Texas Water Science Center |
| Description | Report: viii, 35 p.; Data Release |
| Country | United States |
| State | Alabama, Florida, Georgia, Louisiana, Mississippi, Tennessee |
| Other Geospatial | Mobile Bay and Perdido Bay watersheds |
| Online Only (Y/N) | Y |
| Additional Online Files (Y/N) | N |