

Urban Stormwater Treatment Using Biofiltration—Variable Performance Across Solids, Nutrients, Major Ions, and Metals
Links
- Document: Report (4.0 MB pdf) , HTML , XML
- Data Release: USGS data release - Water quality concentration and load data for a biofilter at Green Tech Station in Milwaukee, Wisconsin, 2022–24
- Download citation as: RIS | Dublin Core
Acknowledgments
The authors would like to thank Sean Thiboldeaux and Rami Badreddine of the U.S. Geological Survey for field operations and maintaining data integrity.
The authors would also like to thank Justin Hegarty of Reflow H2O, Jay Karls of Ramboll, Tory Kress of the City of Milwaukee, and Sarah Bregant of the Northwest Side Community Development Corporation for coordination of site access and operations at Green Tech Station.
Abstract
Urban runoff from streets and parking lots carries pollutants that degrade receiving waters. Green infrastructure, such as biofilters, is increasingly used to treat this runoff by mimicking natural hydrologic processes. The U.S. Geological Survey, in cooperation with the Milwaukee Metropolitan Sewerage District, evaluated a biofilter receiving roadway runoff from an industrial area in Milwaukee, Wisconsin, over a 3-year period (2022–24). Paired inlet and outlet samples were analyzed for changes in runoff volume, peak discharge, and concentrations of solids, nutrients, major ions, and metals. The biofilter reduced runoff volume by 86 percent and peak discharge by 92 percent, with substantial reductions in total suspended solids (99 percent), total phosphorus (86 percent), and particulate metals (greater than 80 percent for most analytes). However, dissolved constituents showed variable performance; dissolved phosphorus and several metals exhibited net export, likely influenced by media composition, redox conditions, and winter road salt inputs. Sodium export, despite stable chloride loads, suggests cation exchange and seasonal release dynamics. These findings highlight limitations of conventional biofilter designs for dissolved pollutants and underscore the need for improved media, vegetation management, and consideration of winter deicing practices.
Plain Language Summary
Urban stormwater runoff can carry sediment, nutrients, salts, and metals into nearby rivers and lakes, contributing to flooding and water-quality problems. To reduce these impacts, communities are increasingly using shallow, planted systems called biofilters to capture and soak up runoff. This study evaluates how well a biofilter in Milwaukee, Wisconsin, performed over three years and what its results mean for managing stormwater in urban areas.
The biofilter was highly effective at managing stormwater volume and flow. On average, it reduced the amount of runoff leaving the site by 86 percent and reduced peak flow rates by 92 percent. These reductions help lower the risk of flooding downstream, especially during heavy rain.
The biofilter also worked very well at removing pollutants attached to soil and debris. Nearly all suspended sediment was removed, and total phosphorus was reduced by more than 80 percent. Most metals attached to sediment, such as lead and copper, were also greatly reduced. These results show that biofilters are reliable tools for controlling particulate forms of pollutants from roads, even when sediment loads are high.
However, the biofilter was less effective at treating dissolved phase pollutants. For example, dissolved phosphorus and several dissolved metals, including iron and manganese, were often higher in water leaving the biofilter than in water entering it. Sodium, a major component of road salt, was also released from the system at times. Export of dissolved phase pollutants from the biofilter likely reflects interactions between runoff, organic material in the soil, and winter deicing practices. Improving soil mixtures, managing vegetation, and reducing salt inputs may help biofilters better protect urban water quality in the future.
Introduction
Conventional stormwater infrastructure conveys runoff from developed areas via piped conveyance systems and open drainage channels to centralized treatment facilities or directly to receiving water. During high-intensity or large-volume precipitation events, these systems frequently exceed their design capacity, resulting in localized flooding and insufficient mitigation of water-quality impacts. Runoff discharged to surface waters often contains elevated concentrations of suspended sediment, nutrients, trash, and other contaminants, with pollutant loads further exacerbated in areas served by combined sanitary and storm sewer systems during high-flow conditions (U.S. Environmental Protection Agency, 1983; Great Lakes Commission, 2018). By contrast, precipitation in undeveloped landscapes is largely infiltrated, retained, and filtered by soils and vegetation, producing runoff that is reduced in both volume and pollutant load prior to reaching downstream water bodies.
Green infrastructure (GI), as defined by the Water Infrastructure Improvement Act (Public Law 115–436, 132 Stat. 5565), includes the range of measures that use plant or soil systems or other permeable surfaces to store, infiltrate, or evapotranspire stormwater and reduce flows to sewer systems and receiving water bodies. GI practices are increasingly being used at various scales to address the hydrologic challenges of increasing impervious surfaces found in expanding urbanized areas. By capturing and treating stormwater at or near its source, GI is increasingly being recognized as a key strategy in helping communities meet watershed goals (Baker and others, 2022). Although GI is primarily designed to reduce flooding by decreasing stormwater volume and peak flow rates, recent modifications have centered around improving the quality of stormwater through treatment processes such as settling, filtration, adsorption, and biotransformation of pollutants (Clary and others, 2020; Bodus and others, 2024). These processes, when used in combination, have been shown to be effective at mitigating the water-quality effects of stormwater to surface and groundwater systems; however, reported treatment efficiencies of GI have largely been constrained to a limited number of regulated pollutants such as total suspended solids (TSS) and total phosphorus (TP) (Field and Sullivan, 2002; Barrett, 2005).
Biofilters, also known as bioretention cells, bioswales, and rain gardens, are a type of GI practice that have increasingly gained popularity because of their low cost to design, build, and maintain, but also because of their proven capacity to remove appreciable amounts of sediment, nutrients, and metals from untreated urban stormwater (Feng and others, 2012; Zhang and others, 2014; Clary and others, 2020). However, although most biofilters can remove a portion of particulate pollutants in stormwater, they are often ineffective at removing dissolved pollutants. Of the regulated pollutants biofilters are typically designed to treat, dissolved phosphorus (DP) and chloride have been shown to have higher concentrations at the outlet compared to the inlet (Erickson and others, 2012, 2019). The unique physiochemical properties of dissolved-phase pollutants hinder their removal by biofilters.
To address the ineffectiveness of biofilters at removing dissolved pollutants, an expanding list of design modifications has been tested for enhanced pollutant removal, primarily in the form of new formulations of soil amendments. The list of materials used in soil mixtures to enhance pollution control is extensive, with varying degrees of success. In most cases, removal primarily occurs through adsorption to other materials. For example, iron filings and biochar are often used in biofilters for enhanced phosphorus removal. Erickson and others (2012) have shown that sand mixed with 5 percent iron filings captures a mean of 88 percent of DP. In a review of 40 different adsorptive materials, Ali and Pickering (2023) suggest activated alumina, layered double hydroxyl, alum-based water treatment residuals, and zero valent iron as top performers. Although results from these studies are promising, they are typically done under controlled conditions using synthetically produced runoff applied to soil columns or mesocosms that emulate biofiltration. Results from these studies should be validated through in situ monitoring at field scale to properly characterize response across a range of environmental conditions (Hatt and others, 2009).
Design features other than soil additives have also shown promise at enhanced pollutant removal. Using soil columns to assess the effect of a range of factors on removal efficiency, Bratieres and others (2008) noted more than 98 percent of copper and zinc was removed if the soil depth was greater than 300 millimeters. Other studies point to proper selection of vegetative species and use of saturation zones to enhance nutrient reduction, particularly nitrogen (Read and others, 2008; Wu and others, 2017). Simple design modifications, as well as other existing treatment mechanisms (for example, filtration, sorption, biological and other physiochemical processes), hold potential to sequester particulate and dissolved-phase pollutants; however, no single design alteration or soil additive has been shown to address the full range of pollutants present in urban stormwater. Therefore, the precise approach and engineering modifications needed to do so are unclear (Bodus and others, 2024). More information is needed to better understand the fate, transport, exposure, and toxicity of stormwater pollutant mixtures discharged to and from infiltration-based GI practices.
The U.S. Geological Survey, in cooperation with the Milwaukee Metropolitan Sewerage District (MMSD), initiated a study to determine the pollutant reduction capabilities of a biofilter receiving roadway runoff from an industrialized area in Milwaukee, Wisconsin. MMSD has a goal of capturing the first 0.5-inch of rainfall on impervious surfaces (equivalent to 740 million gallons of water) with GI by the year 2035 (CH2MHILL, 2013). A large part of this goal is intended to be achieved by creating 650 acres of bioretention, bioswales, and rain gardens to store 26 percent of stormwater runoff from impervious surfaces. In addition to stormwater volume reduction, MMSD is continuously working on advancing new techniques and technologies that improve the quality of water entering Lake Michigan and its tributaries. Through advancements in biofilter design and maintenance, MMSD is taking steps to not only meet current water-quality regulations for TSS and TP but also minimize contributions of a larger suite of pollutants, such as metals and chloride, to downstream receiving waters. This study supports an ongoing effort to identify existing and new methods to reduce nonpoint source pollution from urban areas.
Materials and Methods
This study quantified concentrations and loads of select total and dissolved inorganic pollutants in urban stormwater runoff from an impervious roadway and conveyed through a biofilter in Milwaukee, Wis. Water-quality performance of the biofilter was assessed by comparing differences between inputs at the biofilter inlet and outputs via the underdrain. Collection of samples began in the summer of 2022 and concluded in the fall of 2024.
Site Description
Samples were collected for this study within the Green Tech Station green infrastructure plaza (hereafter referred to as “Green Tech Station”), which is a 3-acre site located in a mixed commercial and industrial use area in Milwaukee, Wis. (fig. 1). In 2018, the site transitioned from an undeveloped parcel of land into an environmental education and stormwater management demonstration park. The site features several green infrastructure practices, including four separate biofilters designed to capture and treat runoff from an adjacent roadway. Of the four biofilters at Green Tech Station, only one was instrumented for measurement of discharge and collection of water-quality samples (fig. 1).
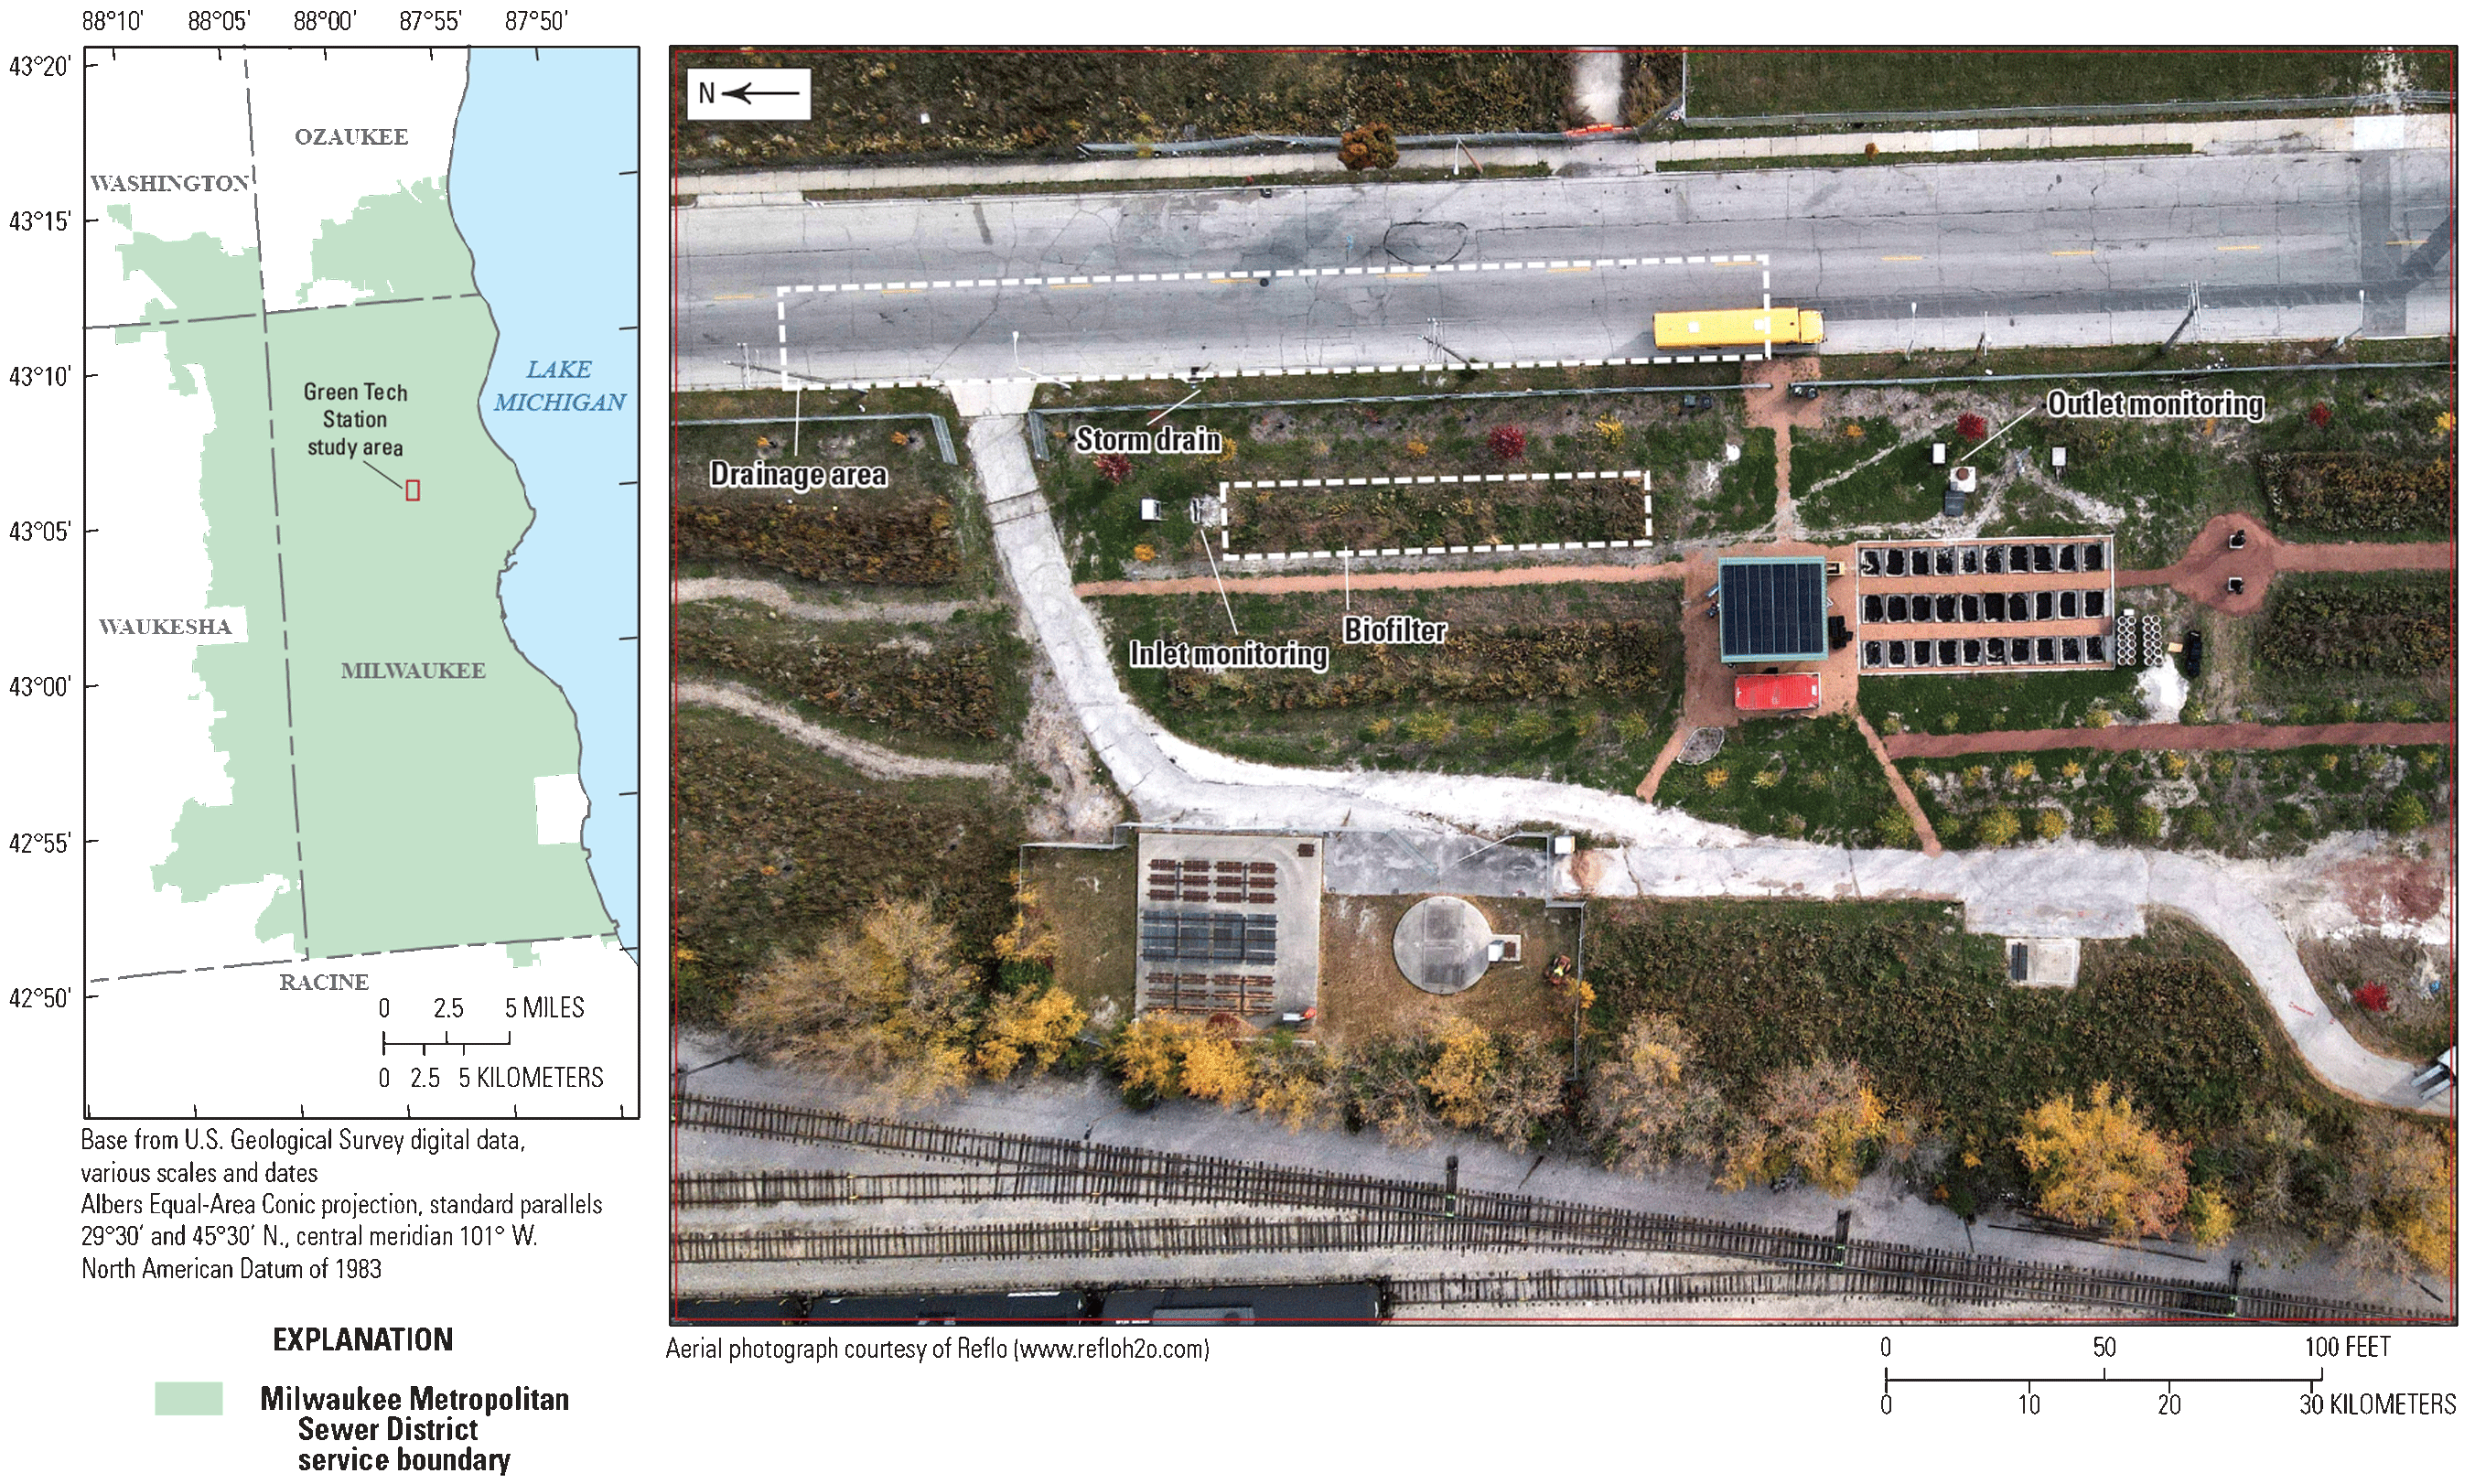
Map showing location of the monitored biofilter within the Green Tech Station stormwater plaza in Milwaukee, Wisconsin.
Flow Measurement
Measurement of discharge at both the biofilter influent and effluent was quantified using pre-rated hydraulic control structures at each monitoring location. Measurements of water level were converted to discharge using manufacturer-provided rating curves based on standard flume and weir equations. These relationships account for geometry and flow regime to allow for quantification of inflow and outflow necessary to evaluate biofilter hydraulic performance and frequency of water-quality samples.
Inlet
Near Green Tech Station, stormwater runoff is routed from an approximately 4,000 square feet section of a feeder street to a nearby storm drain (fig. 1). The street is asphalt-based serving primarily industrial land use with a mean traffic count of 3,600 vehicles per day (Wisconsin Department of Transportation, 2025). A 4-inch pipe transfers runoff from the storm drain into a 5- x 1-foot (ft) concrete chamber at the head of the biofilter. Water inside the concrete chamber rises to approximately 0.17 ft before cascading through an 11-inch x 24-inch, 95-degree V-notch weir (fig. 2). A submersible pressure transducer, calibrated to the nearest 0.01 ft, measured the changing water level in the concrete chamber, which was then used to compute instantaneous discharge by use of standard weir equations (Grant and Dawson, 2001). Water passing through the weir first entered a pre-treatment forebay before reaching the biofilter (fig. 3). The forebay was lined with an impermeable membrane and filled with cobble overlying coarse gravel. The rectangular forebay extended 3 ft away from the concrete chamber and 1 ft below the weir invert. Once full, water from the pre-treatment forebay would then overflow into the biofilter.
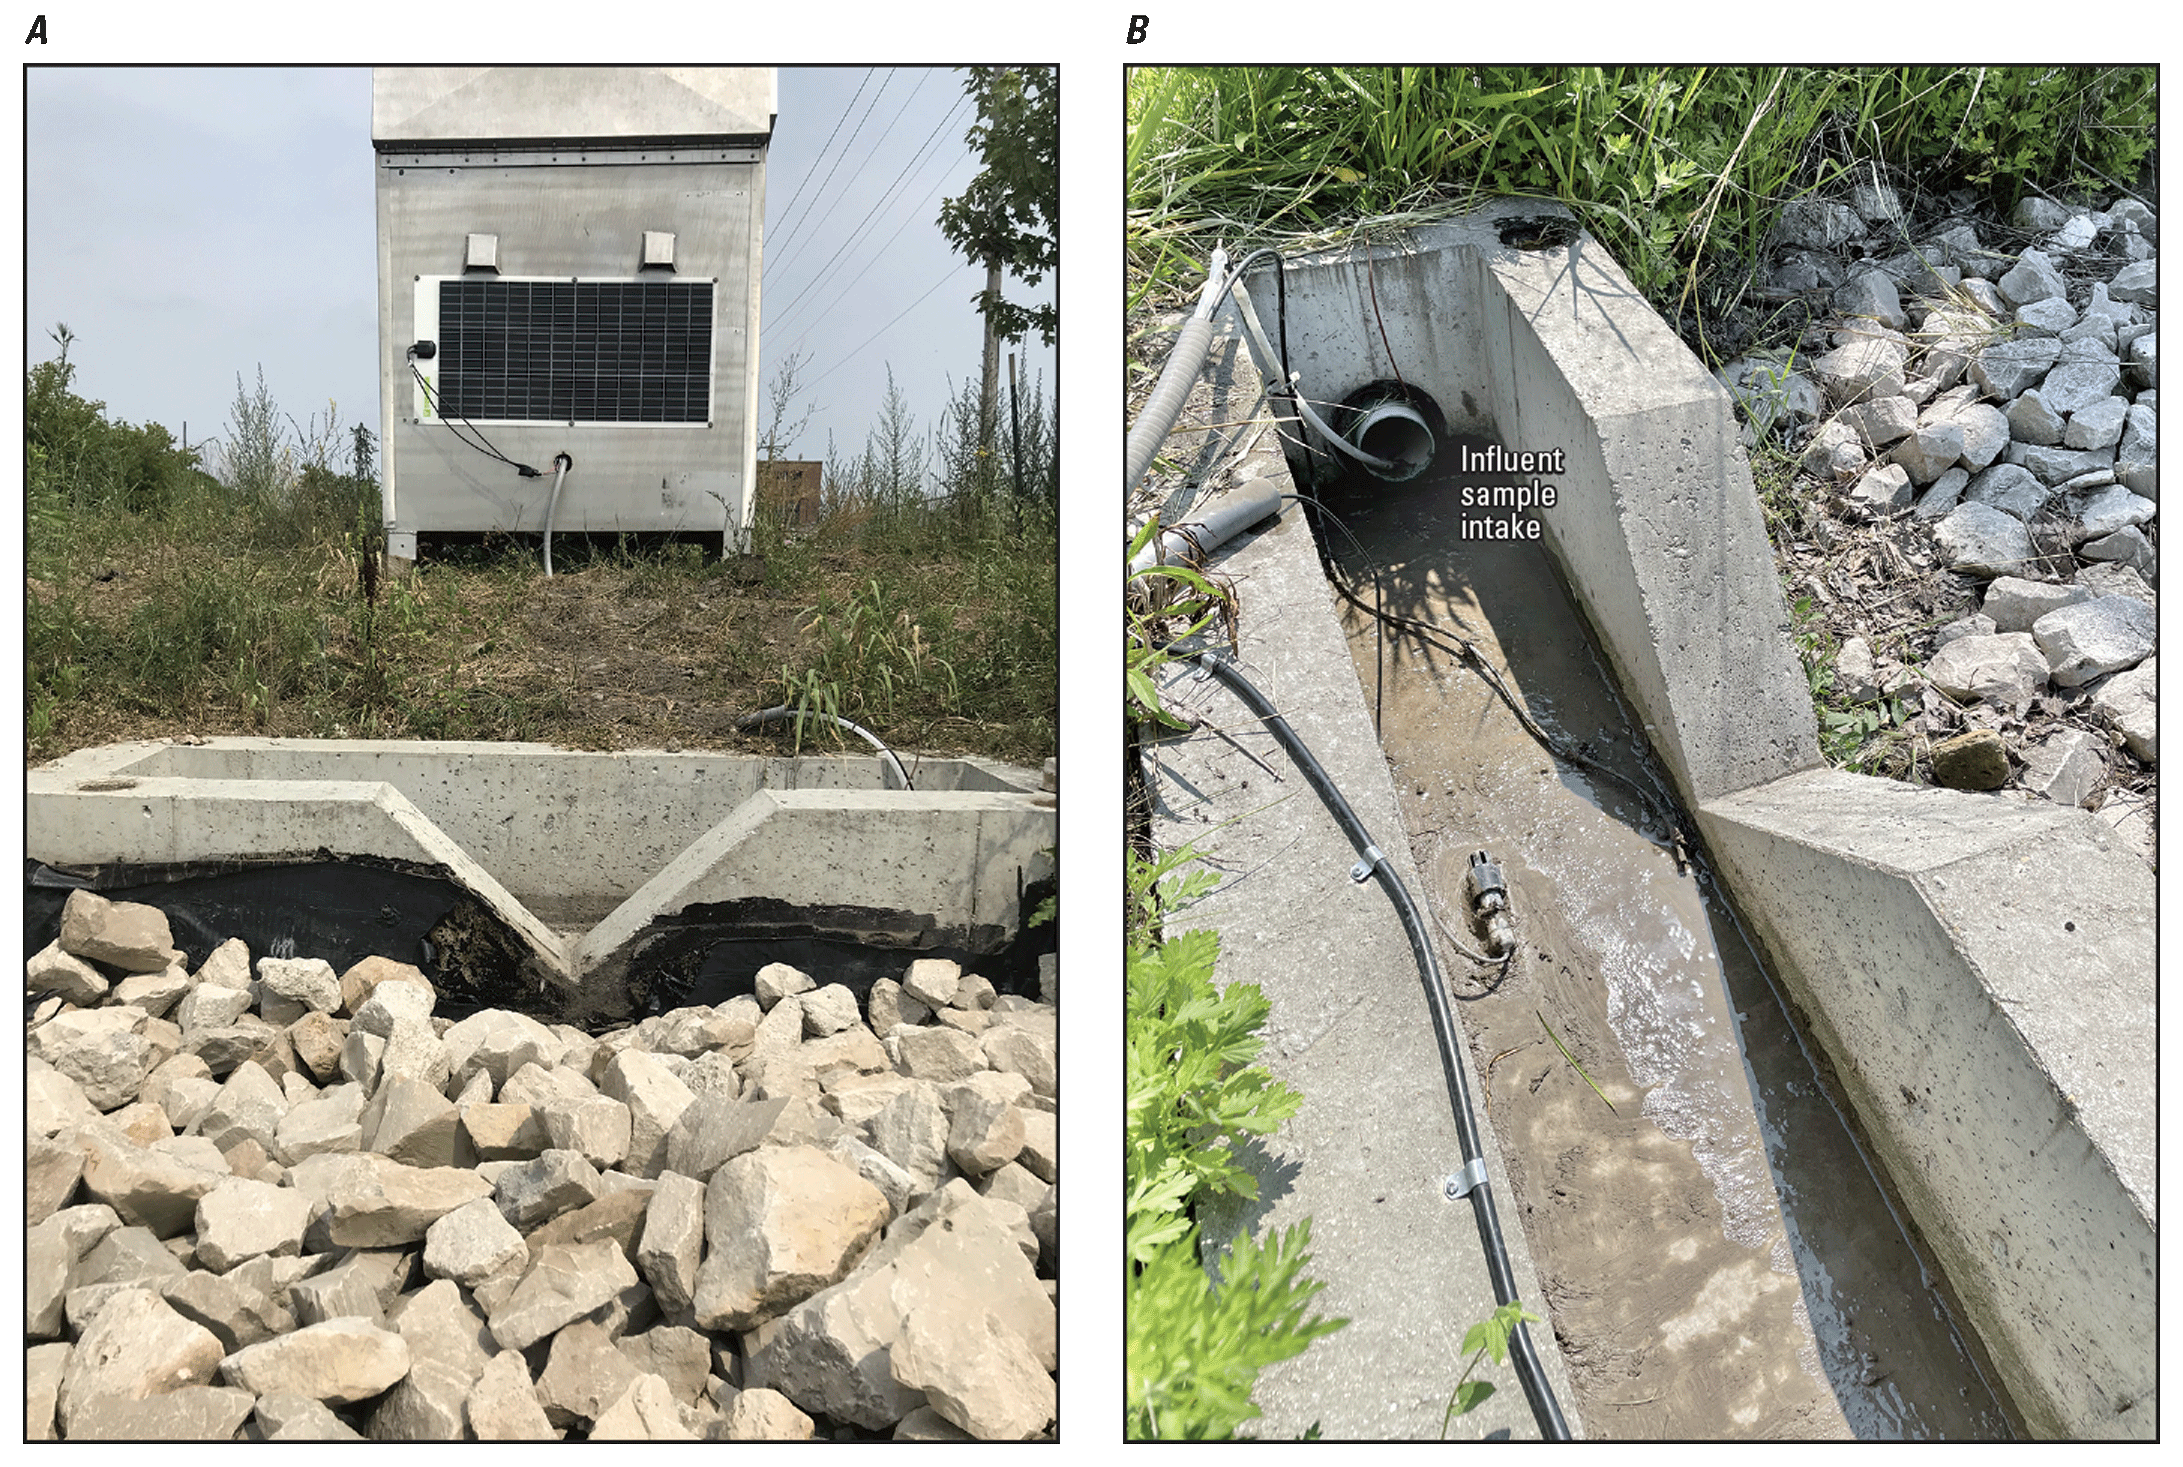
V-notch weir used to measure the discharge of runoff entering the biofilter. A, Cobble pretreatment forebay. B, Submersible pressure transducer placed below the invert of the V-notch weir.
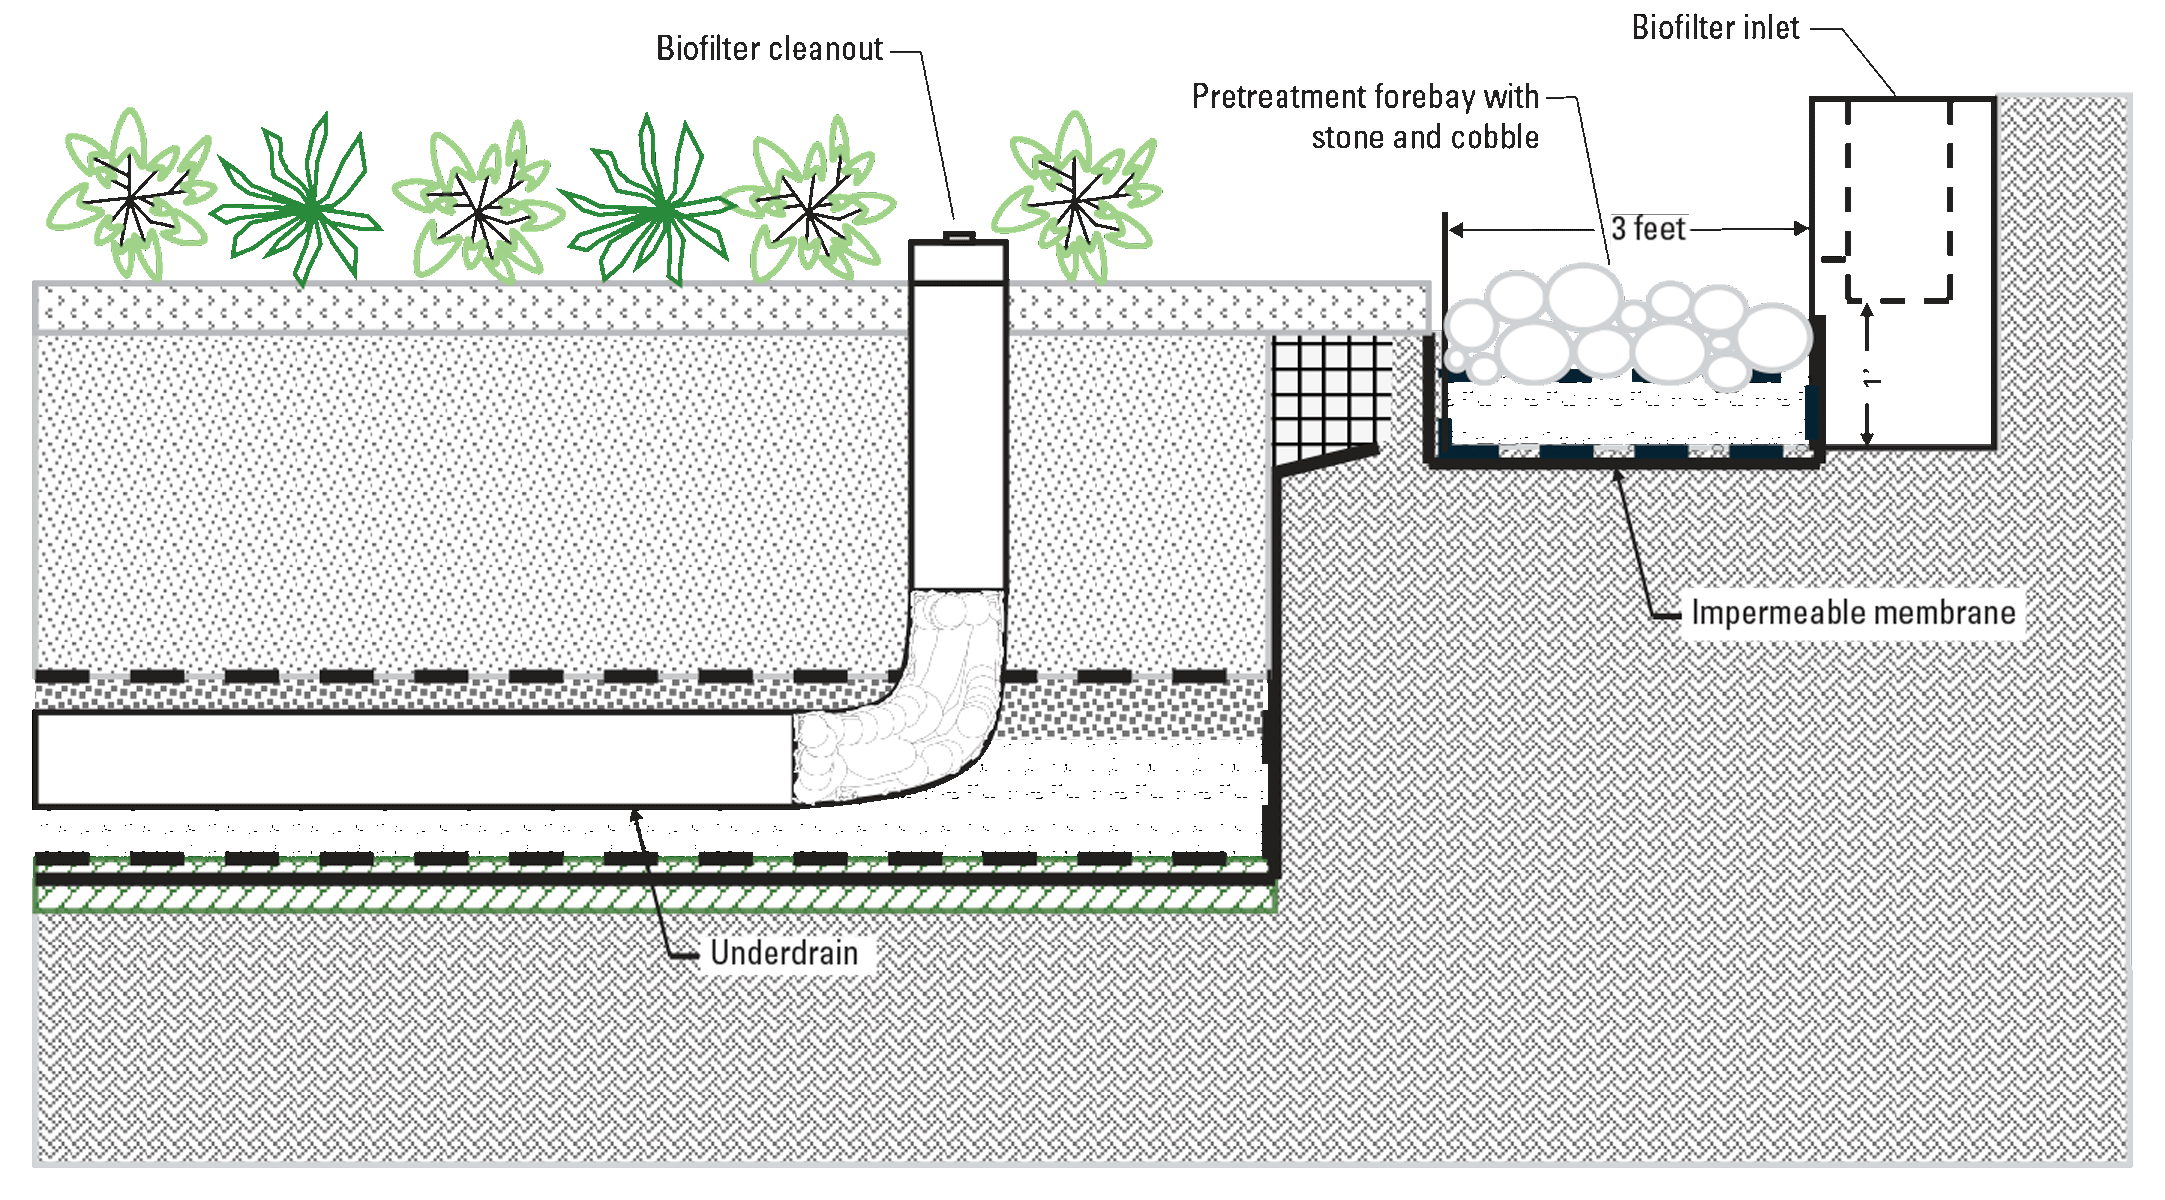
Schematic of biofilter cross-section detailing the concrete weir, pretreatment forebay, and biofilter with underdrain.
Outlet
Runoff infiltrating through the biofilter was captured by a 4-inch underdrain and routed to a 20,000-gallon underground cistern. A 4-inch Palmer-Bowlus flume was attached to the terminus of the underdrain pipe within the cistern for measurement of effluent discharge (fig. 4). A submersible pressure transducer, calibrated to the nearest 0.01 ft, measured the changing water levels in the flume that were then used to compute instantaneous discharge by use of standard flume equations (Grant and Dawson, 2001). There were no overflow drains in the biofilter.
The cistern was used to temporarily store effluent discharge from the biofilter as well as from all other GI practices within the Green Tech Station. Stored water was later used to irrigate vegetation during dry periods. On occasion, the volume of water would exceed the storage capacity of the cistern and submerge the flume. Water levels measured during these periods were censored from analysis.
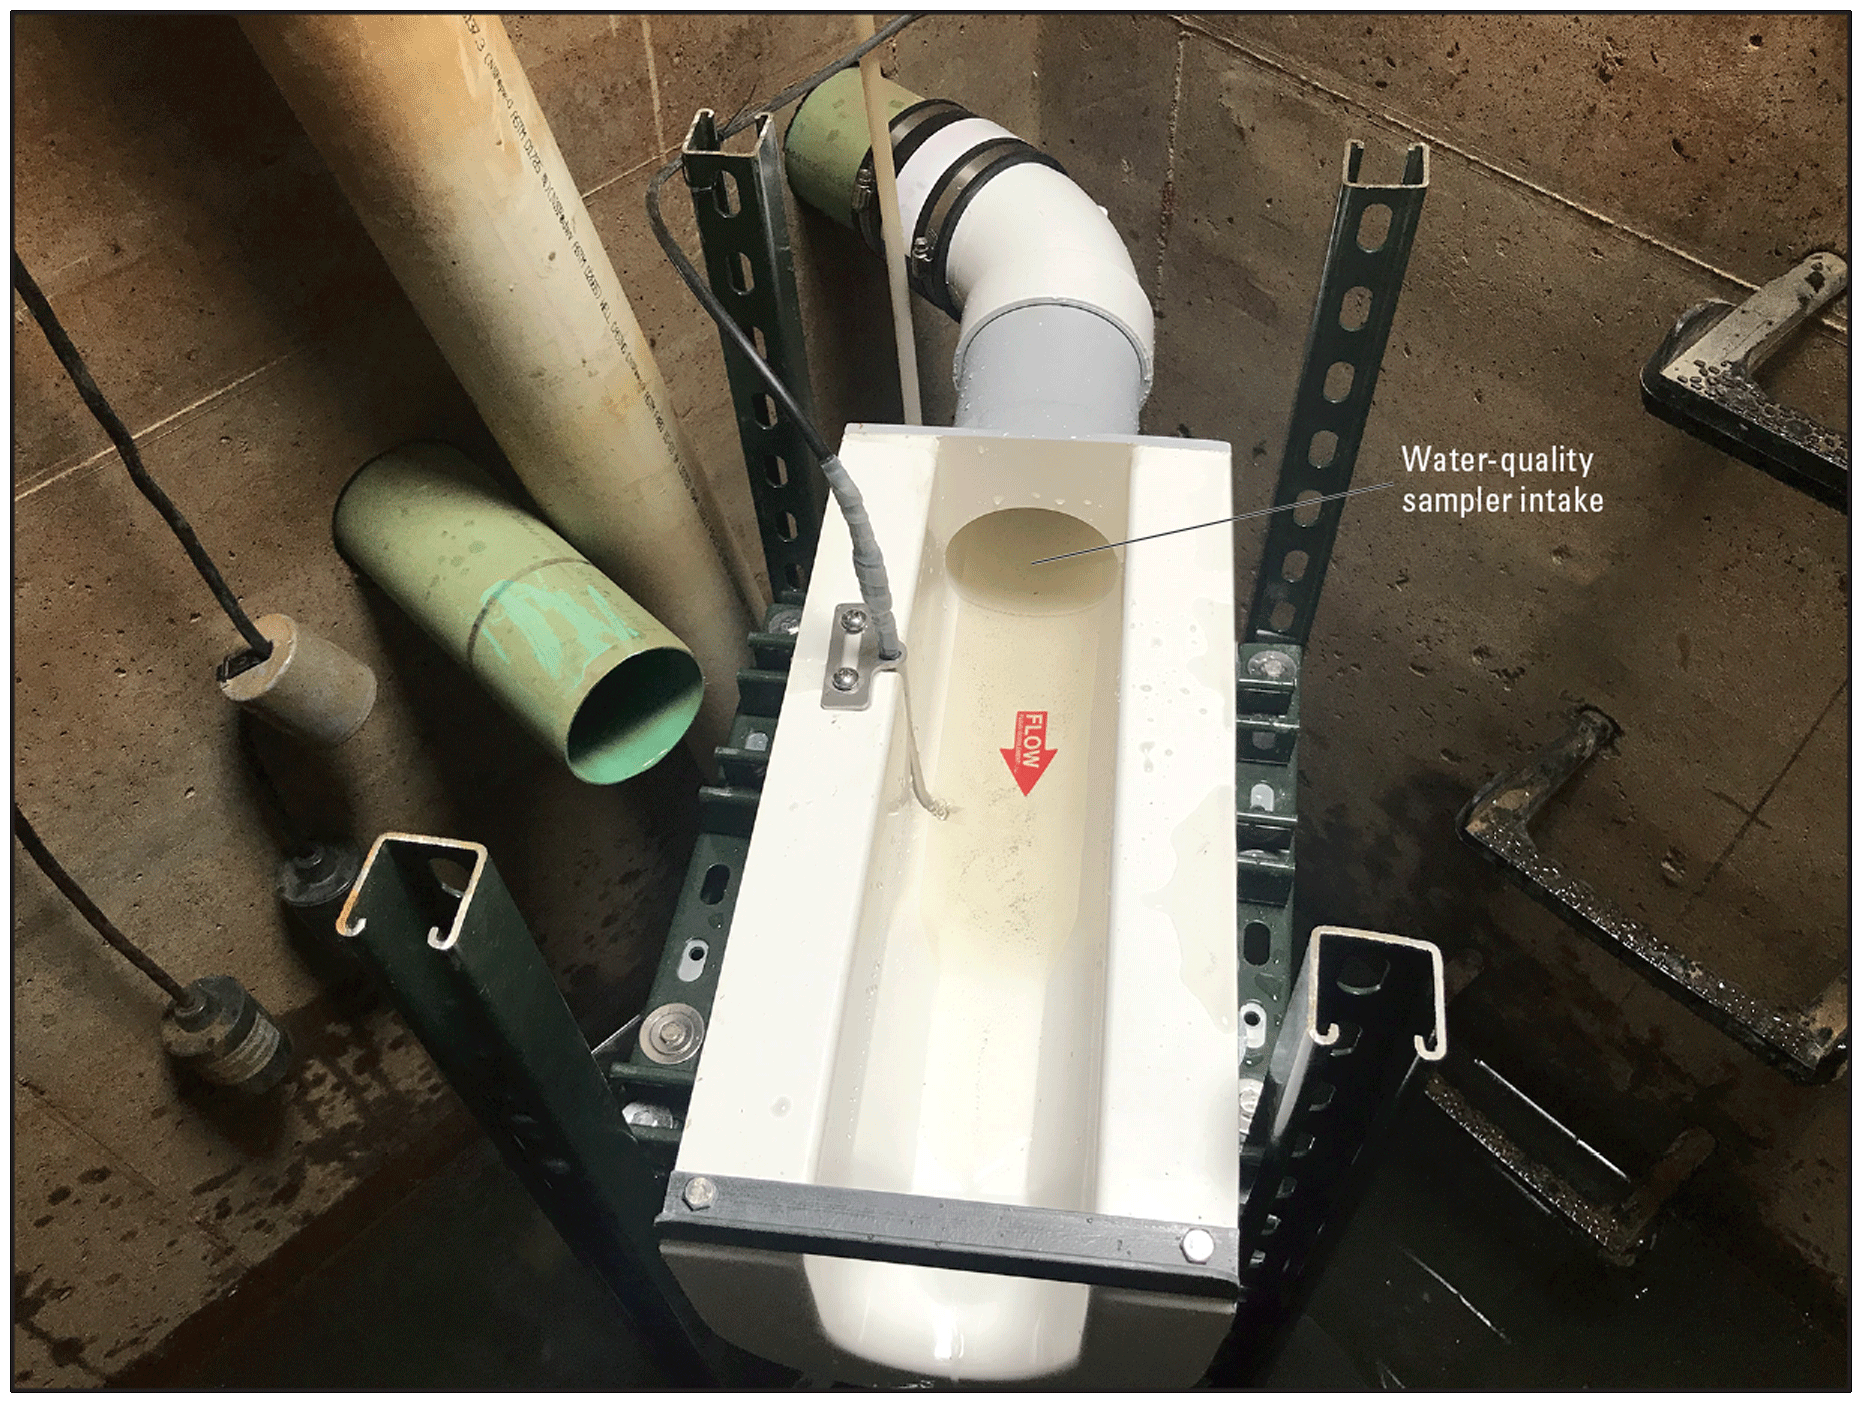
Palmer-Bowlus flume used to measure underdrain effluent discharge from the biofilter.
Precipitation
Continuous precipitation data were collected by use of a tipping-bucket rain gage calibrated to 0.01 inch per tip. The rain gage was located near the center of the Green Tech Station in an area with no overhead tree canopy or other larger structures. The rain gage was not designed to measure snowfall; however, some runoff events occurred during the winter when precipitation was in the form of rain instead of snow. Because of the roughness of the street surface, runoff did not typically occur until rainfall exceeded approximately 0.1 inch.
Measurement of Concentrations in Water
The inlet and outlet monitoring stations were equipped with refrigerated, automated water-quality samplers. Each sampler had an orifice diameter of approximately 0.375 inch and a withdrawal velocity of approximately 3.0 feet per second. The sample intake for runoff into the biofilter was located at the invert of the 4-inch pipe leading into the concrete chamber (fig. 2). The intake for runoff out of the biofilter was located at the invert of the 4-inch underdrain pipe just upslope of the flume in the cistern (fig. 4). Sample collection was activated by a rise in water level in the flumes during a precipitation or snowmelt event, or both. Once water level exceeded a threshold, typically 0.03 ft above the point of zero flow, the volume of water passing the monitoring station was measured and accumulated at 1-minute increments until a volumetric threshold was reached. At that point, a discrete water sample was collected, and the volumetric counter was reset. This process was repeated until the water level receded below the threshold. All flow-weighted discrete samples collected throughout the duration of an event hydrograph were combined into a single, composite sample, resulting in an event mean concentration (EMC) that represented a minimum of 80 percent of the storm hydrograph. Water-quality samples were collected within 24 hours after runoff cessation. A Teflon churn splitter was used to composite and split samples into sample containers to be delivered to the analytical laboratory. A portion of the composite sample was processed through a 0.45-micrometer filter for analysis of dissolved constituents. All processed samples were kept refrigerated at 4 degrees Celsius until delivered to the analytical laboratory, usually within 48 hours after preservation. Samples were analyzed for inorganic constituents at the National Water Quality Laboratory in Lakewood, Colorado. A list of all analyzed constituents in paired water-quality samples is provided in table 1.
Biofilter Design and Maintenance
The biofilter within Green Tech Station is approximately 12 ft wide and 100 ft long, covering an area of 1,200 square feet and approximating a 3:1 ratio of contributing to receiving area. The bottom of the biofilter is 2 ft wide with a 5:1 side slope and a 1-ft ponding depth, creating a storage capacity of 9,000 gallons (fig. 5). The upper 2 ft of engineered soil consists of a mixture of 80 percent friable topsoil, 10–15 percent sand, and 5 percent compost. This mixture was inspected to ensure it was free of rocks, stumps, brush, or other materials larger than 1-inch diameter. In addition, the pH of the soil was confirmed to be within the recommended range of 5.5 to 8.0 when initially installed. Water passing through the engineered soil layer accumulated in the bottom storage layer, which was a 1-ft-thick layer of well-graded, coarse aggregate placed on top of an impermeable membrane (fig. 5). This layer captured and temporarily stored the filtered stormwater before draining into a 4-inch perforated underdrain pipe, encased in filter fabric, and sloped at 0.5 percent increasing to 1.0 percent. A 4-inch, vertically oriented, rigid, nonperforated standpipe was connected to the underdrain to serve as a clean-out port. This standpipe was sealed with a waterproof cap and extended 3 inches above the biofilter surface. The biofilter underdrain was not cleaned out prior to the study.
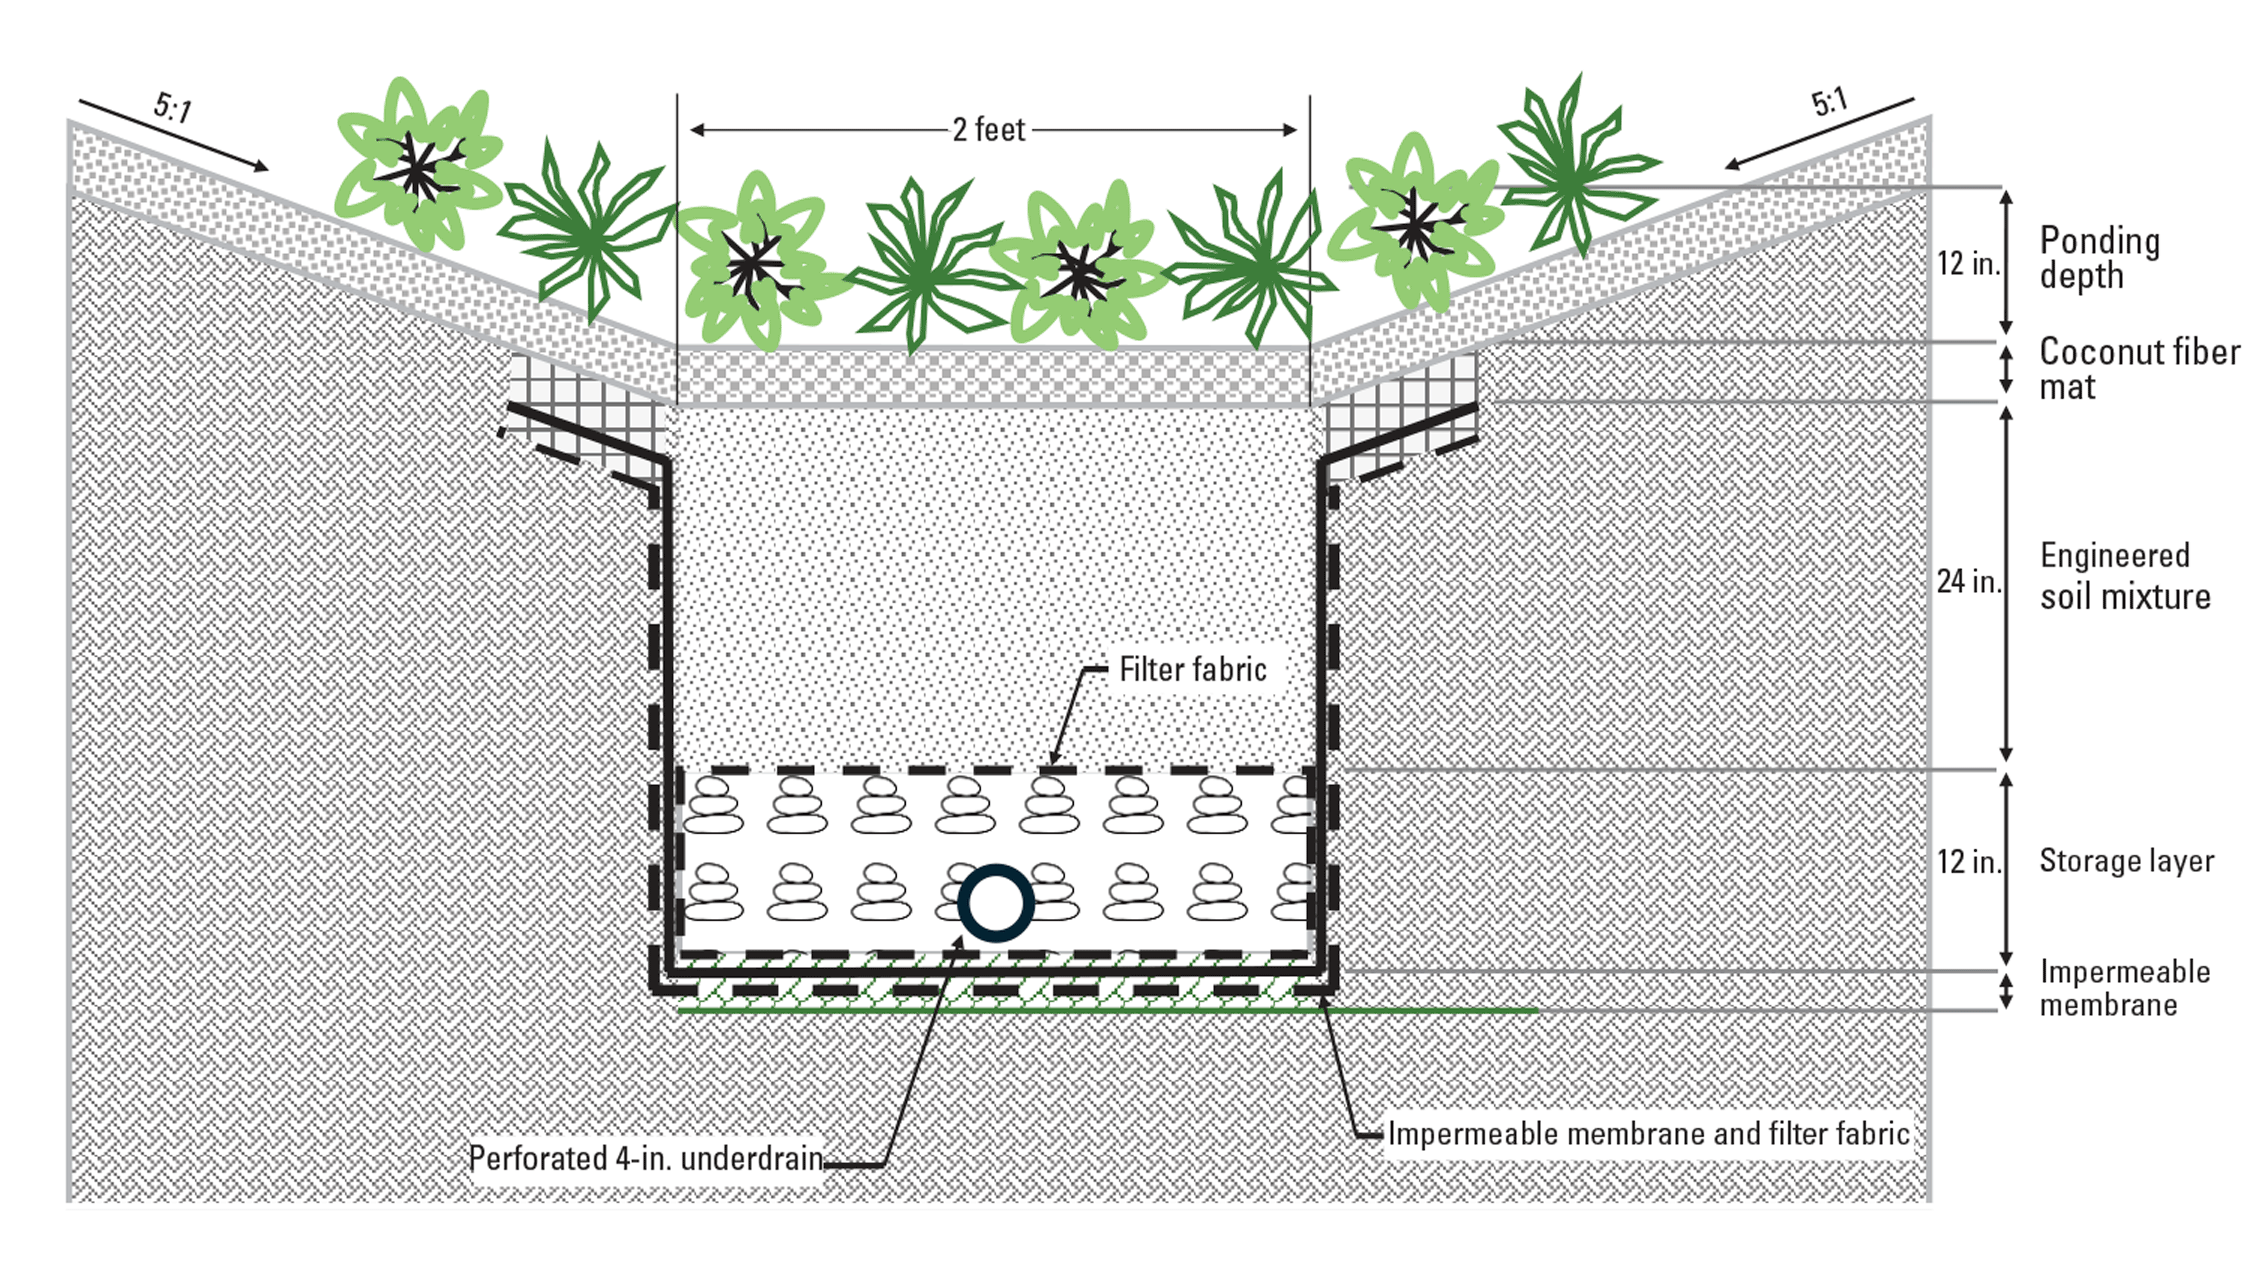
Schematic of biofilter cross-section detailing base and side slope dimensions, placement of coconut fiber mat and impermeable membrane, ponding depth, and thickness of engineered soil media.
Table 1.
Constituents analyzed in water samples collected at the inlet and outlet of a biofilter in Milwaukee, Wisconsin.[MDL, method detection limit; mg/L, milligram per liter; µg/L, microgram per liter]
| Constituent | Units | MDL | Method |
|---|---|---|---|
| Total suspended solids | mg/L | 15 | Fishman (1993) |
| Total phosphorus | mg/L | 0.003 | Drummond and Maher (1995) |
| Dissolved phosphorus | mg/L | 0.003 | Drummond and Maher (1995) |
| Calcium | mg/L | 0.04 | Garbarino and Struzeski (1998) |
| Magnesium | mg/L | 0.01 | Garbarino and Struzeski (1998) |
| Sodium | mg/L | 0.2 | Garbarino and Struzeski (1998) |
| Bromide | mg/L | 0.01 | Fishman and Friedman (2015) |
| Chloride | mg/L | 0.05 | Lipps and others (2023) |
| Aluminum | μg/L | 4 | Faires (1993) |
| Cadmium | μg/L | 0.03 | Faires (1993) |
| Chromium | μg/L | 0.5 | Faires (1993) |
| Cobalt | μg/L | 0.03 | Faires (1993) |
| Copper | μg/L | 0.4 | Faires (1993) |
| Iron | μg/L | 5 | Garbarino and Struzeski (1998) |
| Lead | μg/L | 0.03 | Faires (1993) |
| Manganese | μg/L | 0.4 | Faires (1993) |
| Nickel | μg/L | 0.2 | Faires (1993) |
| Vanadium | μg/L | 0.1 | Faires (1993) |
| Zinc | μg/L | 2 | Faires (1993) |
| Arsenic | μg/L | 0.1 | Faires (1993) |
A diverse mix of mature, native vegetation covered the bottom and side slopes of the biofilter (table 2). Plugs were used for the initial planting of vegetative species along the sides, slopes, and bottom of the biofilter. To preserve the integrity of the sloped surfaces and prevent erosion, a coconut fiber mat was installed on the surface after construction. Maintenance of deteriorating organic material in the biofilter was done by annual burning or mowing, usually in spring, to encourage healthy root growth and limit proliferation of invasive species.
Measurement of Infiltration Rate
Infiltration tests were done using a Modified Philip-Dunne infiltrometer (Ahmed and others, 2014). This device was selected for ease of use, short duration, low water consumption, and comparable results to the traditionally utilized double ring infiltrometer (American Society of Testing and Materials, 2025). Infiltration tests were done in the fall of 2024 near the inlet, middle, and outlet of the biofilter. Infiltration rates reported herein represent the mean of the three measured locations.
Statistical Analyses
The performance of the biofilter was based on a calculated percentage change between paired inlet and outlet pollutant loads from sampled events. Storm event loads at each monitoring location were computed by multiplying the EMC by event runoff volumes. EMCs for some pollutants were below the detection limit as reported by the analytical laboratory. A value of one-half the detection limit was used as an estimate of the actual concentration when computing summary statistics and event loads. The percentage change between paired inlet and outlet loads represents the aggregated pollutant removal capabilities (or lack thereof) of the biofilter.
Load data were first tested for normality by using the Shapiro-Wilk test (Helsel and Hirsch, 2002). Generally, data were not normally distributed in which case differences between paired inlet and outlet concentrations and loads were evaluated by use of the nonparametric Wilcoxon signed-rank test (Helsel and Hirsch, 2002). All statistical tests were initially done using a two-tailed test in which the null hypothesis assumed that the central tendency of populations for each group was not different. If the null was rejected, tests were repeated using a one-tailed test to determine if the outlet load was statistically greater or less than the inlet.
Correlation tests were done using Spearman’s rank test, which is a nonparametric statistical test used to measure the strength and direction of the monotonic relation between two ranked variables (Helsel and Hirsch, 2002). This test does not assume a linear relation and normal distribution. The degree of correlation, represented by Spearman’s rank correlation coefficient (ρ), moves from weak to strong as the value of the coefficient increases. All statistical tests used a 95-percent confidence level unless otherwise noted.
Results and Discussion
A total of 19 paired inlet and outlet samples were collected during the study period (June 2022–August 2024). Samples were primarily collected during the spring, summer, and fall months when precipitation was in the form of rain; however, some samples collected in March and April represented runoff from a combination of rainfall and snowmelt. A complete list of paired event volume, peak discharge, concentration, load, and precipitation characteristics are provided in a U.S. Geological Survey data release (Selbig and Romano, 2026).
Hydrologic Performance
Of the 142 precipitation events from March through November in 2022–24, 109 produced measurable runoff at the inlet (Selbig and Romano, 2026). The biofilter consistently demonstrated a high capacity to capture and store the entirety of generated stormwater runoff volume for all but 42 events (fig. 6). The volume of runoff at the inlet was strongly correlated to precipitation depth and 60-minute intensity (ρ=0.79; probability value [p-value] less than [<] 0.01 and ρ=0.71; p-value<0.01, respectively), which are two factors commonly associated with runoff from impervious surfaces. Inlet and outlet volumes showed a strong positive correlation as increasing volume of runoff entering the biofilter resulted in more volume leaving (ρ=0.79; p-value<0.01). This correlation can also be seen in figure 6 by the positive linear relation between the inlet and outlet across a gradient of volumes. Most runoff events were completely stored within the biofilter with no infiltrated water reaching the underdrain, resulting in a mean volume reduction of 86 percent (range from 11 percent to 100 percent) for all 109 events (table 3). Mean volume reduction decreased to 63 percent for the 42 events that exceeded the infiltration rate (mean of 10.9 inches per hour) and storage capacity of the biofilter, resulting in measurable volume at the outlet. As shown in figure 6, little to no runoff reaches the outlet until the inlet volume approaches 60 cubic feet, which is equivalent to approximately 0.18 inch of rainfall over the contributing roadway. There were no events that exceeded the aboveground volumetric storage capacity of the biofilter; however, on at least one occasion, a faulty seal allowed excess water in an adjacent biofilter to spill into the monitored biofilter downstream of the inlet. This excess water resulted in a larger volume of water measured at the outlet that was unaccounted for at the inlet, as seen by a single point above the line of equality in figure 6, and was subsequently censored from summary statistics detailed in table 3.
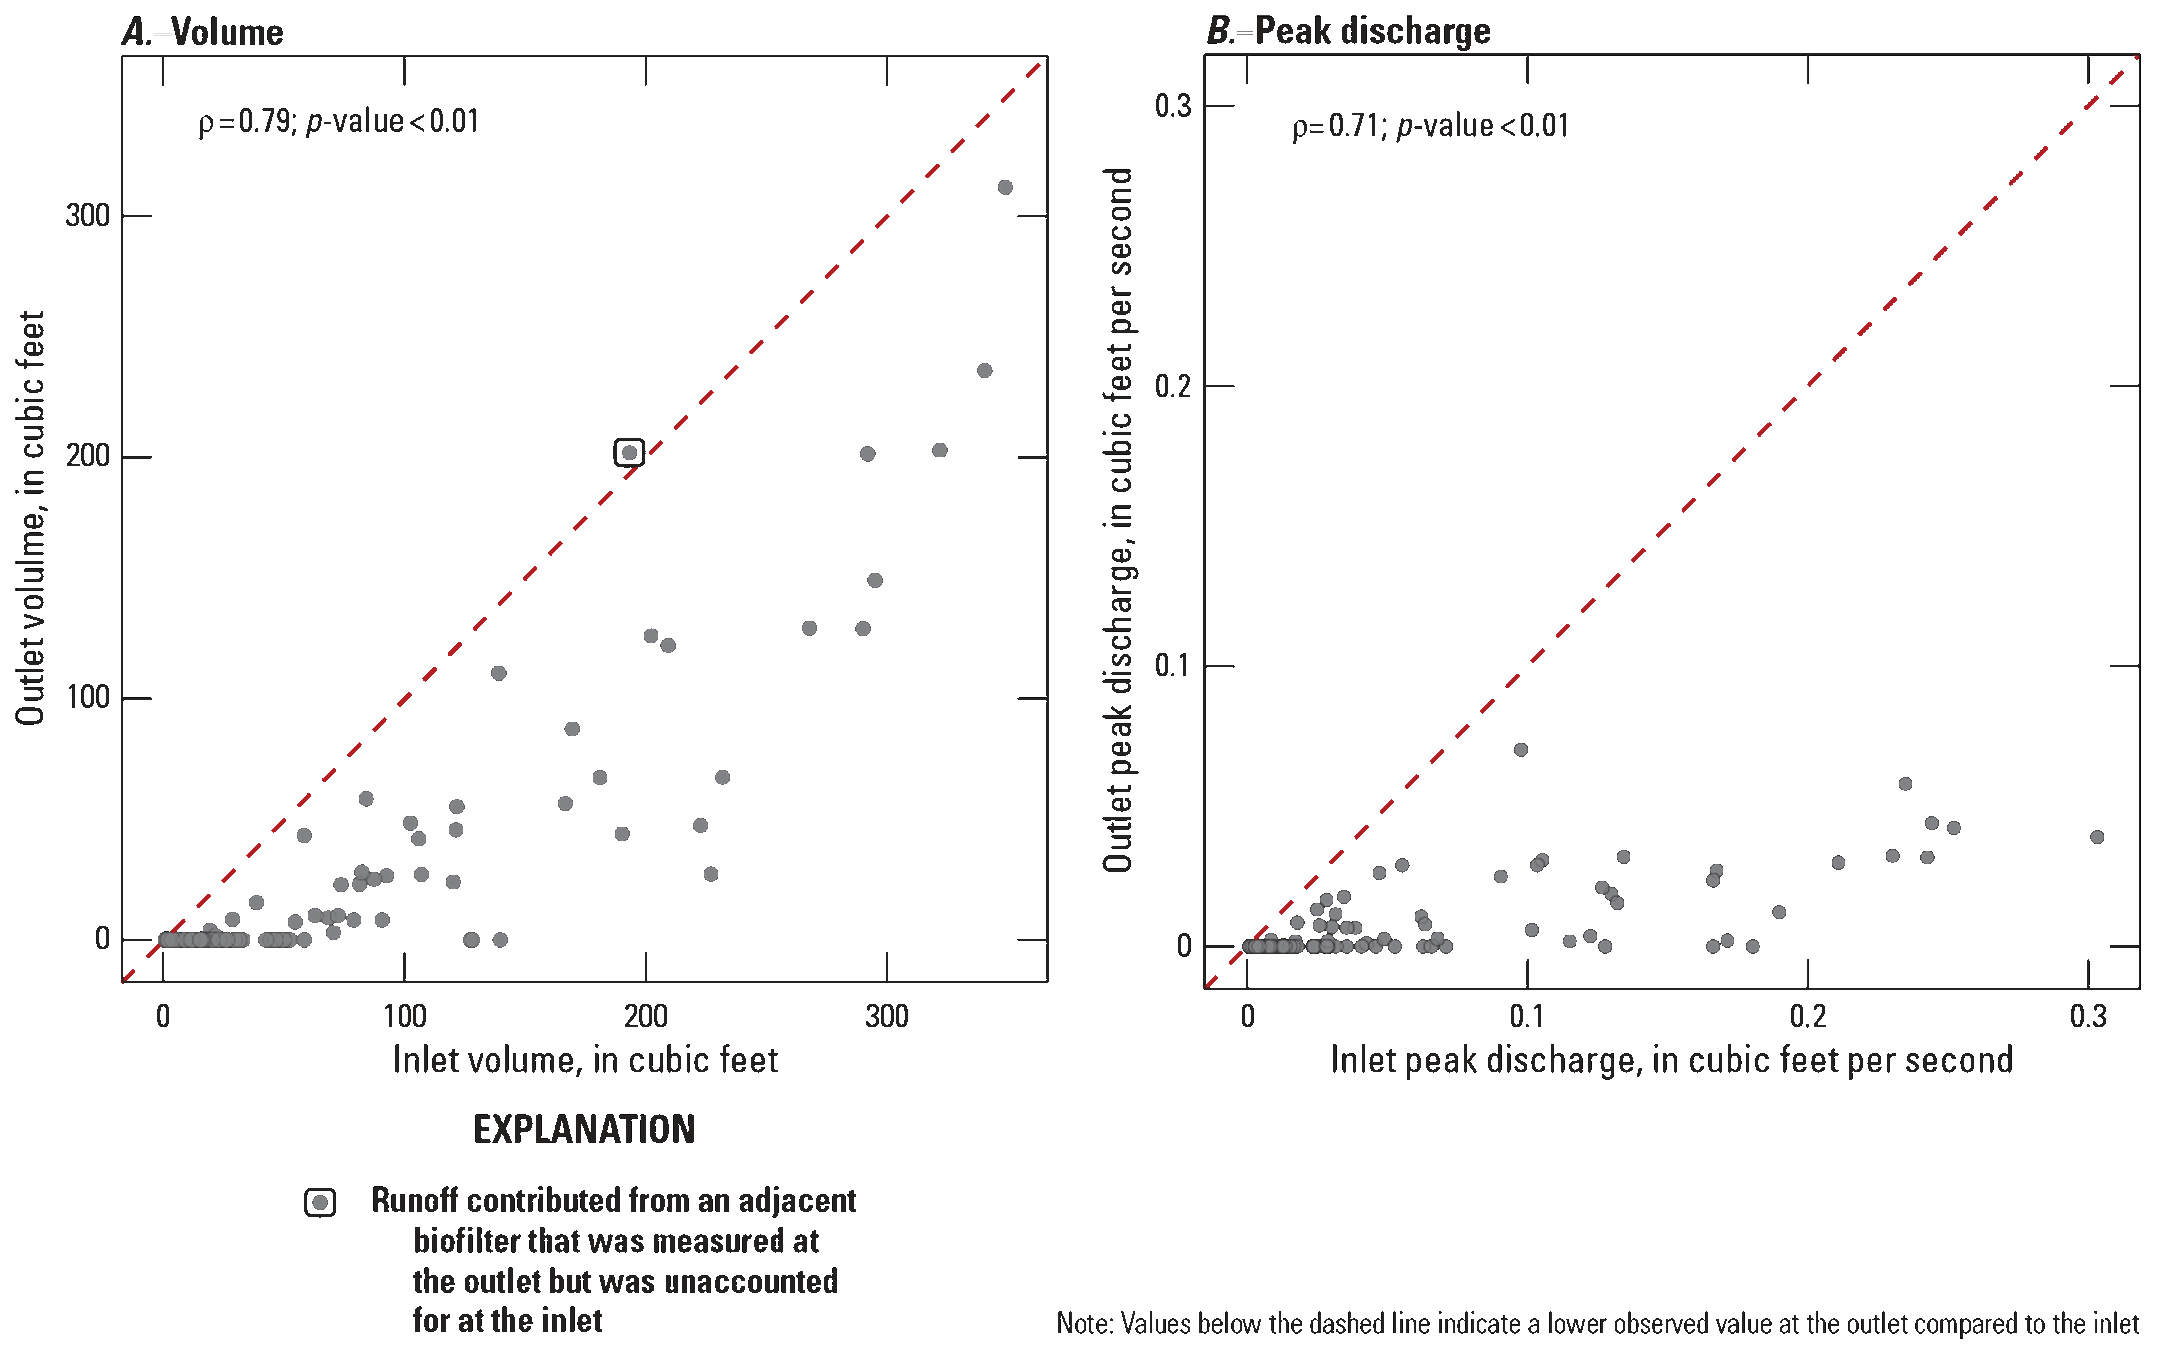
Comparison of 109 event runoff volumes and peak discharge observed at the inlet and outlet of a biofilter in Milwaukee, Wisconsin. A, Volume. B, Peak discharge. [ρ, Spearman’s correlation coefficient; p-value, probability value]
Table 3.
Summary statistics for runoff volume and peak discharge from 109 storm events measured at the inlet and outlet of a biofilter in Milwaukee, Wisconsin.[ft3, cubic foot; ft3/s, cubic foot per second; in/hr, inch per hour]
Like volume, the biofilter attenuated peak discharge passing through the inlet by storing and slowly releasing excess volume to the underdrain. The mean value of peak discharge at the outlet was 92 percent less (ranging from 28 percent to 100 percent) than the inlet across all 109 events (table 3). As expected, the magnitude of peak discharge at the outlet was positively correlated to volume and peak discharge at the inlet (ρ=0.78; p-value<0.01 and ρ=0.71; p-value<0.01, respectively). The buffering of peak discharge by the biofilter is evident by the relative consistency of values measured at the outlet compared to increasing values at the inlet (fig. 6).
These results highlight the biofilter's effectiveness in attenuating stormwater flows and underscore the hydrologic efficiency of biofilters as a green infrastructure practice. By capturing, slowing, and infiltrating runoff, biofilters help to mimic natural hydrologic processes in urban environments, contributing to improved watershed health and resilience against the effects of stormwater.
Comparison of Concentrations
The efficiency of GI is a measure of how well the system removes pollutants. It is a metric based on the outlet water quality rather than a percent reduction between inlet and outlet locations, which can be misleading (Strecker and others, 2001). For example, Trowsdale and Simcock (2011) observed a 95-percent reduction between the median concentration of total zinc observed at the inlet and outlet of a biofilter, yet outlet concentrations remained three times higher than published water-quality guidelines. Additionally, the pollution reduction performance of a biofilter may not consistently be achieved if the inlet concentration of a pollutant is so low that further reduction becomes unlikely (Strecker and others, 2001; Larm and Wahlsten, 2019). Therefore, a more holistic approach to describing the efficacy of a biofilter, or other infiltration-based GI practices, should include assessment of outlet water-quality concentrations.
Concentrations observed at the inlet and outlet of the biofilter are presented herein along with comparison to previous studies and published water-quality guidelines. EMCs for most of the measured pollutants were not normally distributed. Therefore, a comparison of medians, rather than means, was more representative of the central tendency.
Solids
The median inlet TSS concentration of 343 milligrams per liter (mg/L) (table 4) was far greater than what had been reported by Pitt and others (2018) for a composite of freeway and industrial sites across the Nation (74 mg/L; n=967). The high sediment load is likely a reflection of several factors including the age and poor condition of the road surface combined with high traffic use, remnants of residual sand applied during winter months for vehicular traction, and construction. Construction adjacent to the roadway that drained to the biofilter appeared to be a considerable contributor of sediment for a portion of the study period. Construction began in the spring 2024 and continued through the remainder of the study period, affecting 12 of the 19 paired samples collected as part of the study. The median concentration of TSS prior to construction was 19 mg/L compared to 453 mg/L after construction began.
Despite the high amount of solids transported from the road surface, the biofilter was able to significantly reduce TSS concentration by a factor of nearly 40 (fig. 7, table 4). Compared to other studies, the median TSS concentration of 9 mg/L observed at the outlet was nearly identical to a median of 10 mg/L reported from a composite of 685 samples from 41 other biofilter studies across the Nation (Clary and others, 2020; table 4). Of the 19 paired runoff events measured as part of this study, only two had outlet concentrations above the detection limit of 15 mg/L (Selbig and Romano, 2026).
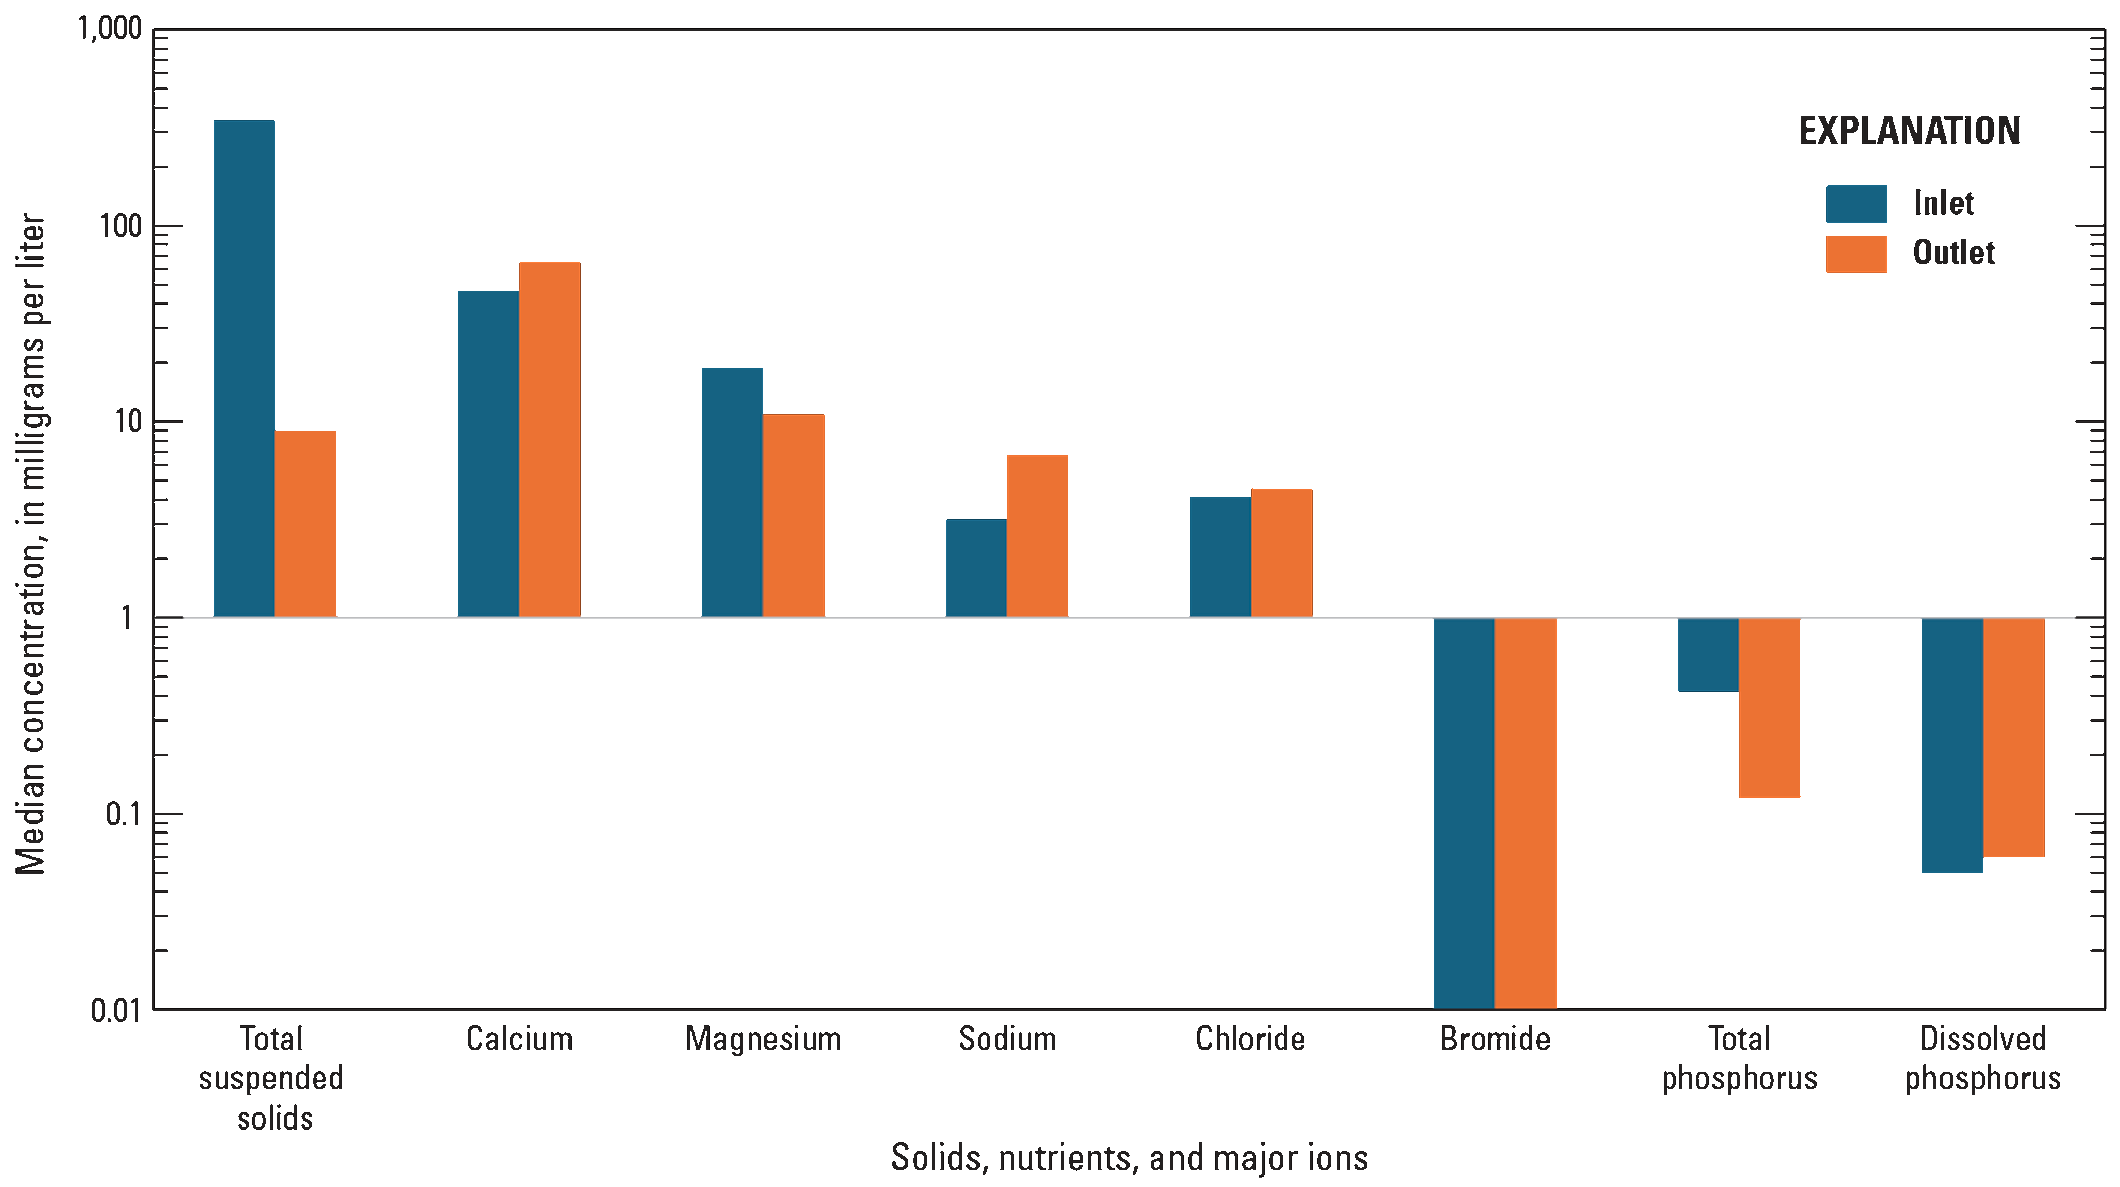
Median concentrations of solids, nutrients, and major ions observed at the inlet and outlet of a biofilter in Milwaukee, Wisconsin.
Nutrients
The median TP concentration of 0.42 mg/L originating from the road surface and observed at the inlet was more than double the median value of 0.19 mg/L reported by Clary and others (2020) but similar to values reported for residential streets with high overhead tree canopy during summer months where mean values ranged from 0.38 to 0.45 mg/L (Selbig, 2016). Conversely, the median concentration of TP at the outlet was one-half the value reported by Clary and others (2020) (table 4). Variation in concentrations of TP delivered to a biofilter could be due to differences in contributing land use, vegetation, seasonality, or other drainage area characteristics. Median concentrations of TP significantly decreased from 0.42 mg/L at the inlet of the biofilter to 0.12 mg/L at the outlet, suggesting effective phosphorus retention and removal mechanisms within the engineered soil (fig. 7, table 4). This reduction aligns with previous studies that have reported significant TP reductions in biofilters, such as Davis and others (2003), who observed a 65–85-percent reduction in TP in similar bioretention systems. Bratieres and others (2008) further suggest biofilters can remove more than 80 percent of TP, provided no organic matter is added to the filter media.
Table 4.
Summary statistics of 19 paired event mean concentrations for solids, nutrients, and major ions measured at the inlet and outlet of a biofilter in Milwaukee, Wisconsin.[All units in milligrams per liter; EPA, U.S. Environmental Protection Agency; Min, minimum; Max, maximum; COV, coefficient of variation; TSS, total suspended solids; --, no data; <, less than; na, not applicable; ↓, outlet is significantly less than the inlet (probability value [p-value] <0.05); Ca, calcium; ↑, outlet is significantly greater than the inlet (p-value<0.05); Mg, magnesium; Na, sodium; Br, bromide; X, outlet is not significantly different than the inlet (p-value<0.05); TP, total phosphorus; DP, dissolved phosphorus]
| Pollutant | EPA Aquatic Life Criteriaa | Location | Min | Max | Mean | Median | Change | COV | Clary and others (2020) | |
|---|---|---|---|---|---|---|---|---|---|---|
| Chronic | Acute | |||||||||
| TSS | -- | -- | Inlet | <15 | 1,332 | 286 | 343 | na | 1.0 | 44 |
| Outlet | <15 | 25 | 7.5 | 9 | ↓ | 0.5 | 10 | |||
| Ca | -- | -- | Inlet | 4.36 | 169.60 | 39.08 | 46.49 | na | 0.88 | -- |
| Outlet | 28.41 | 125.10 | 63.73 | 65.23 | ↑ | 0.37 | -- | |||
| Mg | -- | -- | Inlet | 1.70 | 61.23 | 16.44 | 18.77 | na | 0.84 | -- |
| Outlet | 4.53 | 29.89 | 10.03 | 10.90 | ↓ | 0.53 | -- | |||
| Na | -- | -- | Inlet | 0.50 | 30.36 | 1.18 | 3.18 | na | 2.11 | -- |
| Outlet | 1.11 | 31.07 | 3.28 | 6.76 | ↑ | 1.12 | -- | |||
| Br | -- | -- | Inlet | <0.01 | 0.03 | <0.01 | <0.01 | na | 0.80 | -- |
| Outlet | <0.01 | 0.02 | <0.01 | <0.01 | X | 0.44 | -- | |||
| Chloride | 230 | 860 | Inlet | 0.57 | 40.00 | 1.52 | 4.11 | na | 2.15 | -- |
| Outlet | 0.51 | 15.87 | 2.82 | 4.55 | X | 0.94 | -- | |||
| TP | 0.075b | -- | Inlet | 0.07 | 1.16 | 0.37 | 0.42 | na | 0.72 | 0.19 |
| Outlet | 0.06 | 0.19 | 0.12 | 0.12 | ↓ | 0.30 | 0.24 | |||
| DP | -- | -- | Inlet | 0.02 | 0.10 | 0.04 | 0.05 | na | 0.47 | 0.13 |
| Outlet | 0.04 | 0.16 | 0.05 | 0.06 | ↑ | 0.45 | 0.35 | |||
| pH | -- | -- | Inlet | 7.11 | 8.61 | 7.93 | 7.80 | na | 0.06 | -- |
| Outlet | 7.34 | 8.42 | 7.86 | 7.87 | X | 0.03 | -- | |||
Wisconsin numeric criteria for streams (Wisconsin Department of Natural Resources, 2025a).
Concentrations of DP at the outlet were significantly higher than the inlet indicating a shift in phosphorus speciation resulting in export despite median values only showing a slight increase from 0.05 mg/L at the inlet to 0.06 mg/L (fig. 7, table 4). Phosphorus was primarily in the particulate phase at the inlet, with DP averaging only 19 percent of TP. Phosphorus was mainly in the dissolved phase at the outlet, with DP averaging 55 percent of TP. This trend has been noted in other studies where bioretention systems were found to leach DP under certain conditions, particularly when compost or other organic-rich media were used and duration of saturation times increased (Hurley and others, 2017). Potential causes of elevated DP concentrations at the outlet include mineralization of organic matter, phosphorus desorption from soil particles under saturated or anaerobic conditions, or leaching from phosphorus-rich soil amendments (Hatt and others, 2009). These findings underscore the importance of carefully selecting soils that contain enough organic matter to promote vegetation growth while limiting the amount of phosphorus available for leaching, especially in areas where phosphorus is a pollutant of concern. Further research is needed to better understand the biogeochemical processes that may differentially affect TP and DP removal in GI.
Major Ions
Median concentrations of calcium (Ca), magnesium (Mg), sodium (Na), and chloride varied between the inlet and outlet of the biofilter, indicating different geochemical and transport processes (fig. 7). Ca significantly increased from 46.49 mg/L at the inlet to 65.23 mg/L at the outlet, suggesting leaching or dissolution of calcium-bearing minerals commonly associated with aggregates used in the construction of asphalt roads as well as within the engineered soils (table 4). In contrast, Mg significantly decreased from 18.77 mg/L to 10.90 mg/L, which may reflect adsorption or precipitation processes (Khudair and others, 2024). Median Na concentrations more than doubled, increasing from 3.18 mg/L at the inlet to 6.76 mg/L at the outlet, possibly owing to ion exchange processes and the release of Na from soil amendments. Median concentrations of chloride remained relatively stable, with a slight increase from 4.11 mg/L to 4.55 mg/L, indicating limited retention or transformation within the system. However, statistical comparison of inlet and outlet concentrations showed chloride to be significantly greater at the outlet than the inlet, which is evidenced by mean concentrations that were nearly twice as high at the outlet, although still well below chronic and acute thresholds (table 4). These shifts suggest that although the system may attenuate some ions, it may also contribute to increases in others through subsurface geochemical interactions.
Metals
Total metals include particulate-bound and dissolved fractions. Except for aluminum (Al), cadmium, iron (Fe), and lead (Pb), all metal concentrations observed at the inlet were below U.S. Environmental Protection Agency chronic or acute water-quality thresholds for aquatic life (U.S. Environmental Protection Agency, 2026) (table 5). Concentrations of total Pb consistently exceeded the chronic threshold of 2.5 micrograms per liter (µg/L) and twice exceeded the acute threshold of 65 µg/L. Similarly, total Fe frequently exceeded chronic thresholds in 15 of the 19 runoff events, and total Al exceeded acute thresholds in 9 events. Of these, only total Fe had a single EMC exceed the chronic threshold at the outlet. The Wilcoxon signed-rank test confirmed significant reductions for total metals at the outlet except for arsenic (As), which showed no statistical difference from the inlet and only a minor increase between median and mean values (fig. 8, table 5). Median concentrations at the outlet were comparable to those reported by Clary and others (2020) despite having appreciably higher inlet concentrations (table 5). In general, median concentrations of particulate and dissolved metals for the contributing roadway in Milwaukee were within the range of values reported elsewhere across the country (Kayhanian and others, 2007; Flanagan and others, 2018; Clary and others, 2020). Variation in characteristics of roadway runoff, when directly generated from transportation activities, may be due to historic anthropogenic factors (for example, leaded gasoline), surrounding land use, or other environmental conditions.
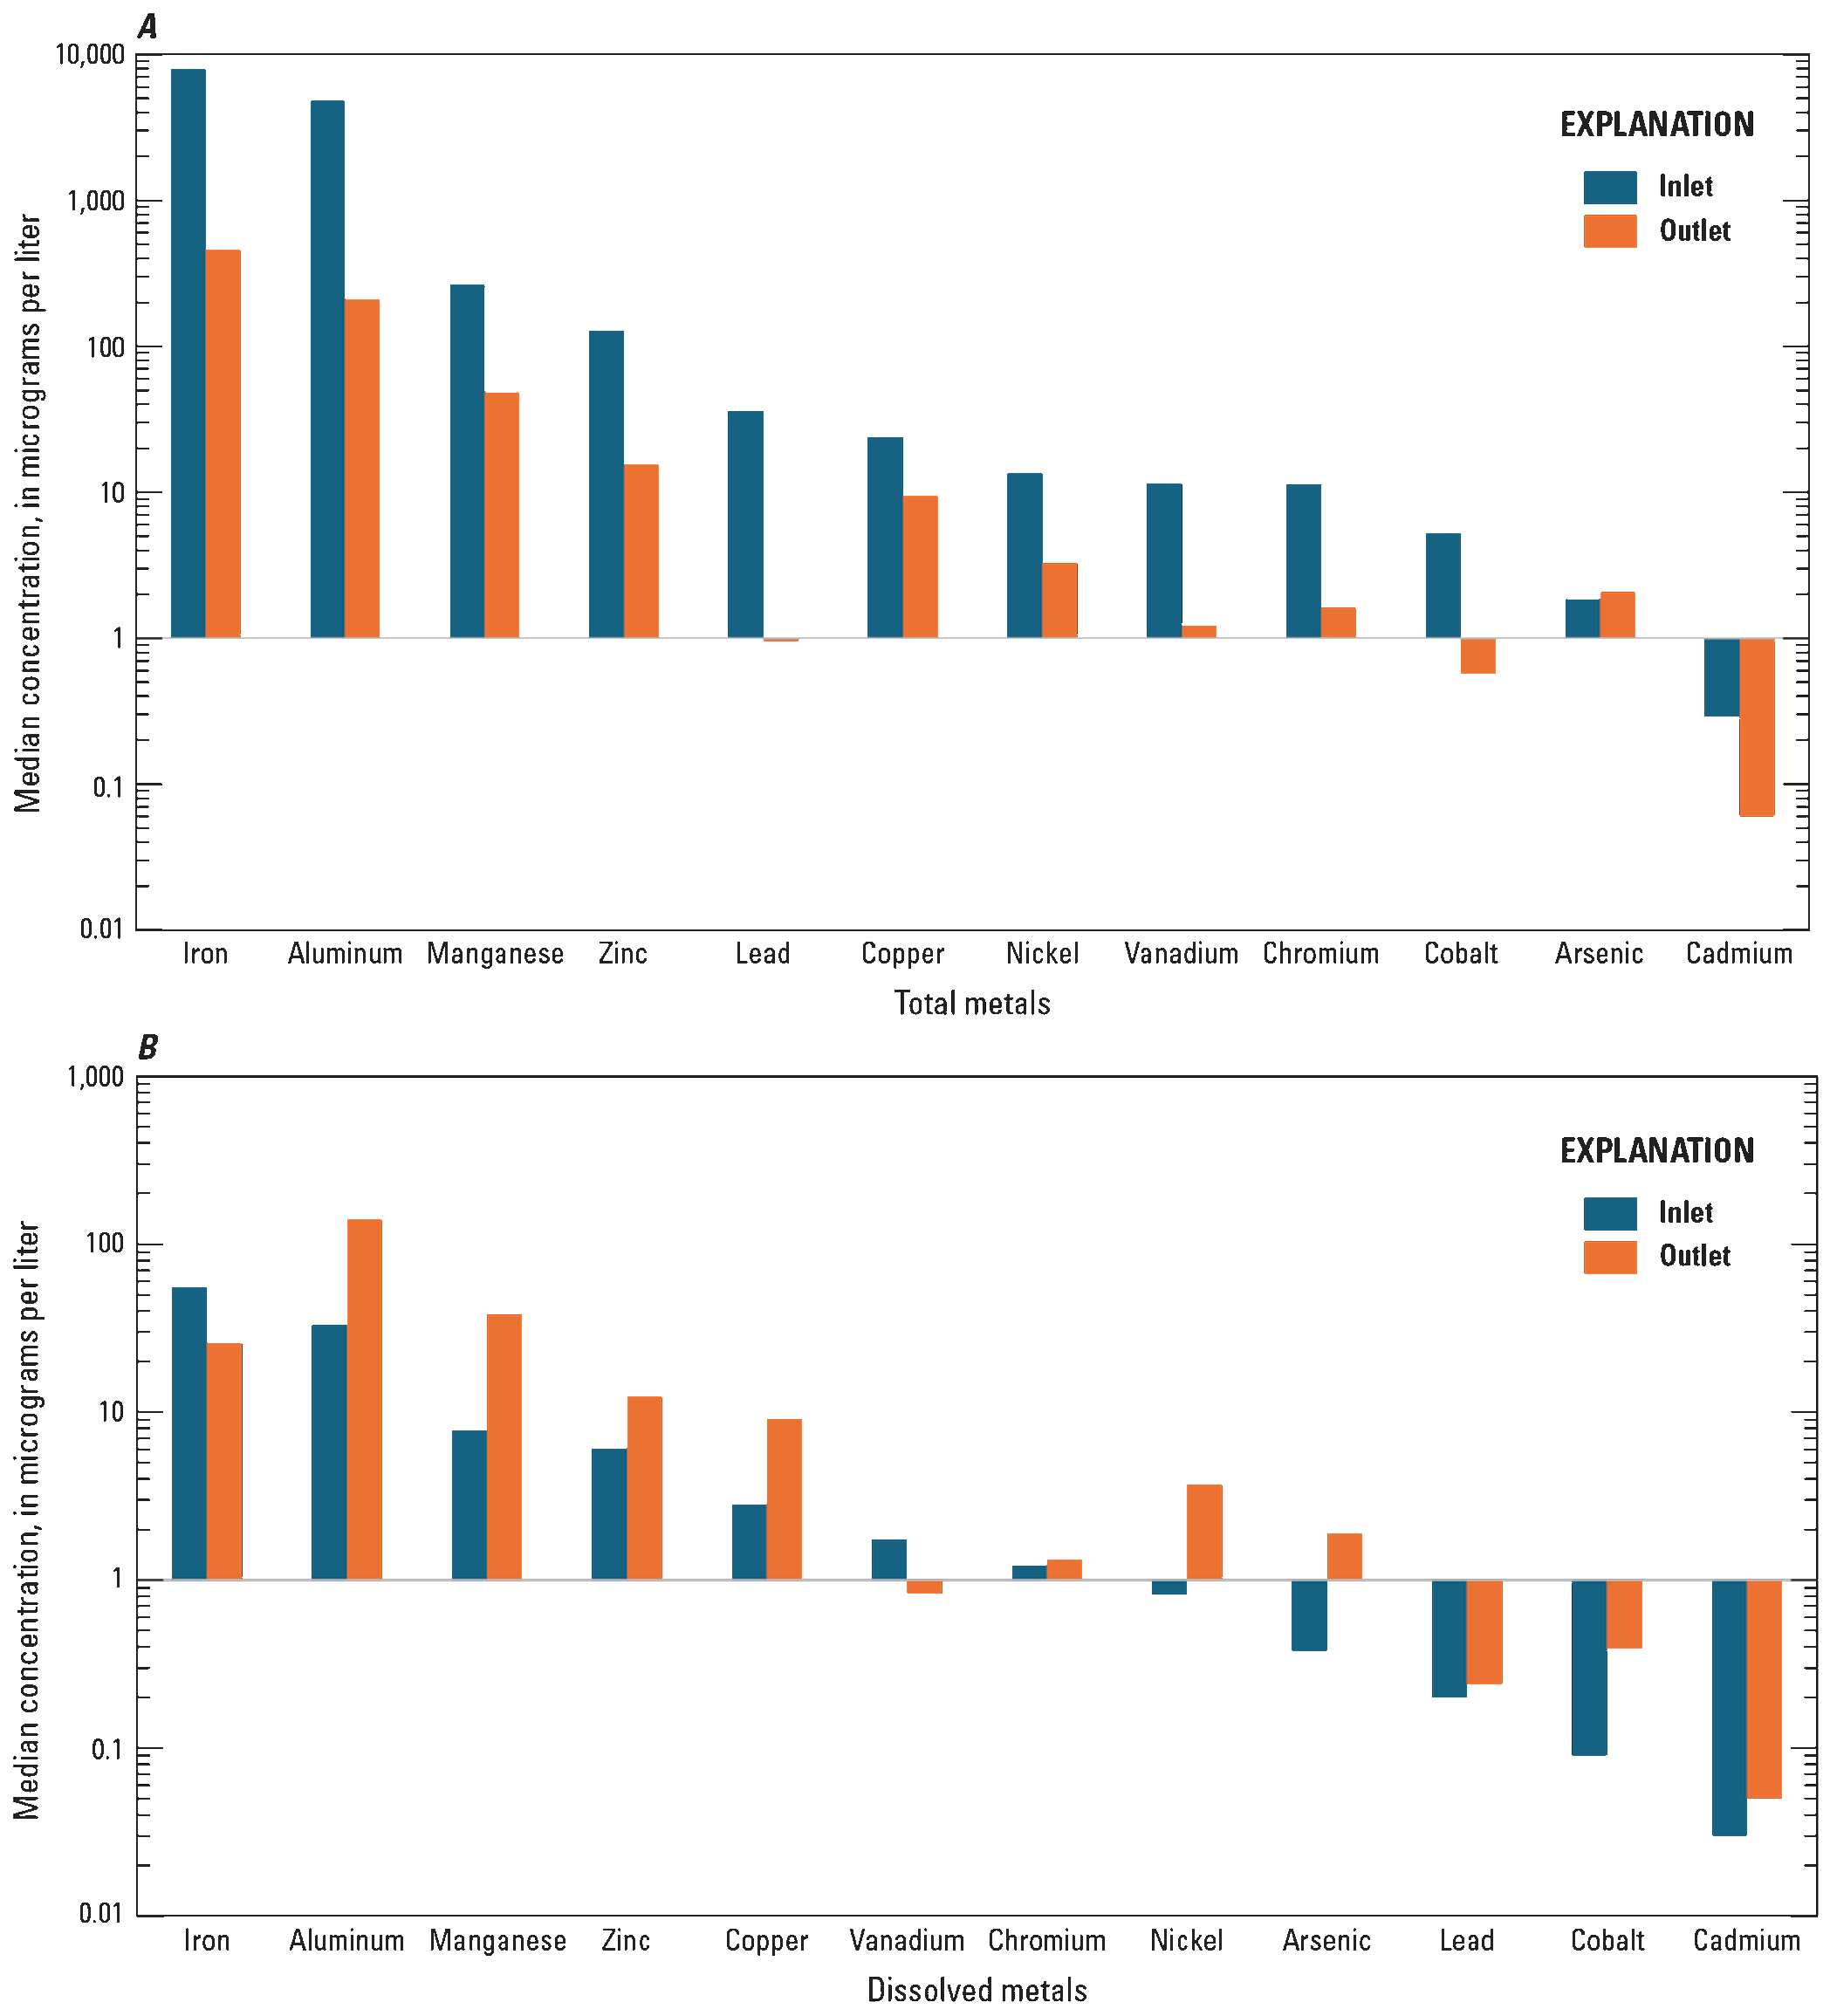
Median concentrations of total and dissolved metals observed at the inlet and outlet of a biofilter in Milwaukee, Wisconsin. Values are sorted by decreasing inlet concentrations.
Table 5.
Summary statistics of event mean concentrations for select metals measured at the inlet and outlet of a biofilter in Milwaukee, Wisconsin.[all units in micrograms per liter; EPA, U.S. Environmental Protection Agency; Min, minimum; Max, maximum; COV, coefficient of variation; Al, aluminum; na, not applicable; --, no data; ↓, outlet is significantly less than the inlet (probability value [p-value] <0.05); Cd, cadmium; <, less than; ↑, outlet is significantly greater than the inlet (p-value<0.05); Cr, chromium; X, outlet is not significantly different than the inlet (p-value<0.05); Co, cobalt; Cu, copper; Fe, iron; Pb, lead; Mn, manganese; Ni, nickel; V, vanadium; Zn, zinc; As, arsenic]
| Pollutant | EPA Aquatic Life Criteriaa | Location | Total | Dissolved | |||||||||||||
|---|---|---|---|---|---|---|---|---|---|---|---|---|---|---|---|---|---|
| Chronic | Acute | Min | Max | Mean | Median | Change | COV | Clary and others (2020) | Min | Max | Mean | Median | Change | COV | Clary and others (2020) | ||
| Al | 0.63–3,200 | 1–4,800 | Inlet | 113.85 | 14,572.61 | 4,463.71 | 4,830.95 | na | 0.92 | -- | 9.13 | 217.71 | 48.31 | 55.48 | na | 0.88 | -- |
| Outlet | 35.43 | 458.21 | 167.22 | 211.17 | ↓ | 0.77 | -- | 5.55 | 59.07 | 19.12 | 25.92 | ↓ | 0.57 | -- | |||
| Cd | 0.72 | 1.80 | Inlet | <0.03 | 0.87 | 0.29 | 0.29 | na | 0.77 | 0.13 | <0.03 | 0.10 | <0.03 | <0.03 | na | 0.83 | 0.03 |
| Outlet | 0.03 | 0.12 | 0.06 | 0.06 | ↓ | 0.37 | 0.08 | <0.03 | 0.11 | 0.05 | 0.05 | ↑ | 0.44 | 0.07 | |||
| Crb | -- | -- | Inlet | 1.71 | 36.01 | 10.18 | 11.33 | na | 0.81 | 4.00 | <0.05 | 4.08 | 1.09 | 1.22 | na | 1.01 | 0.61 |
| Outlet | 0.75 | 3.34 | 1.41 | 1.61 | ↓ | 0.43 | 0.74 | 0.72 | 3.71 | 0.94 | 1.32 | X | 0.62 | 0.46 | |||
| Co | -- | -- | Inlet | 0.15 | 18.38 | 4.90 | 5.25 | na | 0.93 | -- | <0.03 | 0.16 | 0.09 | 0.09 | na | 0.45 | -- |
| Outlet | 0.16 | 1.85 | 0.42 | 0.57 | ↓ | 0.87 | -- | 0.10 | 1.71 | 0.19 | 0.39 | ↑ | 1.18 | -- | |||
| Cu | --c | --c | Inlet | 3.78 | 57.37 | 23.83 | 23.79 | na | 0.66 | 13.1 | <0.40 | 5.30 | 2.69 | 2.81 | na | 0.42 | 6.85 |
| Outlet | 2.83 | 14.38 | 8.92 | 9.46 | ↓ | 0.30 | 7.13 | 2.70 | 15.92 | 8.84 | 9.10 | ↑ | 0.36 | 7.54 | |||
| Fe | 1,000 | -- | Inlet | 248.00 | 27,410.00 | 7,724.00 | 7,989.74 | na | 0.91 | 556 | 8.9 | 74.4 | 28.3 | 33.0 | na | 0.51 | -- |
| Outlet | 102.80 | 1283.00 | 448.30 | 457.05 | ↓ | 0.67 | 595 | 43.7 | 555.0 | 88.8 | 140.8 | ↑ | 1.00 | -- | |||
| Pb | 2.5 | 65 | Inlet | 2.58 | 91.71 | 36.02 | 35.91 | na | 0.72 | 5.70 | 0.07 | 0.44 | 0.20 | 0.20 | na | 0.42 | 0.09 |
| Outlet | 0.19 | 2.00 | 0.97 | 0.95 | ↓ | 0.56 | 0.93 | 0.10 | 0.40 | 0.23 | 0.24 | ↑ | 0.33 | 0.07 | |||
| Mn | -- | -- | Inlet | 8.07 | 923.19 | 236.25 | 265.26 | na | 0.92 | -- | 1.35 | 19.20 | 7.43 | 7.76 | na | 0.66 | -- |
| Outlet | 6.02 | 218.54 | 27.05 | 48.35 | ↓ | 1.31 | -- | 1.13 | 202.20 | 15.31 | 38.14 | ↑ | 1.61 | -- | |||
| Ni | 52 | 470 | Inlet | 0.72 | 43.63 | 13.93 | 13.51 | na | 0.90 | 4.20 | 0.34 | 3.34 | 0.56 | 0.82 | na | 1.09 | -- |
| Outlet | 1.37 | 4.79 | 3.04 | 3.26 | ↓ | 0.27 | 2.80 | 1.46 | 17.65 | 2.90 | 3.70 | ↑ | 0.94 | -- | |||
| V | 120d | -- | Inlet | 0.91 | 41.90 | 10.15 | 11.51 | na | 0.97 | -- | 0.29 | 5.66 | 1.03 | 1.74 | na | 0.84 | -- |
| Outlet | 0.66 | 1.88 | 1.24 | 1.22 | ↓ | 0.21 | -- | 0.59 | 1.18 | 0.84 | 0.83 | ↓ | 0.16 | -- | |||
| Zn | 120 | 120 | Inlet | 24.10 | 363.28 | 115.03 | 127.13 | na | 0.68 | 62.0 | <2.0 | 21.44 | 2.54 | 6.05 | na | 1.06 | 20.8 |
| Outlet | 8.39 | 27.76 | 14.35 | 15.50 | ↓ | 0.33 | 12.8 | 6.06 | 25.43 | 11.31 | 12.40 | ↑ | 0.40 | 12.5 | |||
| As | 150 | 340 | Inlet | 0.10 | 6.21 | 1.85 | 1.85 | na | 0.86 | 1.31 | <0.01 | 1.09 | 0.33 | 0.38 | na | 0.76 | -- |
| Outlet | 1.37 | 3.11 | 1.93 | 2.06 | X | 0.28 | 1.60 | 1.13 | 3.04 | 1.88 | 1.90 | ↑ | 0.26 | -- | |||
Engineered soils typically associated with biofilters are known to be efficient at removing the particulate-bound portion of heavy metals, which are often associated with TSS (Davis and others, 2003; Trowsdale and Simcock, 2011). Although not tested as part of this study, most of the removal of particulate metals has been shown to occur within the top 25 centimeters of biofilter media (Sharma and Malaviya, 2021). When sampling only the top 5 centimeters of soil in 21 different biofilters, Adhikari and others (2023) showed concentrations of metals in soil near the inlet to be much higher than soil in an area that does not often get exposed to stormwater runoff. They also determined metals accumulation in soils was not related to age but rather to the amount of organic matter and loading rate. Additional metal sequestration may come from vegetation within the biofilter though Sharma and Malaviya (2021) suggest limited uptake (1–3 percent) of metals bound within the substrate. Reductions in particulate metals concentration, in some cases by more than an order of magnitude, support soil-based biofilter media as an effective way to remove the particulate fraction of heavy metals (table 5).
In contrast, the biofilter was unable to reduce metals in the dissolved phase. Median concentrations for nearly all dissolved metals were greater at the outlet than the inlet (fig. 8, table 5). Al and vanadium were the only metals that did not follow this pattern, showing modest but significant decreases at the outlet. This pattern was replicated in similar studies reported by Clary and others (2020), suggesting biofilters are often less effective at removing the dissolved fraction of metals, which are more mobile and less likely to be captured by physical processes. The removal of dissolved metals relies primarily on chemical processes such as adsorption and reduction-oxidation dynamics (redox). These processes are highly dependent on factors like pH, organic matter content, and the cation exchange capacity of the filter media (Sharma and Malaviya, 2021; Xin and others, 2025). For instance, metals such as copper (Cu) and zinc can adsorb to negatively charged mineral or organic surfaces, but this is often limited under acidic or low-ionic-strength conditions typical of urban runoff (Sansalone and Buchberger, 1997). Additionally, if organic matter in the biofilter becomes saturated or begins to degrade, it may release complexed metals back into solution, reducing net removal efficiency. Anthropogenic factors can also contribute to mobilization of dissolved metals, such as changes in ion exchange owing to application of deicing agents during winter months. Galella and others (2023) determined increased chloride concentrations associated with various road salt formulations had profound effects on metals mobilization in infiltration-based GI. Similarly, Mullins and others (2020) determined that road salt application in the winter was shown to increase Pb and Cu concentrations at the outlet of an infiltration trench. Thus, although biofilters are effective at removing total metals via physical trapping, optimizing the soil mixtures used in biofilters and limiting the introduction of deicing materials are essential for targeting dissolved metal fractions effectively.
Other anthropogenic factors contributing to export of metals may include historical land use practices. In a review of historical site operations to delineate and identify potential soil and groundwater effects around the study area, investigators noted the presence of refinery operations and rail yards dating back to 1910 (Tory Kress, City of Milwaukee, written commun., 2026). Although the primary concern for potential contamination was volatile organic compounds and polycyclic aromatic hydrocarbons, investigators also tested for the presence of As. Results of a grab sample of groundwater that pooled near the surface of an open excavation pit revealed dissolved As concentration of 2.7 µg/L, which is higher than the preventive action limit of 1 µg/L (Wisconsin Department of Natural Resources, 2025b). Excavated soil during construction of the site was not repurposed as part of the soil media in the biofilter. The friable topsoil, constituting 80 percent of the biofilter media, was most likely sourced from a nearby “clean” construction site (Jay Karls, Ramboll, written commun., 2024). Considering As concentrations of soils in the Milwaukee region are generally higher than other parts of Wisconsin (Stensvold, 2012), it is likely that soils used in the biofilter had background levels of As that contributed to elevated values observed at the outlet.
Comparison of Loads
Calculated loads can be evaluated on an event-by-event basis to better understand the dynamic relation among event-based hydrology, pollutant transport mechanisms, and changing climate characteristics, or evaluated cumulatively to dampen interevent variability and offer insight into the overall pollution reduction. Performance results presented herein represent the percent change between the sum of the 19 paired inlet and outlet pollutant loads. Individual, event-based performance metrics are available in Selbig and Romano (2026).
Solids, Nutrients, and Major Ions
The percent change between the cumulative pollutant load for TSS, TP, DP, and major ions measured at the inlet and outlet, where positive values indicate removal and negative values indicate export, are summarized in table 6. Individual event-based results are presented in figure 9. The biofilter was highly effective at removing TSS and TP, with reductions of 99 percent and 86 percent, respectively. These high removal efficiencies are consistent with previous studies showing that biofilters efficiently removed particulate-bound pollutants through sedimentation and filtration (Davis and others, 2003; Hatt and others, 2009; Trowsdale and Simcock, 2011). There were no events that had a higher load of TSS leaving the biofilter than entering (fig. 9). DP similarly showed an overall decrease in load at the outlet despite having concentrations that were significantly greater than the inlet (table 4). Because runoff volume at the outlet was much lower than the inlet, an overall reduction in DP load was observed but at a much lower percentage (24 percent) compared to TP (86 percent). Retention of DP can be a common limitation of biofilters. The most common cause of phosphorus release is from organic-rich compost in the soil media (Hatt and others, 2007; Hurley and others, 2017).
Compost is often necessary to provide a source of nutrients for vegetation. As a result, biofilters that use excess amounts of compost relative to sand or other additives can become a source rather than a sink for DP. Only 5 percent of the soil media used in the biofilter was classified as compost, which is considerably less than the suggested amount of 15–30 percent compost specified by the State of Wisconsin (Wisconsin Department of Natural Resources, 2025c). Such a low percentage of compost should limit the amount of nutrients available for leaching into runoff that may exfiltrate from the biofilter but not eliminate it completely. The source of compost (for example, yard waste or food residue) could also influence DP release rates (Erickson and others, 2022).
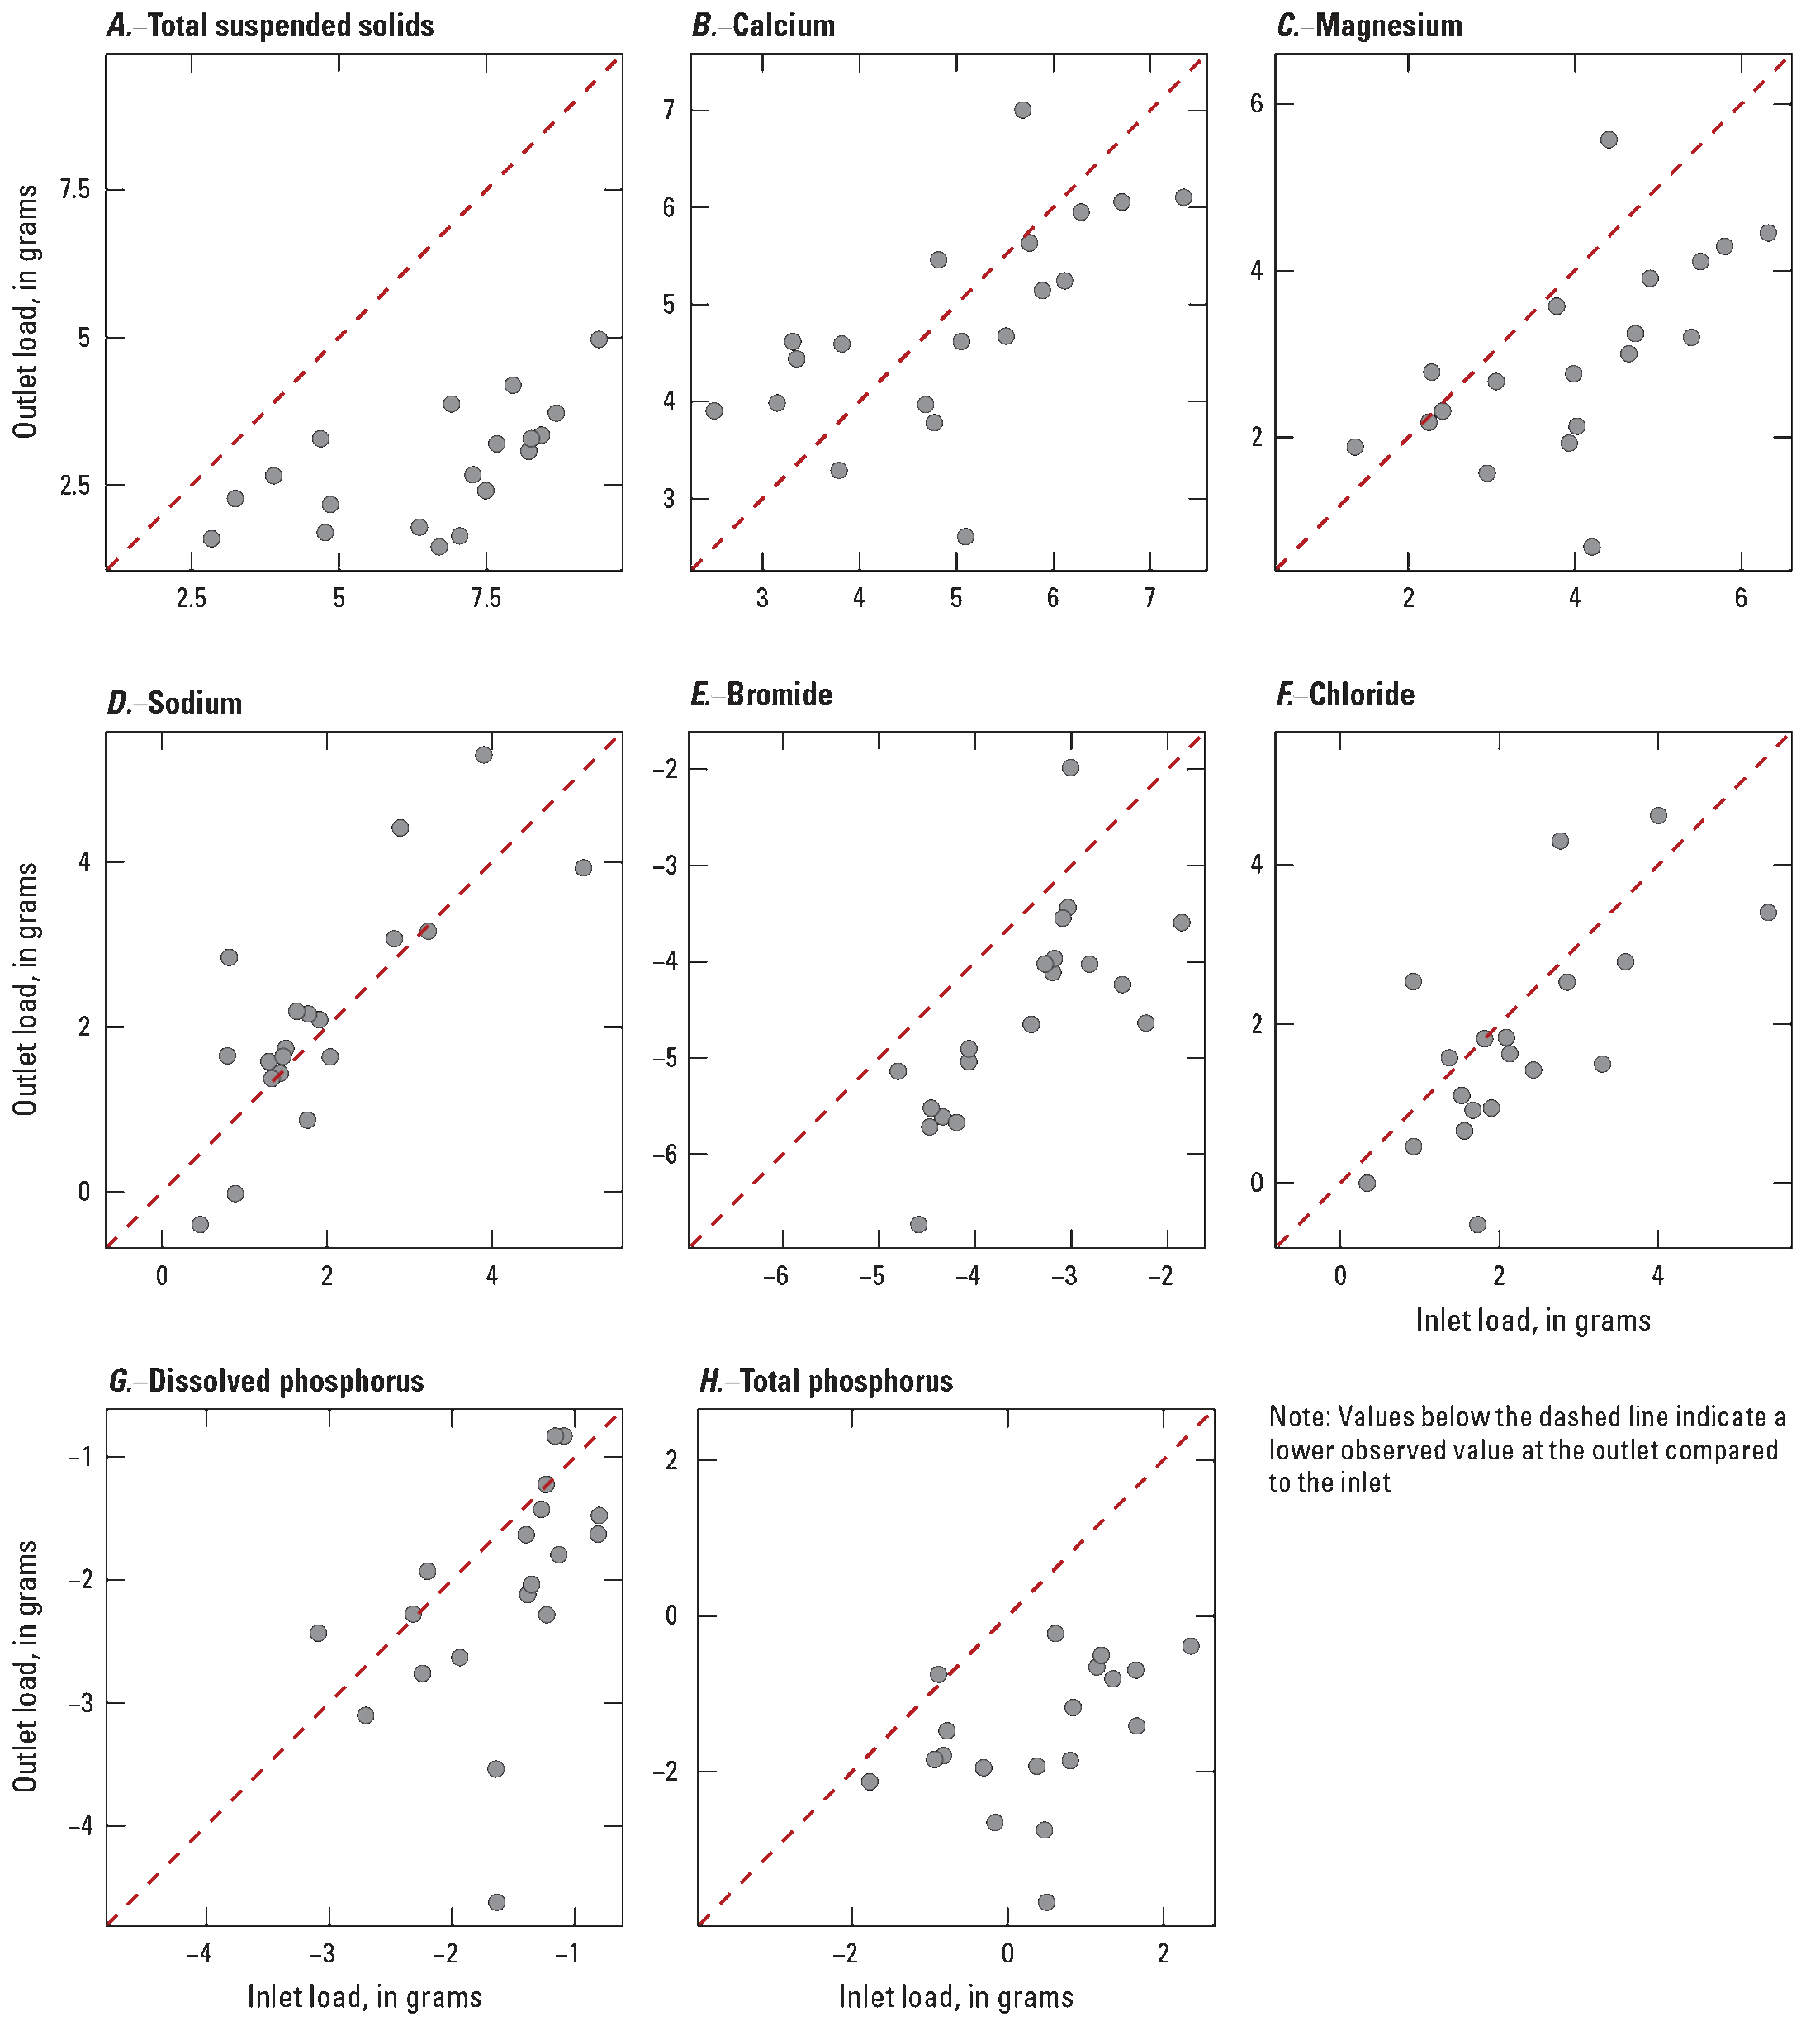
Comparison of natural log-transformed computed loads for solids, major ions, and nutrients measured at the inlet and outlet of a biofilter in Milwaukee, Wisconsin. A, Total suspended solids. B, Calcium. C, Magnesium. D, Sodium. E, Bromide. F, Chloride. G, Dissolved phosphorus. H, Total phosphorus.
Table 6.
Removal efficiency based on the cumulative load of 19 paired events for select solids, major ions, nutrients, and metals at the inlet and outlet of a biofilter in Milwaukee, Wisconsin.[All values rounded to the nearest whole number except for dissolved cadmium; TSS, total suspended solids; TP, total phosphorus; DP, dissolved phosphorus; Ca, calcium; Mg, magnesium; Na, sodium; Br, bromide; <, less than; Al, aluminum; Cd, cadmium, Cr, chromium; Co, cobalt; Cu, copper; Fe, iron; Pb, lead; Mn, manganese; Ni, nickel; V, vanadium; Zn, zinc; As, arsenic]
An additional source of nutrients may have been friable topsoil used as part of the soil mixture in the biofilter (80 percent). Friable topsoil is generally rich in organic matter making it ideal for plant growth but also a potential source of leachable DP. In a study of 10 mesocosms containing different mixtures of soil media, Erickson and others (2014, 2022) showed the amount of DP released from soil increases with increasing percentages of compost, regardless of type. They also note replacing phosphate-rich compost with select additives, such as iron filings, can result in net DP capture instead of release. However, when subjected to high concentrations of Na (related to road salt application during winter months), mesocosms with select types of compost increased export of DP by a factor of two. Results from these studies suggest road salt application in the Milwaukee metropolitan area may have played a role in reduced capture and retention of DP in the monitored biofilter. Na was the only major ion with net export, as indicated by a negative percentage change (table 6). Despite having a higher median and mean value of Na at the outlet compared to the inlet, results of the Wilcoxon signed-rank test showed no statistical difference between the two sampling locations (table 7). A lack of significant difference between the inlet and outlet is likely due to the seasonal nature of road salt application. The two highest Na loads for events measured at the inlet occurred in March (Selbig and Romano, 2026), which is a period when early spring rain can combine with snowmelt to produce high Na and chloride concentrations in stormwater runoff. The outlet from these two events created more than one-half of the total cumulative Na load measured from the biofilter.
Even with an overall increase in Na load at the outlet, chloride load decreased by 24 percent (table 6), though differences between the inlet and outlet were not statistically significant (p-value=0.21). Biofilter soils rich in organic matter or clay minerals can undergo cation exchange reactions. In these reactions, Na ions are released from soil exchange sites in response to the introduction of other cations, such as Ca and Mg in stormwater. Both Ca and Mg were observed in abundance at the inlet; however, only Mg showed decreasing concentrations at the outlet, whereas Ca, like Na, increased (table 4, fig. 7). Cation displacement can therefore effectively increase Na in biofilter effluent even if input from the stormwater itself is low (Roy-Poirier and others, 2010). Seasonal factors may have also contributed to the timing of Na displacement. Concentrations of Na may have accumulated in the biofilter soils during winter road salt application and subsequently flushed later in spring resulting in concentrated pulses of Na during snowmelt or early rainfall events. Chloride, being a more conservative analyte, may have already passed through or been diluted by the time Na was released. For example, an early spring snowmelt event on April 1, 2024, resulted in high export of Na and chloride (−359 percent and −365 percent, respectively) (Selbig and Romano, 2026). The next sampled rainfall event on May 7, 2024, resulted in modest reduction in chloride (55 percent) but only minor reduction in Na (7 percent). There were seven runoff events between April 1 and May 7, 2024, that were not sampled that may have contributed to accelerated flushing of chloride relative to Na.
Table 7.
Summary statistics of calculated loads for solids, nutrients, and major ions measured at the inlet and outlet of a biofilter in Milwaukee, Wisconsin.[All units in grams; Min, minimum; Max, maximum; COV, coefficient of variation; TSS, total suspended solids; na, not applicable; ↓, outlet is significantly less than the inlet (probability value [p-value] less than 0.05); Ca, calcium; X, outlet is not significantly different than the inlet (p-value less than 0.05); Mg, magnesium; Na, sodium; Br, bromide; TP, total phosphorus; DP, dissolved phosphorus]
Metals
The biofilter demonstrated strong removal of the particulate fraction for most metals. Of the 12 metals tested, the particulate form of As had the lowest, but still positive, load reduction at 43 percent, whereas all other metals exceeded 80-percent reduction (table 6). A combination of lower concentrations at the outlet coupled with lower effluent volumes resulted in loads that were statistically less than the inlet for all measured particulate metals (table 8, fig. 10). In contrast, dissolved metal removal was more variable, with some metals showing significant export from the system (fig. 11). For example, cobalt, Fe, manganese (Mn), nickel, and As all showed negative percent change greater than 100 percent, indicating that the biofilter was a likely source of these metals rather than a sink (table 6). Cadmium, Cu, and zinc also had negative percent change but to a lesser degree. Export of metals could potentially be due to saturation of adsorption sites or complexation with dissolved organic carbon that increases mobility; however, dissolved organic carbon was not measured as part of this study to substantiate this claim. Al, chromium, Pb, and vanadium had positive percent change, indicating overall capture of these dissolved metals. The largest export of dissolved metals was Mn (−330 percent). Export of dissolved metals from the biofilter can occur owing to desorption from soil media under changing redox or pH conditions or from the dissolution of previously retained particulate-bound metals (Davis and others, 2003; Adhikari and others, 2023). Metals like Fe and Mn are particularly redox sensitive and may dissolve under reducing conditions that can develop in waterlogged or organic-rich zones of the media (Blecken and others, 2010). In a study of seasonal influences on metal retention in roadside bioswales, Mullins and others (2020) determined increases in dissolved Fe and Mn were related to reducing environments during the summer. Further testing of soils deeper in the biofilter are needed to confirm the presence of seasonally induced changes in oxidation.
Table 8.
Summary statistics of calculated loads for select metals measured at the inlet and outlet of a biofilter in Milwaukee, Wisconsin.[all units in milligrams; Min, minimum; Max, maximum; COV, coefficient of variation; Al, aluminum; na, not applicable; ↓, outlet is significantly less than the inlet (probability value [p-value] less than [<] 0.05); Cd, cadmium; --, no data; X, outlet is not significantly different than the inlet (p-value<0.05); Cr, chromium; Co, cobalt; Cu, copper; ↑, outlet is significantly greater than the inlet (p-value<0.05); Fe, iron; Pb, lead; Mn, manganese; Ni, nickel; V, vanadium; Zn, zinc; As, arsenic]
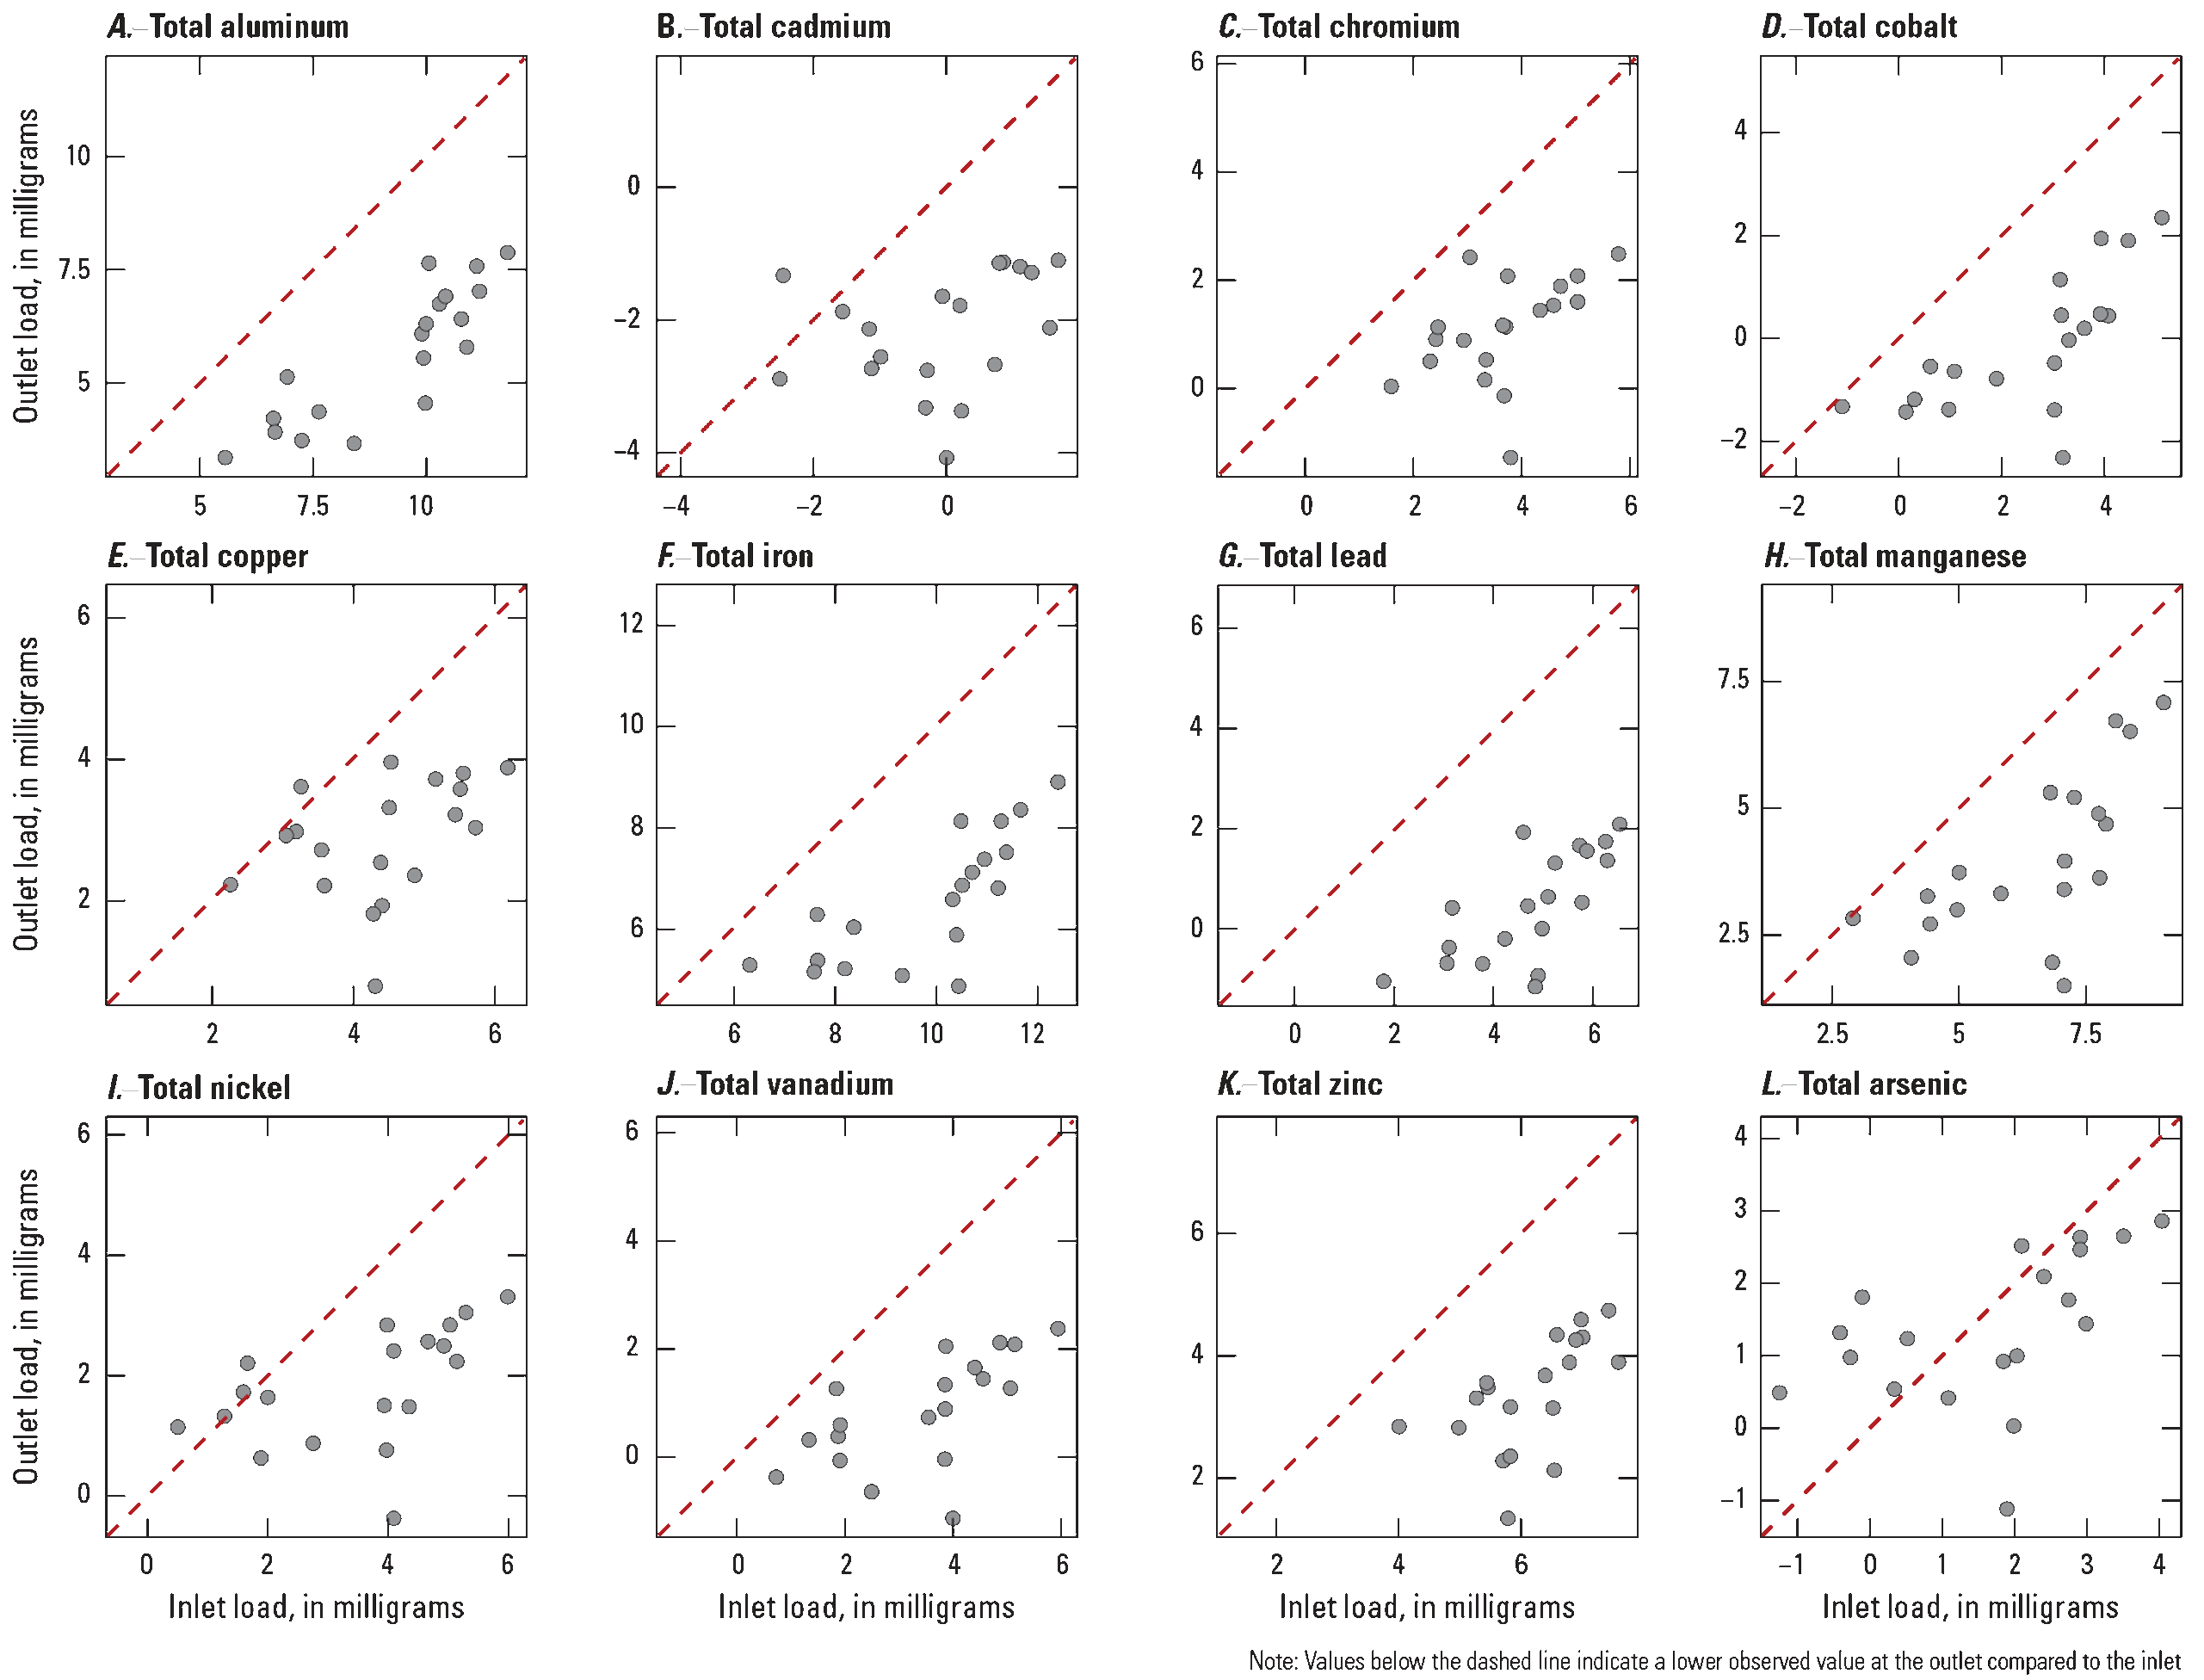
Comparison of natural log-transformed computed loads for total metals at the inlet and outlet of a biofilter in Milwaukee, Wisconsin. A, Total aluminum. B, Total cadmium. C, Total chromium. D, Total cobalt. E, Total copper. F, Total iron. G, Total lead. H, Total manganese. I, Total nickel. J, Total vanadium. K. Total zinc. L, Total arsenic.
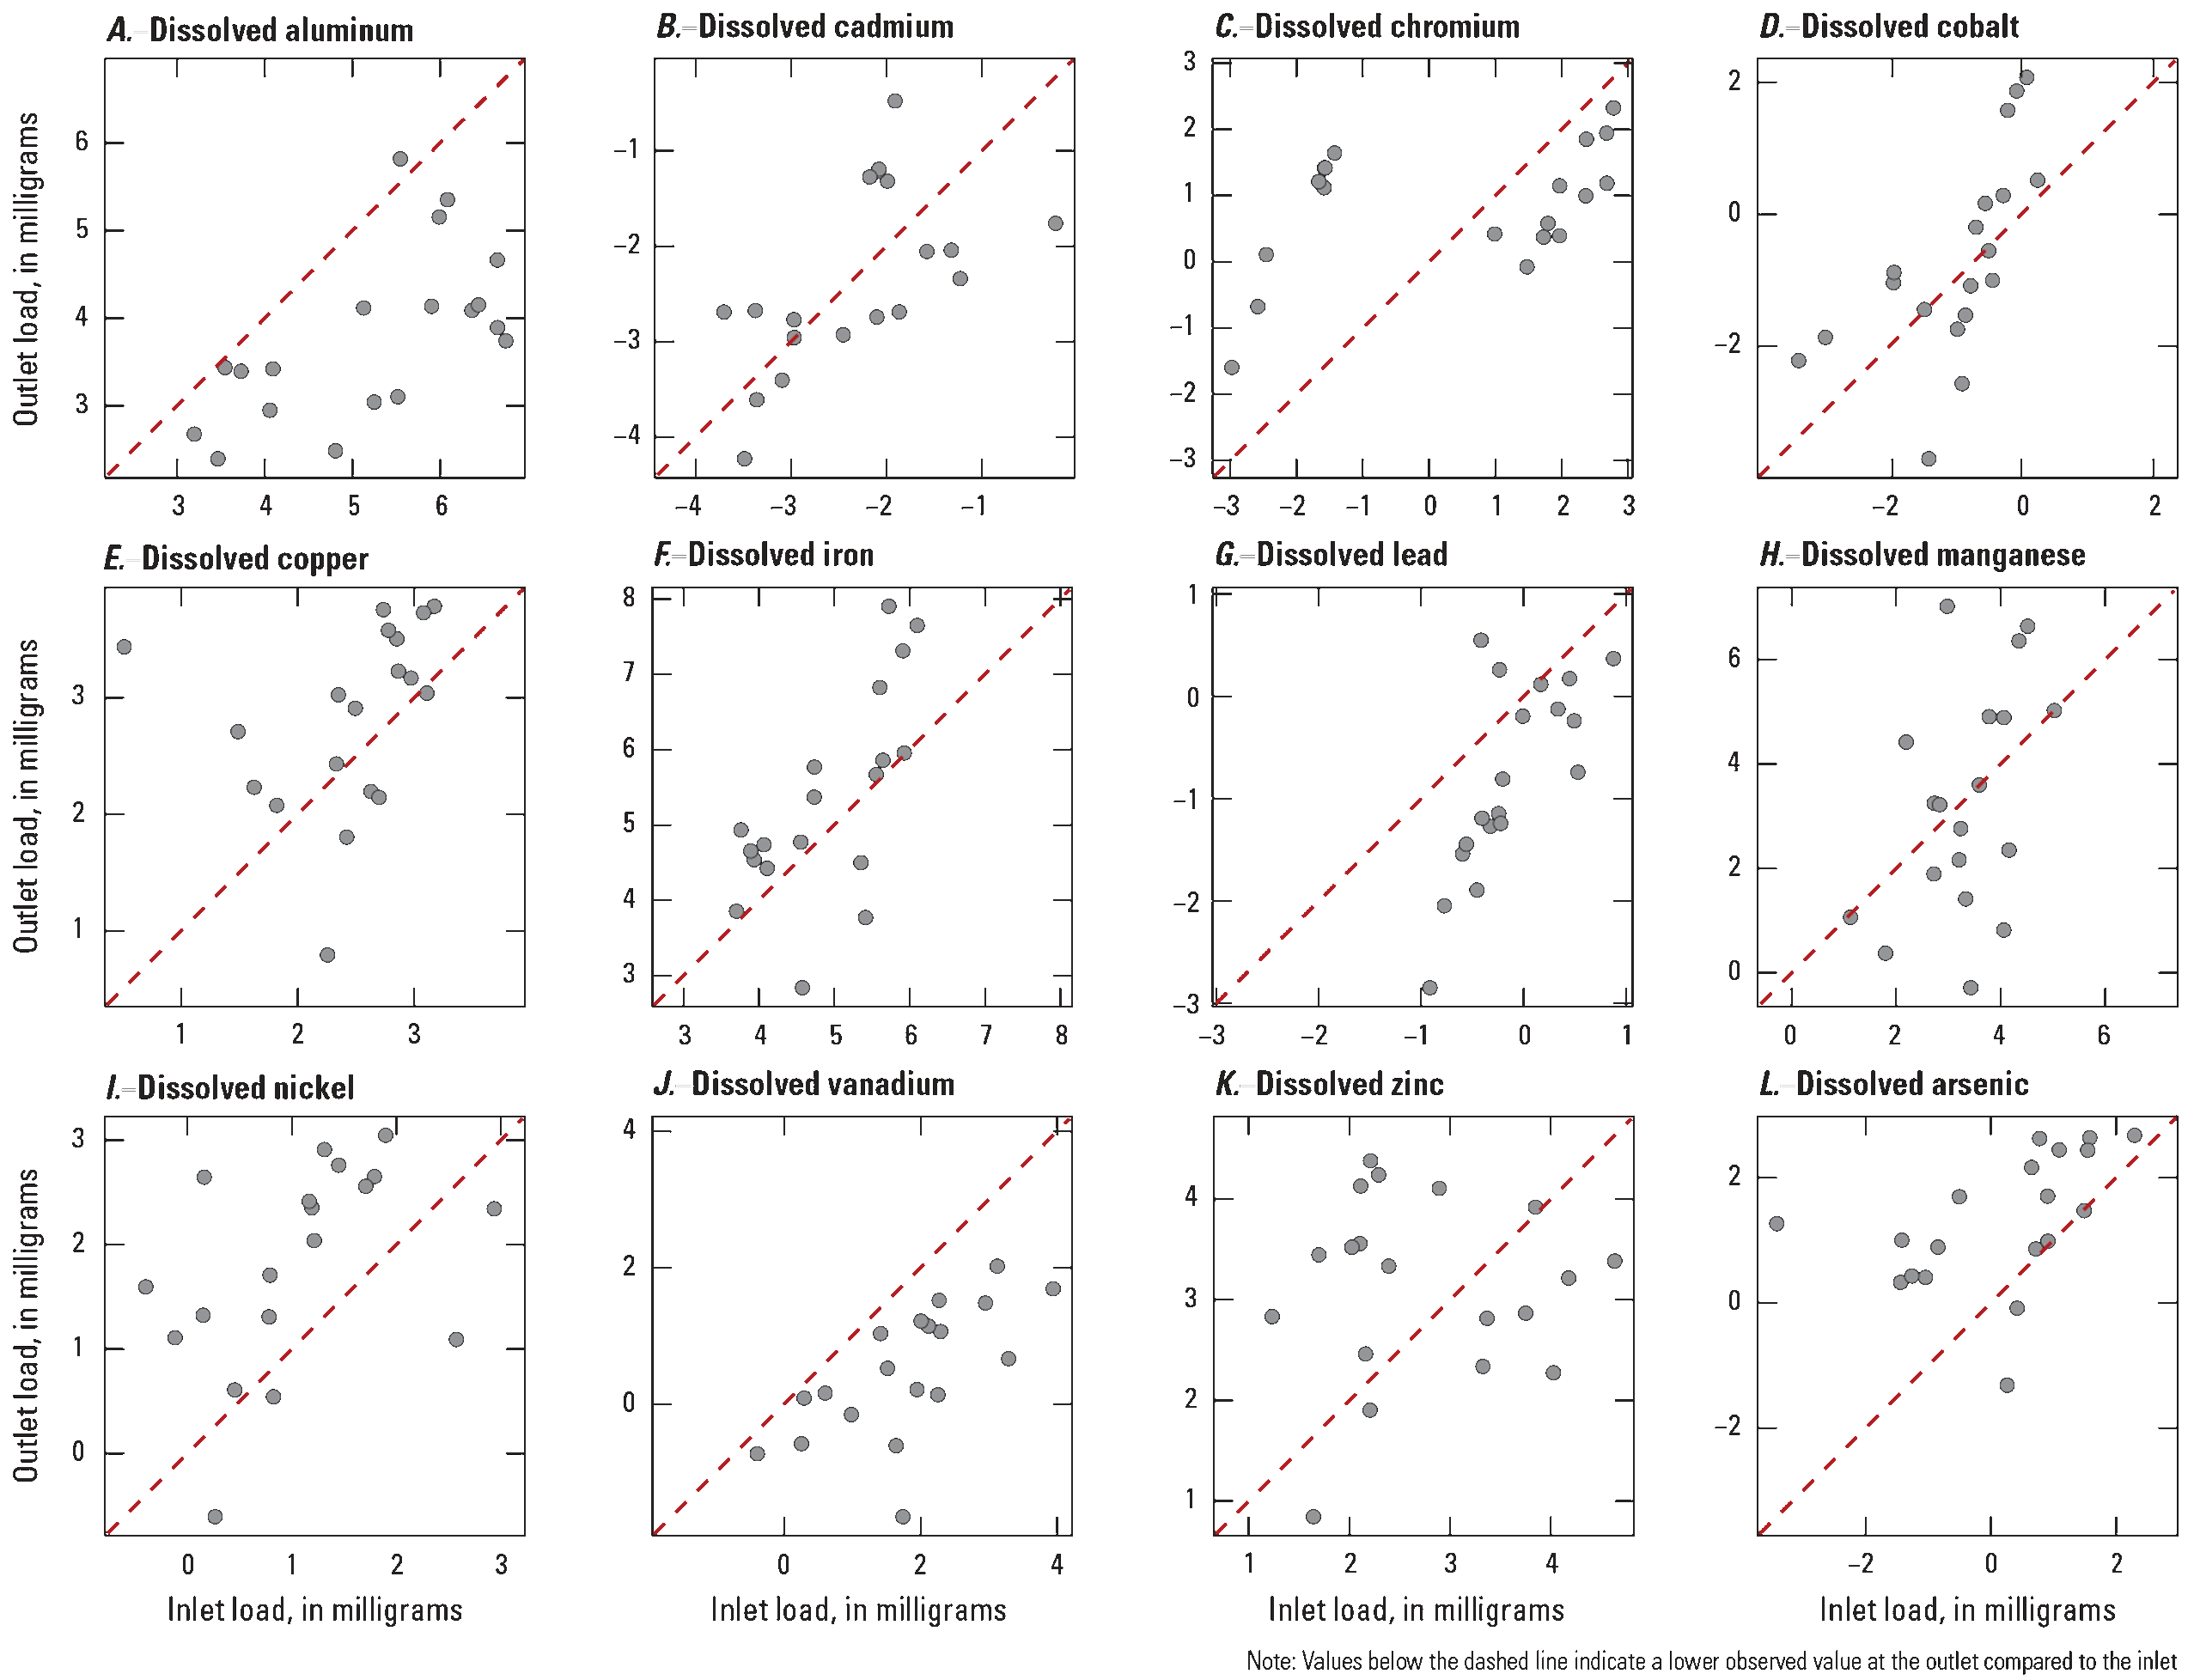
Comparison of natural log-transformed computed loads for dissolved metals at the inlet and outlet of a biofilter in Milwaukee, Wisconsin. A, Dissolved aluminum. B, Dissolved cadmium. C, Dissolved chromium. D, Dissolved cobalt. E, Dissolved copper. F, Dissolved iron. G, Dissolved lead. H, Dissolved manganese. I, Dissolved nickel. J, Dissolved vanadium. K. Dissolved zinc. L, Dissolved arsenic.
Implications for Urban Stormwater Management
Biofilters are effective tools to reduce the hydrologic effects of stormwater runoff by reducing volume and peak discharge rates. When designed with adequate storage capacity and maintained to optimize infiltration, biofilters allow a substantial portion of incoming runoff to percolate into underlying soils or be taken up by vegetation, rather than being conveyed directly to sewer networks. This not only reduces the total volume of runoff leaving a site but also attenuates peak flows, helping to mimic pre-development hydrology. This attenuation is important to reduce the risk of downstream flooding, especially in urban catchments with high impervious cover. It can also limit volumetric contributions to sewer collection systems, which can be a critical component in prevention of combined sewer overflows, a primary goal of MMSD’s GI plan (CH2MHILL, 2013).
In addition to management of stormwater runoff volume, biofilters have become a widely adopted stormwater control measure to effectively capture and treat pollutants associated with urban runoff. Biofilters and other infiltration-based GI have consistently demonstrated effective removal of TSS and particulate-bound pollutants (for example, phosphorus and metals) through a combination of sedimentation and filtration (Davis and others, 2003; Hatt and others, 2009; Clary and others, 2020). Source control of sediment on streets through targeted street sweeping can be an effective solution to limit delivery of excess sediment in runoff (Selbig and Bannerman, 2007); however, the biofilter continued to demonstrate effective removal of TSS even under high loading conditions contributed by nearby construction activity.
By adhering to sediment particles, pollutants are effectively trapped by the physical filtering mechanisms within the biofilter media. However, the performance of biofilters in removing dissolved-phase pollutants, particularly DP and dissolved metals, is often inconsistent or poor. These dissolved constituents are not readily captured by physical filtration and instead require chemical sorption or plant uptake, which are processes that may be insufficient with certain formulations of engineered media. Dissolved metals can also remain mobile in stormwater owing to their complexation with organic matter (for example, compost) or inadequate binding to filter media (Sun and Davis, 2007). Release of dissolved-phase pollutants can increase when biofilters are subjected to high concentrations of Na and chloride from winter deicing application. Elevated concentrations of Na can displace nutrient-binding cations such as Ca, Mg, and Fe on soil exchange sites, leading to the mobilization of previously adsorbed nutrients, particularly phosphorus (Novotny and others, 2009). This ion exchange process can reduce the biofilter capacity to retain phosphorus and may even cause net export under certain conditions. Moreover, high chloride levels can increase the solubility and mobility of metals through changes in ionic strength and complexation reactions, further diminishing the retention efficiency. In cold climates where deicing practices are common, these effects highlight the importance of selecting biofilter media with high cation exchange capacity and resistance to salt-induced degradation. Use of salt-tolerant vegetation may also increase survivability of runoff events containing high Na concentration. Additionally, managing deicing application rates may help preserve treatment performance. Other lesser explored options include incorporating design features that allow for bypass of runoff, either active or passive, during high-salt runoff periods.
Although biofilters are valuable tools for reducing sediment and particulate pollutant loads, their limitations with dissolved pollutants limit the ability to attain water-quality goals such as total maximum daily loads for nutrients and metals, especially in urban watersheds where DP and metals contribute to downstream impairments. To address this shortfall, stormwater managers may need to consider using alternative design features such as soil amendments that bind dissolved nutrients and metals, allow for vegetation to flourish, and are cost-effective. Recent research suggests zero valent iron, activated alumina, water treatment residuals, and biochar may be viable solutions for enhanced phosphorus binding in biofilters (Erickson and others, 2014; Erickson and others, 202218; Ali and Pickering, 2023). As new formulations of adsorptive materials continue to evolve, it is important to validate performance through laboratory column and field testing. Alternatives to structural controls such as source reduction measures (for example, street cleaning) can also reduce the amount of particulate and dissolved-phase pollutants available for transport in stormwater runoff (Selbig, 2016). Adaptive strategies that identify sources of pollutants distributed throughout the watershed coupled with continued advancement in biofilter design are essential to ensure long-term treatment efficacy of biofilters across a broad spectrum of pollutants.
Summary
The U.S. Geological Survey, in cooperation with the Milwaukee Metropolitan Sewerage District, evaluated the performance of a biofilter installed at Green Tech Station in Milwaukee, Wisconsin, between 2022 and 2024. The biofilter was designed to treat stormwater runoff from an industrial roadway and was constructed using conventional engineering practices and soil media mixtures. The primary objective of the study was to assess the treatment capabilities of a biofilter receiving stormwater runoff from a roadway in an industrial corridor. Changes in stormwater volume and peak discharge were evaluated at the inlet and outlet of the biofilter as well as pollutant concentrations and loads for solids, nutrients, major ions, and metals.
Results showed that the biofilter consistently provided substantial hydrologic benefits. Mean runoff volume was reduced by 86 percent and peak discharge by 92 percent, demonstrating its effectiveness in lessening the burden of stormwater on downstream infrastructure. The biofilter was similarly capable of capturing and retaining particulate-bound pollutants. Based on the cumulative load from 19 paired events, total suspended solids loads were nearly eliminated, with a 99-percent reduction, whereas total phosphorus loads decreased by 86 percent. Similarly, most particulate metals were reduced by more than 80 percent, with the exception being total arsenic.
Performance for dissolved pollutants was more variable. Concentrations of dissolved phosphorus were frequently greater at the outlet compared to the inlet, reflecting a shift from particulate to dissolved forms within the filter media. Several dissolved metals, including manganese, nickel, iron, and arsenic, also showed net export. These outcomes are likely tied to the organic-rich composition of the soil media, reduction-oxidation dynamics conditions that mobilize certain elements, and seasonal applications of deicers on the contributing roadway. Sodium in particular showed evidence of export, even when chloride loads remained stable, suggesting cation exchange processes and delayed flushing related to winter deicing practices.
Results from this study highlight the strengths and limitations of conventional biofilter designs. Although biofilters are valuable tools for reducing runoff volume and particulate pollutants, their ability to consistently capture dissolved nutrients and metals was limited. Improvements may be achieved using advanced soil media mixtures with lower organic content and higher capacity to adsorb dissolved constituents. Other factors that may improve pollutant reduction performance include careful management of vegetation and strategies to mitigate the effects of road salt.
References Cited
Adhikari, B., Perlman, R., Rigden, A., Walter, M.T., Clark, S., and McPhillips, L., 2023, Field assessment of metal and base cation accumulation in green stormwater infrastructure soils: Science of the Total Environment, v. 875, article 162500, 13 p., accessed January 2026 at https://doi.org/10.1016/j.scitotenv.2023.162500.
Ahmed, F., Nestingen, R., Nieber, J.L., Gulliver, J.S., and Hozalski, R.M., 2014, A Modified Philip-Dunne infiltrometer for measuring field-saturated hydraulic conductivity of surface soil: Vadose Zone Journal, v. 13, no. 10, p. 1–14, accesses January 2026 at https://doi.org/10.2136/vzj2014.01.0012.
Ali, A.M. and Pickering, N.B., 2023, Systematic evaluation of materials to enhance soluble phosphorus removal using biofiltration or bioswale stormwater management controls, Journal of Sustainable Water in the Built Environment, v. 9, no. 1, 11 p., accessed January 2026 at https://doi.org/10.1061/JSWBAY.0001004.
American Society of Testing and Materials, 2025, Standard test method for infiltration rate of soils in field using double-ring infiltrometer: ASTM D3385–18, 8 p., accessed September 24, 2025, at https://doi.org/10.1520/D3385-18.
Baker, N.T., Sullivan, D.J., Selbig, W.R., Haefner, R.J., Lampe, D.C., Bayless, R., and McHale, M.R., 2022, Green infrastructure in the Great Lakes—Assessment of performance, barriers and unintended consequences: U.S. Geological Survey Circular 1496, 70 p., accessed January 2026 https://doi.org/10.3133/cir1496.
Bodus, B., O’Malley, K., Dieter, G., Gunawardana, C., and McDonald, W., 2024, Review of emerging contaminants in green stormwater infrastructure—Antibiotic resistance genes, microplastics, tire wear particles, PFAS, and temperature: Science of the Total Environment, v. 906, 167195, accessed January 2026 at https://doi.org/10.1016/j.scitotenv.2023.167195.
Barrett, M. E., 2005, BMP performance comparisons—Examples from the International Stormwater BMP Database: Impacts of Global Climate Change, v. 2005, no. 11, p. 4910–4923, accessed January 2026 at https://doi.org/10.1061/40792(173)163.
Blecken, G.-T., Marsalek, J., and Viklander, M., 2010, Laboratory study of stormwater biofiltration in low temperatures—Total and dissolved metal removals and fates, Water, Air, &: Water, Air, and Soil Pollution, v. 219, no. 1–4, p. 303–317, accessed January 2026 at https://doi.org/10.1007/s11270-010-0708-2.
Bratieres, K., Fletcher, T.D., Deletic, A., and Zinger, Y., 2008, Nutrient and sediment removal by stormwater biofilters—A large-scale design optimisation study: Water Research, v. 42, no. 14, p. 3930–3940, accessed January 2026 at https://doi.org/10.1016/j.watres.2008.06.009.
CH2MHILL, 2013, Milwaukee Metropolitan Sewerage District regional green infrastructure plan: accessed July 30, 2025, at https://www.mmsd.com/what-we-do/green-infrastructure/resources/regional-green-infrastructure-plan.
Clary, J., Jones, J., Leisenring, M., Hobson, P., Strecker, E., Jones, J., Hobson, P., and Strecker, E., 2020, International stormwater BMP database—2020 summary statistics, in the Water Research Foundation, Project no. 4968, accessed January 2026 at https://www.waterrf.org/resource/international-stormwater-bmp-database-2016-summary-statistics.
Davis, A.P., Shokouhian, M., Sharma, H., Minami, C., and Winogradoff, D., 2003, Water quality improvement through bioretention—Lead, copper, and zinc removal: Water Environment Research, v. 75, no. 1, p. 73–82, accessed January 2026 at https://doi.org/10.2175/106143003X140854.
Drummond, L., and Maher, W., 1995, Determination of phosphorus in aqueous solution via formation of the phosphoantimonylmolybdenum blue complex. Re-examination of optimum conditions for the analysis of phosphate: Analytica Chimica Acta, v. 302, no. 1, p. 69–74, accessed January 2026 at https://doi.org/10.1016/0003-2670(94)00429-P.
Environment and Climate Change Canada, 2016, Federal environmental quality guidelines—Vanadium: 8 p., accessed February 26, 2026, at https://www.canada.ca/content/dam/eccc/migration/ese-ees/48d3a655-0f43-4bcd-905d-631b1402b61a/feqg_vanadium_en.pdf.
Erickson, A.J., Gulliver, J.S., and Weiss, P.T., 2012, Capturing phosphates with iron enhanced sand filtration: Water Research, v. 46, no. 9, p. 3032–3042, accessed January 2026 at https://doi.org/10.1016/j.watres.2012.03.009.
Erickson, A.J., Gulliver, J.S., Weiss, P.T., and Arnold, W.A., 2014, Enhanced filter media for removal of dissolved contaminants from stormwater: Minneapolis, Minnesota, St. Anthony Falls Laboratory, University of Minnesota, 149 p., accessed January 2026 at http://hdl.handle.net/11299/166940.
Erickson, A.J., Gulliver, J.S., and Weiss, P.T., 2019, Transport of chloride through silt loam, sandy loam and sandy loam with compost: Minneapolis, Minnesota, St. Anthony Falls Laboratory, University of Minnesota, 49 p., accessed January 2026 at https://hdl.handle.net/11299/210228.
Erickson, A.J., Kozarek, J.L., Kramarczuk, K.A., and Lewis, L., 2022, Biofiltration media optimization— Phase I Final report: Minneapolis, Minnesota, St. Anthony Falls Laboratory, University of Minnesota, Project Report No. 593, 66 p., accessed January 2026 at https://hdl.handle.net/11299/218193.
Faires, L.M., 1993, Methods of analysis by the U.S. Geological Survey National Water Quality Laboratory—Determination of metals in water by inductively coupled plasma-mass spectrometry: U.S. Geological Survey Open-File Report 92–634, 28 p., accessed January 2026 at https://doi.org/10.3133/ofr92634.
Feng, W., Hatt, B.E., McCarthy, D.T., Fletcher, T.D., and Deletic, A., 2012, Biofilters for stormwater harvesting—Understanding the treatment performance of key metals that pose a risk for water use: Environmental Science & Technology, v. 46, no. 9, p. 5100–5108, accessed January 2026 at https://doi.org/10.1021/es203396f.
Flanagan, K., Branchu, P., Boudahmane, L., Caupos, E., Demare, D., Deshayes, S., Dubois, P., Meffray, L., Partibane, C., Saad, M., and Gromaire, M.-C., 2018, Field performance of two biofiltration systems treating micropollutants from road runoff: Water Research, v. 145, p. 562–578, accessed January 2026, at https://doi.org/10.1016/j.watres.2018.08.064.
Field, R., and Sullivan, D., eds., 2002, National Stormwater Runoff Pollution Database, chap. 3 of Field, R., and Sullivan, D., eds., Wet-weather flow in the urban watershed: CRC Press, p. 81–92, accessed January 2026 at https://doi.org/10.1201/9781420012774-8.
Fishman, M.J., ed., 1993, Methods of analysis by the U.S. Geological Survey National Water Quality Laboratory—Determination of inorganic and organic constituents in water and fluvial sediments: U.S. Geological Survey Open-File Report 93–125, 217 p., accessed January 2026 at /https://doi.org/10.3133/ofr93125.
Fishman, M.J., and Friedman, L.C., eds., 2015, Methods for determination of inorganic substances in water and fluvial sediments: U.S. Geological Survey Techniques of Water-Resources Investigations, book 5, chap. A1, 160 p., accessed July 1, 2025, at https://doi.org/10.3133/twri05A1_1979.
Galella, J.G., Kaushal, S.S., Mayer, P.M., Maas, C.M., Shatkay, R.R., and Stutzke, R.A., 2023, Stormwater best management practices: Experimental evaluation of chemical cocktails mobilized by freshwater salinization syndrome: Frontiers in Environmental Science, v. 11, article 1020914, 20 p., accessed January 2026 at https://doi.org/10.3389/fenvs.2023.1020914.
Garbarino, J.R., and Struzeski, T.M., 1998, Methods of analysis by the U.S. Geological Survey National Water Quality Laboratory—Determination of elements in whole-water digests using inductively coupled plasma-optical emission spectrometry and inductively coupled plasma-mass spectrometry: U.S. Geological Survey Open-File Report 98–165, 101 p., accessed January 2026 at https://doi.org/10.3133/ofr98165.
Great Lakes Commission, 2018, Great Lakes regional green infrastructure policy analysis: Addressing Barriers to Implementation: Great Lakes Commission and Credit Valley Conservation, 52 p., accessed January 2026 at https://www.glc.org/wp-content/uploads/GI-policy-analysis.pdf.
Hatt, B.E., Fletcher, T.D., and Deletic, A., 2007, Treatment performance of gravel filter media—Implications for design and application of stormwater infiltration systems: Water Research, v. 41, no. 12, p. 2513–2524, accessed January 2026 at https://doi.org/10.1016/j.watres.2007.03.014.
Hatt, B.E., Fletcher, T.D., and Deletic, A., 2009, Hydrologic and pollutant removal performance of stormwater biofiltration systems at the field scale: Journal of Hydrology, v. 365, no. 3–4, p. 310–321, accessed January 2026 at https://doi.org/10.1016/j.jhydrol.2008.12.001.
Helsel, D.R., and Hirsch, R.M., 2002, Statistical methods in water resources: U.S. Geological Survey Techniques of Water Resources Investigations, book 4, chap. A3, 522 p., accessed November 17, 2017, at https://doi.org/10.3133/twri04A3.
Hurley, S., Shrestha, P., & Cording, A., 2017, Nutrient leaching from compost—Implications for bioretention and other green stormwater infrastructure: Journal of Sustainable Water in the Built Environment, v. 3, no. 3, 8 p., accessed January 2026 at https://doi.org/10.1061/JSWBAY.0000821.
Kayhanian, M., Suverkropp, C., Ruby, A., and Tsay, K., 2007, Characterization and prediction of highway runoff constituent event mean concentration: Journal of Environmental Management, v. 85, no. 2, p. 279–295, accessed January 2026 at https://doi.org/10.1016/j.jenvman.2006.09.024.
Khudair, M.Y., Ethaib, S., Jasim, F.M., and Kamel, A.H., 2024, Developing sustainable water treatment systems using biofiltration process: International Journal of Environmental Impacts, v. 7, no. 4, p. 781–790, accessed January 2026 at https://doi.org/10.18280/ijei.070418.
Larm, T., and Wahlsten, A., 2019, Applying the parameter “irreducible concentration” in modelling of stormwater treatment facilities: Journal of Civil Engineering and Architecture, v. 13, no. 8, p. 469–476, accessed January 2026 at https://doi.org/10.17265/1934-7359/2019.08.001.
Mullins, A. R., Bain, D. J., Pfeil-McCullough, E., Hopkins, K. G., Lavin, S., and Copeland, E., 2020, Seasonal drivers of chemical and hydrological patterns in roadside infiltration-based green infrastructure: Science of The Total Environment, 714, 9 p., accessed January 2026 at https://doi.org/10.1016/j.scitotenv.2020.136503.
Novotny, E.V., Sander, A.R., Mohseni, O., and Stefan, H.G., 2009, Chloride ion transport and mass balance in a metropolitan area using road salt: Water Resources Research, v. 45, no. 12, 13 p., accessed January 2026 at https://doi.org/10.1029/2009WR008141.
Pitt, R., Maestre, A., and Clary, J., 2018, The National Stormwater Quality Database (NSQD), version 4.02: accessed July 15, 2025, at https://static1.squarespace.com/static/5f8dbde10268ab224c895ad7/t/5fbd4f842192d61a1f85f71a/1606242187964/NSQD_ver_4_brief_Feb_18_2018.pdf.
Read, J., Wevill, T., Fletcher, T., and Deletic, A., 2008, Variation among plant species in pollutant removal from stormwater in biofiltration systems: Water Research, v. 42, no. 4–5, p. 893–902, accessed January 2026 at https://doi.org/10.1016/j.watres.2007.08.036.
Roy-Poirier, A., Champagne, P., and Filion, Y., 2010, Review of bioretention system research and design—Past, present, and future: Journal of Environmental Engineering, v. 136, no. 9, p. 878–889, accessed January 2026 at https://doi.org/10.1061/(ASCE)EE.1943-7870.0000227.
Sansalone, J.J., and Buchberger, S.G., 1997, Partitioning and first flush of metals in urban roadway storm water: Journal of Environmental Engineering, v. 123, no. 2, p. 134–143, accessed January 2026 at https://doi.org/10.1061/(ASCE)0733-9372(1997)123:2(134).
Selbig, W.R., 2016, Evaluation of leaf removal as a means to reduce nutrient concentrations and loads in urban stormwater: Science of the Total Environment, v. 571, p. 124–133, accessed January 2026 at https://doi.org/10.1016/j.scitotenv.2016.07.003.
Selbig, W.R., and Bannerman, R.T., 2007, Evaluation of street sweeping as a stormwater-quality management tool in three residential basins in Madison, Wisconsin: U.S. Geological Survey Scientific Investigations Report 2007–5156, 120 p., accessed January 2026 at https://doi.org/10.3133/sir20075156.
Selbig, W.R., and Romano, J.T., 2026, Water quality concentration and load data for a biofilter at Green Tech Station in Milwaukee, Wisconsin, 2022–24: U.S. Geological Survey data release, https://doi.org/10.5066/P13E8BMK.
Sharma, R., and Malaviya, P., 2021, Management of stormwater pollution using green infrastructure—The role of rain gardens: WIREs Water, v. 8, no. 2, e1507, accessed January 2026 at https://doi.org/10.1002/wat2.1507.
Stensvold, K.A., 2012, Distribution and variation of arsenic in Wisconsin surface soils, with data on other trace elements: U.S. Geological Survey Scientific Investigations Report 2011–5202, 41 p., 1 app., accessed January 2026 at https://doi.org/10.3133/sir20115202.
Strecker, E.W., Quigley, M.M., Urbonas, B.R., Jones, J.E., and Clary, J.K., 2001, Determining urban storm water BMP effectiveness: Journal of Water Resources Planning and Management, v. 127, no. 3, p. 144–149, accessed January 2026 at https://doi.org/10.1061/(ASCE)0733-9496(2001)127:3(144).
Sun, X., and Davis, A.P., 2007, Heavy metal fates in laboratory bioretention systems: Chemosphere, v. 66, no. 9, p. 1601–1609, accessed January 2026 at https://doi.org/10.1016/j.chemosphere.2006.08.013.
Trowsdale, S.A., and Simcock, R., 2011, Urban stormwater treatment using bioretention: Journal of Hydrology, v. 397, no. 3-4, p. 167–174, accessed January 2026 at https://doi.org/10.1016/j.jhydrol.2010.11.023.
U.S. Environmental Protection Agency, 1983, Results of the Nationwide Urban Runoff Program: Volume 1—Final Report, Washington D.C., U.S. Environmental Protection Agency, Water Planning Division, EPA Report (NTIS PB84-185552), accessed March 7, 2025, at https://nepis.epa.gov/Exe/ZyPURL.cgi?Dockey=2000SNX3.TXT.
U.S. Environmental Protection Agency, 2026, National recommended water quality criteria—Aquatic life criteria table: accessed February 26, 2026, at https://www.epa.gov/wqc/national-recommended-water-quality-criteria-aquatic-life-criteria-table.
Wisconsin Department of Natural Resources, 2025a, Wisconsin Administrative Code NR102.06—Phosphorus, chap. NR 102 of water quality standards for Wisconsin surface waters: Madison, Wisconsin, Wisconsin Legislative Reference Bureau, accessed July 15, 2025, at https://docs.legis.wisconsin.gov/code/admin_code/nr/100/102/I/06.
Wisconsin Department of Natural Resources, 2025b, Groundwater quality: Wisconsin Administrative Code, Chapter NR 140, accessed July 24, 2025, at https://docs.legis.wisconsin.gov/code/admin_code/nr/100/140.
Wisconsin Department of Natural Resources, 2025c, Bioretention for infiltration 1004: Wisconsin Department of Natural Resources technical standard, 13 p., accessed July 18, 2025, at https://dnr.wisconsin.gov/sites/default/files/topic/Stormwater/1004Bioretention.pdf.
Wisconsin Department of Transportation, 2025, Traffic count map: accessed April 10, 2025, at https://wisconsindot.gov/pages/projects/data-plan/traf-counts/default.aspx.
Wu, J., Cao, X., Zhao, J., Dai, Y., Cui, N., Li, Z., and Cheng, S., 2017, Performance of biofilter with a saturated zone for urban stormwater runoff pollution control—Influence of vegetation type and saturation time: Ecological Engineering, v. 105, p. 355–361, accessed January 2026 at https://doi.org/10.1016/j.ecoleng.2017.05.016.
Xin, D., Gray, J., Zabala, T., Davis, A., and Fassman-Beck, E., 2025, Impact of media properties on dissolved copper sorption in stormwater biofiltration: ACS ES&T Water, v. 5, no. 9, p. 5685–5694, accessed January 2026 at https://doi.org/10.1021/acsestwater.5c00680.
Zhang, K., Randelovic, A., Page, D., McCarthy, D.T., and Deletic, A., 2014, The validation of stormwater biofilters for micropollutant removal using in situ challenge tests: Ecological Engineering, v. 67, p. 1–10, accessed January 2026 at https://doi.org/10.1016/j.ecoleng.2014.03.004.
Conversion Factors
U.S. customary units to International System of Units
Temperature in degrees Celsius (°C) may be converted to degrees Fahrenheit (°F) as follows: °F = (1.8 × °C) + 32.
Supplemental Information
Concentrations of chemical constituents in water are given in either milligrams per liter (mg/L) or micrograms per liter (µg/L).
Abbreviations
ρ
Spearman’s rank correlation coefficient
Al
aluminum
As
arsenic
Ca
calcium
Cu
copper
DP
dissolved phosphorus
EMC
event mean concentration
Fe
iron
GI
green infrastructure
Mg
magnesium
MMSD
Milwaukee Metropolitan Sewerage District
Mn
manganese
Na
sodium
Pb
lead
redox
reduction-oxidation dynamics
TP
total phosphorus
TSS
total suspended solids
For more information about this publication, contact:
Director, USGS Upper Midwest Water Science Center
8505 Research Way
Middleton, WI 53562
608–828–9901
For additional information, visit: https://www.usgs.gov/centers/umid-water
Publishing support provided by the
USGS Science Publishing Network,
Rolla and Reston Publishing Service Centers
Disclaimers
Any use of trade, firm, or product names is for descriptive purposes only and does not imply endorsement by the U.S. Government.
Although this information product, for the most part, is in the public domain, it also may contain copyrighted materials as noted in the text. Permission to reproduce copyrighted items must be secured from the copyright owner.
Suggested Citation
Selbig, W.R., and Romano, J., 2026, Urban stormwater treatment using biofiltration—Variable performance across solids, nutrients, major ions, and metals: U.S. Geological Survey Scientific Investigations Report 2026–5143, 27 p., https://doi.org/10.3133/sir20265143.
ISSN: 2328-0328 (online)
Study Area
| Publication type | Report |
|---|---|
| Publication Subtype | USGS Numbered Series |
| Title | Urban stormwater treatment using biofiltration—Variable performance across solids, nutrients, major ions, and metals |
| Series title | Scientific Investigations Report |
| Series number | 2026-5143 |
| DOI | 10.3133/sir20265143 |
| Publication Date | March 18, 2026 |
| Year Published | 2026 |
| Language | English |
| Publisher | U.S. Geological Survey |
| Publisher location | Reston, VA |
| Contributing office(s) | Upper Midwest Water Science Center |
| Description | Report: vii, 27 p.; Data Release |
| Country | United States |
| State | Wisconsin |
| City | Milwaukee |
| Other Geospatial | Green Tech Station stormwater plaza |
| Online Only (Y/N) | Y |
| Additional Online Files (Y/N) | N |