

A Data Exchange Standard for Wadeable Stream Habitat Monitoring Data
Links
- Document: Report (3.3 MB pdf) , HTML , XML
- Data Release: USGS data release - Wadeable stream habitat data integrated from multiple monitoring programs for the US from 2000–2022
- NGMDB Index Page: National Geologic Map Database Index Page (html)
- Software Release: USGS software release - SHMI-DES
- Download citation as: RIS | Dublin Core
Acknowledgments
The Bureau of Land Management, the U.S. Forest Service (USFS), and the U.S. Geological Survey (USGS) funded this work.
Phil Kaufmann (U.S. Environmental Protection Agency; EPA) participated in the working group and contributed to metric compatibility discussions, data exchange standard development, and provided comments on the manuscript. Sarah Lehmann (EPA) participated in working group meetings and provided comments on the manuscript. Brett Roper (USFS) participated in working group meetings and contributed to metric compatibility discussions. Susan Kemp (USGS) facilitated publication and associated data and software release processes. Sam Cimino (USGS), Meg Dethloff (USGS), and Rachael Paul-Wilson (USGS) assisted with methods documentation on MonitoringResources.org. Jason Dunham (USGS) and Jeff Ojala (USFS) participated in working group meetings and supported the project. Jake Weltzin, Sky Bristol, Abby Benson, Steven Aulenbach, and Mark Wiltermuth (USGS) provided initial support and guidance on the project.
Abstract
Data from wadeable streams collected by monitoring programs are used to assess watershed condition status and trends. Federally managed programs collect a suite of similar habitat measurements using compatible methods and produce individual program datasets for their prescribed geographic and temporal range. We identified four programs that produce similar data: the Bureau of Land Management Assessment, Inventory, and Monitoring lotic division, the U.S. Environmental Protection Agency National Aquatic Resource Surveys National Rivers and Streams Assessment survey section, the Federal interagency Aquatic and Riparian Effectiveness Monitoring Program, and the PacFish/InFish Biological Opinion Monitoring Program. Their datasets answer agency-specific management questions and fulfill reporting requirements, but the datasets are not released in full, or at all, and in some cases, there was no method to integrate data from the four programs to provide data at a larger spatial scale.
The Pacific Northwest Aquatic Monitoring Partnership (PNAMP) led a working group of experts from the four monitoring programs to determine data compatibility, develop a Stream Habitat Metrics Integration (SHMI) data exchange standard, and integrate compatible wadeable stream data. The resulting SHMI data exchange standard contains a data mapping file used to transform data from the source program data to a conformed format based on a controlled vocabulary. After extensive discussions assessing and comparing program collection and analyses methods, the working group found 26 stream habitat metrics to be sufficiently comparable to be integrated into a meaningful dataset. Furthermore, a subset of PIBO MP data previously available only by request and AREMP data available only as a proprietary ESRI ArcGIS geodatabase were made publicly available in non-proprietary formats via the integrated SHMI dataset.
A selection of data from the four programs determined to be compatible among 14 datasets were filtered, transformed, standardized, and combined using R code to create the integrated SHMI dataset containing about 12,000 locations, 19,000 events, and 200,000 measurements from 2000 to 2022.
This report describes the SHMI data exchange standard and its development, the metric compatibility assessment, and the data integration process, so that others may reuse the SHMI data exchange standard and its components as well as the data integration processes.
Introduction
Stream monitoring programs managed by state, federal, and Tribal agencies collect and maintain extensive data across the United States to inform and support decision-making. Long-term stream monitoring data aid the understanding of local and regional impacts of recreation, infrastructure, transportation development, forestry practices, as well as climate change, on stream habitat and sensitive species within the ecosystem. While valuable for addressing specific program concerns, data availability and usability are limited by some individual programs’ geographic boundaries and publishing processes (Bayer and others, 2023). Combining data from multiple sources can aid in addressing issues across jurisdictional boundaries (Houston and others, 2002; Roper and others, 2011; Collins and others, 2012; Katz and others, 2019) and allow data use more readily than individual datasets (Bayer and others, 2023).
Stream monitoring program data collection and analysis methods are designed to suit specific program aims, but many programs measure a suite of common stream characteristics during surveys. Physical channel characteristics commonly measured during wadeable stream surveys include bankfull width and depth, channel and pool tail substrate sizes, habitat unit classification (pool versus riffle), bank stability, gradient, and frequency and volume of woody debris. Water quality and chemistry (pH, specific conductance, temperature, nutrients) and biological samples (benthic macroinvertebrates, fish assemblages, invasive species) are sometimes also included during surveys.
Most aspects of physical stream habitat can be measured using rapid assessment protocols that utilize a reach-based approach with transects and stick and tape measurements (Harrelson and others, 1994; Whitacre and others, 2007; Roper and others, 2011). Physical habitat data are collected along a section of stream, called a reach, in which measurements are taken at 6–11 equally spaced transects throughout a minimum 150–160 meter (m) long reach (Harrelson and others, 1994; Kaufmann and Robison, 1994, 1998). Many monitoring programs follow this basic reach setup with modifications to the length of the reach and number of transects and suite of measurements taken along the reach as needed by individual program objectives (Aquatic and Riparian Effectiveness Monitoring Program, 2019; Saunders and others, 2019; U.S. Environmental Protection Agency, 2019; Bureau of Land Management Assessment, Inventory, and Monitoring Project Team, 2021). New technologies, such as drones and remote sensing, can be used to measure physical habitat characteristics, but these technologies generate very different data structures that can be time intensive to process and manage. Additionally, remote sensing cannot always reliably characterize small stream habitat conditions, so field surveys are needed to gather habitat measurements and provide ground truthing (Dias-Silva and others, 2021).
Long-term stream monitoring programs are responsible for independently managing large datasets, and though they measure and store similar data, there are currently no data or metadata standards for stream habitat metrics. A data standard defines data storage, format, and structure, and may include a controlled vocabulary or “a defined list of explicitly allowed terms and definitions” (DAMA International, 2011, p. 62). A metadata standard provides required and recommended elements necessary to describe the data for findability and usability (Michener and others, 2011; Habermann, 2018). Using a metadata standard helps data managers organize and structure data in a uniform manner. Data that follow a metadata standard improve user findability, which facilitates reusability and increased data integration. Given that monitoring programs collect similar measurements, developing a data standard will help combine compatible stream habitat data from different programs into a single dataset to help answer new questions and address issues across jurisdictional boundaries (Houston and others, 2002; Roper and others, 2011; Collins and others, 2012).
Although programs collect and calculate similar stream metrics, measurements of the same characteristic (such as stream temperature, pool structure) are not always comparable between programs (Whitacre and others, 2007; Al-Chokhachy and Roper, 2011; Isaak and others, 2018) and raw data measurements may be compatible while computed metrics may not be. Metrics are values reduced or processed from measurements taken one or more times during the study period (for example, averages across multiple replicates; Stevens and Urquhart, 2000) and are commonly calculated for stream survey data. Developing and using a Stream Habitat Metrics Integration (SHMI) data exchange standard will provide a consistent vocabulary, units, and metadata, thus reducing the amount of work it will take to integrate data from multiple programs.
Project Objectives
Our objectives were to create a Stream Habitat Metrics Integration (SHMI) data exchange standard that documented which metrics had compatible field and analysis methods and use the SHMI data exchange standard to integrate stream habitat data from multiple monitoring programs. To meet these objectives, we created standardized metadata, file formats, and structure. We defined new data exchange standards for wadeable stream habitat data using elements from pre-existing standards and frameworks (Darwin Core [Wieczorek and others, 2012] and Observations Data Model 2 [ODM2; Horsburgh and others, 2008, 2016]) and created new terms and definitions where necessary.
The Darwin Core standard and ODM2 provided the initial framework for our data exchange standard, named and referred to throughout this report as the Stream Habitat Metric Integration (SHMI) data exchange standard. Darwin Core is adaptable to many different disciplines (Reed and others, 2015; De Pooter and others, 2017; Guralnick and others, 2018) and provided the basis for the terms included in the SHMI data exchange standard. A relational data structure and additional terms were used from the ODM2. While the U.S. Environmental Protection Agency (EPA) Water Quality Exchange (WQX) facilitates public sharing of water-quality data, the WQX was not suitable for sharing stream habitat monitoring data at the time of this work.
Purpose and Scope
In this report, we describe a case study (SHMI project) that used data from four monitoring programs to integrate stream habitat data using the SHMI data exchange standard. We then describe how we used the SHMI data exchange standard to integrate the data, including definitions for habitat metrics (in a controlled vocabulary), and how the SHMI data exchange standard was developed. We conclude with a discussion of maintenance and future development. Appendix 1 describes specific methods used to integrate each source data file.
Stream Habitat Metrics Integration Project
To integrate wadeable stream habitat metrics from monitoring programs, the Pacific Northwest Aquatic Monitoring Partnership (PNAMP) led the SHMI project with a working group of experts from four federally managed, long-term programs that monitor streams (table 1; fig. 1):
-
• Bureau of Land Management (BLM) Assessment, Inventory, and Monitoring (AIM) Strategy
-
• United States Forest Service (USFS) and BLM Aquatic and Riparian Effectiveness Monitoring Program (AREMP)
-
• USFS and BLM PacFish/InFish Biological Opinion Monitoring Program (PIBO MP)
-
• EPA National Aquatic Resource Surveys (NARS) National Rivers and Streams Assessment (NRSA)
Table 1.
Overview of monitoring programs participating in the Stream Habitat Metrics Data Integration project, their managing agencies, program descriptions and objectives, and spatio-temporal extent of their surveys.[Table modified from Bayer and others (2023). Spatial extent of monitoring programs is shown in figure 1. Abbreviations: BLM, Bureau of Land Management; EPA, Environmental Protection Agency]
| Agency and program name |
Description | Spatio-temporal extent |
|---|---|---|
| BLM Assessment, Inventory, and Monitoring (AIM) National Aquatic Monitoring Framework | The lotic AIM Strategy provides a framework for the BLM to assess the condition and trend of stream and river systems on BLM lands. Such information is actively used by the BLM to guide and justify land uses, policy actions, and adaptive management decisions for individual field offices to national level reporting (Bureau of Land Management, 2015; Kachergis and others, 2022). | Western United States including Alaska since 2013 |
| Federal interagency Aquatic and Riparian Effectiveness Monitoring Program (AREMP) | AREMP focuses on assessing the effectiveness of federal land management under the aquatic conservation strategy (ACS) of the Northwest Forest Plan (NWFP) in California, Oregon, and Washington on maintaining and improving watershed conditions (U.S. Forest Service and U.S. Bureau of Land Management, 1994a, 1994b79). | Western California, Oregon and Washington since 2002 |
| EPA National Aquatic Resource Surveys (NARS)—National Rivers and Streams Assessment (NRSA) | The NARS are collaborative aquatic resource surveys conducted by EPA, states, and Tribes. NARS is designed to assess the quality of the nation’s coastal waters, lakes and reservoirs, rivers and streams, and wetlands using a statistical probability survey design and standardized field data collection and analysis. The NRSA uses NARS data to provide information on the ecological conditions of the nation’s rivers and streams and the key stressors on a national and ecoregional scale (Shapiro and others, 2008; U.S. Environmental Protection Agency, 2016b, 2020b). | Continental United States since early 2000s |
| Federal interagency PacFish/InFish Biological Opinion Monitoring Program (PIBO MP) | The goal of PIBO MP is to monitor stream and riparian habitats within the PIBO MP study area in order to determine if the PacFish (Pacific Anadromous Fish) and InFish (Inland Fish) aquatic conservation strategies can effectively maintain or restore the structure and function of riparian and aquatic systems (Archer and others, 2012). | Continental Western United States since 1998 |
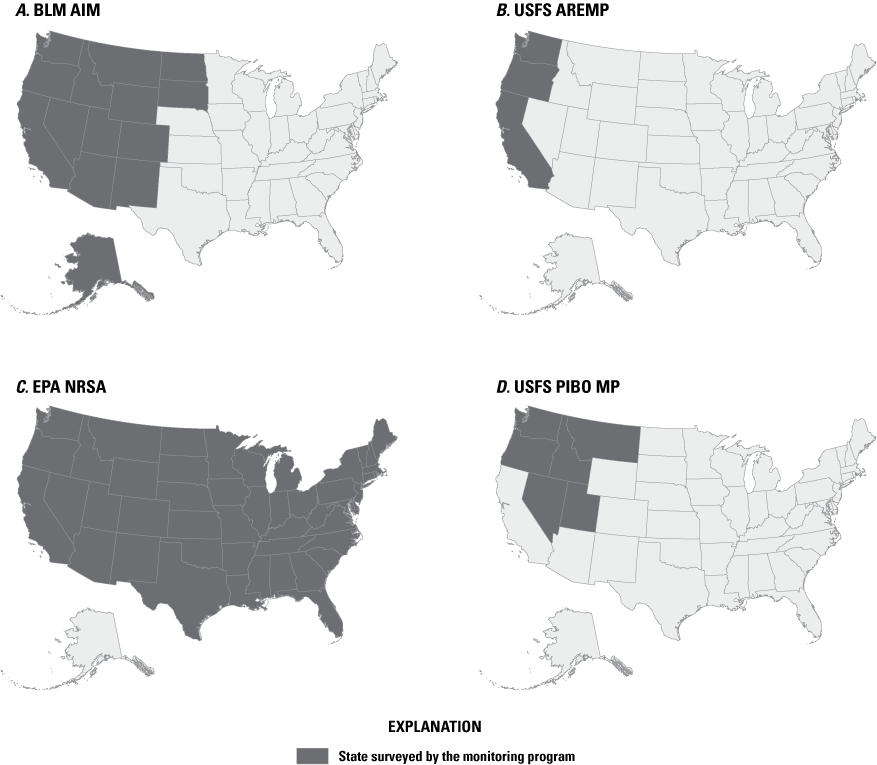
U.S. states in which each monitoring program conducts surveys. Bureau of Land Management Assessment, Inventory, and Monitoring (BLM AIM; A), U.S. Forest Service (USFS) Aquatic and Riparian Effectiveness Monitoring Program (Federal interagency AREMP; B), Environmental Protection Agency National Rivers and Streams Assessment (EPA NRSA; C), and United States Forest Service (USFS) PacFish/InFish Biological Opinion Monitoring Program (Federal interagency PIBO MP; D). Hawaii is not shown because these monitoring programs do not operate in Hawaii. Data sources for each monitoring program are shown in table 1.
These programs were chosen because they have some geographic overlap and were developed collaboratively over time, particularly AIM, AREMP, and PIBO MP (Lenz and Miller, 1996; Houston and others, 2002; Whitacre and others, 2007; Roper and others, 2011). Their collaborative history produces some compatible data and metrics, which are suited for integration more readily than data from programs without any prior collaboration. Furthermore, they also use consistent methods and statistically valid designs for collecting data.
The chosen programs also conduct other surveys and collect additional data (such as terrestrial surveys or lake assessments) not included or assessed as part of this work. We only used the following subsets of program data for this project (refer to Scully and others, 2023a for more specific data included, such as file names, metadata files, and other data sources). When using program names or acronyms throughout this report, we refer only to the data we used in this project, not the entire program:
-
• National lotic AIM indicators wadeable data published to a BLM ArcGIS Hub (Bureau of Land Management Assessment, Inventory, and Monitoring Project Team, 2021)
-
• AREMP data published for a 20-year report (Miller and others, 2017) to an ArcGIS geodatabase on the AREMP website (Northwest Forest Plan Aquatic and Riparian Effectiveness Monitoring Program, 2015)
-
• NARS Wadeable Streams and NRSA data published to the NARS website (U.S. Environmental Protection Agency, 2006, 2016a, 2020a, 2021)
-
• PIBO MP habitat data obtained via data request (W.C. Saunders, U.S. Forest Service PacFish/InFish Biological Opinion Monitoring Program, unpub. data, 20211 )
At the time of this publication (2024), data were not publicly available from U.S. Forest Service.
Case Study Results of Integrating Stream Habitat Data Using the Stream Habitat Metrics Integration Data Exchange Standard
We used the SHMI data exchange standard to integrate data subsets from four participating federally managed monitoring programs (AIM, AREMP, PIBO MP, and NARS) using methods described in appendix 1. The resulting integrated SHMI dataset includes 26 compatible stream habitat monitoring metrics collected between the early 2000s and 2022 across the United States, including Alaska (table 1). By combining data from 14 datasets, about 12,000 locations, and about 19,000 events, we produced a dataset with greater temporal and spatial extent providing stream monitoring data for compatible metrics from 4 participating monitoring programs for about 200,000 measurements. The working group identified this subset of data as interoperable after discussions in which data collection and analysis methods were reviewed.
The integrated data, consisting of four tables named (“RecordLevel,” “Location,” “Event,” and “MeasurementOrFact”) and an accompanying analysis-ready dataset, are published in Scully and others (2023a). The four tables are structured as comma-separated value (CSV) files, which can be constructed in a relational database (fig. 2; table 2). The SHMI data exchange standard tables (as CSV tables) and R code (R Core Team, 2023) used to integrate the data are published in Scully and others (2023b). Readers should refer to the SHMI data exchange standard tables on GitLab to accompany this publication. The SHMI data exchange standard tables, which provide definitions for the four tables that are built during the generation of the integrated data, are located within the DataExchangeStandardTables folder of the SHMI-DES repository (Scully and others, 2023b).
The “RecordLevel” table contains the core elements of the dataset, including information about the dataset’s origin, who collected the data, and how to cite the source dataset. The “Location” table contains information on field data collection locations. The “Event” table contains information about a data collection event that occurred at a location on a specific date. The “MeasurementOrFact” table contains compatible metric measurements, which are a reach-level summary of compatible measurements at an event. The measurementValue field stores the data values and the measurementType field defines the “nature of the measure, fact, characteristic or assertion” (for example, percentage of pools as PctPool and gradient as Grad; Darwin Core Maintenance Group, 2021).
Table 2.
Primary and foreign keys that define the database structural relationships between tables.[Symbol: —, the field is not applicable]
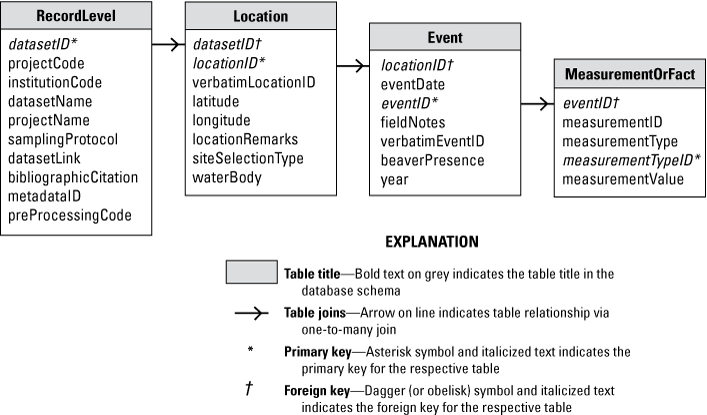
Integrated stream habitat database entity relationship diagram. Primary key datasetID joins the “RecordLevel” table to the foreign key datasetID in the “Location” table. Primary key locationID joins the “Location” table to the foreign key locationID in the “Event” table. Primary key measurementTypeID joins the “Event” table to the foreign key eventID in the “MeasurementOrFact” table.
Stream Habitat Metrics Integration Data Exchange Standard
In the sections that follow, we provide additional information on the first version of the wadeable SHMI data exchange standard developed by the PNAMP-led working group. The SHMI data exchange standard is published and maintained on the U.S. Geological Survey (USGS) OpenSource GitLab (Scully and others, 2023b) following recommendations on data standard development and sharing (Crystal‐Ornelas and others, 2021). For more detail on the development process and R code, refer to appendix 1.
Description of Standard
The SHMI data exchange standard (DES) (Scully and others, 2023b) includes a description of the data structure and guidelines for stream habitat data, including fields (with units and valid domain ranges) and relationships between tables (fig. 2; table 2), as well as data mapping and controlled vocabulary input files used to produce the data and R code to integrate compatible stream habitat data from the four participating programs. The data mapping input file included in the SHMI data exchange standard is named “DataMappingDES.csv.” Data mapping is the “assignment of source data entities and attributes to target data entities and attributes, and the resolution of disparate data” (DAMA International, 2011, p. 80). The data mapping file contains original field names (in the OriginalField column), original units (OriginalUnit column), original data type (OriginalDataType column) from source program data and the respective field names from the SHMI data exchange standard. The data mapping is used in the R code to transform compatible source data to integrated SHMI data. For example, the AIM field StreamName, NRSA field GNIS_NAME, and PIBO field Stream are mapped to the SHMI data exchange standard’s field waterBody. The controlled vocabulary input file included in the SHMI data exchange standard is named “metricControlledVocabulary.csv,” referred to as the controlled vocabulary in this document. The controlled vocabulary contains definitions, data types (for example, numeric or string), measurement units (for example, meters, degrees), and valid values (for example, a percentage must fall between 0 and 100) for all metrics in the integrated SHMI dataset. The SHMI data exchange standard also includes R code that pre-processes, transforms, and combines the data to produce the integrated SHMI dataset (Scully and others, 2023b).
Use and Limitations
The SHMI data exchange standard can be used to share and integrate compatible wadeable stream monitoring data from AIM, AREMP, NRSA, and PIBO MP. One application of the integrated data resulting from applying the SHMI data exchange standard is identifying a network of minimally impacted sites across multiple programs. These sites can be used to characterize the natural range of variables without anthropogenic impacts and help us better understand the natural variability for instream habitat. Using the integrated SHMI dataset increases the number and spatio-temporal range of minimally impacted sites.
Survey design is not documented in the programs’ metadata and was difficult to assess without consulting reports, documentation, or program experts. We accounted for survey design at a broad level and the siteSelectionType field in the “Location” table includes two categories, named “Random” and “Targeted.” The “Random” category includes any randomly selected site, such as those generated by Generalized Random Tessellation Stratified designs. The “Targeted” category includes any site chosen for a specific reason, such as testing restoration impacts like dam removal or wood placement on a site. The non-specific site selection data may make certain types of analyses difficult for answering certain questions and data users should be aware of this.
Additionally, observation variability—within and across crews—can influence measurement consistency in the field and variability in resulting metrics for a single program (Roper and others, 2002). To reduce observation variability within the program, all four programs train field personnel according to standardized protocols and quality check the data before final publication. Within programs, technicians are consistently trained, but training varies between the programs. AREMP also re-surveys 10 percent of watersheds for quality control (Miller and others, 2017). NRSA re-surveys 10 percent of sites within a single survey season to quantify human-caused and natural variation within the season (Kaufmann and others, 1999; Larsen and others, 2004).
Users need to consider these limitations when using the SHMI data exchange standard and (or) integrated data. The SHMI data exchange standard only applies to wadeable data and metrics deemed compatible by the working group and represents a subset of all data collected or computed by each program. Users who survey using the same field protocols as participating programs will want to consider analysis method compatibility before integrating their data using the SHMI data exchange standard and code. To do so, users may consult one or more of the following:
-
• Each program’s documentation and protocol cited in the metadata record
-
• Data collection and analysis methods for each program’s metric documented at Pacific Northwest Aquatic Monitoring Partnership (2024, www.MonitoringResources.org). Permanent hyperlinks to each method at Pacific Northwest Aquatic Monitoring Partnership (2024) are included in the data mapping table’s methodCollection and methodAnalysis fields.
-
• The “Controlled Vocabulary Development” section of this report.
Controlled Vocabulary Development
Metric Compatibility Summary
PNAMP facilitated discussions with the working group to evaluate metric compatibility across programs based on data collection and analysis methods for a selected subset of habitat metrics. Programs publish metrics with metadata; therefore, we chose to combine metrics and not raw field measurements. We included selected compatible metrics in the SHMI integrated dataset based on compatibility decisions by working group experts and a host of empirical studies on the comparability and precision of the data (Roper and others, 2002; Larsen and others, 2004; Whitacre and others, 2007; Al-Chokhachy and others, 2011; Roper and others, 2011). We chose to focus on the following aspects of stream habitat:
-
1. Overall reach characteristics (sampled reach length, channel gradient, and sinuosity)
-
2. Channel dimensions (bankfull width and height, average bankfull width-to-depth ratio, mean thalweg depth, average wetted width)
-
3. Channel substrate particle sizes (percentage of fines, percentage of bedrock, fine sediment percentiles)
-
4. Pools (residual pool depth, pool tail fines)
-
5. Bank characterizations (angle)
-
6. Water quality and chemistry (specific conductance, turbidity, pH, total nitrogen, total phosphorus)
Although programs also collect data that describe other aspects of stream habitat, such as riparian vegetation, in-channel wood, or floodplain characteristics, these data were not as standardized or collected as commonly or similarly by other programs, so we did not consider these aspects of stream habitat in our project.
Field measurement techniques, equipment and technology, metric calculations, and laboratory methods can vary between programs that report the same metric. As a result, assessing metric compatibility involved extensive discussions which took place over a few years to evaluate data collection and analysis methods for each individual metric. Based on the metric compatibility assessment, we compiled a controlled vocabulary of 26 metrics with definitions, value ranges, and units. The compatible metrics are a subset of program metrics and do not represent all data collected or shared by any individual program (table 3).
Links to data collection and analysis methods that record the data provenance for each metric included in the dataset are provided within the “DataMappingDES.csv” file (Scully and others, 2023b). Individual program field protocols and study design documentation can also be found on program websites. Links to program websites are reported in the “Record Level” table of the integrated dataset and within the “Source Data” section of the integrated dataset’s metadata (Scully and others, 2023a; Scully and others, 2023b).
In the sections that follow, we briefly describe reach surveys conducted by the monitoring programs and then describe metric compatibility. We describe and define each metric in the controlled vocabulary and how compatibility was assessed by the working group based on program methods and provide a table summarizing the metric compatibility across programs.
Table 3.
Summary of Stream Habitat Metrics Integration project metric compatibility by monitoring source programs listed by stream habitat characteristic.[Data for all mapped metrics may not be included in the integrated dataset because of a lack of data availability from the source program. Agencies that administer each source program are listed in table 1. Controlled vocabulary metrics are defined in Scully and others (2023b). Metric compatibility with: “Yes” indicates the metric is compatible with the SHMI controlled vocabulary and the program’s metric was included in the data mapping for the program in that column. “No” indicates the metric is not compatible with the SHMI controlled vocabulary and the program’s metric was not included in data mapping for that program. “Contingent” indicates the metric is compatible with the SHMI controlled vocabulary but is not published or shared by program and therefore is mapped but is not integrated. If the metric is shared or published in the future (and methods remain compatible), this metric could be integrated. Symbol: —, indicates “Not applicable” as the program does not collect the data or calculate the metric. Source programs: Lotic AIM, Lotic Assessment, Inventory, and Monitoring; AREMP, Aquatic and Riparian Effectiveness Monitoring Program; NARS NRSA, National Aquatic Resource Surveys National Rivers and Streams Assessment; PIBO MP, PacFish/InFish Biological Opinion Monitoring Program]
Reach Surveys
Physical habitat measurements are collected along a section of a stream, called a reach, at evenly spaced transects. Measurements start at the downstream extent of reach, the bottom of the reach, and then proceed upstream to the end, the top of the reach. Reach length, transect intervals, and stream size definitions impact program data comparability. Reach length and transect intervals are determined by a stream's size. In larger streams, transects are spaced farther apart to adequately capture natural variability. Stream size is determined by identifying bankfull which corresponds to the discharge associated with channel formation and maintenance. Bankfull is:
“The height on the streambanks where water fills the channel and begins to overflow onto the active bench (i.e., floodplain). This flow volume occurs on average every 1.5 years and is the channel-forming flow” (Bureau of Land Management, 2022, p. 9).
All four programs (AIM, AREMP, NRSA, PIBO MP) used the same bankfull indicators as described by Harrelson and others (1994), including:
Alterations to Reach Surveys
Side channels, interrupted flow, channel braids, and beaver ponds impact which measurements are taken in the field and how reach surveys are conducted. We did not include metrics or data regarding side channels, interrupted flow, or channel braids in our metric compatibility assessment or the integrated dataset. Beaver presence is accounted for in the beaverPresence column of the “Event” table. For more information on how interrupted flow, braided systems, and beaver ponds impact field methods, refer to each monitoring program’s most recent protocols (Aquatic and Riparian Effectiveness Monitoring Program, 2019; Saunders and others, 2019; U.S. Environmental Protection Agency, 2019; Bureau of Land Management, 2022).
We include a brief overview here of how programs survey reaches with side channels to allow users to understand how side channels impact surveys and available data. Side channels are channels “separated directly from the main channel by an island, not a mid-channel bar” (Bureau of Land Management, 2022, p. 111) in which an island is defined by height extending above the bankfull elevation rather than by sediment characteristics or vegetation. Each program defines side channels using this general definition. Each program only surveys side channels with distinct channels and side channels which are continuous features. All programs exclude tributaries from side channel surveys. The presence of side channels impacts which field measurements are collected, which varies by program. Only select measurements routinely measured in the main channel are also measured in side channels (table 4). These raw field measurements may not be used in further analyses or published results in all cases. For more information about side channel methodology, see the program’s protocols (Saunders and others, 2019; U.S. Environmental Protection Agency, 2019; U.S. Forest Service, 2019; Bureau of Land Management, 2022).
Table 4.
Field measurements taken within side channels during monitoring program wadeable stream surveys for metrics included in the Stream Habitat Metrics integrated dataset and data exchange standard.[Agencies that administer each source program are listed in table 1. Monitoring program: Lotic AIM, Lotic Assessment, Inventory and Monitoring; NRSA, National Rivers and Streams Assessment; AREMP, Aquatic and Riparian Effectiveness Monitoring Program; PIBO MP, PacFish/InFish Biological Opinion Monitoring Program]
Reach Characteristics
Reach Length (ReachLen and ProtocolReachLen)
Reach length is the length of the sample reach measured along the thalweg. The thalweg is the longitudinal path of the stream connecting the deepest part of the channel where the most flow occurs. Reach length provides context for the spatial resolution of transects and other metrics, such as gradient and percentage of pools. To ensure that programs capture stream heterogeneity, all programs scale reach length to stream size—the larger the wetted width or bankfull width, the longer the reach sampled. AREMP, PIBO MP, and NRSA report the total reach length sampled. AIM reports protocol reach length, which is the intended reach length to be sampled based on the size of the stream (for example, 20 times bankfull width). Protocol reach length may be greater than the reach length sampled if some transects are inaccessible. To ensure we included reach length for all programs, two fields are included in the controlled vocabulary: ReachLen and ProtocolReachLen. The field ReachLen is mapped and integrated with AREMP, PIBO MP, and NRSA data. The field ProtocolReachLen is mapped to AIM data because it is not compatible with the other programs; therefore, ProtocolReachLen is included in the SHMI but are not integrated with any other program (table 5).
Gradient (Grad)
Gradient is the slope of the water surface from the bottom of the reach to the top of the reach. Gradient is important in determining the power of the stream to transport sediment and is relevant to other metrics, such as percentage of pools. All programs measure the elevation change from the top to the bottom of the reach and divide this by the length of the reach along the thalweg to compute a gradient (Harrelson and others, 1994). PIBO MP and AIM used transit auto levels for measuring elevation change and are therefore compatible. AREMP used a laser to measure gradient for the data included in the controlled vocabulary. NRSA used different data collection methods to measure elevation change depending on the site conditions. NRSA’s primary method is a laser level or transit. If slope could not be measured using a laser level or transit and the slope is greater than 1.5 percent, then a clinometer is used. If the slope is less than 1.5 percent, then map-based calculations are used (Kaufmann and others, 2022). NRSA reports the best available slope as XSLOPE regardless of the method used. Some of their methods are less precise than other programs but the working group experts agreed that the NRSA field XSLOPE was compatible with the other three programs and XSLOPE was integrated for Grad (table 5).
Sinuosity (Sin)
Reach sinuosity is the reach length along the thalweg divided by the straight-line distance between the bottom of the reach and the top of the reach. Sinuosity is a key descriptive characteristic of stream type that is correlated with sediment size and slope. Sinuosity can also be an indicator of habitat complexity since streams with higher sinuosity contain habitable features such as backwaters and oxbows. PIBO MP and NRSA use measured reach length to calculate sinuosity and are compatible. AIM uses protocol reach length to calculate sinuosity and is compatible because sinuosity is not calculated or reported for partially sampled reaches (table 5).
Table 5.
Stream Habitat Metrics Integration (SHMI) controlled vocabulary that describe reach characteristics and their compatibility with source monitoring programs (with program’s original field names if measured and [or] calculated) and status of the metric in SHMI data mapping and integrated data.[Agencies that administer each source program are listed in table 1. Source program: AIM, Assessment, Inventory, and Monitoring; AREMP, Aquatic and Riparian Effectiveness Monitoring Program; NRSA, National Rivers and Streams Assessment; PIBO MP, PacFish/InFish Biological Opinion Monitoring Program. SHMI dataset published in Scully and others (2023b). Abbreviation and symbol: SHMI, Stream Habitat Metric Integration project; —, indicates the program’s metric name does not exist (if not measured and [or] calculated)]
Channel Dimensions
Bankfull Width (BFWidth)
Bankfull width is a measure of stream size, which is a natural factor that influences many other stream habitat characteristics. All four programs used comparable field and analysis methods to quantify average bankfull width (table 6). They computed bankfull width as the average of bankfull widths collected at 6–11 equally spaced transects in a sample reach (table 6).
Bankfull Height (BFHeight)
Bankfull height can be collected and used by aquatic monitoring programs in many ways. Bankfull height can be compared to bench heights to determine floodplain connectivity or to characterize the shape of cross-sections of the stream, which is necessary to determine channel hydraulics and sediment transport. Bench height and floodplains can be challenging to consistently define. Instead of using bench height and floodplains, programs measure cross-sections of streams (including bankfull height), which tend to be more consistent (Houston and others, 2002; Roper and others, 2011).
PIBO MP and AREMP take a cross-section approach measuring the height from bankfull to the streambed at 5–10 locations at each of 11 transects throughout the reach, and they do not measure benches or floodplains. NRSA measured both cross-sections and assesses bench height and floodplain connectivity, as well as measuring bankfull height from the water surface. AIM primarily focuses on comparing bankfull height to bench and floodplain heights and measures bankfull height from the water surface. This means that PIBO MP and AREMP bankfull height data are comparable and AIM and NRSA bankfull height data are compatible, but PIBO MP and AREMP are not compatible with AIM and NRSA. Therefore, only AREMP and PIBO MP were mapped as part of SHMI data exchange standard, and only AREMP data is included in the integrated dataset because PIBO MP data were not readily calculated or shared when completing this work (table 6). In the future, AIM and NRSA bankfull heights could be recalculated to be compatible and integrated with PIBO MP and AREMP.
Bankfull Width to Depth Ratio (AvgBFWDRatio)
Bankfull width-to-depth ratios are used to classify stream types (Rosgen, 1996) and characterize channel hydrology and sediment transport dynamics. These ratios are based on cross-sectional approaches to measuring average bankfull depth and are calculated by dividing the bankfull width at a transect by the average bankfull depth at that transect and then averaging the bankfull width to depth ratio across 11 transects in a reach. NRSA, PIBO MP, AIM, and AREMP data collection and analysis methods for width are comparable, yet only PIBO MP and AREMP methods are comparable for bankfull depth. Therefore, this metric is only mapped and included in the dataset for PIBO MP and AREMP programs (table 6).
Mean Thalweg Depth (MeanThalwegDepth)
Mean thalweg depth is the reach-wide average of the depth measurements taken along the deepest part of the channel, the thalweg. AIM and NRSA measure thalweg depth from the streambed to the water surface at 100–161 equally spaced locations throughout the reach and calculate mean thalweg depth using compatible methods. AREMP and PIBO MP do not currently calculate this metric and are not mapped or included in the data (table 6).
Average Wetted Width from Transects (WetWidth)
Wetted width is the average width of the wet channel collected at 11–21 transects in the sample reach and provides a coarse assessment of available habitat during summer low flows. AIM, PIBO MP, and NRSA measurements include mid-channel bars (but not islands) in wetted width. AIM and PIBO MP measurements include the main and side channels, and AREMP measurements do not include side channels. The experts consider AIM, PIBO MP, AREMP, and NRSA field measurements compatible.
AREMP wetted widths wettedWidth_ave metric data were not published at the time of this publication but are considered compatible to AIM WettedWidthAvg by the experts despite excluding mid-channel bars. In a forthcoming data release, AREMP plans to include mid-channel bars in wettedWidth_ave. The NRSA XWIDTH metric calculation is the maximum wet width measurement from the main or side channel. The PIBO MP measurements are compatible, but a wetted width metric is not calculated and published as part of their dataset. Despite these differences, for the purposes of the integrated data, WetWidth was considered compatible across all four programs, but only mapped and integrated for AIM and NRSA because they are the only programs that publish the metrics (table 6).
Table 6.
Stream Habitat Metrics Integration (SHMI) controlled vocabulary that describe channel dimensions and their compatibility with source monitoring programs (with program’s original field names if measured and [or] calculated) and status of the metric in SHMI data mapping and integrated data.[Agencies that administer each source program are listed in table 1. Source program: AIM, Assessment, Inventory, and Monitoring; AREMP, Aquatic and Riparian Effectiveness Monitoring Program; NRSA, National Rivers and Streams Assessment; PIBO MP, PacFish/InFish Biological Opinion Monitoring Program. SHMI dataset published in Scully and others (2023b). Abbreviation and symbol: SHMI, Stream Habitat Metric Integration project; —, indicates the program’s metric name does not exist (if not measured and [or] calculated) or is not shared or known]
PIBO MP BFHeight is compatible, but data are not published or shared by program, and therefore, data are mapped but not integrated. If the metric is shared or published in the future (and methods remain compatible), this metric could be integrated.
Substrates
Streambed Particle Size Distributions (D16, D50, D84, PctBdrk, PctFines2, PctFines6)
The size of particles that compose streambeds and riverbeds play a critical role in the type, diversity, and abundance of organisms inhabiting a given system (Allan and Castillo, 2007; Bryce and others, 2010; Descloux and others, 2013; Duan and others, 2014; Wharton and others, 2017). Higher percentages of fine sediment (controlled vocabulary metrics: PctFines2, PctFines6) can be harmful for aquatic biota. Particle size distributions (controlled vocabulary metrics: D16, D50, D84) can be used with channel dimension data to determine sediment transport dynamics and whether the stream channel is aggrading or eroding.
All four programs assess the size of 105 substrate particles to 300 substrate particles along 11–21 equally spaced transects using modified Wolman (1954) pebble counts. Programs differ in the number of particles collected, where particles are collected from, and whether particle size is measured or estimated. Despite these differences, we considered a subset of substrate metrics compatible across most programs. The AIM, PIBO MP, and AREMP programs measure and record each individual particle while NRSA visually estimates individual particle sizes according to predefined class sizes (bedrock, boulder, cobbles, sand, fines, etc.). Visually estimating particle size is incompatible with programs that measure individual particles, so NRSA particle-size data are incompatible with data from the other programs except when assessing particles that are smaller (sand [less than (<) 2 millimeters (mm)] and fines [<1 mm]) or larger bedrock (greater than [>] 4097 mm) than substrates measured by other programs. Therefore, NRSA PCT_SAFN is only compatible with other programs for particles less than 2 mm and PCT_BDRK for percentage of bedrock. AIM and PIBO MP do not report percentage of bedrock, so only NRSA PctBdrk data are included (table 7).
The location of particle collection in the stream channel is the most important factor to consider when comparing substrate methods (Beschta and Platts, 1986). Particle collection locations may differ among programs depending on their interest in characterizing only the streambed that is mobile during typical flow events (active wetted channel) or if they are also interested in assessing bank substrate that is mobile during lateral scouring (bankfull channel). Faustini and Kaufmann (2007) and Bunte and others (2009) demonstrated that particle count results differ based on where channel particles are collected: in the bankfull channel, in the active channel, or in the wetted width. Particles summarized in the active channel (for example, the on-average yearly flow event; Clarkin, 2008) are comparable to particles summarized in the wetted channel. However, metrics including particles above the active channel (AREMP D16, D50, D84, bedrock_pcnt, pcnt_fines_tran2, pcnt_fines_tran6) are not equivalent and often result in smaller values. Because AREMP measures particles outside of the active channel, none of their substrate metrics are currently compatible with the other programs (table 7).
Table 7.
Stream Habitat Metrics Integration (SHMI) controlled vocabulary that describe substrates and their compatibility with source monitoring programs (with program’s original field names if measured and [or] calculated) and status of the metric in SHMI data mapping and integrated data.[Agencies that administer each program are listed in table 1. Source program: AIM, Assessment, Inventory, and Monitoring; AREMP, Aquatic and Riparian Effectiveness Monitoring Program; NRSA, National Rivers and Streams Assessment; PIBO MP, PacFish/InFish Biological Opinion Monitoring Program. SHMI dataset published in Scully and others (2023b). Abbreviation and symbol: SHMI, Stream Habitat Metric Integration project; —, indicates the program’s metric name does not exist (if not measured and [or] calculated) or is not shared or known]
Pools
Residual Pool Depth (RPD), Percentage of Pools (PctPool), and Pool Frequency (PoolFreq)
Defining pool habitat is important to determine available fish habitat, particularly during summer low flows. AREMP, PIBO MP, and AIM all use an identical definition of pools. They require six criteria to be met regarding pool shape, depth, width, and placement of the pool within the reach and do not assess pools if flow is not present (Lanigan, 2010). NRSA defines pools during data analysis from longitudinal thalweg measurements based on depth requirements (U.S. Environmental Protection Agency, 2019).
Once pools are defined and identified, all programs use the Lisle (1987) approach to measure pool dimensions. Residual pool depth is the difference between the pool tail depth and the maximum pool depth. Percentage of pools is the percentage of the sample reach (linear extent) classified as pool habitat, and pool frequency is the number of pools within the sampled reach standardized to pools per kilometer. The expert working group agreed that residual pool depth, percentage of pools, and pool frequency are compatible between AREMP, PIBO MP, and AIM (table 8). Preliminary analysis completed by AIM found that NRSA methods for defining pools are incompatible with other programs, so NRSA pool metrics are not mapped or integrated (table 8).
Pool Tail Fines (PoolTailFines2, PoolTailFines6)
The metrics that include pool fines describe the average percentage of fine particles less than 2 mm (controlled vocabulary metric: PoolTailFines2) or less than 6 mm (controlled vocabulary metric: PoolTailFines6) on the pool tail. Pool fines are the average percentage of fine particles less than 2 mm and less than 6 mm on the pool tail. Applications are similar to those for substrate size distributions (discussed in the “Substrates” section), but this metric specifically quantifies the percentage of fine sediment in pool tails which are ideal fish spawning habitat. As described in the section Residual Pool Depth (controlled vocabulary metric: RPD), Percentage of Pools (controlled vocabulary metric: PctPool), and Pool Frequency (controlled vocabulary metric: PoolFreq), AIM, PIBO MP, and AREMP use compatible methods to define pools but slightly different methods for pool tail fines (Bauer and Burton, 1993; U.S. Forest Service, 2005). AREMP counts pool fines at all pools in the reach but only counts particles that are less than 2 mm. In contrast, AIM and PIBO MP count pool tail fines (in two size classes: particles less than 2 mm and particles less than 6 mm) at the first 10 scour and plunge pools. The working group agreed the metric for percentage of fines less than 2 mm is comparable across AIM, AREMP and PIBO MP. The metric for percentage of fines less than 6 mm is comparable across AIM and PIBO MP. NRSA does not have comparable metric and is not included in data mapping or integrated data (table 8).
Table 8.
Stream Habitat Metrics Integration (SHMI) controlled vocabulary that describe pool characteristics and their compatibility with source monitoring programs (with program’s original field names if measured and [or] calculated) and status of the metric in SHMI data mapping and integrated data.[Agencies that administer each source program are listed in table 1. Source program: AIM, Assessment, Inventory, and Monitoring; AREMP, Aquatic and Riparian Effectiveness Monitoring Program; NRSA, National Rivers and Streams Assessment; PIBO MP, PacFish/InFish Biological Opinion Monitoring Program. SHMI dataset published in Scully and others (2023b). Abbreviation and symbol: SHMI, Stream Habitat Metric Integration project; —, indicates the program’s metric name does not exist (if not measured and [or] calculated) or is not shared or known]
Bank Characterizations
Bank Angle (BankAngle)
Bank angle is the average angle of stream banks within a reach. AIM and PIBO MP bank angle is measured where streambed meets the streambank to the first flat depositional feature at or above bankfull at transects on the left and right stream banks. Acute angles indicate undercut banks, while obtuse angles indicate flattened banks. Percent stability measured by AIM and PIBO MP is the percentage of banks within a reach that lack signs of active erosion and is measured on left and right stream banks at 21 transects within the reach. The stability of each bank is assessed using a plot that is 50 centimeters (cm) in width and extends from scour line to the first flat depositional feature at or above bankfull. Bank stability and bank angle can be used to assess the susceptibility of stream banks to natural and accelerated erosion rates associated with anthropogenic activities. Unstable banks due to factors such as lack of vegetation or the presence of livestock trampling can accelerate erosion and flattened banks (Trimble and Mendel, 1995). This contributes to excessive fine sediment loading, wider stream channels, and altered sediment transport dynamics degrading habitat for fish. Alternatively, stable banks typically have more undercut banks that provide important habitat for fish (Doyle and Stanley 2003).
AREMP does not collect bank stability or angle measurements because there is no grazing in their study area. AIM and PIBO MP have comparable collection methods for bank angle (Platts and others, 1987) but not bank stability (Bauer and Burton, 1993; Burton and others, 2011) because AIM includes depositional banks while PIBO MP does not (table 9). This means AIM and PIBO MP bank angle metrics are compatible while their metrics that describe the percentage of bank stability are not. NRSA does not assess bank stability, and its methods to assess bank angle are different from the other programs and are incompatible. NRSA bank angle is collected from where the water edge meets stream bank instead of where streambed meets streambank, so is 180 degrees offset from PIBO MP and AIM, and does not follow the same complex rule set as AIM and PIBO MP on selecting the bank angle to measure in varied erosional/depositional habitats or when multiple bank angles are present (table 9).
Table 9.
Stream Habitat Metrics Integration (SHMI) controlled vocabulary that describe bank characteristics and their compatibility with source monitoring programs (with program’s original field names if measured and [or] calculated) and status of the metric in SHMI data mapping and integrated data.[Agencies that administer each source program are listed in table 1. Source program: AIM, Assessment, Inventory, and Monitoring; AREMP, Aquatic and Riparian Effectiveness Monitoring Program; NRSA, National Rivers and Streams Assessment; PIBO MP, PacFish/InFish Biological Opinion Monitoring Program. SHMI dataset published in Scully and others (2023b). Abbreviation and symbol: SHMI, Stream Habitat Metric Integration project; —, indicates the program’s metric name does not exist (if not measured and [or] calculated)]
Water Quality and Chemistry
Specific Conductance, Turbidity, pH, Total Nitrogen, and Total Phosphorus
Programs use two primary methods for collecting water quality: in situ measurements and grab samples that are analyzed in the laboratory. All programs collect some measurements in situ, while only AREMP, AIM, and NRSA collect water-quality grab samples. PIBO MP does not collect water-quality grab samples.
Conductivity measures water’s ability to conduct an electrical current, and specific conductance is temperature-corrected conductivity. Anthropogenic activities can increase conductivity, which reduces water quality, causes toxicity, and leads to osmoregulation imbalances in stream biota (Miller and others, 2007; Vander Laan and others, 2013; Clements and Kotalik, 2016). AREMP and AIM measure specific conductance in situ using a sonde and are compatible. NRSA measures specific conductance in situ using a sonde and from grab samples taken to, and measured in, a laboratory. The in situ data are not released publicly in the dataset used for this project, while the grab-sample data are available publicly, so the NRSA conductivity data are not compatible at this time (table 10).
Turbidity is the average water clarity as measured by the suspended solids in the water column. Turbidity can affect the ability of organisms to forage and photosynthesize and is also correlated with the percentage of fine sediment in streams. AIM collects turbidity in situ using a turbidimeter. NRSA measures turbidity in the laboratory only. AIM and NRSA turbidity data are not compatible. PIBO MP and AREMP do not measure turbidity (table 10).
pH is a measure of hydrogen ion activity in water. Acidification or alkalinization of aquatic systems can be detrimental to biota and ecosystem processes. AIM and AREMP collect pH in situ using a sonde. NRSA measures pH in situ using and from grab samples taken to, and measured in, a laboratory. The in situ data are not released publicly in the dataset used for this project, while the grab-sample data are available publicly, so the NRSA pH data are not compatible with the controlled vocabulary (table 10).
Excess loading from nutrients such as nitrogen and phosphorus can lead to eutrophication and disrupt food webs. AIM, AREMP, and NRSA all take grab samples to assess total nitrogen and total phosphorus and are compatible. AIM and AREMP process the samples in the same laboratory at Utah State University. NRSA processes the samples at the Pacific Ecological Systems Division Analytical Laboratory (previously part of the Willamette Research Station prior to 2023) (table 10).
Table 10.
Stream Habitat Metrics Integration (SHMI) controlled vocabulary that describe water-quality and chemistry characteristics and their compatibility with source monitoring programs (with program’s original field names if measured and [or] calculated) and status of the metric in SHMI data mapping and integrated data.[Agencies that administer each source program are listed in table 1. Source program: AIM, Assessment, Inventory, and Monitoring; AREMP, Aquatic and Riparian Effectiveness Monitoring Program; NRSA, National Rivers and Streams Assessment; PIBO MP, PacFish/InFish Biological Opinion Monitoring Program. SHMI dataset published in Scully and others (2023b). Abbreviation and symbol: SHMI, Stream Habitat Metric Integration project; —, indicates the program’s metric name does not exist (if not measured and [or] calculated)]
AREMP SpecificConductance, pH, TotalNitrogen, and TotalPhosphorous are compatible but are not published or shared by the program and therefore are mapped but are not integrated. If the metrics are shared or published in the future (and methods remain compatible), these metrics could be integrated.
Key Considerations When Building Data Exchange Standards and Integrating Datasets
Product Longevity
Data integration requires that subject-matter experts commit to collaborating to define data exchange standards and assess data and metric compatibility across programs. Data integration also requires staff to manage data integration code and documentation. In the case of SHMI data integration, PNAMP managed the data integration code and documentation. Using R code for data integration tasks allows a reproducible process which may be customized as needed by other programs or individuals. The code is suited to four specific monitoring programs. The SHMI exchange standard will be affected if programs change and adapt future data, alter (or add new) field names, data collection, or analysis methods, or both. Changes to inputs to the SHMI exchange standard could also cause the associated code to become deprecated and no longer function as intended. Therefore, as programs publish new data, the SHMI data exchange standard and code will need to be updated to integrate compatible data into a new version of the integrated dataset.
There are options to maintain the SHMI data exchange standard and integrated data. PNAMP could continue to act as a third-party data manager to maintain the SHMI data exchange standard and integrate new data. This approach would require continued collaboration and communication about changes to data or methods to re-evaluate metric compatibility as needed. Third-party management and maintenance are suited to standardized data published in a consistent manner and formatted with well-documented metadata, which is currently a challenge for these four programs. This option keeps the burden off individual programs to maintain a data exchange standard and integrate data but requires commitment and resources from PNAMP. Alternatively, individual programs could take ownership of their data processing and transformation code, keeping it up to date according to their program changes and using it to produce a subset of compatible data to release. However, this approach relies on a substantial commitment of time and resources from each program, which may not be possible given resource constraints.
Future Development
In addition to maintaining the SHMI data exchange standard and integrated data into the future, there are possibilities for improving and expanding the products in the future. Many of the tasks to improve and expand these products will require additional experts as well as the PNAMP working groups’ continued engagement with the project. Many state, federal, and Tribal programs collect stream data using the same, or similar, methods as the four programs already included in the SHMI integrated dataset. These programs include Washington State’s Watershed Health Monitoring Program (Washington State Department of Ecology, 2021), Okanogan Basin Monitoring (Okanogan Basin Monitoring and Evaluation Program, 2022), CalFish (CalFish, 2018), and the National Park Service’s Southeast Coast Inventory and Monitoring Network (McDonald and others, 2018). Some state and Tribal monitoring programs use EPA’s NRSA sampling methods to intensify the national 5-year random sampling design (see Minnesota Pollution Control Agency (MPCA) Monitoring Programs (Minnesota Pollution Control Agency, 2024); and Confederated Tribes of the Umatilla Indian Reservation (CTUIR) (Jones and others, 2015). They produce the same metrics at different spatial and temporal scales and, if added, would further expand the integrated dataset.
The integrated dataset and the controlled vocabulary contain a subset of all metrics from the AIM, AREMP, NRSA, and PIBO MP programs. Other types of data and metrics may be compatible and integrated in the future, after further in-depth compatibility discussions. These data and metrics include (but are not limited to):
-
• canopy cover (AIM and NRSA)
-
• channel incision (AIM and NRSA)
-
• large wood frequency and volume (AIM, AREMP, NRSA, PIBO MP)
-
• macroinvertebrate metrics (AIM, AREMP, NRSA, PIBO MP)
-
• bank stability (AIM and PIBO MP)
-
• side channel presence (AIM, AREMP, NRSA. PIBO MP)
Furthermore, a subset of metrics from some programs are compatible with the integrated data, but the data were not available during the time of this project. The following metrics could be integrated when data are made available:
-
• RPD, PctPool, PoolFreq, WetWidth (AREMP)
-
• TotalNitrogen, TotalPhosphorous, pH, SpecificConductance (AREMP)
-
• D16, D84 (PIBO MP)
-
• BeaverPresence (AREMP, PIBO MP)
There are examples of where data are collected comparably across programs, but the programs don’t calculate method compatible with the controlled vocabulary. To add data to the SHMI dataset, the programs can calculate and share the following metrics based on the controlled vocabulary definitions:
To provide additional co-variates to the data, the SHMI integrated data could also be combined with other data, such as the National Hydrography Dataset (U.S. Geological Survey, 2004), StreamCat (Hill and others, 2016), Parameter-elevation Regressions on Independent Slopes Model (PRISM) climate data (PRISM Climate Group, 2014), NorWest Stream Temperature data (Isaak and others, 2017), or Hydrologic Unit Codes (HUC) from the USGS Watershed Boundary Dataset (Jones and others, 2022).
Raw data could be assessed for compatibility and then combined. For this effort, the working group chose to integrate metrics rather than raw data because metrics were more readily available with metadata documentation. One of the initial drivers of this work was to combine existing datasets and not create new datasets. Integrating raw data could alleviate some of the challenges faced when programs implement different analysis methodologies and allow the data user to decide how to summarize the measurements into metrics. Raw data would require additional time and resources from the individual programs to provide access to the raw data and create metadata, which at this time (2023) are not available. Additionally, an investment in technical expertise from the individual programs would be necessary to create standard analysis methods for the raw data. There are also examples where field methods are different, so the raw data are different across programs. Yet, source data monitoring program experts agree the metrics are compatible. For those examples, raw data could not be combined, only metrics. At the time of this work (2023), combining raw data was outside the project scope, but could be attempted in future studies.
Finally, building additional tools to download integrated data subsets will promote accessibility and ease of use. A web tool or data dashboard could allow users to select data by certain attributes (such as geographic region, watershed, metric, source program, etc.) and download files for analysis or visualization. This would make the data more accessible for users, eliminating the need to download the entire dataset.
Summary
Collaboration with four federally managed monitoring programs collecting stream habitat data enabled the Pacific Northwest Aquatic Monitoring Partnership (PNAMP) Stream Habitat Metrics Integration (SHMI) project to develop the SHMI data exchange standard. This is the first data exchange standard developed specifically for monitoring program wadeable stream habitat data. The SHMI data exchange standard was used to integrate compatible data and metrics from four monitoring programs to create the integrated SHMI dataset. The four participating programs are the Bureau of Land Management Assessment, Inventory, and Monitoring (AIM) lotic division, the Federal interagency Aquatic and Riparian Effectiveness Monitoring Program (AREMP), the U.S. Environmental Protection Agency National Aquatic Resource Surveys (NARS) National Rivers and Streams Assessment (NRSA), and the Federal interagency (Bureau of Land Management and U.S. Forest Service) PacFish/InFish Biological Opinion Monitoring Program (PIBO MP). Combining data collected across the United States from 2000 to 2022 allows researchers, land managers, and decision-makers to ask questions and study trends in stream habitat (and sensitive species therein) across jurisdictional boundaries and expanded timeframes.
The SHMI data exchange standard was published to the U.S. Geological Survey OpenSource GitLab and the SHMI integrated dataset was published to the U.S. Geological Survey ScienceBase data repository to promote re-use and continued future development of both products. Future development may include the addition of compatible data and (or) metrics to the dataset and SHMI data exchange standard, combining other information from other datasets, and adding data collected in the future from these four monitoring programs or data from other programs who use the same, or similar, field and analysis methods. Dedicated resources, personnel, and continued collaboration among monitoring programs could help enhance later versions of these products.
References Cited
Al-Chokhachy, R., Roper, B.B., Archer, E.K., and Miller, S., 2011, Quantifying the extent of and factors associated with the temporal variability of physical stream habitat in headwater streams in the interior Columbia River Basin: Transactions of the American Fisheries Society, v. 140, no. 2, p. 399–414.
Allan, J.D., and Castillo, M.M., 2007, Stream Ecology—Structure and function of running waters: Dordrecht, Springer Netherlands, 436 p., accessed January 5, 2022, at https://doi.org/10.1007/978-1-4020-5583-6.
Archer, E., Hough-Snee, N., Van Wagenen, A., Lokteff, R., and Roper, B.B., 2012, The PACFISH/INFISH Biological Opinion (PIBO) effectiveness monitoring program and invasive plant species detection—A retrospective summary 2003–2011: U.S. Forest Service and Bureau of Land Management, 26 p., accessed April 15, 2024, at https://www.fs.usda.gov/biology/nsaec/assets/piboinvasivesmappingdraftfinaltext.pd.pdf.
Bayer, J.M., Scully, R.A., Dlabola, E.K., Courtwright, J.L., Hirsch, C.L., Hockman-Wert, D., Miller, S.W., Roper, B.B., Saunders, W.C., and Snyder, M.S., 2023, Sharing FAIR monitoring program data improves discoverability and reuse: Environmental Monitoring and Assessment, v. 195, no. 10, p. 1141, accessed October 1, 2023, at https://doi.org/10.1007/s10661-023-11788-4.
Beschta, R.L., and Platts, W.S., 1986, Morphological features of small streams—Significance and function: Water Resources Bulletin, v. 22, no. 3, p. 369–379, accessed October 1, 2024, at https://doi.org/10.1111/j.1752-1688.1986.tb01891.x.
Bureau of Land Management, 2015, AIM National Aquatic Monitoring Framework—Introducing the framework and indicators for lotic systems: U.S. Department of the Interior, Bureau of Land Management National Operations Center, Technical Reference 1735–1, accessed February 10, 2021, at https://www.blm.gov/sites/blm.gov/files/uploads/AIM%20National%20Aquatic%20Monitoring%20Framework.pdf.
Bureau of Land Management, 2022, AIM National Aquatic Monitoring Framework—Field protocol for wadeable lotic systems: U.S. Department of the Interior, Bureau of Land Management National Operations Center, Technical Reference 1735–2, accessed February 15, 2021, at https://www.blm.gov/sites/blm.gov/files/docs/2021-03/AIM%20National%20Aquatic%20Monitoring%20Framework%2C%20Field%20Protocol%20for%20Wadeable%20Lotic% 20Systems%2C%20TR1735-2.pdf.
Bureau of Land Management Assessment, Inventory, and Monitoring Project Team, 2021, I_Indicators: Bureau of Land Management Geospatial Business Platform vector digital data, accessed April 15, 2023, at https://gbp-blm-egis.hub.arcgis.com/datasets/BLM-EGIS:blm-natl-aim-lotic-indicators-hub/about.
CalFish, 2018, A California cooperative anadromous fish and habitat data program: CalFish website, accessed November 28, 2022, at https://www.calfish.org/.
Collins, M.J., Gray, J.R., Peppler, M.C., Fitzpatrick, F.A., and Schubauer-Berigan, J.P., 2012, Developing a national stream morphology data exchange—Needs, challenges, and opportunities: Eos, v. 93, no. 20, p. 195, accessed September 20, 2021, at https://doi.org/10.1029/2012EO200005.
Crystal‐Ornelas, R., Varadharajan, C., Bond‐Lamberty, B., Boye, K., Burrus, M., Cholia, S., Crow, M., Damerow, J., Devarakonda, R., Ely, K.S., Goldman, A., Heinz, S., Hendrix, V., Kakalia, Z., Pennington, S.C., Robles, E., Rogers, A., Simmonds, M., Velliquette, T., Weierbach, H., Weisenhorn, P., Welch, J.N., and Agarwal, D.A., 2021, A guide to using GitHub for developing and versioning data standards and reporting formats: Earth and Space Science, v. 8, no. 8, p. e2021EA001797, accessed September 21, 2021, at https://doi.org/10.1029/2021EA001797.
Darwin Core Maintenance Group, 2021, Darwin Core quick reference guide: Biodiversity Information Standards (TDWG) website, accessed February 1, 2021, at https://dwc.tdwg.org/terms/.
De Pooter, D., Appeltans, W., Bailly, N., Bristol, S., Deneudt, K., Eliezer, M., Fujioka, E., Giorgetti, A., Goldstein, P., Lewis, M., Lipizer, M., Mackay, K., Marin, M., Moncoiffé, G., Nikolopoulou, S., Provoost, P., Rauch, S., Roubicek, A., Torres, C., van de Putte, A., Vandepitte, L., Vanhoorne, B., Vinci, M., Wambiji, N., Watts, D., Klein Salas, E., and Hernandez, F., 2017, Toward a new data standard for combined marine biological and environmental datasets—Expanding OBIS beyond species occurrences: Biodiversity Data Journal, v. 5, no. 5, p. e10989, accessed August 10, 2021, at https://doi.org/10.3897/BDJ.5.e10989.
Dias-Silva, K., Vieira, T.B., de Matos, T.P., Juen, L., Simião-Ferreira, J., Hughes, R.M., and De Marco Júnior, P., 2021, Measuring stream habitat conditions—Can remote sensing substitute for field data?: Science of the Total Environment, v. 788, p. 147617, accessed January 10, 2022, at https://doi.org/10.1016/j.scitotenv.2021.147617.
Habermann, T., 2018, Metadata life cycles, use cases and hierarchies: Geosciences, v. 8, no. 5, p. 1–15, accessed January 11, 2022, at https://doi.org/10.3390/geosciences8050179.
Hill, R.A., Weber, M.H., Leibowitz, S.G., Olsen, A.O., and Thornbrugh, D.J., 2016, The Stream-Catchment (StreamCat) dataset—A database of watershed metrics for the conterminous United States: Journal of the American Water Resources Association, v. 52, no. 1, p. 120–128. [Also available at https://doi.org/10.1111/1752-1688.12372.]
Horsburgh, J.S., Aufdenkampe, A.K., Mayorga, E., Lehnert, K.A., Hsu, L., Song, L., Spackman Jones, A., Damiano, S.G., Tarboton, D.G., Valentine, D., Zaslavsky, I., and Whitenack, T., 2016, Observations Data Model 2—A community information model for spatially discrete Earth observations: Environmental Modelling & Software, v. 79, p. 55–74, accessed August 10, 2021, at https://doi.org/10.1016/j.envsoft.2016.01.010.
Isaak, D.S., Peterson, W.E., Nagel, J.V.D., Luce, C., Hostetler, S., Dunham, J., Roper, B., Wollrab, S., Chandler, G., Horan, D., and Parkes-Payne, S., 2017, The NorWeST summer stream temperature model and scenarios for the western U.S.—A crowd-sourced database and new geospatial tools foster a user community and predict broad climate warming of rivers and streams: Water Resources Research, v. 53, no. 11, p. 9181–9205. [Also available at https://doi.org/10.1002/2017WR020969.]
Jones, K.A., Niknami, L.S., Buto, S.G., and Decker, D., 2022, Federal standards and procedures for the national Watershed Boundary Dataset (WBD): U.S. Geological Survey Techniques and Methods 11-A3 (5th ed.), book 11, chap. A3, 54 p. [Also available at https://doi.org/10.3133/tm11A3.]
Jones, K.L., O’Daniel, S.J., and Beechie, T.J., Zakrajsek, John, and Webster, J.G., 2015, Physical habitat monitoring strategy (PHAMS) for reach-scale restoration effectiveness monitoring: U.S. Geological Survey Open-File Report 2015–1069, 58 p. [Also available at http://dx.doi.org/10.3133/ofr20151069.]
Kachergis, E., Miller, S.W., McCord, S.E., Dickard, M., Savage, S., Reynolds, L.V., Lepak, N., Dietrich, C., Green, A., Nafus, A., Prentice, K., and Davidson, Z., 2022, Adaptive monitoring for multiscale land management—Lessons learned from the Assessment, Inventory, and Monitoring (AIM) principles: Rangelands, v. 44, no. 1, p. 50–63.
Katz, S.L., Barnas, K.A., Diaz, M., and Hampton, S.E., 2019, Data system design alters meaning in ecological data—Salmon habitat restoration across the U.S. Pacific Northwest: Ecosphere, v. 10, no. 11, p. e02920, accessed August 15, 2021, at https://doi.org/10.1002/ecs2.2920.
Kaufmann, P.R., Levine, P., Robison, E.G., Seelinger, C., and Peck, D.V., 1999, Quantifying physical habitat in wadeable streams: U.S. Environmental Protection Agency EPA/620/R-99/003, accessed January 30, 2023, at https://archive.epa.gov/emap/archive-emap/web/html/phyhab.html.
Kaufmann, P.R., and Robison, E.G., 1994, Physical habitat assessment, in Klemm, D.J., and Lazorchak, J.M., eds., Environmental monitoring and assessment program 1994 pilot field operations manual for streams: Cincinnati, Ohio, U.S. Environmental Protection Agency, Office of Research and Development, p. 77–118.
Kaufmann, P.R., and Robison, E.G., 1998, Physical habitat characterization, in Lazorchak, J.M., Klemm, D.J., and Peck, D.V., eds., Environmental monitoring and assessment program—Surface waters—Field operations and methods for measuring the ecological condition of wadeable streams: Washington, D.C., U.S. Environmental Protection Agency, Office of Research and Development, p. 77–118.
Larsen, D.P., Kaufmann, P.R., Kincaid, T.M., and Urquhart, N.S., 2004, Detecting persistent change in the habitat of salmon-bearing streams in the Pacific Northwest: Canadian Journal of Fisheries and Aquatic Sciences, v. 61, no. 2, p. 283–191, accessed January 15, 2022, at https://doi.org/10.1139/F03-157.
Lisle, T.E., 1987, Using “residual depths” to monitor pool depths independently of discharge: U.S. Forest Service, Pacific Southwest Forest and Range Experiment Station Res. Note PSW-RN-394, 4 p., accessed April 15, 2023, at https://doi.org/10.2737/PSW-RN-394.
McDonald, J.M., Gregory, M.B., Riley, J.W., and Starkey, E.N., 2018, Monitoring wadeable stream habitat conditions in southeast coast network parks: National Park Service, U.S. Department of the Interior NPS/SECN/NRR—2018/1715, 130 p., accessed April 1, 2023, at https://irma.nps.gov/DataStore/DownloadFile/605870.
Miller, S.A., Gordon, S.N., Eldred, P., Beloin, R.M., Wilcox, S., Raggon, M., Andersen, H., and Muldoon, A., 2017, Northwest forest plan—The first 20 years (1994–2013)—Watershed condition status and trends: U.S. Forest Service, Pacific Northwest Research Station General Technical Report PNW-GTR-932, 84 p.
Minnesota Pollution Control Agency, 2024, Minnesota Pollution Control Agency—River and stream biological monitoring: Minnesota Pollution Control Agency website, accessed August 5, 2024, at https://www.pca.state.mn.us/air-water-land-climate/river-and-stream-biological-monitoring.
Northwest Forest Plan Aquatic and Riparian Effectiveness Monitoring Program, 2015, Northwest forest plan—The first 20 years (1994–2013): Watershed Condition Status and Trend [ArcGIS geodatabase], accessed May 3, 2023, at https://www.fs.usda.gov/r6/reo/monitoring/downloads/watershed/NwfpWatershedCondition20yrReport.gdb.zip.
Okanogan Basin Monitoring and Evaluation Program, 2022, Okanogan Basin monitoring: Okanogan Basin Monitoring and Evaluation Program webpage, accessed November 28, 2022, at https://www.okanoganmonitoring.org/.
Pacific Northwest Aquatic Monitoring Partnership, 2024, Monitoring Resources: Pacific Northwest Aquatic Monitoring Partnership website, accessed January 30, 2023, at www.monitoringresources.org.
Platts, W.S., Armour, C., Booth, G.D., Bryant, M., Bufford, J.L., Cuplin, P., Jensen, S., Lienkaemper, G.W., Minshall, G.W., Monsen, S.P., Nelson, R.L., Sedell, J.R., and Tuhy, J.S., 1987, Methods for evaluating riparian habitats with applications to management: U.S. Forest Service, Intermountain Research Station General Technical Report INT-221, 183 p.
PRISM Climate Group, 2014, Parameter-elevation regressions on independent slopes model (PRISM): Oregon State University website, accessed February 2, 2023, at https://prism.oregonstate.edu.
R Core Team, 2023, R—A language and environment for statistical computing: R Foundation for Statistical Computing, Vienna, Austria, https://www.R-project.org/.
Roper, B.B., Buffington, J.M., Bennett, S., Lanigan, S.H., Archer, E., Downie, S.T., Faustini, J., Hillman, T.W., Hubler, S., Jones, K., Jordan, C., Kaufmann, P.R., Merritt, G., Moyer, C., and Pleus, A., 2011, A comparison of the performance and compatibility of protocols used by seven monitoring groups to measure stream habitat in the Pacific Northwest: North American Journal of Fisheries Management, v. 30, no. 2, p. 565–587.
Saunders, W.C., Ojala, J.V., Van Wagenen, A., Haynes, D., Archer, E.K., and Henderson, R., 2019, PacFish InFish Biological Opinion (PIBO) monitoring program—Effectiveness monitoring sampling methods for stream channel attributes: Logan, Utah, PACFISH/INFISH Biological Opinion Monitoring Program (PIBO) staff Multi-Federal agency monitoring program, accessed April 15, 2024, at https://www.fs.usda.gov/Internet/FSE_DOCUMENTS/fseprd834380.pdf.
Scully, R.A., Dlabola, E.K., and Heaston, E.D., 2023a, Wadeable stream habitat data integrated from multiple monitoring programs for the US from 2000–2022: U.S. Geological Survey data release, accessed May 5, 2023, at https://doi.org/10.5066/P9J3P7SN.
Scully, R.A., Heaston, E.D., and Dlabola, E.K., 2023b, SHMI-DES: U.S. Geological Survey software release, accessed May 5, 2023, at https://doi.org/10.5066/P9KON2PK.
Shapiro, M.H., Holdsworth, S.M., and Paulsen, S.G., 2008, The need to assess the condition of aquatic resources in the US: Journal of the North American Benthological Society, v. 27, no. 4, p. 808–811, accessed February 10, 2022, at https://doi.org/10.1899/08-116.1.
U.S. Environmental Protection Agency, 2006, National Aquatic Resource Surveys, Wadeable Streams Assessment 2004 [tabular files]: U.S. Environmental Protection Agency National Aquatic Surveys website, accessed May 2, 2023, at https://www.epa.gov/national-aquatic-resource-surveys/data-national-aquatic-resource-surveys.
U.S. Environmental Protection Agency, 2016a, National Aquatic Resource Surveys, National Rivers and Streams Assessment 2008–2009 [tabular files]: U.S. Environmental Protection Agency National Aquatic Surveys website, accessed May 2, 2023, at https://www.epa.gov/national-aquatic-resource-surveys/data-national-aquatic-resource-surveys.
U.S. Environmental Protection Agency, 2016b, National Rivers and Streams Assessment 2008–2009—A collaborative survey: U.S. Environmental Protection Agency, Office of Water and Office of Research and Development report number EPA/841/R-16/007, accessed April 10, 2021, at https://www.epa.gov/sites/default/files/2016-03/documents/nrsa_0809_march_2_final.pdf.
U.S. Environmental Protection Agency, 2019, National Rivers and Streams Assessment 2018/19—Field operations manual—Wadeable (ver. 1.2, May 2019): U.S. Environmental Protection Agency, Office of Water report number EPA-841-B-17-003a, accessed January 30, 2023, at https://www.epa.gov/sites/default/files/2019-05/documents/nrsa_1819_fom_wadeable_version_1.2_0.pdf.
U.S. Environmental Protection Agency, 2020a, National Aquatic Resource Surveys— National Rivers and Streams Assessment 2013–2014 [tabular files]: U.S. Environmental Protection Agency, accessed April 10, 2021, at https://www.epa.gov/national-aquatic-resource-surveys/data-national-aquatic-resource-surveys.
U.S. Environmental Protection Agency, 2020b, National Rivers and Streams Assessment 2013–2014—A collaborative survey: U.S. Environmental Protection Agency report number EPA 841-R-19-001, accessed April 10, 2021, at https://www.epa.gov/system/files/documents/2021-10/nrsa_13-14_report_508_ci_2021-10-15.pdf.
U.S. Environmental Protection Agency, 2021, National Aquatic Resource Surveys, National Rivers and Streams Assessment 2018–2019 [tabular files]: U.S. Environmental Protection Agency, accessed April 10, 2021, at https://www.epa.gov/national-aquatic-resource-surveys/data-national-aquatic-resource-surveys.
U.S. Forest Service and U.S. Bureau of Land Management, 1994a, Final supplemental environmental impact statement on management of habitat for late-successional and old-growth species within the range of the Northern Spotted Owl: U.S. Forest Service and U.S. Bureau of Land Management, Aquatic conservation strategy, Appendix B6, p. B-81–B-128, accessed March 1, 2021, at https://www.fs.usda.gov/r6/reo/library/downloads/documents/NWFP-FSEIS-1994-II.pdf.
U.S. Forest Service, 2019, Field protocol manual—2019 field season: U.S. Forest Service, Aquatic and Riparian Effectiveness Monitoring Program regional interagency monitoring for the Northwest Forest Plan, 74 p., accessed March 1, 2021, at https://www.monitoringresources.org/Document/Protocol/DownloadDescription/3542.
U.S. Geological Survey, 2004, National Hydrography Dataset: U.S. Department of the Interior website, accessed, August 5, 2024, at https://www.usgs.gov/national-hydrography/national-hydrography-dataset.
Washington State Department of Ecology, 2021, Focus on—Watershed health monitoring 2021: Washington State Department of Ecology Publication 21-03–004, accessed November 28, 2022, at https://apps.ecology.wa.gov/publications/documents/2103004.pdf.
Wieczorek, J., Bloom, D., Guralnick, R., Blum, S., Döring, M., Giovanni, R., Robertson, T., and Vieglais, D., 2012, Darwin Core—An evolving community-developed biodiversity data standard: PLoS One, v. 7, no. 1, p. 1–8, accessed September 1, 2022, at https://doi.org/10.1371/journal.pone.0029715.
Appendix 1. Data Exchange Standard Development and Data Integration Methods Using R Code
Data Standard Development
Prior to data integration, the Pacific Northwest Aquatic Monitoring Partnership (PNAMP) coordinated with the working group to develop the Stream Habitat Metrics Integration (SHMI) data exchange standard. PNAMP staff downloaded or requested data from each source program and compiled all fields into one file to identify which fields and metrics programs had in common. Source programs are the Bureau of Land Management Assessment, Inventory, and Monitoring (AIM), U.S. Forest Service Aquatic and Riparian Effectiveness Monitoring Program (AREMP), U.S. Environmental Protection Agency National Aquatic Resource Surveys (NARS) National Rivers and Streams Assessment (NRSA), and U.S. Forest Service and Bureau of Land Management PacFish/InFish Biological Opinion Monitoring Program (PIBO MP; Scully and others, 2023a). Working group discussions were hosted by PNAMP to determine data compatibility, necessary data transformations to ensure compatibility, and metric compatibility (refer to the “Controlled Vocabulary Development” section). These determinations led to the SHMI data exchange standard.
PNAMP staff consulted pre-existing standards and frameworks (Darwin Core [Wieczorek and others, 2012], Observations Data Model 2 [ODM2; Horsburgh and others, 2008, 2016]) to choose data structure and terminology. A data mapping file (DataMappingDES.csv) was created to translate between programs’ compatible data and metrics (Scully and others, 2023a; Scully and others, 2023b). To document data collection and analysis methods for inclusion in the data mapping, PNAMP staff coordinated with working group experts to create methods and protocols at Pacific Northwest Aquatic Monitoring Partnership’s Monitoring Resources website (Pacific Northwest Aquatic Monitoring Partnership, 2024; www.MonitoringResources.org) and added the uniform resource locator (URL) for each method in the DataMappingDES.csv file.
Data Integration Methods
Code was written in R (R Core Team, 2023) and published on GitLab to integrate compatible wadeable stream monitoring data from the four programs based on the SHMI data exchange standard (Scully and others, 2023b). Data were accessed or obtained via data request, pre-processed, transformed, and integrated via R code (fig. 1.1). Wadeable data from three programs (AIM, AREMP, and NRSA) were pre-processed and transformed via separate R code files (“DownloadAndCleanBLMAIMData.R”; “DownloadAndCleanUSFSAREMPData.R”; “DownloadAndCleanEPANRSA.R”). The interim data from the three programs produced by pre-processing plus the PIBO MP data were further transformed as described in the code published on GitLab (Scully and others, 2023a) and in the ‘Data Transformations’ section of this report, then integrated via the integration R code (“CombineData.R”).
Data Transformations
Source data were transformed during the integration process using R code (Scully and others, 2023b). Examples of the transformations applied to the following fields to ensure compatibility throughout the SHMI integrated data (Scully and others, 2023a) are shown in this appendix. For the comprehensive transformations refer to the R code (Scully and others, 2023a).
fieldNotes
Data from fields that correspond to the SHMI integrated data variable fieldNotes categorical data were transformed as follows:
eventDate
Data from fields that correspond to the SHMI integrated data variable eventDate data were transformed as follows:
beaverPresence
Data from fields that correspond to the SHMI integrated data variable beaverPresence data were transformed as follows:
siteSelectionType
Data from fields that correspond to the SHMI integrated data variable siteSelectionType categorical data were transformed as follows:
latitude and longitude
Data from fields that correspond to the SHMI integrated data variable latitude and longitude data were transformed as follows:
measurementType
Data from fields that correspond to the SHMI integrated data variable measurementType for the controlled vocabulary term:D50 (millimeters) data were transformed as follows:
MeanThalwegDepth (meters) data were transformed as follows: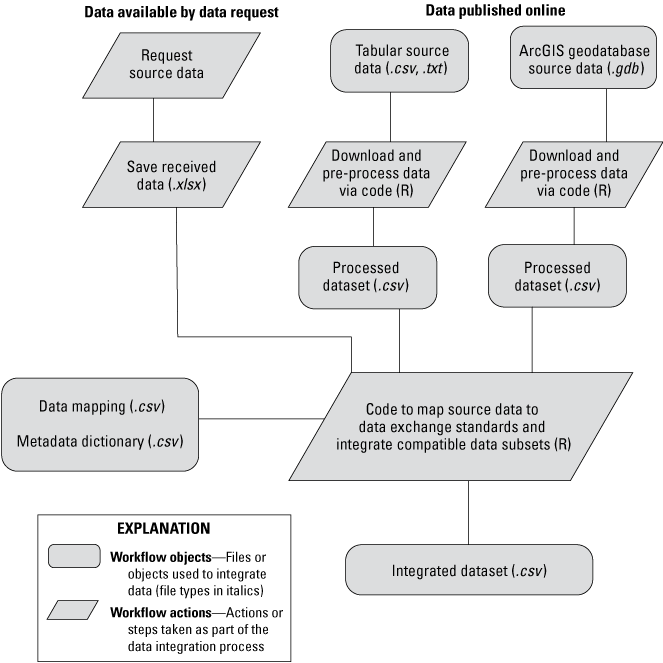
Visual representation of the R workflow to download (or obtain via data request), pre-process and integrate source data to produce the integrated dataset.
References Cited
Horsburgh, J.S., Aufdenkampe, A.K., Mayorga, E., Lehnert, K.A., Hsu, L., Song, L., Spackman Jones, A., Damiano, S.G., Tarboton, D.G., Valentine, D., Zaslavsky, I., and Whitenack, T., 2016, Observations Data Model 2—A community information model for spatially discrete Earth observations: Environmental Modelling & Software, v. 79, p. 55–74, accessed August 10, 2021, at https://doi.org/10.1016/j.envsoft.2016.01.010.
Pacific Northwest Aquatic Monitoring Partnership, 2024, Monitoring resources: Pacific Northwest Aquatic Monitoring Partnership website, accessed January 30, 2023, at www.monitoringresources.org.
R Core Team, 2023, R—A language and environment for statistical computing: R Foundation for Statistical Computing, Vienna, Austria, https://www.R-project.org/.
Scully, R.A., Dlabola, E.K., and Heaston, E.D., 2023a, Wadeable stream habitat data integrated from multiple monitoring programs for the US from 2000–2022: U.S. Geological Survey data release, accessed May 5, 2023, at https://doi.org/10.5066/P9J3P7SN.
Scully, R.A., Heaston, E.D., and Dlabola, E.K., 2023b, SHMI-DES: U.S. Geological Survey software release, accessed May 5, 2023, at https://doi.org/10.5066/P9KON2PK.
Wieczorek, J., Bloom, D., Guralnick, R., Blum, S., Döring, M., Giovanni, R., Robertson, T., and Vieglais, D., 2012, Darwin Core—An evolving community-developed biodiversity data standard: PLoS One, v. 7, no. 1, p. 1–8, accessed September 1, 2022, at https://doi.org/10.1371/journal.pone.0029715.
For information about the research in this report, contact the
Director, Forest and Rangeland Ecosystem Science Center
U.S. Geological Survey
777 NW 9th Street, Suite 400
Corvallis, Oregon 97330
https://www.usgs.gov/centers/forest-and-rangeland-ecosystem-science-center
Manuscript approved on July 22, 2024
Publishing support provided by the U.S. Geological Survey
Science Publishing Network, Tacoma Publishing Service Center
Disclaimers
Any use of trade, firm, or product names is for descriptive purposes only and does not imply endorsement by the U.S. Government.
Although this information product, for the most part, is in the public domain, it also may contain copyrighted materials as noted in the text. Permission to reproduce copyrighted items must be secured from the copyright owner.
Suggested Citation
Scully, R.A., Dlabola, E.K., Bayer, J.M., Heaston, E., Courtwright, J., Snyder, M.N., Hockman-Wert, D., Saunders, W.C., Blocksom, K.A., Hirsch, C., and Miller, S.W., 2024, A data exchange standard for wadeable stream habitat monitoring data: U.S. Geological Survey Techniques and Methods, book 16, chap. B2, 28 p., https://doi.org/10.3133/tm16B2.
ISSN: 2328-7055 (online)
| Publication type | Report |
|---|---|
| Publication Subtype | USGS Numbered Series |
| Title | A data exchange standard for wadeable stream habitat monitoring data |
| Series title | Techniques and Methods |
| Series number | 16-B2 |
| DOI | 10.3133/tm16B2 |
| Publication Date | October 03, 2024 |
| Year Published | 2024 |
| Language | English |
| Publisher | U.S. Geological Survey |
| Publisher location | Reston, VA |
| Contributing office(s) | Forest and Rangeland Ecosystem Science Center |
| Description | Report: vii, 28 p.; Data Release; Software Release |
| Online Only (Y/N) | Y |