

Evaluating Oil and Gas Industry Two-Dimensional Multichannel Seismic Data for Use in Near-Surface Assessment of Geologic Framework and Potential Marine Minerals Resources
Links
- Document: Report (11.1 MB pdf) , HTML , XML
- Data Release: U.S. Geological Survey database—National Archive of Marine Seismic Surveys (NAMSS)
- Download citation as: RIS | Dublin Core
Acknowledgments
This study is part of the Bureau of Ocean and Energy Management Intra-agency agreement M21PG00012 “Analysis of Digitally Recovered Single-Channel Seismic Data from the Texas-Louisiana and Alabama-Florida Outer Continental Shelf and the Evaluation of Oil and Gas Industry Two-Dimensional Multichannel Seismic Data for use in Near-Surface Assessment of the Geologic Framework and Potential Marine Minerals Resources.” The study is also part of the Gulf of Mexico Outer Continental Shelf Seismic Data Conversion and Preservation Project, a collaborative effort between the U.S. Geological Survey and Bureau of Ocean and Energy Management. The authors would like to thank Kara Doran and Kathryn Weber for their valuable reviews.
Abstract
Marine seismic reflection data acquired across the Gulf of Mexico during oil and gas exploration are available to the public through an online database archive. The data are archived as two-dimensional multichannel seismic data in two digital formats. The formats include image files in portable document format (PDF), and binary files in industry standard Society for Exploration Geophysicists revision Y (SEG-Y) format. Also included in the database are navigation files and acquisition information associated with the collection of the data.
This study examines the data acquired within two geographic areas in the northern Gulf of Mexico. Although the seismic reflection data are acquired for oil and gas exploration many kilometers below the seafloor, this study focuses on the feasibility of using the data for near-surface geologic and seafloor morphologic studies (<100 meters below the seafloor). The report outlines the methodologies used to recover and process the data, including computer processing steps to convert the PDF imagery into SEG-Y format. The report includes two-dimensional profiles of the data to demonstrate the efficacy of the data in near-surface geologic studies. The study found that, for the two areas of interest, the seafloor reflectors in most of the available data are not resolvable. Although the data are readily available and computer processing can adequately image the uppermost reflectors of the seismic profiles, the resolution of the data in most cases are not suitable for near-surface geologic evaluations.
Introduction
Across the northern Gulf of Mexico Outer Continental Shelf (OCS), proprietary marine seismic reflection data are acquired for geophysical and geological exploration of oil and gas (O&G) prospects (fig. 1). According to Federal regulations, these proprietary geophysical data can be released to the Bureau of Ocean Energy Management (BOEM) after 25 years. For the Gulf of Mexico region, data holdings generally date between 1975 and the mid-1990s. Much of these data are in the form of two-dimensional (2D) multichannel seismic data that were acquired using airgun systems. After release, these data are transferred to the U.S. Geological Survey (USGS) and archived in the National Archive of Marine Seismic Surveys database (NAMSS, https://walrus.wr.usgs.gov/namss/search/). This database provides free and open access to the O&G data.
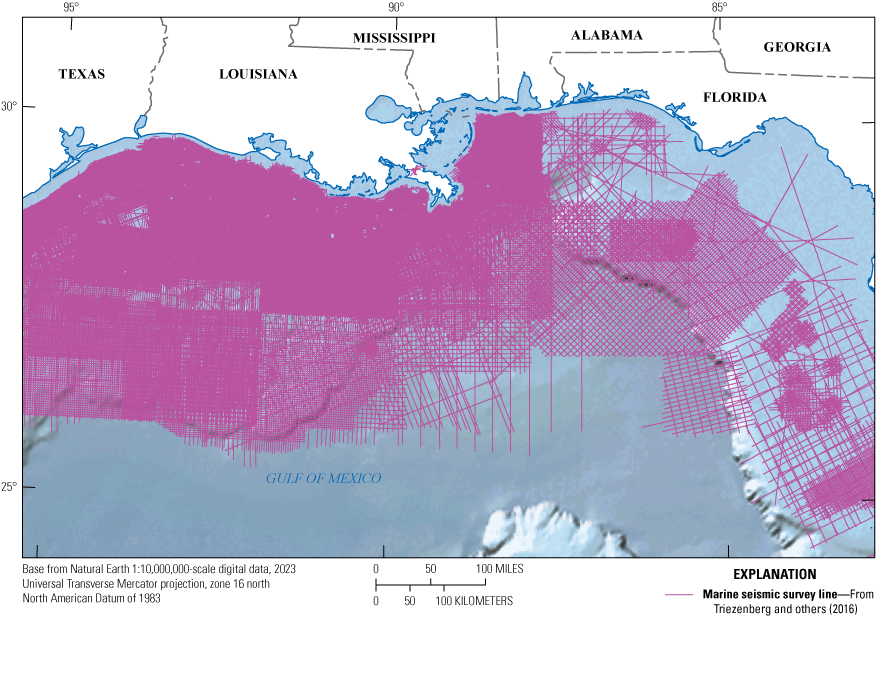
A subset of two-dimensional multichannel seismic tracklines collected across the northern Gulf of Mexico and archived in the U.S. Geological Survey National Archive of Marine Seismic Survey database (https://walrus.wr.usgs.gov/namss/search/).
The geophysical data acquired during O&G exploration can be used to evaluate geologic structures thousands of meters below the Earth’s surface for hydrocarbon reservoir potential. The purpose of this study was to evaluate if the released 2D seismic data from commercial surveys could be used to characterize near-surface (less than 50 meters [m] below the seafloor) geology and surface morphology for Pleistocene to Holocene geologic framework studies and marine minerals resource evaluation. As a pilot study, 2D seismic datasets obtained during O&G exploration that are contained within specified lease blocks located in the OCS offshore of Alabama were selected for analyses. The seismic data from these areas were downloaded from the NAMSS database and assessed for completeness, accessibility, suitable metadata, and geographic positioning. The data were then windowed (cropped) to the top 100 milliseconds (ms) of data and imported into three-dimensional (3D) visualization software for analysis.
This project is part of a collaboration between the USGS and BOEM to evaluate archived seismic data for use in marine mineral assessments. This report describes the data acquisition, processing, and analysis protocols used to evaluate existing commercial 2D seismic data for suitability for evaluation of near-surface (less than 50-m depth) geological features.
Area of Analysis
Marine mineral resources from the OCS in the northern Gulf of Mexico are used for coastal restoration and management projects. The offshore borrow site must be suitably shallow for extraction by mechanical dredge, meaning that the combination of water depth and depth below the seafloor must be within the dredge system capability. Through a working group of Federal and State agencies, it was determined that in OCS waters, seafloor shoals and near-surface fluvial deposits are potential sources of sediment if they are within 30-m water depth. Previous geologic investigations and analysis tools (for example, ShoalMATE; see also Pickens and others, 2020) were used to identify areas within lease blocks offshore of Alabama that fit the criterion of potential mineral resources. These lease blocks were surveyed for O&G potential and have associated 2D multichannel seismic data that have potential for evaluating marine mineral resources. Two OCS areas offshore of Alabama were selected for this pilot study (fig. 2). In this report, these two areas are called the Mobile and Pensacola areas for their proximity to Mobile Bay and Pensacola Bay, respectively. The O&G data available from within these areas were downloaded from NAMSS, processed, and evaluated to determine if they were suitable for mineral resource assessments.
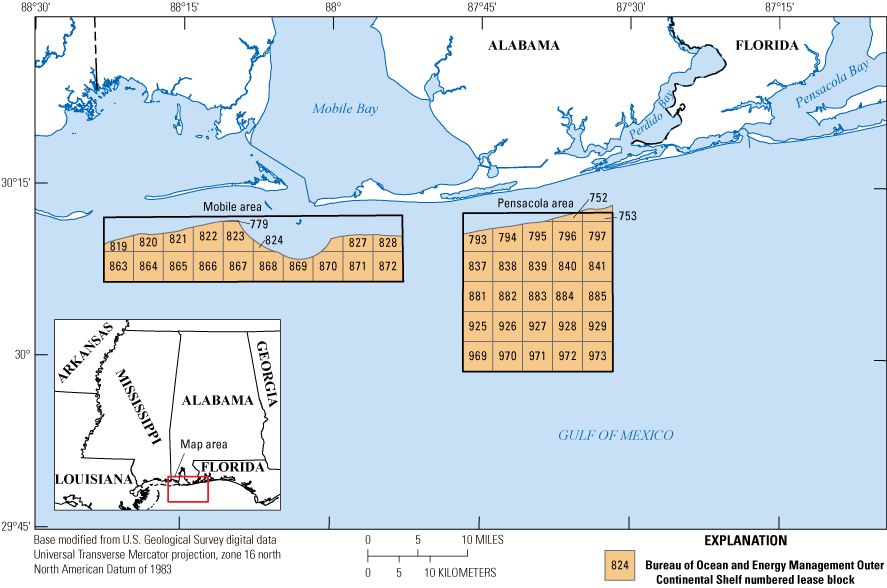
Lease blocks within the Mobile and Pensacola study areas that have two-dimensional multichannel seismic data available. Seismic data are stored in the U.S. Geological Survey National Archive of Marine Seismic Survey database, and the lease blocks are available online at https://www.boem.gov/oil-gas-energy/mapping-and-data.
Oil and Gas 2D Multichannel Seismic Data
The NAMSS database stores 2D multichannel seismic data files in either the industry-standard Society of Exploration Geophysicists revision Y (SEG-Y) format (Barry and others, 1975) or as image files in Portable Document Format (PDF). The files are organized by survey and include navigation and metadata files in American Standard Code for Information Interchange (ASCII) format. General information stored in the NAMSS archive for each survey includes the following:
-
• NAMSS cruise identification (field activity identifier)
-
• Data acquisition method (for example, airgun)
-
• Dates of acquisition
-
• Geographic bounding box
-
• USGS/BOEM points of contact
-
• Navigation datum
-
• Processing methods and data classes (for example, seismic reflection stack)
-
• Data file formats
-
• Line name, length (kilometers), and first and last shotpoint numbers
Table 1.
Example of an acquisition parameters table from U.S. Geological Survey National Archive of Marine Seismic Surveys for field activity B-12-84-AL.[From Triezenberg and others (2016)]
The 2D multichannel seismic data can be selected from the database by location and field activity identifier and downloaded from the NAMSS server. The surveys acquired within the Mobile and Pensacola study areas are shown in table 2. The survey tracklines for the downloaded data are shown in figure 3. The locations of seismic profiles displayed as figures in this report are shown in figure 4.
Table 2.
Two-dimensional multichannel seismic surveys acquired within the Mobile and Pensacola study areas from the U.S. Geological Survey National Archive of Marine Seismic Surveys database (Triezenberg and others, 2016).[See figure 3 for location of the study areas and surveys. The field activity refers to the name of the activity as listed in the database, the number of lines is the sum of individual tracklines within the field activity. Complete filenames are listed in the “file structure” section of the appendix. SEG-Y, Society of Exploration Geophysicists revision Y; PDF, Portable Document Format]
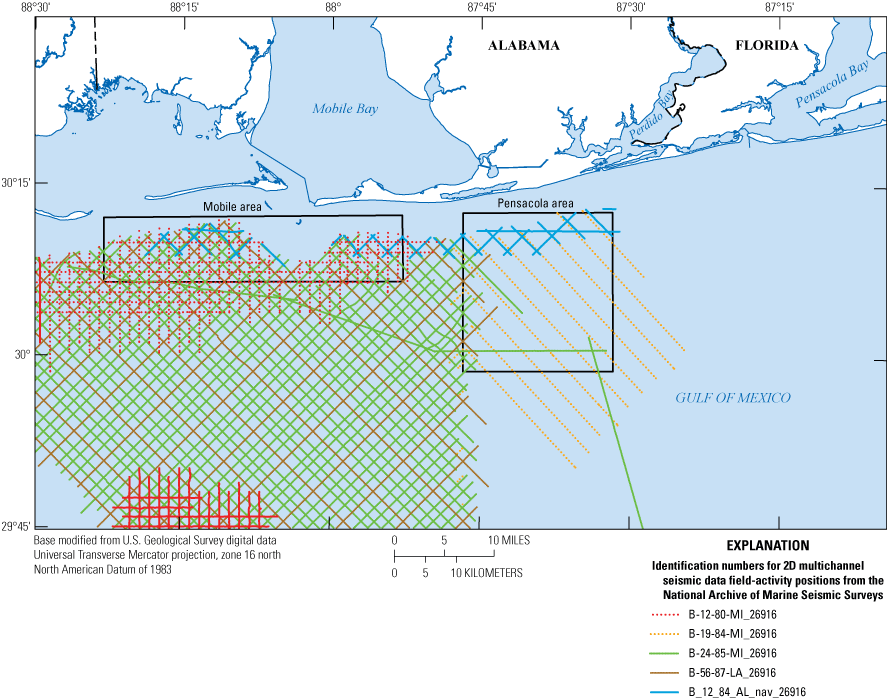
Trace positions (tracklines) for the two-dimensional multichannel seismic data evaluated in this study, displayed by field activity. The field activity refers to the name of the activity as listed in the database. Seismic profiles were clipped to the Mobile and Pensacola study areas.
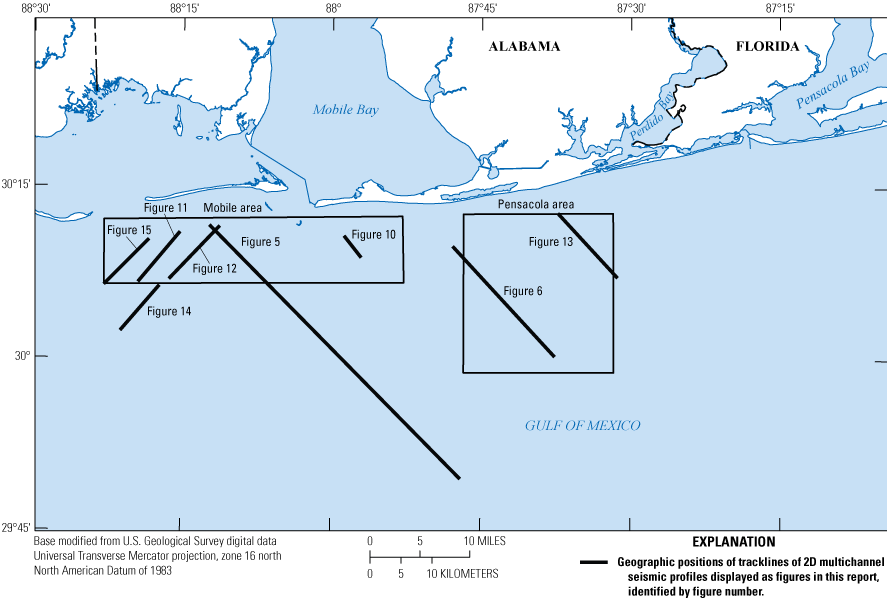
Locations of seismic profiles in the Mobile and Pensacola areas that are used in this report.
Data and Methods
The 2D multichannel seismic data are stored in the NAMSS archive in either SEG-Y or PDF format (table 2). The SEG-Y files can be accessed and viewed using SEG-Y–compatible software. Figure 5 is an example of a SEG-Y profile from field activity B-24-85-MI with the vertical dimension in time (seconds), and horizontal dimension represented as traces (common depth-point stack number). These dimensions can be converted to depth (in meters) and distance (in meters) and further processed using SEG-Y processing utilities.
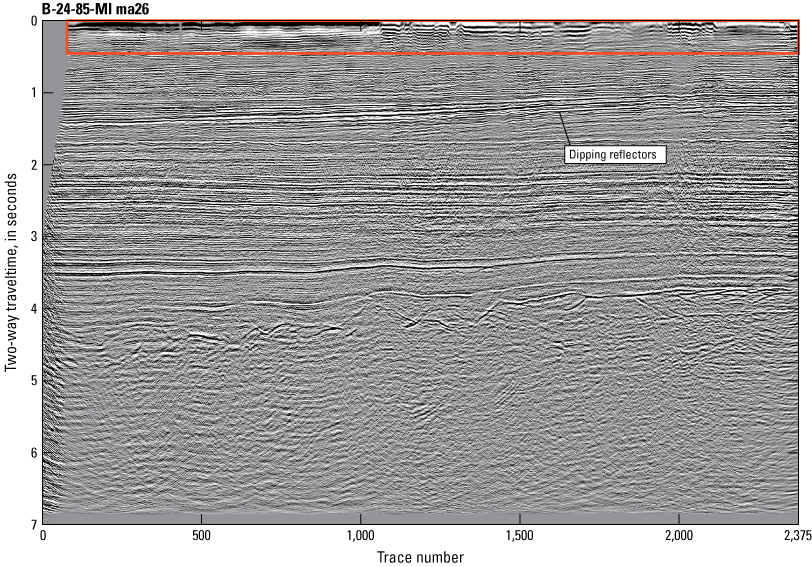
Two-dimensional multichannel seismic profile example of line ma26 from field activity B-24-85-MI (see fig. 4 for location). The image is digitally generated from a Society of Exploration Geophysicists revision Y (SEG-Y) file using a SEG-Y processing utility. The line is approximately 56 kilometers long and contains 2,375 traces. The vertical axis represents the two-way traveltime of sound within the subsurface and extends approximately 5 kilometers below the seafloor. Gray areas on left side and bottom of profile represent no data. Dipping reflectors and strong horizontal reflectors in the subsurface, such as those present down to a two-way traveltime of 2 seconds, represent features associated with the geologic framework of the Gulf of Mexico, such as deltaic deposits. The red box encompasses the portion of the profile that was assessed for this study.
Pertinent information stored in the trace header of each SEG-Y file can be extracted (table 3) to assess the validity of the file. For a seismic file to be usable for this study, it must contain the values shown in table 3, although file header records frequently contain much more information (see Barry and others [1975] and SEG Technical Standards Committee [2017] for a complete listing of SEG-Y header information). For this study, each file was checked for completeness of header file records and input values. It was determined that the file header records for field activity B-12-80-MI (table 2) were not ordered properly, and the survey could not be used in this study. Once the seismic data in a file were determined to be valid, they were then evaluated for suitability for analysis of near-surface geologic features.
Table 3.
Data values extracted from the standard trace header of the Society of Exploration Geophysicists revision Y (SEG-Y) file for line ma62c from field activity B-24-85-MI.[Trace identification code is for time-domain seismic data; offset distance between source and receiver units is unknown. Source X and source Y are the coordinate system of the trace coordinates; in this case, it is Universal Transverse Mercator Zone 16, given in feet (trace coordinates are also provided in the navigation file included in the U.S. Geological Survey National Archive of Marine Seismic Surveys archive). Height and coordinate scalars are used to scale values to maintain a consistent byte space across surveys. Number of samples are samples per trace, and sample interval indicates sampling rate]
The geographic position of each trace in a seismic profile is necessary to accurately plot the data in 3D space. These positions, known as profile navigation, are stored in the trace header of the file and in separate ASCII-formatted tabular files, with each row of the ASCII files containing at least the sequential trace number and two coordinate (X,Y) positions. The horizontal datum (North American Datum of 1927, Clarke 1866 ellipsoid) and coordinate system (Universal Transverse Mercator [UTM] Zone 16, in feet) are listed in the field activity metadata files. For this study, all coordinates were converted to the North American Datum of 1983 (NAD 83) and UTM Zone 16, in meters. Navigation data in the trace header of the SEG-Y files are in the source coordinate – X and source coordinate – Y fields (Barry and others, 1975). All coordinates were examined using geographic information system software to identify valid positioning. The trackline map (fig. 3) shows the locations of the profiles used in this study.
Image to SEG-Y Conversion
Two of the field activities (B-12-84-AL and B-19-84-MI) contain 2D multichannel seismic profiles that are scans of paper seismic profiles in PDF format instead of seismic trace data. These files contain information in the sidebar and along both axes of the profile that was comparable to the trace header information found in the SEG-Y files (fig. 6).
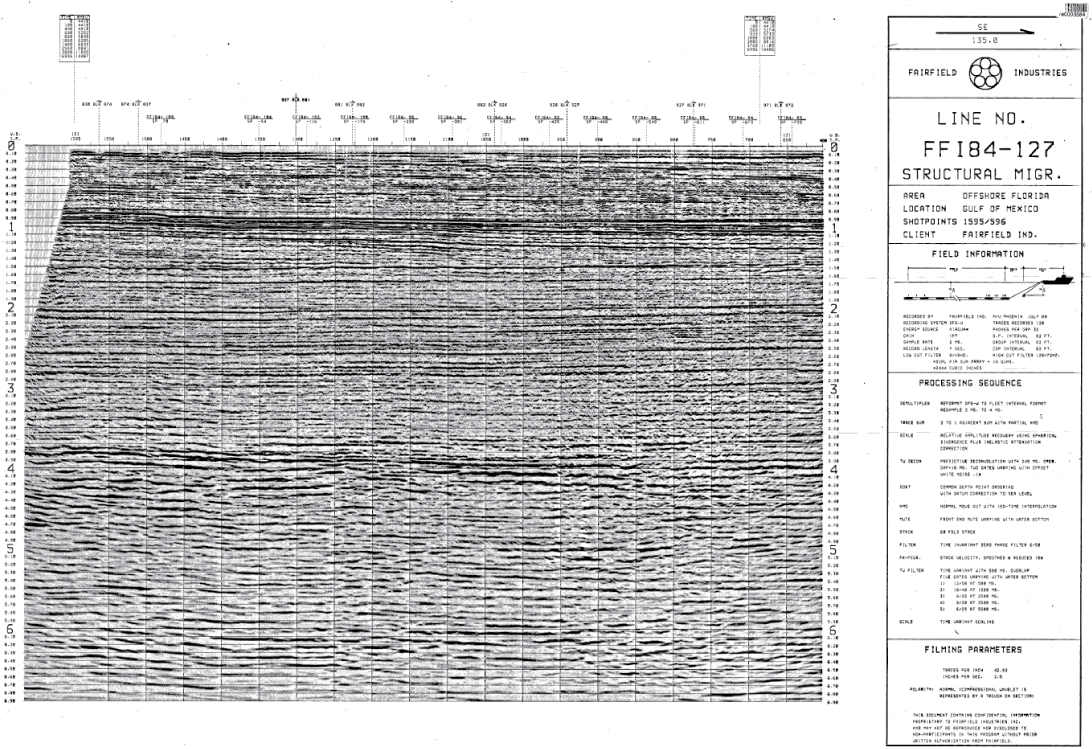
Two-dimensional multichannel seismic profile example of line FF184-127B from field activity B-19-84-MI (see fig. 4 for location). The line is archived as a scanned image in Portable Document Format (PDF). Each line trace is displayed as a plot of amplitude, with higher values extending the trace curve to the right (wiggle trace). Line information typically stored in the trace header in Society of Exploration Geophysicists revision Y (SEG-Y) files (table 3) is displayed in the sidebar (right) and along the axes of the seismic profile data. This line is approximately 22 kilometers long and contains 999 shotpoints. The vertical axis shows the two-way traveltime of sound, in seconds, within the subsurface and extends approximately 5 kilometers below the seafloor. The horizontal axis lists the shotpoint number and crossing data of other tracklines. For this study, the image was converted to SEG-Y format.
To integrate the data from the PDF images with the SEG-Y data used in this study, the images first had to be converted to SEG-Y format. During this process, each column of pixels in the PDF image was considered equivalent to a seismic trace. The seismic trace is represented as a vertical plot, or wiggle trace, of amplitude. In the PDF image, each pixel within a column was treated as a sample. Sample values were represented by the amplitude of the wiggle trace at that pixel. The binary trace header was created from the information in the sidebar (fig. 6), and the trace navigation was inserted into the SEG-Y file using the trace positions provided in the ASCII navigation file. Although the navigation file does not contain a geographic position or fix for each trace, positions (shotpoints) were typically recorded for the first and last trace, and every 10th trace in between. Positions for each trace were interpolated between fixes using the open-source Generic Mapping Tools (GMT) toolbox and were inserted into the SEG-Y file.
The conversion process required image manipulation and use of a UNIX series of scripts and open-source image processing software. The scripts rotated the images and scaled the axis relative to sample and trace count as described below. Batch processing was used to create the SEG-Y files from the PDF files, and then save them with a .sgy file extension. The 2D multichannel profile image shown in figure 6 was converted to SEG-Y format and is displayed in figure 7. The procedure to convert scanned seismic profile imagery to SEG-Y is as follows:
-
1. Manually extract shotpoint fix positions from navigation files according to fix annotations along the x-axis of the image. Use GMT to interpolate positions for each trace in the extracted fix file.
-
2. Manually record sample rate and other pertinent information from the sidebar of the PDF image.
-
3. Crop the image so only the seismic profile remains and orient the image using an image processing program so that the trace sequence increases from left to right. The image file should be saved in 8-bit grayscale tagged image file format (TIFF).
-
4. Size the image so that the pixel count on the horizontal axis corresponds to the trace count as specified in the sidebar, and the pixel count along the vertical axis corresponds to the sample count. The sample count is the product of the sample rate (from step 2) and the record length shown in the vertical axis:
For example, if the profile is acquired with a sample rate of 4 ms and a record length of 7 seconds, then a horizontal pixel count of 1,750 would represent each sample. If there are 200 traces in the profile, the image would be resized to 1,750 × 200 pixels using GMT.
-
5. Convert the image to SEG-Y using the UNIX shell script Tif2segy (appendix 1). This script uses the open-source software packages Seismic Unix, GMT, and Netpbm to manipulate the image. The script rotates the image 90 degrees so that the traces are read horizontally (waterfall format), similar to the positioning of trace data in a SEG-Y file. In order to batch process the images, GMT commands to interpolate and insert the positions for each trace (step 1), acquire the image size information to resize the image (step 4), and window (crop) the profile to the top 100 ms of data, were included in the script. The output includes a filename extension (_wind) to distinguish it from the original file. The modified script is provided in appendix 1.
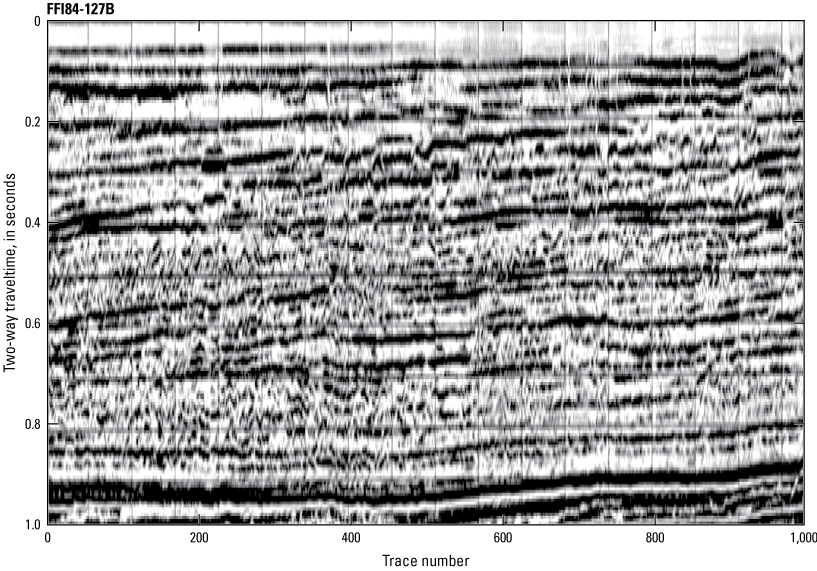
Output image of a two-dimensional multichannel seismic profile line FF184-127B from field activity B-19-84-MI that was converted from an image (fig. 6) to Society of Exploration Geophysicists revision Y (SEG-Y) format using a series of free, publicly available image manipulation and conversion utilities. The profile has been windowed (cropped) to the upper 1 second two-way traveltime of data and cropped to the Pensacola study area (see fig. 4 for location).
Output Files and Metadata
The O&G data used for hydrocarbon exploration extends much farther into the subsurface than what is necessary for near-surface mineral resource assessments. For this study, the data were windowed, or cropped, to the top 1-second of the two-way traveltime (TWT) data (total TWT is 6 seconds). This corresponds to about the upper 75 m of stratigraphy using a sound velocity of 1,500 meters per second in shallow marine sediments. The coordinate system of the data was also converted from the Clarke 1866 ellipsoid and UTM Zone 16, in feet, to NAD 83 UTM Zone 16, in meters. These file conversions resulted in a new set of SEG-Y files. Each line name associated with the downloaded NAMSS seismic data (.segy) contains a prefix (table 2) followed by a line number. The new files (NAD 83 UTM Zone 16, in meters, and .segy file extensions) have the same filenames as the original but are appended with “_wind” (windowed) in the filename. The filename directory is listed in the appendix. Metadata was provided with the original datasets within the NAMSS archive.
Visualization
Once the seismic profiles were inspected for adequate header information (table 3), converted to SEG-Y format (if needed), and correctly positioned in vertical space, they were brought into OpendTect open-source seismic data visualization software (dGB Earth Sciences; https://www.dgbes.com). This process provided a representation of the data in 3D space so the profiles could be properly aligned. OpendTect data cubes were developed for both the Mobile and Pensacola study areas (figs. 8 and 9) with coordinates for each data cube in UTM Zone 16, in meters, and TWT, in milliseconds.
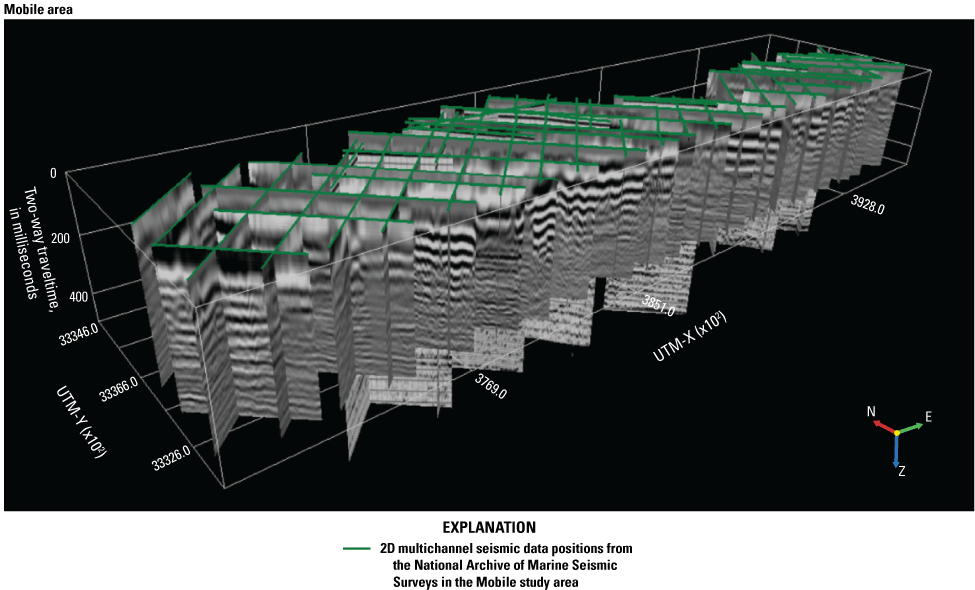
Model of a data cube within the OpendTect visualization environment containing the two-dimensional multichannel seismic data for the Mobile area. See figure 3 for map view. UTM, Universal Transverse Mercator.
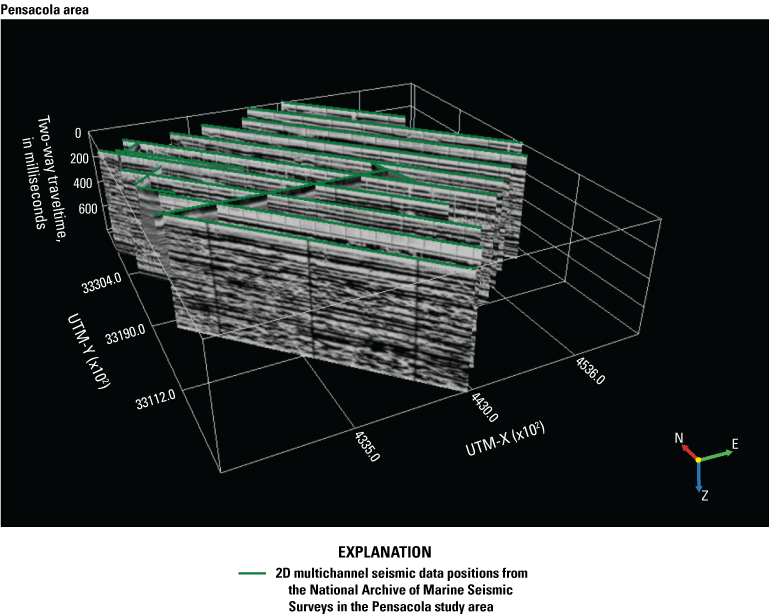
Model of a data cube within the OpendTect visualization environment containing the two-dimensional multichannel seismic data for the Pensacola area. See figure 3 for map view. UTM, Universal Transverse Mercator.
Data Evaluation
The purpose of this study was to evaluate the usefulness of the 2D multichannel seismic data for identifying potential mineral resources at or near the seafloor. This evaluation required data with an associated trace distribution and sampling rate with suitable resolutions to resolve near-surface and surface morphologic features, such as shoals, and thin stratigraphic features, such as sand sheets. Average trace range (meters per trace) and sample range (meters per sample) for each field activity are shown in table 4. Representative profiles from each field activity, and where resolvable, the reflector that represents the seafloor for each profile is labeled on figures 10–13. In surveys B-56-87-LA (fig. 12) and B-19-84-MI (fig. 13), it was not possible to resolve the seafloor reflectors. It should be noted that in deeper waters beyond the study area, resolving the seafloor reflector sometimes improved. This is possibly due to better setup of the outgoing signal prior to penetrating the seafloor.
Table 4.
Trace spacing (horizontal) and sample spacing (vertical) averaged from all lines in each field activity.[For comparison, a U.S. Geological Survey field activity (GYRE 81-6) conducted near the Mobile and Pensacola areas in 1981 using a high-resolution sensor for near-surface geologic investigations is included (Sanford and others, 2009)]
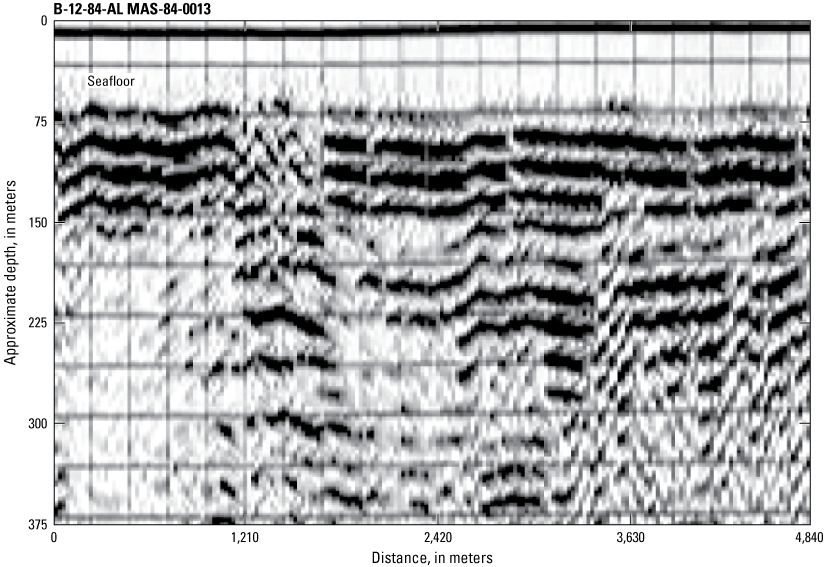
Two-dimensional multichannel seismic profile line MAS-84-0013 from field activity B-12-84-AL; see figure 4 for location. Profile was converted from a PDF image format to Society of Exploration Geophysicists revision Y (SEG-Y) format. Seafloor location is approximated. Depth is estimated from two-way traveltime in milliseconds to meters using a sound velocity of 1,500 meters per second.
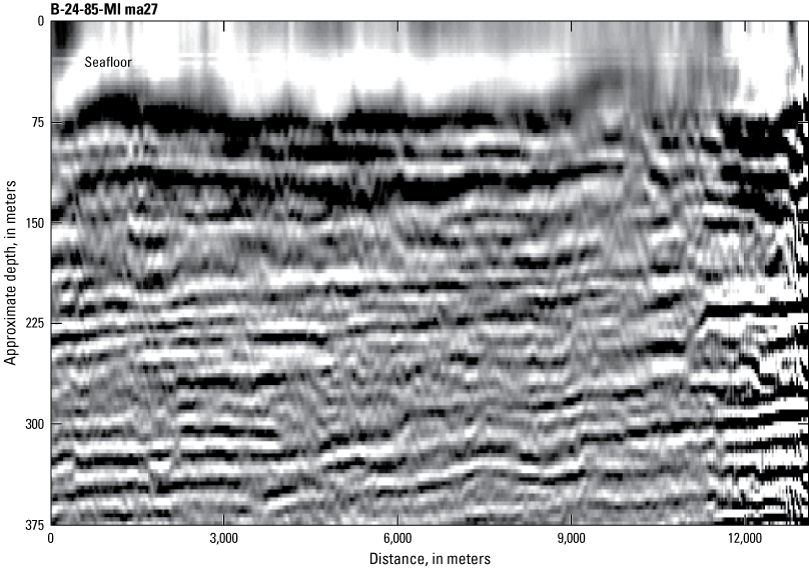
Two-dimensional multichannel seismic profile line ma27 from field activity B-24-85-MI; see figure 4 for location. Image file is in Society of Exploration Geophysicists revision Y (SEG-Y) format. Seafloor location is approximated. Depth is estimated from two-way traveltime in milliseconds to meters using a sound velocity of 1,500 meters per second.
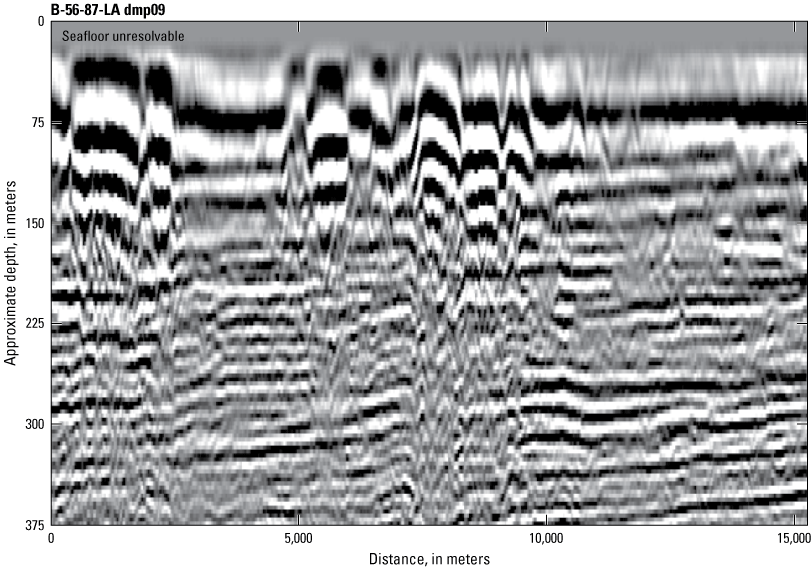
Two-dimensional multichannel seismic profile line dmp09 from field activity B-56-87-LA; see figure 4 for location. Image file is in Society of Exploration Geophysicists revision Y (SEG-Y) format. Seafloor location is not resolvable. Depth is estimated from two-way traveltime in milliseconds to meters using a sound velocity of 1,500 meters per second.
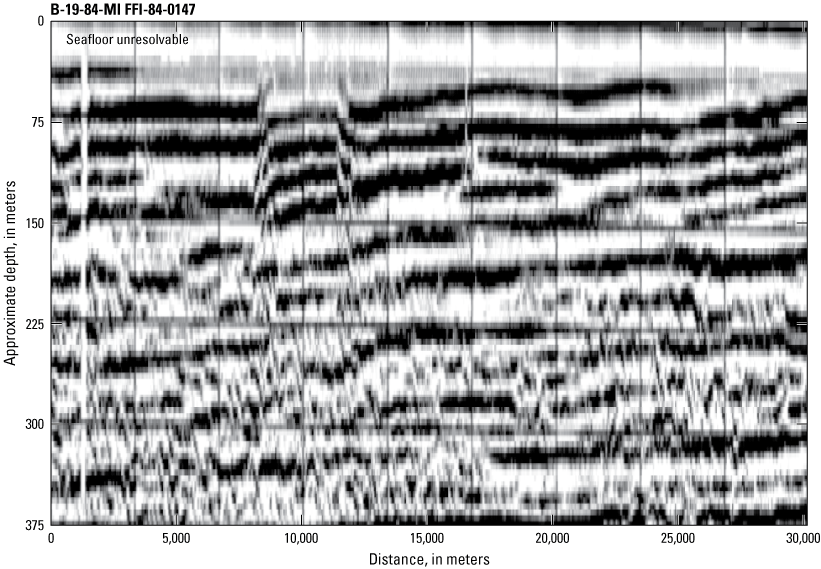
Two-dimensional multichannel seismic profile line FFI-84-0147 from field activity B-19-84-MI; see figure 4 for location. Profile was converted from a PDF image format to Society of Exploration Geophysicists revision Y (SEG-Y) format. Seafloor location is not resolvable. Depth is estimated from two-way traveltime in milliseconds to meters using a sound velocity of 1,500 meters per second.
A geologic investigation conducted adjacent to the Mobile area in 1981 (Sanford and others, 2009) used a high-resolution acoustic system (boomer) that operates at a higher frequency and uses lower power than airgun systems. The rate of data collection (the time period between signal pulses) for boomer systems is much faster than for the O&G investigations. (See spacing parameters for the USGS field activity GYRE 81-6 in table 4.) A profile from this survey is included for comparison (fig. 14). The seafloor and near-surface stratigraphy are more resolvable when compared to the O&G multichannel seismic traces.
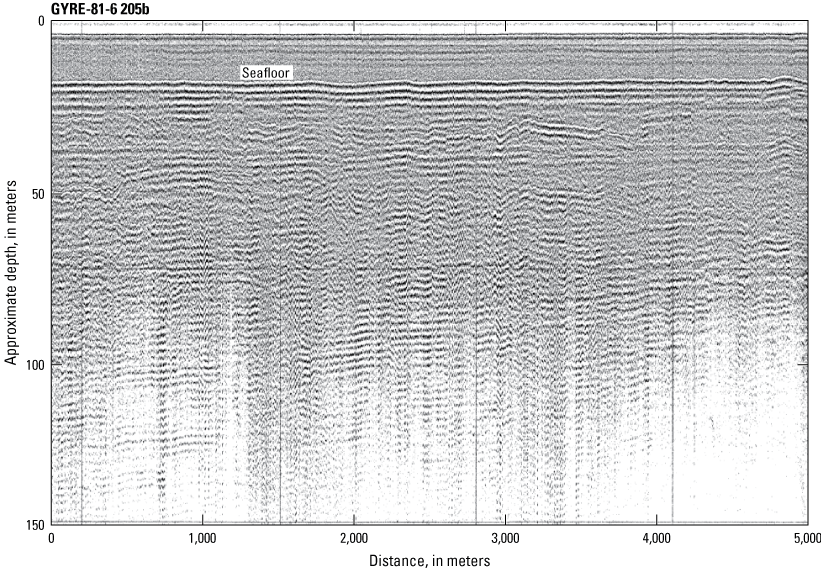
Two-dimensional single-channel seismic profile (boomer) line 205b from U.S. Geological Survey field activity GYRE-81-6 acquired adjacent to the Mobile area (see fig. 4 for location). The boomer system uses an electromagnetic plate to emit a sound pulse instead of the implosive source of an airgun. The vertical scale in this seismic profile is less than that in figures 10–13, but the near-surface seismic reflectors are more resolvable, indicating that the penetration of the energy from the boomer system into the subsurface is much shallower than that of the system used to create the oil and gas seismic profiles.
Resolving Morphologic Features
Seafloor features, such as shoals, are potential resources for suitable sediment that could be used for shoreline management projects. Seismic data are commonly used to identify these features on the seafloor, and to resolve the shoal base so that volumetric calculations of these features can be applied. Numerous shoals exist within the Mobile study area and are visible in the National Oceanic and Atmospheric Administration digital elevation model (National Oceanic and Atmospheric Administration, 2010). A 2D multichannel profile that crosses several shoals is shown in figure 15, along with a bathymetric profile derived from the digital elevation model, providing a direct comparison between the bathymetric profile and the surface reflectors in the seismic profile.
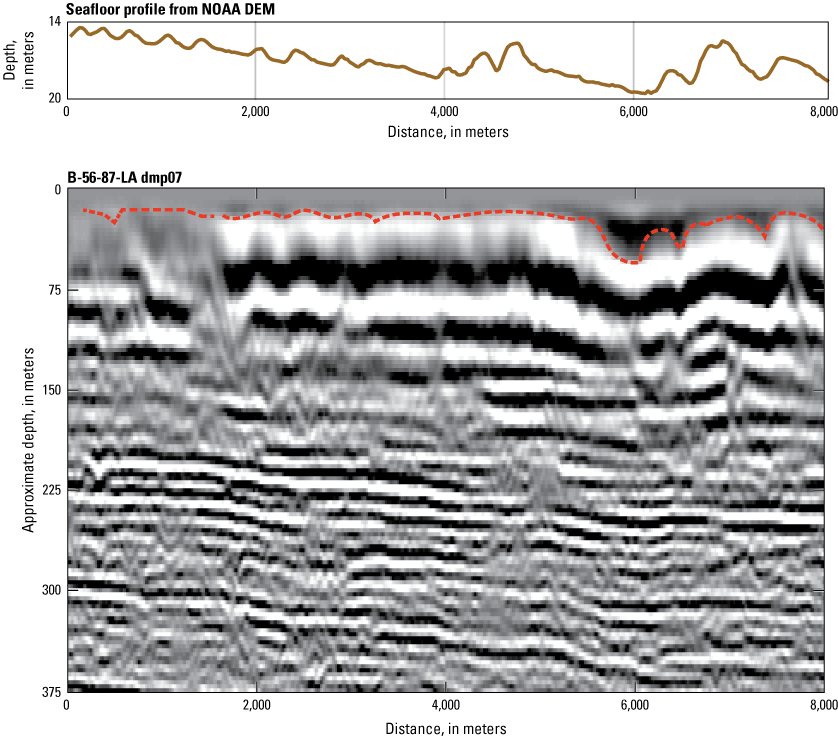
Two-dimensional multichannel seismic profile line dmp07 from field activity B-56-87-LA (see fig. 4 for location) is shown in the lower portion of the figure. A possible location for the seafloor reflector in the seismic profile is hand-interpreted as a red dashed line, although the tracking confidence is not high. The seafloor profile along the trackline position derived from the National Oceanic and Atmospheric Administration (NOAA) digital elevation model (DEM) is shown above the seismic profile, and the vertical scale of the seafloor profile is exaggerated relative to the seismic profile.
Summary and Conclusions
The oil and gas (O&G) two-dimensional multichannel seismic data archived in the U.S. Geological Survey National Archive of Marine Seismic Surveys database are publicly accessible and have complete navigation and metadata records accompanying each dataset. Before using these data, it was necessary to check for valid positioning by comparing the available navigation files to the positions stored in the trace header of the Society of Exploration Geophysicists revision Y (SEG-Y) files. Some discrepancies in navigation were found during this study that had to be corrected manually. If external navigation files were used for positioning, interpolation of trace positions from navigation fixes was necessary. Of the five surveys evaluated in this study, data files from one survey (B-12-80-MI) contained irregular data within the trace headers and could not be accessed. The data in the National Archive of Marine Seismic Surveys database are available either as SEG-Y files or images in Portable Document Format (PDF). Parameter data for the image files used in the study is complete, and the data in the files can be converted into SEG-Y format and integrated into seismic visualization software.
The O&G data are of high quality, and large-scale stratigraphic features pertinent to hydrocarbon exploration deep (greater than 100 meters) below the Earth’s surface are readily distinguishable. However, resolving features near the seafloor that are pertinent to mineral resource assessment is problematic. The low frequency of sound waves necessary for deep exploration do not have the resolution needed to capture small-scale morphologic features at the seafloor. For comparison, conventional high-resolution geophysical systems used to explore the near-surface stratigraphy of the inner continental shelf (Flocks and others, 2014) collect data at a rate that is an order of magnitude higher than the O&G data, and near-surface reflectors are significantly more resolvable, with sub-meter resolution. The energy emitted by the airgun systems used for deep seismic exploration is much higher than that used by conventional high-resolution geophysical systems as well, and this added energy to the substrate tends to blow out the seafloor reflector and near-surface stratigraphy.
This study concludes that as an early step in mineral resource investigations, finding and evaluating available O&G two-dimensional multichannel seismic data would be a relatively simple and useful exercise. The methods and scripts provided in this report can be used to batch-process large collections of data into useful formats for evaluation of seismic surveys. Because of the regional scale of these data, large-scale stratigraphic features, such as shelf-wide transgressive deposits, could be identified even though seafloor features are not resolvable. It was noted that in deeper water, the signal resolution at the seafloor improved because the outgoing high-energy signal has more time to develop a parabolic waveform before penetrating the seafloor, thus optimizing the reflected signal.
An objective of this study was to assess seismic data within water depths that are accessible to current dredging capabilities (less than 30-meter water depth). The seafloor reflector was difficult to identify in several of the profiles that were investigated, and visualization of the multichannel data suggests that morphologic features, such as sand shoals, are also not resolvable. The vertical resolution of the data within the study area does not appear to be adequate to map sedimentary deposits or features with enough resolution to perform volumetric calculations on the stratigraphic features that are common on the inner shelf of the northern Gulf of Mexico.
References Cited
Barry, K.M., Cavers, D.A., and Kneale, C.W., 1975, Recommended standards for digital tape formats: Geophysics, v. 40, no. 2, p. 344–352, accessed December 6, 2022, at https://doi.org/10.1190/1.1440530.
Flocks, J., Kindinger, J., Kelso, K., Bernier, J., DeWitt, N., and FitzHarris, M., 2014, Nearsurface stratigraphy and morphology, Mississippi inner shelf, northern Gulf of Mexico: U.S. Geological Survey Open-File Report 2015–1014, 19 p., accessed December 6, 2022, at https://doi.org/10.3133/ofr20151014.
National Oceanic and Atmospheric Administration, 2010, Northern Gulf 1 arc-second NAVD 88 coastal digital elevation model: NOAA National Centers for Environmental Information, accessed August 24, 2022, at https://catalog.data.gov/dataset/northern-gulf-1-arc-second-navd-88-coastal-digital-elevation-model.
Pickens, P., Taylor, J.C., Finkbeiner, M., Hansen, D., and Turner, L., 2020, Modeling sand shoals on the U.S. Atlantic Shelf—Moving beyond a site-by-site approach: Journal of Coastal Research, v. 37, p. 227 – 237, accessed March 16, 2023, at https://doi.org/10.2112/JCOASTRES-D-20-00084.1.
Sanford, J., Harrison, A., Wiese, D., and Flocks, J., 2009, Archive of digitized analog boomer and minisparker seismic reflection data collected from the Alabama-Mississippi-Louisiana shelf during cruises onboard the R/V Carancahua and R/V Gyre, April and July, 1981: U.S. Geological Survey Data Series 428, 1 DVD-ROM, accessed December 6, 2022, at https://doi.org/10.3133/ds428.
SEG Technical Standards Committee, 2017, SEG-Y_r2.0—SEG-Y revision 2.0 data exchange format: SEG Technical Standards Committee, 151 p., accessed December 6, 2022, at https://seg.org/Portals/0/SEG/News%20and%20Resources/Technical%20Standards/seg_y_rev2_0-mar2017.pdf.
Triezenberg, P.J., Hart, P.E., and Childs, J.R., 2016, National Archive of Marine Seismic Surveys (NAMSS): U.S. Geological Survey database, accessed August 24, 2022, at https://walrus.wr.usgs.gov/namss/. [B-12-84-AL survey data directly accessible at https://walrus.wr.usgs.gov/namss/survey/b-12-84-al/.]
Appendix 1. Processing Scripts and File Structure
Processing Scripts
UNIX script to convert image files to Society of Exploration Geophysicists revision Y (SEG-Y) format. This script is freely available at http://seismic.ocean.dal.ca/~seismic/pwp_wiki/static/upload/tif2segy, and was modified to manipulate the oil and gas multichannel data used in the study. In addition to the SEG-Y conversion, the script adds the interpolated navigation and windows the data. The script can be compiled with an optimizing compiler, such as the GNU Compiler Collection, and called in batch scripts to manipulate multiple files.
# Converts an 8-bit greyscale TIFF file to a segy file
# Assumes that there is one pixel horizontally for each trace
# and 1 pixel vertically for each time sample.
# Assumes the sample interval in the resulting segy file
# is 4ms (i.e. 250 samples or pixels per second)
#
# Author: Andrew MacRae, (Andrew.MacRae at SMU.CA)
# usage:
# tif2segy filename.tif
# output will be put in filename.segy
# Note: This script has been modified to manipulate
# 2D multichannel seismic data (e.g. flip, scale, contrast
# add UTM nav for each trace, and window to 1s). Modifications
# commented as "11/30/21"
# 11/30/21
# Set tiffile = $1
set pngfile = $1
# Get linename, without .png
set linename = $1:r
#if ( !( -e "$tiffile" ) ) then
if ( !( -e "$pngfile")) then
echo "tif2segy -- convert a TIFF image file to a SEGY file"
echo "By Andrew MacRae, and the authors of NetPBM and Seismic Unix"
echo
echo "Usage: tif2segy filename.tif"
echo
echo "Input file should be a TIFF file with the content of the seismic plot"
echo "(i.e. no labels or annotation -- only the data) with 1 pixel per "
echo "trace horizontally, and one pixel per sample vertically."
echo "The number of traces and number of samples are calculated from the image size."
echo "Output is placed in filename.segy."
echo
echo "The program assumes that the "netpbm" image tools and "Seismic Unix""
echo "are already in the command path."
exit(1)
else
echo "tif2segy -- convert a TIFF image file to a SEGY file"
echo "By Andrew MacRae, and the authors of NetPBM and Seismic Unix"
echo
endif
if( `which tifftopnm | cut -f 1 -d ' '` == 'no' ) then
echo "Could not find the NetPBM tools (e.g., tifftopnm)."
echo "You need to install them, or put them into your command path."
exit(1)
endif
if( `which suaddhead | cut -f 1 -d ' '` == 'no' ) then
echo "Could not find Seismic Unix."
echo "You need to install it, or put the programs into your command path."
exit(1)
endif
# sample interval -- 4000 = 4 milliseconds
#set interval = 4000
#11/30/21:
#set interval = 3000
set interval = 2000
# 11/30/21 (convert png files to tif and flip (traces low/left to high/right)):
pngtopnm < $pngfile | pamflip -lr | pnmtotiff > $linename.tif
# Get number of traces, then scale horizontally and vertically
set fileversion = _utm.txt
gmt info $linename$fileversion | cut -d "/" -f 2 | cut -d">" -f 1 > tmp_width_value.txt
set tracewidth = `cat tmp_width_value.txt`
echo $tracewidth
set fileversion = _scale
tifftopnm < $linename.tif | pamscale -xsize=$tracewidth -ysize=3500 | pnmnorm | pnmtotiff > $linename$fileversion.tif
set tiffile = $linename$fileversion.tif
# get size of image:
# horizontal pixels -> number of traces
# vertical pixels -> number of samples
#set traces = `tifftopnm < $tiffile | pnmfile | cut -f 3 -d ' ' -s`
set traces = `tifftopnm < $linename.tif | pnmfile | cut -f 3 -d ' ' -s`
set samples = `tifftopnm < $tiffile | pnmfile | cut -f 5 -d ' ' -s`
echo image file $tiffile has $traces horizontal pixels which will become "traces"
# convert image to byte values and invert values (tifftopnm and pnminvert)
# rotate and flip to Seismic Unix standard trace-sample orientation
# (pnmflip), chop off PGM image header (tail), reformat data from
# 8-bit character values to floating point (recast), and then
# add trace headers and insert sample interval (suaddhead and
# sushw). Output to Seismic Unix data file (.su file)
# 11/30/21 add navigation to su file
# use GMT sample1d to calculate nav for each trace
# and convert nav file from ascii to binary
set fileversion = _utm.txt
set fileversion2 = _s1d
gmt sample1d -V $linename$fileversion -N0 -T1 > $linename$fileversion2$fileversion
a2b < $linename$fileversion2$fileversion n1=5 > $linename.bin
# include nav in added sushw string
echo $tiffile
tifftopnm < $tiffile | pnminvert | pnmflip -r90 -tb | tail +4 | recast in=uchar out=float \
| suaddhead ns=$samples ftn=0 | sushw key=dt a=$interval | sushw key=tracl,sx,sy,gx,gy infile=$linename.bin > $linename.su
# 11/30/21 Create version windowed to 1sec
set fileversion = _wind
suwind < $linename.su key=tracl tmax=1 > $linename$fileversion.su
#get firstbreak of .su File
set fileversion2 = _fb
sufbpickw < $linename$fileversion.su | sugethw key=tracl,sx,sy,unscale > $linename$fileversion2.txt
# create binary and EBCDIC headers
segyhdrs < $linename.su
# default header is not needed
rm header
# write out a 40-line, 80 character/line header to be converted to EBCDIC
# get the name of the file, without a .tif ending
# 11/30/21 following already set
# set linename = $tiffile:r
echo "C " > tif2segy_header
# This will output a line with the linename (derived from the filename)
# and then truncate the line to 80 characters
# Please modify this header to describe your data.
echo "C Line from file: " $linename " " | cut -c1-79 >> tif2segy_header
echo "C " >> tif2segy_header
echo "C This SEGY file was created by the USGS using 2D multichannel " >> tif2segy_header
echo "C seismic data from https://walrus.wr.usgs.gov/namss/ " >> tif2segy_header
echo "C " >> tif2segy_header
echo "C File was converted using tif2segy, netpbm, and Seismic Unix " >> tif2segy_header
echo "C Author of tif2segy script is Andrew MacRae (andrew.macrae at smu.ca) " >> tif2segy_header
set i = 0
while ($i < 32 )
echo "C " >> tif2segy_header
set i = ($i + 1)
end
# write a SEGY file using headers and Seismic Unix file. Include 'endian=0' if using a little endian machine.
segywrite tape=$linename.segy bfile=binary hfile=tif2segy_header endian=0 < $linename.su
# 11/30/21 write a SEGY file for windowed version as well
segyhdrs < $linename$fileversion.su
segywrite tape=$linename$fileversion.segy bfile=binary hfile=tif2segy_header endian=0 < $linename$fileversion.su
# leave cleanup to the user, in case they want to review the
# Seismic Unix files
echo "Cleaning up temporary files: tif2segy_header, binary, and" $linename.su
rm tif2segy_header
rm binary
# 11/30/21 keeping .su file
#rm $tiffile:r.su
exit(0)
File Structure
File deliverables. Note that the directory structure may change according to repository.
./Mobile_segy/Segy_files:
B-12-80-MI
B-12-84-AL
B-24-85-MI
B-56-87-LA
./Mobile_segy/Segy_files/B-12-80-MI/Nav_and_Metadata_files:
GOMSEGY05-1_M80-012.segp1
b-12-80-mi.seismic-v1.xml
./Mobile_segy/Segy_files/B-12-80-MI/Original_segy:
MO05.segy
MO05_2.segy
MO05_B.segy
MO07.segy
MO09.segy
MO09_B.segy
MO11.segy
MO12.segy
MO13.segy
MO14.segy
MO16.segy
MO18.segy
MO20.segy
MO22.segy
MO24.segy
MO26.segy
MO28.segy
MO30.segy
MO32.segy
MO34.segy
MO36.segy
MO38.segy
MO40.segy
MO42.segy
MO44.segy
MO46.segy
MO50.segy
MO52.segy
MO54.segy
MO56.segy
MO58.segy
MO60.segy
MO62.segy
MO64.segy
MO66.segy
MO68.segy
MO70.segy
./Mobile_segy/Segy_files/B-12-84-AL:
MAS-84-0011.pdf
MAS-84-0012.pdf
MAS-84-0013.pdf
MAS-84-0015.pdf
MAS-84-0017.pdf
MAS-84-0018.pdf
MAS-84-0020.pdf
MAS-84-0021.pdf
MAS-84-0023.pdf
MAS-84-0024.pdf
MAS-84-0026.pdf
MAS-84-0028.pdf
MAS-84-0030.pdf
MAS-84-0205W.pdf
Nav_and_Metadata_file
./Mobile_segy/Segy_files/B-12-84-AL/Whole_file_segys:
MAS-84-0011.segy
MAS-84-0012.segy
MAS-84-0013.segy
MAS-84-0015.segy
MAS-84-0017.segy
MAS-84-0018.segy
MAS-84-0020.segy
MAS-84-0021.segy
MAS-84-0023.segy
MAS-84-0024.segy
MAS-84-0026.segy
MAS-84-0028.segy
MAS-84-0030.segy
MAS-84-0205W.segy
./Mobile_segy/Segy_files/B-12-84-AL/Windowed_segys:
MAS-84-0011_wind.segy
MAS-84-0012_wind.segy
MAS-84-0013_wind.segy
MAS-84-0015_wind.segy
MAS-84-0017_wind.segy
MAS-84-0018_wind.segy
MAS-84-0020_wind.segy
MAS-84-0021_wind.segy
MAS-84-0023_wind.segy
MAS-84-0024_wind.segy
MAS-84-0026_wind.segy
MAS-84-0028_wind.segy
MAS-84-0030_wind.segy
MAS-84-0205W_wind.segy
./Mobile_segy/Segy_files/B-24-85-MI:
12ext.segy
ma12.segy
ma14.segy
ma18.segy
ma20.segy
ma21.segy
ma23.segy
ma24.segy
ma25.segy
ma26.segy
ma27.segy
ma29.segy
ma30.segy
ma30a.segy
ma31.segy
ma32.segy
ma33.segy
ma35.segy
ma36.segy
ma37.segy
ma38.segy
ma39.segy
ma41.segy
ma42a.segy
ma43.segy
ma45.segy
ma47.segy
ma49.segy
ma51.segy
wt1.segy
x14.segy
x16.segy
x20.segy
./Mobile_segy/Segy_files/B-24-85-MI/Windowed_segy_files:
12ext_win.sgy
ma12_win.sgy
ma14_win.sgy
ma18_win.sgy
ma20_win.sgy
ma21_win.sgy
ma23_win.sgy
ma24_win.sgy
ma25_win.sgy
ma26_win.sgy
ma27_win.sgy
ma29_win.sgy
ma30_win.sgy
ma30a_win.sgy
ma31_win.sgy
ma32_win.sgy
ma33_win.sgy
ma35_win.sgy
ma36_win.sgy
ma37_win.sgy
ma38_win.sgy
ma39_win.sgy
ma41_win.sgy
ma42a_win.sgy
ma43_win.sgy
ma45_win.sgy
ma47_win.sgy
ma49_win.sgy
ma51_win.sgy
wt1_win.sgy
x14_win.sgy
x16_win.sgy
x20_win.sgy
x20_win.su
x20_win_fb.su
x20_win_fb.txt
./Mobile_segy/Segy_files/B-56-87-LA/Original_segy:
dmp07.segy
dmp09.segy
dmp106.segy
dmp108.segy
dmp11.segy
dmp110.segy
dmp112.segy
dmp114.segy
dmp13.segy
dmp15.segy
./Mobile_segy/Segy_files/B-56-87-LA/Original_segy/Windowed_segys:
dmp07_wind.sgy
dmp07_wind.su
dmp07_wind_fb.su
dmp09_wind.sgy
dmp106_wind.sgy
dmp108_wind.sgy
dmp110_wind.sgy
dmp112_wind.sgy
dmp114_wind.sgy
dmp11_wind.sgy
dmp13_wind.sgy
dmp15_wind.sgy
./Pensacola_segy:
B-19-84-MI
B-24-85-MI
./Pensacola_segy/B-19-84-MI/PDF_files:
FFI-84-0115.pdf
FFI-84-0119.pdf
FFI-84-0123.pdf
FFI-84-0127A.pdf
FFI-84-0127B.pdf
FFI-84-0131.pdf
FFI-84-0135.pdf
FFI-84-0139.pdf
FFI-84-0143.pdf
FFI-84-0147.pdf
FFI-84-0151.pdf
./Pensacola_segy/B-19-84-MI/PDF_files/Cropped_scaled/Whole_file_segys:
FFI-84-0115.segy
FFI-84-0119.segy
FFI-84-0119_redo.segy
FFI-84-0123.segy
FFI-84-0127A.segy
FFI-84-0127B.segy
FFI-84-0131.segy
FFI-84-0135.segy
FFI-84-0139.segy
FFI-84-0143.segy
FFI-84-0147.segy
FFI-84-0151.segy
./Pensacola_segy/B-19-84-MI/PDF_files/Cropped_scaled/Windowed_segys:
FFI-84-0115_wind.segy
FFI-84-0119_redo_wind.segy
FFI-84-0119_wind.segy
FFI-84-0123_wind.segy
FFI-84-0127A_wind.segy
FFI-84-0127B_wind.segy
FFI-84-0131_wind.segy
FFI-84-0135_wind.segy
FFI-84-0139_wind.segy
FFI-84-0143_wind.segy
FFI-84-0147_wind.segy
FFI-84-0151_wind.segy
./Pensacola_segy/B-24-85-MI/Segy_files:
ma59.segy
ma63.segy
wt3.segy
wt3cd.segy
wt4.segy
x22.segy
x24.segy
./Pensacola_segy/B-24-85-MI/Segy_files/Windowed_segys:
ma59_wind.sgy
ma63_wind.sgy
wt3_wind.sgy
wt4_wind.sgy
x22_wind.sgy
x24_wind.sgy
Datums
Vertical coordinate information is referenced to the North American Vertical Datum of 1988 (NAVD 88).
Horizontal coordinate information is referenced to the North American Datum of 1983 (NAD 83).
Abbreviations
2D
two dimensional
3D
three dimensional
ASCII
American Standard Code for Information Interchange
BOEM
Bureau of Ocean and Energy Management
GMT
Generic Mapping Tools
NAMSS
National Archive of Marine Seismic Surveys
O&G
oil and gas
OCS
Outer Continental Shelf
PDF
Portable Document Format
SEG-Y
Society of Exploration Geophysicists revision Y
TIFF
tagged image file format
TWT
two-way travel
USGS
U.S. Geological Survey
UTM
Universal Transverse Mercator
For more information about this publication, contact
Director, St. Petersburg Coastal and Marine Science Center
600 4th Street South
St. Petersburg, FL 33701
For additional information, visit
https://www.usgs.gov/centers/spcmsc
Publishing support provided by
Lafayette and Reston Publishing Service Centers
Disclaimers
Any use of trade, firm, or product names is for descriptive purposes only and does not imply endorsement by the U.S. Government.
Although this information product, for the most part, is in the public domain, it also may contain copyrighted materials as noted in the text. Permission to reproduce copyrighted items must be secured from the copyright owner.
Suggested Citation
Flocks, J., Forde, A., and Bosse, S., 2023, Evaluating oil and gas industry two-dimensional multichannel seismic data for use in near-surface assessment of geologic framework and potential marine minerals resources: U.S. Geological Survey Techniques and Methods, book 2, chap. E4, 25 p., https://doi.org/10.3133/tm2E4.
ISSN: 2328-7055 (online)
Study Area
| Publication type | Report |
|---|---|
| Publication Subtype | USGS Numbered Series |
| Title | Evaluating oil and gas industry two-dimensional multichannel seismic data for use in near-surface assessment of geologic framework and potential marine minerals resources |
| Series title | Techniques and Methods |
| Series number | 2-E4 |
| Subseries | Book 2, Collection of Environmental Data |
| DOI | 10.3133/tm2E4 |
| Publication Date | August 21, 2023 |
| Year Published | 2023 |
| Language | English |
| Publisher | U.S. Geological Survey |
| Publisher location | Reston, VA |
| Contributing office(s) | St. Petersburg Coastal and Marine Science Center |
| Description | Report: viii, 25 p.; Data Release |
| Country | United States |
| State | Alabama, Florida, Louisiana, Mississippi, Texas |
| Other Geospatial | northern Gulf of Mexico |
| Online Only (Y/N) | Y |