

Determination of Per- and Polyfluoroalkyl Substances in Water by Direct Injection of Matrix-Modified Centrifuge Supernatant and Liquid Chromatography/Tandem Mass Spectrometry with Isotope Dilution
Links
- Document: Report (5.35 MB pdf) , HTML , XML
- Data Release: USGS data release - Concentrations of per- and polyfluoroalkyl substances (PFAS) from validation experiments and custom sample analysis by U.S. Geological Survey (USGS) National Water Quality Laboratory (NWQL) Laboratory Code 9660, December 2020 to March 2022
- Download citation as: RIS | Dublin Core
Acknowledgments
Ralph Hindle (Vogon Laboratories) provided consultation on instrument optimization and sample preparation procedures. David Steinberg (Agilent, Wilmington, Delaware) provided assistance with instrument configuration and background reduction. Stan Skrobaliowski, Jerry Casile, Tim Oden, and Dana Kolpin, all of the U.S. Geological Survey, kindly provided samples for our validation studies.
Abstract
A direct-injection liquid chromatography/tandem mass spectrometry method was developed to determine 34 per- and polyfluoroalkyl substances (PFAS), including selected branched isomers, in centrifuge supernatant of matrix-modified (amended with approximately 50 percent methanol) water samples. The method has been validated in reagent water, surface water, groundwater, and wastewater effluent. Other water types (for example, drinking water, untreated wastewater, and landfill leachate) have been analyzed by the method but not systematically validated. Recovery of isotope-dilution standards, added to each sample, may be used to assess method performance in nonvalidated matrices on a sample-by-sample basis.
Using this method, PFAS concentrations were determined in the range of 2–2,000 nanograms per liter in water samples. This range can be extended by diluting concentrated samples. At circumneutral pH, most compounds are present in the environment in their ionized form, and data are reported as such (for example, perfluorooctanoic acid is referred to as “perfluorooctanoate” [PFOA], perfluorooctane sulfonic acid is referred to as “perfluorooctane sulfonate” [PFOS]).
Sample preparation procedures were designed without the use of filtration and with minimum sample handling steps to mitigate procedural losses of target compounds due to sorption to surfaces. Further, isotope-dilution quantification allowed for the correction of bias that may result from procedural losses, matrix-induced signal suppression or enhancement, and other factors.
Validation experiments to characterize bias and variability, method detection level, and holding time were done in four distinct water matrices—reagent water, surface water, treated wastewater effluent, and groundwater—at multiple concentration levels. Mean PFAS recoveries met data quality objectives of bias and variability studies in all four validation matrices except for two compounds with low and variable recovery in the reagent water matrix only. Isotope-dilution standards, treated as surrogate compounds, were analyzed in more than 1,500 customer-submitted environmental samples with aggregate recovery of 102.5±6.5 percent (mean±standard deviation). Maximum holding times for all target compounds in the four validation matrices were 28 days for refrigerated samples and 90 days for frozen samples.
Introduction
Per- and polyfluoroalkyl substances (PFAS) are a diverse group of synthetic organic compounds that can be found in aqueous film-forming foam used in firefighting, grease and stain repellents for fabric and food packaging, metal plating, and aviation hydraulic fluids, among other uses (for example, refer to Ahrens, 2011; Buck and others, 2011; and Moe and others, 2012). Exposure to some PFAS has documented effects on humans and wildlife, and the persistence of these compounds in the environment has been well documented (Tokranov and others, 2021). Thus, the presence of PFAS in water can pose a threat to water availability for human and ecological uses. The widespread use of PFAS and their recalcitrance to chemical and biological treatment make treated wastewater effluent (WWE) an important source of PFAS in the environment (Zareitalabad and others, 2013). Industrial discharges and hydrocarbon-fueled firefighting operations can represent other important sources to the environment and can lead to extremely high (thousands of nanograms per liter [ng/L]) concentrations of PFAS in groundwater, creating groundwater plumes near points of discharge or use (Hu and others, 2016). The presence of PFAS in drinking water sources across the coterminous United States makes drinking water a potentially important human exposure mechanism (Hu and others, 2016).
As a result, although drinking water is not the only human exposure mechanism for PFAS and ecological effects are not explicitly considered by regulators, most existing and proposed regulatory limits on PFAS in the United States are relevant to drinking water and ecological exposures. There are more than 4,000 PFAS structures that have been synthesized, either intentionally or as byproducts of the synthesis process (Tokranov and others, 2021). Most of these compounds have not been studied in depth, and only a small fraction has been singled out as a concern for drinking water and other environmental compartments.
Analytical methods to determine a broad range of PFAS compounds, including perfluorocarboxylates (PFCAs), perfluorosulfonates (PFSAs), perfluoroalkane sulfonamides (FASAs), perfluorooctane sulfonamideacetates (FOSAAs), fluorotelomer sulfonates (FTSAs), and novel PFCA/PFSA replacement compounds, are important to help monitor water quality in the Nation’s water resources. All the above PFAS are determined by the method detailed in this report.
The Interstate Technology Regulatory Council (ITRC) maintains a database of current PFAS regulations, guidance, and advisories for the entire United States, individual States, and selected international jurisdictions (Interstate Technology Regulatory Council, 2020). As of June 2022, the ITRC database includes regulations or guidelines for 21 unique PFAS compounds, although not all these compounds are addressed by every jurisdiction. Perfluorooctane sulfonate (PFOS) and perfluorooctanoate (PFOA) are almost universally addressed by these entities, and perfluorobutanoate (PFBA), perfluoroheptanoate (PFHpA), perfluorononanoate (PFNA), perfluorobutane sulfonate (PFBS), and perfluorohexane sulfonate (PFHxS) are also commonly addressed. The other compounds are addressed less frequently.
Notably, in 2016 the U.S. Environmental Protection Agency (EPA) promulgated Drinking Water Health Advisory levels for PFOS plus PFOA in drinking water of 70 parts per trillion (ppt), which is equivalent to 70 ng/L (EPA, 2016a, b). In June 2022, the EPA lowered this guidance for PFOS to 0.02 ng/L and for PFOA to 0.004 ng/L and established new Drinking Water Health Advisory levels for hexafluoropropylene oxide-dimer acid (HFPO-DA, GenX) and PFBS of 10 and 2,000 ng/L, respectively (EPA, 2022). Furthermore, other jurisdictions have implemented or are considering implementing regulatory levels for drinking water that are lower than 70 ng/L, encompass a wider range of PFAS compounds than PFOS and PFOA, or both. For example, in 2018, the California State Water Resources Control Board’s Division of Drinking Water set interim notification levels of 14 ppt for PFOA and 13 ppt for PFOS (Interstate Technology Regulatory Council, 2020). Also, the Minnesota Department of Health has issued health-based guidance values for drinking water for PFBS of 100 ng/L, PFHxS of 47 ng/L, PFOS of 15 ng/L, PFBA of 7,000 ng/L, and PFOA of 35 ng/L (Minnesota Department of Health, 2022). Thus, for maximal utility, U.S. Geological Survey (USGS) methods for the determination of PFAS in water are designed to help meet research and regulatory requirements.
Background
The Water Quality Processes Technical Requirements Team, operating within the USGS Water Resources Mission Area, has specified a list of 34 compounds to be included in targeted PFAS methods to determine PFAS compounds in water, soils, and sediments. This report documents method development and validation of method performance to determine PFAS concentrations in water for all 34 of those compounds (table 1). The determination of PFAS compounds in sediment and soil requires additional sample preparation steps, including PFAS extraction and sample cleanup procedures. As a result, soil and sediment analysis is beyond the scope of this report.
Table 1.
List of target compound and isotope-dilution standard (IDS) pairings.[For 22 of 34 compounds, an exact structural analog is used as the IDS. For the remaining 12 compounds, a closely related structural analog (indicated by an asterisk [*]) is used.]
None of the target PFAS (table 1) in the method detailed in this report has been previously monitored by approved USGS analytical methods. Each compound has a National Water Information System (NWIS) parameter code that is unique to this method and does not use existing parameter codes under which contract laboratory data are stored. Previously existing parameter codes are designated as “filtered water” or “unfiltered water.” Unlike other analytical methods for PFAS compounds in water, this method uses centrifugation instead of filtration to remove particulate matter from raw water samples, avoiding the potential biases associated with filtration. Therefore, the parameter codes and method codes in NWIS identify the matrix as “centrifuge supernatant.”
Another major difference between this method and other laboratory methods in common use (for example, EPA, 2021) is that this method does not use solid-phase extraction (SPE) or any other form of sample enrichment before liquid chromatography/tandem mass spectrometry (LC/MS/MS) analysis. There are several benefits to this approach: (1) the sample preparation process requires less time for sample preparation; (2) the required sample volume is much less (1 milliliter [mL] compared to 250 mL), which can reduce sample collection and shipping costs and the waste stream produced through operation of the method; and (3) most crucially, sample handling and transfer steps are minimized, eliminating many opportunities to introduce bias from analyte losses and (or) sample contamination. Although SPE enrichment can result in lower method detection levels (MDLs), the newest generation of LC/MS/MS systems are sensitive enough to meet the MDL requirements of the USGS.
This method uses isotope-dilution quantification (IDQ) to implicitly correct for procedural variations that persist despite a streamlined preparation procedure (Foreman and others, 2012). Approximately 50 percent methanol and a mixture of 20 isotope-dilution standards (IDSs) are added to each sample before centrifugation. Each target compound is quantified relative to an IDS, and the recovery of each IDS is evaluated relative to an injection internal standard (IIS) added at the time of transfer to a high-performance liquid chromatography (HPLC) vial after all sample preparation steps are complete. The IDS recoveries provide sample-specific quality control (QC) information for all analyses and can be used to qualify data if recovery is poor or to adjust MDLs, as appropriate.
For 14 target compounds, an exact analog IDS compound (that is, a compound that differs from the target compound only in the additional mass of the isotopic labels deuterium [d] or carbon-13 [13C]) was not available. For these compounds, the target compound was quantified relative to a structurally similar IDS, and spike-recovery data were evaluated to ensure that the behavior of the IDS closely mimicked that of the target compound. The IDS associated with each target compound is shown in table 1. Qualitative identification of the target PFAS was confirmed by monitoring chromatographic retention time and the area ratio of multiple-reaction-monitoring (MRM) precursor-to-product ion transitions. For two compounds (PFBA and perfluoropentanoate [PFPeA]), only one MRM transition was available, and valid detections were qualified without a confirmatory ion. This is consistent with the procedures used for other published PFAS methods (Schultz and others, 2006; Shoemaker and Tettenhorst, 2018; EPA, 2021).
Purpose and Scope
The purpose of this report is to describe the analytical procedure for a new direct-injection (DI) LC/MS/MS method for determining PFAS compounds in matrix-modified centrifuge supernatant of water samples and to provide data to validate method performance. The validation studies include bias and variability, MDL, and holding time. All experiments were performed in four water matrices (reagent water [RW], groundwater [GW], surface water [SW], and treated municipal wastewater effluent [WWE]), except for the frozen holding time experiment, which omitted groundwater. Bias and variability were evaluated by analyzing replicate samples (n=7) spiked at seven different concentrations for each compound. If a specific compound could not be detected in low-concentration spikes, bias and variability were reported at fewer than seven concentration levels. MDLs were determined according to National Water Quality Laboratory (NWQL) quality management system requirements. Advancing Standards Transforming Market’s (ASTM’s) DQCALC software was used to calculate Currie’s critical level (Lc) within laboratory values as the MDL. Laboratory reporting levels were assigned as twice the MDL (ASTM International, 2010, 2013; Foreman and others, 2021). These ASTM standards were not revised or reapproved within an 8-year window and were withdrawn from active status. ASTM has confirmed that this has no bearing on the validity of the described processes, and that it remains acceptable to use and reference both of these historical standards (James R. Morgan, ASTM, written commun., June 2025). Stability was studied at 4 degrees Celsius (°C) with compound recoveries evaluated after 7-, 28-, and 90-day storage intervals and at −4 °C with recoveries evaluated after 90 days to determine maximum holding times.
Previous Studies
Sample collection, isolation, and sample cleanup must be considered before any discussion of instrumental analysis, particularly for this class of compounds because of their ubiquitous presence in the environment and potential sorption to sampling containers (Martin and others, 2004; Taniyasu and others, 2005). Fluorinated materials used in the analysis, such as filtration and extraction media (Arp and Goss, 2009) or tubing and seals in the HPLC instrumentation (Yamashita and others, 2004), can also cause analytical artifacts. Procedural losses can occur during sample preparation, but these are more easily compensated for using IDQ, or in ideal circumstances, standard addition quantification (SAQ). Both IDQ and SAQ can involve additional expense compared to internal- or external-standard quantification, because IDQ requires the acquisition of stable-isotope analogs of target compounds and SAQ requires the analysis of multiple spiked replicate samples to yield a single analytical result. Therefore, the interlaboratory comparison of van Leeuwen and others (2009) demonstrated that SAQ may generate more robust results in the absence of exact isotopic analogs, but when cost is considered, IDQ appears to be a reasonable alternative.
Another important consideration in the development of PFAS methods is the stability of PFAS compounds in stored samples and standards. In a study of 29 PFAS compounds in four matrices (bottled water, surface water, two wastewater treatment plant [WWTP] effluents) at three temperatures (20 °C, 4 °C, −20 °C), 10 compounds showed changes in concentration during storage in at least one experimental treatment (Woudneh and others, 2019). Most of these changes were observed in 20 °C treatments, indicating that refrigeration or freezing is at least somewhat effective at mitigating the interconversion of PFAS compounds. In fact, no changes to compound concentration were observed in any matrix for frozen samples (−20 °C). For refrigerated (4 °C) samples, no changes were observed in bottled water samples, but in surface water, 4 compounds had substantial decreases in concentration and 2 compounds increased. Likewise, in refrigerated WWTP effluents, 5 compounds decreased in concentration and 3 compounds increased. Woudneh and others (2019) demonstrate that, although the conventional wisdom that PFAS compounds are particularly stable in laboratory storage conditions is true, there are exceptions that must be considered when determining acceptable holding times.
One of the first extraction techniques for PFCA and PFSA utilized weak anion exchange SPE prior to derivatization gas chromatography/mass spectrometry (GC/MS) analysis (Moody and Field, 1999). The method was refined and applied to an LC/MS/MS quantification method by Taniyasu and others (2005). Other methods compared by van Leeuwen and others (2009) utilized SPE phases of octadecyl alkyl (C18), OASIS-HLB, OASIS-WAX, styrene-divinylbenzene, or liquid-liquid extraction with methyl tert-butyl ether (MTBE) as a solvent. Methods that used a cleanup step generally involved washing the extraction media with a weaker solvent than was used to elute the compounds of interest.
Some methods have eliminated offline preconcentration as more sensitive mass spectrometers have become available and online SPE has become more feasible. Schultz and others (2006) utilized online SPE of a 500 microliter (μL) sample aliquot on a guard column followed by LC/MS/MS analysis. Backe and Field (2012) used large-volume injection of 900 μL samples and analysis of several PFCAs, PFSAs, and steroid estrogens to determine the need for SPE concentration techniques in general. Methods developed at the NWQL for pesticides (Sandstrom and others, 2015) and pharmaceuticals (Furlong and others, 2014) show that, with modern instrumentation, DI can achieve reasonable MDLs without the large-volume injection that required SPE for earlier methods. This has also been shown by Weber and others (2017).
The EPA has developed multiple methods for PFAS determination that have been approved. The discussion in this report is limited to the two most common methods that are offered by multiple laboratories and in widespread use. Method 537.1 is approved for the determination of 18 PFAS compounds in drinking water only (Shoemaker, and Tettenhorst, 2018), and Method 1633 (EPA, 2021) has been approved for the determination of 40 PFAS in water and other matrices including solids and tissues. All 18 compounds in Method 537.1 are determined by the method detailed in this report; Method 1633 determines 10 compounds not determined by this method (this method determines 4 compounds that are not determined by Method 1633).
The major differences between this method and the EPA methods are: (1) separate determination of branched isomers for PFHxS and PFOS (this method); (2) use of IDQ (this method and Method 1633); (3) applicability to water matrices other than drinking water (this method and Method 1633); (4) use of offline SPE (EPA Methods 537.1 and 1633); and (5) use of direct sample injection (this method). Direct sample injection is considered a major advantage of this method compared to Methods 537.1 and 1633 because it can reduce sample handling and the opportunity to introduce bias, reduce sample volume requirements and associated shipping and storage costs, and eliminate the need for filtration, a potential source of negative bias to results. The tradeoff is that processing a smaller volume can make lower detection limits more difficult to achieve.
Analytical Approach
Although the primary purpose of this report is to document the version of this method as implemented at the NWQL, this section also discusses the development process and thus includes some historical information for context.
Selection of Analytes and Matrix
The 34 compounds determined by the method discussed in this report were selected on the basis of a combination of factors:
-
• A review of published and (or) commercially available analytical methods;
-
• A review of regulatory lists, such as the one maintained by ITRC;
-
• The availability of high-quality reference standards; and
-
• The performance of the compound in LC/MS/MS analysis.
The study of PFAS is an evolving field, and new compounds may be added to future iterations of this method. Standards were acquired for a total of 36 PFAS compounds. Two compounds that are included in many other methods, N-methylperfluorooctanesulfonamido ethanol (N-MeFOSE) and N-ethylperfluorooctanesulfonamido ethanol (N-EtFOSE), were eliminated after initial testing because they each had only one ion transition, and that transition was not considered sufficiently diagnostic for qualitative identification in unknown samples.
Selection of Instrumentation
This method was developed and validated using an Agilent 6495A LC/MS/MS system. After analytical conditions were developed for this instrument, the method was tested on an Agilent 6495CA LC/MS/MS system to verify comparable performance on both platforms. Initial optimization experiments focused on identifying the most accurate MRM ion transitions to use for each individual compound on the basis of instrument response and signal-to-noise ratio (SNR) in concentrated standards. Once transitions were identified, they were compared to the MRM transitions used in published methods such as EPA 1633 (EPA, 2021). All the MRM transitions used in published methods were observed on the Agilent system, but for some of the higher mass compounds where more ion transitions were present, instrument response and SNR led to selection of MRM transitions that differed from those in some previously published methods. Next, ionization and fragmentation conditions were optimized to give the highest response for a subset of key regulated compounds, including PFOS and PFOA, while maintaining acceptable performance for all target compounds.
Selection of Sample Preparation Procedures
After a set of optimized parameters for instrumental analysis was selected, sample preparation procedures were developed. During this process, priority was given to minimizing sample volume and handling steps to reduce the loss of target compounds. Particulates must be removed from samples before samples are injected into an LC/MS/MS system. However, many of the target compounds may irreversibly sorb to filter media (Chandramouli and others, 2015). This effect is especially pronounced for higher molecular weight PFAS compounds that contain longer hydrophobic tail moieties. Instead of filtration, this method uses centrifugation for particle removal. In addition to eliminating the potential negative bias introduced by the filtration process, this approach has the advantage of allowing the entire preparatory procedure to be completed in one container. The only transfer step required is from a field-collected polypropylene centrifuge tube to an HPLC vial for instrumental analysis. Still, the more hydrophobic compounds may sorb to container walls in an aqueous sample, and approximately 50 percent methanol is added to each sample to help ensure complete compound recovery. The amount of methanol added varies on the basis of the exact volume of each sample; if the volume falls below 45 percent, recovery losses for the more hydrophobic congeners may be observed. It is possible that some amount of the PFAS that is sorbed to particulate matter also could be extracted. This amount could vary considerably with water quality, particulate load, and other conditions, and was not tested exhaustively during validation.
Coding and Nomenclature Used by the National Water Quality Laboratory and the National Water Information System
The sections “Method Number, Schedule, and Code,” “Scope and Application,” and “Nomenclature” summarize the naming schemes, scope, and nomenclature applicable to this report’s method. This information is utilized to identify PFAS and to distinguish results generated by this method from those generated by other methods that may also be present in NWIS.
Method Number, Schedule, and Code
The analytical method and validation plan described in this report were developed in consultation with the NWQL and USGS Strategic Laboratory Services Branch, and approval authority resides with the USGS Laboratory and Analytical Services Division. PFAS compounds were analyzed using DI-LC/MS/MS of centrifuge supernatant in accordance with NWQL laboratory code (LC) 9660, laboratory method code LCM85, and USGS Method O-4441-22. When the method described in this report is approved, it will be referred to as “Laboratory Schedule 9660.” The laboratory method code is used by NWIS (https://nwis.waterdata.usgs.gov/nwis/qw) to describe methods for determining water-quality parameters. In addition, NWIS water-quality software (QWDATA) uses a reference table of parameter-method code pairs (called analyteID) for reporting rounded values to data users. Parameter codes used by this method are listed in table 2.
Table 2.
List of target compounds and isotope-dilution standards with abbreviations, compound groups, and National Water Information System (NWIS) parameter codes.[NWIS method code for the method described in this report, LCM85. IDS, isotope-dilution standard]
Scope and Application
Laboratory code 9660 was used to determine 34 PFAS compounds in centrifuge supernatant of samples of varying types of water (table 2). The method validation data apply to RW, SW, GW, and WWE. Other water types, such as drinking water, untreated wastewater effluent, or landfill leachate, may be submitted for analysis. For nonvalidated water types, IDS recovery may be used to indicate whether the method’s performance is comparable to performance in validated water types. However, additional, customer-requested QC samples, such as laboratory matrix spikes, field and laboratory replicates, and field and laboratory blanks, are helpful to document study-specific method performance.
The range of calibration standard concentrations spans from 1 to 1,000 ng/L. The MDLs range from 0.7 to 81 ng/L. Information about the PFAS compounds summarized in table 2 includes compound names and abbreviations and NWIS parameter codes. The MDLs and laboratory reporting levels (LRLs) are summarized in table 3 and use ASTM International’s DQCALC procedure (ASTM International, 2010).
Table 3.
Method detection levels (MDLs) and laboratory reporting levels (LRLs) determined from spike experiments at multiple concentration levels using ASTM International's DQCALC procedure.[The MDL is set at Currie's critical level (Lc) and the LRL is set at 2 times (2´) the MDL with two exceptions. When qualitative identification criteria could not be met at the DQCALC method reporting level (MRL; ASTM International, 2010) in at least 50 percent (%) of batches (n=25), LRLs were increased to a level where this requirement was satisfied. When qualitative identification criteria were consistently met at concentrations substantially less than the DQCALC MRL, the U.S. Environmental Protection Agency MDL procedure (EPA, 2017) was applied to calculate MDL and LRL. LC, laboratory code; ng/L, nanograms per liter; RL, reporting level; <, less than; >, greater than]
Refer to table 2 for full compound name.
Nomenclature
The compounds in this report may be reported elsewhere as their acid or salt form. For example, the acidic form of PFOA is called perfluorooctanoic acid. The salt form of PFOA is called ammonium perfluorooctanoate. Other target compounds included in this method may occur in similar acid or salt variations. However, in environmental water samples and in negative electrospray ionization LC/MS/MS conditions, the anionic form is dominant for most of the target compounds investigated here. Therefore, this method and NWIS parameter-code definitions use the nomenclature of the anionic form, which is perfluorooctanoate in the current example.
Summary of Method
In the field, 1 mL (or less) samples are collected directly into 2-mL polypropylene microcentrifuge tubes, without filtration or other treatment, and three replicate tubes are shipped to the laboratory on ice.
Upon receipt at the laboratory, sample temperatures are logged and samples are refrigerated at 4 °C until analysis, no later than 28 days after sample collection. Before analysis, samples are warmed to room temperature, weighed, brought to approximately 50 percent methanol, and an IDS solution is added. Samples are then mixed and centrifuged, and a 940 μL aliquot is transferred to a polypropylene HPLC vial containing the IIS (PFPeA-13C3). Vials are mixed using a Vortex Genie 2 mixer placed on the autosampler for analysis.
After the samples are mixed, samples and standards are injected onto a porous-shell C18 analytical column, and PFAS compounds are separated using a binary mobile-phase gradient consisting of 10 millimoles per liter (mmol/L) ammonium acetate in water and methanol. A dynamic MRM method is used to collect specific quantification and qualifying ions for each compound. Compound identification is based on mass-to-charge ratios, comparison of chromatographic retention time, and the ratio of two characteristic MRM transitions to that of a known standard. The concentration of each identified compound is determined using IDQ relative to an exact isotopic analog or closely related structural analog.
Safety Considerations
All procedures that require the use of solvents, such as the preparation of mobile phases, calibration standards, and samples for centrifugation, are done in a fume hood. Eye protection, nitrile gloves, and protective clothing should be worn when handling reagents, solvents, and standards.
Liquid waste produced during sample preparation and analysis, including solvents used for rinsing glassware, unused mobile phase mixtures, and mobile phase waste eluting from the HPLC instrument, is collected in thick-walled plastic carboys. Solid waste, including analytical vials containing samples, standard mixtures, and methanol, is stored in glass carboys. All liquid and solid waste is stored and disposed of according to NWQL waste-handling procedures.
Interferences
Interferences causing either positive or negative bias to analytical results have been well documented in the analysis of PFAS compounds (Rodowa and others, 2020). It is crucial that glass and polytetrafluoroethylene (PTFE, also known as Teflon) are eliminated from sample containers, HPLC vials, caps, cap liners or septa, pipet tips, sampling pumps, tubing, seals, and any other material that will come into direct contact with samples. The disposable materials used in this method are polypropylene, high-density polyethylene (HDPE), or similar nonfluorinated polymer plastics whenever possible. Anionic functionalities in PFAS compounds may sorb to glass surfaces, resulting in a negative bias, although glass containers may be used for concentrated standards stored in an organic solvent such as methanol. Target analytes, such as PFOA and 4,8-dioxa-3H-perfluorononanoate (DONA), may be used in the synthesis of PTFE and potentially leach from PTFE-based materials.
Commercial HPLC systems typically contain PTFE in tubing, seals, solvent degasser membranes, and other components and must be modified to minimize contamination (Anumol and others, 2017). The LC/MS/MS instruments used for this analysis are modified to remove as much PTFE as possible; PTFE is replaced with stainless steel, polyether ether ketone (PEEK), or another nonfluorinated replacement. The HPLC instrument is fitted with a delay column to separate target compounds derived from instrument components from target compounds present in samples. The delay column is placed in the HPLC flow path immediately before the sample injector. Any target compounds present in elution solvents, pumps, pump seals, solvent degasser, or other components upstream from the delay column must pass through two HPLC columns, but target compounds derived from the sample only pass through the instrument’s analytical column. This results in a delay in the contaminant peak, if such a peak is present. When instrument contamination is present, two peaks for PFOA, DONA, or other compounds may be observed; the earlier eluting peak, which has the same retention time as the exact analog IDS, if present, is the peak of interest, and the later eluting peak should not be quantified.
Higher mass PFAS compounds (primarily PFAS with 10 or more carbon atoms) may also sorb to container surfaces in an aqueous sample matrix, causing a negative bias. This can be mitigated by adding methanol to samples to aid compound desorption. For this method, 45–55 percent methanol is added to each sample prior to centrifugation. The methanol fraction varies depending on the volume of the sample submitted. If a subsample must be taken from an aqueous sample (for example, if sample vials are submitted more than half full), an alternate sampling protocol, described later in the report, is applied.
Other sources of interference that are less well documented may occur, including ion suppression or enhancement from matrix components such as ionic strength or dissolved organic carbon. One major advantage of using IDQ is that isotope recovery is used to correct calculated concentrations for such interferences, which may be unpredictable and sample specific. These interference issues can also affect results during field sampling processes before samples are submitted to the laboratory.
Equipment and Supplies
The equipment and supplies listed below were tested during development of this specific method. Specific brand names and catalog numbers are shown as examples used for method development, but equivalent vendors can be used where appropriate.
-
• Analytical vials—Polypropylene crimp-top vials, 1 mL (Agilent Technology, Wilmington, Delaware, Agilent part 5182-0567) with 11-millimeter (mm) polyethylene crimp top (Agilent part 5182-0541). Vials and septa must not contain glass, PTFE, or other fluorinated polymers.
-
• Analytical balance—Capable of weighing to nearest 0.00001 gram (g; Mettler Toledo, Columbus, Ohio, model XS205 or equivalent).
-
• Microcentrifuge—2 mL volume, 24-vial capacity (Fisher Scientific AccuSpin17 or equivalent).
-
• Digital pipette—Various capacities, including 12.5 μL, 125 μL, and 1,250 μL, with disposable polypropylene tips. Pipettes are used to prepare calibration solutions, add methanol, transfer samples from microcentrifuge tubes to analytical vials, and add internal standards and injection standards to samples. Pipette tips must be rinsed with clean methanol to prewet tips and remove any contaminants before use. During custom sample analysis, we observed substantial PFBA contamination from pipette tips that were not rinsed with methanol before use (Kolpin and others, 2021).
-
• Vortex mixer—Vortex Genie 2 (Scientific Industries, Bohemia, New York, model G560).
-
• Glass reagent bottles with ground glass stoppers—These bottles should be used instead of any squeeze bottles for all solvents due to the potential for contamination from PTFE (also known as Teflon) or other fluorinated polymers.
-
• Microcentrifuge tubes, 2 mL—Samples are collected, shipped, stored, and processed in these tubes before transfer to analytical vials. These tubes are preweighed for calculation of sample weight, so only vials supplied by the USGS National Field Supply Service (Denver, Colorado) should be used based on this specific method (USA Scientific, Ocala, Florida, part 1620-2700).
Instrumentation
For the LC/MS/MS system, samples were analyzed using an Agilent model 6495A or 6495CA triple quadrupole mass spectrometer equipped with electrospray ionization with Agilent jet stream and ion funnel technology. The tandem mass spectrometer (MS/MS) was coupled to an Agilent 1200 series LC system consisting of a binary pump (part G4220A), secondary pump (part G7112B), 1290 FlexCube (part G4227A), thermostatted column compartment (part G1316C), and 1290 multisampler (part G7167B). The secondary pump and FlexCube are configured to allow online solid-phase extraction and not strictly required for this method. Qualitative and quantitative analyses were performed using the Agilent MassHunter data system (version B10.00).
Reagents
Reagents used specifically for this laboratory method include neat (undiluted) reagents, solutions that are obtained from external vendors, and solutions that are prepared in the laboratory as specified.
Neat Reagents
-
• Nitrogen gas—High-purity nitrogen (99.999 percent pure), dry, supplied at as much as 30 L/minute from an ultra-pure, condensed tank of nitrogen General Air (Denver, Colo.). This tank can last as many as 3 years on one system and is used as collision gas. Nitrogen from Dewars, which is used as drying gas, may not provide sufficient purity and is used as drying gas, sheath gas, nebulizing gas, and to pressurize the calibrant delivery system in this method. A high-capacity gas conditioner attached to the gas inlet tubing of the LC/MS/MS is used to remove any hydrocarbon contamination from the nitrogen source for collision cell reagent gas.
-
• Laboratory reagent water—Fisher Chemical or equivalent water, ultra-pure (Water, Optima LC/MS, catalog number [cat. no.] W7-4). Only this grade of Optima Water should be used for the preparation of any solutions, buffers, and mobile phases used in this method.
-
• Methanol HPLC grade (no Optima methanol)—Burdick & Jackson, Phoenix, Arizona (cat. no. BJ230-4) or equivalent methanol.
-
• Isopropyl alcohol high purity (no Optima isopropyl alcohol)—Burdick & Jackson (cat. no. BJ3232-4) or equivalent isopropyl alcohol.
-
• Ammonium acetate—98 percent minimum assay, Sigma-Aldrich, St. Louis, Missouri (cat. no. A7330-100G) or equivalent.
Reagent Solutions
-
• 0.5 molar (M) ammonium acetate solution—Dissolve 39.33 g of ammonium acetate into 1 liter (L) of Optima Water. This mass considers the ammonium acetate purity of 98 percent.
-
• Aqueous mobile phase—Optima Water modified with ammonium acetate solution. Dilute 20 mL of 0.5 M ammonium acetate with Optima Water to a final volume of 1 L.
-
• Organic mobile phase—LC/MS-grade methanol. Optima methanol is not suggested for this specific method. We have observed that some lots of Optima methanol contain background ions, which can prohibit the analysis of selected compounds. This background may be the result of polyethylene glycol surfactant contamination.
-
• Needle rinse—Combine 500 mL Optima Water, 250 mL LC/MS-grade methanol, and 250 mL high-purity isopropyl alcohol.
-
• Seal rinse—Combine 900 mL Optima Water with 100 mL high-purity isopropyl alcohol.
-
• Electrospray calibrant mixture—Premixed solution of perfluorinated compounds (unrelated to target compounds) that are distributed in the mass range (from 112 to 2,834 mass-to-charge ratio [m/z]) for tuning electrospray MS/MS (Agilent Technology, part no. G1969-85000 EI-L).
Standards
Analytical reference standards and isotopically labeled standards were obtained from Wellington Laboratories (Ontario, Canada). Standards were purchased as either multiple compound or single-compound solutions rather than as neat material.
Intermediate Stock Solutions
Standards were supplied by the vendor in methanol solutions contained in glass ampules at a nominal concentration of 1 μg/mL with 4-mole-per-liter equivalent sodium hydroxide. If the vendor made the standard from a salt, or the standard contains linear and branched isomers, the actual concentration may deviate from 1 μg/mL (table 4). Thirty-two of the 34 compounds in this method are available as a single solution (Wellington Laboratories, cat. no. PFAC-30PAR) to which two additional compounds (N-methylperfluorooctanesulfonamide [N-MeFOSA-M] and N-ethylperfluorooctanesulfonamide [N-EtFOSA-M]) are added to prepare intermediate stock solutions (table 4). The intermediate stock solution has a nominal concentration of 200,000 ng/L and contains all target compounds. The 20,000 ng/L solution is diluted with methanol to prepare intermediate stocks with nominal concentrations of 100, 500, and 10,000 ng/L.
Table 4.
Composition of intermediate stock solution (in methanol) for the preparation of quality-control standards, including standards for calibration and spiking.[The vendor-supplied mixed stock solution has a concentration of 1 microgram per milliliter (μg/mL) for most compounds. Compounds whose neat forms are salts or contain mixtures of branched and linear isomers have lower concentrations. Compound concentrations listed here reflect standard lots in use as of February 1, 2022; slight variations may be present when new lots are received from vendor. μg/mL, micrograms per milliliter; INT, intermediate; μl, microliters; ng/mL, nanograms per milliliter]
Refer to table 2 for full compound name.
Isotope-Dilution Standard Solutions
Before any centrifugation, IDSs were added to all samples and QC standards, sample transfers, or other processing. Nineteen compounds are supplied by the vendor in a single solution, and one compound (2,3,3,3-Tetrafluoro-2-(1,1,2,2,3,3,3-heptafluoropropoxy)propanoate-13C3 [HFPO-DA, GenX]) was added while preparing intermediate standards. (Alternative names for HFPO-DA/GenX include hexafluoropropylene oxide dimer acid and Perfluoro-2-propoxypropanoate.) Table 5 shows the IDS and stock solutions used, concentrations and volumes of the stock solutions, and final volumes and concentrations of the IDSs. Individual compounds may deviate slightly in concentration from the nominal value. The nominal concentration of the resulting IDS solution with 20 components is 10,000 ng/L. This solution is added to all samples before centrifugation (63 μL) and calibration standards (30 μL) during preparation.
Table 5.
Composition of intermediate stock solution (in methanol) for the preparation of the isotope-dilution standard (IDS) added to each sample.[The vendor-supplied mixed stock solution (MPFAC-24ES) had a concentration of 1 microgram per milliliter (μg/mL) for most compounds. Compounds whose neat forms are salts have lower concentrations. Perfluoro-2-propoxy-13C3-propanoate (HFPO-DA-13C3) was not available in MPFAC-24ES and was added separately (vendor catalog number M3HFPO-DA). All compounds were MPFAC-24ES except for HFPO-DA-13C3. Compound concentrations listed here reflect standard lots in use as of February 1, 2022; slight variations may be present when new lots are received from vendor. μL, microliters; mL, milliliters; ng/mL, nanograms per milliliter]
Injection Internal Standard Solutions
In addition to the IDS solution, an IIS is used to allow internal standard adjustments to be made in the calculation of IDS recovery through the sample preparation process. The IIS for this method is perfluoro-n-pentanoate-13C3 (PFPeA-13C3). The vendor-supplied methanolic stock has a concentration of 5 μg/mL, which is diluted with methanol to 10,000 ng/L. An aliquot of 10 μL of IIS solution is added to all samples and standards at the time of vialing.
Laboratory Spike Solution
The 200,000 ng/L nominal intermediate stock solution (table 4) is diluted with methanol to make a 10,000 ng/L solution used for all reagent water and matrix spikes. To prepare reagent water and matrix spikes, 25 μL of this solution is added to the appropriate sample’s centrifuge tube before centrifuging and transferred to an analytical vial (table 6).
Table 6.
Volumes of water, methanol, injection internal standard (IIS), and isotope dilution standard (IDS) added to standards or samples when transferring to vials for analysis.[Samples had methanol (MeOH) and IDS added prior to centrifugation, so they were not added to samples. Cal, calibration; ng/L, nanograms per liter; μl, microliters; %, percent; L, liters; CCV, continuing calibration verification; TPC, third-party check; NA, not applicable; prep, preparation]
Third-Party Check Intermediate Solution
An alternative solution from Wellington Laboratories is used as a third-party check (TPC). This solution has been updated to conform with the updated method EPA-537PDS-R1 (https://well-labs.com/wp-content/uploads/2019/02/EPA537R1_15feb2019_wellington%20reporter.pdf). However, solutions provided by an alternate vendor can be used, if available. This methanolic solution contains 21 of the target compounds at a nominal concentration of 2,000 μg/L (micrograms per liter) and is diluted in methanol to make TPC (L11), a 10,000 ng/L stock solution (table 6).
Calibration, Continuing Calibration Verification and Blank, Third-Party Check, and Limit of Quantification Standards
Calibration, continuing calibration verification (CCV), continuing calibration verification blank (CCB), TPC, and limit of quantification (LOQ) standards are prepared separately for each analytical run according to the formula in table 6. Each standard is prepared directly in the analytical vial by adding the prescribed volume of the appropriate intermediate standard, IIS, IDS, water, and methanol to provide a calibration curve ranging from 1 to 1,000 ng/L. In table 6, the CCV standards are made at concentrations corresponding to the L7 level, LOQ standard concentrations range from L1 to L6, and CCBs are blanks. Calibration and (or) QC standard vials should not be reinjected; a unique vial should be prepared for each injection planned in an analytical run.
Sample Collection, Shipment, and Holding Times
Samples must be collected using techniques designed to collect a representative, unbiased sample. The National Field Manual for the Collection of Water Quality Data (https://www.usgs.gov/mission-areas/water-resources/science/national-field-manual-collection-water-quality-data-nfm) describes protocols and provides guidelines for USGS personnel who collect water-quality data. Specific guidance for the collection of PFAS samples is in development.
There are precautions that must be taken for this method that may differ from those for other organic chemical methods. PFAS compounds, such as PFOA, other PFCAs, and DONA, may be used in the synthesis of PTFE. Therefore, it is critical that PTFE-containing materials are not used in the collection of PFAS samples. This extends to sample containers, tubing, and anything else that may come in direct contact with water samples. Although it is prudent to avoid the use of sample collection items that may have previously contained PFAS compounds, contamination from such items has not been documented when appropriate protocols are used during sampling (Rodowa and others, 2020).
In addition, PFAS compounds are prone to adsorption to surfaces and interfaces, which can result in analyte losses and negative bias on results. For that reason, sample collection protocols in this method have been streamlined to eliminate filtration steps and minimize steps that involve sample handling and transfer between containers.
Sample Collection
Literature surveys and initial laboratory experiments indicate that all commercially available filter media have the potential to adsorb some PFAS compounds (Chandramouli and others, 2015). Therefore, in this method, samples are not to be filtered in the field, and particle removal before analysis is done in the laboratory by centrifugation.
Samples are collected directly into three replicate 2 mL microcentrifuge tubes filled no more than half full. If tubes are overfilled, removing some water is difficult and can result in sorption of target compounds to container surfaces. Therefore, it is recommended to bring extra microcentrifuge tubes into the field. If a tube is overfilled, it should be discarded and another tube filled to the appropriate level. Filling the tubes no more than halfway allows laboratory staff to fill the remaining volume with methanol. Samples must be in a solution of approximately 50 percent methanol and 50 percent water at the time of centrifugation to ensure that target compounds are not retained on the tube walls.
Submission of three replicates for each sample allows the laboratory to use one microcentrifuge tube for the primary analysis (tube 1) and one for a laboratory QC sample (tube 2); another tube (tube 3) is held in reserve in case sample dilution is required. Owing to the nature of IDQ techniques, sample dilutions cannot be analyzed from the original sample and require the use of a replicate tube. If replicate tubes are not submitted, the sample will not be selected for laboratory QC, and sample dilution for accurate reporting of high-concentration analytes will not be possible. If sample dilution is not possible, any compounds detected beyond the calibration range of the method will be qualified with an “E” result-level remark code and a value-qualifier code of “a” (value extrapolated at high end).
Field Quality Control Samples
Collection and analysis of field QC samples are essential components of water-quality field studies. The NWQL is not, as of 2025, providing a spiking solution for use in the field, but it is recommended that replicates of some samples be collected and submitted to the laboratory for the analysis of laboratory matrix spikes (LMS). The NWQL will use the replicate microcentrifuge tubes submitted to analyze at least one LMS sample and one replicate environmental sample per batch of 20 samples, including 18 environmental samples. However, these are selected at random, and customers can request these analyses for specific samples of interest. Based on the method described in this report, field blanks should be prepared using Fisher Optima Water, available from the National Field Supply Service (no. N1700).
Sample Shipment and Holding Time
After samples are collected, the microcentrifuge tubes should be double bagged in similar clear, sealable (zip-top) bags, with labeling on the outside of the interior bag. They are then shipped to the NWQL in ice-chilled (4–6 °C) coolers. Holding-time studies described in this report show that all target compounds are stable (no compound losses exceed 30 percent) when they are kept chilled at 4 °C for as many as 28 days. This report also documents that all target compounds are stable for at least 90 days if samples are frozen and stored at −4 °C. Samples should be shipped overnight to NWQL to ensure that they remain chilled and are received with sufficient time to meet the 28-day holding time.
Sample Preparation
Upon arrival at the laboratory, samples are frozen at −4 °C if they will not be analyzed within one week. Otherwise, samples are stored at 4 °C in a refrigerator until they are analyzed. Before analysis, samples, IDS, IIS, and standard solutions are brought to room temperature. All samples, calibration standards, and QC standards that are to be analyzed as part of the same instrument run must be processed at the same time. Each instrument run can include as many as three prep batches containing as many as 22 environmental and QC samples. Each prep batch consists of one laboratory reagent water blank, one laboratory reagent water spike (RWS), as many as 18 environmental samples, one LMS (denoted “MSPK” in the worklist shown in table 7), and one replicate (denoted “DUP” [duplicate]). The LMS and replicate samples are selected randomly from the 18 environmental samples in the batch using one of the replicate microcentrifuge tubes submitted with each sample (table 7).
Table 7.
Example instrument batch sequence showing calibration standards, required quality control standards, and groups of environmental samples.[CCB, continuing-calibration blank; CCV, continuing-calibration verification; L, liters; LOQ, limit of quantification; ng/L, nanogram per liter; QC, quality control; TPC, third-party check]
The reagent water blank is prepared by adding 1,000 μL of reagent water to a new microcentrifuge tube. The RWS is prepared by adding 1,000 μL of reagent water and 25 μL of 10,000 ng/L prep spiking standard to a new microcentrifuge tube. For each sample, customers provide three environmental sample replicates. The LMS is prepared by weighing and recording the weight of one of these environmental sample replicates and adding 25 μL of 10,000 ng/L PFAS spiking standard. After preparation is complete, these QC samples are processed identically to the environmental samples in the batch. Preparation of blanks and spikes can be completed the day before the batch is processed.
Each centrifuge tube containing an environmental or QC sample is weighed, and the weight is recorded in the batch spreadsheet. Then, 63 μL of IDS in methanol is added to each tube with additional methanol as needed to bring the final solution to approximately 50 percent methanol. Each tube is capped and mixed for 30 seconds on a Vortex mixer and placed on the centrifuge. The samples are centrifuged for 15 minutes at 13,300 revolutions per minute. After samples are removed from the centrifuge, 10 μL of IIS solution is added to an HPLC vial for each sample followed by 940 μL of the centrifuge supernatant. When this is complete, the remaining sample in each centrifuge tube is discarded, the tube is allowed to dry, and the weight of the dry tube is recorded. This allows the exact volume of water in the original sample to be calculated. As many as three prep batches, processed on the same day, can be included in an analytical run with one set of calibration, LOQ, and TPC standards, and with CCV and CCB samples bracketing each prep batch (table 7).
Alternate Procedure for Preparation of Overfilled Centrifuge Tubes
If all three of the replicate centrifuge tubes are received overfilled (that is, they contain more than 1,200 μL of sample, or the tube weight exceeds 2.36 g), an alternate sample preparation procedure must be followed. This procedure adds considerable time and effort to the processing and may result in an additional charge to the customer.
The entire sample must be weighed and removed from the original centrifuge tube with an automated pipette and dispensed into a 5 mL centrifuge tube. After removal of the sample, 107 μL of IDS and 797 μL of methanol is added to the original 2 mL tube, the solution is vortexed, and the mixture is added to the sample in the 5-mL centrifuge tube. After the first rinse, a second aliquot of 797 μL methanol is added to the 2-mL tube, vortexed, and transferred to the 5-mL tube with the sample. This procedure ensures that any PFAS that adsorbed to container surfaces during shipping and storage is carried through the analysis. This is necessary because PFAS sorption to container walls is more pronounced when the sample matrix is 100 percent water compared to a water-methanol mixture.
After the entire sample and two methanol washes have been transferred to the 5-mL centrifuge tube, the mixture is vortexed for 30 seconds, and a 1.5-mL aliquot is transferred back to the original 2-mL centrifuge tube. The samples are now ready to centrifuge, and the remainder of the process is identical to the standard sample preparation procedure.
Analysis by Liquid Chromatography/Tandem Mass Spectrometry—Setup and Data Acquisition
Sample analysis for this method is conducted using LC/MS/MS. This section describes how instrumentation is set up for analysis and how data are acquired.
Overview
Samples for analysis by DI-LC/MS/MS in 1-mL polypropylene analytical vials contain a mixture of approximately 50 percent water and 50 percent methanol, IDS compounds, and IIS. An aliquot of 20 μL is injected into the LC/MS/MS system. Analytes are separated on a reversed-phase, porous-shell analytical column with a water-methanol-ammonium acetate gradient elution. A C18 reversed-phase column (delay column) is placed immediately upstream of the injector to separate any PFAS contamination internal to the instrument from the PFAS derived from the sample. Such internal PFAS contamination elutes after the peak of interest. After chromatographic separation, compounds undergo negative electrospray ionization followed by multiple-reaction monitoring of two precursor-to-product ion transitions. There is only one suitable transition available for PFBA and PFPeA, so these compounds are analyzed without a confirmatory ion. Data analysis is performed using Agilent MassHunter software (https://www.agilent.com/en/promotions/masshunter-mass-spec), and results are processed using custom Microsoft Excel reports developed by the NWQL to summarize results and quality control information and to ensure reported data are qualitatively and quantitatively accurate.
Separation by Liquid Chromatography
Environmental samples, QC samples, and calibration standards in 2-mL HPLC vials are placed in the sample tray of the autosampler. The sample tray is maintained at room temperature and not chilled because lower temperatures increase the tendency of PFAS to sorb to vial surfaces. A 20 μL aliquot is injected into the HPLC to begin the separation.
The HPLC parameters are shown in table 8, and a representative chromatogram is shown in figure 1 with separation of branched and linear PFHxS (fig. 2A) and PFOS (fig. 2B). An Agilent Poroshell 120 PFP HPLC column (3.1 mm×100 mm×2.7 micrometers [μm]) is used for separation. An Agilent Zorbax Eclipse (3.1 mm×50 mm×5.0 μm or similar C18 column) is used as the delay column and is placed immediately upstream of the injector and downstream of the JetWeaver mixer. A guard column is not used in this method. The mobile phase consists of 10 millimoles per liter (mmol/L) ammonium acetate in water (A) and methanol (B). The column temperature is 40 °C, the flow rate is 0.4 mL/minute, and the HPLC pump gradient (table 9) increases from 10 percent B to 95 percent B during the 23-minute run time. The initial composition of the gradient has less methanol than the sample injection solution does. This composition can result in the broadening of early eluting peaks, but the high methanol content in the vials is necessary to ensure that the less-polar, late-eluting peaks do not sorb to vial walls. The gradient program was optimized to ensure the separation of the branched and linear isomers of PFHxS and PFOS. The isomers of each compound share common fragmentation patterns, so chromatographic separation is the best way to distinguish them for separate quantification.
Table 8.
High-performance liquid chromatography (HPLC) acquisition parameters.[ESI negative, negative electrospray ionization; mm, millimeters; °C, degrees Celsius; mmol/L, millimoles per liter; mL/min, milliliters per minute; min, minute; ~, approximately; μL, microliters]
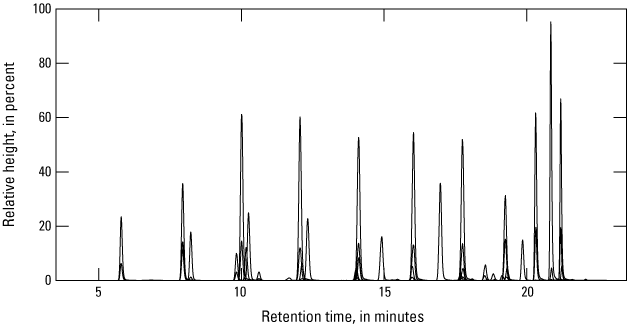
Typical chromatogram of 1,000 ng/L (nanograms per liter) per- and polyfluoroalkyl substances (PFAS) standard.
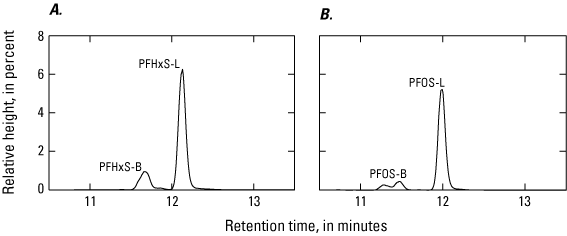
Typical chromatograms showing A, separation of linear and branched isomers of perfluorohexane sulfonate (PFHxS-L and PFHxS-B) and B, separation of linear and branched isomers of perfluorooctane sulfonate (PFOS-L and PFOS-B).
Analysis with Dynamic Multiple-Reaction Monitoring
Dynamic MRM conditions were developed and optimized using procedures similar to those used for DI-LC/MS/MS analysis of pesticides (Sandstrom and others, 2015). Except for PFBA and PFPeA, two unique precursor-to-product ion transitions are monitored for each compound. In negative electrospray conditions, these low molecular weight compounds (PFBA and PFPeA) only produce one fragment ion in sufficient quantities for use in MRM analysis. Ion transitions were chosen on the basis of relative signal strength and comparison of selected ions to published PFAS methods. The ion source parameters are shown in table 10; MRM conditions for the 34 target compounds, 20 isotopically labeled IDS compounds and surrogate standards, and the isotopically labeled IIS compound are shown in table 11. The MRM transitions and HPLC gradient were optimized before the ionization parameters so that ionization conditions could be developed according to solvent conditions present at the time of each compound’s elution. Several changes to the solvent gradient were made during method development, and after each change, ionization parameters were reoptimized.
Table 10.
Ion source parameters for operation in negative electrospray mode.[iFunnel is included on the Agilent 6495C liquid chromatography/tandem mass spectrometry (LC/MS/MS) system and is not included in the 6495A system, leading to the large discrepancy in optimal fragmentor voltage and “not applicable” (NA) notations for iFunnel radio frequency (Rf) voltages. ESI, electrospray ionization mode; °C, degrees Celsius; L/min, liter per minute; kPa, kilopascals; V, volts]
Table 11.
Precursor-to-product ion transitions, collision energies (CE), and retention times for multiple-reaction-monitoring[m/z, mass-to-charge ratio; eV, electron volts; IIS, internal injection standard; --, compound has no qualifier ion]
Refer to table 2 for full compound names.
Mass Calibration
The mass spectrometer is tuned and calibrated using a calibrant mixture and procedures specified by the instrument manufacturer. Before every analytical run, a Checktune routine is initiated to verify that the instrument calibration is acceptable. Checktune is a procedure run in the Agilent MassHunter software that verifies the instrument tuning is still valid and retuning of the instrument is not necessary. If the Checktune report is not satisfactory, the Autotune procedure, also built into the Agilent MassHunter software, is used to optimize ion transmission and electron multiplier voltage. Even if the calibration remains stable and the Checktune passes, Autotune is run at least every 3 months. Typically, these procedures are run only in the negative electrospray mode used by this method, but the Autotune procedure should be run in negative and positive modes when the vendor provides preventative maintenance on the instrument up to three times annually.
Sample Analysis Sequence
Analytical batches are composed of a sequence of calibration, QC, and environmental samples from one or more prep batches and are constructed as shown in table 7. All the QC sample types discussed in this section are prepared by the NWQL analyst as described in table 7. When the same type of QC standard is injected multiple times while preparing a batch, a separate vial is prepared for each injection; multiple injections from the same vial are not advised. Before instrument calibration, wash blanks are used to verify that the instrument is not contaminated from previous analysis. A mid-level (100 μg/L) standard (INSTCHECK-100-1) is injected to verify the presence and adequate response of peaks for each analyte. The INSTCHECK-100-1 is evaluated immediately after injection so the run can be paused before any more injections if additional instrument cleaning or maintenance is required. A CCB is also analyzed before the calibration curve and denoted as CCBPRE. Making these injections before calibration ensures that instrument conditions have stabilized before any samples that will be used in data analysis are analyzed.
Next, a series of 10 standards ranging in concentration from 1 to 1,000 ng/L is analyzed in ascending order of concentration. After the last calibration standard, another CCB standard (CCBPOST) is analyzed to verify that there is no measurable carryover from the high concentration standard, and a TPC standard, made with solutions sourced separately from the calibration standards, is analyzed. Carryover is rarely, if ever, observed after the 1,000 ng/L standard, and in-house data processing scripts flag any sample results greater than 1,000 ng/L so the analyst can investigate any signs of carryover. As many as three prep batches, each bracketed by a CCB and CCV standard, may be analyzed. At the end of the analytical batch, a series of low-concentration LOQ standards is analyzed to verify that instrument sensitivity has been maintained throughout the course of analysis. The calculated concentration must be between 70 and 130 percent of nominal for CCVs and 50 and 150 percent for LOQs. Each block of environmental samples must be bracketed by satisfactory CCVs; in the case of CCV failure, samples must be reanalyzed or data for affected analytes appropriately qualified. For LOQ failures, reporting levels are adjusted to match the concentration of the lowest-passing LOQ.
Use of Isotope-Dilution Standards
The concentrations of PFAS in this method are determined by IDQ, which is described in Foreman and others (2012) in relation to NWQL’s steroid hormone method. As shown in Foreman and others (2012), IDQ performs better than traditional internal standard quantitation because it uses isotopic analogs of target compounds that more effectively compensate for matrix suppression, incomplete recovery during sample preparation, and other potential issues.
As of the time of this report, this method uses 20 labeled IDS compounds to provide an exact isotopic analog for 20 of the 34 PFAS measured (PFHxS-13C3 and PFOS-13C8, carbon 13-labeled analogs of PFHxS and PFOS, are not considered exact analogs for branched isomers of PFHxS and PFOS). The remaining 14 PFAS are quantified relative to a structurally similar and closely eluting IDS (table 2). Exact analogs of other target compounds may be added to the method as they become commercially available. For example, during the method validation experiments presented in this report, GenX (HFPO-DA) was quantified relative to PFOS-13C8 but since December 2020, GenX has been quantified relative to the newly available HFPO-DA-13C3 (perfluoro-2-propoxy-13C3-propanoate) standard.
In addition to their function as internal standards that improve quantitative accuracy, IDS compounds are used as surrogates to provide an estimate of absolute recovery for each compound through preparation and analysis. To achieve this, the IDS compounds are themselves quantified relative to an IIS; the IIS is not itself quantified, and no IIS data is ever reported. The IIS is another isotopically labeled PFAS (PFPeA-13C3), which is added to samples at the time of vialing and thus is not subject to procedural losses during sample preparation. During method validation, PFPeA-13C3 was not available and PFOS-13C8 was used as the IIS. This was effective but not ideal due to PFOS-13C8’s structural differences from method analytes. The IIS is used only in the calculation of IDS recoveries and as a possible indicator of a failed injection or other major analysis failure.
Quantification, Calculation, and Reporting of Results
Data from each analytical batch is analyzed using vendor-supplied Agilent MassHunter software. Quantitative and qualitative data are exported from MassHunter and further processed using custom-reporting scripts and macros developed by the NWQL, which add qualifying information, check for QC compliance, track analyst consistency, and perform other tasks. Calibration is performed using the peak area of the primary precursor-to-product transition (quantification ion [Q]) normalized to the peak area of Q for the associated IDS. Calibration standards are prepared at 10 different concentrations ranging from 1 to 1,000 ng/L nominal concentration. Some compound concentrations may deviate from the nominal concentration due to the use of salts or mixtures of branched and linear isomers in the commercially acquired mixed standard solutions (table 4). All PFAS are calibrated using a quadratic model with 1/X2 weighting and a minimum acceptable R2 of 0.97. The acceptable R2 is less than that required for some USGS organic methods (for example, Foreman and others, 2012; Furlong and others, 2014; Sandstrom and others, 2015) because this method also requires residuals to meet a ±30 percent tolerance at each calibration level (±50 percent for standards below the method reporting level). If either R2 or residuals fail to meet these tolerance criteria, quantitative results for affected compounds are qualified as estimated (“E” code). An example of a calibration curve from this method is shown in figure 3.
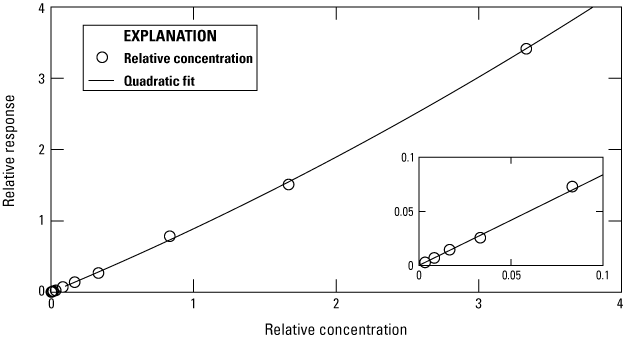
Typical calibration curve for perfluorooctanoate (PFOA) standards (1–1,000 nanograms per liter [ng/L]).
Some target compounds may not be detectable at lower calibration levels, and these low standards may be excluded (disabled) from the calibration model. If standards at or above a compound’s MRL are not detectable, that compound’s reporting level (RL) must be adjusted upwards to the level of the lowest-enabled qualified calibrator. At the analyst’s discretion, when an analyte in a low-level standard does not meet qualification criteria but there is a sufficient signal in the Q ion to reliably integrate the peak, the lowest-enabled calibrator may be included in the calibration. In the method of this report, the lowest-enabled qualified calibrator still determines whether the compound’s MRL should be raised for the entire analytical batch.
Likewise, when high concentration standards distort the fit of the calibration model, one or more standards at the high end of the calibration curve may be excluded from the calculation to meet R2 or residual requirements. If this is done, any environmental samples with concentrations exceeding the highest-enabled qualified calibrator must be diluted and reanalyzed in another batch. If this is not feasible, data exceeding the calibration is qualified with the “E” result-level remark code and assigned an “a” value-qualifier code and comment of “Value extrapolated at high end.” Points may be excluded from the top or bottom end of the calibration only for the reasons given above, and there must always be at least five enabled calibrators. In no circumstance may calibration levels in the middle of the curve be excluded. If calibration curves for many compounds do not meet performance criteria, it is usually best to stop the run before any samples are analyzed, perform instrument maintenance or other corrective action, and then proceed with the analysis using a new set of calibration standards. For this reason, the calibration curves are evaluated immediately after they have been analyzed so that the run can be stopped before the injection of environmental samples and reanalysis can occur within the sample holding time limits.
For samples with results that exceed the highest calibration standard, a replicate tube should be diluted and analyzed in the next instrument batch. The IDQ process precludes the use of the original sample for the dilution because the IDS response includes information on procedural losses that would be lost in the dilution process. The data from the original sample should be reported for any compounds that were not detected outside the calibration range, and data from the diluted sample (appropriately corrected for the dilution factor) should be substituted only for those compounds that were above the calibration range. Results from analyses of diluted samples are given the “d” value-qualifier code (for “dilution”) in NWIS. If dilution using a replicate sample container is not possible, sample concentrations exceeding the highest calibration standard should be qualified with the “E” remark code and the appropriate NWIS value-qualifier code (“a”: value extrapolated at high end).
Final concentrations are reported in nanograms per liter rounded to the following precision:
-
• for concentration values below 1 ng/L, concentrations are reported with one significant digit;
-
• for concentration values from 1 to 10 ng/L, concentrations are reported with two significant digits; and
-
• for concentration values above 10 ng/L, concentrations are reported with three significant digits.
No data should be reported with more than three significant digits. Results for compounds not detected in samples are reported as less than the LRL. When chromatographic interferences or detections in blank QC samples occur, the reporting level may be raised, and nondetections may be reported as less than a raised reporting level. For chromatographic interferences, the interfering peak is integrated as if it is a detection, and the raised reporting level is set at the calculated concentration for that peak. When there are detections in blank QC samples, the raised reporting level is set at the concentration corresponding to three times the average blank response.
Qualitative Determination
PFAS in unknown samples can be positively identified by evaluating mass-to-charge ratio, compound retention times (RTs), qualifier ion ratios (QIRs), SNR, peak-shape metrics, and other qualitative parameters reported by the MassHunter software. The QIR is the ratio of the integrated peak area of Q ion and the qualifying ion (q) for each compound. Expected values of retention times and ion ratios are determined for each analytical batch from values in that batch’s calibration standards. Although MassHunter software and in-house Microsoft Excel scripts may automate and assist in integrating peaks and determining if qualitative identification criteria have been met, the final decision of whether a compound has been identified remains with the analyst.
Retention Times
The acceptance criteria for retention times are set for each batch of samples on the basis of relative retention times (RRTs) of the calibration standards. The RRT is defined as the ratio of the RT of an analyte to the RT of its associated IDS. The default tolerance for RRT variability is set at ±1 percent; if any of the calibration standards deviate by more than the tolerance, the RRT tolerance is increased for that batch only to the lowest integer value (percent) that results in all the calibration standards meeting the criteria.
Qualifier Ion Ratios
The acceptance ranges for QIRs are based on general guidelines published by the European Union (EU) for the identification of veterinary drug residues in food (European Commission, 2002). The EU requirements allow for wider tolerances for higher values of QIR (for example, when the difference in response between Q and q is large), but for this method, all tolerances have been set as ±30 percent of the average QIR for calibration standards within each batch. The 2002 European Commission decision was amended in 2021, and the new requirements (±40 percent) are less restrictive than the requirements of this method (European Commission, 2021). Although these acceptance criteria do not perfectly agree with EU requirements, this method is in line with the EU published literature on PFAS analysis and uses additional qualitative criteria not used in the EU guidelines.
Sometimes the integrations of Q or q peaks by the MassHunter software are performed incorrectly because of noise peaks, dips, or other artifacts, leading to QIR failure, and manual adjustments to the peak integrations might be required. Manual integrations must follow best practices to accurately represent the true peak areas and not be influenced by meeting QC criteria at the expense of correctly representing the peak areas. A useful approach for avoiding unconscious bias is to perform any adjustments to peak integrations before considering if qualitative identification criteria are acceptable, avoiding unwarranted adjustments that bring these criteria into compliance.
Signal-to-Noise Ratios
For each constituent peak, Q and q ions are required to have an SNR greater than 3 for detection in an environmental sample to be reported. In calibration standards, results may be used to calculate calibration curves without meeting the SNR requirement for the q ion if the calculated result for any nonqualified standard meets residual criteria in the resulting curve (±30 percent for concentrations above the MRL and ±50 percent for concentrations below the MRL). When Q is more responsive than q, these nonqualified detections in the calculation can improve the accuracy of the calibration at the low end of the standard curve. This exception applies only to calibration standards with a known concentration and to the inclusion of those responses in the calculation of the calibration curve.
Quality-Assurance and Quality-Control Criteria
General guidelines for acceptance criteria for QC samples, calibration standards, and other QC procedures relevant to the NWQL (as provided in Maloney [2005]) were used for this method. Acceptance criteria (that is, batch QC criteria) for most QC types are based on IDS-adjusted calculated concentrations of target PFAS and set as 100±30 percent standard deviation (SD) of expected concentration (100±50 percent for LOQ standards). These QC types include RWS, CCV, LOQ, and TPC standards. The use of IDQ for the calculation of concentrations generally improves the accuracy and precision of results; however, there can be instances when procedural losses during sample preparation and analysis are substantial and can impede accurate data reporting. Therefore, each IDS is used as both an internal standard for the calculation of concentrations of target PFAS and a surrogate, calibrated relative to the IIS. Calculation of surrogate recovery provides a sample-specific estimate of procedural losses, matrix effects, and so on, for each of the 20 IDS compounds.
There are two related effects of low IDS recovery that must be accounted for: (1) when compounds are detected, the correction factor applied (implicitly) due to low IDS recovery increases, resulting in increased variability in calculated results for target PFAS; and (2) when compounds are not detected, MRL values calculated from fortified samples with higher IDS recovery may overestimate method sensitivity. For that reason, when there is low IDS recovery, results may be censored or qualified, or MRLs may be raised (table 12).
Table 12.
Data qualifiers applied to results at different isotope dilution standard (IDS) recovery ranges for compounds that do and do not have an exact analog IDS.[>, greater than; <, less than; m, compound was identified as highly variable when analyzed by this method; r, sample was ruined in preparation or analysis; x, result failed quality assurance review; E, estimated]
Results from this method are sometimes qualified with remark codes, value-qualifier codes, or comment fields using NWIS water-quality database conventions when QC acceptance criteria are not met or if problems or deviations in workflows could affect the accuracy of the result. A list of value-qualifier codes that may be used in the reporting of results from this method can be found in table 11 of Appendix A of the NWIS user’s manual (Dupré and others, 2013).
Wherever possible, the application of the codes is automated by custom Microsoft Excel scripts that base their actions on analytical results obtained from MassHunter data processing software. Although scripts may be used to aid the analyst to make qualification decisions, the final decision regarding data qualification is made by a trained analyst.
Concentrations of PFAS in each sample are determined using the calibration curves only after an analyst has reviewed the MRM chromatograms and confirmed that the qualitative identification of each analyte is valid. No quantitative results are reported without this qualitative confirmation of a detection. If the qualitative identification criteria (described in the sections of this report titled “Retention Times,” “Qualifier Ion Ratios,” and “Signal-to-Noise Ratios”) and batch QC criteria (described in the section of this report titled “Quality-Assurance and Quality-Control Criteria”) are met, concentration data are reported to the NWQL’s laboratory information management system. Concentrations below the MDL are reported with a result-level remark code of “E” (estimated or having a higher degree of uncertainty) and an appropriate NWIS value-qualifier code to reflect increased uncertainty in the magnitude of the quantitative result (for example, the “b” value was extrapolated at the low end, and the “t” value was extrapolated below the MDL). The “E” remark should not be interpreted to reflect uncertainty in analyte identification. Qualitative identification and quantitation are distinct and separate processes, and all confirmed detections must satisfy the same qualitative identification criteria.
Results and Discussion of Method Validation Experiments
The method validation consisted of a set of experiments designed to determine the performance of PFAS compounds when IDS was adjusted and unadjusted. All reported concentrations for native (unlabeled) compounds have been recovery corrected using IDQ techniques. Because 20 IDS compounds were added to every sample after sample collection, shipment, and storage, but before any laboratory processing, every sample was the equivalent of a spike-recovery experiment for the 20 IDSs.
Validation experiments were designed to determine calibration linearity and response, bias, and variability in different matrices across a continuum of concentration levels; MDLs for each compound using a multiconcentration approach; and stability of samples during refrigerated storage before analysis. The primary goal during method development was to achieve optimal performance primarily for PFOS and PFOA; other compounds were also optimized, but not at the expense of the performance metrics of these two key PFAS. Most included PFAS are anions at neutral pH, and analysis was done exclusively in the negative electrospray acquisition mode. Other PFAS that may be cationic or zwitterionic (possessing both a positive and negative charge on the same molecule) were not included.
Validation data presented in this report are in the form of summary tables and figures that show aggregate performance of replicate analyses to determine bias and variability, method detection levels, and compound stability and maximum holding times. Results of the individual measurements used to generate the summary results presented here are published separately in a USGS data release (Gray and others, 2024).
Evaluation Criteria for Validation Experiments
The evaluation criteria for the validation experiments were that bias must be within 30 percent of the expected value (IDS-adjusted recovery between 70 and 130 percent) and variability less than or equal to 25-percent SD in spikes at a concentration equivalent to a mid-range calibration standard (145 or 516 ng/L). No PFAS were removed from the method for failing to meet these bias and variability requirements. All summary data in this report are tabulated as mean and absolute SD values. Note that absolute SD values of recoveries have units of percent; this does not imply that those values are relative SDs.
For MeFOSA-M and EtFOSA-M, recoveries in reagent water were low and variable (table 13; figs. 1.31 and 1.32 of app. 1), but performance was acceptable in the environmental matrices tested (tables 14–16; figs. 1.31 and 1.32 of app. 1), so those compounds were retained in the method and will likely be reported to customers and NWIS with an estimated remark code (“E”).
Table 13.
Bias and variability of reagent water samples fortified with per- and polyfluoroalkyl substances (PFAS) at eight different concentrations.[The amount fortified for individual compounds at each concentration level equals the nominal concentration times that compound's concentration multiplier. Results are shown in the L1–L8 columns as percent recovery and standard deviation (in parentheses) for seven replicate measurements. Refer to table 2 for compound names. CM, concentration multiplier; L, level; ng/L, nanograms per liter; ND, not determined]
Table 14.
Bias and variability of groundwater samples fortified with per- and polyfluoroalkyl substances (PFAS) at seven different concentrations.[The amount fortified for individual compounds at each concentration level equals the nominal concentration times that compound's concentration multiplier. Results are shown in the L1–L7 columns as percent recovery and standard deviation (in parentheses) for seven replicate measurements. Refer to table 2 for compound names. CM, concentration multiplier; L, level; ng/L, nanograms per liter; ND, not determined]
Table 15.
Bias and variability of surface water samples fortified with per- and polyfluoroalkyl substances (PFAS) at seven different concentrations.[The amount fortified for individual compounds at each concentration level equals the nominal concentration times that compound's concentration multiplier. Results are shown in the L1–L7 columns as percent recovery and standard deviation (in parentheses) for seven replicate measurements. No PFAS were detected in unfortified samples. Refer to table 2 for compound names. CM, concentration multiplier; L, level; ng/L, nanograms per liter; ND, not determined]
Table 16.
Bias and variability of wastewater effluent samples fortified with per- and polyfluoroalkyl substances (PFAS) at seven different concentrations.[The amount fortified for individual compounds at each concentration level equals the nominal concentration times that compound's concentration multiplier. Results are shown in the L1–L7 columns as percent recovery and standard deviation (in parentheses) for seven replicate measurements. Refer to table 2 for compound names. CM, concentration multiplier; L, level; ng/L, nanograms per liter; ND, not determined]
Assessment of Suitability for Direct Injection Liquid Chromatography/Tandem Mass Spectrometry Method
Two compounds underwent initial testing and were not included in the final version of the method. Both N-MeFOSE and N-EtFOSE had only one available MRM transition, and in both compounds the transition represented a very common fragmentation pattern that was not considered sufficiently diagnostic for inclusion in the method. These compounds were only included in the initial development of LC/MS/MS tests and were not tested in validation or other matrix testing. These compounds are reported by other published methods using the same ion transitions deemed unsuitable here. Data users should be aware of the potential risk associated with relying on N-MeFOSE and N-EtFOSE results produced by unit-resolution LC/MS/MS methods; inclusion of such compounds could lead to results affected by misidentification with other compounds that have similar retention times or to bias from an overlapping signal.
An additional five compounds (perfluorotridecanoate [PFTrDA], perfluorotetradecanoate [PFTeDA], N-MeFOSA-M, N-EtFOSA-M, and 11-chloroeicosafluoro-3-oxaundecane-1-sulfonate [11Cl-PF3OUdS]) had poor recovery or variability statistics during early phases of developing this method. Preliminary experiments indicate that this is likely because of a high affinity for container walls and other surfaces or interfaces in a 10 percent methanol, 90 percent water solution. Before the method validation experiments, the solvent composition during centrifugation and sample transfer steps was changed to a higher organic content (50 percent methanol, 50 percent water). Performance was improved significantly, and all five PFAS are included in the final version of the method.
Method Detection Level Determination
The method described in this report uses MDLs to define the sensitivity of analysis of each compound and RLs to provide batch- and sample-specific estimates of minimum reportable concentrations. The procedures for determining these parameters are described below.
Method Detection Level Procedure
The MDL for each compound was determined using the ASTM DQCALC procedure. This is a multiconcentration, spike-based procedure suited to organic methods in which method analytes may have a wide range of response factors. The application of DQCALC at the NWQL, including its advantages and disadvantages compared to other procedures, is discussed in detail by Foreman and others (2021). DQCALC produces a statistically derived estimate of Lc for each compound. The Lc estimates produced by the DQCALC software are designed to minimize false positive results and are used as initial MDL estimates for this method, with LRLs set at twice the MDL (in other words, LRL=2×Lc) to reduce the occurrence of false negatives.
The MDL and LRL values were then compared to batch RLs derived from an evaluation of QC samples analyzed with every analytical batch. Data from 25 batches analyzed on two separate LC/MS/MS instruments for 1 year (June 2020–June 2021) were used. QC samples with concentrations at the ASTM LRL (±30 percent) were required to meet all qualitative identification criteria in at least 50 percent of the batches. If the QC sample did not satisfy this requirement, the calculated LRL was deemed unreasonably low and was adjusted upwards to a level where the requirement was met. Conversely, if qualitative criteria were routinely satisfied at QC concentrations substantially less than the calculated LRL, the LRL was considered unreasonably high and was recalculated using the EPA MDL procedure using the same data if a suitable concentration level was available, and using pooled calibration data if a spiked sample at a suitable concentration was not available.
Method Detection Level Study Design
Replicate reagent water samples were spiked at eight concentrations (typically 2.1, 10.3, 20.7, 51.6, 103, 207, 516, and 1,033 ng/L) and analyzed to determine MDL (table 13). Concentrations of some compounds were somewhat less than nominal due to the actual composition of vendor-supplied multicomponent stock solutions. Seven replicates of each concentration level were analyzed in five analytical batches for 31 days.
Every analytical batch contained either one or two replicate reagent spikes at each concentration level. The five batches were processed by two analysts; one analyst processed two batches and the second analyst processed the other three batches. The purpose of analyzing samples in different batches that were processed by two analysts was to ensure that the statistically calculated MDLs incorporated the types of variability typical for routine analysis in a production laboratory like NWQL (Childress and others, 1999). The validation and MDL determination experiments took place before the acquisition of a second LC/MS/MS system for PFAS, so instrument-to-instrument variability could not be accounted for.
Results of Method Detection Level Determination
Results from DQCALC, batch-specific RLs calculated from QC data for 25 production batches, and the LC 9660 MDL and LRL values are shown in table 3. LC 9660 MDL and LRL were determined from DQCALC unless the batch-specific RLs indicated that the DQCALC values were unrealistic, as described in the section of this report titled “Method Detection Level Procedure.” Percent recoveries for reagent water spikes at all eight concentration levels are summarized in table 13. The five lowest concentration levels with at least six valid detections (in other words, meeting all qualitative criteria) were the only data supplied to the DQCALC software to minimize the calculation of unrealistic results. For 23 of 34 compounds, the 2.1 ng/L concentration level did not have enough valid detections to be used in the calculation of Lc (indicated by “ND” [not determined] in table 13). This was also true for 5 compounds at 10.3 ng/L and 2 compounds at 20.7 ng/L. Thus, five concentration levels were incorporated in all DQCALC MDL calculations, but the specific levels used for each compound varied.
The calculated Lc values ranged from 1.7 to 81.0 ng/L with a median of 8.0 ng/L, corresponding to LRLs ranging from 3.3 to 162 ng/L (median 16.0). It was apparent that some of these values were not always achieved in day-to-day method operation. This is likely because the calculations were based on the response and variability of the Q ion, although meeting qualitative identification criteria depends largely on the behavior of the q ion, which is typically the less responsive of the two ions. Anecdotally, calculated Lc was often too low for compounds with large differences in response between Q and q or for mixtures of branched isomers branched PFHxS (PFHxS-B) and branched PFOS (PFOS-B), which may have different fragmentation patterns, limiting ion ratio repeatability. Furthermore, the 31-day study period may have led to underestimation of instrument variability for longer time periods. For some compounds, batch-specific RLs varied by a factor of as much as 10 for the yearlong period sampled.
Considering these complications, the final MDL was equal to Lc for 24 of the 34 PFAS compounds, greater than the Lc for 8 compounds, and lower for the remaining 2 compounds. Although individual MDLs ranged from 0.3 to 31 times Lc, the effect on the overall distribution of MDLs (0.7–81.0 ng/L, median 8.0) and LRLs was small.
Performance of Isotope-Dilution Standards
The 20 IDS compounds that were used as internal standards for target PFAS were also treated as surrogates, and their recoveries are reported. From time to time, new, labeled PFAS compounds may become commercially available. Because using exact-analog IDS compounds is preferable to using closely related PFAS for IDS, when new, isotopically labeled PFAS become available, they might be verified and implemented in this method without a need for formal revalidation. When a new, exact-analog IDS is added to the method, the results should be calculated using both the old, nonexact analog IDS and the new IDS to verify that recovery and variability are comparable or improved in batch QC that does (for example, RWS and laboratory matrix spikes) or does not (for example, CCVs and LOQs) undergo the sample preparation procedure.
During the Method Validation Study
During method validation, 19 IDS compounds were used, one of which (perfluorooctane sulfonate-13C8 [PFOS-13C8]) was also used as the IIS to estimate surrogate recovery for the other 18 IDS compounds. For that reason, surrogate recovery information for PFOS-13C8, corrected to itself, is calculated as 100 percent for all samples. Effectively, surrogate recovery information is provided only for the other 18 IDS. Table 17 shows a comparison of IDS surrogate recovery in 275 batch QC samples that did not undergo centrifugation and vial transfer steps with 397 prep QC and environmental samples that did undergo those two steps.
Table 17.
Percent recoveries of isotope-dilution standards (IDS), also used as surrogate standards, during method validation.[Summary statistics for all samples, standards, and quality control (QC) standards analyzed during method validation (bias and variability, method detection level (MDL), and holding time studies). Two standards currently (2025) in use for the method were not available at the time of this study. As a result, no data are shown for perfluoro-2-propoxy-13C3-propanoate (HFPO-DA-13C3) and perfluoro-1-[13C8]octanesulfonate (PFOS-13C8). Refer to table 2 for compound names. N, number; ND, not determined; SD, standard deviation; RSD, relative standard deviation; %, percent]
Average IDS recovery was acceptable in all cases, ranging from 83.2 to 105.6 percent in prep QC and environmental samples and from 94.8 to 104.7 percent in batch QC samples. For every compound, the error bars for the two data treatments showed substantial overlap. In both treatments, the SD did not exceed 25 percent of recovery for 17 of 19 compounds, with 4:2 FTS-13C2 (1H,1H,2H,2H-perfluoro-1-[1,2-13C2]hexanesulfonate) and PFTeDA-13C2 (perfluoro-n-[1,2-13C2]tetradecanoate) showing slightly more variability (maximum SD of 33.4 percent of recovery). Variability limits are enforced on analyte results and not on surrogate recoveries.
Current Method Operation
Two new isotopically labeled compounds have been added to the method since the validation study. The new IIS, PFPeA-13C3 (perfluoro-n-[13C3]pentanoate), can be distinguished by the mass spectrometer from the IDS, PFPeA-13C5 (perfluoro-n-[13C5]pentanoate). With this change, PFOS-13C8 is no longer used as an IIS, and its surrogate recovery can be reported. In addition, HFPO-DA-13C3 has been procured, providing one additional compound with an exact analog IDS.
Table 18 shows summaries for samples analyzed after the implementation of the new IIS and IDS compounds (results for 1,010 batch QC samples and 1,536 prep QC and environmental samples are summarized). Mean surrogate recoveries are not demonstrably different from those observed during method validation, ranging from 87.1 percent to 108.7 percent in prep QC and environmental samples and from 92.4 percent to 102.2 percent in batch QC samples. In fact, recovery and variability of some IDS compounds are slightly improved (all SDs less than 20 percent), which is noteworthy because these samples comprise a much wider range of matrix types than the four used during validation. This comparison shows the utility of allowing the addition of new IDS compounds as they become available.
Table 18.
Percent recoveries of isotope-dilution standards (IDS), also used as surrogate standards, from December 15, 2020, to March 2, 2022.[Quantified relative to perfluoro-n-[13C3]pentanoate (PFPeA-13C3) and summary statistics for all samples, standards, and quality control (QC) standards analyzed from December 15, 2020, to March 2, 2022. After December 15, 2020, PFPeA-13C3 was added to the method as the injection internal standard, and perfluoro-2-propoxy-13C3-propanoate (HFPO-DA-13C3) was added as a new IDS for perfluoro-2-propoxypropanoate (HFPO-DA [GenX]) and related compounds. Refer to table 2 for compound names. N, number; SD, standard deviation; RSD, relative standard deviation; ND; not determined; %, percent]
Bias and Variability from Matrix-Spike Recovery Experiments
The performance of the method in different matrices and for a range of concentrations was evaluated in a matrix-spike study. The structure of the experiments in each matrix was very similar to the structure of the MDL experiments. In fact, the data from the MDL determination are from the same sample replicates used in this report for bias and variability of RWSs. The four matrices tested for bias and variability were: RW; GW from a monitoring well at the NWQL; SW from Clear Creek in Golden, Colo.; and secondary WWE from Coralville, Iowa. For the three environmental matrices, there was a need to understand bias and variability at higher concentrations than in RW; therefore, although RW was evaluated at the eight levels listed in the section titled “Method Detection Level Determination” (ranging from nominal concentrations of 2.1 to 1033 ng/L), the environmental water matrices were evaluated at seven levels ranging from 2.1 to 2065 ng/L. The specific nominal concentration levels investigated in GW, SW, and WWE were 2.1, 10.3, 41.3, 145, 516, 1,033, and 2,065 ng/L. For many PFAS, one or both of the two lowest concentration levels fell below the calculated MDL for that compound. In those cases, estimates of the mean and standard deviation of recovery are highlighted in the results presented in tabular format (tables 13–16) and are shown without qualification when the data are presented in graphical form (supplemental figs. 1.1–1.34 of app. 1). On the figures, a horizontal dashed line is plotted at each compound’s MDL to emphasize how precision and accuracy compare above and below the MDL.
Similarly, even when the spiked concentration is above the MDL, the presence of PFAS compounds in the ambient (unspiked) environmental matrices can complicate the calculation of recovery due to the need to subtract the ambient concentration from the spiked concentration. Significant uncertainty is introduced to recovery calculations when the ambient concentration approaches or exceeds the spike concentration for a given PFAS compound. When ambient concentration is greater than the amount spiked, the corresponding results are flagged in tabular format (tables 13–16). If the compound in question was detected in the ambient sample, a vertical dashed line indicating the ambient concentration is shown on supplemental figures (figs. 1.1–1.34 of app. 1). Data may diverge from the plotted one-to-one (1:1) line when concentrations are less than the MDL or less than the mean measured concentration in unspiked samples but are expected to agree at larger concentrations. (In other words, individual data points are expected to fall near the 1:1 line in the upper half of the chart for compounds that are not present in unspiked samples and in the upper-right quadrant for compounds that are present in the unspiked samples.)
The same sample data were used to generate supplemental figures 1.35–1.68 (refer to app. 1), but these charts instead depict concentration variability (that is, SD) relative to measured concentration, and the line representing MDL is vertical. There is no representation of ambient concentration because that factor should primarily affect accuracy and not precision. In these figures, data points should ideally fall below the plotted 25 percent RSD line in the right half of each graph (in other words, above the MDL) although variability may begin to increase at concentrations marginally higher than the MDL.
Reagent Water
The assessment of bias and variability in RW used the same data as the MDL determination. Data for all eight concentration levels are summarized in table 13 (also refer to figs. 1.1–1.68 of app. 1).
At 103 ng/L (spike level L5 in table 13), 31 of 34 compounds demonstrated acceptable bias (88.5 to 105.9 percent recovery) and variability (maximum SD of 20.8 percent recovery). Spike level L5 is at least twice the MDL for 32 of 34 PFAS (MDLs for N-MeFOSA-M and N-EtFOSA-M are 61.5 and 81.0 ng/L, respectively) and avoids the increased variability found closer to the high end of the calibration curve. For most PFAS, variability increases markedly below each compound’s MDL (figs. 1.35A–1.68A of app. 1). For the remaining three compounds, N-MeFOSA-M (figs. 1.31A and 1.65A of app. 1) and N-EtFOSA-M (figs. 1.32A and 1.66A of app. 1) are to always be reported with the “E” remark code to indicate that the results are estimated or have a higher uncertainty. For the third compound, the data from level L5 may not be representative of the overall performance because linear PFOS (PFOS-L) bias and variability statistics appear more in line with the other 31 compounds at other concentration levels (table 13; app. 1, figs. 1.18A and 1.52A). All three of these compounds (N-MeFOSA-M, N-EtFOSA-M, and PFOS-L) have markedly improved performance in the SW, GW, and WWE matrices, which contributes to the decision to retain N-MeFOSA-M and N-EtFOSA-M in the method.
Groundwater
Data for GW are summarized in table 14 and figures 1.1B–1.68B of appendix 1. Three replicates of unfortified GW were analyzed (table 19) with six detections between 2.1 and 14.7 ng/L. Calculated recoveries were adjusted where necessary for PFAS present in the ambient (unspiked) sample, but no ambient PFAS concentrations were high enough to substantially affect the bias and precision calculations at or above 145 ng/L. At a concentration of 145 ng/L (spike level 4, indicated by L4 in table 14), all 34 compounds had acceptable recoveries, which ranged from 83.6 to 101.1 ng/L (median 94.4) percent. Absolute SD ranged from 4.7 to 17.3 ng/L (median 9.8) percent recovery for L4. Performance in GW was markedly better than that observed in RW.
Table 19.
Concentrations of individual per- and polyfluoroalkyl substances (PFAS) measured in ambient replicates of matrices fortified during validation studies.[Table shows values for mean and standard deviation (in parentheses) values of four replicate measurements. All concentrations in nanograms per liter (ng/L). <, less than]
Surface Water
Data for SW are summarized in table 15 and figures 1.1C–1.68C of appendix 1. Three replicates of unspiked SW were analyzed, and because none had detections of PFAS, no ambient correction was necessary to determine recoveries. In spike level four (145 ng/L), indicated by L4 in table 15, all 34 compounds showed acceptable recoveries, ranging from 87.2 to 101.2 (median 94.3) percent. Standard deviation ranged from 4.6 to 20.2 (median 8.2) percent for all PFAS except N-EtFOSA-M, which has a nonexact IDS and an SD of 31.8 percent. It is notable that overall performance in this matrix is better than in RW.
Wastewater Effluent
Data for WWE are summarized in table 16 and figures 1.1D–1.68D of appendix 1. Four replicates of unfortified WWE were analyzed, and 11 compounds were detected at concentrations ranging from 1.8 to 93.3 ng/L. In particular, the amount of compound found in the ambient sample exceeded 30 percent of the fortified concentration for three compounds: PFPeA (93.3 ng/L), PFHxA (perfluorohexanoate, 42.3 ng/L), and PFOA (56.6 ng/L), which could conceivably affect the precision of recovery calculations for the 145 ng/L spike. This did not appear to be the case, as their respective recoveries ±SD were 97.1±15.7, 87.4±10.7, and 114.0±12.1 percent. For spike concentrations less than three times the concentration in the unspiked samples, bias and recovery calculations become less reliable; therefore, method performance in WWE is best characterized at the 145 ng/L level. Overall performance at the 145 ng/L spike concentration was once again better than in RW. Recoveries were in the range of 82.7 to 112.1 percent (median 93.5) and had an SD for 33 of 34 compounds ranging from 6.4 to 23.0 percent (median 11.8), with N-EtFOSA-M (30.3 percent), which has a nonexact IDS, exceeding 25 percent.
Stability Study and Determination of Maximum Holding Time
The stability of the 34 PFAS compounds in water at refrigerated temperature (4 °C) and during frozen storage (−4 °C) was investigated with the purpose of determining the maximum holding time of samples before analysis. With the small (1 mL) sample size and the tendency of PFAS to accumulate at interfaces, the addition of preservation reagents or sample filtration in the field is not feasible. Methanol (approximately 50 percent) is added to samples followed by centrifugation to remove particles, both of which (methanol and centrifugation) most likely inhibit microbial degradation processes. However, these steps do not take place until samples are analyzed, so it is important to understand the effects of storage on PFAS recovery.
Stability Study Design
The stability of PFAS spiked into all four matrices (RW, GW, SW, and secondary WWE) used for the bias and variability studies was investigated over a 90-day period. Including environmental matrices in addition to RW is important because RW represents a simple chemical matrix with minimal opportunity for microbial degradation of compounds. Conversely, matrix components such as dissolved salts and organic matter may enhance physical losses such as sorption to container walls. In short, to understand PFAS stability in environmental samples, it is necessary to test in environmental matrices.
For each matrix, 28 replicate spikes were prepared in 2-mL microcentrifuge tubes and separated into four groups of seven replicates to be analyzed after different holding times. Samples were spiked at a medium-high concentration (413 ng/L nominal) and recovery was assessed at four time intervals. The first set of seven replicates per matrix was processed immediately (t=0), and the remaining 21 replicates were refrigerated and stored at 4 °C until analysis. No centrifugation, addition of IDS solution, or other processing took place until the day each set of replicates was to be analyzed. After the initial set of seven replicates per matrix at t=0 was analyzed, an additional seven replicates were analyzed after 7, 28, and 90 days (t=7, t=28, t=90).
Stability in frozen samples was subsequently investigated over a 90-day period for three of the test matrices; a sufficient volume of the groundwater matrix was not available to complete these tests. Seven replicates each of RW, SW, and WWE were spiked (250 ng/L nominal) and immediately transferred to a freezer, where they were stored for 90 days at −4 °C before analysis. In addition, one unspiked sample of each matrix was analyzed at the beginning (0 days) and end of the 90-day storage period.
Maximum Holding Times
Sandstrom and others (2015) describe two approaches for the calculation of maximum holding times—a statistical calculation specified by the ASTM (ASTM International, 1993), and a practical approach based on the data-quality objectives (DQOs) of the validation experiments. For this report, the goal was to develop a simple rule to specify how long samples can be stored before analysis. Therefore, only the practical approach was applied. A criterion that the lower limit of stability be 70 percent recovery (alternatively, that maximum loss is 30 percent) for all compounds at the maximum holding time was chosen for consistency with the control limits of other method QC parameters (for example, RWS recovery and CCV recovery). For all stability tests discussed in this report, raw (uncentrifuged) samples were stored for a specified amount of time, and centrifugation was done at the time of sample preparation.
Stability Study Results
The results of the refrigerated stability study in RW (table 20), GW (table 21), SW (table 22), and WWE (table 23) are shown in terms of PFAS recovery ±SD. Data from t=7, t=28, and t=90 are not normalized to t=0; rather, the recovery is calculated independently for each sample, and any compound losses are compared to the nominal concentration spiked rather than the measured concentration at t=0. Although there was some variation in PFAS between the four matrices, all compounds in all four matrices had recoveries greater than or equal to 70 percent after 28 days. Likewise, all four matrices had recoveries of individual PFAS compounds less than 70 percent after 90 days. Therefore, there is no need to consider setting different holding times for each matrix or making the holding time for certain matrices shorter than necessary to maintain consistency between samples.
Table 20.
Average percent recovery of reagent water samples fortified with per- and polyfluoroalkyl substances (PFAS; 413 nanograms per liter times concentration multiplier) after different holding times at 4 degrees Celsius shown as mean percent recovery and standard deviation (in parentheses) of seven replicate measurements.[CM, concentration multiplier]
Refer to table 2 for full compound names.
Table 21.
Average percent recovery of groundwater samples fortified with per- and polyfluoroalkyl substances (PFAS; 413 nanograms per liter times concentration multiplier) after different holding times at 4 degrees Celsius shown as mean percent recovery and standard deviation (in parentheses) of seven replicate measurements.[CM, concentration multiplier]
Refer to table 2 for full compound names.
Table 22.
Average percent recovery of surface water samples fortified with per- and polyfluoroalkyl substances (PFAS; 413 nanograms per liter times concentration multiplier) after different holding times at 4 degrees Celsius shown as mean percent recovery and standard deviation (in parentheses) of seven replicate measurements.[CM, concentration multiplier]
Refer to table 2 for full compound names.
Table 23.
Average percent recovery of wastewater effluent samples fortified with per- and polyfluoroalkyl substances (PFAS; 413 nanograms per liter times concentration multiplier) after different holding times at 4 degrees Celsius shown as mean percent recovery and standard deviation (in parentheses) of seven replicate measurements.[CM, concentration multiplier]
Refer to table 2 for full compound names.
At t=0, t=7, and t=28, there was only one instance of an individual PFAS with average compound recovery less than 70 percent (compound loss greater than 30 percent) in any of the four matrices tested (GenX in RW at t=28, 69.5±4.2 percent recovery). This was deemed acceptable because 70 percent is within the RSD, losses are less in the environmental matrices, and GenX loss remains consistent at 28.9±9.9 percent at t=90. Thus, by the practical approach, 28 days of storage before analysis is acceptable for all 34 PFAS in RW, GW, SW, and WWE. In RW (table 20), the compound with the greatest loss after 28 days was GenX (30.5±4.2 percent loss) with 27 of the other 34 compounds having losses of 20 percent or less. Once again, the environmental matrices, which have greater potential for microbial activity, had slightly better results than RW. Lower recovery in RW may be more closely related to compound recovery than to holding time effects, as the bias and variability studies (tables 13–16) clearly indicate poorer performance in the cleaner RW matrix, which also likely has greater opportunity for sorptive losses during storage. For SW (table 22), the lowest average recovery at 28 days was 71.2±4.2 percent for GenX, with no other compounds less than 80.3 percent. For GW (table 21), the lowest average recovery at 28 days was for GenX at 72.8±8.3 percent, with no other compounds less than 80.1 percent. Finally, in WWE (table 23), the lowest average recovery at 28 days was 82.4±3.9 percent for GenX, with no other compounds less than 86.0 percent.
In contrast, at t=90, RW had 8 compounds with average recoveries less than 70 percent and with a minimum of 4.5±1.9 percent; SW had 20 compounds with recoveries less than 70 percent (minimum 11.4±3.1 percent); GW had 27 compounds below 70 percent (minimum 13.3±3.4 percent); and WWE had 13 compounds below 70 percent (minimum 15.3±4.3 percent). For the samples refrigerated for 90 days, the previous trends appeared to reverse, with losses in RW less than in other matrices, suggesting that it may take several weeks for the increased potential for degradation in the more complex matrices to outweigh the higher likelihood of sorptive losses to container walls in RW. After 28 days, RW had the highest recovery of the four matrices for 2 PFAS, third highest for 7 PFAS, and lowest for 25 PFAS. After 90 days, RW had the highest recovery of the four matrices for 19 PFAS, second highest for 10 PFAS, third highest for 2 PFAS, and lowest for 3 PFAS. Many of the failures are in the range of 60–70 percent recovery, but some go far below that. Thus, 28 days is acceptable for all the target PFAS in all four matrices; holding samples 90 days before analysis is too long to achieve acceptable recovery. The maximum holding time for this method has been set to 28 days from the date of sample preparation for samples refrigerated at 4 °C.
For frozen samples, compound stability after 90 days exceeded the refrigerated stability after 28 days (table 24). Once again, the poorest performance was observed for N-MeFOSA-M (78.9±4.5 percent) and N-EtFOSA-M (80.1±4.9 percent) in RW, which still exceeded the minimum limit of 70 percent suggested by Sandstrom and others (2015) and used previously by other NWQL methods. Excluding those two outliers, average compound recoveries were 103.7±7.6 percent (the range for 32 compounds was 91.5–114.6) in RW, 106.1±6.0 percent (with a range of 89.8–115.2) in SW, and 105.5±5.8 percent (with a range of 98.4–115.6) in WWE. Other than PFBA in SW (20.3 percent), the maximum SD of any compound in any matrix was 9.9 percent.
Table 24.
Average ambient-corrected percent recovery of reagent water, surface water, and wastewater effluent samples fortified with per- and polyfluoroalkyl substances (PFAS; 250 nanograms per liter times concentration multiplier) after storage for 90 days at −4 degrees Celsius, shown as mean percent recovery and standard deviation (in parentheses) of seven replicate measurements.[CM, concentration multiplier]
Refer to table 2 for full compound names.
It is possible that the risk of high bias, defined as recovery exceeding 130 percent in individual samples, or false positive results for PFBA, is somewhat higher after frozen storage. PFBA was not detected in unfortified SW before freezing but was observed after 90 days (94.2 ng/L, representing 37.6 percent of the concentration added to fortified samples), and 3 of 7 fortified replicates showed evidence of high bias. High bias was not observed in any RW or WWE samples.
On the basis of these results, an initial maximum holding time for frozen samples has been set at 90 days, and samples are frozen on receipt at the laboratory. Further experiments can help determine if this limit can be extended beyond 90 days and to better understand the sporadic high bias in SW PFBA results to inform any data qualification required for frozen PFBA samples.
Performance of Batch Quality-Control Samples During Custom Analysis Period
Thirty-four analytical batches composed of 99 prep batches containing customer-submitted samples with a variety of sources and sample matrices were analyzed from December 15, 2020, to March 2, 2022. Batch QC, including reagent water (prep) spikes, LMS of customer samples, duplicates of customer samples, and reagent water (prep) blanks, were summarized to understand method performance over a longer time frame than that of the validation study. Results of the individual measurements used to generate the summary results presented here are published separately in a USGS data release (Gray and others, 2024).
Compound recoveries in reagent water (250 ng/L, nominal concentration) were near 100 percent and highly consistent (table 25). Mean recovery in prep spikes ranged from 72.7 to 104.3 percent (median 98.1) with SD not exceeding 15.6 percent for any compound (table 25). Two compounds (N-MeFOSA-M and N-EtFOSA-M) had inconsistent performance in reagent water during the validation study, which persisted throughout the December 15, 2020, to March 2, 2022, time frame. If the results for these two compounds are excluded, the lowest average recovery of the remaining 32 compounds was 91.6 percent, and the largest SD was 11.0 percent.
Table 25.
Percent recovery of per- and polyfluoroalkyl substances (PFAS) in 99 reagent water spike samples analyzed with each analytical batch from December 15, 2020, to March 2, 2022.[n=99 for all compounds listed. SD, standard deviation; perc, percentile; IQR, interquartile range]
Refer to table 2 for full compound names.
In 94 of 99 prep batches, a customer-submitted sample was selected as a matrix spike and fortified with 250 ng/L of PFAS compounds (table 26). These samples show that performance is not substantially affected by ambient concentrations of target compounds and any interferences derived from the sample matrix. Performance was comparable to the reagent water matrix with mean recoveries ranging from 83.0 percent (N-MeFOSA-M) to 106.6 percent (PFBA) and a maximum SD of 16.7 percent (PFBA; median recovery 102.9 percent). For prep and matrix spikes, recoveries of all compounds fell easily within the acceptable range (recovery 70–130 percent, with a maximum acceptable SD of 25 percent).
Table 26.
Percent recovery per- and polyfluoroalkyl substances (PFAS) in 94 matrix spike samples analyzed from December 15, 2020, to March 2, 2022, amended with 250 nanograms per liter (ng/L) nominal PFAS.[Recoveries are corrected for ambient concentrations. N, number; SD, standard deviation; ND, not detected]
Refer to table 2 for full compound names.
Likewise, 93 of 99 prep batches had a customer-submitted sample selected for duplicate analysis (table 27). Duplicate pairs had greater than 99.8 percent agreement, with only four instances of a compound that was detected in one duplicate sample but not the other. Even so, for three of these discrepancies, the results were not inconsistent. Two of these discrepancies occurred for PFOS-L (pair 1: 12.0 ng/L and <14.8 ng/L, pair 2: 14.0 ng/L and <37.0 ng/L) and one was for FOSA (perfluorooctanesulfonamide: 9.6 ng/L, <12.8 ng/L). The remaining discrepancy appears to be that one PFBA replicate was affected by sporadic contamination, as discussed in the section of this report titled “Problematic Compounds” (65.6 ng/L, <5.1 ng/L). The reporting level for this batch would not have been adjusted because this occurred in an environmental sample and not a blank. For PFBA, there is a false positive rate of 0.6 percent (one occurrence out of 93 replicate pairs or 186 measurements). Out of 3,162 paired comparisons (34 compounds compared in 93 duplicate pairs), both duplicates had a detection 9.7 percent of the time, and neither had a detection 90.2 percent of the time. Quantitative agreement between duplicates with detected PFAS was also quite good, with an average relative difference of 11.5 percent (N=306).
Table 27.
Comparison of per- and polyfluoroalkyl substances (PFAS) in 93 pairs of duplicate environmental samples analyzed from December 15, 2020, to March 2, 2022.[n=93 for all compounds listed. ND, not detected; RPD, relative percent deviation; NA, not applicable]
Refer to table 2 for full compound names.
There was a reagent water blank sample analyzed with all 99 prep batches (table 28). Thirty of 34 PFAS were never detected in any of the 99 blanks. PFBA was the most frequently detected compound in blanks (26 detections, 26.3 percent); PFPeA (15 detections), PFOA (12 detections), and PFDA (perfluorodecanoate, 2 detections) were also observed. All the PFPeA detections and 10 of the 12 PFOA detections occurred during a time frame when methanol with likely polyethylene glycol contamination was in use; when this issue was identified, a change was made to a different methanol supplier, and the PFPeA and PFOA contamination is not expected to be present going forward. Neither PFPeA, PFOA, nor PFDA exceeded their MDL in blanks, and no corrective actions were required; PFBA was above its MDL in 8 out of 26 instances. The RL for these batches was raised to 3 times the average blank response, detections between 3 and 10 times the average blank response were qualified with a “v” result-level value-qualifier code to indicate additional potential for bias, and detections at more than 10 times the average blank response were reported without qualification.
Table 28.
Summary of per- and polyfluoroalkyl substances (PFAS) concentrations in 99 laboratory blank samples analyzed from December 15, 2020, to March 2, 2022.[No PFAS were detected in the 31 compounds not listed. All concentrations in nanograms per liter (ng/L). N, number]
Refer to table 2 for full compound names.
Problematic Compounds
The two lowest molecular weight and earliest eluting compounds, PFBA and PFPeA, have only one major precursor-to-product transition, which complicates their positive identification. The QIR is the most important piece of confirmatory information for compound qualification, aside from perhaps retention time. Calculation of QIR requires two distinct MRM transitions. Each of these compounds has additional characteristics that make positive identification more difficult, lead to a higher incidence of raised RLs, and may lead to a high prevalence of false positive results. PFBA and PFPeA results produced using unit-resolution LC/MS/MS by NWQL or any other laboratory should be scrutinized, including a detailed assessment of laboratory blank data.
To facilitate recovery of high molecular weight, nonpolar PFAS, samples were brought to a composition of approximately 50 percent methanol in water before centrifugation and vial transfer steps. Injecting samples in solvent with higher organic content than the initial HPLC gradient (5 percent methanol) causes broadening of the PFBA peak and makes RT less reproducible. Thus, RRT becomes less reliable as a diagnostic criterion than it is for other compounds. However, an injection-solvent composition more amenable to PFBA analysis has negative effects on the performance of late-eluting compounds. The use of 50 percent methanol in the injection solvent is consistent with other PFAS methods and is a tradeoff that was deemed worthwhile to improve the performance of several other target compounds. Finally, early in development, PFBA appeared to be pervasive in blanks. The contaminant peak had the same MRM transition (213.0 to 169.0) and similar RT to PFBA, but the lack of a confirmatory ion or reproducible RT means this identification is not definitive. The source of this contamination was found to be in the disposable polypropylene pipette tips used in standard and sample preparation and was mitigated by drawing and dispensing methanol through the pipette tips before contact with samples, standards, or other solutions (Kolpin and others, 2021).
PFPeA is affected by the same chromatographic artifacts as PFBA, but because it elutes later in the chromatogram, those effects are less pronounced. Peak broadening is noticeable but does not occur to the same extent as for PFBA, and the RT of PFPeA is more consistent than that of PFBA. There is also an issue of a known contaminant that shares PFPeA’s single MRM transition (263.0 to 19.0). For PFPeA, the contaminant was determined to be a polyethylene glycol component present in some lots of LC/MS-grade methanol but thus far not observed in the HPLC-grade methanol now used for mobile phase and sample preparation. As the source of contamination is from one of the mobile phase solvents rather than an injection, this presents as an elevated MRM baseline rather than a resolved chromatographic peak. This problem was resolved by acquiring methanol for the mobile phase solvent from an alternative source.
Finally, as previously mentioned, some of the higher molecular weight PFAS require a high organic composition in the solvent used during centrifugation and vial transfer steps to prevent adsorption to sample container walls and other interfaces. Although a composition of 50 percent is targeted, in any given sample the composition can range from 45–55 percent due to variability in the volume of the sample submitted to the laboratory. As a result, any excess volume in overfilled centrifuge tubes cannot simply be decanted at the beginning of the analysis. The less polar PFAS compounds are preferentially bound to the walls of the centrifuge tube, and if the excess volume is decanted, they are left behind, only to be desorbed when methanol is added to the samples. This produces a positive bias in sample results for samples that have been decanted.
To address this, an alternative preparation procedure has been developed for overfilled centrifuge tubes. Rather than decanting excess water from the sample, 107 μL of IDS is added to the sample, the sample is mixed using a Vortex mixer, and the entire sample volume is transferred to a larger (5 mL) centrifuge tube. The original centrifuge tube is then washed twice into the larger tube with a known volume of methanol. Once the original centrifuge tube has been rinsed and the 5 mL tube brought to the proper concentration of methanol using the rinsate, an aliquot of the resulting solution is returned to the original 2-mL tube, and the analysis proceeds as normal. Although this mitigates the bias associated with PFAS sorption to container walls, it is labor-intensive and adds to the cost of analysis.
Summary and Conclusions
An isotope-dilution liquid chromatography/tandem mass spectrometry (LC/MS/MS) method with direct injection of matrix-modified water samples was developed for the determination of 34 per- and polyfluoroalkyl substances (PFAS), including two pairs of branched and linear isomers, in centrifuge supernatant from a variety of water types. The method has been formally validated in reagent water, surface water, groundwater, and wastewater effluent; other water types, including drinking water, sediment pore water, and landfill leachates, have also been tested. The use of isotopically labeled analogs as isotope-dilution standards and surrogate standards allowed for the correction of recovery losses and the assessment of method performance in every sample. This gives some degree of confidence that the method can be applied reliably to previously untested water matrices. Specifically for more complex sample matrices, the concurrent use of isotope-dilution standards compounds as surrogate standards will indicate that there are performance issues so that data can be appropriately qualified or censored.
This method provides several advantages over previously published methods for the determination of PFAS in water, and these advantages can be beneficial to the National Water Quality Laboratory and its customers. Sample collection and preparation are greatly simplified and streamlined. Samples are collected directly into microcentrifuge tubes that are used in the first steps of laboratory analysis. This has two benefits: (1) the need for a sample transfer with the potential for procedural losses and the introduction of bias to results is eliminated, and (2) it facilitates the use of centrifugation for particle removal instead of filtration, eliminating another step with a high probability of introducing procedural bias. Also, the use of the newest generation in LC/MS/MS instrumentation achieves method detection levels (MDLs) comparable with other published methods without resorting to solid-phase extraction or other means of sample preconcentration. This eliminates another step with potential introduction of bias, but perhaps more importantly, it greatly reduces the cost of analysis, sample storage, and sample shipping as only 1 milliliter of sample is required compared to 250 milliliters or more in other PFAS analyses.
The instrumental method was developed for a selection of 34 PFAS compounds, most of which are negatively charged at circumneutral pH and therefore amenable to ionization in negative electrospray mode. These PFAS were selected on the basis of a combination of scientific and regulatory interest, commercial availability of authentic standards and isotopically labeled compounds, and compatibility for concurrent analysis by LC/MS/MS. Ionization and fragmentation conditions were optimized for the most abundant precursor ion.
Reagent water MDLs, ranging from 0.7 to 81 (median 8.0) nanograms per liter, were set at Currie’s critical level and adjusted if the qualitative identification of compounds at Currie’s critical level was inconsistent from analytical batch to batch. Two compounds of regulatory and scientific interest, perfluorooctane sulfonate (PFOS) and perfluorooctanoate (PFOA), had MDLs of 7.2 and 2.6 nanograms per liter, respectively. These MDLs are low enough to be useful in the regulatory context and comparable to existing methods with more extensive sample preparation requirements.
Mean recoveries of most analytes were within DQOs of 100±30 percent in all matrices at spike concentrations equal to or greater than each compound’s MDL. Two compounds, N-MeFOSA-M (N-methylperfluorooctanesulfonamide) and N-EtFOSA-M (N-ethylperfluorooctanesulfonamide), are reported to the National Water Information System with the “E” remark code to indicate that results have higher uncertainty due to validation performance outside of those limits. Although isotope-dilution quantification enhances the ability to meet these DQOs, in the four matrices tested, most isotope-dilution standards fall within those limits when recovery data are reported as surrogate compounds. The spiked sample recoveries in three environmental matrices tested during the validation study were at least comparable to, and often better than, corresponding results in laboratory reagent water. Of 36 compounds originally considered for inclusion in this method, 34 had adequate performance characteristics for inclusion in the final method. Additional, related PFAS compounds are already being considered for addition in an update to this method.
Studies of stability using refrigeration and frozen storage were done in all four matrices used for the evaluation of bias and recovery during method validation, as opposed to only in reagent water. Much like the validation results, the environmental matrices of surface water, groundwater, and wastewater effluent met or exceeded the stability observed in reagent water. On the basis of the results of these studies, it was determined that 28 days in refrigerated storage (4 degrees Celsius) before analysis does not result in excessive loss in recovery, but 90 days of refrigerated storage does. Thus, a maximum holding time of 28 days is indicated.
References Cited
Ahrens, L., 2011, Polyfluoroalkyl compounds in the aquatic environment—A review of their occurrence and fate: Journal of Environmental Monitoring, v. 13, no. 1, p. 20–31, accessed December 15, 2024, at https://doi.org/10.1039/C0EM00373E.
Arp, H.P.H., and Goss, K.-U., 2009, Gas/particle partitioning behavior of perfluorocarboxylic acids with terrestrial aerosols: Environmental Science & Technology, v. 43, no. 22, p. 8542–8547, accessed December 15, 2024, at https://doi.org/10.1021/es901864s.
ASTM International, 2010, Standard practice for performing detection and quantitation estimation and data assessment utilizing DQCALC software, based on ASTM Practices D6091 and D6512 of Committee D19 on Water (Withdrawn 2025): West Conshohocken, Pa., ASTM International ASTM D7510-10(2016)e, 17 p., accessed August 10, 2022, at https://www.astm.org/d7510-10r16e01.html.
ASTM International, 2013, Standard practice for determination of the 99%/95% critical level (WCL) and a reliable detection estimate (WDE) based on within-laboratory data (Withdrawn 2022): West Conshohocken, Pa., ASTM International, ASTM D7782-13, 14 p., accessed December 15, 2024, at https://doi.org/10.1520/D7782-13.
Backe, W.J., and Field, J.A., 2012, Is SPE necessary for environmental analysis? A quantitative comparison of matrix effects from large-volume injection and solid-phase extraction based methods: Environmental Science & Technology, v. 46, no. 12, p. 6750–6758, accessed December 15, 2024, at https://doi.org/10.1021/es300235z.
Buck, R.C., Franklin, J., Dr., Berger, U., Conder, J.M., Cousins, I.T., de Voogt, P., Jensen, A.A., Kannan, K., Mabury, S.A., and van Leeuwen, S.P.J., 2011, Perfluoroalkyl and polyfluoroalkyl substances in the environment—Terminology, classification, and origins: Integrated Environmental Assessment and Management, v. 7, no. 4, p. 513–541, accessed December 15, 2024, at https://doi.org/10.1002/ieam.258.
Chandramouli, B., Benskin, J.P., Hamilton, M.C., and Cosgrove, J.R., 2015, Sorption of per- and polyfluoroalkyl substances (PFASs) on filter media—Implications for phase partitioning studies: Environmental Toxicology and Chemistry, v. 34, no. 1, p. 30–36, accessed December 15, 2024, at https://doi.org/10.1002/etc.2751.
Childress, C.J.O., Foreman, W.T., Connor, B.F., and Maloney, T.J., 1999, New reporting procedures based on long-term method detection levels and some considerations for interpretations of water-quality data provided by the U.S. Geological Survey National Water Quality Laboratory: U.S. Geological Survey Open-File Report 99–193, 19 p., accessed December 15, 2024, at https://doi.org/10.3133/ofr99193.
Dupré, D.H., Scott, J.C., Clark, M.L., Canova, M.G., and Stoker, Y.E., 2013, User’s manual for the National Water Information System of the U.S. Geological Survey—Water-Quality System, version 5.0: U.S. Geological Survey Open-File Report 2013–1054, 730 p., accessed December 15, 2024, at https://pubs.usgs.gov/of/2013/1054/. [Supersedes Open-File Report 2006–1145.]
European Commission, 2002, Commission Decision 2002/657/EC implementing Council Directive 96/23/EC concerning the performance of analytical methods and the interpretation of results: Official Journal of the European Communities, v. L221, p. 8–36. [Also available at https://eur-lex.europa.eu/eli/dec/2002/657/oj.]
European Commission, 2021, Commission Decision 2021/808/EC on the performance of analytical methods for residues of pharmacologically active substances used in food-producing animals and on the interpretation of results as well as on the methods to be used for sampling and repealing Decisions 2002/657/EC and 98/179/EC: Official Journal of the European Communities, v. L184, p. 84–109. [Also available at https://eur-lex.europa.eu/legal-content/EN/TXT/?uri=OJ:L:2021:180:TOC.]
Foreman, W.T., Gray, J.L., ReVello, R.C., Lindley, C.E., Losche, S.A., and Barber, L.B., 2012, Determination of steroid hormones and related compounds in filtered and unfiltered water by solid-phase extraction, derivatization, and gas chromatography with tandem mass spectrometry: U.S. Geological Survey Techniques and Methods, book 5, chap. B9, 118 p., accessed December 15, 2024, at https://doi.org/10.3133/tm5B9.
Foreman, W.T., Williams, T.L., Furlong, E.T., Hemmerle, D.M., Stetson, S.J., Jha, V.K., Noriega, M.C., Decess, J.A., Reed-Parker, C., and Sandstrom, M.W., 2021, Comparison of detection limits estimated using single- and multi-concentration spike-based and blank-based procedures: Talanta, vol. 228, art. 122139, 15 p., accessed December 15, 2024, at https://doi.org/10.1016/j.talanta.2021.122139.
Furlong, E.T., Noriega, M.C., Kanagy, C.J., Kanagy, L.K., Coffey, L.J., and Burkhardt, M.R., 2014, Determination of human-use pharmaceuticals in filtered water by direct aqueous injection-high-performance liquid chromatography/tandem mass spectrometry: U.S. Geological Survey Techniques and Methods, book 5, chap. B10, 49 p., accessed December 15, 2024, at https://doi.org/10.3133/tm5B10.
Gray, J.L., Kanagy, L.K., Kanagy, C.J., and Anderson, C.A., 2024, Concentrations of per- and polyfluoroalkyl substances (PFAS) from validation experiments and custom sample analysis by U.S. Geological Survey (USGS) National Water Quality Laboratory (NWQL) Laboratory Code 9660, December 2020 to March 2022: U.S. Geological Survey data release, https://doi.org/10.5066/P9P3YPXG.
Hu, X.C., Andrews, D.Q., Lindstrom, A.B., Bruton, T.A., Schaider, L.A., Grandjean, P., Lohmann, R., Carignan, C.C., Blum, A., Balan, S.A., Higgins, C.P., and Sunderland, E.M., 2016, Detection of poly- and perfluoroalkyl substances (PFASs) in U.S. drinking water linked to industrial sites, military fire training areas, and wastewater treatment plants: Environmental Science & Technology Letters, v. 3, no. 10, p. 344–350, accessed December 15, 2024, at https://doi.org/10.1021/acs.estlett.6b00260.
Interstate Technology Regulatory Council, 2020, History and use of per- and polyfluoroalkyl substances (PFAS): Washington, D.C., Interstate Technology Regulatory Council Fact Sheet, 4 p., accessed April 3, 2025, at https://pfas-1.itrcweb.org/wp-content/uploads/2023/10/PFAS_Regs-Fact-Sheet-Sept2023_final.pdf.
Kolpin, D.W., Hubbard, L.E., Cwiertny, D.M., Meppelink, S.M., Thompson, D.A., and Gray, J.L., 2021, A comprehensive statewide spatiotemporal stream assessment of per- and polyfluoralkyl substances (PFAS) in an agricultural region of the United States: Environmental Science & Technology Letters, v. 8, no. 11, p. 981–988, accessed December 15, 2024, at https://doi.org/10.1021/acs.estlett.1c00750.
Leeuwen, S.P.J., van, Swart, C.P., van der Veen, I., and de Boer, J., 2009, Significant improvements in the analysis of perfluorinated compounds in water and fish—Results from an interlaboratory method evaluation study: Journal of Chromatography A, v. 1216, no. 3, p. 401–409, accessed December 15, 2024, https://doi.org/10.1016/j.chroma.2008.11.029.
Maloney, T.J., ed., 2005, Quality management system, U.S. Geological Survey National Water Quality Laboratory (ver. 1.3, November 2005): U.S. Geological Survey Open-File Report 2005–1263, variously paged. [Also available at https://doi.org/10.3133/ofr20051263.]
Martin, J.W., Kannan, K., Berger, U., De Voogt, P., Field, J., Franklin, J., Giesy, J.P., Harner, T., Muir, D.C.G., Scott, B., Kaiser, M., Järnberg, U., Jones, K.C., Mabury, S.A., Schroeder, H., Simcik, M., Sottani, C., Van Bavel, B., Kärrman, A., Lindström, G., and Van Leeuwen, S., 2004, Analytical challenges hamper perfluoroalkyl research: Environmental Science & Technology, v. 38, no. 13, p. 248A–255A, accessed December 15, 2024, at https://doi.org/10.1021/es0405528.
Minnesota Department of Health, 2022, Per- and polyfluoroalkyl substances in private wells: Minnesota Department of Health website, accessed June 28, 2023, at https://www.health.state.mn.us/communities/environment/water/wells/waterquality/pfas.html.
Moe, M.K., Huber, S., Svenson, J., Hagenaars, A., Pabon, M., Trümper, M., Berger, U., Knapen, D., and Herzke, D., 2012, The structure of the fire fighting foam surfactant Forafac®1157 and its biological and photolytic transformation products: Chemosphere, v. 89, no. 7, p. 869–875, accessed December 15, 2024, at https://doi.org/10.1016/j.chemosphere.2012.05.012.
Moody, C.A., and Field, J.A., 1999, Determination of perfluorocarboxylates in groundwater impacted by fire-fighting activity: Environmental Science & Technology, v. 33, no. 16, p. 2800–2806, accessed December 15, 2024, at https://doi.org/10.1021/es981355.
Rodowa, A.E., Christie, E., Peaslee, G.F., Bogdan, D., Digiuseppi, B., and Field, J.A., 2020, Field sampling materials unlikely source of contamination for perfluoroalkyl and polyfluoroalkyl substances in field samples: Environmental Science & Technology Letters, v. 7, no. 3, p. 156–163, accessed December 15, 2024, at https://doi.org/10.1021/acs.estlett.0c00036.
Sandstrom, M.W., Kanagy, L.K., Anderson, C.A., and Kanagy, C.J., 2015, Determination of pesticides and pesticide degradates in filtered water by direct aqueous-injection liquid chromatography-tandem mass spectrometry: U.S. Geological Survey Techniques and Methods, book 5, chap. B11, 54 p., accessed December 15, 2024, at http://doi.org/10.3133/tm5B11.
Schultz, M.M., Barofsky, D.F., and Field, J.A., 2006, Quantitative determination of fluorinated alkyl substances by large-volume-injection liquid chromatography tandem mass spectrometry—Characterization of municipal wastewaters: Environmental Science & Technology, v. 40, no. 1, p. 289–295, accessed December 15, 2024, at https://doi.org/10.1021/es051381p.
Shoemaker, J.A., and Tettenhorst, D.R., 2018, Method 537.1—Determination of selected per- and polyfluorinated alkyl substances in drinking water by solid phase extraction and liquid chromatography/tandem mass spectrometry (LC/MS/MS): Washington, D.C., U.S. Environmental Protection Agency, Office of Research and Development, National Center for Environmental Assessment, EPA/600/R-18/352, 50 p. [Also available at https://cfpub.epa.gov/si/si_public_record_report.cfm?dirEntryId=343042&Lab=NERL.]
Taniyasu, S., Kannan, K., Man, K.S., Gulkowska, A., Sinclair, E., Okazawa, T., and Yamashita, N., 2005, Analysis of fluorotelomer alcohols, fluorotelomer acids, and short- and long-chain perfluorinated acids in water and biota: Journal of Chromatography A, v. 1093, no. 1–2, p. 89–97, accessed December 15, 2024, at https://doi.org/10.1016/j.chroma.2005.07.053.
Tokranov, A.K., Bradley, P.M., Focazio, M.J., Kent, D.B., LeBlanc, D.R., McCoy, J.W., Smalling, K.L., Steevens, J.A., and Toccalino, P.L., 2021, Integrated science for the study of perfluoroalkyl and polyfluoroalkyl substances (PFAS) in the environment—A strategic science vision for the U.S. Geological Survey: U.S. Geological Survey Circular 1490, 50 p., accessed May 27, 2025, at https://doi.org/10.3133/cir1490.
U.S. Environmental Protection Agency [EPA], 2016a, Drinking water health advisory for perfluorooctane sulfonate (PFOS): Washington, D.C., U.S. Environmental Protection Agency, Office of Water, Health and Ecological Criteria Division, EPA/822/R-16/004, 88 p., accessed December 15, 2024, at https://www.epa.gov/sites/production/files/2016-05/documents/pfos_health_advisory_final_508.pdf.
U.S. Environmental Protection Agency [EPA], 2016b, Drinking water health advisory for perfluorooctanoic acid (PFOA): Washington, D.C., U.S. Environmental Protection Agency, Office of Water, Health and Ecological Criteria Division, EPA/822/R-16/005, 103 p., accessed December 15, 2024, at https://www.epa.gov/sites/default/files/2016-05/documents/pfoa_health_advisory_final_508.pdf.
U.S. Environmental Protection Agency [EPA], 2017, Clean Water Act methods update rule for the analysis of effluent, appendix B to part 136—Definition and procedure for the determination of the method detection limit—Revision 2: Federal Register, p. 40939–40941, accessed May 27, 2025, at https://www.govinfo.gov/content/pkg/FR-2017-08-28/pdf/2017-17271.pdf#page=104.
U.S. Environmental Protection Agency [EPA], 2021, Method 1633—Analysis of per- and polyfluoroalkyl substances (PFAS) in aqueous, solid, biosolids, and tissue samples by LC/MS/MS: Washington, D.C., U.S. Environmental Protection Agency, Office of Water, Engineering and Analysis Division, EPA/821/D-21/001.
U.S. Environmental Protection Agency [EPA], 2022, Lifetime drinking water health advisories for four perfluoroalkyl substances: Federal Register, v. 87, no. 118, p. 36848–36849, accessed May 27, 2025, at https://www.federalregister.gov/documents/2022/06/21/2022-13158/lifetime-drinking-water-health-advisories-for-four-perfluoroalkyl-substances.
Weber, A.K., Barber, L.B., LeBlanc, D.R., Sunderland, E.M., and Vecitis, C.D., 2017, Geochemical and hydrologic factors controlling subsurface transport of poly- and perfluoroalkyl substances—Cape Cod, Massachusetts: Environmental Science & Technology, v. 51, no. 8, p. 4269–4279, accessed December 15, 2024, at https://doi.org/10.1021/acs.est.6b05573.
Woudneh, M.B., Chandramouli, B., Hamilton, C., and Grace, R., 2019, Effect of sample storage on the quantitative determination of 29 PFAS—Observation of analyte interconversions during storage: Environmental Science & Technology, v. 53, no. 21, p. 12576–12585, accessed January 27, 2025, at https://doi.org/10.1021/acs.est.9b03859.
Yamashita, N., Kannan, K., Taniyasu, S., Horii, Y., Okazawa, T., Petrick, G., and Gamo, T., 2004, Analysis of perfluorinated acids at parts-per-quadrillion levels in seawater using liquid chromatography-tandem mass spectrometry: Environmental Science & Technology, v. 38, no. 21, p. 5522–5528, accessed December 15, 2024, at https://doi.org/10.1021/es0492541.
Zareitalabad, P., Siemens, J., Hamer, M., and Amelung, W., 2013, Perfluorooctanoic acid (PFOA) and perfluorooctanesulfonic acid (PFOS) in surface waters, sediments, soils and wastewater—A review on concentrations and distribution coefficients: Chemosphere, v. 91, no. 6, p. 725–732, accessed December 15, 2024, at https://doi.org/10.1016/j.chemosphere.2013.02.024.
Appendix 1. Supplemental Figures
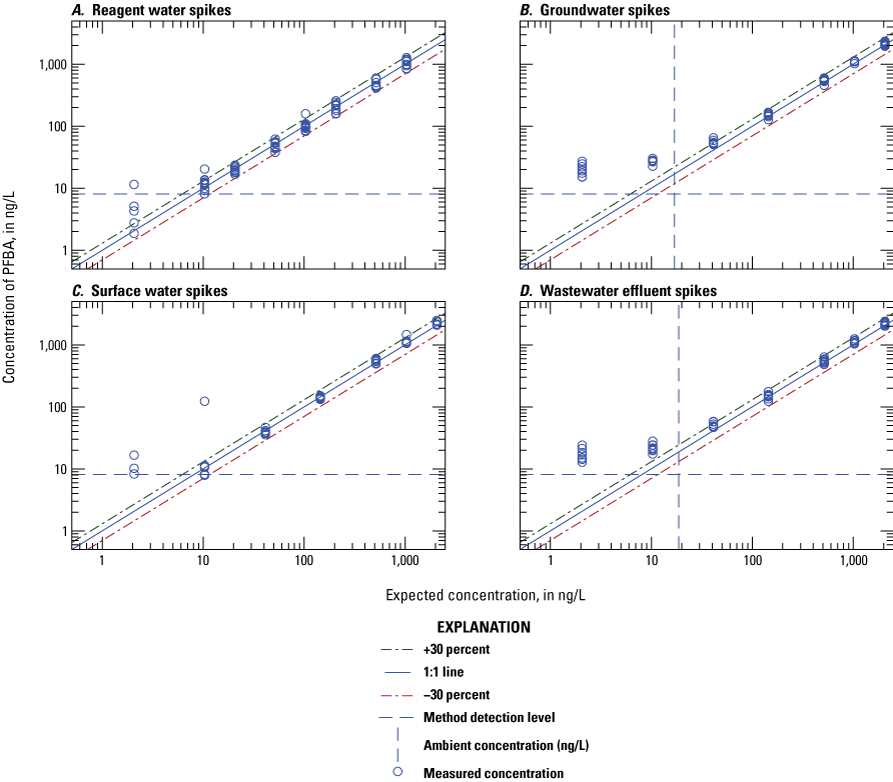
Graphs comparing the measured concentration to amount spiked for perfluorobutanoate (PFBA) in A, reagent water; B, groundwater; C, surface water; and D, wastewater effluent. (ng/L, nanograms per liter)
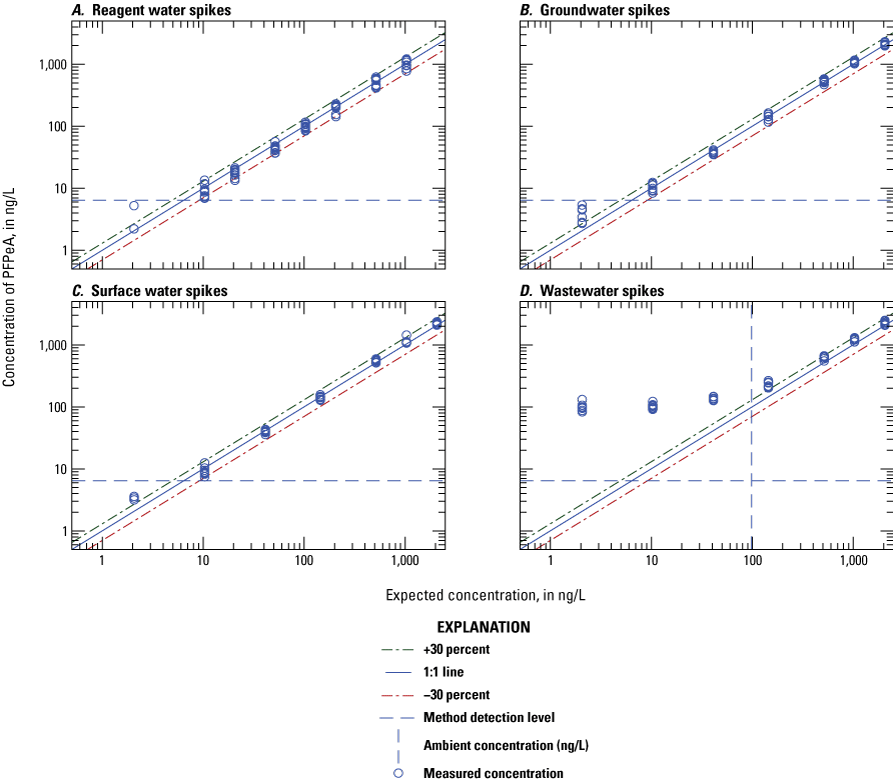
Graphs comparing the measured concentration to amount spiked for perfluoropentanoate (PFPeA) in A, reagent water; B, groundwater; C, surface water; and D, wastewater effluent. (ng/L, nanograms per liter)
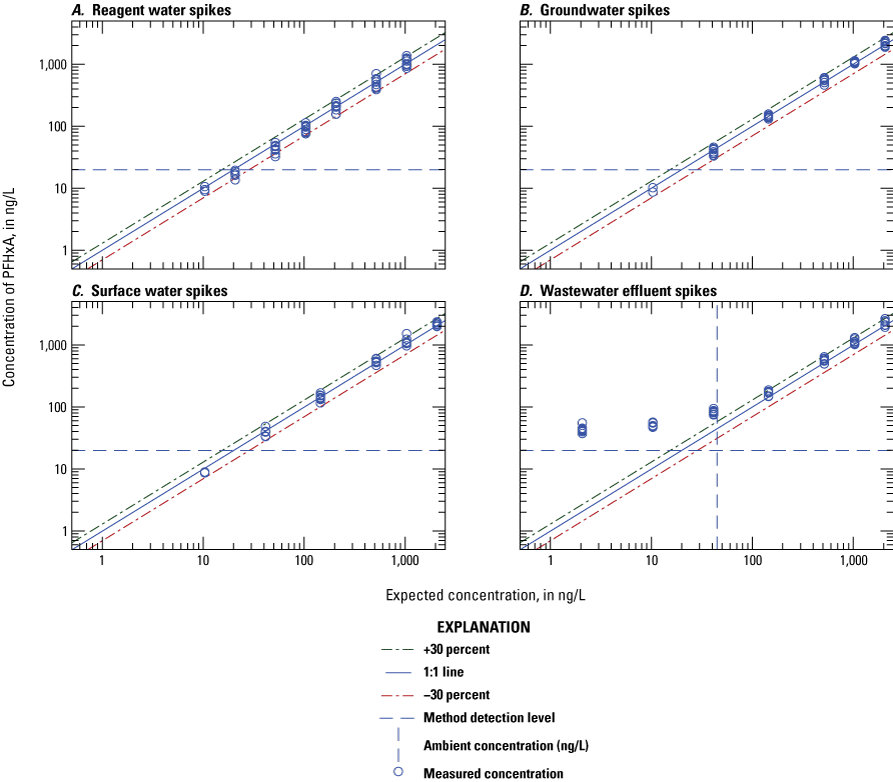
Graphs comparing the measured concentration to amount spiked for perfluorohexanoate (PFHxA) in A, reagent water; B, groundwater; C, surface water; and D, wastewater effluent. (ng/L, nanograms per liter)
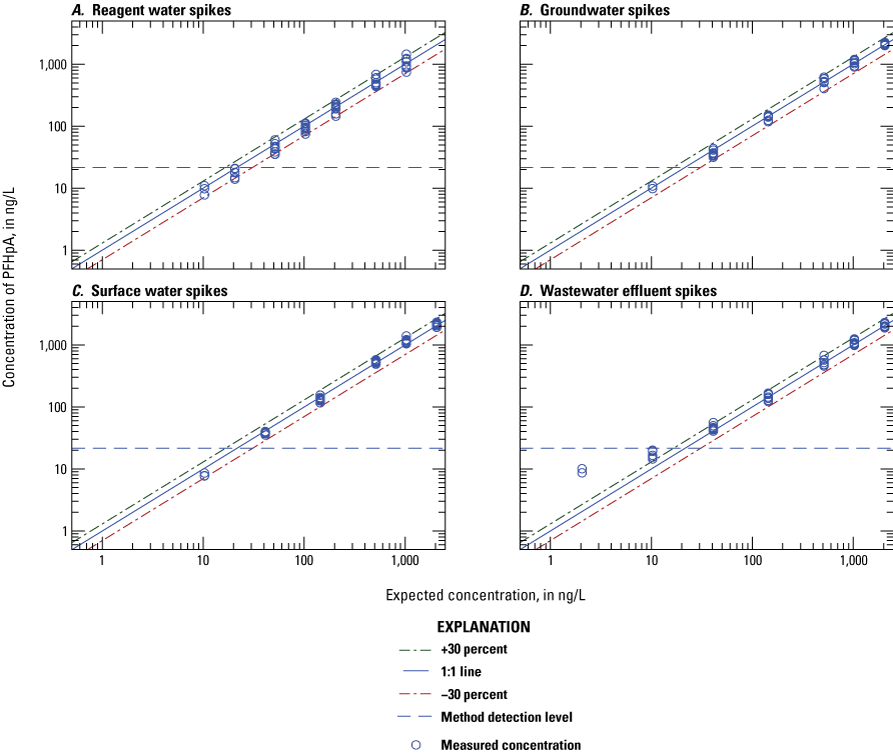
Graphs comparing the measured concentration to amount spiked for perfluoroheptanoate (PFHpA) in A, reagent water; B, groundwater; C, surface water; and D, wastewater effluent. (ng/L, nanograms per liter)
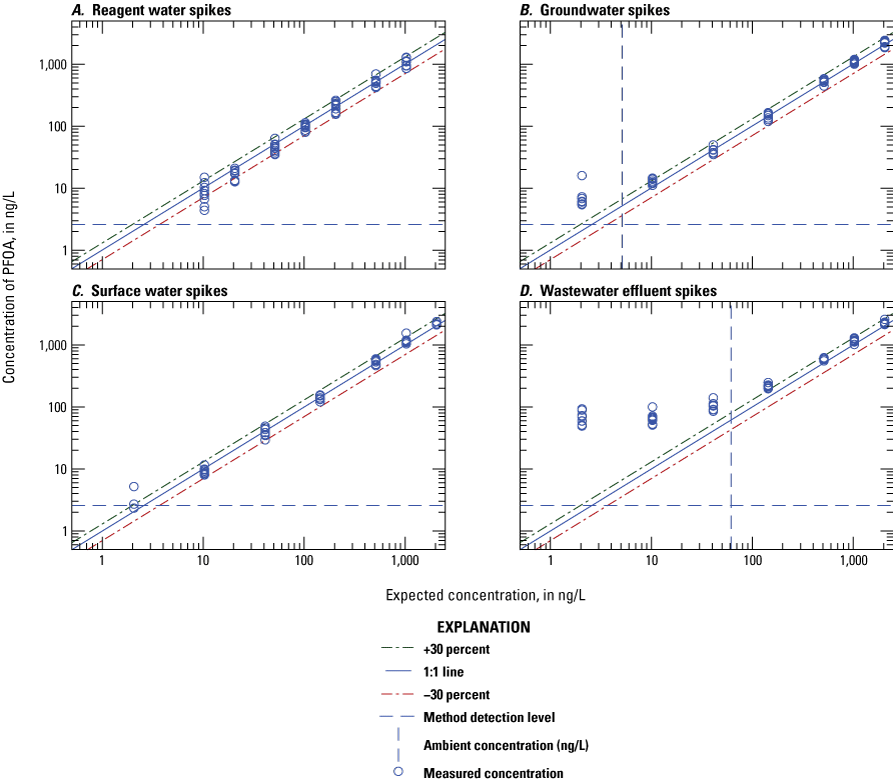
Graphs comparing the measured concentration to amount spiked for perfluorooctanoate (PFOA) in A, reagent water; B, groundwater; C, surface water; and D, wastewater effluent. (ng/L, nanograms per liter)

Graphs comparing the measured concentration to amount spiked for perfluorononanoate (PFNA) in A, reagent water; B, groundwater; C, surface water; and D, wastewater effluent. (ng/L, nanograms per liter)

Graphs comparing the measured concentration to amount spiked for perfluorodecanoate (PFDA) in A, reagent water; B, groundwater; C, surface water; and D, wastewater effluent. (ng/L, nanograms per liter)
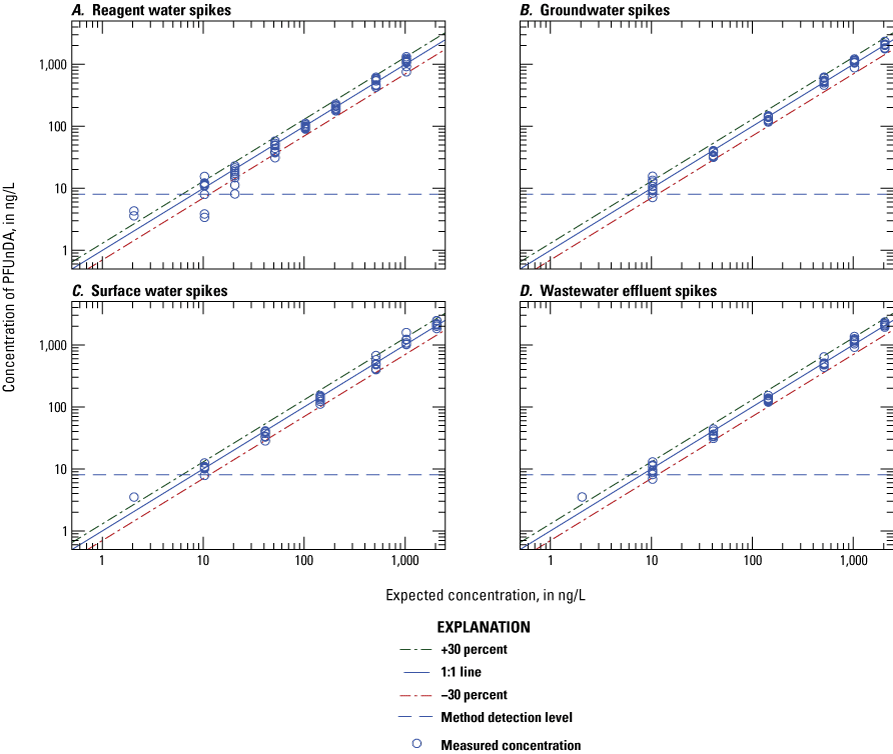
Graphs comparing the measured concentration to amount spiked for perfluoroundecanoate (PFUnDA) in A, reagent water; B, groundwater; C, surface water; and D, wastewater effluent. (ng/L, nanograms per liter)
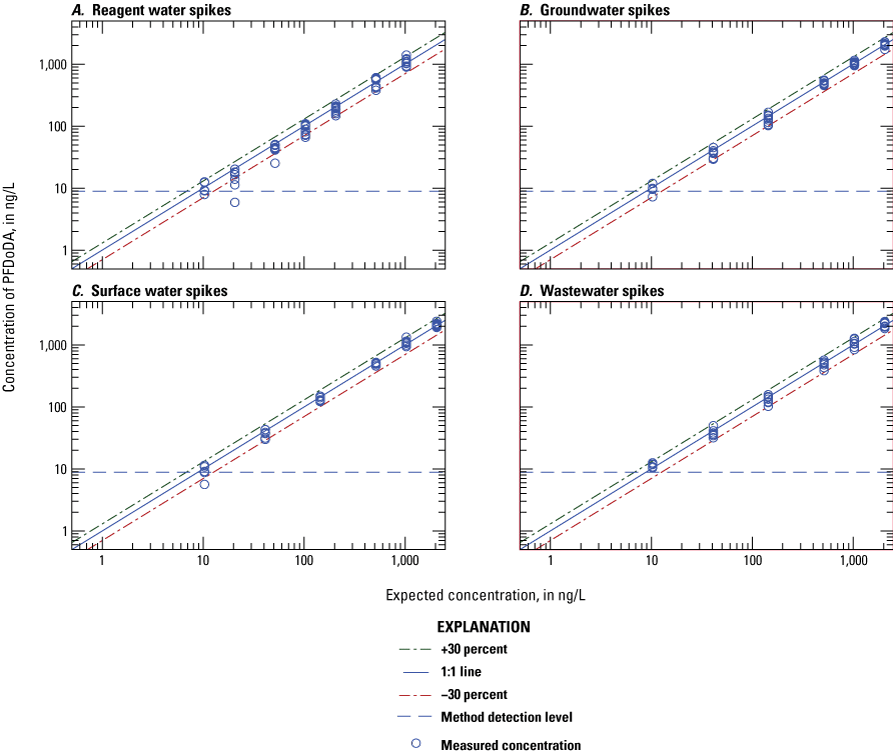
Graphs comparing the measured concentration to amount spiked for perfluorododecanoate (PFDoDA) in A, reagent water; B, groundwater; C, surface water; and D, wastewater effluent. (ng/L, nanograms per liter)
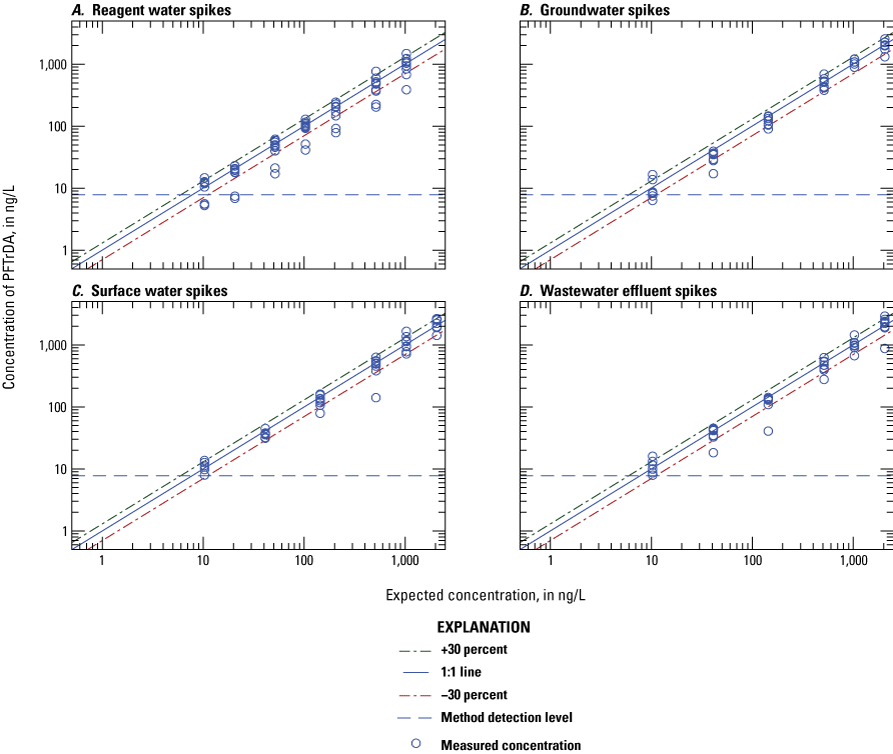
Graphs comparing the measured concentration to amount spiked for perfluorotridecanoate (PFTrDA) in A, reagent water; B, groundwater; C, surface water; and D, wastewater effluent. (ng/L, nanograms per liter)
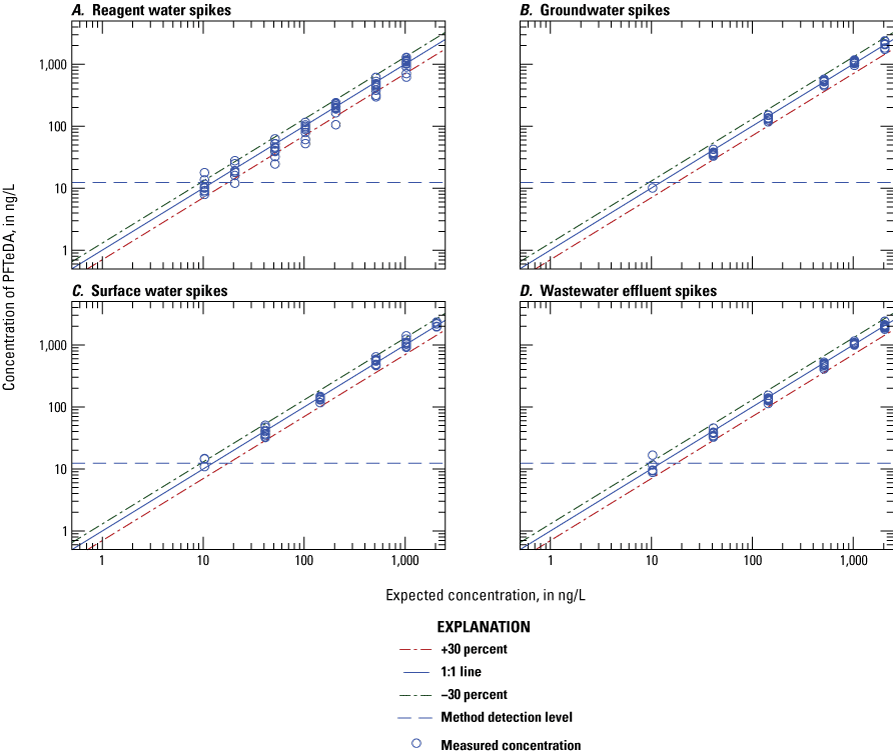
Graphs comparing the measured concentration to amount spiked for perfluorotetradecanoate (PFTeDA) in A, reagent water; B, groundwater; C, surface water; and D, wastewater effluent. (ng/L, nanograms per liter)
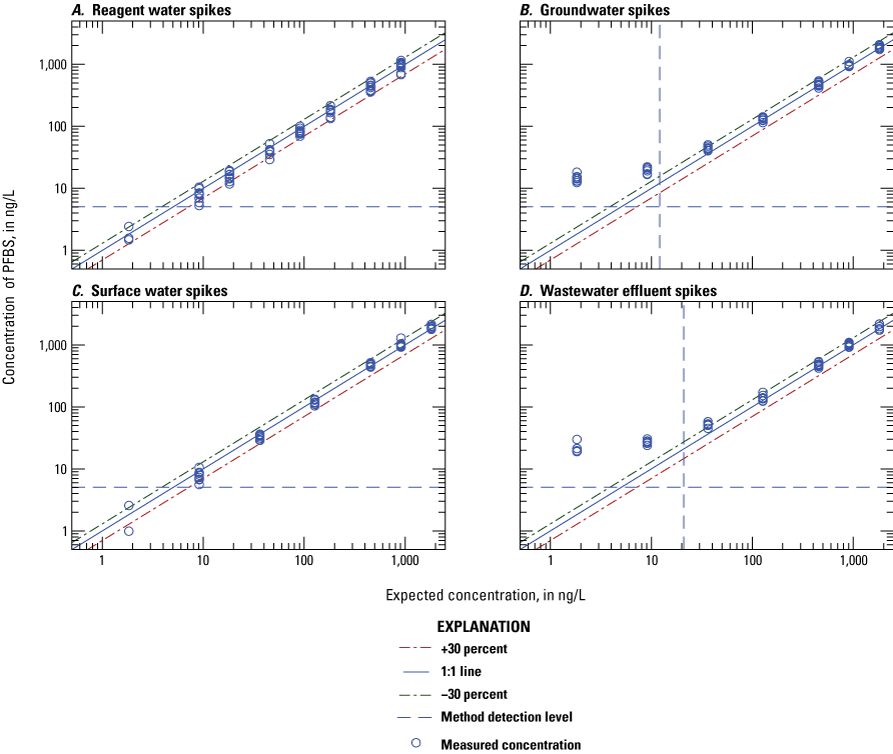
Graphs comparing the measured concentration to amount spiked for perfluorobutane sulfonate (PFBS) in A, reagent water; B, groundwater; C, surface water; and D, wastewater effluent. (ng/L, nanograms per liter)
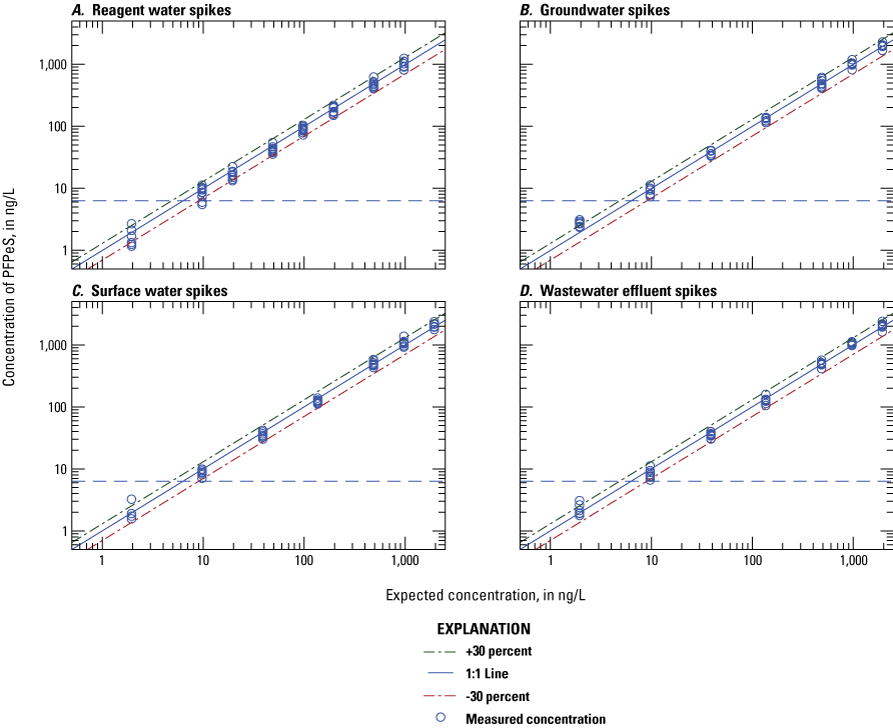
Graphs comparing the measured concentration to amount spiked for perfluoropentane sulfonate (PFPeS) in A, reagent water; B, groundwater; C, surface water; and D, wastewater effluent. (ng/L, nanograms per liter)
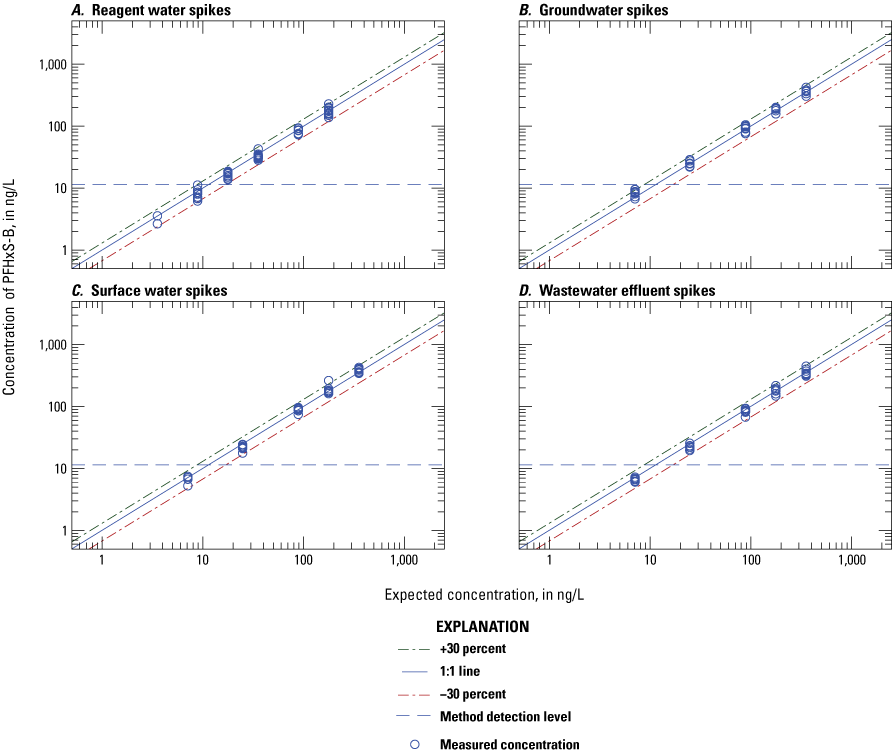
Graphs comparing the measured concentration to amount spiked for branched perfluorohexane sulfonate (PFHxS-B) in A, reagent water; B, groundwater; C, surface water; and D, wastewater effluent. (ng/L, nanograms per liter)
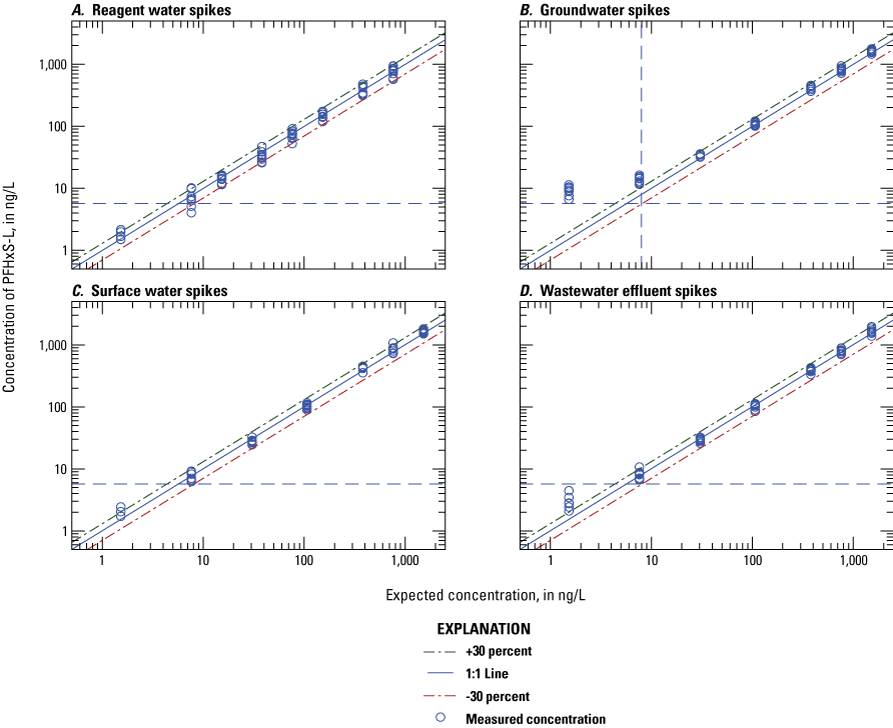
Graphs comparing the measured concentration to amount spiked for linear perfluorohexane sulfonate (PFHxS-L) in A, reagent water; B, groundwater; C, surface water; and D, wastewater effluent. (ng/L, nanograms per liter)
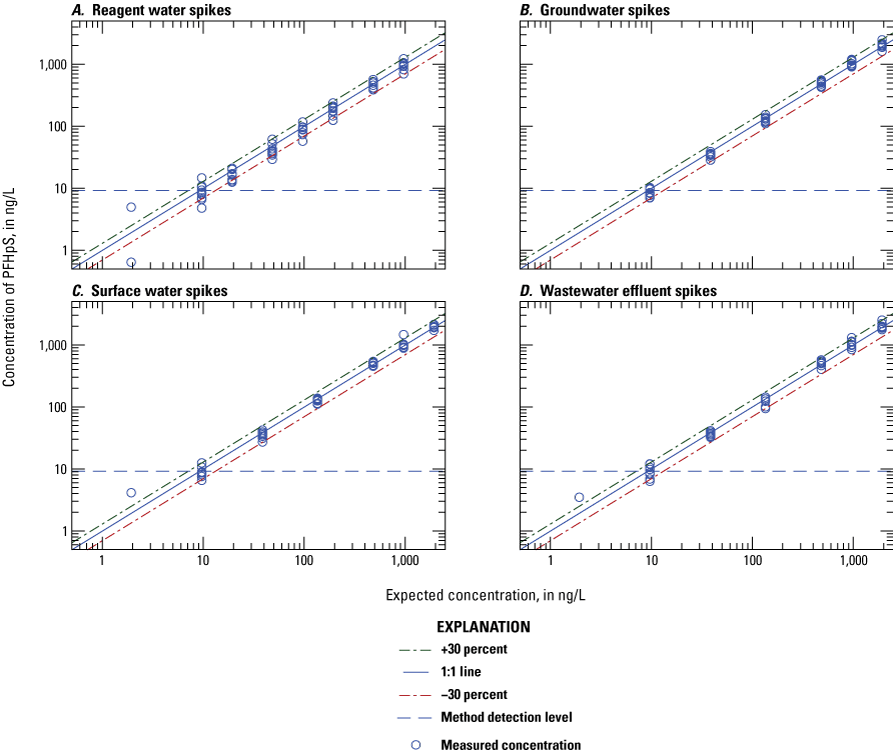
Graphs comparing the measured concentration to amount spiked for perfluoroheptane sulfonate (PFHpS) in A, reagent water; B, groundwater; C, surface water; and D, wastewater effluent. (ng/L, nanograms per liter)
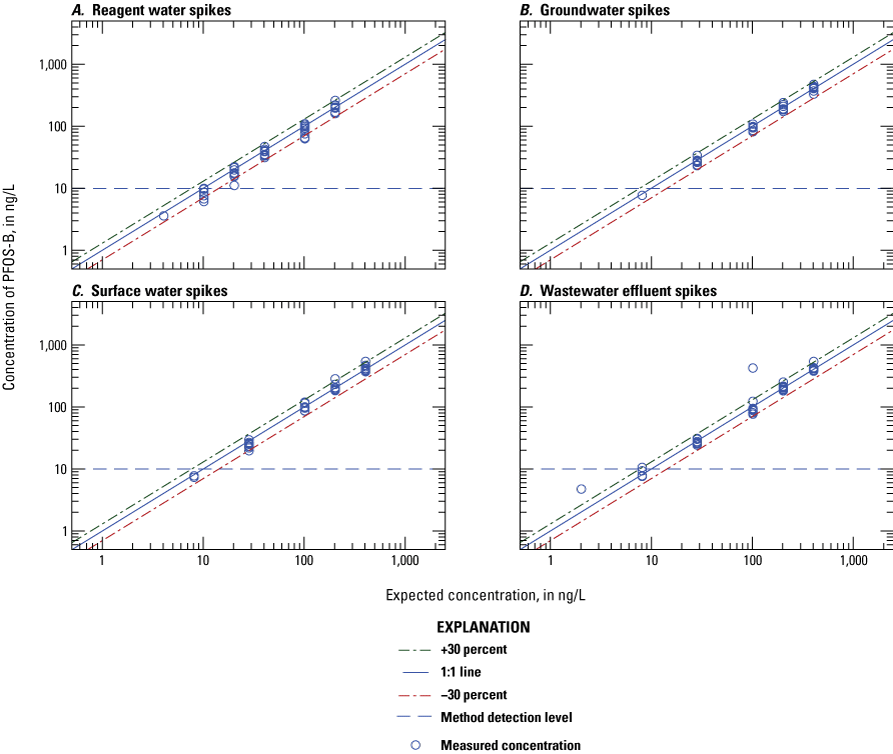
Graphs comparing the measured concentration to amount spiked for branched perfluorooctane sulfonate (PFOS-B) in A, reagent water; B, groundwater; C, surface water; and D, wastewater effluent. (ng/L, nanograms per liter)
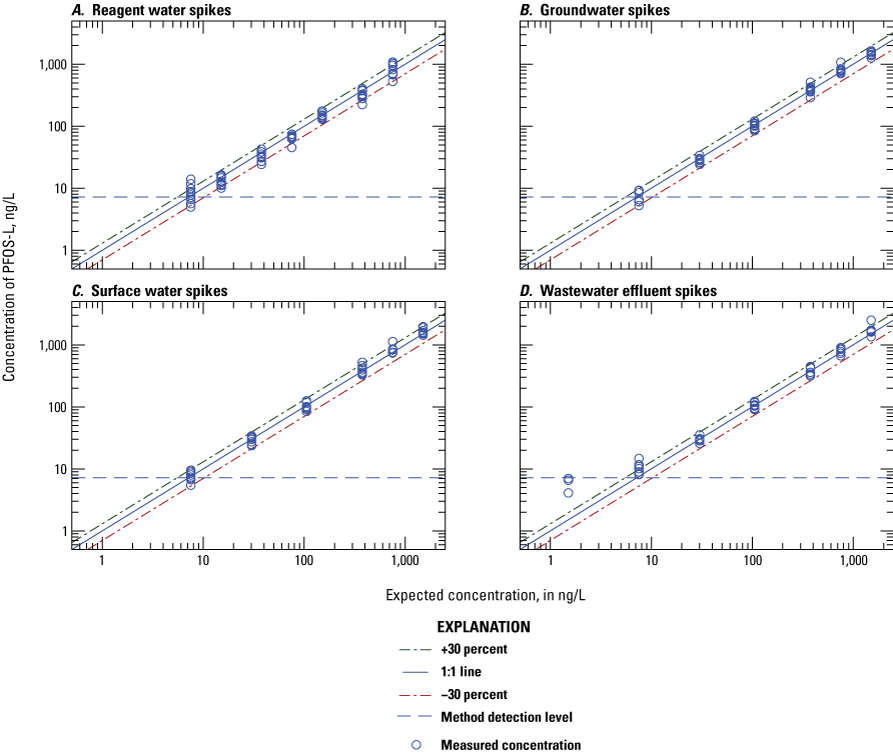
Graphs comparing the measured concentration to amount spiked for linear perfluorooctane sulfonate (PFOS-L) in A, reagent water; B, groundwater; C, surface water; and D, wastewater effluent. (ng/L, nanograms per liter)
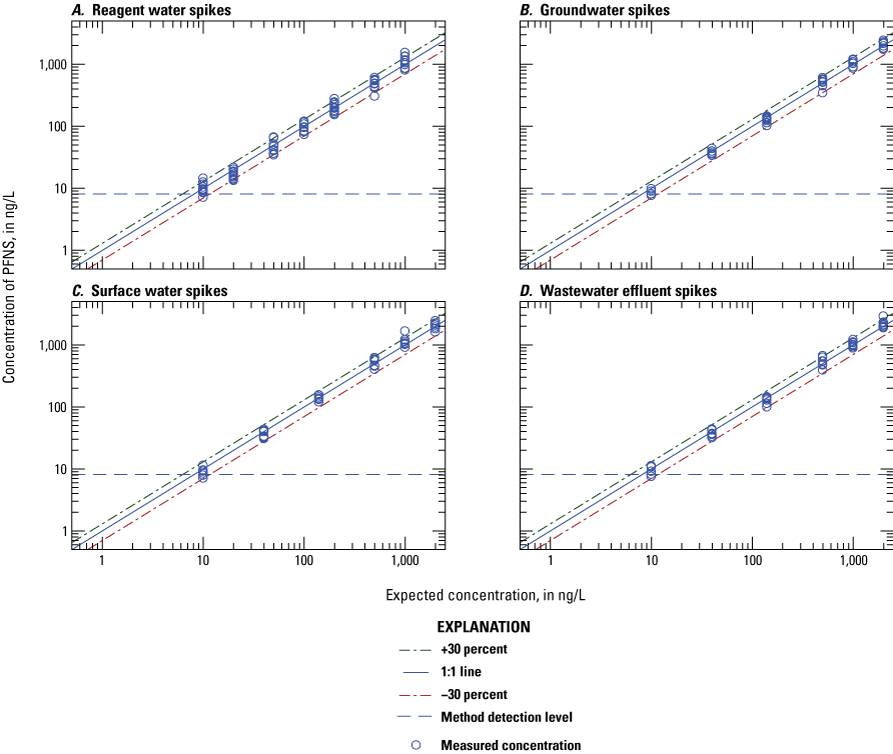
Graphs comparing the measured concentration to amount spiked for perfluorononane sulfonate (PFNS) in A, reagent water; B, groundwater; C, surface water; and D, wastewater effluent. (ng/L, nanograms per liter)
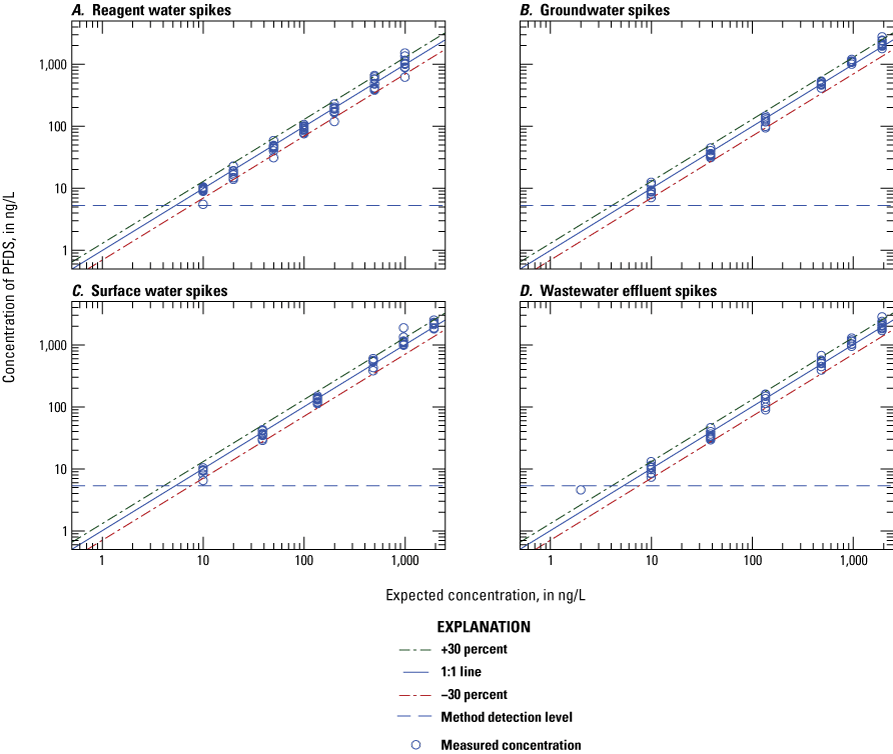
Graphs comparing the measured concentration to amount spiked for perfluorodecane sulfonate (PFDS) in A, reagent water; B, groundwater; C, surface water; and D, wastewater effluent. (ng/L, nanograms per liter)
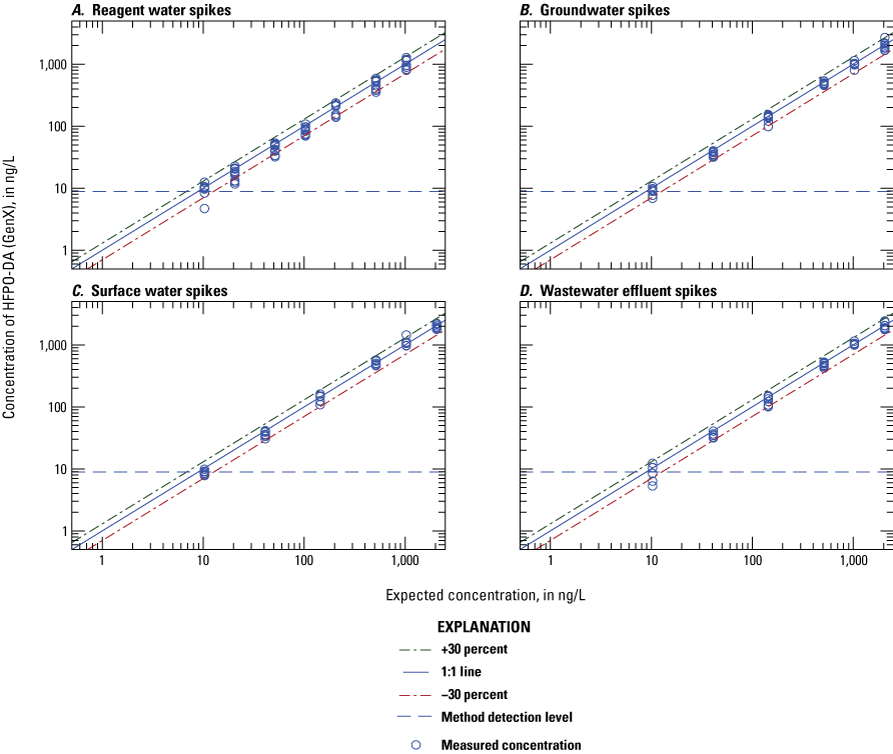
Graphs comparing the measured concentration to amount spiked for hexafluoropropylene oxide-dimer acid (HFPO-DA, GenX) in A, reagent water; B, groundwater; C, surface water; and D, wastewater effluent. (ng/L, nanograms per liter)
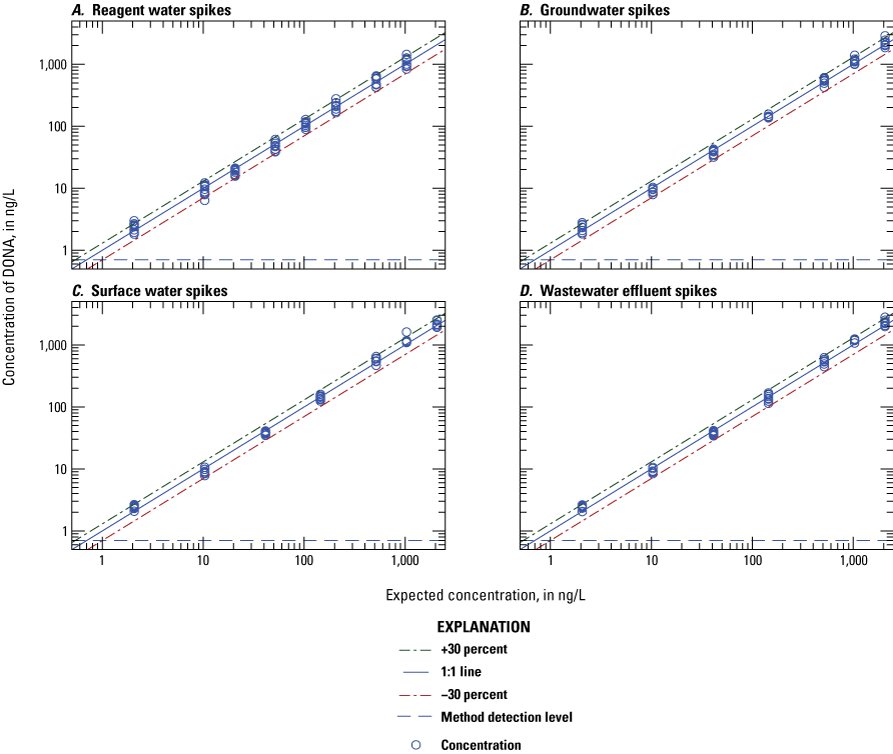
Graphs comparing the measured concentration to amount spiked for 4,8-dioxa-3H-perfluorononanoate (DONA) in A, reagent water; B, groundwater; C, surface water; and D, wastewater effluent. (ng/L, nanograms per liter)
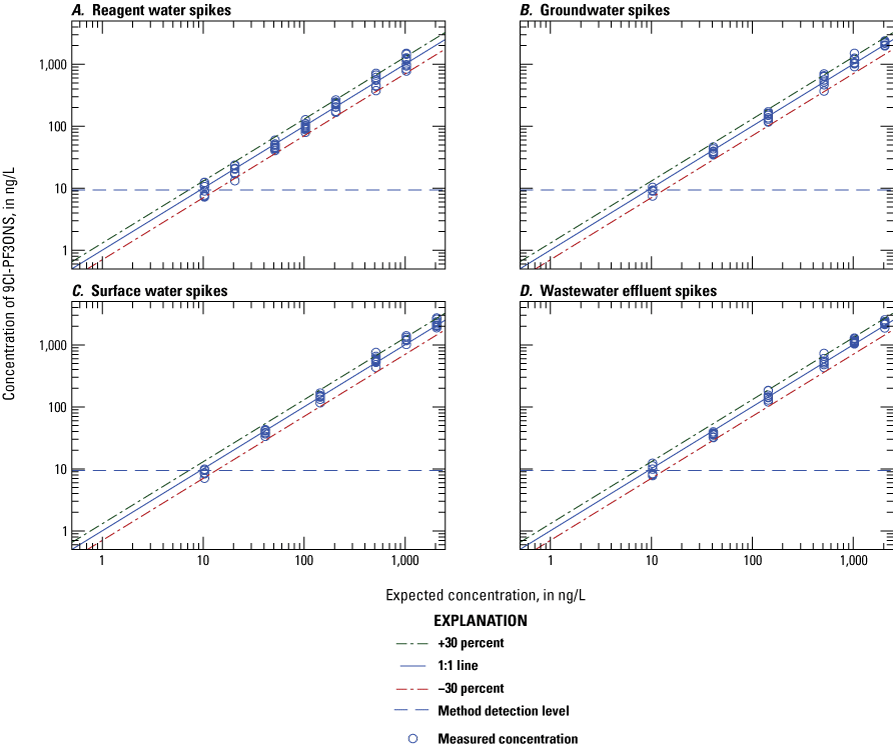
Graphs comparing the measured concentration to amount spiked for 9-chlorohexadecafluoro-3-oxanonane-1-sulfonate (9Cl-PF3ONS) in A, reagent water; B, groundwater; C, surface water; and D, wastewater effluent. (ng/L, nanograms per liter)
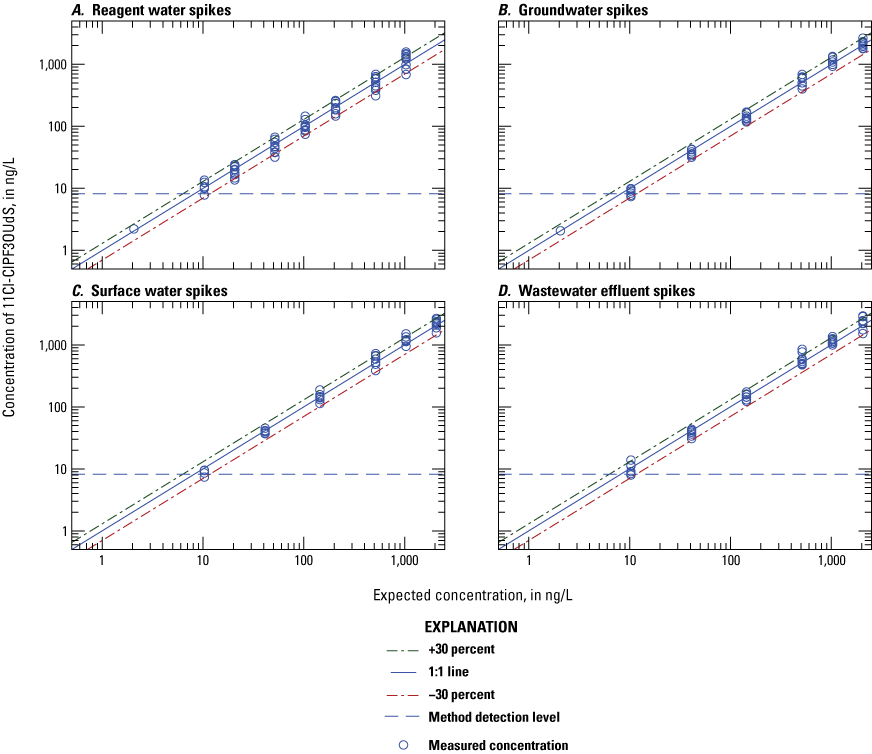
Graphs comparing the measured concentration to amount spiked for 11-chloroeicosafluoro-3-oxaundecane-1-sulfonate (11Cl-PF3OUdS) in A, reagent water; B, groundwater; C, surface water; and D, wastewater effluent. (ng/L, nanograms per liter)
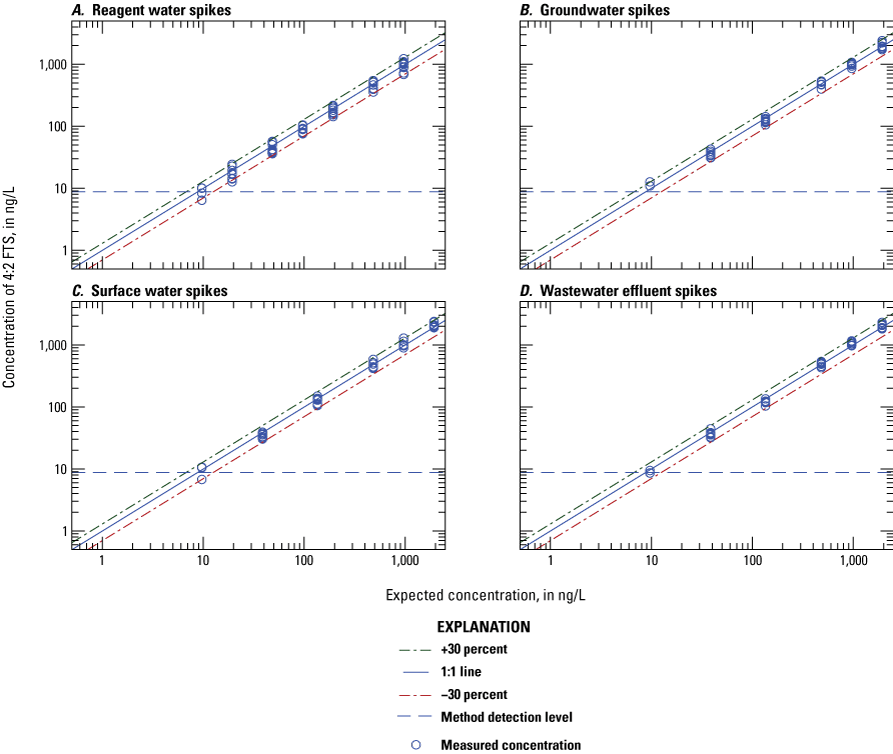
Graphs comparing the measured concentration to amount spiked for 4:2 fluorotelomer sulfonate (4:2 FTS) in A, reagent water; B, groundwater; C, surface water; and D, wastewater effluent. (ng/L, nanograms per liter)
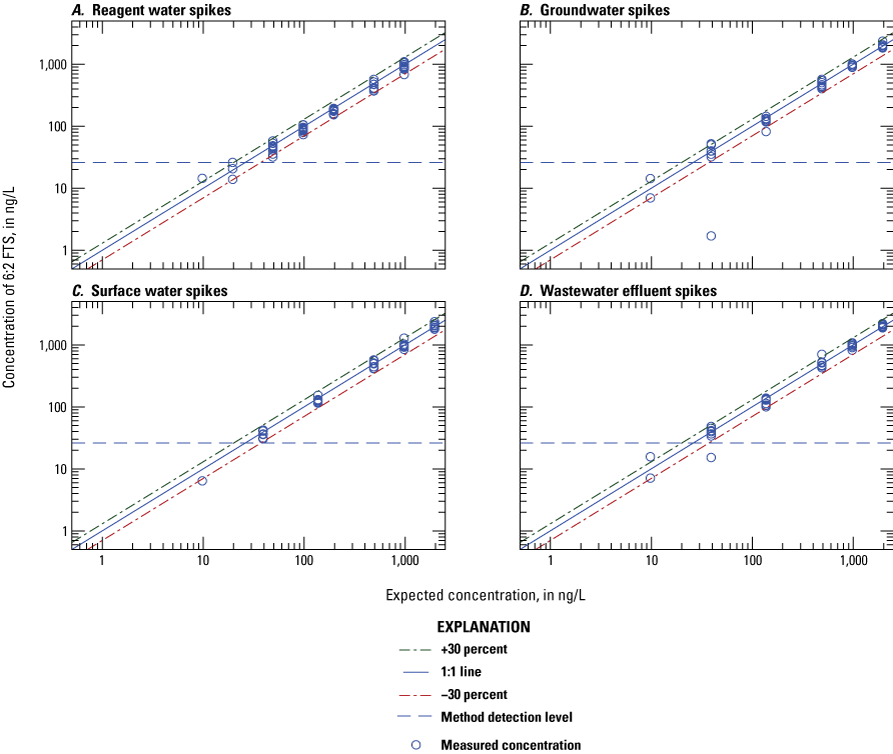
Graphs comparing the measured concentration to amount spiked for 6:2 fluorotelomersulfonate (6:2 FTS) in A, reagent water; B, groundwater; C, surface water; and D, wastewater effluent. (ng/L, nanograms per liter)
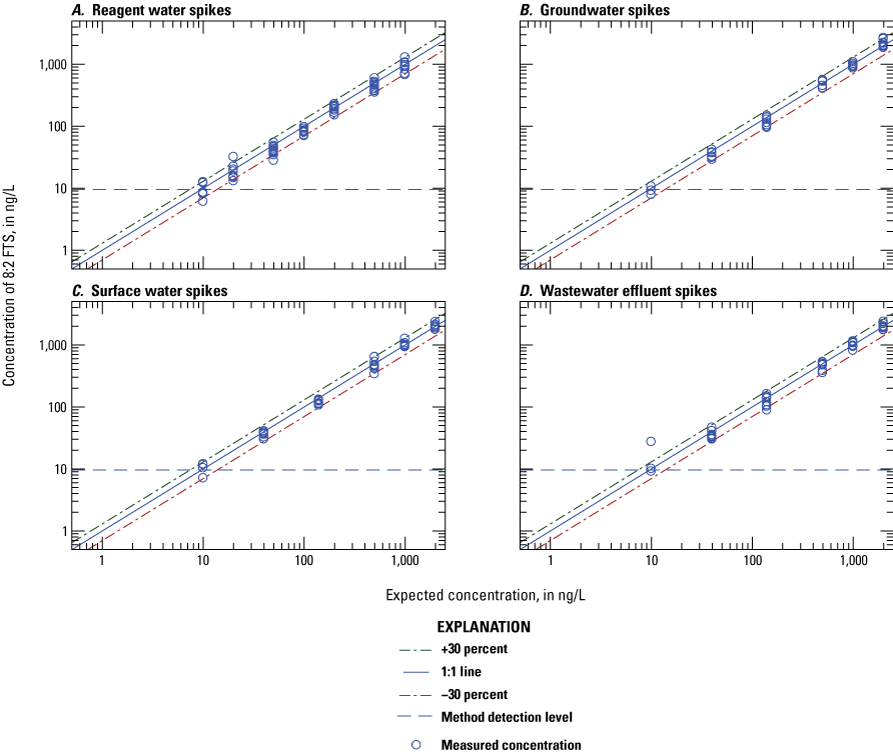
Graphs comparing the measured concentration to amount spiked for 8:2 fluorotelomer sulfonate (8:2 FTS) in A, reagent water; B, groundwater; C, surface water; and D, wastewater effluent. (ng/L, nanograms per liter)
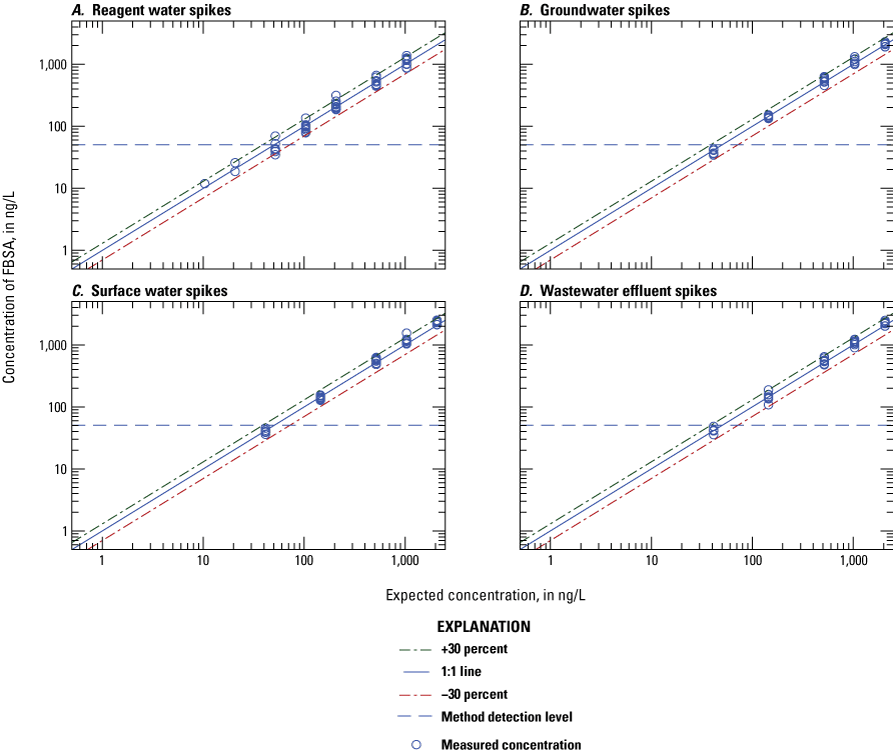
Graphs comparing the measured concentration to amount spiked for perfluorobutanesuldonamide (FBSA) in A, reagent water; B, groundwater; C, surface water; and D, wastewater effluent. (ng/L, nanograms per liter)

Graphs comparing the measured concentration to amount spiked for perfluorohexanesulfonamide (FHxSA) in A, reagent water; B, groundwater; C, surface water; and D, wastewater effluent. (ng/L, nanograms per liter)
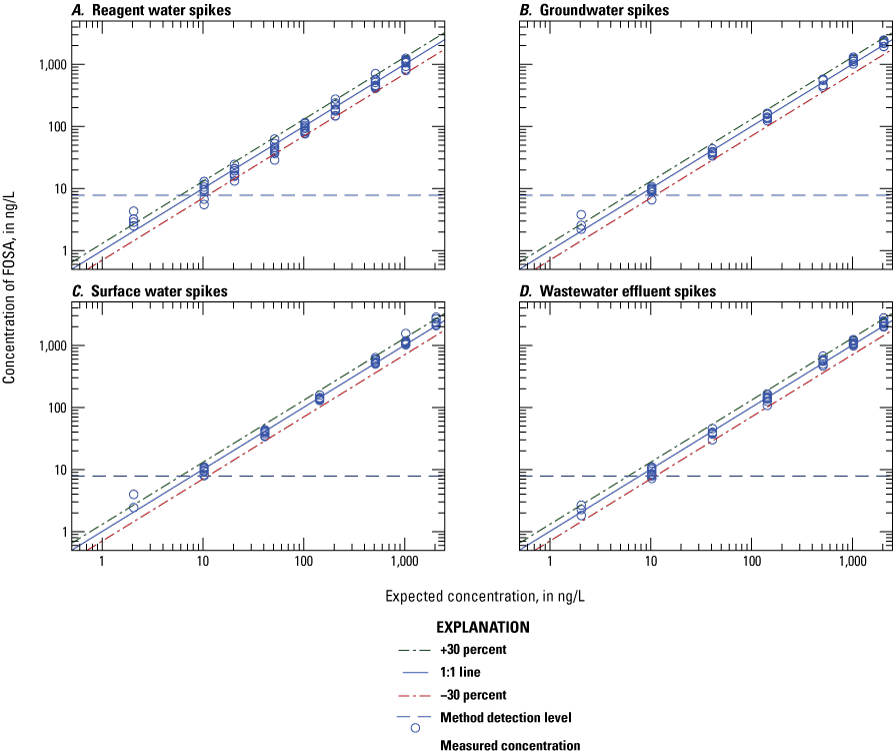
Graphs comparing the measured concentration to amount spiked for perfluorooctanesulfonamide (FOSA) in A, reagent water; B, groundwater; C, surface water; and D, wastewater effluent. (ng/L, nanograms per liter)
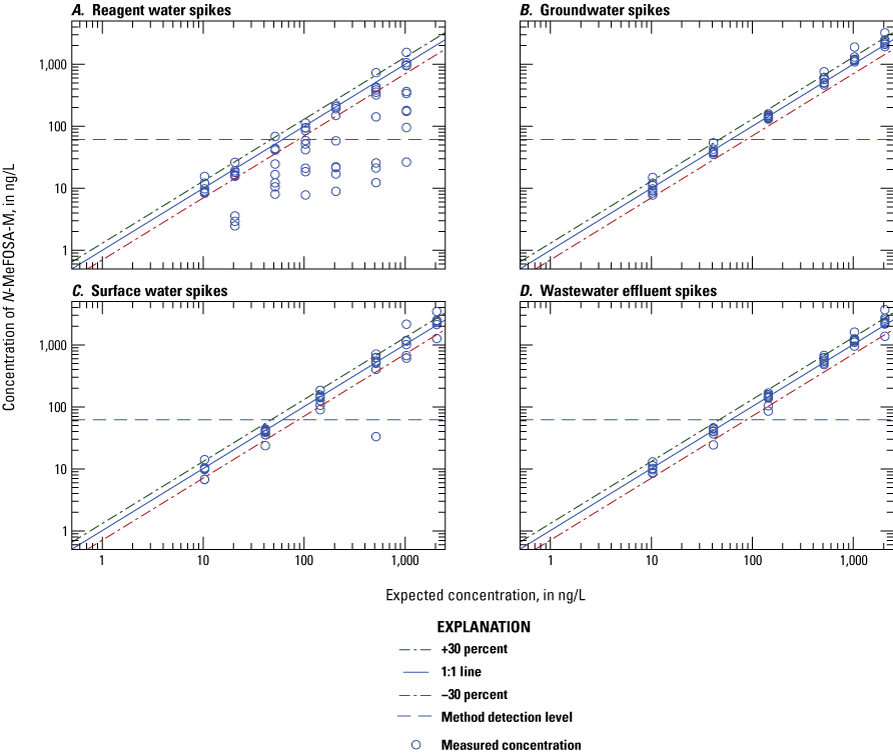
Graphs comparing the measured concentration to amount spiked for N-methylperfluorooctanesulfonamide (N-MeFOSA-M) in A, reagent water; B, groundwater; C, surface water; and D, wastewater effluent. (ng/L, nanograms per liter)
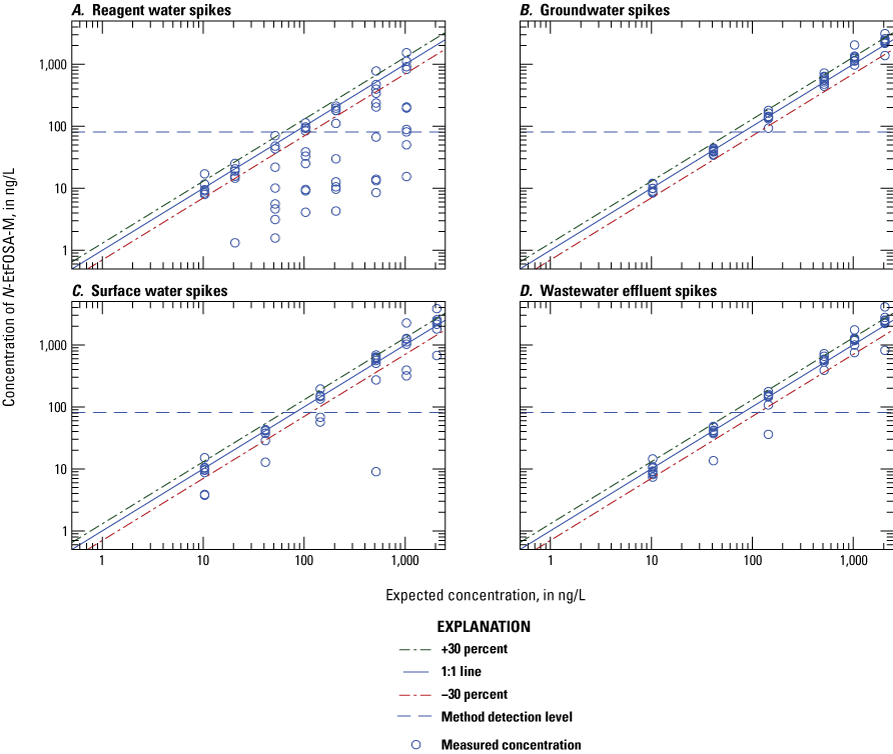
Graphs comparing the measured concentration to amount spiked for N-ethylperfluorooctanesulfonamide (N-EtFOSA-M) in A, reagent water; B, groundwater; C, surface water; and D, wastewater effluent. (ng/L, nanograms per liter)

Graphs comparing the measured concentration to amount spiked for linear N-methylperfluorooctanesulfonamido acetate (N-MeFOSAA-L) in A, reagent water; B, groundwater; C, surface water; and D, wastewater effluent. (ng/L, nanograms per liter)
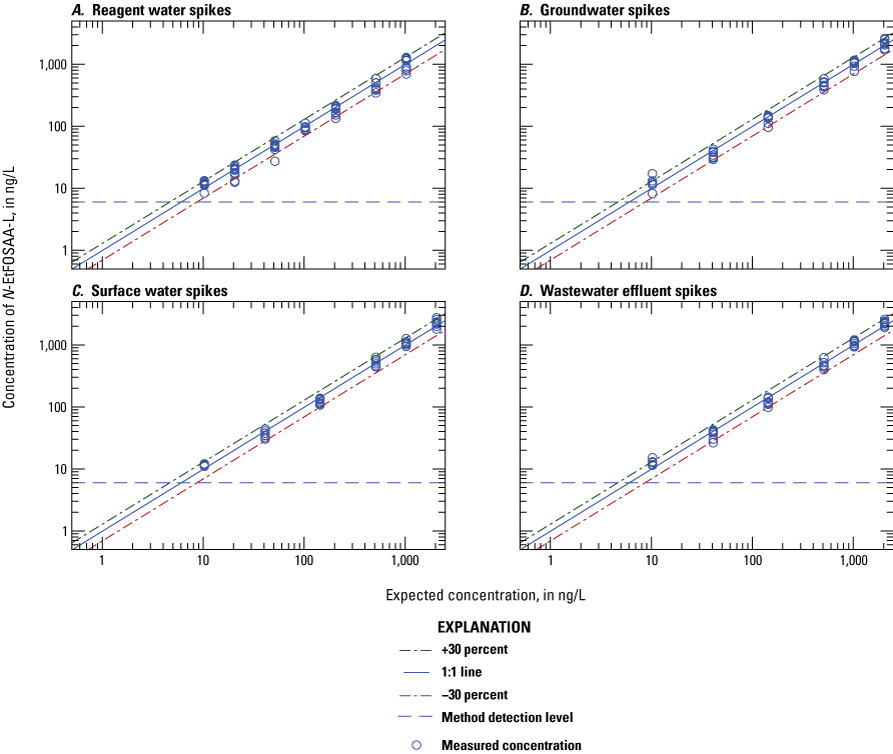
Graphs comparing the measured concentration to amount spiked for linear N-ethylperfluorooctanesulfonamido acetate (N-EtFOSAA-L) in A, reagent water; B, groundwater; C, surface water; and D, wastewater effluent. (ng/L, nanograms per liter)
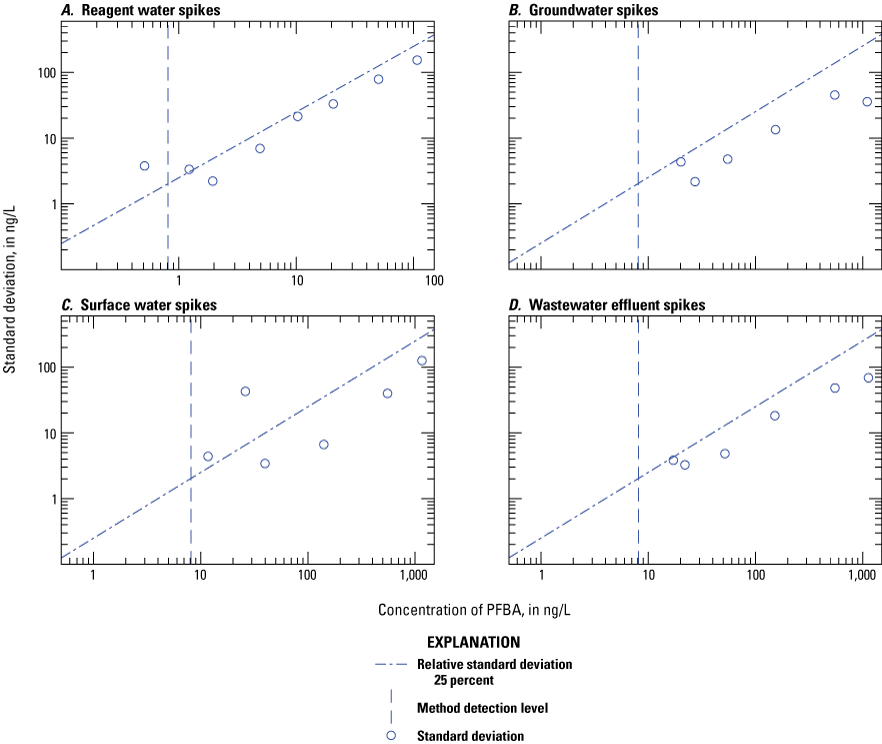
Graphs comparing the variability of measured perfluorobutanoate (PFBA) concentration at different spike levels in A, reagent water; B, groundwater; C, surface water; and D, wastewater effluent. (ng/L, nanograms per liter)
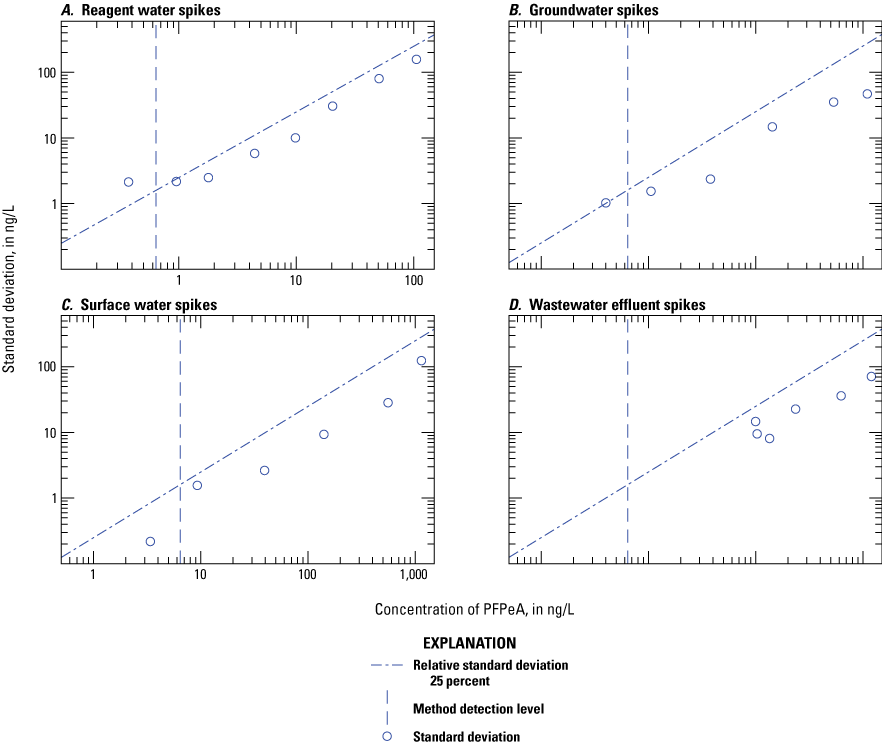
Graphs comparing the variability of measured perfluoropentanoate (PFPeA) concentration at different spike levels in A, reagent water; B, groundwater; C, surface water; and D, wastewater effluent. (ng/L, nanograms per liter)
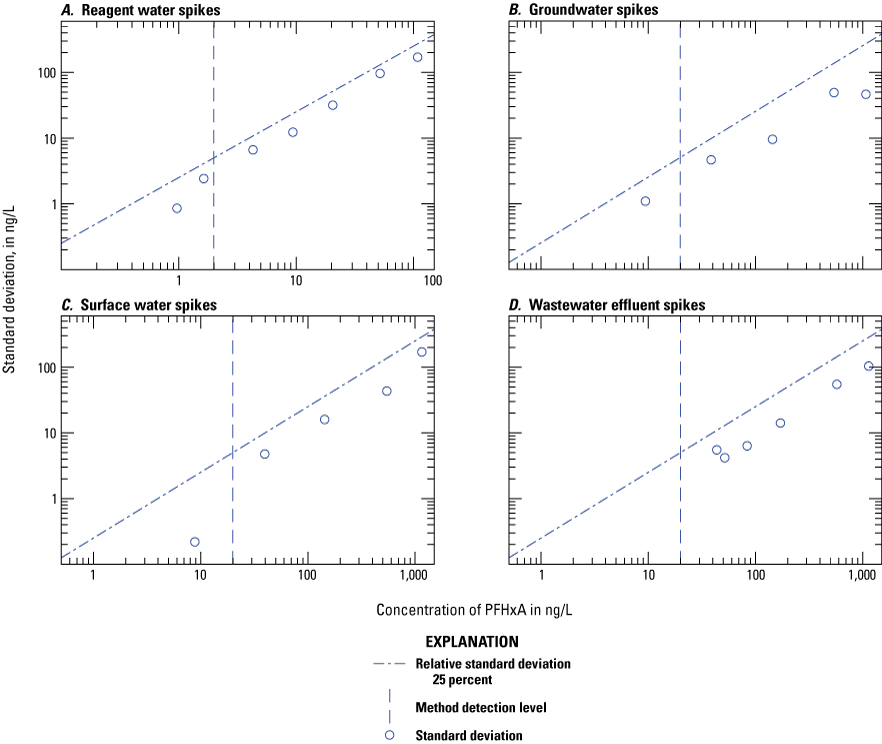
Graphs comparing the variability of measured perfluorohexanoate (PFHxA) concentration at different spike levels in A, reagent water; B, groundwater; C, surface water; and D, wastewater effluent. (ng/L, nanograms per liter)
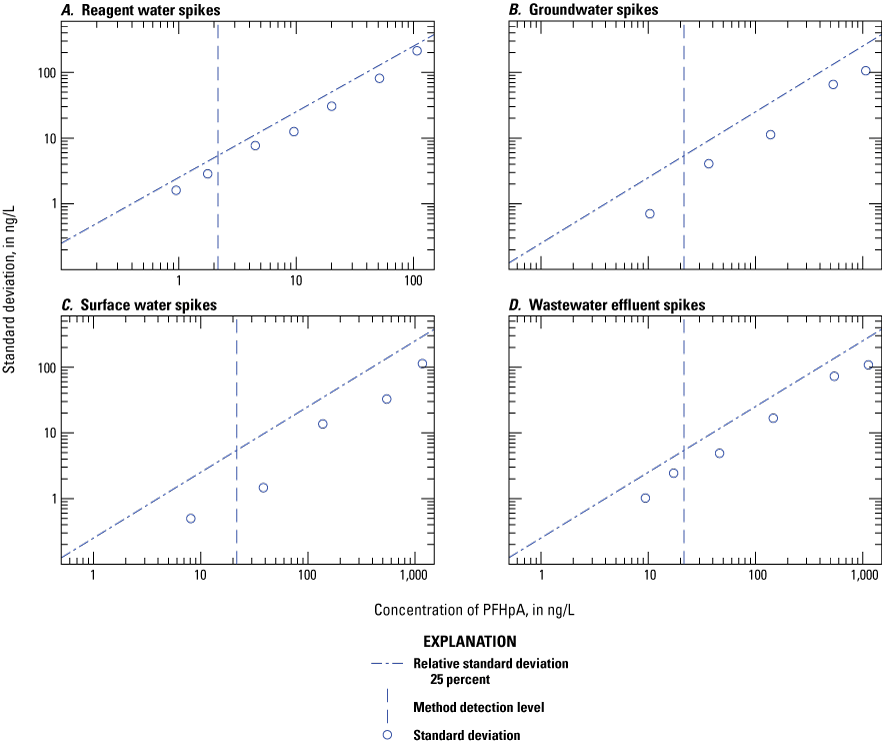
Graphs comparing the variability of measured perfluoroheptanoate (PFHpA) concentration at different spike levels in A, reagent water; B, groundwater; C, surface water; and D, wastewater effluent. (ng/L, nanograms per liter)
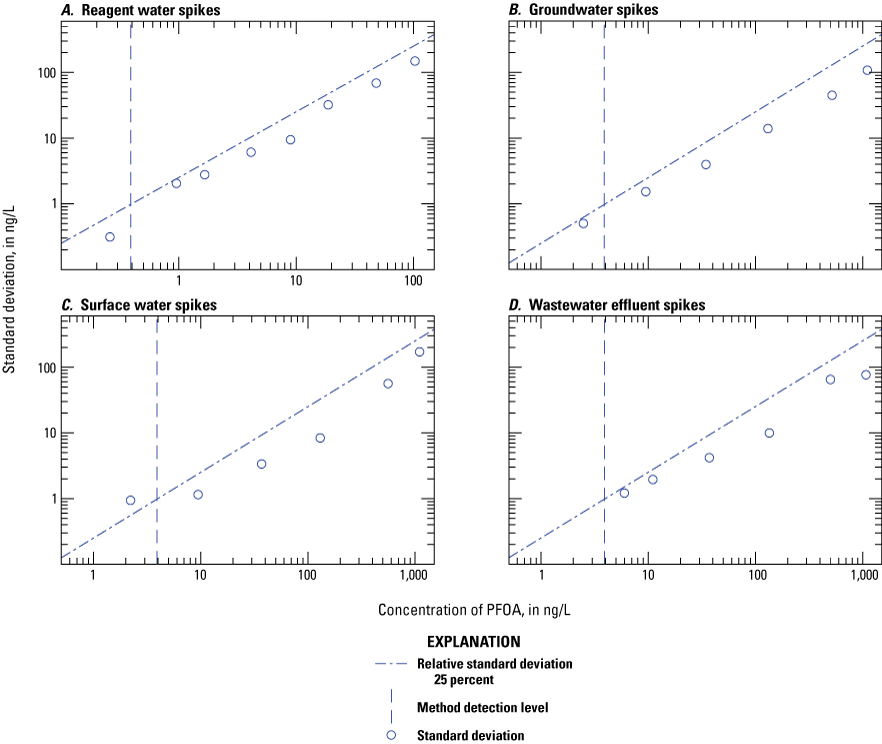
Graphs comparing the variability of measured perfluorooctanoate (PFOA) concentration at different spike levels in A, reagent water; B, groundwater; C, surface water; and D, wastewater effluent. (ng/L, nanograms per liter)
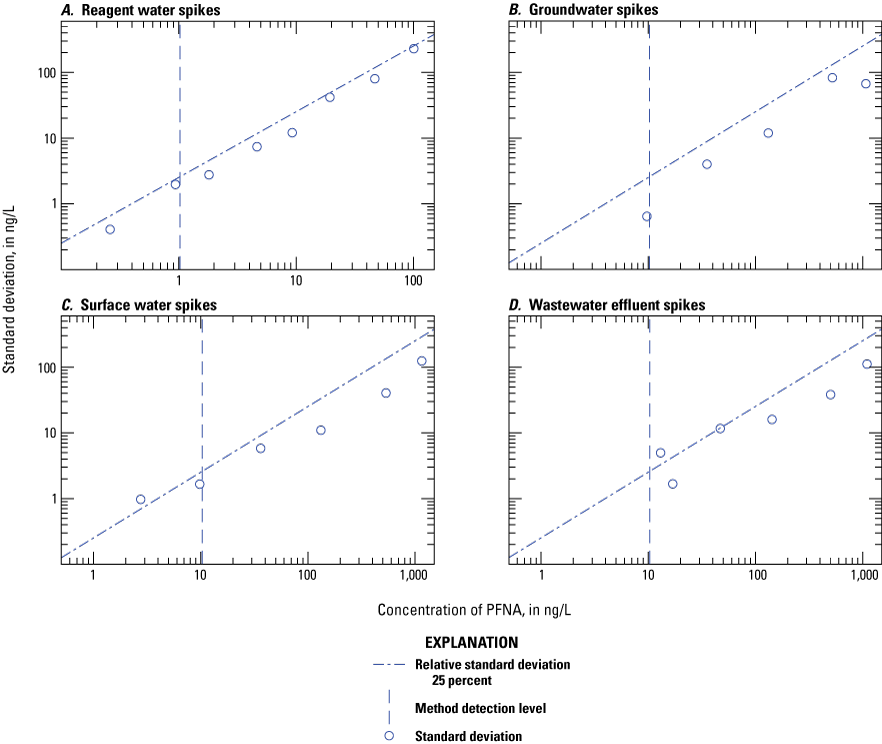
Graphs comparing the variability of measured perfluorononanoate (PFNA) concentration at different spike levels in A, reagent water; B, groundwater; C, surface water; and D, wastewater effluent. (ng/L, nanograms per liter)
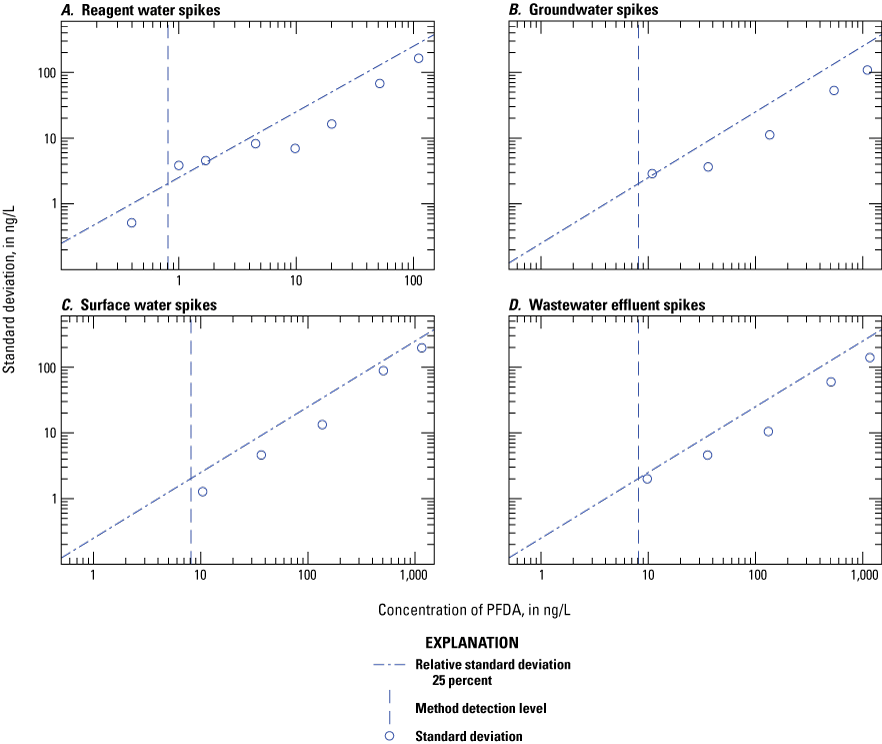
Graphs comparing the variability of measured perfluorodecanoate (PFDA) concentration at different spike levels in A, reagent water; B, groundwater; C, surface water; and D, wastewater effluent. (ng/L, nanograms per liter)
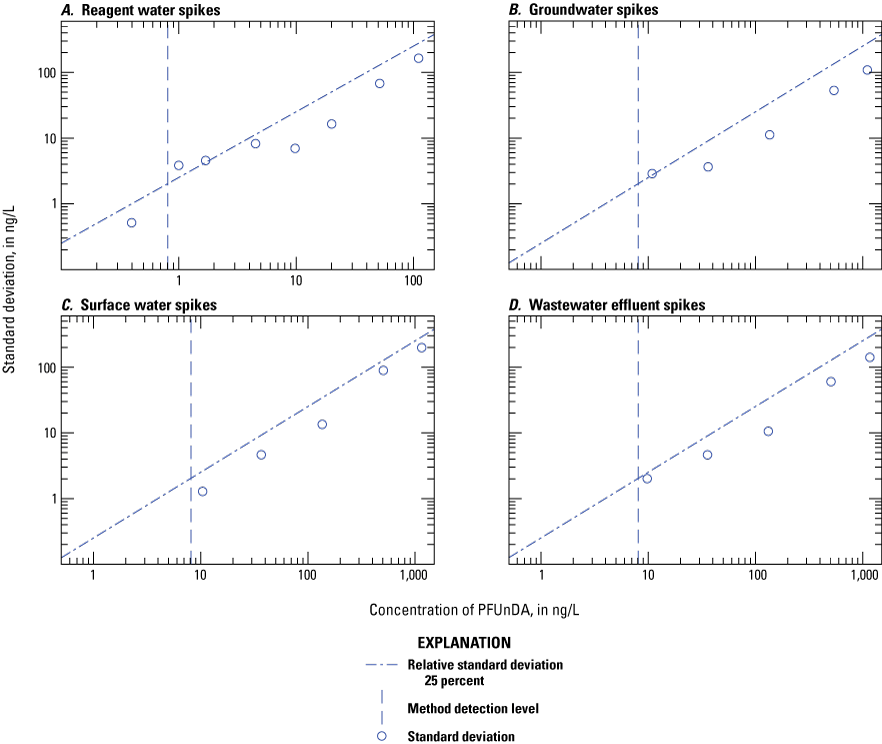
Graphs comparing the variability of measured perfluoroundecanoate (PFUnDA) concentration at different spike levels in A, reagent water; B, groundwater; C, surface water; and D, wastewater effluent. (ng/L, nanograms per liter)
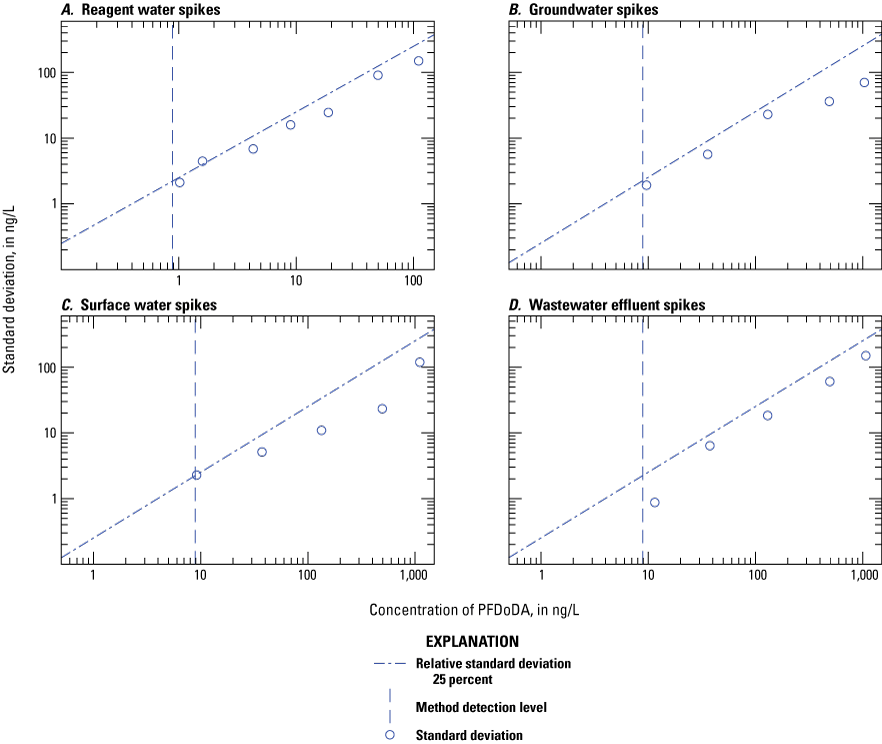
Graphs comparing the variability of measured perfluorododecanoate (PFDoDA) concentration at different spike levels in A, reagent water; B, groundwater; C, surface water; and D, wastewater effluent. (ng/L, nanograms per liter)
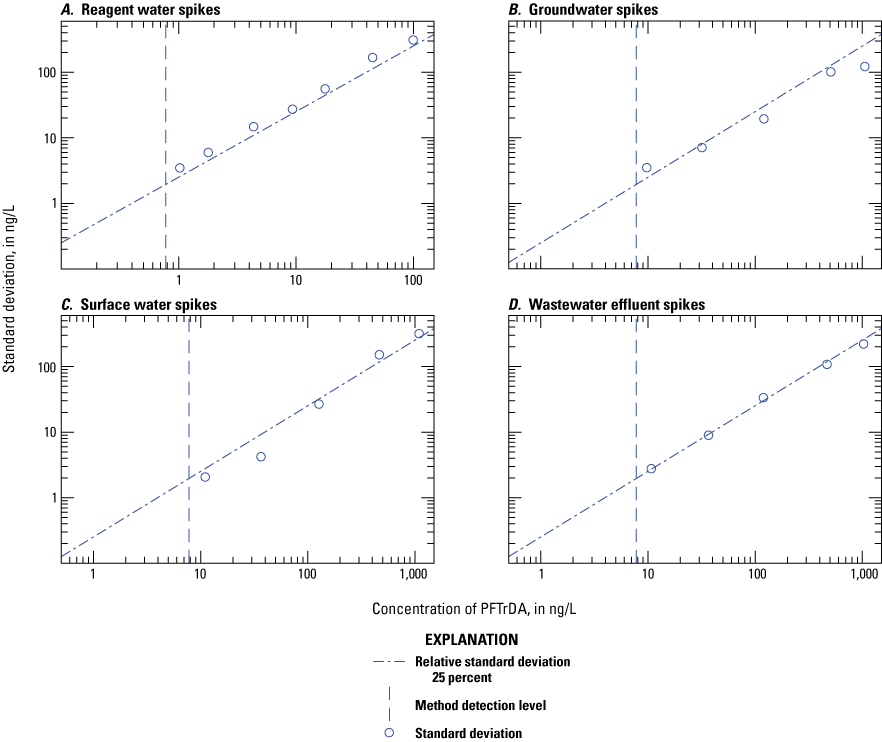
Graphs comparing the variability of measured perfluorotridecanoate (PFTrDA) concentration at different spike levels in A, reagent water; B, groundwater; C, surface water; and D, wastewater effluent. (ng/L, nanograms per liter)
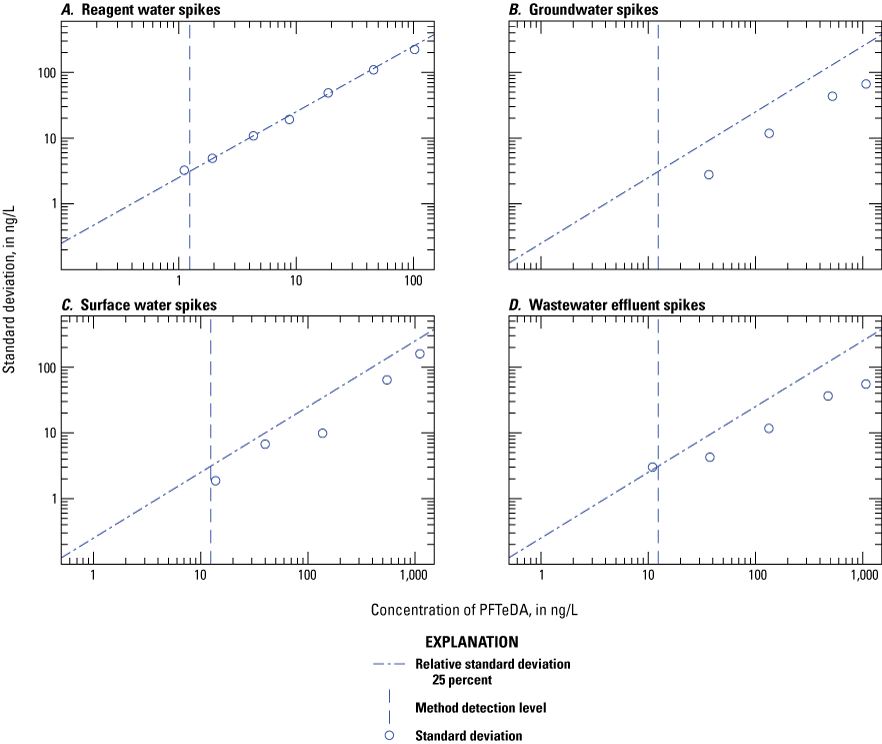
Graphs comparing the variability of measured perfluorotetradecanoate (PFTeDA) concentration at different spike levels in A, reagent water; B, groundwater; C, surface water; and D, wastewater effluent. (ng/L, nanograms per liter)
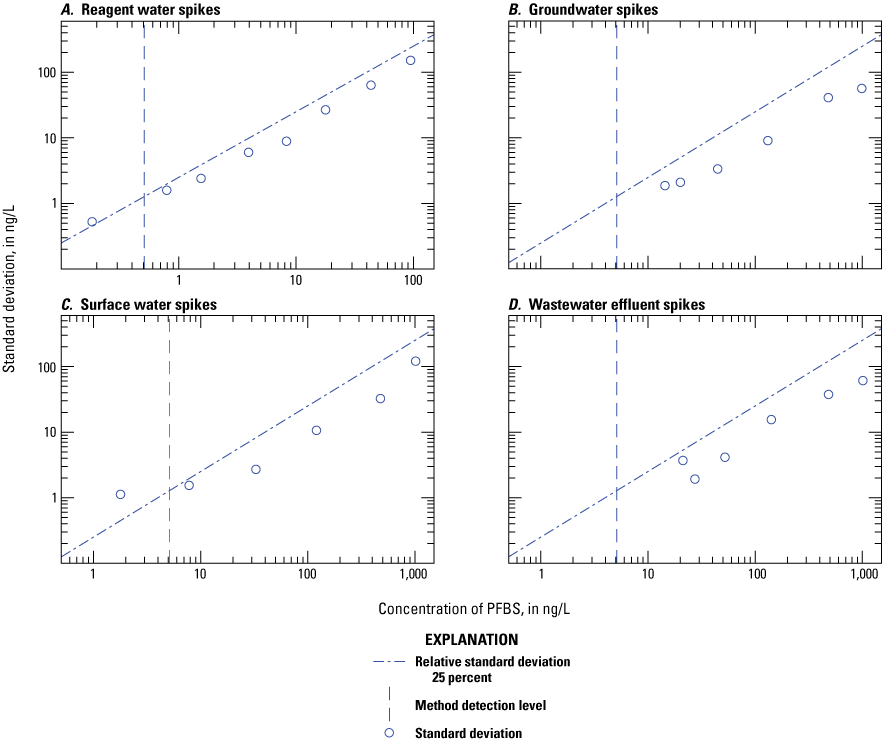
Graphs comparing the variability of measured for perfluorobutane sulfonate (PFBS) concentration at different spike levels in A, reagent water; B, groundwater; C, surface water; and D, wastewater effluent. (ng/L, nanograms per liter)
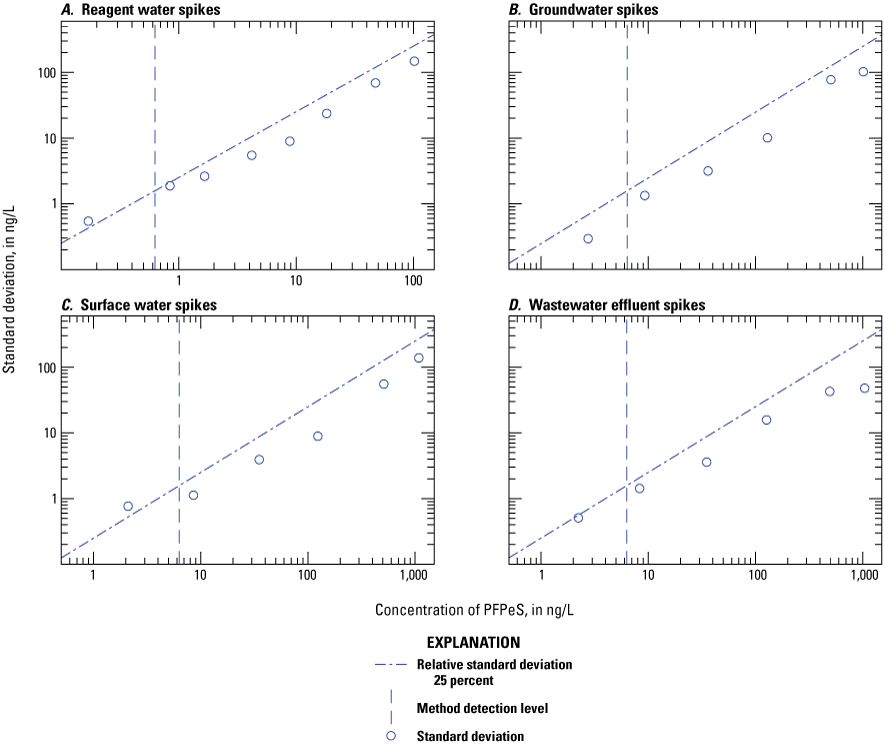
Graphs comparing the variability of measured perfluoropentane sulfonate (PFPeS) concentration at different spike levels in A, reagent water; B, groundwater; C, surface water; and D, wastewater effluent. (ng/L, nanograms per liter)
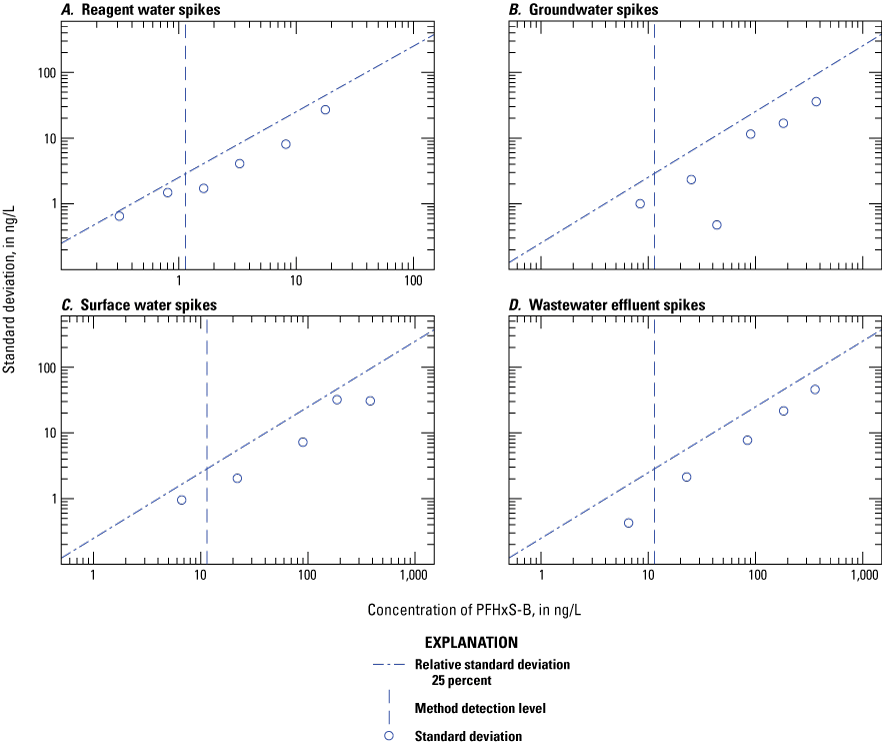
Graphs comparing the variability of measured branched perfluorohexane sulfonate (PFHxS-B) concentration at different spike levels in A, reagent water; B, groundwater; C, surface water; and D, wastewater effluent. (ng/L, nanograms per liter)
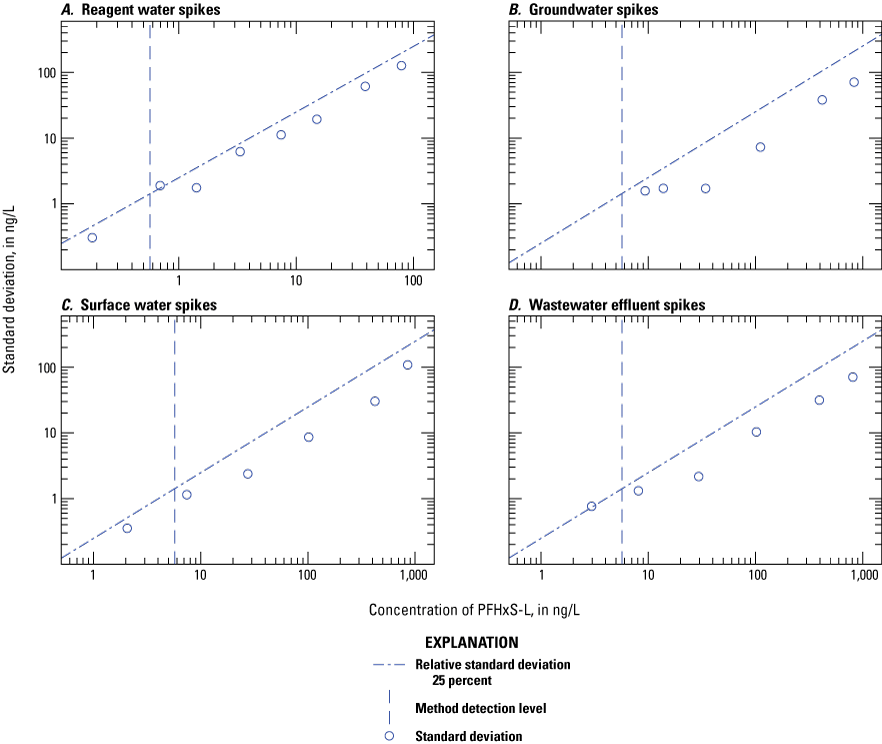
Graphs comparing the variability of measured linear perfluorohexane sulfonate (PFHxS-L) concentration at different spike levels in A, reagent water; B, groundwater; C, surface water; and D, wastewater effluent. (ng/L, nanograms per liter)
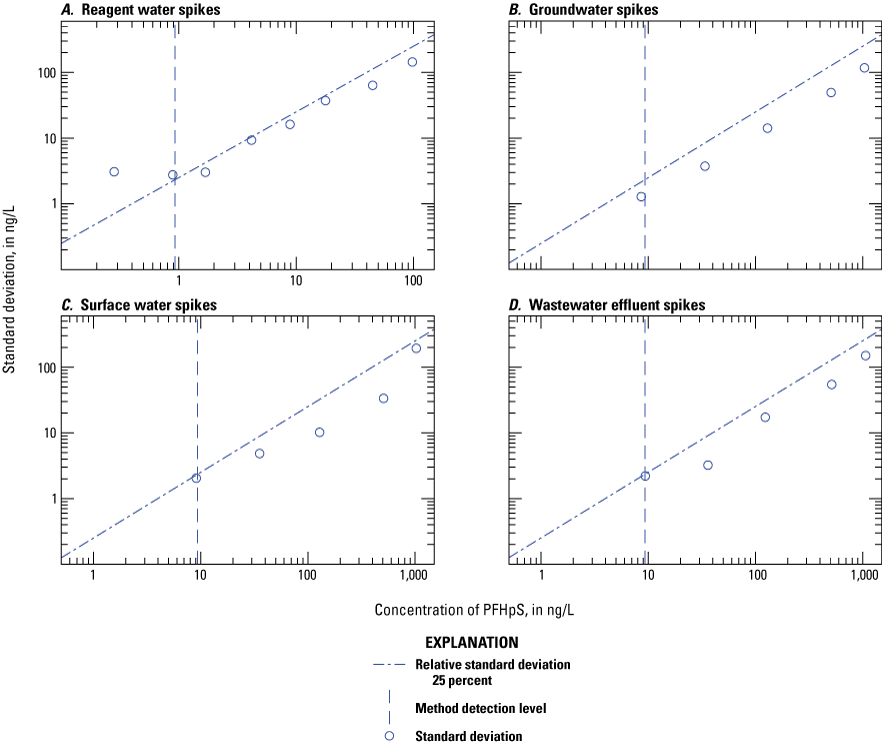
Graphs comparing the variability of measured perfluoroheptane sulfonate (PFHpS) concentration at different spike levels in A, reagent water; B, groundwater; C, surface water; and D, wastewater effluent. (ng/L, nanograms per liter)
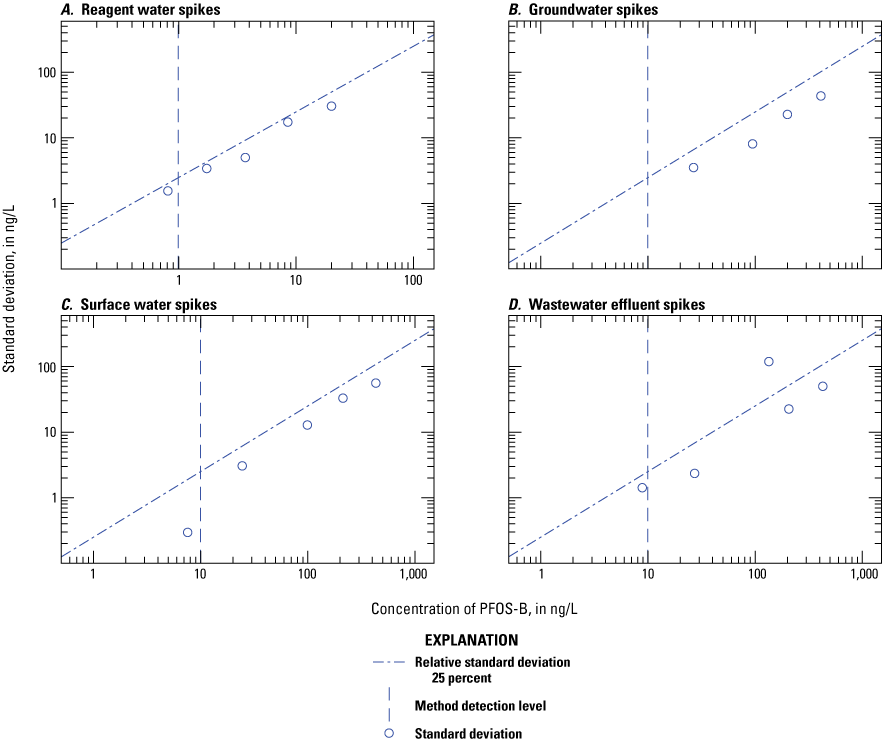
Graphs comparing the variability of measured branched perfluorooctane sulfonate (PFOS-B) concentration at different spike levels in A, reagent water; B, groundwater; C, surface water; and D, wastewater effluent. (ng/L, nanograms per liter)
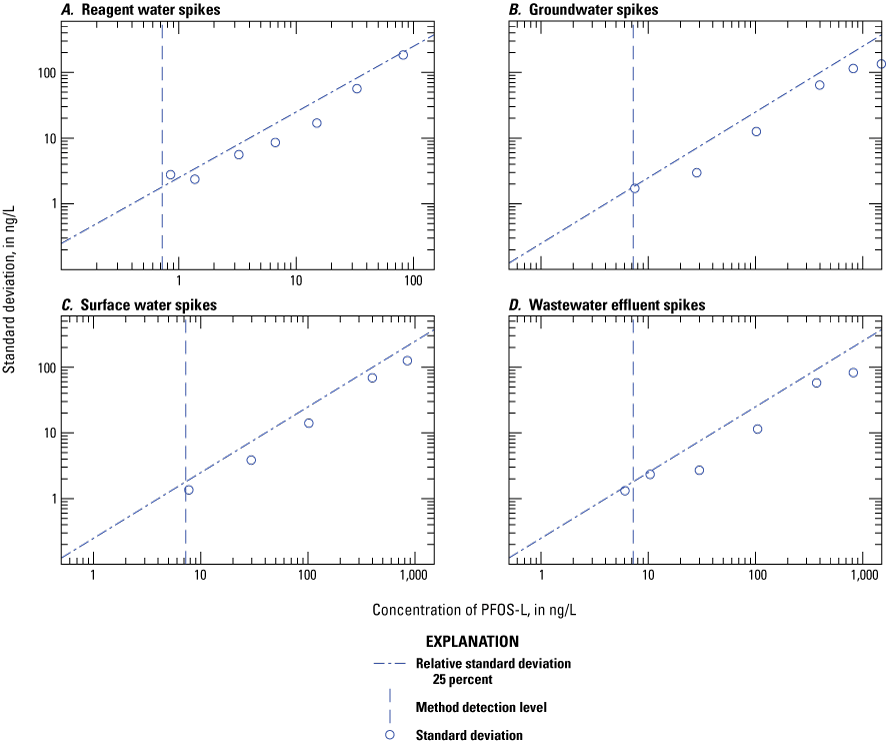
Graphs comparing the variability of measured linear perfluorooctane sulfonate (PFOS-L) concentration at different spike levels in A, reagent water; B, groundwater; C, surface water; and D, wastewater effluent. (ng/L, nanograms per liter)
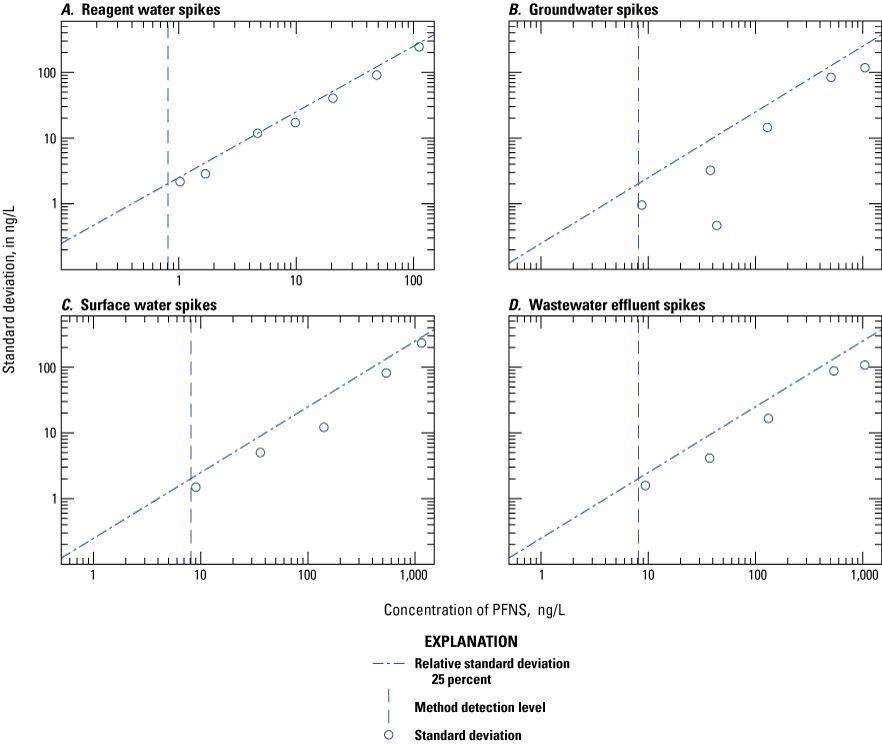
Graphs comparing the variability of measured perfluorononane sulfonate (PFNS) concentration at different spike levels in A, reagent water; B, groundwater; C, surface water; and D, wastewater effluent. (ng/L, nanograms per liter)
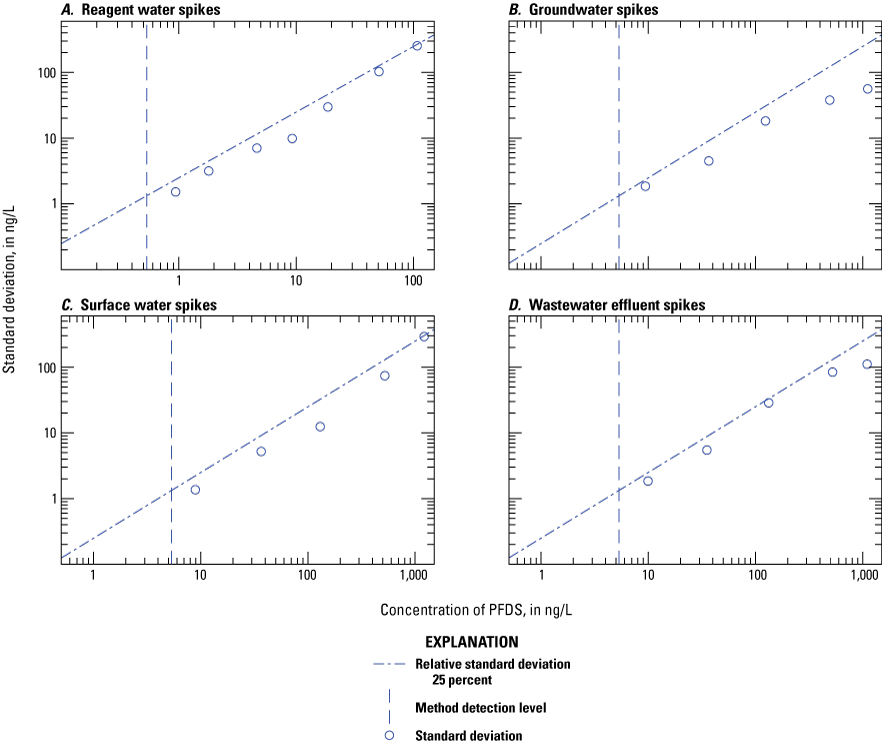
Graphs comparing the variability of measured perfluorodecane sulfonate (PFDS) in A, reagent water; B, groundwater; C, surface water; and D, wastewater effluent. (ng/L, nanograms per liter)
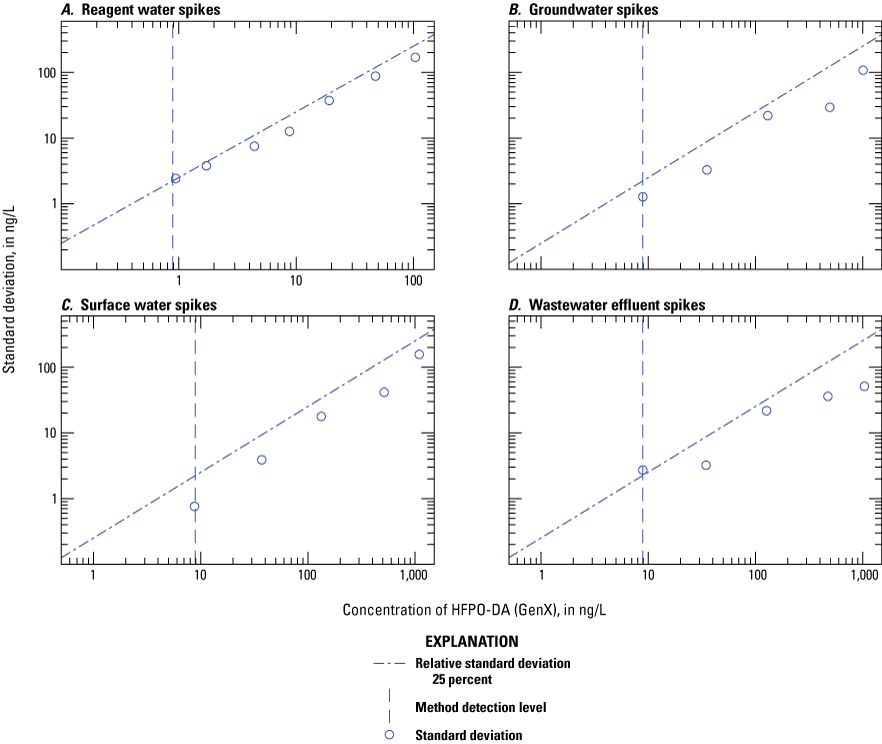
Graphs comparing the variability of measured hexafluoropropylene oxide-dimer acid (HFPO-DA, GenX) concentration at different spike levels in A, reagent water; B, groundwater; C, surface water; and D, wastewater effluent. (ng/L, nanograms per liter)
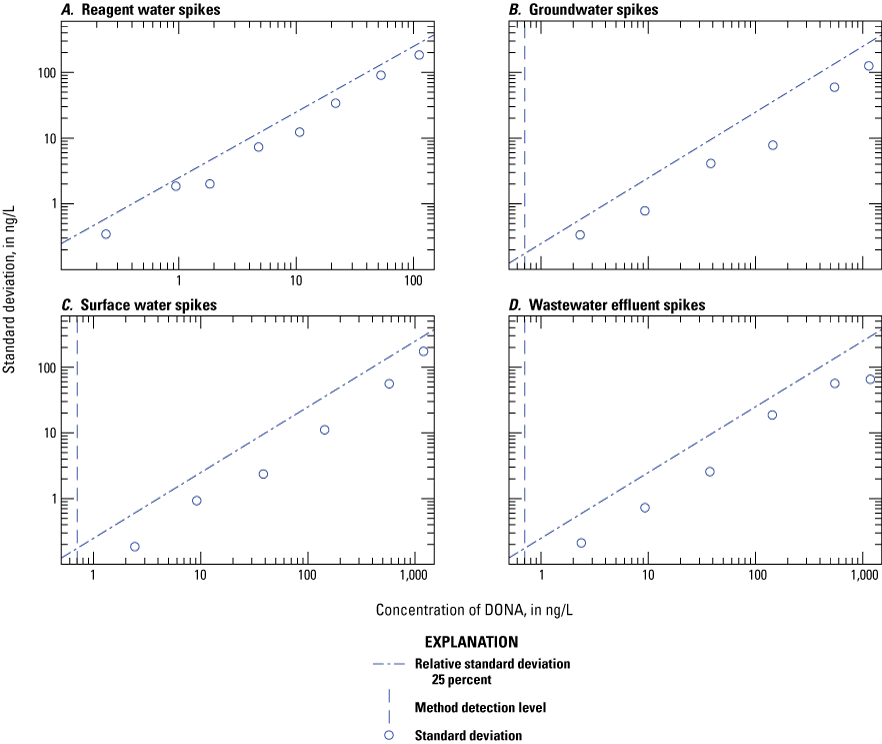
Graphs comparing the variability of measured 4,8-dioxa-3H-perfluorononanoate (DONA) concentration at different spike levels in A, reagent water; B, groundwater; C, surface water; and D, wastewater effluent. (ng/L, nanograms per liter)
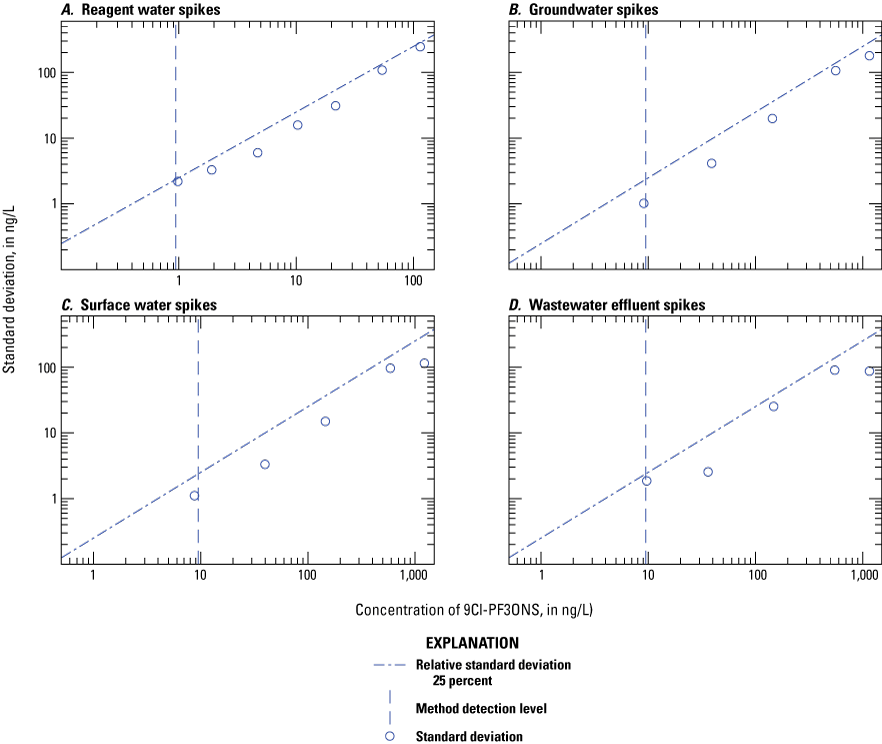
Graphs comparing the variability of measured 9-chlorohexadecafluoro-3-oxanonane-1-sulfonate (9Cl-PF3ONS) concentration at different spike levels in A, reagent water; B, groundwater; C, surface water; and D, wastewater effluent. (ng/L, nanograms per liter)
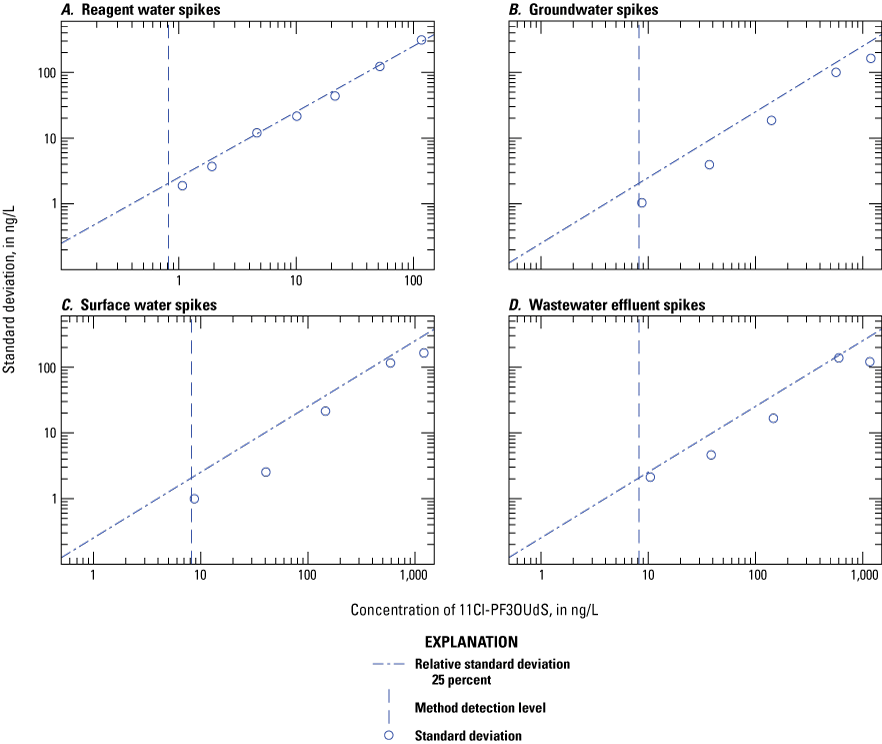
Graphs comparing the variability of measured 11-chloroeicosafluoro-3-oxaundecane-1-sulfonate (11Cl-PF3OUdS) concentration at different spike levels in A, reagent water; B, groundwater; C, surface water; and D, wastewater effluent. (ng/L, nanograms per liter)

Graphs comparing the variability of measured 4:2 fluorotelomer sulfonate (4:2 FTS) concentration at different spike levels in A, reagent water; B, groundwater; C, surface water; and D, wastewater effluent. (ng/L, nanograms per liter)
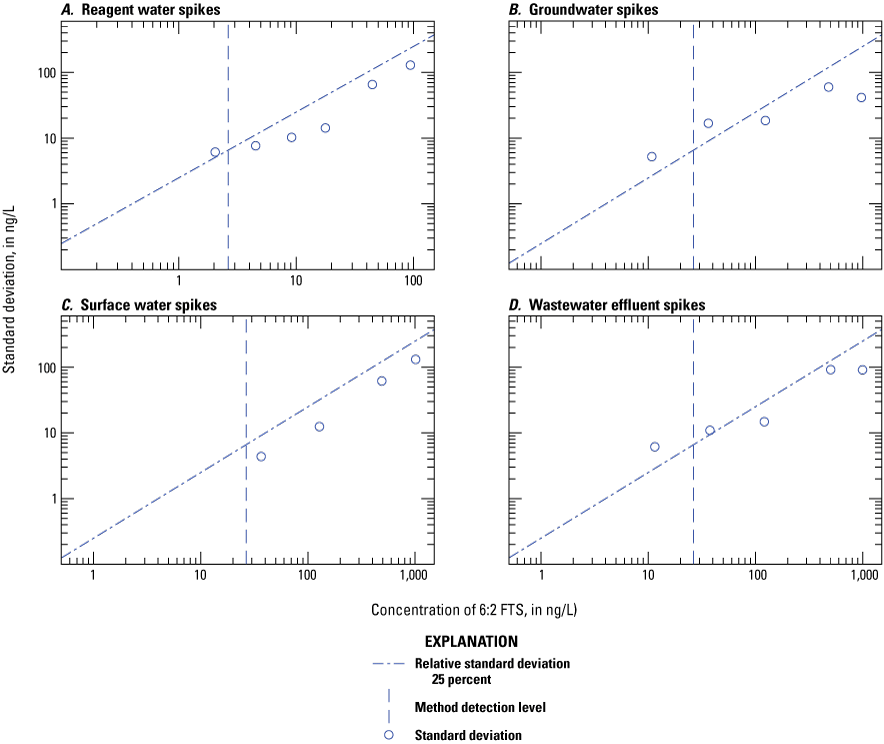
Graphs comparing the variability of measured 6:2 fluorotelomer sulfonate (6:2 FTS) concentration at different spike levels in A, reagent water; B, groundwater; C, surface water; and D, wastewater effluent. (ng/L, nanograms per liter)
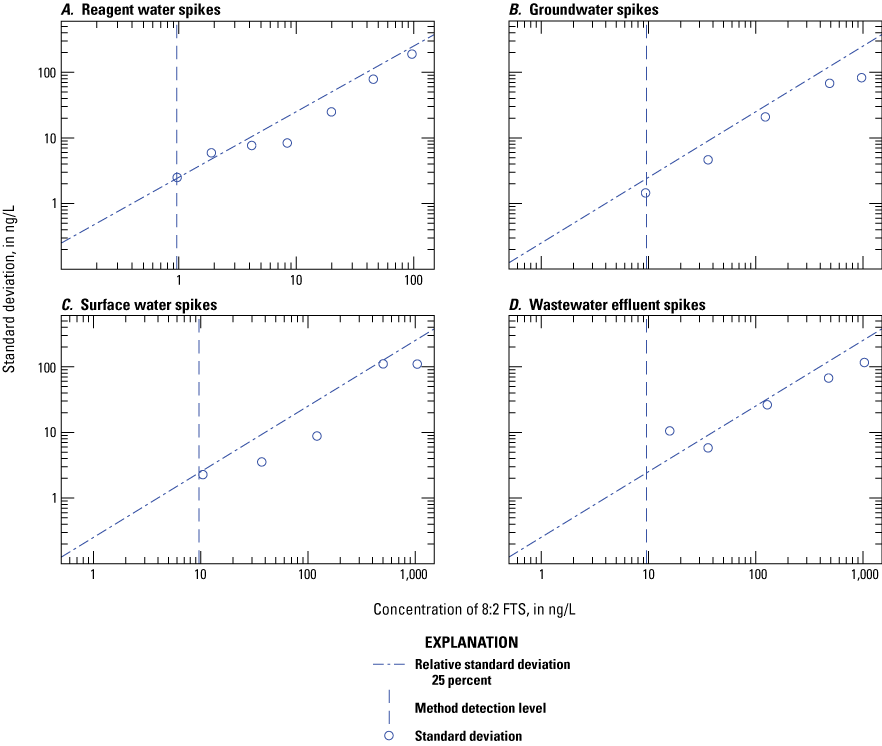
Graphs comparing the variability of measured 8:2 fluorotelomer sulfonate (8:2 FTS) concentration at different spike levels in A, reagent water; B, groundwater; C, surface water; and D, wastewater effluent. (ng/L, nanograms per liter)
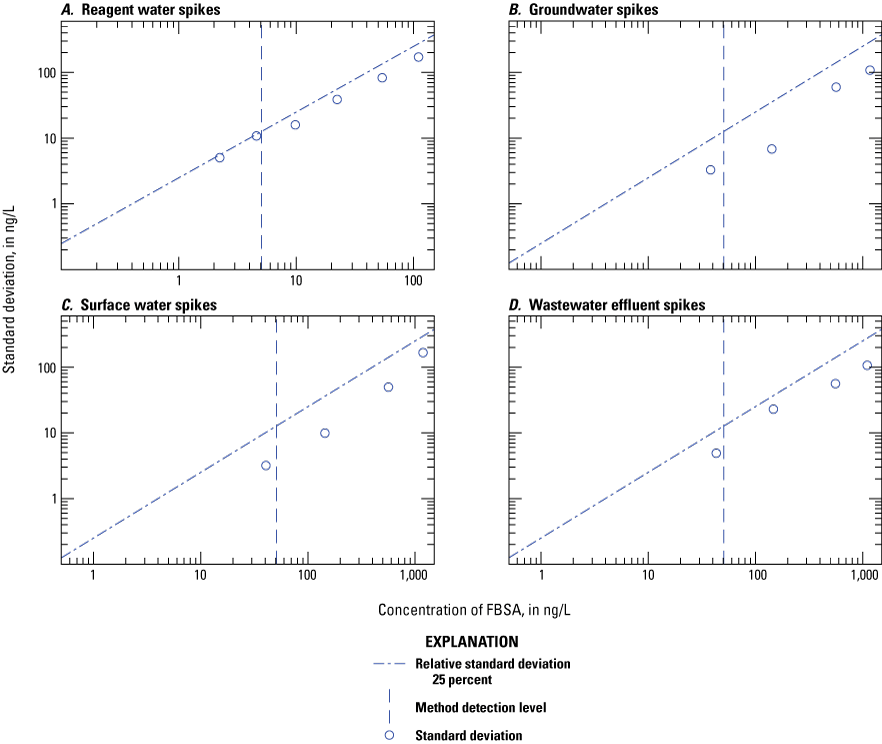
Graphs comparing the variability of measured perfluorobutanesulfonamide (FBSA) concentration at different spike levels in A, reagent water; B, groundwater; C, surface water; and D, wastewater effluent. (ng/L, nanograms per liter)
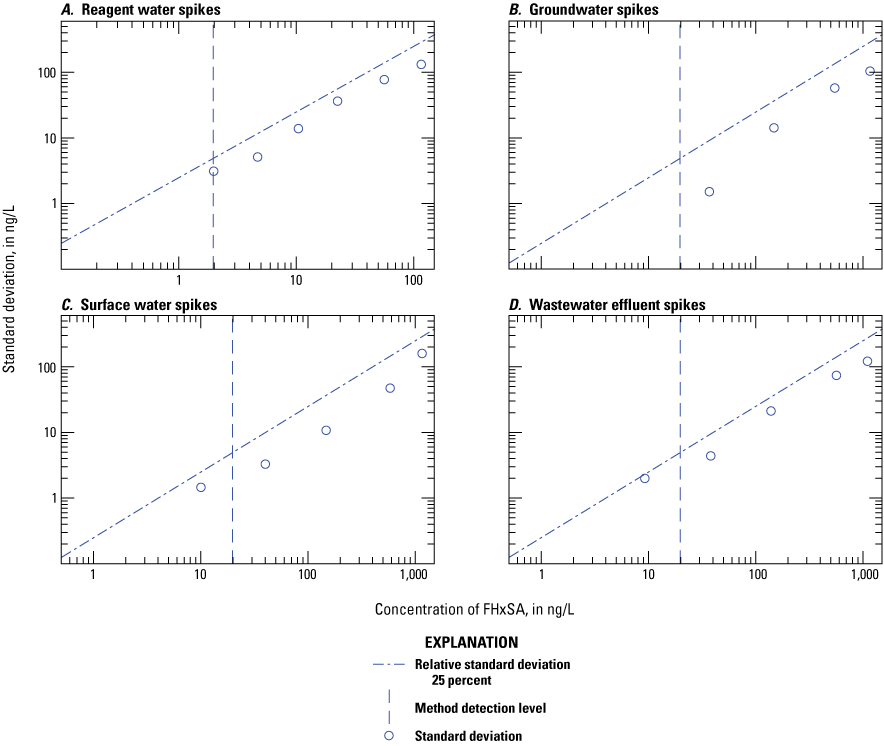
Graphs comparing the variability of measured perfluorohexanesulfonamide (FHxSA) concentration at different spike levels in A, reagent water; B, groundwater; C, surface water; and D, wastewater effluent. (ng/L, nanograms per liter)
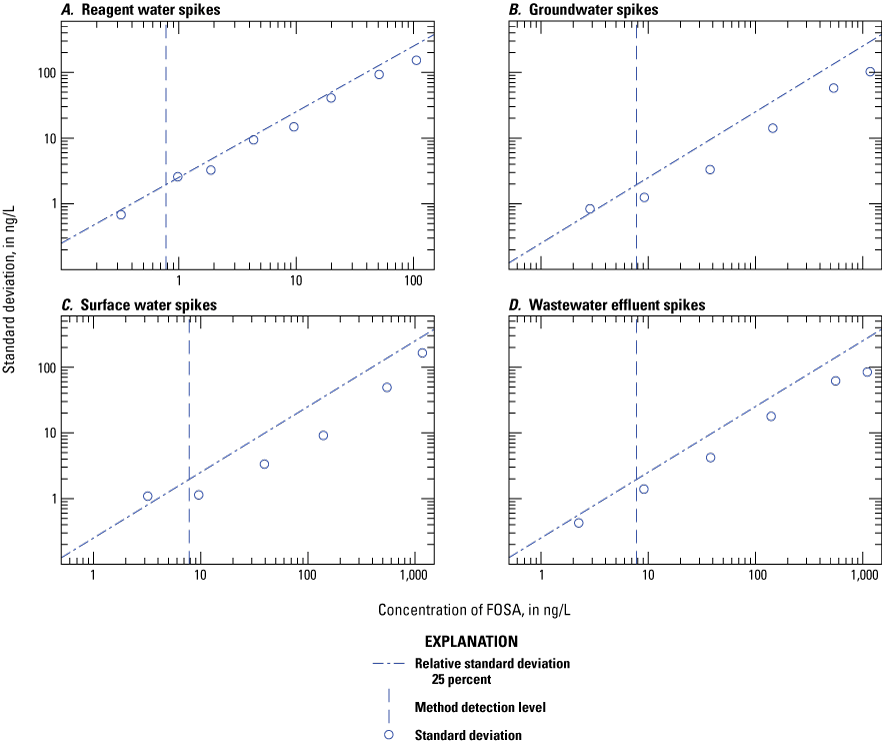
Graphs comparing the variability of measured perfluorooctanesulfonamide (FOSA) concentration at different spike levels in A, reagent water; B, groundwater; C, surface water; and D, wastewater effluent. (ng/L, nanograms per liter)
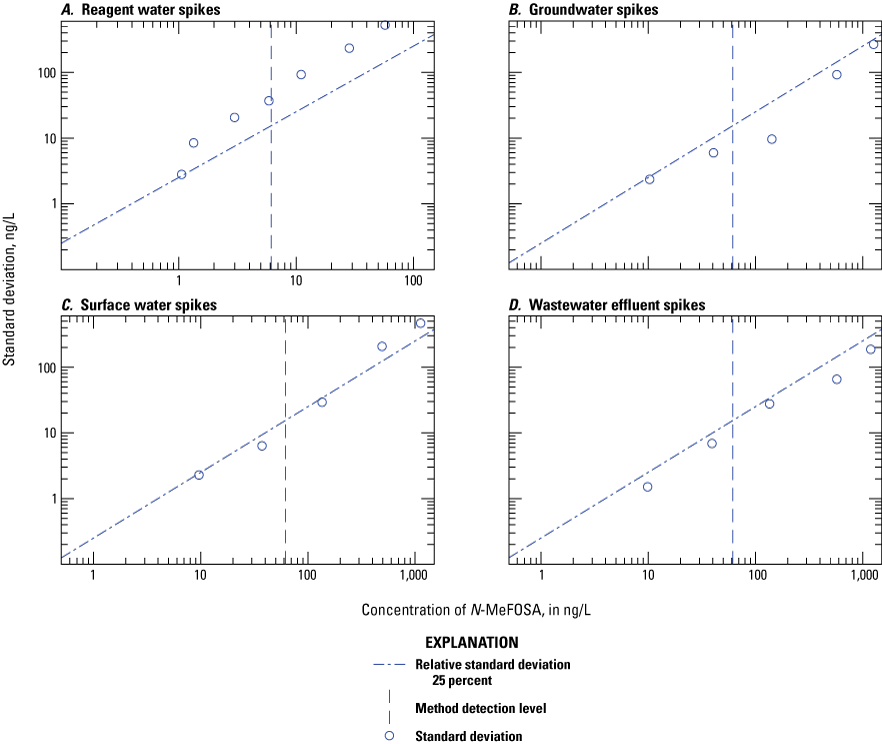
Graphs comparing the variability of measured N-methylperfluorooctanesulfonamide (N-MeFOSA-M) concentration at different spike levels in A, reagent water; B, groundwater; C, surface water; and D, wastewater effluent. (ng/L, nanograms per liter)
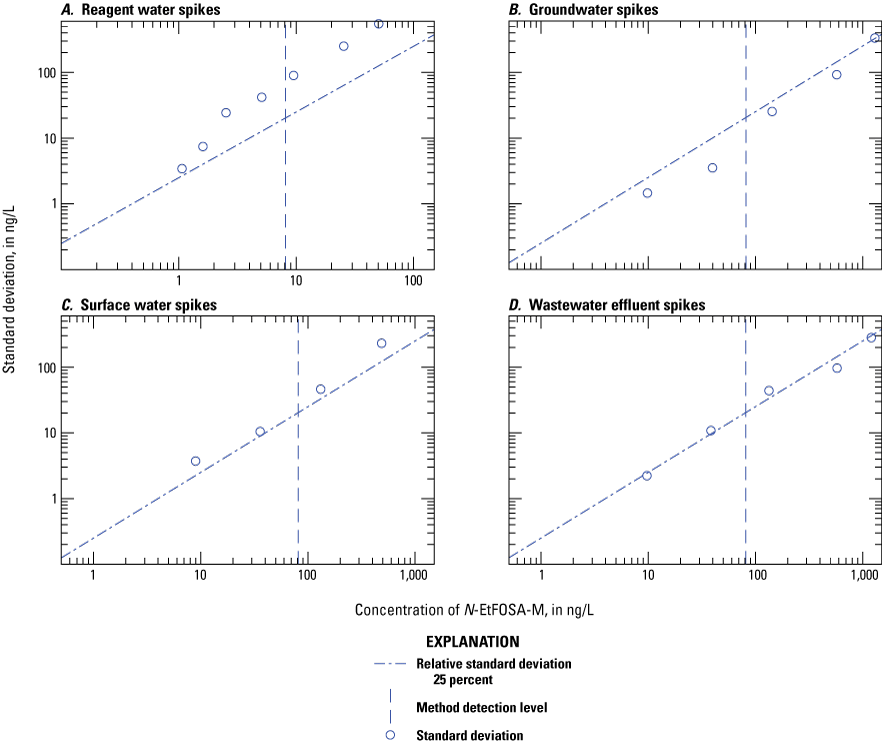
Graphs comparing the variability of measured N-ethylperfluorooctanesulfonamide (N-EtFOSA-M) concentration at different spike levels in A, reagent water; B, groundwater; C, surface water; and D, wastewater effluent. (ng/L, nanograms per liter)
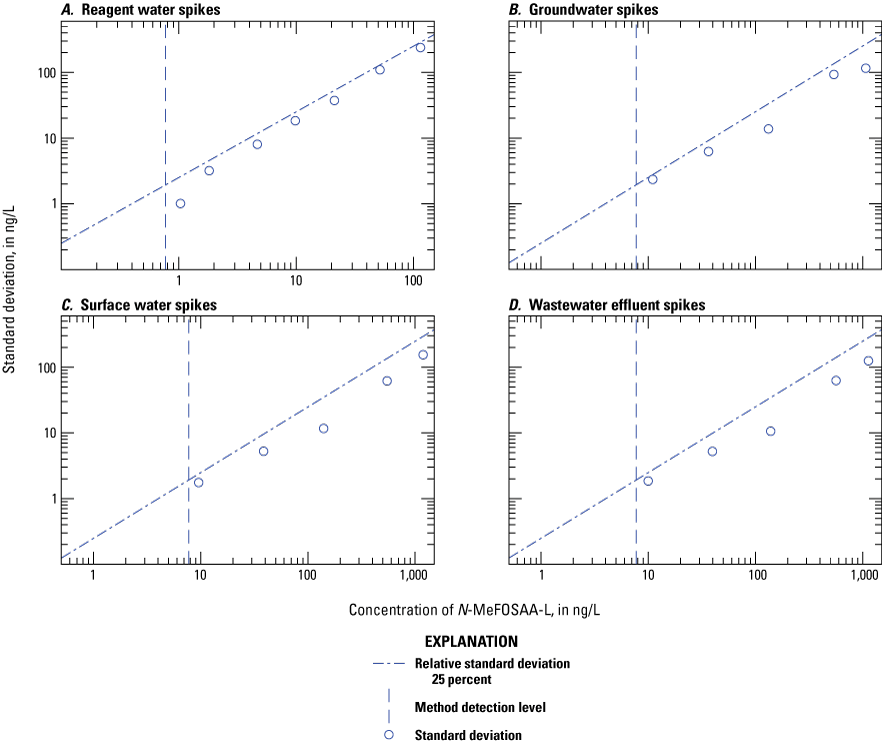
Graphs comparing the variability of measured linear N-methylperfluorooctanesulfonamido acetate (N-MeFOSAA-L) concentration at different spike levels in A, reagent water; B, groundwater; C, surface water; and D, wastewater effluent. (ng/L, nanograms per liter)
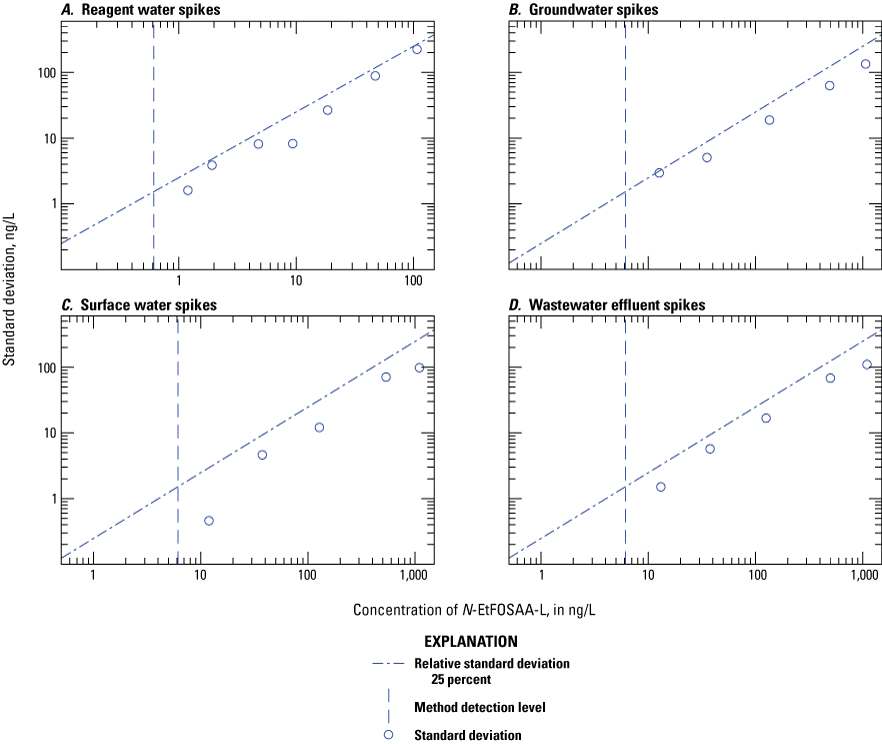
Graphs comparing the variability of measured linear N-ethylperfluorooctanesulfonamido acetate (N-EtFOSAA-L) concentration at different spike levels in A, reagent water; B, groundwater; C, surface water; and D, wastewater effluent. (ng/L, nanograms per liter)
Conversion Factors
Temperature in degrees Celsius (°C) may be converted to degrees Fahrenheit (°F) as follows:
°F = (1.8 × °C) + 32.
Temperature in degrees Fahrenheit (°F) may be converted to degrees Celsius (°C) as follows:
°C = (°F – 32) / 1.8.
The following abbreviations are also used in this report: millimoles per liter (mmol/L); nanograms per liter (ng/L).
Supplemental Information
Concentrations of chemical compounds in water are given in either milligrams per liter (mg/L) or micrograms per liter (μg/L).
Abbreviations
cat. no.
catalog number
CCB
continuing calibration verification blank
CCV
continuing calibration verification
DI
direct injection
DQO
data-quality objective
E
estimated
EPA
U.S. Environmental Protection Agency
EU
European Union
GW
groundwater
HDPE
high-density polyethylene
HPLC
high-performance liquid chromatography
IDQ
isotope-dilution quantification
IDS
isotope-dilution standard
IIS
injection internal standard
ITRC
Interstate Technology Regulatory Council
Lc
Currie’s critical level
LC
laboratory code
LC/MS/MS
liquid chromatography/tandem mass spectrometry
LMS
laboratory matrix spike
LOQ
limit of quantification
LRL
laboratory reporting level
MDL
method detection level
MRM
multiple-reaction monitoring
NWIS
National Water Information System
NWQL
National Water Quality Laboratory
ppt
parts per trillion
q
qualifying ion
Q
quantification ion
QC
quality control
QIR
qualifier ion ratio
RL
reporting level
RRT
relative retention time
RSD
relative standard deviation
RT
retention time
RW
reagent water
RWS
laboratory reagent water spike
SAQ
standard addition quantification
SD
standard deviation
SNR
signal-to-noise ratio
SPE
solid-phase extraction
SW
surface water
TPC
third-party check
USGS
U.S. Geological Survey
WWE
wastewater effluent
WWTP
wastewater treatment plant
For more information concerning the research in this report, contact the
Chief, USGS National Water Quality Laboratory
Box 25585, Mail Stop 407
Denver, CO 80225-0585
(303) 236-2000
Or visit the National Water Quality Laboratory website at https://www.usgs.gov/labs/national-water-quality-laboratory
Publishing support provided by the Science Publishing Network,
Denver Publishing Service Center
Disclaimers
Any use of trade, firm, or product names is for descriptive purposes only and does not imply endorsement by the U.S. Government.
Although this information product, for the most part, is in the public domain, it also may contain copyrighted materials as noted in the text. Permission to reproduce copyrighted items must be secured from the copyright owner.
Suggested Citation
Gray, J.L., Kanagy, L.K., Kanagy, C.J., and Anderson, C.A., 2025, Determination of per- and polyfluoroalkyl substances in water by direct injection of matrix-modified centrifuge supernatant and liquid chromatography/tandem mass spectrometry with isotope dilution: U.S. Geological Survey Techniques and Methods, book 5, chap. B13, 121 p., https://doi.org/10.3133/tm5B13.
ISSN: 2328-7055 (online)
| Publication type | Report |
|---|---|
| Publication Subtype | USGS Numbered Series |
| Title | Determination of per- and polyfluoroalkyl substances in water by direct injection of matrix-modified centrifuge supernatant and liquid chromatography/tandem mass spectrometry with isotope dilution |
| Series title | Techniques and Methods |
| Series number | 5-B13 |
| DOI | 10.3133/tm5B13 |
| Publication Date | July 09, 2025 |
| Year Published | 2025 |
| Language | English |
| Publisher | U.S. Geological Survey |
| Publisher location | Reston VA |
| Contributing office(s) | WMA - Laboratory & Analytical Services Division |
| Description | Report: xii, 121 p.; Data Release |
| Online Only (Y/N) | Y |