Scientific Investigations Report 2005-5255
U.S. GEOLOGICAL SURVEY
Scientific Investigations Report 2005-5255
Various techniques have previously been used at a number of sites throughout the lower Nooksack River basin to identify locations where ground water discharges directly to streams. Aerial images generated from Forward Looking Infra-Red (FLIR) videography have been used along portions of the mainstem of the Nooksack River as well as portions of the South Fork of the Nooksack River (Watershed Sciences, LLC, 2002). Synoptic low-flow discharge measurements, or seepage runs, have been used along Fishtrap and Bertrand Creeks to identify locations of ground-water discharges and quantify the amount of water either gained or lost by the streams (R.A. Kimbrough, U.S. Geological Survey, written commun., 2002). These studies were used in the selection process to select sites where more detailed information on ground water/surface water interactions would be collected.
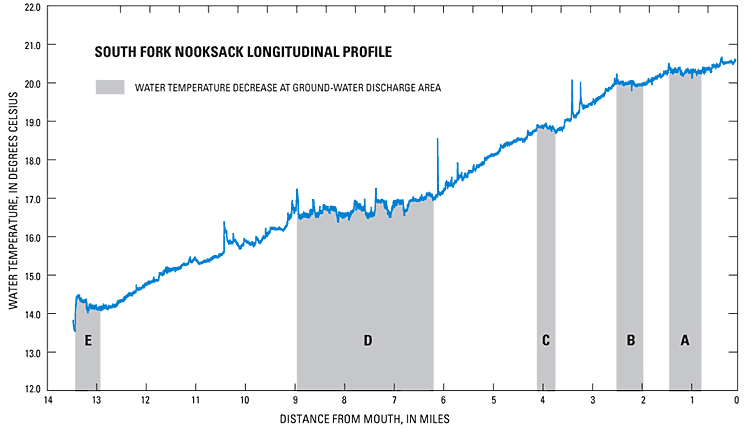
To identify specific locations of discharging ground water, a longitudinal survey of surface-water temperatures near the riverbed was conducted on the 14-mile reach of the South Fork Nooksack River between the Skookum Creek Fish Hatchery and the confluence with the North Fork of the Nooksack River (fig. 1). River-water temperatures typically show a diurnal pattern of steadily increasing temperatures during the day as solar energy is adsorbed followed by nightly cooling. In the longitudinal survey, stream reaches where the rate of water temperature increase is substantially smaller than the average or where decreasing temperature trends are measured are interpolated as springs or seeps where cooler ground-water discharge is occurring.
The longitudinal thermal profile survey was conducted between 9:00 a.m. and 4:00 p.m. on August 28, 2003, during the rising limb of the river’s diurnal temperature cycle. The recorded water temperature near the streambed ranged from about 14°C at the upstream location near Skookum Creek to 20.6°C at the confluence near Deming (fig. 1). Localized temperature variations could be seen in some of the larger deep pools where the river bottom was more insulated from solar radiation, in very shallow areas where solar radiation was sufficient to warm slow moving water, and in areas where riparian cover provided shade during the hottest times of the day. However, these localized variations generally were small due to the amount of mixing caused by turbulence in a flowing river environment and did not adversely affect the water temperature survey.
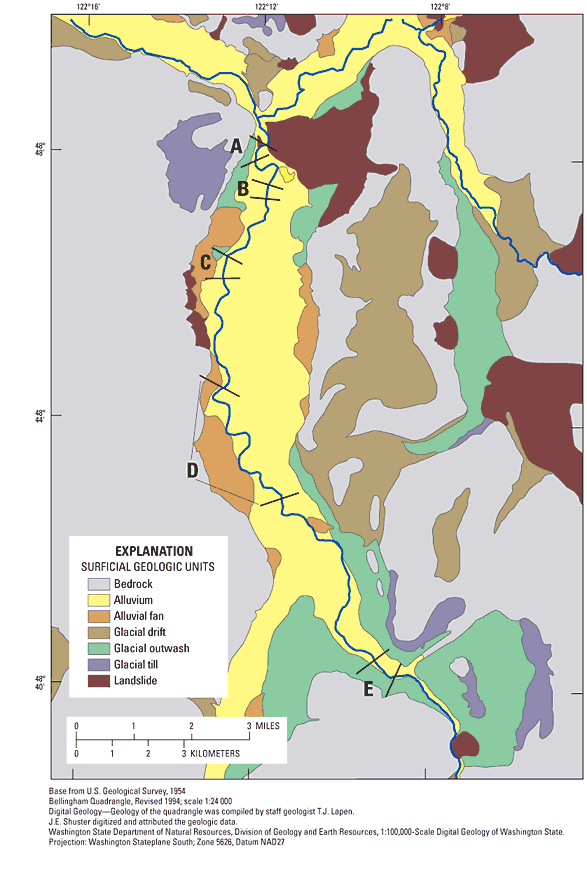
The longitudinal thermal profile clearly shows five reaches (A, B, C, D, and E) (fig. 4) where river temperatures depart from the diurnal warming trend suggesting the input of cooler ground water. Four of these reaches were adjacent to sedimentary geological deposits that are characteristically permeable and may be locally significant aquifers (fig. 5). Permeable glacial outwash is adjacent to reach E, where water temperatures decreased substantially throughout the reach. Permeable alluvial-fan deposits were adjacent to reach D where water temperatures remained cool over a relatively long distance and to reach C where a distinct cooling trend was observed. Reach B is immediately adjacent to a deposit of recent valley alluvium and reach A is adjacent to a large landslide deposit.
Although recent valley alluvium typically is composed of fine-grained sediments that are poorly transmissive and do not allow water to flow easily through them, these deposits are often of limited thickness. In this setting, permeable glacial outwash, that is highly transmissive, is adjacent to the alluvium on both sides of the river and likely occurs beneath the alluvium. The cooler stream water temperatures in reaches B and A likely are due to ground water discharging to the river from this glacial outwash deposit at the downstream end of the South Fork valley.
Ground water was discharging unevenly along the South Fork Nooksack River. Interpreted ground-water discharge areas appear to be adjacent to geologic deposits that may contain sufficient coarse-grained materials for aquifer formation. No sites along the South Fork Nooksack River were selected for detailed study of discharging ground water or further monitoring.
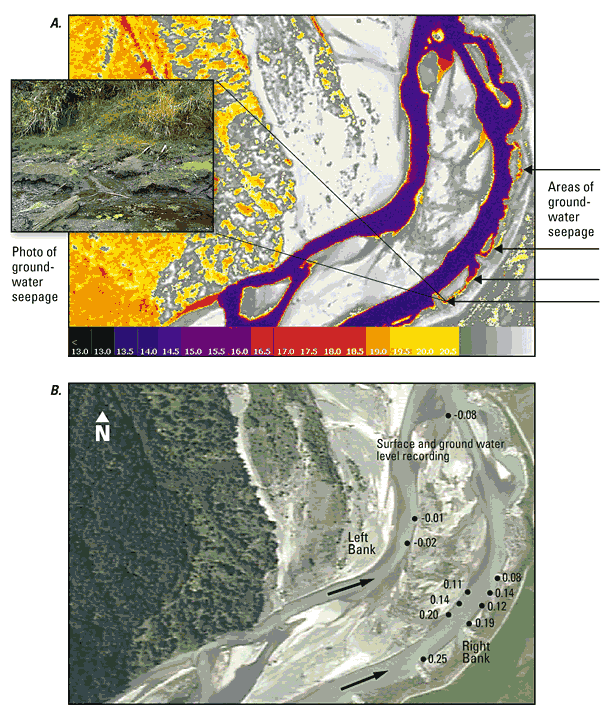
The FLIR images taken along the mainstem of the Nooksack River showed a number of locations along portions of the riverbank where cooler surface temperatures might indicate the locations of ground-water discharge (Watershed Sciences, LLC, 2002). At a site about 2 mi upstream of the town of Everson, the FLIR image showed cooler surface temperatures along the right bank of the Nooksack River (fig. 6). At this location, the river channel is divided into two channels separated by a gravel island partly covered with brushy vegetation estimated to be less than 5 years in age. The main flow of the river follows the west or left bank channel and a subordinate channel flows along the right bank of the river adjacent to agricultural pasture lands. Further reconnaissance of the site revealed ground-water seepage from the bluff beneath the adjacent pasture land.
At one location, ground-water seepage with estimated flow of 100 to 200 mL/min was observed flowing over the land surface and into the river (fig. 6 inset). Vertical hydraulic gradients between surface water and the underlying ground water were measured using a manometer board at 10 sites along the subordinate channel and at 4 sites on the west side of the island along the main river channel.
Specific conductance was used to help distinguish between ground water and surface water. Specific conductance was 88 µS/cm in water samples from the river and ranged from 241 to about 500 µS/cm in ground water from wells in the area adjacent to the riverbank (table 1, at back of report). Along the right bank channel and shoreline, the vertical hydraulic gradient was positive (or upward) ranging from 0.08 to 0.25 ft/ft during the manometer board survey. Specific conductance in ground water ranged from 207 to 247 µS/cm during the manometer board survey.
The largest vertical hydraulic gradient (0.25 ft/ft) was measured near the area where 100 to 200 mL/min ground-water seepage was observed flowing into the Nooksack River. The variation of vertical hydraulic gradients was more than an order of magnitude although the variation in specific conductance was much more limited. The larger variation in vertical hydraulic gradient compared to specific conductance is likely due to local variations in permeability of aquifer materials. The cooler temperatures observed in the FLIR image, the upward vertical hydraulic gradients observed in the manometer survey, and the limited variation in specific conductance of shallow ground water all indicate ground-water discharge (fig. 6) at this site.
On the west side of the gravel island along the right bank of the main channel, vertical hydraulic gradients in shallow ground water were negative (or downward). In addition, the specific conductance of water pumped from the piezometers ranged from 96 to 99 µS/cm, which was very similar to the specific conductance of surface water (88 to 89 µS/cm) indicating that river water was flowing downward into the streambed. The downward vertical gradients may represent flow within the rivers hyporheic system as a minor riffle was present about 300 ft downstream.
To evaluate temporal variations in ground-water discharge at this site, hourly measurements of surface-water levels of the Nooksack River and ground-water levels beneath the riverbed were recorded from November 2002 to October 2004 (fig. 7). A temporary surface-water gaging station was established on the east bank of the east channel near the center of the ground-water discharge area (fig. 6). The gaging station consisted of a water-level data logger installed in a pipe open to the Nooksack River although another data logger was installed in a nearby piezometer driven 6.5 ft below the streambed. Data from both data loggers are referenced to a common arbitrary reference datum so that water levels could be directly compared.
Surface-water levels measured in the Nooksack River ranged from 15.4 to 27.8 ft above the reference datum whereas ground-water levels beneath the riverbed ranged from 16.8 to 22.9 ft above the reference datum. The surface-water and ground-water hydrographs (fig. 7A) reveal very similar patterns in the rise and fall of water levels throughout most of the year although the range of variation for surface water was nearly twice as large as that of ground-water levels. Ground-water levels typically were 0.98 to 1.31 ft higher than surface-water levels indicating an upward vertical hydraulic gradient ranging from 0.17 to 0.22 ft/ft. However, during periods of very high river stage, surface-water levels often exceeded ground-water levels. During these brief periods of very high river stage, the vertical hydraulic gradient was downward, reaching values as low as -0.8 ft/ft as river water flowed through the streambed and into the underlying ground-water system or moved into bank storage. The downward vertical hydraulic gradients that occurred during high discharge events, were of short duration, lasting only a few hours. Positive (or upward) vertical gradients returned immediately or within a few hours after the flood crest had passed and surface-water levels declined below a stage of about 22 ft (fig. 7A). During the 16,800 hours of recorded data, a positive vertical hydraulic gradient, indicating discharging ground water, was recorded 98 percent of the time; the exceptions being brief periods of extreme high river flows.
Hydrostatic pressure effects resulting from river stage is the likely reason ground-water levels mimic surface-water levels, rising and declining roughly to the same extent while maintaining a head difference of 1.0 to 1.3 ft (fig. 7A). However, there appears to be an upper limit on the ability of ground-water levels to respond to river stage. At this site, that limit corresponds to a ground-water level between 21.3 and 21.7 ft. The extent that downward vertical hydraulic gradients are able to develop depends on how much higher surface-water levels rise above the 21.3 to 21.7 ft range.
Comparison of surface-water and ground-water temperatures confirms that ground-water discharge occurs throughout the year at the Nooksack River site (fig. 7B). Over the annual cycle, the temperature of ground water beneath the streambed of the Nooksack River remains constant to within a few degrees of the base-line temperature of about 10°C. Surface-water temperatures typically displayed daily and seasonal variations ranging from 3 to 10°C becoming larger during the summer months. If surface water is moving into the ground-water system through the streambed, then the temperature signal of shallow ground water beneath the river may show a similar seasonal and diurnal pattern of variation. The recorded ground-water temperatures at the Nooksack River site did not vary substantially from 10°C indicating that there was only very limited movement of surface water into ground water underlying the riverbed (fig. 7B). Short-duration perturbations of ground-water temperatures were measured during flood peaks when water levels in the river were sufficiently high to develop a negative vertical hydraulic gradient, thus allowing cold surface water to move into the underlying ground-water (fig. 7B).
Comparison of surface-water levels in the Nooksack River to ground-water levels beneath the riverbed and the adjacent uplands indicate that both respond similarly to changing hydrologic conditions at the site. Precipitation/runoff events within the drainage basin commonly generate sharp peaks on the surface-water hydrograph followed by more gradual water-level declines (fig. 7A). Similar patterns were observed in the ground-water hydrograph except that the peak ground-water elevations do not occur simultaneously. Peak ground-water levels typically occurred within a few hours of the peaks in the surface-water hydrograph, although in some cases, the peaks were as much as 14 hours apart, and on a few occasions apparently preceded peak surface-water elevations.
Ground-water levels in the aquifer beneath the adjacent field represented by the hydrograph for well ABS-480 (fig. 7C) show some similarity to water levels that were measured in the in-stream piezometer beneath the Nooksack River near Everson as lowest water levels recorded in both ground water sites occurred in the late summer to early autumn time frame. However, the range of water-level variation measured in well ABS-480 was about one-half of that measured in the in-stream piezometer beneath the Nooksack River near Everson and did not exhibit the surface-water response pattern measured in that piezometer (fig. 7A). Marked differences were observed in the ground-water temperature data from the two sites. Annual water temperature cycle of about 4°C was measured in well ABS-480 but not observed in the piezometer installed beneath the streambed of the Nooksack River where measured temperature variations were limited to about 1.1°C. The limited temperature variation measured in the in-stream piezometer beneath the Nooksack River near Everson is consistent with discharging ground water from deeper portions of the aquifer where water temperatures remain more constant than near the water table as in well ABS-480.
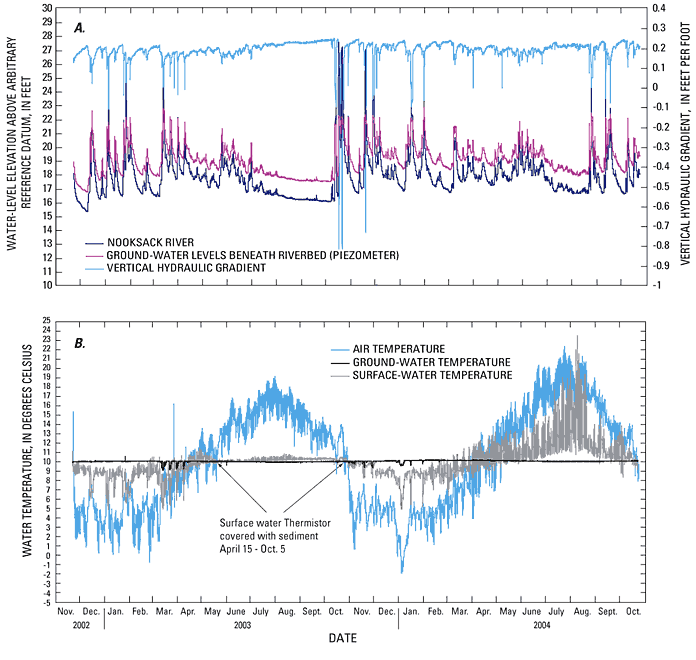
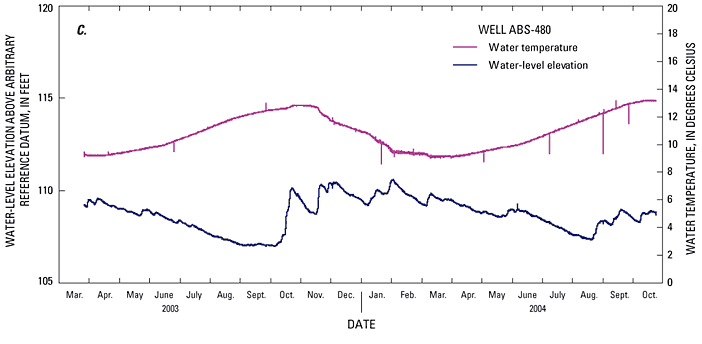
Figure 7. Continued.
Fishtrap Creek was included in this study because it is a primary stream draining an area of intense agricultural and urban land use, and because contamination by fecal coliform bacteria has been documented as a water-quality issue in this stream (Joy, 2000). In addition to discharging ground water, the creek is fed by tile drains and ditches that drain agricultural fields. Barnyard manure is sprayed seasonally on many of these fields to amend soil nutrients.
Reconnaissance investigations used a network of nine in-stream piezometers installed from the Canadian border to near the confluence with the Nooksack River (fig. 8). Continuous data were collected near one of the stations in the network (PZF-3) where data loggers were installed to collect hourly water-level and water-temperature data for surface water and ground water beneath the streambed. In addition, two transects of three piezometers each were installed perpendicular to the creek at the ground-water discharge study site near PZF-2.
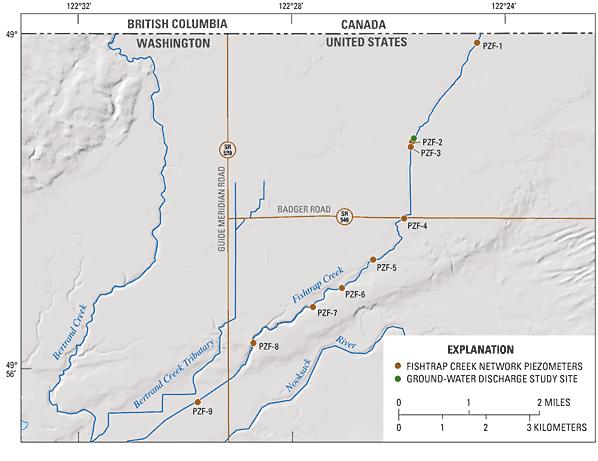
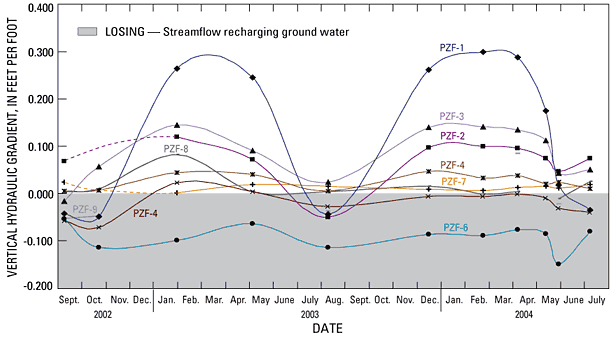
Vertical hydraulic gradients were measured along the network of in-stream piezometers every few months from September 2002 to June 2004. At most of the monitoring sites, the vertical hydraulic gradients varied seasonally and generally were upward indicating discharging ground water. The magnitude of the vertical hydraulic gradients typically were larger during the winter precipitation period from November to April and smaller from June to September during the summer and late autumn (fig. 9). The direction of water flow changed seasonally in some piezometers (PZF-1, PZF-2). Vertical hydraulic gradients were positive during the wet winter months indicating upward flow of discharging ground water; however, vertical hydraulic gradients were negative during the late summer period indicating downward flow of surface water recharging the ground-water system. Seasonal variations in vertical hydraulic gradients were most pronounced in the upstream agricultural areas near the Canadian border (piezometers PZF-1, PZF-2, and PZF-3) and smallest in the downstream reaches from the town of Lynden to the mouth of the creek (piezometer PZF-9) (fig. 9). Vertical hydraulic gradients generally were upward during the study period at all piezometers except for PZF-6, where the vertical hydraulic gradient was consistently downward. Downward vertical gradients at this location may be related to the surrounding geography as this piezometer is near the break in slope where the Fishtrap Creek channel has eroded into the alluvial terrace of the Nooksack River and may not have incised to the level of the regional ground water table.
Locations of piezometers are shown in figure 8.
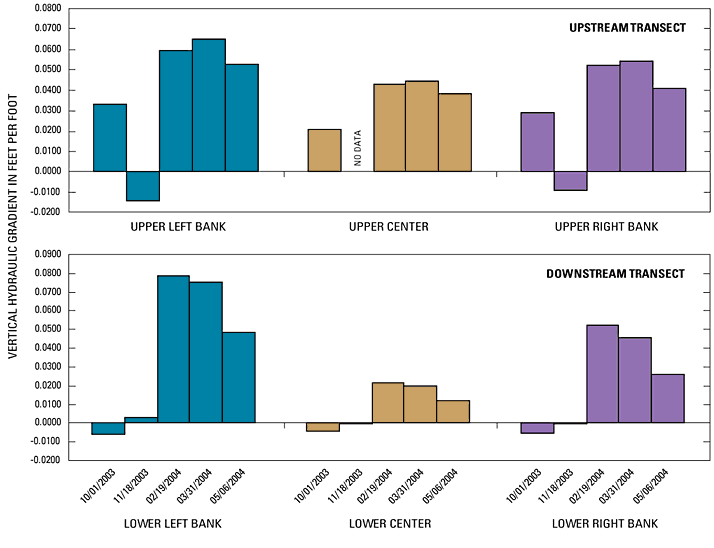
Vertical hydraulic gradients also were measured periodically in two perpendicular transects of piezometers installed near PZF-2 (fig. 10). Manometer board measurements taken intermittently from October 1, 2003, to May 6, 2004 indicate that vertical hydraulic gradients are more positive during February and March 2004 (fig. 10) consistent with the seasonal pattern exhibited in PZF-2, which was 30 ft downstream. The pattern of vertical hydraulic gradients near the stream channel suggests that ground-water flow is not symmetrical to the streambed at this location although the topography near this site generally is flat. Vertical hydraulic gradients were consistently lower at the center of the channel than either bank and gradients on the left bank generally were more positive than the right bank. These patterns suggest the potential for larger ground-water fluxes from the field southeast of the piezometer nest than fluxes from the northwest field, thus providing further evidence that source areas contributing ground-water discharge to streams can be variable at the field scale. Although most of the measured vertical hydraulic gradients were positive, indicating upward ground-water flow, brief periods of high streamflow appear to have induced downward flow in October 2003 at the downstream transect and in November 2003 at the upstream transect.
Hourly measurements of surface-water levels in Fishtrap Creek and ground-water levels in a piezometer installed to a depth of 5 ft beneath the streambed were recorded from April 2003 to August 2004 in order to evaluate temporal variations in ground-water discharge. When referenced to a common arbitrary datum, these data show that ground-water levels generally were higher than the water level in streams (fig. 11). Exceptions were noted during short-duration stream discharge events such as a storm on July 12 and 13, 2003, in which 2.2 in. of precipitation was recorded at a weather station 4 mi north of Fishtrap Creek. During this storm, the increase in hydraulic head monitored in the ground water began on July 12 at 9 p.m. while increased stage in Fishtrap Creek was not seen until 2 hours later at 11:00 p.m. However, the water level in Fishtrap Creek did eventually exceed the hydraulic head of the ground water resulting in a negative vertical hydraulic gradient for about 18 hours. Analysis of individual storm events indicates that surface-water and ground-water levels respond rapidly to precipitation events, and periods of negative vertical hydraulic gradients occur during peak streamflows, but typically are of short duration.
Vertical hydraulic gradients became less positive from early July to early September 2003, and during the same period in 2004, the vertical hydraulic gradient became negative from July 7 to September 12 (fig. 11). The water temperature record for this site confirms the downward flux of warm surface water during late summer 2004. The temperature record shows that surface water undergoes both diurnal and seasonal variations and ground water generally remains at a consistent 10°C throughout the year. However, during the late summer dry period of 2004, downward flow through the streambed caused a substantial increase in ground-water temperature at this site (fig. 11). Ground-water temperatures gradually returned to an ambient 10°C after the vertical hydraulic gradient returned to a positive value indicating upward flow in early September 2004.
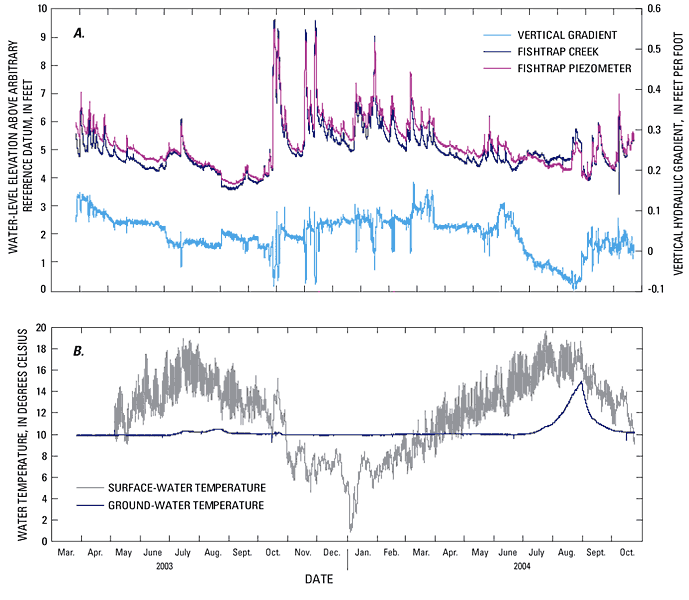
The negative vertical hydraulic gradient measured during the late summer of 2004 may be related to changing hydraulic conditions within the stream or the adjacent riparian corridor. The growth of vegetation within and adjacent to the creek channel increases substantially during the later one-half of the summer impeding streamflow and resulting in higher water levels within the stream channel. Irrigation return flows from tile drains also may help to sustain stream stages as ground-water levels continue to decline during the dry season. Either of these factors could combine to cause negative vertical hydraulic gradients during late summer.
The effects of an artificial increase in stream stage were observed during a site visit to piezometer PZF-2 in August 2004. Woody debris had accumulated on a small constriction just downstream of a network piezometer, possibly placed there by beaver or other animals. The manometer board measurement made before removal of the debris indicated a negative (downward) vertical hydraulic gradient. Following the removal of the debris, the pool elevation in the creek declined 4.3 in. then stabilized. Repeat measurements of the vertical hydraulic gradient indicated a positive value as did a follow-up measurement the next day. This condition may explain some of the variation in the measurements of vertical hydraulic gradient shown in the piezometer transect near PZF-2 in figure 10. Thus, local site conditions can be important when interpreting hydraulic gradient data.
Fourmile Creek was selected as a ground-water discharge study site because it is a low order stream draining an area of intense agricultural production. Fourmile Creek originates from Green Lake and surrounding wetlands (fig. 1) where it flows generally west to join Tenmile Creek just west of the Guide Meridian, which in turn flows into the Nooksack River near Ferndale. Like Fishtrap Creek to the north, the ground-water discharge study site is in an agricultural area subject to manure applications and where tile drains have been used to artificially drain fields. Initial installation of monitoring equipment was disrupted by dredging of the stream channel during autumn 2003. About 3 ft of organic sediments were removed from the channel exposing fine to medium sand in the streambed. The water table in the area was measured at depths of about 2 to 5 ft below the land surface, close enough to the surface to require tile drains for artificial drainage to lower the water-level elevation in order to prepare for planting crops in the spring.
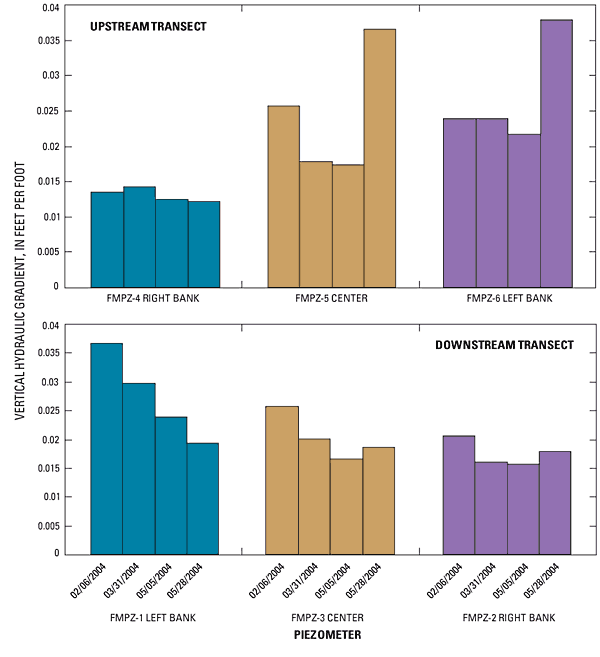
Two transects of three piezometers each were installed perpendicular to the creek at the ground-water discharge study site on Fourmile Creek. Vertical hydraulic gradients were measured in each piezometer with a manometer board four times from February through May 2004 (fig. 12). Vertical hydraulic gradients were consistently positive; however, at most sites, the positive gradient tended to become smaller from February through early May 2004. Precipitation in late May 2004 could have caused the anomalously positive values in the right bank and center of the upper transect and slightly more positive values in the center and left bank of the downstream transect (fig. 12). Vertical hydraulic gradients were consistently more positive on the right bank and progressively less positive toward the left bank suggesting that ground-water fluxes probably are higher on the northwest side of the creek at this site. Data from this site show both the spatial and temporal variability in surface water/ground-water interactions at a field scale. Such variations are likely due to heterogeneities within aquifer materials underlying the streambed, local topography, the placement of tile drains, or other factors. Precipitation also may influence localized ground-water discharge.
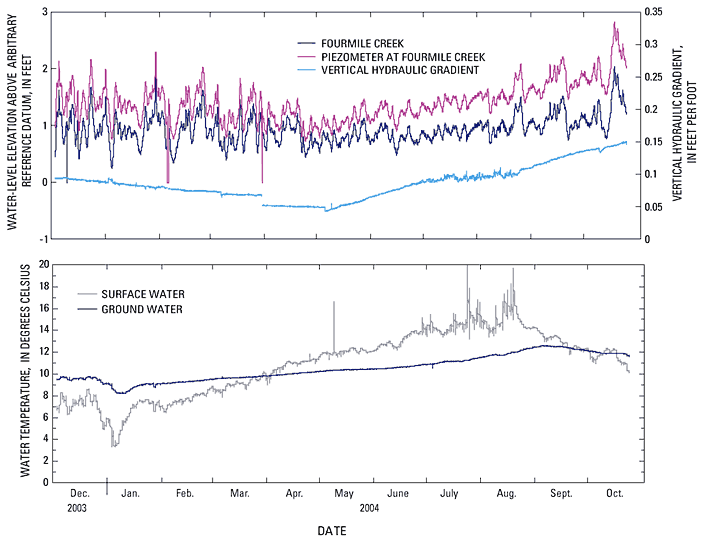
A temporary gaging station was established at the Fourmile Creek site and continuous water-level data were collected from December 2003 to October 2004 (fig. 13). Ground-water levels recorded in a piezometer installed to a depth of 5.4 ft below the streambed were consistently higher than surface-water levels throughout the study period indicating that gaining conditions predominate throughout the year.
Vertical hydraulic gradients were upward and generally were larger during winter and autumn than during the summer months. Ground-water temperatures were relatively constant throughout the study period, with a difference of 4.2°C between the coolest temperature in January and the warmest temperature in September (fig. 13). Surface-water temperatures at the Fourmile Creek site did not show as strong a diurnal signal as observed at other sites. Stream temperatures at this site may have been buffered by ground water discharging at a nearly constant temperature or influenced by riparian vegetation that create shaded conditions that were more common along Fourmile Creek than at other sites. The nearly identical response in ground-water levels and surface-water stage at this site may be due to the fact that the streambed is composed of well-sorted, un-compacted sand with a loose quicksand-like texture. The loose-open texture allowed unimpeded hydraulic connection between ground water and surface water resulting in little if any lag effect as precipitation and runoff events varied the flow in Fourmile Creek. The effect of dredging the stream channel appears to have enhanced the communication between surface water and the underlying aquifer and, in this case, increased the rate of ground-water discharge.
The Bertrand Creek ground-water discharge study site was selected to assess the impacts of agricultural practices on water quality at a field scale. The study site is actually located on a small drainage ditch that is tributary to Bertrand Creek. The ditch originates from and flows through fields in agricultural production, northwest of Lynden, Washington (fig. 1). The tributary flows through a manmade ditch that drains fields used primarily for hay and grass dairy feed. Manure was applied to fields using traditional spray methods on the east side of the ground-water discharge study site, and a newer injection method was used on the west side.
A temporary gaging station was installed adjacent to an in-stream piezometer in March 2003 and routine sampling and vertical hydraulic head was measured in September 2003. Continuous data loggers were installed in the tributary in December 2003 but the channel was dredged on February 14, 2004, and several months of continuous data were lost. The dredging removed accumulated mud and sediments in the channel and exposed sandy material on the streambed. In March 2004, the temporary gaging station was re-established and a new ground-water piezometer was installed to a depth of 6.5 ft beneath the streambed. Continuous data loggers were installed to collect hourly ground-water and surface-water levels, as well as, water-temperature data.
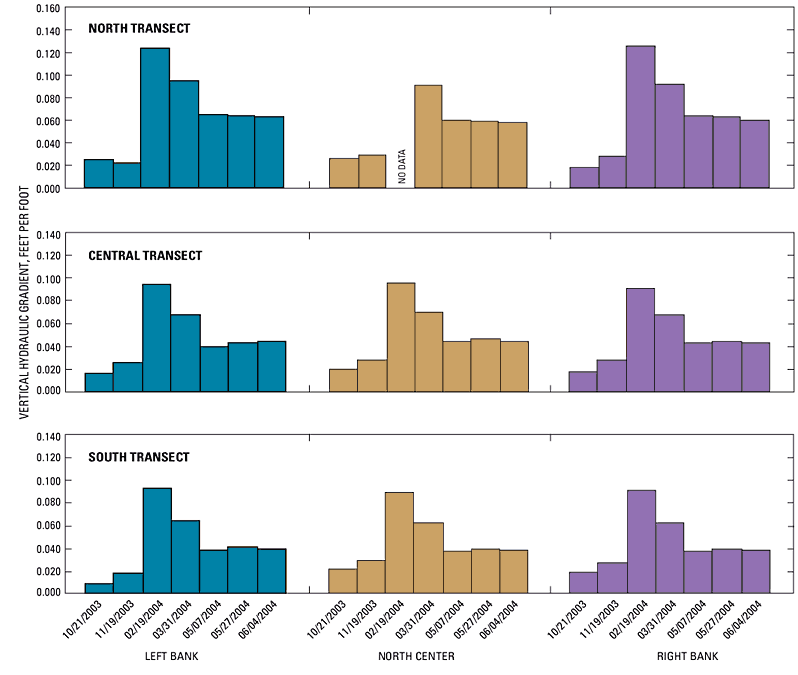
Three transects of three piezometers each were installed perpendicular to the drainage ditch at intervals of about 50 ft. The surface-water gaging station was installed at the center transect. Vertical hydraulic gradients were measured throughout the autumn and winter of 2003 and into the spring and summer of 2004 in each of the nine piezometers (fig. 14).
Vertical hydraulic gradients were most positive in February when winter precipitation was greatest. Gradients gradually became less positive through the spring and early summer and are assumed to continue to decrease until winter precipitation begins, typically after November. Although downward vertical hydraulic gradients were not measured during the period of study, downward flow could have occurred during the dry summer months. Vertical hydraulic gradients measured in the three piezometers that comprise a single transect generally were consistent. However, downward gradients in the north transect tended to be larger than at the central and south transects suggesting a small component of regional ground-water flow from north to south at the study site. The consistency of hydraulic gradient values across each transect suggests that aquifer conditions at this site possibly are more homogeneous than the other ground-water discharge study sites evaluated as part of this study. Thus, although ground-water discharge varies temporally at this site it does not appear to have a large spatial variation.
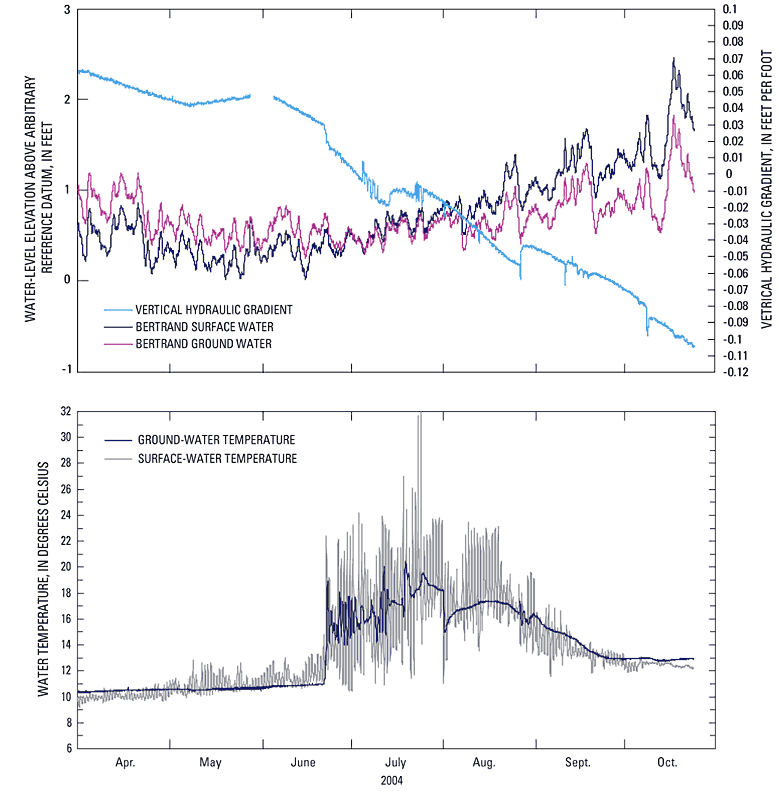
Continuous water-level and water-temperature data were collected at Bertrand Creek tributary site from March 30 to October 24, 2004 (fig. 15). Corrections had to be applied to the data to account for drift of the data logger instruments, so the accuracy of the stage data at this site is considered fair. A comparison of stream-stage and ground-water level data indicates that vertical hydraulic gradients were upward from April 2004 to late June 2004, at which time the gradient reversed and became downward. The reversal from upward to downward flow appears to have occurred around June 22, 2004, as indicated by a significant change in both stream and ground-water temperatures (fig. 15). Slow moving and very shallow surface water, no longer buffered by cooler ground-water discharge, was more strongly affected by atmospheric temperature variations. In addition, the warmer, downward moving surface water is indicated in the temperature data from the ground-water sensor at a depth of 6.5 ft below the streambed. Although downward vertical hydraulic gradients were recorded through October 2004, once winter rains begin to recharge the shallow aquifer, the hydraulic gradients were assumed to reverse once again to upward flow through the winter and following spring.
For more information about USGS activities in Washington, visit the USGS Washington Water Science Center home page .

![]() U.S. Department of the Interior |
U.S. Geological Survey
U.S. Department of the Interior |
U.S. Geological Survey
URL: https://
Page Contact Information:
Page Last Modified:
