Scientific Investigations Report 2005–5288
U.S. GEOLOGICAL SURVEY
Scientific Investigations Report 2005–5288
ET is the process in which water is evaporated and changes from a liquid to a vapor and discharged to the atmosphere. ET is the sum of direct evaporation of free water and transpiration by plants. Transpiration is the process whereby shallow ground water or water retained in the subsurface as soil moisture is adsorbed by plant roots, moves through the plant, and is evaporated from leaves to the atmosphere. ET in Carson Valley includes evaporation from bare soil, evaporation of precipitation and open water, and transpiration by plants. The source of water transpired by plants includes precipitation, applied irrigation water, soil moisture, and ground water. Estimates of daily, monthly, and annual ET rates presented in this report are for the total ET supplied by all these sources of water. Estimates of ET rates for the various plant communities in Carson Valley are useful for evaluating the effects of changes in land use and developing updated water budgets in Carson Valley.
Significant and measurable amounts of energy are required for water to be evaporated. Instrumentation used for this study measured components of the energy budget to solve an energy-budget equation and compute estimates of ET. The energy-budget equation partitions energy into four principal flux components: (1) net-solar radiation, (2) soil-heat flux, (3) sensible-heat flux, and (4) latent-heat flux. The energy-budget equation can be written as modified from Brutsaert (1982, p. 2):
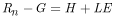 ,
(1)
,
(1)
where
 |
is the net-solar radiation, in energy per area per time, |
 |
is the soil-heat flux, in energy per area per time, |
 |
is the sensible-heat flux, in energy per area per time, and |
 |
is the latent-heat flux, in energy per area per time. |
Flux components that make up the energy budget are illustrated
in figure 5 with their typical daytime directions.
The primary source of heat energy is incoming solar radiation. The balance between
incoming and outgoing solar radiation at the surface of the Earth is called
net radiation (![]() ).
Net radiation is positive during the daytime when the incoming solar and long-wave
radiation exceeds outgoing radiation transmitted back to the atmosphere. Soil-heat
flux (
).
Net radiation is positive during the daytime when the incoming solar and long-wave
radiation exceeds outgoing radiation transmitted back to the atmosphere. Soil-heat
flux (![]() )
is the energy exchange through the soil and is considered positive during the
daytime when moving downward. Net radiation and soil-heat flux are measured
using net radiometers mounted above the plant canopy and heat-flux plates buried
0.2 ft beneath the soil surface. The energy difference between net radiation
and soil-heat flux is the energy available to drive the sensible-heat flux (
)
is the energy exchange through the soil and is considered positive during the
daytime when moving downward. Net radiation and soil-heat flux are measured
using net radiometers mounted above the plant canopy and heat-flux plates buried
0.2 ft beneath the soil surface. The energy difference between net radiation
and soil-heat flux is the energy available to drive the sensible-heat flux (![]() )
and latent-heat flux (
)
and latent-heat flux (![]() )
at the Earth’s surface. Sensible-heat flux is the amount of energy that heats
the air and is positive during the daytime. Latent-heat flux is the energy consumed
for ET and is positive when vapor is transferred upward. The directions of energy
movement reverse at nighttime when net radiation, soil-heat flux, and sensible-heat
flux become negative, and latent-heat flux is approximately zero.
)
at the Earth’s surface. Sensible-heat flux is the amount of energy that heats
the air and is positive during the daytime. Latent-heat flux is the energy consumed
for ET and is positive when vapor is transferred upward. The directions of energy
movement reverse at nighttime when net radiation, soil-heat flux, and sensible-heat
flux become negative, and latent-heat flux is approximately zero.
In this study, two standard methods were used to solve the energy-budget
equation and estimate ET, the Bowen-ratio method (Bowen, 1926), and the eddy-correlation
method (Swinbank, 1951). Details of the application of these methods are
given by Nichols (1992), Laczniak and others (1999), and Berger and others (2001).
The two methods require different types of instrumentation (fig.
5) to collect the micrometeorological data necessary to determine the flux
components of the energy budget near land surface. The energy budget is solved
for ![]() to obtain an estimate of the energy consumed by ET, which then can be converted
to the rate of ET.
to obtain an estimate of the energy consumed by ET, which then can be converted
to the rate of ET.
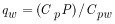
The Bowen-ratio method uses instrument stations with sensors
at two heights above the plant canopy to measure vertical differences in air
temperature and vapor pressure, along with sensors to measure net radiation
and soil-heat flux. The vertical differences in air temperature and vapor pressure
are used to approximate the ratio of ![]() to
to ![]() (known as the Bowen ratio). The measured difference between net radiation,
(known as the Bowen ratio). The measured difference between net radiation, ![]() ,
and soil-heat flux,
,
and soil-heat flux, ![]() ,
are then used with the Bowen ratio to solve the energy-budget equation (Bowen,
1926; Nichols, 1992; Laczniak and others, 1999; Berger and others, 2001). The
positions of the air-temperature and vapor-pressure sensors are reversed every
10 minutes to cancel any instrumentation bias and obtain 20-minute values for
ET computations. The Bowen-ratio instrumentation is capable of obtaining data
in adverse weather conditions. For this reason, along with instrument availability,
four Bowen-ratio stations were installed in spring 2003 and remained in operation,
except for periods of instrument malfunction, until autumn 2004 at sites ET-1,
ET-2, ET-3, and ET-8 (fig. 2, table
1).
,
are then used with the Bowen ratio to solve the energy-budget equation (Bowen,
1926; Nichols, 1992; Laczniak and others, 1999; Berger and others, 2001). The
positions of the air-temperature and vapor-pressure sensors are reversed every
10 minutes to cancel any instrumentation bias and obtain 20-minute values for
ET computations. The Bowen-ratio instrumentation is capable of obtaining data
in adverse weather conditions. For this reason, along with instrument availability,
four Bowen-ratio stations were installed in spring 2003 and remained in operation,
except for periods of instrument malfunction, until autumn 2004 at sites ET-1,
ET-2, ET-3, and ET-8 (fig. 2, table
1).
The eddy-correlation method uses instrument stations with a sonic anemometer, a hygrometer, and a thermocouple (fig. 5) to measure rapid changes in vertical wind speed, vapor density, and temperature, respectively. The measurements of changes in vertical wind speed and air temperature are used to calculate sensible-heat flux. Measurements of changes in vertical wind speed and vapor density are used to calculate the energy consumed by ET (latent-heat flux). The instrumentation for the eddy-correlation method is much more susceptible to malfunction under rainy or windy conditions, but is relatively portable compared to the Bowen-ratio instrumentation. For these reasons, the eddy-correlation stations were not operated during winter and were moved between various types of plant communities at sites ET-4, ET-5, ET-6, and ET-7 (fig. 2, table 1). One-dimensional (1-D) sonic anemometers were used at eddy-correlation sites in 2003, but required frequent maintenance to minimize equipment malfunction. In 2004, a more robust three-dimensional (3-D) sonic anemometer was used to collect eddy-correlation data at sites ET-4 and ET-8 (fig. 2, table 1).
Estimates of ET rates were made at eight sites on and near the valley floor (fig. 2). The sites were selected to obtain estimates for the major types of vegetation present in Carson Valley: native phreatophytes (plants that use ground water) such as rabbitbrush and greasewood; native nonphreatophytes such as bitterbrush and sagebrush that cover alluvial fans on the western side of Carson Valley; and irrigated crops such as alfalfa and pasture grasses. ET from low-lying and sparse sagebrush communities covering large areas on the northern and eastern sides of Carson Valley was not measured because such plants do not tap the water table, and recharge from precipitation was estimated from soil-chloride profiles in those areas. Depth to water is known to vary beneath areas of irrigated crops, thus, instrumentation sites for irrigated crops were selected in areas having different depths to water because this has been shown to affect ET rates (Nichols, 2000, p. 9). The exact placement of instrumentation sites was limited to locations where permission to install the equipment could be obtained. Although fairly large areas of crops on the eastern side of Carson Valley are irrigated with sprinkler systems, permission to install in sprinkler-irrigated areas was not obtained and only flood-irrigated areas were instrumented.
The instrumentation used at each site and the type of vegetation are shown in figures 6A–6H. Long-term Bowen-ratio stations were installed at one site with native vegetation (site ET-1) and at three sites on agricultural land (sites ET-2, ET-3, and ET-8). The four long-term Bowen-ratio sites were: (1) ET-1 in a stand of rabbitbrush, sagebrush, greasewood, and mixed grasses where the water table was 3–5 ft below land surface on the northern end of the valley; (2) ET-2 in a flood-irrigated alfalfa field where the water table was 3–6 ft below land surface; (3) ET-3 in a flood-irrigated field of pasture grass where the water table was 2–5 ft below land surface; and (4) ET-8 in a flood-irrigated field of pasture grass where the water table was 0–2 ft below land surface. At site ET-8, land surface often was saturated during site visits and the local rancher used the term “subirrigated” for the pasture even though it routinely was flood irrigated. Plant density at site ET-1 was estimated to be 73 percent and essentially was 100 percent at the pasture and alfalfa sites. The Bowen-ratio stations obtained continuous record except for relatively short periods when equipment malfunctioned due to failed exchange mechanisms for the temperature and relative-humidity sensors, damage from cattle that breached the fenced enclosure at site ET-3, and a fire at site ET-8.
Two 1-D eddy-correlation stations at sites ET-7 and ET-5 were installed in 2003 and operated for periods of 3–5 months to obtain data from different vegetation communities (fig. 2, table 1). Site ET-7 was operated from mid-May to November 2003 in a stand of bitterbrush (5–7 ft tall), sagebrush, and mixed grasses where the water table was about 60 ft below land surface. Plant density at site ET-7 was estimated to be 35 percent. Site ET-5 was operated from early August through October 2003 in a flood-irrigated alfalfa field where the water table was about 40 ft below land surface. At sites ET-5 and ET-7, the water table likely is below the reach of plant roots; thus, ground water probably is not consumed by transpiration at these sites.
In 2004, a 1-D and a 3-D eddy-correlation station were colocated with the Bowen-ratio station at site ET-8 from early April through May to obtain data with which to compare ET estimates from the three types of stations. From April through October 2004, a 1-D eddy-correlation station was reestablished at site ET-5. In early June, the two eddy-correlation stations from site ET-8 were moved to sites ET-4 and ET-6 and operated through October and mid-October 2004, respectively. Site ET-4 is a flood-irrigated field of pasture grasses where the water table was 3–4 ft below land surface, and site ET-6 is a nonirrigated field of pasture grasses where the water table was 6–7 ft below land surface. Plant density at sites ET-4 and ET-6 essentially was 100 percent.
ET data were collected in Carson Valley from mid-April 2003 through early November 2004 (table 1). To provide an annual estimate of ET during water year 2004, two methods were used to estimate daily ET during periods of equipment malfunction or when the stations were being moved. The first method used equations developed by simple linear regression between measured daily net radiation and the corresponding natural log of daily ET at each site. In the regressions, daily net radiation was the independent variable and natural log of daily ET was the dependent variable (fig. 7). The equations were used to generate daily ET estimates from Bowen-ratio stations at sites ET-1 and ET-8 (January 2004) where net radiation was available, but measurements of one or more flux components were missing because of equipment failure.
The second method to estimate daily ET was used for Bowen-ratio sites ET-2, ET-3, and ET-8 when net radiation was not available, and for all eddy-correlation sites ET-4–ET-7. This method used equations developed by simple linear regression between measured daily net radiation at each site and the average of daily net radiation recorded at all functioning ET stations in Carson Valley. In the regressions, measured daily net radiation was the dependent variable, average daily net radiation was the independent variable, and the equations are in the form of a linear function (fig. 8). The equations shown in figure 8 were used to estimate daily net radiation for periods of equipment malfunction and when the eddy-correlation stations were moved. The estimates of daily net radiation were then used with equations from figure 7 to estimate daily ET. In this report, daily ET estimates calculated using both methods are called predicted daily ET values.
The coefficient of determination (R2) for equations in figure 7 are measures of the amount of variance in the data explained by the regression and range from 77 to 88 percent for the Bowen-ratio sites and from 54 to 73 percent for the eddy-correlation sites. R2 for equations, in figure 8, ranges from 96 to 97 percent for the Bowen-ratio sites and from 79 to 98 percent for the eddy-correlation sites. A natural-log transformation of ET was necessary because the variance in daily ET increases as net radiation increases. Variations in the natural log of daily ET generally are explained reasonably well by variations in daily net radiation. Residual plots for all sites, except site ET-8, indicate that the residuals are distributed randomly and show no distinct patterns (fig. 9). The residual plot for site ET-8 exhibits a typical ‘horn’ pattern signifying heteroscedasticity or nonconstant variance (Helsel and Hirsch, 1992, p. 231). Bias that may be associated with application of the equation for site ET-8 is negligible because of the very short periods of predicted ET estimates (fig. 10A).
The two methods provided reasonable values of daily ET for periods of missing data (no large increases or decreases in predicted values compared to measured values) at all sites except during winter months at site ET-5 on irrigated alfalfa. Predicted daily ET at site ET-5 during winter months was unreasonably high. For this reason, average daily ET rates measured at the other alfalfa site, ET-2, were substituted for each month with missing data at site ET-5 (November 2003–April 2004) to obtain estimates of daily ET for water year 2004 (appendix A). The substitution of values from site ET-2 during winter months had little effect on estimates of the total annual ET at site ET-5, because ET rates were low during winter compared to summer. Daily rates of estimated and predicted ET for all sites are listed in appendix A.
Daily and monthly ET computed for the sites are listed in appendix A. Plots of daily estimated and predicted ET from April 2003 through November 2004 are shown in figure 10. To obtain the annual ET estimate for each site, the daily estimated and predicted ET was summed for water year 2004 (October 1, 2003–September 30, 2004; table 2).
The more complete data sets for the Bowen-ratio sites (fig. 10A) clearly indicate the seasonal variation in ET, with daily winter ET being less than 0.05 in. and daily summer ET being greater than 0.25 in. Variations in daily ET are caused by localized cloud cover and precipitation, and by the timing of irrigation and crop cuttings at the pasture and alfalfa sites (ET-2, ET-4, ET-5, and ET-8; fig. 10). The greatest daily ET, 0.35 in., was estimated at site ET-8 between irrigation applications in early June 2004.
Application of irrigation water and crop cuttings produces cyclic patterns in daily ET. These patterns are most pronounced at site ET-5, where the depth to water is about 40 ft below land surface and the only source of water for ET is applied irrigation water and precipitation (fig. 10B). Precipitation during the summer 2004 growing season near site ET-5 was 1.2 in. at Minden (National Climate Data Center, written commun., 2005). The average daily ET at site ET-5 for the 5 days prior to the June 8, 2004, crop cutting was 0.023 in. and averaged 0.08 in. for the following 5 days (fig. 10B, appendix A). Daily ET steadily increased following each cutting, with greater increases in daily ET following irrigation. In contrast, at sites ET-2, ET-4, and ET-8, where depth to water is about 5 ft or less, changes in daily ET resulting from irrigation and cuttings are much less pronounced (fig. 10A). At these sites, ET rates also decrease abruptly after cutting; however, ET recovers to precutting rates relatively rapidly because the shallow water table provides a constant source of readily available water. On average, about 7–10 in. of water is consumed by ET between crop cuttings.
ET from native vegetation and nonirrigated pasture sites is considerably less than ET from irrigated sites. The lowest annual ET in 2004, only 1.5 ft (table 2), was at site ET-7 in a stand of bitterbrush and sagebrush where the depth of water is about 60 ft. The annual ET for nonirrigated pasture at site ET-6 was slightly greater at 1.7 ft. Annual ET from rabbitbrush and greasewood at site ET-1 was 1.9 ft. During winter, daily ET rates at this native-vegetation site generally were greater than daily rates at cropland sites irrigated during summer. In comparison, annual ET from irrigated sites is close to 3.0 ft, except at site ET-8 where the annual ET was 4.4 ft. At site ET-8, the water table is 2 ft or less below land surface and ET likely was higher because of the shallow water table.
Estimates of ET made during this study are similar to most previous estimates. Estimates of annual ET from stands of rabbitbrush and greasewood were 1.3 ft in Ruby Valley, Nev. (Berger and others, 2001, p. 16), and from 0.8 to 2.0 ft in Owens Valley, Calif. (Nichols, 2000, p. 7). Annual ET from irrigated crops, often called crop consumptive use, were estimated for Carson Valley by Ball (1970), Guitgens and Mahannah (1972), Spane (1977), Pennington (1980), and Maurer (1986). Pennington (1980, p. 46–53) used meteorological data collected at three locations in Carson Valley, 1974–77. The data were used to evaluate seven different empirical methods developed by the Soil Conservation Service and to estimate crop-consumptive use ranging from 2.8 to 3.7 ft. Using methods similar to that of Pennington (1980), Guitgens and Mahannah (1972, p. 12) estimated potential ET rates to range from 2.9 to 4.9 ft for study plots on pasture grasses and alfalfa in 1972 and 1973, respectively; Spane (1977, p. 89 and 91) estimated annual rates ranging from 3.5 to 4.0 ft for 1973 and 1974, respectively; and Ball (1970, p. 41) estimated a rate of 2.5 ft. Maurer (1986, p. 42) estimated an annual rate of 3.5 ft for irrigated lands.
ET estimates for plant communities in Carson Valley may not be applicable to drier areas in Nevada. Pennington (1980) showed that crop-consumptive use increased in drier areas of Nevada from about 4.1 ft near Fallon to greater than 5.8 ft near Pahrump.
ET estimates made using data from Bowen-ratio stations generally are greater than estimates from eddy-correlation stations (Dugas and others, 1991, p. 13; Tomlinson, 1996, p. 55). A comparison of ET estimates using the Bowen-ratio and eddy-correlation methods from this study is available for the period when three stations were colocated at site ET-8 for 65 days from April to June 2004 (table 1; Tumbusch and Johnson, 2005). For periods of common data collection, ET estimates from the Bowen-ratio station were 11 to 15 percent greater than those from the eddy-correlation stations. Tumbusch and Johnson (2005) concluded that estimates from the Bowen-ratio station likely overestimated actual ET because the method did not account for energy lost as heat storage in irrigation water moving across the field. The field was irrigated four times during the 65-day period (fig. 10, table 1) and, if irrigation water was applied for about 2 days during each irrigation, surface water was present for about 8 days, or about 12 percent of the period of data collection. Thus, the presence of flood-irrigation water in the fields may account for the differences in the amount of ET estimated by the two methods.
Dugas and others (1991, p. 13) and Tomlinson (1996, p. 55) also showed that eddy-correlation ET estimates were less than the Bowen-ratio estimates, but with discrepancies of 20–30 percent between the two estimates. The study by Dugas and others (1991) was for irrigated wheat, whereas the study by Tomlinson (1996) was for grasslands. Contrary to results from this study, Dugas and others (1991, p. 16) concluded that ET values from the eddy-correlation stations likely underestimated the actual ET. Thus, it is not clear which ET estimate may be most representative of actual ET for the data collected in Carson Valley.
Weighing lysimeters may provide a more accurate measure of ET than micrometeorological methods if conditions within the lysimeters are representative of those outside the lysimeter. Tomlinson (1996, p. 34) reported that, when conditions in the lysimeters are representative of those outside the lysimeters, annual estimates of ET made using Bowen-ratio instruments were about 5 percent greater than those made using weighing lysimeters. Tomlinson (1995, p. 15) also analyzed the error of individual instruments used to calculate ET with micrometeorological methods and concluded that the cumulative error of all instruments may be about 12 percent.
For purposes of this study, estimates of ET from Bowen-ratio and eddy-correlation stations are assumed to be comparable and likely accurate to within about 12 percent of the actual ET for sites where measured daily ET is available for most of water year 2004 (sites ET-1, ET-2, ET-3, ET-5, and ET-8). For sites where daily ET was predicted for a large part of water year 2004 (sites ET-4, ET-6, and ET-7), the uncertainty was estimated from the 95-percent confidence interval for the daily values predicted by equations in figure 7. The uncertainty ranged from +30 to –20 percent for sites ET-4 and ET-6, and from +50 to –40 percent for site ET-7.
ET measured in water year 2004 may be less than what would be measured in a year with average, or above average precipitation. Water year 2004 was considerably drier than average, being the sixth consecutive year of a drought. Precipitation in 2004 at Minden was 5.5 in. (National Climate Data Center, written commun., 2005), almost 3 in., or 36 percent less than the 30-year average of 8.4 in. for 1971–2000 (fig. 4). In average or wet years, depth to water beneath the sites likely would be less than that in 2004. Because greater ET was measured at site ET-8 where the depth to water was less than at the other sites, the depth to water is an important factor controlling the ET rate.
For this study, recharge from precipitation on the northern and eastern sides of Carson Valley was estimated using soil-chloride data from test holes. The northern and eastern sides of Carson Valley lying above the valley floor cover a large area, about 90,000 acres (Maurer and others, 2004, p. 14). Because of the large area, recharge from precipitation in this part of the valley may be a significant component in the valley’s water budget. Additional work using other methods is underway currently (2005) to evaluate recharge from precipitation in other parts of the valley.
Concentration of chloride in pore water in the unsaturated zone (soils above the water table) has been used by many workers to estimate recharge in arid and semi-arid environments (Allison and Hughes, 1983; Scanlon, 1991; Phillips, 1994; Prudic, 1994; Prych, 1998; Stonestrom and others, 2003). Distribution of chloride in soil profiles develops as small quantities of chloride are deposited onto the land surface by precipitation (wet fall) and dust (dry fall), and move downward with infiltrating precipitation. As the water moves downward, it is partly lost to ET, and, assuming none discharges to streams, the remainder percolates to the water table as recharge. Chloride is not taken up through the roots of most plants and becomes concentrated by ET near the base of the root zone (Allison and others, 1994, p. 8).
Ideally, the steady-state profile of chloride concentration with depth will show concentrations increasing from land surface to a maximum concentration near the base of the root zone (Wood, 1999, p. 3). Beneath the point of maximum concentration but above the water table, chloride concentrations decrease to a relatively constant value that is related to the rate of recharge. In areas of active recharge, the chloride concentrations in pore water within the profile and at the peak are low, generally less than 100 mg/L. Whereas, in areas where most precipitation is discharged by ET and recharge is minimal, chloride concentrations are high, often exceeding 1,000 mg/L (Stonestrom and others, 2003, fig. 6; Scanlon, 2004, p. 245).
A fundamental assumption for using soil-chloride profiles to estimate recharge from precipitation is that precipitation is the only source of chloride to the pore water. Application of irrigation water or overland flow of precipitation onto or away from a site are potential sources of, or sinks for chloride. Such sources or sinks should be negligible for the method to provide realistic recharge estimates (Wood, 1999, p. 2). On the steeply sloping alluvial fans along the western side of Carson Valley, overland flow can take place during infrequent periods of intense rainfall, thus the method cannot be applied reasonably. On the valley floor, large volumes of surface water are used for flood irrigation. Although the method also can be used to calculate recharge rates of surface water applied for irrigation (Wood, 1999), the shallow depth to ground water beneath most of the valley floor and infiltration of surface water likely has flushed pore-water chloride into the ground water. For these reasons, estimates of recharge from precipitation using soil-chloride profiles on the western alluvial fans and on the valley floor where flood irrigation is applied were not attempted. On the northern and eastern sides of Carson Valley, numerous hills with relatively flat tops, and broad drainage divides between ephemeral watersheds provide locations where overland flow is negligible and the soil-chloride method may be applied.
Test holes were drilled at nine locations from which samples were collected and analyzed (fig. 2, table 3, appendix B). Locations for the test holes were selected at broad topographic divides and the flat tops of low-lying hills to provide a geographic distribution of data over the northern and eastern sides of the valley.
The holes were drilled using the ODEX hammer method with an Ingersoll Rand Th-75 drill rig (Hammermeister and others, 1985). Cores were collected every 2 ft using a 4-in. inside-diameter core barrel. The core barrel was 24 in. long with a 4-in. core tip and fitted with four 6-in. long aluminum sleeves. The core barrel was driven 2 ft by a percussive air hammer and removed from the test hole. Sleeves were extracted from the core barrel using a hydraulic ram and immediately capped and taped to retain the soil and in-situ soil moisture. Nominal 6-in. flush-thread ODEX casing was then driven to the bottom of the cored interval to hold the test hole open as drilling advanced. At some test holes, cores could not be obtained because of gravelly zones (appendix B). These zones were drilled using the ODEX casing and a percussive air hammer, and coring resumed once finer-grained sediments were encountered. When drilling reached about 30 ft below land surface, or when conditions prevented further drilling, the ODEX casing was removed from the test hole and the test hole was back-filled with native material.
The core samples were analyzed in the laboratory to determine gravimetric and volumetric water content and soil-bulk density using procedures from Donahue and others (1977). Soil-water extractions were collected from selected intervals for chloride analysis. The core samples were weighed in the lab prior to removal of caps and tape to determine the wet weight, then the caps and tape were removed and retained, and the core sleeve and sediment were oven dried at 125ºC for about 1 week. After drying, the core sleeve and sediment along with the original caps and tape were reweighed to determine the dry weight. Dry net weight was calculated as the dry weight minus the weight of the core sleeve, caps, and tape. Gravimetric water content was calculated as the difference between wet and dry weight, divided by the dry net weight. Soil-bulk density was calculated as the dry net weight divided by the volume of the core sleeve. Volumetric water content was calculated as the gravimetric water content multiplied by the soil-bulk density.
Core material was selected for extraction at about 1-ft intervals at each test hole. Soil-water extractions were obtained by mixing about 200 g of oven-dried sediment from selected cores with a similar weight of deionized water. Exact weights of sediment and water were measured to determine the water-to-soil ratio. The soil-water mixtures were shaken periodically for 48 hours, after which the supernatant liquid was decanted into a syringe. The syringe then was placed in a mechanical press and the supernatant liquid was filtered through a 0.45 microfilter into 20 mL glass vials. Replicate samples were collected for each extraction. Samples were analyzed for chloride concentration using an ion chromatograph in Menlo Park, Calif. (K.C. Akstin, U.S. Geological Survey, written commun., March 2004). Pore-water concentrations were calculated by multiplying the chloride concentration of the supernatant liquid by the water-to-soil ratio, dividing that by the gravimetric water content, and multiplying the result by the density of pore water (1 mg/cm3).
The rate of recharge was calculated from the chloride concentration in pore water below the root zone and above the water table, and the chloride concentration in precipitation (including wet fall and dry fall) using the equation from Allison and others (1985):
 ,
(2)
,
(2)
where
 |
is the recharge rate, in inches per year; |
 |
is the chloride concentration of precipitation, in milligrams per liter; |
 |
is the rate of precipitation, in inches per year; and |
 |
is the average chloride concentration of pore water below the root zone, in milligrams per liter. |
Important assumptions made in applying equation 2 are that (1) land surface is neither aggrading nor degrading; (2) atmospheric deposition is the only source of chloride and is constant through time; (3) chloride moves with water (negligible dispersion) steadily and uniformly downward; and (4) pore-water chloride concentrations below the root zone are in equilibrium with the chloride flux at land surface. In other words, there are no sources or sinks for chloride and chloride is not accumulating between land surface to depths below the root zone (Prudic, 1994, p. 10; Wood, 1999).
Assumption 1 is met because soil samples were collected from test holes drilled on the flat tops of topographic divides or hills where the land surface cannot aggrade and degradation is slow relative to the recharge process. Assumption 2 that chloride deposition occurs at a constant rate is seldom met in the real world. For example, precipitation is not constant through time. In Carson Valley, about 70 percent of the annual precipitation falls from November through March and only about 10 percent falls from July through September (Owenby and Ezell, 1992, p. 15). Chloride from dry-fall deposition accumulates on land surface during summer months and is incorporated into early winter precipitation (Dettinger, 1989, p. 60–61). This, coupled with ET during summer, likely causes a spike in the chloride concentration as the accumulated chloride infiltrates. Such a process could produce peaks in the chloride profile, followed by troughs as more dilute water enters the soil later in winter and early spring. Multiple peaks also could be caused by geologic heterogeneities or macropores that allow fast percolation rates through a small part of the sediments (Wood, 1999, p. 2).
The validity of assumptions 3 and 4 can be tested by plotting cumulative water content against cumulative chloride content. If assumptions 3 and 4 are valid, such plots should indicate relatively linear increases (Stonestrom and others, 2003, p. 14–15). For each depth interval sampled, cumulative chloride was calculated by summing the product of chloride concentration and water content, and cumulative water content was calculated by summing the volumetric water content. Values for individual samples were assumed to represent the entire interval defined by the midpoints between samples and the top or bottom of the holes.
Estimating recharge from precipitation using equation 2 requires estimates of annual precipitation at the data-collection sites. Annual precipitation at the data-collection sites was estimated based on their altitude using the following relation from Maurer and Halford (2004, p. 29):
Average annual precipitation, in inches = 0.0027 × altitude, in feet – 5.3646.
Vegetation in the area where soil-chloride test holes were drilled consists of low-lying and sparse sagebrush. Lithologic descriptions of soils penetrated by the test holes (appendix B) indicate that only sites CL-1 and CL-2 are comprised of unconsolidated sediments for the entire depth drilled. At the remaining sites, soils are semiconsolidated at depths ranging from 1.5 to 22 ft. Test-hole CL-5, near the crest of the Pine Nut Mountains, penetrated semiconsolidated sediments at 1.5 ft and weathered bedrock at 4.7 ft; drilling was suspended at a total depth of 12.5 ft. The semiconsolidated soils likely are Tertiary sediments exposed at land surface at sites CL-4, CL-6, and CL-7 and, based on the descriptions, present at shallow depths at sites CL-3, CL-5, CL-8, and CL-9 (fig. 3). The semiconsolidated sediments are relatively fine-grained consisting primarily of silt or clay with mixtures of sand and gravel except at test holes CL-7 and CL-9. At test hole CL-7, the semiconsolidated sediments are coarse grained to a depth of about 25 ft, and at test hole CL-9 become coarse grained at a depth of about 22 ft.
Plots of chloride concentration in pore water against depth below land surface (fig. 11) show chloride concentrations peak at 3–4 ft below land surface at sites CL-1, CL-2, and CL-5, whereas peaks at the remaining sites occur between depths of about 5 to 18 ft. The depth of the peak concentration indicates the depth to which plant roots likely extend at each site; chloride in pore water is concentrated by ET above the depths of the peaks. Peak concentrations are lowest at sites CL-1, CL-2, and CL-7, about 25, 140, and 260 mg/L, respectively, whereas peak concentrations at the remaining sites ranged from about 560 to almost 5,000 mg/L. Recharge rates in the Chihuahuan Desert in Texas approach zero for concentrations greater than about 100 mg/L (Scanlon, 2004, p. 245). Thus, high chloride concentrations at the peaks for test holes CL-3 through CL-6 and CL-8 and CL-9 indicate that ET from native plants is effectively capturing most modern-day precipitation before it can percolate past the root zone to the water table.
Cumulative water and cumulative chloride contents were plotted against depth below land surface, and against each other for each test hole to evaluate the subsurface movement of water and chloride (figs. 12–14). Linear increases in cumulative water with depth are seen at test holes CL-5–CL-9 (fig. 12), which indicate a constant water content with depth at these test holes. At test holes CL-1–CL-4, changes in slope indicate changes in water content at various depths in the profile. At test hole CL-4, the slope changes at about 10 ft, which corresponds to a change from semiconsolidated silt, sand, and gravel to stiff, semiconsolidated clay where more water may be held in the sediment pores (appendix B). At this site, chloride concentrations also decrease at depths greater than 10 ft (fig. 11) indicating that at depths less than 10 ft, ET from plants may be depleting the water content and increasing the chloride concentrations in the root zone. Cumulative water increases at test holes CL-1 and CL-2 at depths greater than about 14 and 18 ft, respectively, and conversely, at test hole CL-3 cumulative water decreases at a depth of about 8 ft. There are no apparent changes in lithology or changes in chloride concentrations at these depths in the three test holes, and the causes for the changes in slope are unknown.
Test holes CL-1, CL-2, and CL-7 (fig. 13) show relatively linear increases in cumulative chloride with depth, indicating chloride is being transported downward at a uniform rate throughout the depth of the test hole. Large changes in slope are seen at one or more points in the remaining test holes, indicating chloride is being concentrated near the base of the root zone where plants extract water, or that the chloride flux at land surface has changed. Changes of the chloride flux at land surface may be caused by changes in the volume of infiltrating precipitation. In test hole CL-3, the peak in chloride occurs at 12 ft (fig. 11) and cumulative chloride greatly increases from a depth of 5 to 12 ft (fig. 13), where very hard semiconsolidated sediments were encountered (appendix B). Plant roots may not be able to penetrate the semiconsolidated sediments at depths greater than 12 ft, extracting percolating water and causing chloride to accumulate in the soil from depths of 5 to 12 ft. Changes in slope at test holes CL-4 and CL-5 are similar near the chloride peaks (fig. 11) at depths of about 10 and 5 ft, respectively, which correlates with lithologic changes in the test holes (appendix B). Changes in cumulative chloride slope in test holes CL-6–CL-9 do not correspond to changes in lithology, but approximately correspond to depths having high chloride concentrations (figs. 11 and 13). Chloride concentrated at the base of the root zone by ET likely is the cause of these changes in slope and rapid increases in cumulative chloride.
A linear increase in cumulative water with cumulative chloride indicates that the data fits the assumption that pore-water chloride concentrations below the root zone are in equilibrium with the chloride flux at land surface (Stonestrom and others, 2003, p. 15). Relatively linear increases are shown at test holes CL-1, CL-2, and CL-7 (fig. 14). At the remaining test holes, a change in slope is evident at one or more depths, indicating that chloride is accumulating near the base of the root zone.
The time required for accumulation of the mass of chloride above a particular depth within a test hole, or throughout each test hole, can be estimated from the cumulative mass of chloride above the depth of interest, divided by the rate of chloride deposition at land surface (table 4; Phillips and others, 1988, p. 1882; Prudic, 1994, p. 10). The rate of chloride deposition is determined by multiplying the average annual precipitation at each site by the average chloride concentration of precipitation. Average annual precipitation at each site was determined from a relation between altitude and precipitation developed by Maurer and Halford (2004, p. 29) for the eastern side of Carson Valley. The average chloride concentration of precipitation used was 0.5 mg/L, as determined by Feth and others (1964, p. 35) from 79 snow samples collected in the Sierra Nevada, representing both wet and dry deposition.
The estimated time required for chloride accumulation to the depths of peak chloride concentrations is from 16 to 17 years at test holes CL-1 and Cl-2; 110 years at test hole CL-4; 175 years at test hole CL-9; 600 years at test hole CL-7; and more than 1,000 years at test holes CL-3, CL-5, CL-6, and CL-8 (table 4). The time required for chloride to accumulate at the bottom of the test holes is about 100 years at test holes CL-1 and CL-2; about 700 years at test hole CL-7, and ranges from 1,400 to almost 12,000 years at the remaining test holes (table 4).
Other studies in the southwestern United States estimated that 10,000–15,000 years were needed to account for the measured accumulation of chloride in similar profiles (Scanlon, 2004, p. 245). Large peak chloride concentrations have been interpreted to signify a lack of recharge from modern-day precipitation and low chloride concentrations at depths greater than the peak concentrations have been attributed to recharge that occurred in wet climates near the end of the Pleistocene Epoch (more than 10,000 years ago; Phillips and others, 2004, p. 285; Scanlon, 2004, p. 244–245).
In Carson Valley, the estimated times for accumulation indicate that recharge from modern-day precipitation is taking place only at test holes CL-1 and CL-2, and possibly at test hole CL-7, if modern-day precipitation is defined as taking place over the past several hundred years. Modern-day precipitation at the other six test holes was consumed by ET and has not infiltrated beyond the base of the root zone. Accordingly, modern-day precipitation likely has not infiltrated to the water table to become recharge over much of the eastern side of Carson Valley where annual precipitation, vegetation, and lithology are similar to those at the six sites.
The long times required for accumulation of chloride to the base of the test holes (about 30 ft below land surface) indicate that water that began infiltrating during the Pleistocene Epoch still could be slowly draining through unsaturated sediments beneath the root zone to recharge the water table. Estimates of the rate of recharge from the Pleistocene Epoch could be made if the rates of precipitation and chloride deposition were known for that time period. However, the rates of chloride deposition for that time period are not well known and such estimates would be highly speculative (Stonestrom and others, 2003, p. 16).
The rate of recharge from modern-day precipitation at test holes CL-1, CL-2, and CL-7 can be estimated using the average annual precipitation at the sites (table 4), the chloride concentration of precipitation (0.5 mg/L; Feth and others, 1964), and the average concentration of chloride in pore water near the bottom of the test holes (table 4, footnotes 1–3). Average chloride concentrations in pore water near the bottom of test holes at these three sites were 7.8 mg/L at test hole CL-1, 11.6 mg/L at test hole CL-2, and 22.2 mg/L at test hole CL-7 (table 4). Corresponding annual rates of recharge were 0.04 ft at test hole CL-1, 0.03 ft at test hole CL-2, and 0.02 ft at test hole CL-7 (table 4).
Test hole CL-1 is in gravel deposits that cap the Indian Hills area, and test hole CL-2 is in eolian sand deposits that cover areas north of the Johnson Lane area (figs. 2 and 3, appendix B). At these locations precipitation infiltrates through the coarse-grained and well-sorted sediments to depths below the root zone. Recharge from modern-day precipitation may be taking place at similar rates in other areas where these gravel and eolian sand deposits are mapped. Test hole CL-7 is in Tertiary sediments near the eastern edge of basin-fill deposits in the Fish Spring Flat area (figs. 2 and 3). Based on the results from the other test holes, the recharge rate estimated for test hole CL-7 is unlikely taking place over a large area.
Uncertainty in estimated recharge rates is related directly to uncertainties in annual precipitation and chloride concentration in precipitation. Uncertainty associated with the estimate of annual precipitation made using the altitude relation is about 15 percent (Maurer and Halford, 2004, p. 37). Other soil-chloride studies in Nevada used a value of about 0.4 mg/L for the chloride concentration in precipitation (Dettinger, 1989, p. 63; Berger and others, 1997, p. 46; Maurer and Thodal, 2000, p. 24).
Values from 0.4 to 0.6 mg/L represent a reasonable range of chloride concentrations in bulk precipitation in Nevada. Average chloride concentration for precipitation at 74 sites sampled in Nevada was 0.4 mg/L (Dettinger, 1989, p. 62). Average chloride concentration for bulk precipitation at eight sites in Nevada was 0.6 mg/L, but the value could be overestimated because of localized remobilization of dry fall between periods of precipitation at the sampling sites (Dettinger, 1989, p. 62). The chloride concentration of bulk precipitation ranged from 0.07 to 1.3 mg/L (average 0.38 mg/L) in 24 samples collected from five sites north of Reno, Nev., 1992–93 (Berger and others, 1997, p. 46). The lowest values were measured in winter months, and highest values were measured in June and September. As pointed out by Dettinger (1989), chloride deposited as dry fall during summer becomes incorporated into early winter precipitation.
Applying the minimum estimate of precipitation and a chloride concentration of 0.4 mg/L to equation 2 provides a minimum estimate of the recharge rate. Whereas, applying the maximum estimate of precipitation and a chloride concentration of 0.6 mg/L provides a maximum estimate (table 5). The resulting range in annual rates is ±0.01 ft of the estimated recharge at each test hole (CL-1, 0.03–0.05 ft; CL-2, 0.02–0.04 ft; and CL-7, 0.01–0.03 ft).
If the streambed is sufficiently permeable to allow flow, streams lose flow and the infiltrating surface water recharges the underlying aquifer when the altitude of the water table adjacent to the stream is lower than the stream’s stage. Conversely, when the altitude of the water table is higher than the stream’s stage, ground-water discharge from the aquifer to the stream takes place and streams gain flow. Locations of streamflow gain and loss, and estimates of their rates, are useful for evaluating the effects of changes in land use and developing updated water budgets.
Temperature data can be used to determine whether streams are gaining or losing flow. Solar heating of stream water during the day and its cooling over night creates diurnal changes in temperature that can be used to trace the movement of water through the streambed. The difference between stream and streambed temperature, and the timing and amplitude of the diurnal temperature signal in sediments beneath the stream can be used to identify where streams gain and lose flow. Diurnal changes in temperature beneath gaining streams are relatively small, whereas those beneath losing streams follow diurnal temperature changes in the streamflow (Constantz and Stonestrom, 2003, p. 2 and 4).
Temperatures at depths of 1.6 and 3.3 ft beneath streambeds were measured using thermocouple probes. Each probe was made of stainless-steel pipe, 3.3-ft long with a 0.25-in. inside diameter. The bottom of the pipe was pounded and ground to a point, and a coupler was threaded to the top of the pipe. Thermocouples (type T, copper-Constantan wires) were placed at the bottom and midway points in the pipe, and silicone sealant was injected through holes drilled in the pipe between and above the thermocouples. Sealant also was applied to the thermocouple tips to ensure electrical insulation from water.
To place the probes into the streambed, thermocouple wires were run through an additional length of pipe threaded into the top of the probe and a hollow, sliding pounder was used to drive the probes into the streambed until the top of the probe was level with the streambed. The upper pipe was then removed and the thermocouple wires were connected to a data recorder. An additional thermocouple was connected to the recorder, placed in the stream, and weighted to remain in place on the streambed. An aluminum cover was placed over the wiring panel to reduce temperature gradients across the panel. Thermocouple temperatures were obtained from differential measurements referenced to the temperature of the wiring panel in the data recorder, which was recorded at the same intervals as the thermocouple data. Thermocouple temperatures were recorded every 5 seconds and averaged over 5-minute periods. The data recorder was housed in a plastic enclosure and secured on the streambank to stakes or the trunks of nearby willows.
Temperatures recorded from thermocouple probes immersed in a water bath were within 0.01ºC of temperatures determined by a laboratory reference thermometer. Tests of the thermocouple probes compared to thermocouples without a surrounding pipe were made to determine the precision of the recorded temperatures. Thermocouples in pipes were placed in the streambed about 1 ft from thermocouples placed without a surrounding pipe. Over a period of 5 days with data recorded at 5-minute intervals, temperatures recorded by the thermocouples at 1.6 ft beneath the streambed differed by an average of 0.17ºC with a standard deviation of 0.05ºC. Temperatures recorded by the thermocouples at 3.3 ft beneath the streambed differed by an average of 0.25ºC with a standard deviation of 0.15ºC.
Temperature data were collected at 37 sites throughout Carson Valley to identify gaining and losing reaches and estimate infiltration and seepage rates (fig. 15). Site locations were selected along roadways to facilitate access and were limited to those where permission to install the equipment could be obtained. Rocky streambeds in the East Fork of the Carson River and in numerous ditches between the East Fork and Highway 88 south of Minden prevented installation of the thermocouple probes in those areas. However, rocky streambeds along the West Fork of the Carson River did not prevent installation of thermocouples at three sites (ST-35–ST-37).
Streambed temperatures were recorded for periods of 3 to 20 days during May to early November 2003 and May to mid-October 2004 (table 6). Temperature data were not collected during winter months because the daily change in temperature likely would not be large enough for data analysis. Data were collected repeatedly at some sites to determine the variability of temperature fluctuations from year to year, and during an irrigation season. Repeated temperature data were collected within about 10 ft of the initial location.
Appendix C lists the 5-minute temperatures recorded at each site. Preliminary graphs of the recorded stream and streambed temperatures along with recorded data-logger panel temperatures allowed detection of problems with the collected data. Declining stream stage at sites ST-2 and ST-33 caused exposure of the stream thermocouple so the recorded stream temperatures were approximately the same as the air temperatures recorded at the data-logger panel (appendix D, figs. D1 and D3). Similarly, flow in the ditch stopped after only a few days of data collection at sites ST-6, ST-33, and ST-36 and recorded temperatures were approximately the same as air temperatures (appendix D, figs. D2 and D3). At site ST-34, ground water pumped from a nearby well into the ditch caused a marked decrease in stream temperatures for various days during data collection (appendix D, fig. D2).
Preliminary graphs also indicated that recorded stream and streambed temperatures were affected by rapid changes in panel temperature of the data logger. Rapid decreases in panel temperature caused abrupt decreases in recorded stream and streambed temperatures, and the reverse occurred during rapid temperature increases (fig. 16, appendix C). In addition, high frequency (5–20 minutes) low amplitude (0.5–2 degrees) fluctuations also were present as noise in the recorded data.
Corrections for the effects of rapid changes in panel temperatures of the data logger were applied to the recorded temperatures of the stream and the streambed at a depth of 1.6 ft, using temperatures recorded at 3.3 ft beneath the streambed. A polynomial equation was derived using decimal days as the independent variable and the temperature at 3.3 ft beneath the streambed at 4 a.m. as the dependent variable. During early morning hours, the data-logger panel temperatures were relatively constant. The difference between the recorded temperature at 3.3 ft and the temperature predicted at the same time by the polynomial equation was assumed to be caused by changing panel temperatures. The difference was then subtracted from the temperatures recorded in the stream and at a depth of 1.6 ft beneath the streambed to obtain adjusted temperature values. This procedure accounts for long-term variations in temperature during the period of data collection.
The method used to adjust the recorded temperatures assumes that: (1) errors caused by changing panel temperatures were the same for all thermocouples, and (2) diurnal-temperature fluctuations at a depth of 3.3 ft beneath the streambed were caused by temperature fluctuations of the data-logger panel and were not caused by flow through the streambed. Thus, the correction will have little effect where streams are gaining flow, but may result in under predicting the flow of water and heat through the streambed in places where streams are losing flow. The effects of rapid changes in panel temperature could have been reduced if the data logger had been insulated from solar radiation by burying the enclosure, however, this was not practical because the recorders were frequently moved and roots along the channel edges made digging difficult.
Adjusting the recorded temperature of the stream and at 1.6 ft beneath the streambed was limited to the period used to derive the polynomial equation (fig. 16C; appendix D). The smooth line for the temperature at 3.3 ft beneath the streambed represents the polynomial equation used to determine adjustments for the temperatures of the stream and at 1.6 ft beneath the streambed. Any diurnal signal at 3.3 ft beneath the streambed is lost, however, the adjusted temperatures are considered more representative of actual temperatures than unadjusted temperatures (fig. 16C). To further reduce noise in the adjusted temperatures, running 30-minute averages of the adjusted stream and streambed temperatures were calculated to produce the plots in figure 16C and appendix D.
At site ST-34, ground water, having a relatively constant lower temperature than the stream, was observed being pumped into the ditch a short distance upstream of the data-collection site on 4 days during the period of data collection (July 9, 12, 14, and 15; appendix D, fig. D2). Clear diurnal fluctuations in temperature were measured at a depth of 1.6 ft beneath the streambed on July 7–9, 2004, indicating losing conditions at the site. Diurnal fluctuations in streambed temperature greatly decreased when ground water was pumped into the ditch and cooler ground water was infiltrating through the streambed. Stream temperature was nearly constant on July 14–15. During this period, streambed temperature lost its diurnal character and gradually approached stream temperature. This would be expected in a losing stream, and indicates the adjusted temperatures are reasonably accurate. The accuracy of adjusted temperatures at other sites is unknown, but based on results from site ST-34, the adjustment is reasonable for estimating gaining and losing conditions.
High-frequency temperature fluctuations of about 2ºC are still present in some of the adjusted data, for example sites ST-11 and ST-27 (appendix D). For most data sets, the effects are minimal, and for sites ST-11 and ST-27 the adjusted streambed temperatures appear to respond to changes in stream temperature. The cause of this noise likely is an instrumentation artifact that was not corrected by the panel-temperature adjustment.
Other noise in the data could be the result of many streambed sites located near flood-irrigated fields. Infiltration of applied water beneath the fields could produce subsurface temperature changes that are not in phase with normal diurnal solar heating and cooling of the stream. In addition, fluctuations in stream temperature beyond those caused by solar heating could be caused by surface runoff from irrigated fields entering the stream upstream of the site. Surface runoff can be warmed to temperatures greater than those in the stream causing unpredictable temperature changes. These factors may be the cause for noise inherent in some of the data.
Differences in temperature between the stream and streambed, the presence of diurnal temperature fluctuations in the streambed, and the propagation or lack of propagation of long-term (longer than diurnal) temperature changes from the stream to the streambed were used to identify gaining, losing, or neutral conditions at the 37 streambed-temperature sites. The identification of conditions are representative of relatively short periods of data collection at each site, and conditions may change over time.
Changes in stream stage during the periods of data collection and seasonal temperature variations may affect the determination of gaining or losing conditions. Changes in stream stage may be responsible for changes in the amplitude of diurnal streambed-temperature fluctuations during the period of data collection at some sites. However, the effects of changes in stream stage on streambed temperature cannot be evaluated with the existing data, because stream stage was not recorded during the periods of temperature data collection. Changes in streambed temperature can be caused by heat conduction alone without movement of water. Lapham (1989, p. 8) showed that seasonal changes in stream temperature caused temperatures of saturated coarse-grained sediment at a depth of 10 ft below the streambed to vary annually as much as 5ºC, even though no water flowed through the streambed. Under conditions of no water flow through the streambed, streambed temperatures versus stream temperatures are most different in May and November and are most similar from late June through late August (Lapham, 1989, p. 8).
At the relatively shallow depths of the thermocouple probes (1–3 ft), streambed temperatures likely reach equilibrium with stream temperatures faster when moving water transmits heat than when heat transfer is by conduction alone. At losing stream reaches in western Washington, streambed temperatures at depths of 1–3 ft become cooler than stream temperatures as streams begin to warm in early March, and become warmer than stream temperatures as streams cool in early October (Simonds and others, 2004, p. 32 and 43).
Application of 2-D models, such as VS2DH (Healy and Ronan, 1996), to the temperature data could be used to provide estimates of infiltration rates at each site. Niswonger and Prudic (2003, p. 87) noted, however, that several types of data are needed for application of VS2DH to obtain reliable estimates of streambed infiltration and the hydraulic conductivity of streambed sediments. These data, which include ground-water levels adjacent to the streambed, vertical hydraulic gradients within the aquifer, and variations in stream stage are not available for most sites.
The difference in time (phase difference) between diurnal-temperature peaks in the stream and streambed at 1.6 ft was used to estimate infiltration rates for losing stream reaches. The difference in time between diurnal peaks and the amplitude of the diurnal fluctuations were determined using measurements made on plots of the data at expanded time and temperature scales (periods used for the measurements shown in appendix D). An equation by Constantz and Thomas (1996, p. 3598) provides accurate estimates of infiltration rates where heat transport is dominated by advection for rates as low as 0.8 ft/d:
 .
(3)
.
(3)
where
 |
is the infiltration rate, in feet per day, |
 |
is the vertical velocity of the temperature peak, and |
 and
and  |
are the products of density and specific heat capacity (volumetric
heat capacities) for wet sediments (signified by the subscripts ‘ |
The vertical velocity of the temperature peak is calculated as:
 ,
(4)
,
(4)
where
| 1.6 | is the depth of the thermocouple, in feet, and |
 |
is the difference in time between peak temperatures of the stream and streambed, in decimal days. |
Equation 3 was used to estimate infiltration rates for losing stream sites from the difference in time, in decimal days, between the peak stream temperatures and peak streambed temperatures at a depth of 1.6 ft. Values of 2.2 × 10⁶ J/m3 ºC for the volumetric heat capacity of sediments and 4.2 × 10⁶ J/m3 ºC for the volumetric heat capacity of water were used in the calculations (Stonestrom and Blasch, 2003, p. 76).
During the period of data collection, from May to early November, average stream temperatures at each site were highest, approaching or exceeding 20ºC, in July and August and lowest, approaching or less than 10ºC, in May and June and in September and October (table 7). Streambed temperatures follow the same pattern with the exceptions of sites ST-1, ST-17, and ST-18 that were 10–12ºC in July and August. Streambed temperatures generally were less than stream temperatures except during September and October, when stream temperatures became cooler than streambed temperatures (table 7). Negative-temperature differences, when the stream temperature is cooler than streambed temperature, generally were smallest (less than 1ºC) in late September and early October (sites ST-8, ST-11, ST-12c, and ST-16) and generally more negative (greater than 3ºC) in late October and early November (sites ST-29 through ST-31). Thus, small temperature differences measured in late September and early October likely are caused by the annual cycle in stream and streambed temperatures previously discussed.
An exception to this pattern is site ST-5, where streambed temperatures were slightly warmer than stream temperatures in mid-June 2003. The warm streambed temperatures compared to the stream temperatures likely were caused by streamflow infiltration during a warm period prior to data collection and a cool period during actual data collection. In late May and early June, mean daytime air temperatures were greater than 25ºC, however, mean daytime air temperatures had decreased to about 9ºC by the end of the data-collection period on June 24, 2003 (Warren Hibbard, National Weather Service observer, written commun., 2005).
The Carson River and irrigation ditches generally gained flow at sites on the westernmost side and northern end of the valley floor, generally north of Muller Lane (fig. 15). The Carson River and irrigation ditches at sites on the southern end and eastern side of the valley floor generally lost flow to ground water. The distribution of gaining, losing, and neutral sites represents conditions for 2003 and 2004 and may change during wetter or drier periods.
Strongly gaining streams are shown by data from sites ST-1, ST-17, and ST-18 (table 7, appendix D, fig. D1), where temperatures beneath the streambed were less than the coolest temperatures in the stream. Little to no diurnal-temperature fluctuation was measured at a depth of 1.6 ft beneath the streambed, and the temperatures at depths of 1.6 and 3.3 ft are nearly equivalent. Data at these sites were collected in July and August when infiltration of warmer streamflow would increase the temperature beneath the streambed and cause diurnal fluctuations. Ground water of relatively constant temperature moving from the water table into the stream caused temperatures at depths of 1.6 and 3.3 ft to be nearly equivalent. Lapham (1989, p. 13) shows that annual temperature fluctuations beneath streambeds are near zero when upward ground-water flow velocities, or seepage rates, are 1 ft/d or greater.
Temperature data collected at sites ST-2, ST-3a, ST-4a, ST-13b, ST-14a, ST-14b, and ST-32a indicated less strongly gaining streams (table 7, appendix D, fig. D1). At these sites, streambed temperatures were greater at depths of 1.6 ft than at 3.3 ft, streambed temperatures were less than stream temperatures, and there was little to no diurnal fluctuation in temperature. Ground water at 1.6 ft may have been warmed by conduction of heat through the streambed, but was kept cooler than the stream by mixing with cooler ground water moving upward from depths of 3.3 ft or greater. At site ST-32b (appendix D, fig. D2), streambed temperatures also were less than stream temperatures, however, relatively large, albeit noisy, diurnal-temperature fluctuations were recorded at 1.6 ft. For this reason, the stream reach at site ST-32b likely is a losing reach (table 7).
Gaining sites had large positive temperature differences, from 2.6 to greater than 7ºC, indicating streambed temperatures were cooler than stream temperatures (table 7). Data at most of these sites were collected during July and August when stream and streambed temperatures had been warming for 2–3 months and temperatures likely are in equilibrium (Lapham, 1989, p. 8).
At sites ST-13a, ST-19, and ST-21 (table 7, appendix D, fig. D1), relatively large diurnal and long-term (longer than diurnal) fluctuations in the stream did not propagate downward into the streambed, indicating gaining conditions and a lack of streamflow infiltration. At sites ST-13a and ST-21, changes of 5–6ºC in stream temperature on 1 or 2 days did not propagate into the streambed. At site ST-19, streambed temperatures continually decreased, whereas stream temperatures increased September 20–25, and decreased after September 25.
Propagation of diurnal stream-temperature fluctuations downward through the streambed were considered indicative of losing stream reaches. At some sites, the diurnal fluctuations were well defined at a depth of 1.6 ft beneath the streambed and had relatively high amplitude, such as sites ST-5, ST-7, ST-12b, ST-16, ST-24, ST-28a, ST-34, and ST-37 (table 7, appendix D, fig. D2). The amplitude of the diurnal streambed-temperature fluctuations at a depth of 1.6 ft, as a percentage of the stream-temperature fluctuations ranged from 20 to 48 percent (table 7). The temperature differences between the stream and streambed at these losing reaches measured during summer months are small, less than 0.8ºC. Small temperature differences measured during summer months provided additional evidence that streambed temperatures were in approximate equilibrium with infiltrating streamflow and that infiltration was relatively rapid. The small, negative temperature differences measured at sites ST-16, ST-24, and ST-28a in September and October may result from long-term seasonal cycles in stream and streambed temperatures previously discussed.
Relatively high-amplitude diurnal fluctuations at 1.6 ft beneath the streambed at sites ST-31, ST-32b, and ST-35 (table 7, appendix D, fig. D2) are somewhat masked by noise in the temperature signal, however, streams likely are losing flow at these sites. The amplitude of diurnal streambed-temperature fluctuations, as a percentage of the stream-temperature fluctuations, ranged from 27 to 36 percent (table 7).
Relatively low amplitude yet well-defined diurnal fluctuations at a depth of 1.6 ft beneath the streambed generally following long-term changes in stream temperatures are shown at sites ST-10, ST-12a, ST-14c, ST-15, and ST-26 (appendix D, fig. D2). These sites likely are losing flow and have streambed-temperature fluctuations with amplitudes ranging from 12 to 27 percent of the stream fluctuations (table 7). At sites ST-3b, ST-11, ST-12c, ST-25, ST-27, ST-28b, ST-30, ST-32c, and ST-33, streambed temperatures show small diurnal fluctuations and generally follow stream temperatures (appendix D, fig. D2). However, these sites also are likely losing flow. Noise in the temperature signal does not allow accurate determination of the relative amplitude and phase difference of the fluctuations at these sites.
Sites ST-4b, ST-6, ST-8, ST-9, ST-20, ST-22, ST-23, ST-29, and ST-36 (table 7, appendix D, fig. D3) do not appear to be gaining or losing significant amounts of flow. At these sites, streambed temperatures at 1.6 ft beneath the streambed have little to no diurnal-temperature fluctuations, but generally follow long-term changes in stream temperatures. The streambed at these sites likely is warmed by conduction from the stream, but infiltration is not sufficient to produce diurnal changes in temperature.
Infiltration rates at losing stream reaches are proportional to the amplitude of the streambed-temperature fluctuation relative to the amplitude of the stream-temperature fluctuation (Lapham, 1989, p. 12). When infiltration rates are high, the amplitude of the diurnal-temperature fluctuation of the streambed closely mimics the diurnal-temperature fluctuation of the stream. Under such conditions, the difference in time between temperature peaks in the stream and streambed is inversely proportional to the infiltration rate (Constantz and Thomas, 1996, equation 3). It follows that sites with high infiltration rates have small differences in time between diurnal stream- and streambed-temperature peaks, and relatively large ratios in the amplitude of streambed to stream diurnal temperatures.
At sites where data were collected during more than one period (sites ST-12a, ST-12b, ST-12c, ST-28a, ST-28b, ST-32b, and ST-32c; table 7), small differences in time between stream- and streambed-temperature peaks generally correspond to large ratios in streambed to stream amplitudes. When different sites were compared, some had large differences in time and large amplitude ratios (table 7; sites ST-30 and ST-31), whereas others had small differences in time and small amplitude ratios (sites ST-12b and ST-26). The relation between the ratio of streambed- to stream-temperature amplitude and the phase difference likely is a complex function of the hydraulic setting and geometry, along with the hydraulic and thermal properties of the streambed sediments at each site.
Time differences ranging from 0.19 to 1.4 days (table 7) were used in equations 3 and 4 to estimate infiltration rates for losing stream sites. Estimated infiltration rates ranged from 0.6 to 4.4 ft/d.
Rates of streamflow loss per mile of stream were estimated by multiplying the estimated infiltration rates by the measured stream widths at each site, then multiplying by 5,280 ft, and dividing by 86,400 seconds per day to provide a loss rate in cubic feet per second per mile at each site (table 8). This method of calculating stream-loss rates assumes that infiltration rates and stream widths are constant over a 1-mi reach of stream. The resulting rates range from less than 0.6 (ft3/s)/mi for the smaller ditches (sites ST-15, ST-26, ST-28a, ST-28b, and ST-34) to 12.1 (ft3/s)/mi for site ST-12b (Carson River near Genoa) in early June 2004.
Stream stage, width, and flow at site ST-12b were high in early June 2004, and flow of the Carson River near Genoa was about 300 ft3/s (http://nevada.usgs.gov/ADR/wy04/sw/10310407_2004_sw.pdf). During this period, a loss rate of about 12 (ft3/s)/mi may be reasonable if it occurs for only 1 or 2 mi. In August 2003, when flow in the river at the site averaged 30 ft3/s (Stockton and others, 2004, p. 202), a loss rate of 3 (ft3/s)/mi was estimated (site ST-12a; table 8). The rates indicate a much greater percentage of flow was lost in August 2003 (10 percent) than in June 2004 (2 percent). This indicates that rates may be variable over time at a particular site, and that application of some of the larger rates, from 3 to 12 (ft3/s)/mi, to reaches of 1 or more miles may yield infiltration rates that exceed the actual flow of the stream, particularly during periods of low flow. Thus, some of the larger estimates of the infiltration rate may be high, or may be applicable only to relatively short stream reaches.
An estimated seepage rate of 1 ft/d, as determined from model simulations by Lapham (1989, p. 13) for gaining stream sites with no annual streambed-temperature fluctuations, was applied to sites ST-1, ST-17, and ST-18 (table 8). The resulting rates of streamflow gain are 1–3 (ft3/s)/mi of channel. Seepage rates as low as 0.1 ft/d also were shown by Lapham (1989, p. 13) to produce minimal annual streambed-temperature fluctuations. An application rate of 0.1 ft/d would decrease the rates of streamflow gain by an order of magnitude from 0.1 to 0.3 (ft3/s)/mi (table 8).
Identification of sites as gaining and losing is somewhat uncertain because of the uncertainty of the complete removal of panel-temperature effects in the adjusted stream and streambed temperatures, the relatively low amplitude and poorly defined diurnal fluctuations for some losing sites, and the potential for changing conditions over time. Data collected in different years, and in different seasons of the same year, indicate that conditions may change at a particular site.
At sites ST-3a, ST-3b, ST-32a, and ST-32b conditions changed from gaining in the summer of 2003 to losing in the spring of 2004 (table 7). Similarly, conditions changed from gaining in the spring of 2004 to losing in late summer of 2004 at sites ST-14b, ST-14c, ST-32b, and ST-32c. Such changes likely are caused by changes in stream stage relative to the altitude of the adjacent water table. Stream stages generally are highest in spring months and decline over the summer on the main stems of the Carson River. Water-table altitudes also are highest in spring after recharge from winter precipitation and widespread application of surface water for irrigation, and decline over summer months.
Stream stage in irrigation ditches varies on weekly, daily, or hourly time scales as surface water is diverted through the ditches and stage is adjusted at control structures to supply water to different fields. Small differences between stream stage and the water-table altitude can cause changes from gaining or losing conditions because of the low slope of land surface across the valley floor and the low gradient of the water table. Finally, drought conditions were present in 2003 and 2004, and it is uncertain how the distribution of gaining and losing reaches might change during periods of average or above average precipitation.
The equation used to estimate infiltration rates at the stream sites assumes that downward flow is purely vertical; however, streamflow lost through the streambed likely also moves in a lateral direction away from the stream. Thus, equation 3 may underestimate infiltration rates, but the magnitude of the error is unknown. In addition, infiltration rates are estimated for particular points on the stream and conditions may change upstream or downstream of the site, and at a particular site, conditions can change over time. Thus, the estimated infiltration rates should be considered point measurements and should be applied only with caution to stream reaches greater than 1 mi. Application of infiltration rates to distances greater than 1 mi can predict streamflow losses that exceed the actual flow of a stream.
Estimates of seepage rates ranging from 0.1 to 1.0 ft/d result in streamflow gain rates ranging from 0.1 to 3 (ft3/s)/mi. For comparison, a streamflow gain of about 10 ft3/s was measured in the 10-mi reach between the Genoa and Carson City gaging stations (fig. 2) in November 2003 when flow of the Carson River was 90–100 ft3/s. This results in a gain rate of about 1.0 (ft3/s)/mi, or one-third that was calculated using a seepage rate of 1.0 ft/d in table 8 for site ST-1. Thus, a more reasonable seepage rate for that reach may be about 0.3 ft/d. However, the combined uncertainty of the individual measurements at flow rates of 90–100 ft3/s is approximately equal to the measured difference in flow. Seepage gains from 0.1 to 1.0 (ft3/s)/mi probably are reasonable bounds for gaining streams in Carson Valley.

![]() U.S.
Department of the Interior | U.S. Geological
Survey
U.S.
Department of the Interior | U.S. Geological
Survey
Persistent URL: https://pubs.water.usgs.gov/sir20055288
Page Contact Information: Publications Team
Page Last Modified: Thursday, 01-Dec-2016 18:48:48 EST
