Scientific Investigations Report 2009–5004
ResultsHydrologic Conditions During 2003–05Surface Water and Ground WaterSurface-water stage and standing surface-water volume in the Wood River Wetland reached a maximum in early spring during the 2003–05 data collection period (figs. 3 and 5). During this time, 80–90 percent of the wetland area was inundated. The average depth of the inundated areas was about 1.1–1.6 ft and maximum depths outside the canals were about 6 ft. Throughout each year, a greater percentage of the South Unit became inundated compared to the North Unit. The average water depths of the inundated areas in the South Unit were greater than the North Unit after discounting the canals. Surface-water stage and standing surface-water volume reached a minimum from August through November, when only about 10 percent of the wetland area was inundated. At this time, most of the inundation occurred in the South Unit and most of the North Unit was dry with much of the surface water confined to canals or ditches (fig. 3). The wetland was reportedly frozen over during parts of the winters of 2003–04 and 2004–05 (Bureau of Land Management, 2006). The highest levels of shallow ground-water during the study period were in late winter or early spring and the lowest levels were in late summer or early autumn following a trend similar to surface-water levels (fig. 6). In the North Unit, water levels in all three piezometers (shallow, intermediate, and deep) were nearly identical and generally differed by only about 0.1 ft. The highest head was typically in the deep piezometer and the lowest head was in the shallow piezometer, indicating a slight upward gradient for ground-water flow; however, water levels in these piezometers did not exceed land surface. In the South Unit, water levels in the shallow and intermediate piezometers were nearly identical, generally differing by only about 0.2 ft. The highest head typically was in the shallow piezometer, indicating a slight downward gradient for ground-water flow; however, peak ground-water levels in these piezometers occasionally exceeded land surface indicating the potential for upward flow. The head difference in the deep piezometer in the South Unit varied from 5 to 7 ft above the head in the shallow and intermediate piezometers. The ground-water level in the deep piezometer always exceeded land surface by several feet, indicating artesian conditions. This is an indication of a strong upward gradient for ground-water flow and the likely presence of confining conditions resulting from intervening low-permeability layers such as clay. Water BudgetThe water budget was determined monthly for May 2003 through September 2005. Table 5 presents the summary for October 2003 through September 2005 (water years 2004 and 2005). Excluding May through September 2003 from the summary of the monthly budgets prevents the biasing of the annual averages toward those months that have low precipitation and high evapotranspiration due to disproportionate representation. This also allowed for a more accurate comparison of annual changes in the starting and ending magnitudes of the storage components by diminishing the effects of seasonal changes in storage. InflowsMonthly inflows to the Wood River Wetland (excluding contributions from storage components) peaked in September and October due to applied irrigation that represented only about 12 percent of the total inflow but which was applied over just 1.5 months. Inflows peaked again in late autumn through late winter or mid-spring due to precipitation. Precipitation was the largest component of inflow, accounting for about 43 percent of total inflow, most of which occurred during this time (fig. 7A, table 5). The remainder of the inflow was ground water from several sources. Most ground-water inflow resulted from regional ground-water discharge, which accounted for 40 percent of the total inflow and remained relatively constant throughout the year with a slight peak in summer due to increased hydraulic gradient. Ground-water discharge from artesian wells and seepage through dikes accounted for only 1 percent and 4 percent of the total inflow, respectively. Seepage through the dikes peaked in the spring when the water levels in the adjacent surface-water bodies were highest. The minimum inflows to the wetland resulted from decreased precipitation and occurred in summer and late autumn, excluding periods of applied irrigation. The distribution of inflow between the North and South Units generally was proportional to their area. The exceptions were applied irrigation, which entered entirely into the North Unit, and ground-water seepage inflows through the dikes, which were greater in the South Unit due to the long perimeter dikes adjacent to surface-water bodies. Total precipitation during the 2005 water year was about normal although the distribution of precipitation throughout the year was not. Precipitation was lower than normal during January and February 2005 and higher than normal in May 2005. This resulted in low levels of standing surface-water and, to a lesser extent, ground-water during spring and summer due to the uptake of precipitation by soil-moisture storage. OutflowsOutflows from the Wood River Wetland (excluding contributions to storage components) peaked in June and July as a result of evaporation and evapotranspiration (fig. 7B). The largest component of outflow was from open-water evaporation, which was equivalent in volume to 78 percent of the total inflows (table 5) and accounted for 64 percent of the total outflows. The remaining outflow was from evapotranspiration from emergent vegetation, which was equivalent in volume to 44 percent of the total inflows (table 5) and accounted for 36 percent of the total outflows. Open-water evaporation exceeded emergent vegetation evapotranspiration from December through July and peaked around June when temperatures increased and large areas remained inundated. The reverse was true from August through November, when evapotranspiration from emergent vegetation exceeded open-water evaporation and peaked around August when water levels receded and plant growth increased. The minimum outflows from the wetland occurred November through January due to decreased evaporation and evapotranspiration resulting from lower temperatures, decreased solar radiation, and dormant vegetation. Open-water evaporation represented a greater proportion of the outflow in the South Unit than in the North Unit. This was a consequence of the slightly lower land-surface elevation in the South Unit, which resulted in large inundated areas that persisted for a longer time, allowing for warmer water temperatures (as much as 33.4°C, South Unit) that resulted in increased open-water evaporation. Changes in StorageChanges in surface-water storage began increasing in autumn and showed the greatest increases in late winter due to increased inflow from precipitation, decreased outflows to evaporation and evapotranspiration, and prior satisfaction of soil-moisture and ground-water storage requirements (fig. 7C). Standing surface-water volumes responded to these increases and reached a maximum in early spring (figs. 3 and 5). Changes in surface-water storage decreased throughout the spring and summer and showed their largest declines in late spring and early summer due to increased outflows to evaporation and evapotranspiration, and decreased inflows from precipitation. The inflows from applied irrigation and precipitation that occurred in late summer and early autumn had to satisfy soil-moisture and ground-water storage before surface-water storage could increase. Standing surface-water volumes responded to these declines and reached a minimum from September through November. The patterns of change in surface-water storage were similar for the North and South Units, although the North Unit had greater magnitudes for the largest rise and decline, which occurred during water year 2004. The total decline in surface-water storage was equivalent in volume to 1 percent of the total inflows. Changes in ground-water storage began increasing in September and October initially showed the greatest increases due to inflow from applied irrigation and increased inflow from precipitation (fig. 7C). Decreased outflows to evapotranspiration and contemporaneous satisfaction of soil-moisture storage requirements contributed to the increase in ground-water storage. Increases in ground-water storage superseded increases in surface-water storage until ground-water levels rose to inundate the soils. Throughout the autumn and early winter, ground-water storage continued to increase; however, the magnitude of the increases declined as the available storage for ground water in the unsaturated zone became filled. Beginning in spring, changes in ground-water storage declined. The magnitude of the decline increased through the summer due to increased outflows to evapotranspiration and decreased inflows from precipitation, which also must contribute to satisfy soil-moisture requirements. However, the declines in ground-water storage occurred only after overlying surface-water levels receded sufficiently to expose the soils. Patterns of ground-water storage changes were similar in the North and South Units, although the magnitudes were somewhat greater in the North Unit due to the thick unsaturated zone over a larger area. From October 1, 2003 through September 30, 2005, the standing surface-water levels in the North and South Units declined about 0.4 ft. However, because the North Unit was nearly dry and only a small part of the South Unit was inundated, the decline in stage represented only about a 200 acre-ft loss in surface-water storage, nearly all of which occurred in the South Unit (table 5). During this same period, shallow ground-water levels declined about 1.7 ft in the North Unit and about 0.7 ft in the South Unit. This resulted in a decline in ground-water storage of about 300 acre-ft in the North Unit and about 100 acre-ft in the South Unit (table 5). The total decline in ground-water storage was equivalent in volume to 2 percent of the total inflows. Water-Budget ResidualMonthly water-budget residuals (fig. 7D) were calculated using values of the inflows, outflows, and changes in storage. Positive residual values are due to errors in estimation or lack of inclusion of additional water-budget components. Positive residual values indicate an excess of water resulting from one or more of the following conditions: inputs overestimated, outputs underestimated, or change in storage underestimated. Negative residual values indicate a deficit of water resulting from one or more of the following: inputs underestimated, outputs overestimated, or change in storage overestimated. Examination of the monthly residuals reveals that the values follow the seasonal pattern expected for soil-moisture storage, an unmeasured and unestimated component of the water budget. Water goes into soil-moisture storage during the autumn and early winter primarily from inflow from applied irrigation and precipitation. During winter, soil-moisture stored in the unsaturated zone is converted to ground-water storage as rising ground-water levels incorporate the water into the saturated zone. During mid- to late spring soil-moisture storage may briefly increase as the soil receives moisture that remains in the unsaturated zone as ground-water levels decline. However, this may be offset by water removed from soil-moisture storage through evapotranspiration, which increases around mid- to late spring and increases through the summer. This cycle is more prominent in the North Unit, which had a thicker unsaturated zone over a larger area, and which persisted through a longer period of time compared with the South Unit. Most monthly residual values can be explained by the uptake or release of water by soil-moisture storage. However, errors in the estimation of the water-budget components are also present in the residuals. Sources of error include:
These errors may contribute to the water-budget residual calculated for October 2003 through September 2005, which was -3,100 acre-ft over the 2 year period (table 5). This amounted to an unaccounted loss of 0.55 ft/yr of water across the wetland and was equivalent in volume to 19 percent of the total inflows. The magnitudes of the monthly residuals tended to be larger for the North Unit than for the South Unit. However, the monthly deficits and excesses of water for the North Unit tended to balance each other on an annual basis. This is not true for the South Unit, which exhibited greater deficits than excesses of water. As a result, the cumulative residual for the South Unit for the 2-year period of the water-budget accounted for 77 percent of the total residual for the units combined. Based on the discussion above, possible causes of the deficit may be one or more of the following: underestimation of inflows from precipitation, ground water, or surface water used for irrigation (considered most likely); overestimation of evaporation, evapotranspiration, or change in surface- or ground-water storage. Other unmeasured water-budget components such as soil-moisture storage or inflows resulting from breaches in the dikes also could contribute to the measured deficit. Surface-Water QualitySurface-water quality was highly variable depending on location (adjacent streams, North Unit, and South Unit) and season. Considerably lower concentrations of dissolved ions (lower SC) and nutrients and generally higher levels of daytime DO were detected in samples collected from Sevenmile Canal and Wood River than from wetland surface waters (fig. 8, table 6).
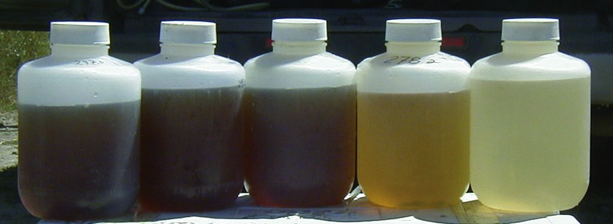
Wetland surface water in the South Unit was warmer and had higher median DOC concentrations than the North Unit, ground-water, and adjacent stream sites (table 7, fig. 8). Maximum concentrations of nitrogen, phosphorus, and dissolved organic carbon were exceedingly high in the South Unit, reaching 90,000 µg-N/L TKN, 32,200 µg-P/L TP, and 270 mg-C/L DOC (tables 8 and 9). The median concentrations of those parameters also were high. Ammonium concentrations reached 2,760 and 5,840 µg-N/L in the North and South Units, respectively. Median concentrations of nitrate were generally low (3.6 and 115 µg-N/L) in the North and South Units, respectively (table 8). In December 2003, however, the median nitrate concentration in the North Unit increased to 2,270 µg-N/L (table 9). Although no pumping occurred during 2003–05, the total nutrient concentrations in April and May (months when pumping typically occurred) ranged from 6,910 to 10,450 µg-N/L TKN and from 4,400 to 6,350 µg-P/L TP in the South Unit, and were about 4,000 µg-N/L TKN and from 670 to 800 µg‑P/L TP in the North Unit (fig. 9, table 9). Signs of biological activity, such as supersaturated DO during the daytime hours of as much as 310 percent, were apparent in the wetland surface waters (table 7). Accumulation of DO results from photosynthesis by wetland plants and algae. The highest recorded surface pH in the North and South Units (9.1 and 9.2, respectively) corresponded with DO concentrations of 310 percent and 290 percent saturation. DO concentrations in surface waters decreased each summer, with the lowest daytime values less than 2 mg/L in surface water each year. Minimum DO concentrations ranged from 0.3 to 0.8 in the North Unit and from 0.2 to 1.9 mg/L in the South Unit, although concentrations may have been lower at times because instantaneous readings did not include early morning measurements. Water-quality conditions varied seasonally, generally related to increasing spring and summer temperature and simultaneous evapoconcentration of nutrients and salts. SC values as much as 2,500 µS/cm were recorded in the South Unit (table 7). Most forms of N and P increased during the spring and summer months (fig. 9). Particulate N and P increased during summer, particularly in the South Unit as indicated by the relative concentration patterns of inorganic to total nutrients (DIN to TN and SRP to TP, fig. 10). Particulate matter and the tea-colored surface water produced significant light attenuation, reducing availability for photosynthesis and seed germination in areas of appropriate depth. Light extinction depths (point where light availability is zero) were as low as 30 cm in the South Unit, although values of 35–70 cm were more common. The combination of low light penetration, high water temperature, and high organic content contributed to high biological oxygen demand and lowered DO concentration to 0.2–2.8 mg/L in surface water each year (fig. 9). The increases in dissolved inorganic N and P (NO3, NH4, and SRP) outpaced the rate of evapoconcentration in the South Unit from spring and early summer to July, indicating the importance of other mechanisms. Ratios for individual nutrient to SC were calculated to examine temporal shifts in nutrients relative to a conservative tracer; SC was highly correlated with Cl (fig. 11), a conservative tracer unaffected by biological activity. Increases in the NO3 to SC, NH4 to SC, and SRP to SC ratios indicated that inorganic nutrients were produced faster than by evapoconcentration alone. The seasonal pattern in nutrient to SC ratios were more pronounced in the South Unit than in the North Unit, but the general patterns were the same. Nutrient concentrations and ratios were more variable in the North Unit, where a notable increase in the NO3 to SC ratio was measured in December 2003 (fig. 12), when the median NO3 concentration was 2,270 µg/L. The phosphorus to SC ratio exhibited similar seasonal increases in nutrient mass and concentration (fig. 12). Seasonal Patterns in Standing Nutrient MassesStanding mass of TN and TP changed markedly, showing seasonal increases during spring and decreases in winter that were inconsistent with simple evapoconcentration and dilution mechanisms (fig. 13). Nitrogen mass was lowest during the autumn and winter, peaked in April, and decreased through the growing season, whereas SRP and TP peaked one to two months later in June and July and then decreased (fig. 13). Trace MetalsDissolved trace metal concentrations, determined on a small number of samples, were dominated by iron, especially in the South Unit, where concentrations were 522–748 µg-Fe/L (table 10). Samples containing high dissolved iron also contained high manganese concentrations, ranging from 65 to 103 µg-Mn/L. The South Unit sites also had lower DO concentrations and higher dissolved iron, manganese, and phosphorus than the adjacent surface-water bodies (fig. 14). Ground-Water QualityGround-water quality from the artesian wells and piezometers at the wetland is presented in figure 8 and tables 6 and 8. Ground-water quality generally varied less over time than surface water, with the artesian wells showing the least variation. Variations in water quality between wells generally was greater than within an individual well, as shown for SC and SRP in figure 15. SC and SRP were similar in the two intermediate-depth wells along the dike road (PZ-WRDK and PZ-AGDK, fig. 2). On four occasions, the water temperature of artesian well water at the northeast corral (ART-1) ranged from 7.4 to 9ºC, with DO concentrations between 0.4 and 3.5 mg/L (table 6). Nutrient concentrations from ART-1 were intermediate between the adjacent streams and wetland surface water, with median TKN concentrations of 6,060 µg-N/L (5,790 µg-N/L was dissolved ammonium) and median TP concentrations of 6,240 µg-P/L (mostly bioavailable SRP). Samples collected from ART-1 contained 4 mg-C/L DOC and 1 mg/L chloride, relatively low concentrations compared with the other wells (table 8). DO in piezometer wells ranged from 0.3 to 5.3 mg/L (2.9–50 percent saturation, table 6) with median DO concentrations ranging from 0.7 to 5.3 mg/L. Minimum DO decreased slightly with increasing depth in the South Unit wells, from 0.8 mg/L DO in the shallow well to 0.3 mg/L in the deep well. Overall, the median pH in shallow wells (6.2 and 6.5 units in PZ-NU1 and PZ-SU1, respectively) was less than the median in the deep wells in both units (pH ranged from 7.2 to 7.6 units). The highest pH in ground water (7.8 units) was measured in the artesian well ART-1 (table 6 and fig. 8). Most total nitrogen (TN) was dissolved organic nitrogen + NH4 (dissolved Kjeldahl nitrogen—DKN). In many instances, dissolved NH4 comprised most DKN in the piezometers. Nitrate concentrations in wells were low, ranging from less than detection to 180 µg-N/L (table 8). Concentrations of NH4 and SRP in ground water generally increased with depth (fig. 8, table 8), especially in the North Unit, where the deep well (PZ-NU3) had exceedingly high concentrations: NH4 (as much as 36,500 µg-N/L), SRP (as much as 4,110 µg-P/L) and SC (as high as 1,410 µS/cm) (tables 6 and 8). Nitrate levels, although low, were highest in the shallow South Unit wells, which contained slightly higher DO levels. The highest SRP concentrations in the South Unit ground water (about 6,600–7,000 µg-P/L) were detected in the intermediate and deep wells (PZ-SU2, and PZ-SU3). The median SRP concentration in the South Unit shallow well (PZ-SU1) was about four times higher than in the North Unit shallow well (PZ-NU1) (table 8). Concentrations of NO3, NH4, and SRP in the shallow and intermediate depth wells in the North Unit showed seasonal patterns somewhat related to DO concentrations (fig. 16). In 2003, the SRP concentration in PZ-NU1 was highest in December (1,265 µg-P/L) and decreased by spring when the DO concentration was 4.6 mg/L. SRP concentrations in PZ-NU1 increased from about 300 to 1,500 µg/L during summer (fig. 16). DO concentrations in the North Unit decreased during summer to about 0.4 mg/L in the shallow and intermediate depth wells by July and August. The DO concentration in the intermediate depth well (PZ-NU2) was lower compared with the shallow or deep wells. Seasonal decreases in DO concentrations did not appear to increase SRP, but NH4 concentrations decreased from about 9,000 µg-N/L to about 3,500 µg-N/L. Modest increases in DO concentrations occurred in September, especially in the North Unit wells, possibly in response to flood irrigation (fig. 16). Biogeochemistry ExperimentsChamber studies were conducted in June and August 2005 at various locations in the South Unit to examine potential for biogeochemical controls on nutrient dynamics at the sediment-water interface. Overall, nutrient flux was about twice as high for SRP (2.9 milligrams of phosphorous per liter per square meter per hour [mg-P/L/m2/h]) than for NH4 (1.3 mg-N/L/m2/h). The SRP increased in all chambers, averaging about 500 µg-P/L (6.5 percent) after an incubation period of 18–20 hrs. The NH4 concentrations increased about 200 µg-N/L (25 percent) in all but two chambers, where the NH4 concentration decreased (fig. 17). The DO concentrations decreased in most chambers to nearly anoxic levels (0.1-0.2 mg/L) by the end of the incubations, producing DO consumption rates between 0.15 and 1.0 mg/L/h. Slight increases in DO, potentially indicative of plant photosynthesis, occurred in two of the South Unit west chambers (fig. 17). A decrease in NO3 concentration was measured in all five control chambers, with simultaneous production of N2O, indicating active denitrification by microbes (fig. 18). Denitrification rates were low in the controls due to low background NO3 (about 10–20 µg-N/L). Nitrate depletion and denitrification were enhanced with NO3 addition, indicating availability of DOC for microbes. The NO3 + glucose addition further enhanced NO3 depletion, producing N2O during denitrification and NH4, possibly by dissimilatory nitrate reduction to ammonia (DNRA) (fig. 18). |
For additional information contact: Part or all of this report is presented in Portable Document Format (PDF); the latest version of Adobe Reader or similar software is required to view it. Download the latest version of Adobe Reader, free of charge. |

![]() U.S. Department of the Interior | U.S. Geological Survey
U.S. Department of the Interior | U.S. Geological Survey
URL: http://
pubsdata.usgs.gov
/pubs/sir/2009/5004/section5.html
Page Contact Information: Contact USGS
Page Last Modified:
Thursday, 10-Jan-2013 19:29:21 EST