Scientific Investigations Report 2009–5026
Construction of Multidimensional Flow ModelsThe USGS Multi-Dimensional Surface-Water Modeling System (MD_SWMS) was used in this study and in the previous study (Barton and others, 2005) to simulate water-surface elevation, water depth, depth-averaged water velocity, boundary (bed) shear stress, and sediment mobility. MD_SWMS has a graphical user interface (GUI) developed by the USGS (McDonald and others, 2001) for hydrodynamic models. FaSTMECH is one computational model within MD_SWMS that was developed at the USGS (Nelson and Smith, 1989; Nelson and McDonald, 1997; Thompson and others, 1998; Lisle and others, 2000; Nelson and others, 2003; McDonald, and others, 2006b; and McDonald, and others, 2006c). FaSTMECH is a quasi-three-dimensional model, often referred to as a 2.5-dimensional model, which includes a two-dimensional vertically averaged flow computation and a method for computing the vertical structure of the flow. FaSTMECH treats the vertical structure of the primary flow (flow along the vertically averaged streamlines) and secondary flows associated with curvature (Nelson and others, 2003). The computational grid used in FaSTMECH is a curvilinear orthogonal coordinate system with a user-defined centerline. Physical assumptions of the model are that (1) flow is steady, (2) flow is incompressible, (3) flow is hydrostatic (vertical accelerations are neglected), and (4) turbulence is adequately treated by relating Reynolds stresses to shear using an isotropic eddy viscosity. Minimum data requirements for the model include channel geometry, streamflow at the upstream boundary, and water-surface elevation at the downstream boundary. The model drag coefficient represents the roughness of the river bottom and banks; this roughness is attributable to the combined effects of channel topography, bedforms, bars, vegetation, and sediment on the riverbed. In this study, the drag coefficient was given a uniform value throughout an entire reach by empirically calibrating the model so the simulated water surface elevation drop matched the measured values. This calibration ensures that the selected drag coefficient adequately represents the total head loss along the river reach. Other choices for drag incorporating spatially distributed values may produce simulations that are more accurate, but require more detailed information (including spatial distributions of grain size, bedforms and their evolution over changing streamflows, and other physical characteristics of the channel bed and banks) than currently is available. The river channel geometry in the braided-straight reach model and meander-straight model was defined by bathymetry measurements and by Light Detection and Ranging (LIDAR) measurements. Vertical datum for the bathymetry and LIDAR measurement was referenced to the North American Vertical Datum of 1988 (NAVD 88). Horizontal coordinate information for the bathymetry and LIDAR measurement was referenced to the North American Datum of 1983 (NAD 83), Idaho Transverse Mercator–North American Datum 1983/1998 Idaho West, in meters. Bathymetry and Streambank TopographyA brief summary of the bathymetric mapping is provided here and a complete description is contained in reports by Barton and others (2004, 2005). Bathymetric data were obtained by the USGS by connecting real-time Global Positioning System (GPS) equipment with survey-grade echo sounders. Taking into account all sources of mapping error, the bathymetry was mapped with a horizontal accuracy of ±0.05 m and a vertical accuracy of ±0.1 m. During 2002, 2003, and 2005, the USGS measured water depth with a single-beam echo sounder (Innerspace Technology, Inc., Model 448). Spacing between those cross sections between RKMs 227 and 245.9 ranged from less than 10 to about 50 m. During 2004 and 2005, the USGS also measured water depth with a multi-channel echo sounder (Ross Model 875-4 with four channels). Spacing between each of the four sounding transducers was 2.8 m. The multi-channel echo sounder was used to survey a series of longitudinal lines between RKMs 236.8 and 245.9 and between RKMs 222.2 and 232.0. These longitudinal lines generally were parallel and spaced less than 5 m in the straight and meander reaches. The single- and multi-channel echo sounders also were used to survey longitudinal lines in the braided reach between RKMs 245.9 and 254. Survey line in the braided reach are spaced farther apart than in the straight and meander reach due to shallow water depth and high streamflow velocity that affected navigation of the survey vessel. Spacing between longitudinal lines of bathymetric data ranged from 2.8 to about 10 m. Bathymetry was mapped with greater coverage where river depth was more variable. Where the bottom was relatively uniform, less bathymetric data were needed to characterize the slope of the channel. The bathymetry data were interpolated between mapped elevations to provide a more continuous coverage. A LIDAR survey was done throughout the Kootenai River Valley in Idaho during spring 2005 when streamflow was 340 m3/s. A contractor for KTOI surveyed the valley floor, floodplain, and the channel to the edge of water. The survey data were provided to the USGS as a 1-m digital elevation model. StreamflowSelection of historical streamflow conditions used for model calibration was based on two criteria: (1) streamflows should be evenly distributed between low flow (less than 226 m3/s) and the pre-Libby Dam era median annual flood (2,240 m3/s) so the model could be adequately calibrated over the range of streamflow in the river; and (2) because MD_SWMS was used as a steady-state model, calibration conditions were selected that represented periods of relatively constant water-surface elevation and discharge during periods of relatively constant stage and discharge. Criterion (1) was met for the meander-straight reach model; however, the braided-straight reach model was calibrated to a streamflow slightly less than 2,000 m3/s due to a shorter period of record for stage and streamflow measurements. During model runs, including calibration for the braided-straight reach model and meander-straight reach model, channel curvature at the downstream model boundary caused recirculation currents at the model boundary. To address this common problem, the MD_SWMS grid extension module was used to extend and gradually straighten the grid in the downstream direction by 100 nodes over a distance of 1,000 m to eliminate recirculation regions at the downstream end of the model reach. The grid extension did not alter the streamflow solution in the region of interest. Braided-Straight Reach Multidimensional Flow ModelThe computational grid used to model the braided-straight reach of the Kootenai River was 8,200 m long with 985 nodes in the downstream direction and 1,300 m wide with 131 nodes in the cross-stream direction, forming an approximately 10 × 10-m cell (fig. 4). Measured bathymetric and LIDAR elevation data for the braided-straight model was mapped to the computation grid through a “nearest-neighbor” method, as described by Barton and others (2005, p. 20). Model CalibrationThe model was calibrated to eight streamflow conditions during 2006 (table 1) that ranged from 196 to 1,760 m3/s (fig. 5). During April 2006, temporary stage gaging stations were installed at five locations in the braided reach (fig. 2). These gaging stations, in addition to the Bonners Ferry (12309500) stage gaging station and Tribal Hatchery (12310100) stage and discharge gaging station, recorded stage in 15-minute intervals and provided important data for model calibration. In addition to streamflow rates, water-surface elevations at the downstream boundary of the model are required to run FaSTMECH. For five streamflows the water-surface elevation at the downstream boundary of the model was interpolated from gaging stations 12314000 and 12310100 (fig. 2). For three streamflows the water-surface elevation was interpolated from synoptic water-surface elevation measurement (table 1). The calibration process involved repeatedly adjusting the drag coefficient within reasonable limits to minimize the difference between the measured and simulated water-surface elevations. In addition the model-user must input a lateral eddy viscosity (LEV) to represent lateral momentum exchange due to turbulence or other variability not generated at the bed (Nelson and others, 2003). The lateral eddy viscosity parameter for the model was computed and iteratively applied to the calibration for each streamflow condition using equation 1 defined as:
The computed LEV value was applied uniformly throughout the modeling reach for each calibration streamflow. LEV consistently increased with increasing streamflow (fig. 5) from 196 to 1,760 m3/s and ranged from 0.014 to 0.051, respectively. The resulting calibration shows that the drag coefficient increases from approximately 0.0024 at flows less than 500 m3/s to approximately 0.003 at flows greater than 1,000 m3/s. This step-change increase in the drag coefficient occurs as the river stage increases and overtops the vegetated bars in the braided reach. The difference between the simulated and measured water-surface elevations was less than or equal to ±0.03 m. Model ValidationThe braided-straight reach model was validated by comparing simulated streamflow velocities with streamflow velocities measured at five cross sections between RKMs 246.1 and 251.5 (fig. 2) during relatively steady streamflow that ranged between 826 and 860 m3/s on May 25–26, 2005. Streamflow velocities were measured using an acoustic Doppler current profiler (ADCP) that was connected to a Trimble mapping-grade GPS receiver and Fugawi navigational software. Streamflow velocity at five cross sections was measured multiple (5–10) times to obtain average velocities suitable for comparison to the model simulation results. Measured data were processed into vertically averaged cross section velocity to test the two-dimensional model component. A general description of procedures for processing raw ADCP data are available in Dinehart (2003) and Barton and others (2005). The braided-straight reach model simulates the magnitude and structure of flow across the section reasonably well (fig. 6). However, small differences were noted between the measured and simulated velocities in most cross-sections. Several possible reasons can explain the mismatch between simulated and measured velocities throughout the study reach. The complex channel topography, particularly upstream of sections 2467 and 2482, resulted in as many as four separate velocity threads across the channel. Subtle differences between simulated topography and actual topography can lead to differences in the routing of streamflow between each of these four channels and therefore differences in the velocity in each channel. Additionally, specifying a constant drag coefficient throughout the reach does not account for vegetation on the surface of the bars separating each channel thread. The high roughness of the vegetated bars relative to the grain roughness of the channel likely exerts an additional influence on the routing of streamflow into each of the four channel threads and therefore on the velocity distribution across the channel downstream. To illustrate the effect of vegetation roughness on the model simulated velocity the tops of bars were approximately mapped as seen in a series of aerial photographs taken in 2002 (fig. 7). To simulate the relatively high roughness of the vegetated bar tops we partitioned the reach using two drag coefficients. The drag coefficient for the most of the model was set to the calibrated value and the bar top drag coefficient was set to a significantly higher value of 0.1. The resulting simulated velocities are shown in figure 6 for sections 2461, 2467, and 2482. A comparison between the measured and simulated velocities using both a uniform drag coefficient and a variable drag coefficient (fig. 6) indicates that the model simulation results could be improved through a better understanding of the effect of vegetation on channel roughness. Proper calibration of the model to vegetation roughness would require measured velocities over the entire modeled range of streamflows because the effect of vegetation on roughness varies with vegetation type and degree of inundation (Wu and others, 1999). Using a simple uniform value of roughness for the entire modeled reach captures the salient features of the measured velocity. Model Sensitivity AnalysisSensitivity analysis of the braided-straight reach model consisted of decreasing and increasing the calibrated drag coefficient by 85 and 115 percent during streamflow simulation runs of 170, 1,130, and 2,120 m3/s. The analysis includes reporting median and maximum river water-surface elevation and velocity for the entire population of wet model nodes (table 2). Varying calibrated drag coefficient by 85 and 115 percent changed the median water-surface elevation by 0.01 to 0.15 m and the median velocities by 0.01 to 0.03 m/s, respectively. Meander-Straight Reach Multidimensional Flow ModelThe computational grid used in the Kootenai River meander-straight reach model was 23,600 m long with 2,359 nodes in the downstream direction and 725 m wide with 73 nodes in the cross-stream direction, forming an approximately 10 × 10-m grid. Measured bathymetric and LIDAR data, for the meander-straight reach model was mapped to the computation grid through a “nearest-neighbor” method. Procedures for mapping topography to the grid are the same as described in Barton and others (2005) except that a 10 × 10-m grid rather than a 5 × 5-m grid was used. Magnitude and direction of streamflow-velocity vectors at the upstream boundary of the model grid had a significant effect on the simulated streamflow patterns for roughly the upper few channel widths of the modeled reach. Uncertainty in model simulation results near the upstream boundary is common in many models. Velocity magnitude and direction were specified at the upstream boundary using the same conditions as the previous model by Barton and others (2005). These streamflow-velocity conditions were based on streamflow measurements made at a cross section at RKM 245.9 for streamflows of 1,260 m3/s measured June 7, 1996, and 776 m3/s measured April 16, 2002. Model CalibrationThe meander-straight reach model was subdivided into two regions of uniform drag coefficients to improve calibration for streamflows less than 1,420 m3/s. One uniform value of drag coefficient was applied to the straight reach and a separate value was applied to the meander reach. These two regions of uniform drag coefficients are necessary because upstream model boundary conditions cause model convergence problems in the relatively short straight reach. The model was calibrated to nine streamflow conditions (table 3) ranging from 170 to 2,120 m3/s. Water-surface elevation at the downstream model boundary were set using a one-dimensional model (Berenbrock, 2005). A complete description of these conditions is available in a report by Berenbrock (2006). Calibration for each streamflow condition consisted of comparing simulated water-surface elevations in the meander reach model and the simulated water-surface elevations at 37 sites from Berenbrock (2006). This process involved repeatedly adjusting the drag coefficient within reasonable limits, running the model, and inspecting differences between simulated water-surface elevations and Berenbrock’s one-dimensional model water-surface elevations with the objective of minimizing the difference. Differences in calibrated meander-straight reach model-simulated water-surface elevations and Berenbrock’s one-dimensional model water-surface elevations were less than or equal to ±0.02 m. The ranges for drag coefficient values are similar to those from the study by Barton and others, (2005). Drag coefficients resulting from model calibration are shown in figure 8. For the straight reach between the RKM 245.9 and Ambush Rock, the drag coefficient decreased sharply from 0.0131 to 0.0073 as streamflow increased from 170 to 283 m3/s. For streamflows greater than 1,130 m3/s, no clear justification was established for using more than a single value of the drag coefficient, because model simulation results were not significantly improved using multiple values. Therefore, at greater streamflows, the drag coefficient was constant throughout the model simulation, increasing gradually from 0.0015 to 0.0019 as streamflow increased from 1,420 to 1,980 m3/s, and then remaining about constant as streamflow increased to 2,120 m3/s. As reported in Barton and others (2005), model calibration indicated that bedforms have a large effect on the drag coefficient at streamflows less than about 595 m3/s: channel roughness along the riverbed increases at low streamflows due to formation of tall dunes, and channel roughness decreases at higher streamflows because the dunes tend to wash out. The model LEV parameter was computed for each model calibration condition using equation (1). The computed LEV value was applied uniformly throughout the model-simulated reach for each calibration streamflow. LEV consistently increased with increasing streamflow (fig. 8) and ranged from 0.011 to 0.095 for streamflow ranging from 170 to 2,120 m3/s. Model ValidationThe previous multidimensional model of the meander and straight reaches (Barton and others, 2005) was validated by comparing simulated streamflow velocities with flow velocities measured at 15 cross sections between RKMs 229.1 and 236.9 during steady streamflow that averaged 538 m3/s on August 12–14, 2003. Details on model validation are available in Barton and others (2005). Validation of the new meander-straight reach model was not required due to the similarity between the previous and new meander-straight reach models: (1) channel geometry in the 5.8 RKM downstream extension in the new model is comparable to the reach in the previous model, which had validation analysis, and (2) channel geometry data used in the downstream extension of the new model were collected with the same methodology as the previous model. Adding LIDAR data was considered an overall improvement to the meander-straight reach multidimensional model. Model Sensitivity AnalysisSensitivity analysis of the meander-straight reach multidimensional model consisted of decreasing and increasing the calibrated drag coefficient by 85 and 115 percent during streamflow simulation runs of 170, 1,130, and 2,120 m3/s. The analysis included reporting median and maximum river depth, velocity, and water-surface elevation, for the entire population of wet model nodes (table 4). Varying calibrated drag coefficient by 85 and 115 percent changed the median water-surface elevation by 0.01 to 0.06 m and changed the median depth-averaged velocities by 0.0 to 0.02 m/s. |
For additional information contact: Part or all of this report is presented in Portable Document Format (PDF); the latest version of Adobe Reader or similar software is required to view it. Download the latest version of Adobe Reader, free of charge. |

![]() U.S. Department of the Interior | U.S. Geological Survey
U.S. Department of the Interior | U.S. Geological Survey
URL: http://
pubsdata.usgs.gov
/pubs/sir/2009/5026/section3.html
Page Contact Information: Contact USGS
Page Last Modified:
Thursday, 10-Jan-2013 19:41:34 EST

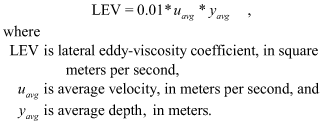 (1)
(1)