


The purpose of these interpretive discussions is to provide a perspective on regional- and national-scale variations in element and mineral distributions in soils and their likely causes. The significant spatial variations shown by most elements and minerals can commonly be attributed to geologic sources in underlying parent materials, but other spatial variations seem clearly related to additional factors such as climate, the age of soils, transported source material, and anthropogenic influences. We attempt to distinguish the influence of these various factors on a regional and national scale. Numerous more local features might similarly be related to these same factors, but these features also have some probability of being an artifact of a random sampling of variable compositions, so that there is some probability of samples with similar compositions occurring in clusters of two or more adjacent sites by chance. Distinguishing such random occurrences from true variability is beyond the scope of the data from which these maps are constructed. Some caution, therefore, is advisable in interpreting the significance of these more local features unless some unique sources or processes can clearly be related to them.
Tin (Sn) is a metallic element that occurs widely in trace amounts in many natural materials. It is used widely in modern societies largely as protective coatings on other metals, including a large percentage of metal food containers ("tin cans"), in solders for joining pipes and electrical circuits, and a wide variety of chemical applications. Tin may be an essential element to some organisms in small quantities, but can be toxic at higher concentrations, particularly in aquatic ecosystems and especially if it is incorporated into organic compounds. Expected environmental exposure to Sn and its inorganic compounds appears to have very limited adverse human health effects, but exposure to organic Sn compounds or occupational exposure to high Sn concentrations may have some harmful effects. More information about Sn toxicity and its potential negative human health impacts can be found at the Agency for Toxic Substances and Disease Registry (ATSDR) website, or click to download a fact sheet about Sn.
The abundance of Sn in the Earth's upper continental crust is estimated to be about 2.2 milligrams per kilogram (mg/kg) (Hu and Gao, 2008). Of the common rock types, Sn is most abundant in granite (3.6 mg/kg), shale (5 mg/kg), and coal (8 mg/kg), and less abundant in sandstone (0.6 mg/kg) and limestone (0.3 mg/kg). Most Sn in bedrock probably is a trace constituent in mica and clay. Our data show the median Sn concentration is 1.3 mg/kg in the soil A horizon and top 0- to 5-cm layer and 1.4 mg/kg in the soil C horizon (see the summary statistics [open in new window]).
The distribution of mineral resource deposits with Sn as a commodity (major or minor) in the United States, extracted from the U.S. Geological Survey (USGS) Mineral Resource Data System (MRDS) website, can be seen by hovering the mouse here. Statistics and information on the worldwide supply of, demand for, and flow of Sn are available through the USGS National Minerals Information Center (NMIC) website.
The principal ore mineral of Sn is cassiterite (SnO2). The element also occurs in trace amounts in micas, amphibole, rutile, and sphene.
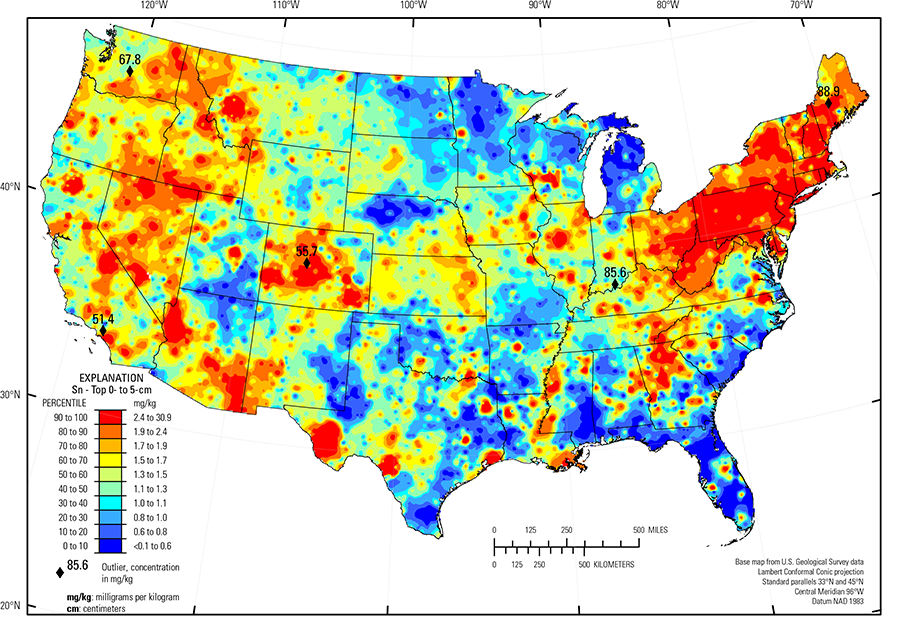
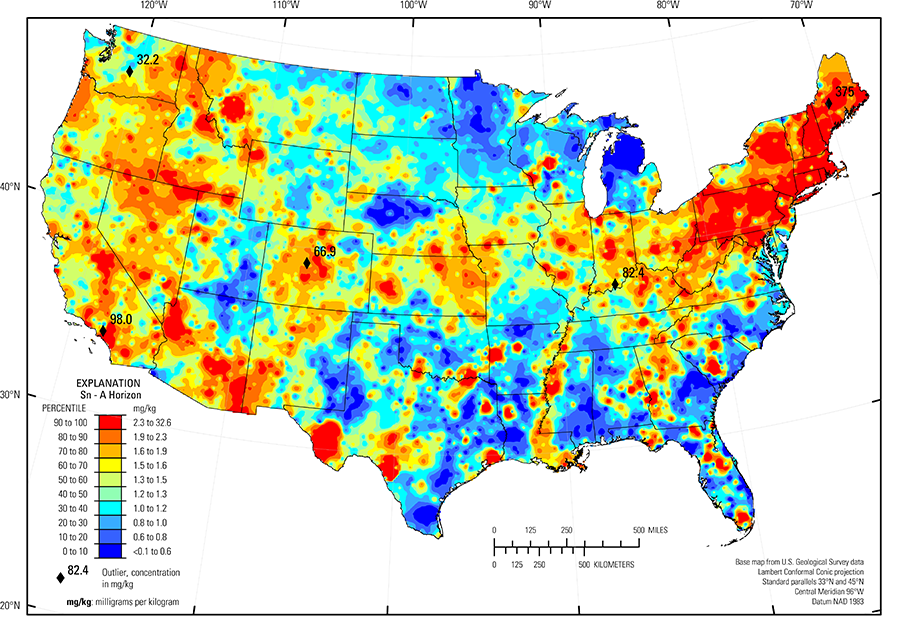
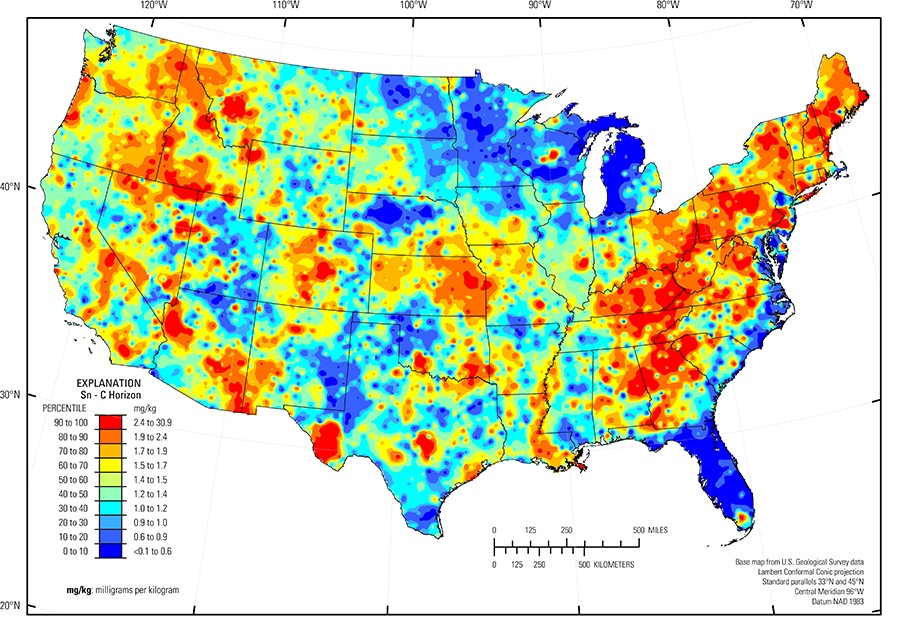
In the western United States, higher Sn concentrations occur mostly over felsic volcanic and intrusive rocks, and alluvium derived from them. It is especially concentrated in soils developed on the Trans–Pecos volcanic rocks (Schruben and others, 1997) of western Texas. Tin concentrations are also somewhat elevated in clay–rich sediments of the Southern Mississippi River Alluvium (USDA, 2006). In the eastern United States, higher Sn values are widespread, especially in the shallower soils, and are not so obviously related to a specific rock type or geologic province. There is some correspondence of Sn concentrations and clay content in the soil C horizon. This correspondence is not as prominent in the soil A horizon or top 0- to 5-cm layer. Tin concentrations are especially high in the top 0- to 5-cm layer in the Northeast. This area includes some of the most populous regions of the United States, both currently and historically, and historically has been the most heavily industrialized. It is possible that the Sn concentrations in that region show some anthropogenic influence although no single source or activity is discernible with these data.
The Sn concentrations are especially low in parts of the Upper Midwest where soils are developed on Pleistocene glacial deposits north of the limit of Pleistocene glaciation (Soller and others, 2012), and in soils developed on eolian sands of the Nebraska Sand Hills (USDA, 2006) and the High Plains (USDA, 2006) of western Texas and New Mexico. Quartz–rich soils in much of Florida also have very low Sn concentrations.
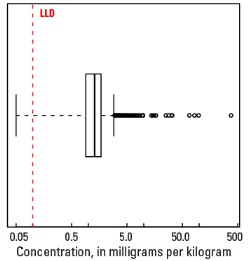
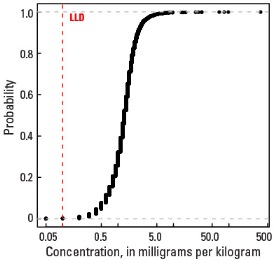
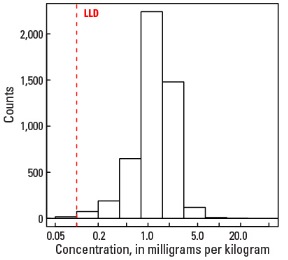
Statistics - 0 TO 5 CM
| Number of samples | 4,841 |
| LLD | 0.1 mg/kg |
| Number below LLD | 9 |
| Minimum | <0.1 mg/kg |
| 5 percentile | 0.5 mg/kg |
| 25 percentile | 0.9 mg/kg |
| 50 percentile | 1.3 mg/kg |
| 75 percentile | 1.8 mg/kg |
| 95 percentile | 3.1 mg/kg |
| Maximum | 88.9 mg/kg |
| MAD | 0.593 mg/kg |
| Robust CV | 45.6% |
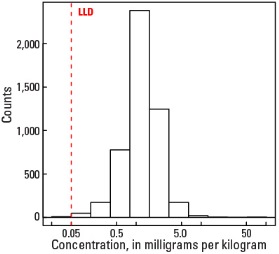
Histogram
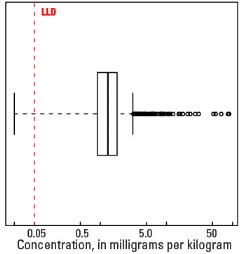
Boxplot
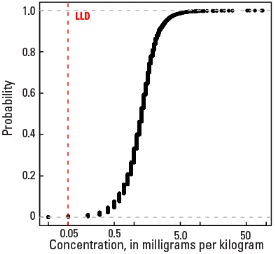
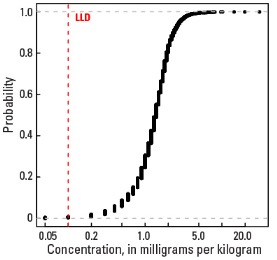
Empirical cumulative distribution function
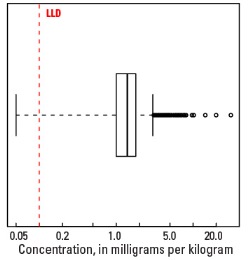
Statistics - A Horizon
| Number of samples | 4,813 |
| LLD | 0.1 mg/kg |
| Number below LLD | 6 |
| Minimum | <0.1 mg/kg |
| 5 percentile | 0.5 mg/kg |
| 25 percentile | 0.9 mg/kg |
| 50 percentile | 1.3 mg/kg |
| 75 percentile | 1.7 mg/kg |
| 95 percentile | 2.8 mg/kg |
| Maximum | 375 mg/kg |
| MAD | 0.593 mg/kg |
| Robust CV | 45.6 % |
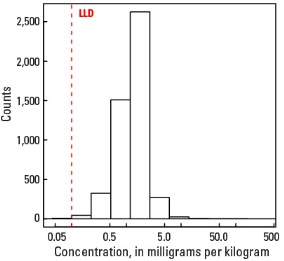
Histogram
Boxplot
Empirical cumulative distribution function
Statistics - C Horizon
| Number of samples | 4,780 |
| LLD | 0.1 mg/kg |
| Number below LLD | 18 |
| Minimum | <0.1 mg/kg |
| 5 percentile | 0.4 mg/kg |
| 25 percentile | 1.0 mg/kg |
| 50 percentile | 1.4 mg/kg |
| 75 percentile | 1.8 mg/kg |
| 95 percentile | 2.8 mg/kg |
| Maximum | 30.9 mg/kg |
| MAD | 0.593 mg/kg |
| Robust CV | 42.4 % |
Histogram
Boxplot