


The purpose of these interpretive discussions is to provide a perspective on regional- and national-scale variations in element and mineral distributions in soils and their likely causes. The significant spatial variations shown by most elements and minerals can commonly be attributed to geologic sources in underlying parent materials, but other spatial variations seem clearly related to additional factors such as climate, the age of soils, transported source material, and anthropogenic influences. We attempt to distinguish the influence of these various factors on a regional and national scale. Numerous more local features might similarly be related to these same factors, but these features also have some probability of being an artifact of a random sampling of variable compositions, so that there is some probability of samples with similar compositions occurring in clusters of two or more adjacent sites by chance. Distinguishing such random occurrences from true variability is beyond the scope of the data from which these maps are constructed. Some caution, therefore, is advisable in interpreting the significance of these more local features unless some unique sources or processes can clearly be related to them.
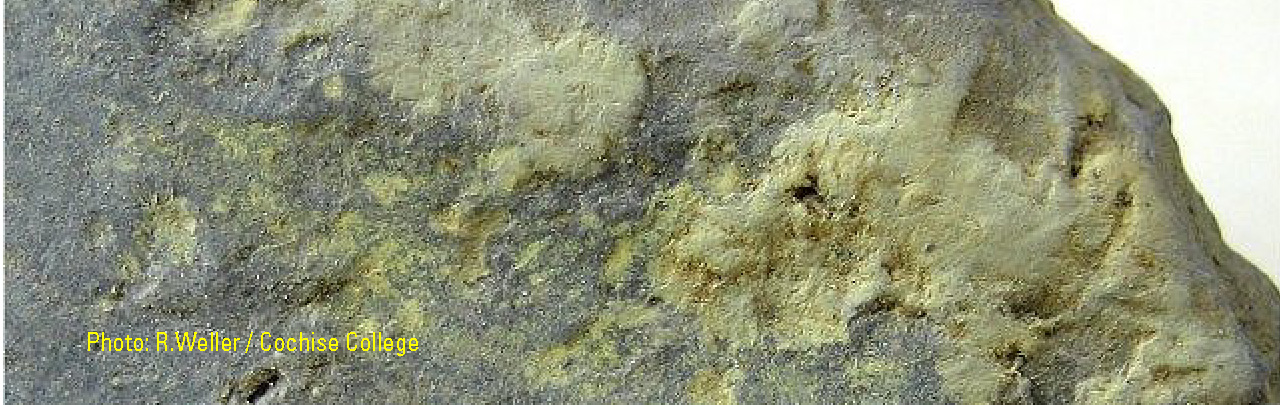
Clay minerals are fine–grained, layered hydrous silicate minerals. In soil, clay minerals can be inherited from parent materials, such as sedimentary rocks, or created in place through soil–forming processes. Different clays result from differing parent materials. For example, feldspar, volcanic glass, ferromagnesian minerals, or even other clays may be the parent material from which clay minerals are formed. The maps of total clay minerals represent the sum of three classes of clays presented in individual maps. These are 10 Å clays, 14 Å clays, and kaolinite.
Clays in the 10 Å (1 Å (angstrom) = 10–10 meters) group have a 10 Å interatomic spacing across their principal parting direction. Clays in this group include illite, muscovite, and biotite and are all potassium (K) aluminosilicate minerals with variable amounts of iron (Fe) and magnesium (Mg). Muscovite and biotite form in igneous and metamorphic rocks at elevated temperatures, but they also persist as constituents of coarse–grained clastic sedimentary rocks. Illite, on the other hand, is the dominant clay mineral in shale and mudstone and in soil can be inherited from such fine–grained parent materials.
Clay minerals in the 14 Å group are those that have an interatomic spacing across their principal parting direction of 14 Å or somewhat greater. They are hydrous aluminosilicate minerals with varying contents of the major elements Fe, Mg, calcium (Ca), sodium (Na), as well as many trace elements. The 14 Å clays in soil can form from the weathering of Fe– and Mg–rich rocks and minerals.
Kaolinite is an aluminum (Al)–rich clay with an interatomic spacing across its principal platy parting direction of 7 Å. Kaolinite most commonly forms by the chemical breakdown of feldspars, accompanied by leaching of elements such as calcium (Ca), Na, and K.
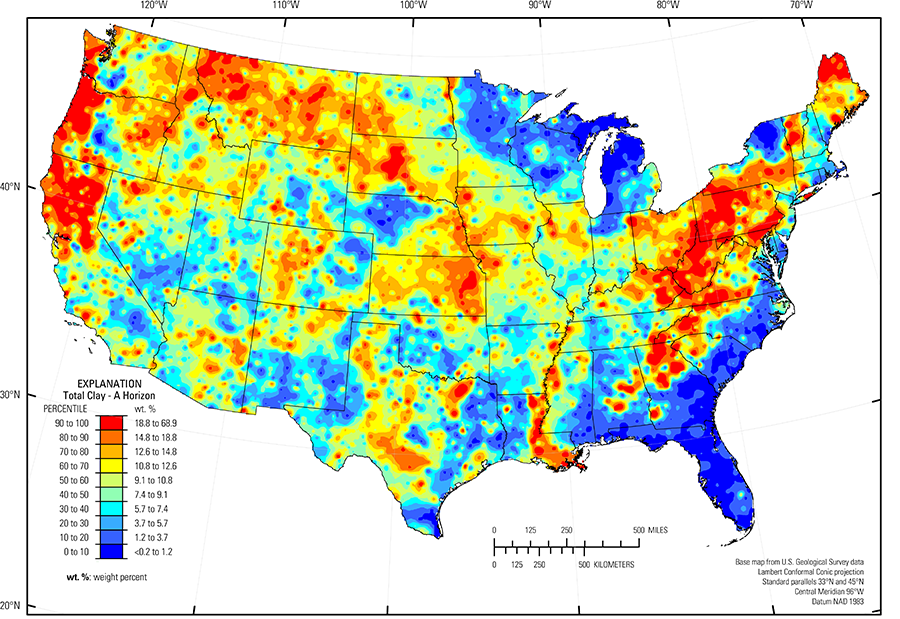
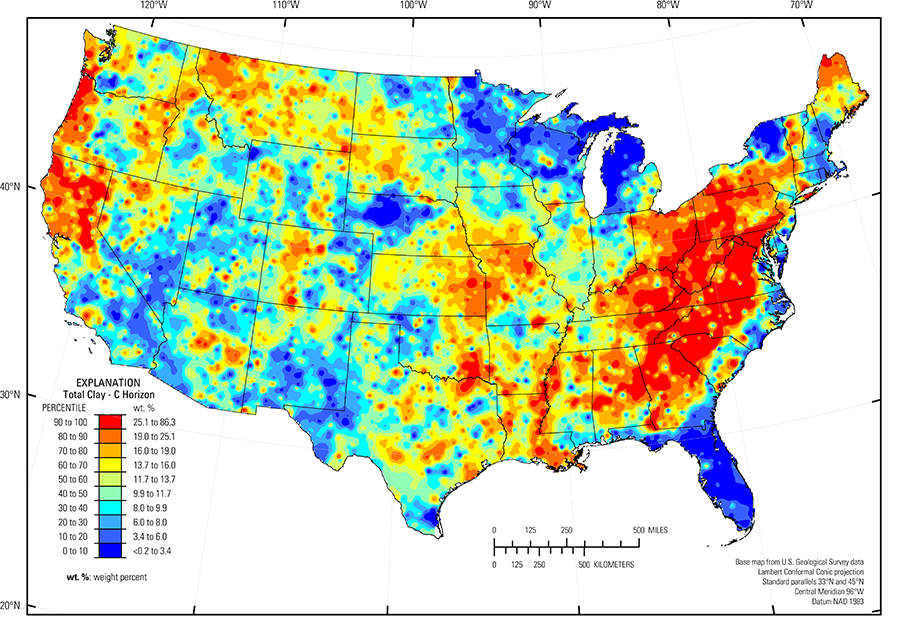
As with the individual mineral classes that constitute total clay, concentrations in soils are highly variable and reflect a combination of many geologic and soil–forming processes. Clays are detected in 93 percent of soil A horizon samples and 97 percent of soil C horizon samples. The soil C horizon has a somewhat higher median total clay concentration (11.7 weight percent (wt. %)) than the soil A horizon (9.1 wt. %). Maximum total clay concentrations are as much as 68.9 wt. % for the soil A horizon and 86.3 wt. % for the soil C horizon (see the summary statistics [open in new window]). Clay minerals are difficult to identify and fully quantify by the relatively simple method used for this study. More detailed studies can provide more definitive identifications of individual minerals, but such studies were beyond the scope and timing of this survey.
The map patterns for total clay integrate multiple geologic and soil–forming processes. For example, high concentrations for 10 Å clays in the soil C horizon in the eastern United States occur in soil developed in the Central Allegheny Plateau, the Valley and Ridge and Blue Ridge Provinces (Fenneman and Johnson, 1946), as well as the Kentucky Bluegrass and the Northern Piedmont regions (USDA, 2006). These high concentrations extend into glaciated areas of New York, Pennsylvania, and Ohio. Most bedrock in these areas is Paleozoic clastic sedimentary rocks, and the presence of 10 Å clays represents either clastic material derived from older crystalline terranes or formed in situ by chemical alteration during soil development. The most prominent area of high 14 Å clays concentrations in the soil C horizon occurs over soil parent materials that were dominantly shale or clay–rich glacial till in North Dakota and South Dakota. Within the shale formations, interbeds of volcanic ash are altered to smectite, which probably contributes to the clay content of at least parts of this area. Another area of high concentrations of 14 Å clays is along the Mississippi Alluvial Plain (Fenneman and Johnson, 1946). Soils in that area developed on fine–grained clayey sediments of both the modern and ancient Mississippi River floodplain and have been shown in many previous studies to be rich in montmorillonite. The largest area of kaolinite–rich soil is in the southeastern United States where a region from Virginia to Alabama has soils that generally fall in the upper 90th percentile of kaolinite content. These high kaolinite soils formed mostly in the eastern Piedmont and Blue Ridge physiographic provinces (Fenneman and Johnson, 1946), an area where crystalline bedrock is deeply weathered, and most feldspars have been altered to kaolinite. Because clay minerals, such as kaolinite, are generally resistant to weathering, they tend to increase in abundance as primary minerals disappear.
The concentration and distribution of total clay are best understood by reading the more detailed discussions of the individual clay groups. These sections provide fuller discussions of the spatial distribution of the clay groups and the controlling factors on clay concentrations.
All three clay maps, and thus the maps for total clay, consistently show that parts of the conterminous United States have little or no clay in soil because of a lack of inherited clay minerals or an absence of clay–containing or clay–producing original minerals. These areas include:
- Colorado Plateau (USDA, 2006) where soils developed on quartz–rich sandstone and eolian deposits;
- Southern High Plains (USDA, 2006) of western Texas and New Mexico where quartz–rich eolian sands and alluvial sediments are widespread;
- Parts of Michigan, where soils have formed on sandy, quartz–rich glacial deposits of the Superior, Green Bay, and Saginaw lobes, (Grimley, 2000); and
- Nebraska Sand Hills (USDA, 2006), an area of quartz– and plagioclase–rich sand dunes and sand sheets.
Statistics - 0 TO 5 CM
Statistics - A Horizon
| Number of samples | 4,802 |
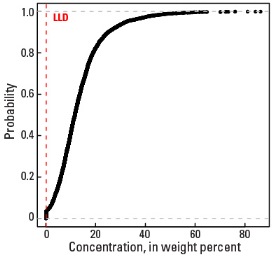
| LLD | 0.2 wt. % |
| Number below LLD | 351 |
| Minimum | <0.2 wt. % |
| 5 percentile | <0.2 wt. % |
| 25 percentile | 4.7 wt. % |
| 50 percentile | 9.1 wt. % |
| 75 percentile | 13.6 wt. % |
| 95 percentile | 23.3 wt. % |
| Maximum | 68.9 wt. % |
| MAD | |
| Robust CV |
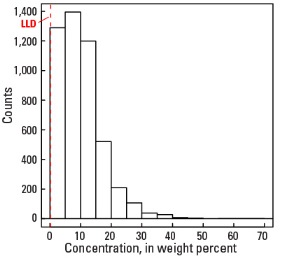
Histogram
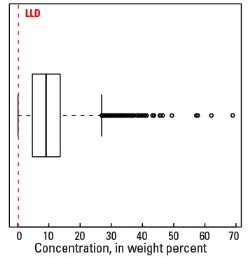
Boxplot
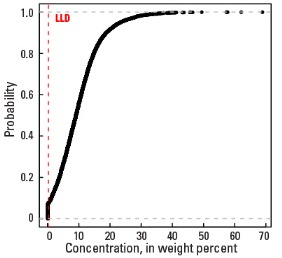
Empirical cumulative distribution function
Statistics - C Horizon
| Number of samples | 4,773 |
| LLD | 0.2 wt. % |
| Number below LLD | 162 |
| Minimum | <0.2 wt. % |
| 5 percentile | 1.4 wt. % |
| 25 percentile | 7.1 wt. % |
| 50 percentile | 11.7 wt. % |
| 75 percentile | 17.3 wt. % |
| 95 percentile | 32.2 wt. % |
| Maximum | 86.3 wt. % |
| MAD | |
| Robust CV |

Histogram
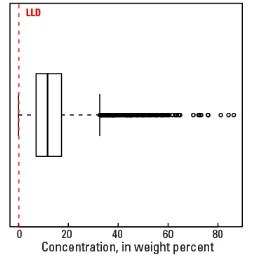
Boxplot