


The purpose of these interpretive discussions is to provide a perspective on regional- and national-scale variations in element and mineral distributions in soils and their likely causes. The significant spatial variations shown by most elements and minerals can commonly be attributed to geologic sources in underlying parent materials, but other spatial variations seem clearly related to additional factors such as climate, the age of soils, transported source material, and anthropogenic influences. We attempt to distinguish the influence of these various factors on a regional and national scale. Numerous more local features might similarly be related to these same factors, but these features also have some probability of being an artifact of a random sampling of variable compositions, so that there is some probability of samples with similar compositions occurring in clusters of two or more adjacent sites by chance. Distinguishing such random occurrences from true variability is beyond the scope of the data from which these maps are constructed. Some caution, therefore, is advisable in interpreting the significance of these more local features unless some unique sources or processes can clearly be related to them.
Mercury (Hg) is a metal that occurs widely, but in very low concentrations, in most natural materials, including soils. Mercury is an unusual metal occurring as a liquid at surface conditions when in its native form, and being easily volatilized and transported as a trace constituent in the atmosphere. Because it is a powerful neurotoxin and can be bioaccumulated and concentrated in aquatic ecosystems, Hg is a significant concern for human health, particularly among individuals for whom fish is a major part of their diets. To be bioaccumulated, Hg must be incorporated into organic compounds, a process that is controlled by local conditions, largely in aquatic and wetland environments, and is not necessarily related to variations in the total Hg concentrations in soils. Much additional information on environmental and health aspects of Hg is accessible at the Environmental Protection Agency (EPA) website and at the Agency for Toxic Substances and Disease Registry (ATSDR) website, or click to download a fact sheet about Hg. Historically, Hg was used widely in manufacturing of many consumer products and was thus widespread in modern societies. But because of its negative health effects, its use has been greatly curtailed in recent decades. A detailed account of historical Hg usage and its decline is provided in Wilburn (2013). Statistics and information on the worldwide supply of, demand for, and flow of Hg–bearing materials are available through the U.S. Geological Survey (USGS) National Minerals Information Center (NMIC) website.
The abundance of Hg in the Earth's upper continental crust is estimated to be about 0.05 milligrams per kilogram (mg/kg) (Rudnick and Gao, 2003). Limited previous data on soils indicate a similar average concentration, except for urban soils, which may be as much as three times higher. Of the common rock types, shale has the highest concentration, averaging about 0.18 mg/kg. Black shale can exhibit even higher concentrations (up to a few mg/kg). Concentrations in coal average about 0.1 mg/kg Hg. Other rock types, such as granite, limestone, and sandstone, average about 0.01–0.03 mg/kg.
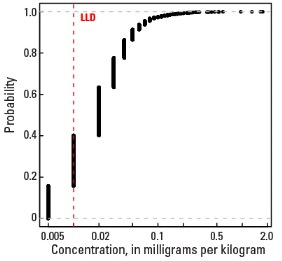
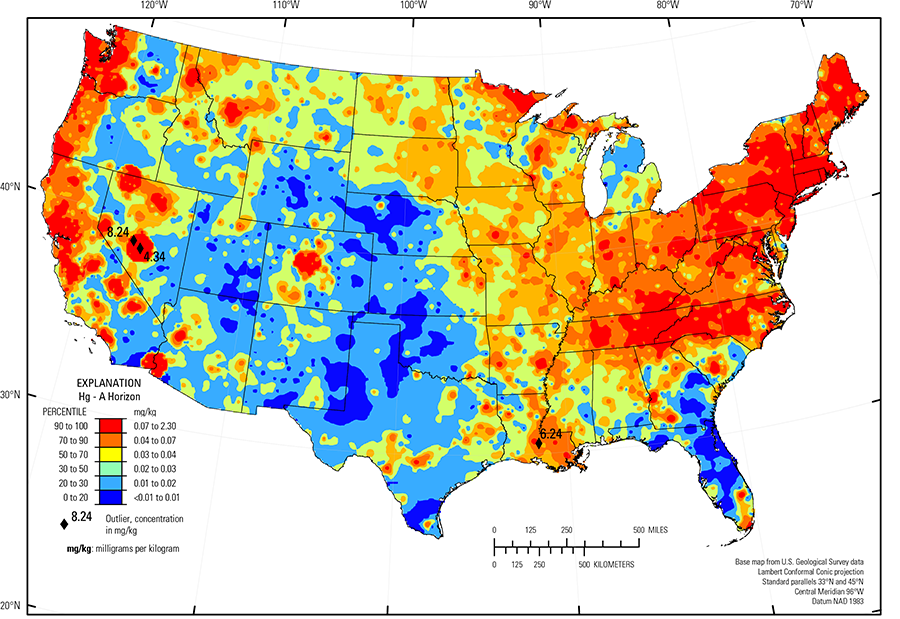
Compared to estimates for the upper continental crust, our data show somewhat lower Hg concentrations in which both the median and mean concentrations are 0.02 mg/kg for all three sample types. It is important to note that most concentrations are near the lower limit of determination (LLD) of the analytical method used (0.01 mg/kg). Data close to the LLD lack the precision of higher concentration data and spatial patterns generated from such data must be viewed with some degree of caution. Concentrations in about 8 percent of samples from the top 0- to 5-cm layer and from the soil A horizon and 16 percent of samples from the soil C horizon were below the LLD (see the summary statistics [open in new window]). Because of the preponderance of low concentrations of Hg, the maps display only 6 concentration classes, rather than 10 as used for most other elements. The analyses report the total Hg concentration of soils, and probably include several chemical forms of Hg that may have different geochemical behavior, as well as different impacts on health and environment. In addition, there is a strong artefact of variable sampling in the southeastern United States for the soil A horizon data. Different crews that did field sampling in South Carolina, Georgia, and Alabama on the south, and North Carolina and Tennessee on the north used different criteria to define the base of the soil A horizon. This resulted in a prominent variation in the concentration of organic carbon and related Hg between these groups of States. This variation reflects that difference in sampling criteria more than true variability of Hg concentration. This discrepancy is not evident in the soil C horizon data and is less prominent in the top 0- to 5-cm layer data.
Mercury occurs in a limited number of minerals and is most abundant in some sulfide minerals that constitute the ores from which it is produced. Those ores are not generally widespread and do not account for most of the Hg in soils of the United States. Mercury has a strong chemical affinity for soil organic matter and commonly occurs in higher concentrations in organic–rich soils. Its pattern of distribution across the United States bears some similarities to the organic carbon concentration of the soil A horizon in areas such as northern Minnesota, northern Michigan, and much of the east-central and northeastern United States. Elsewhere, however, that correspondence is weaker or absent. For the conterminous United States, taken as a whole, there is not a significant correlation between Hg and organic carbon in either the soil A or C horizons. In addition to Hg input to soils from geologic and atmospheric sources, Hg losses from soils also play an important role in determining the Hg concentration. Because Hg is easily volatilized, it can be lost from soils in gaseous form. The ability of soils to sequester Hg in relatively stable compounds is therefore also a critical control on Hg concentration. Because of the likely interplay of geologic, ecosystem, and anthropogenic factors that can have significant impact on the Hg concentrations in soils, it is difficult to isolate specific causes for many of the observed Hg variations.
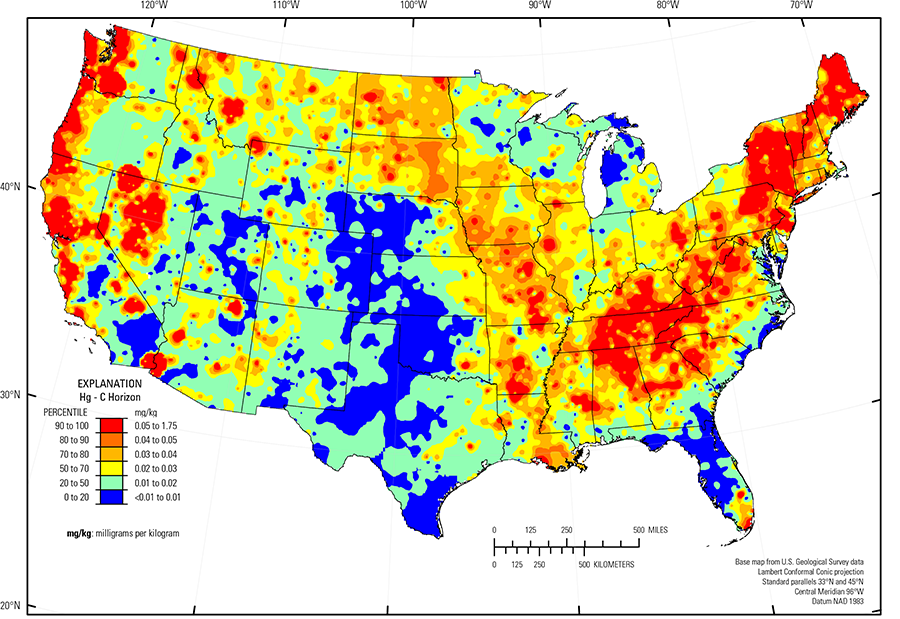
The soil C horizon is the most likely to show variations related to the Hg concentration of parent materials. Among common rock types, Hg is typically most concentrated in shale, but little of the observed variability seems related to shale–rich bedrock. Mercury commonly is concentrated in gold deposits and several areas of elevated Hg concentrations in the western United States correspond to historical gold-mining areas, including central Colorado, western Montana, much of Nevada, parts of central California, and the California–Arizona border. The distribution of mineral resource deposits with Hg as a commodity (major or minor) in the United States, extracted from the USGS Mineral Resource Data System (MRDS) website, can be seen by hovering the mouse here. In addition to natural occurrences, Hg was commonly used in the refining process of gold so anthropogenic Hg additions to soils could also account for part of the high Hg concentrations in historical gold–mining areas. Mercury has also been mined as a principal commodity on a smaller scale, particularly in California, northern Nevada, and Oregon. Most of the Hg deposits and prospects correspond to areas of high Hg concentrations in soils (Wilburn, 2013). These high concentrations may be a combination of natural Hg concentrations, possibly enhanced by Hg releases related to mining.
Another area of elevated Hg concentration is along the Pacific Coast in northern California, Oregon, and Washington, and extending about 200 km inland. There is no obvious geologic or anthropogenic source for this Hg, suggesting the possibility that it is caused by Hg deposition from marine aerosols. This is also an area of high rainfall and generally lush forest vegetation that should be capable of sequestering a high percentage of Hg delivered from precipitation. The area of high Hg concentrations extends eastward into the Cascade Mountains but Hg concentration decreases abruptly across the eastern slope of the Cascades where precipitation also decreases abruptly, further suggesting a link between precipitation, forest type, and Hg concentration in soils in this area.
Large areas of uniformly low Hg concentrations also occur in parts of the western half of the United States. Soils in much of the States of Nebraska, Kansas, Oklahoma, and Texas contain Hg concentrations less than 0.02 mg/kg. This region has a variety of geologic terranes including mostly sedimentary rocks and unconsolidated surficial deposits, and except for a few urban clusters, relatively low population and industrialization. It is dominantly agricultural land with low to moderate precipitation. Perhaps these factors combine to provide low input of Hg and soil conditions that are not favorable for Hg sequestration. An additional area with very low Hg concentrations, mostly in northern Arizona and southern Utah, corresponds mostly with the Colorado Plateau (USDA, 2006), an arid region of mostly sandstone bedrock where soil parent materials are quartz–rich sandstone and eolian deposits, probably low in Hg, and soil conditions are not conducive to Hg sequestration.
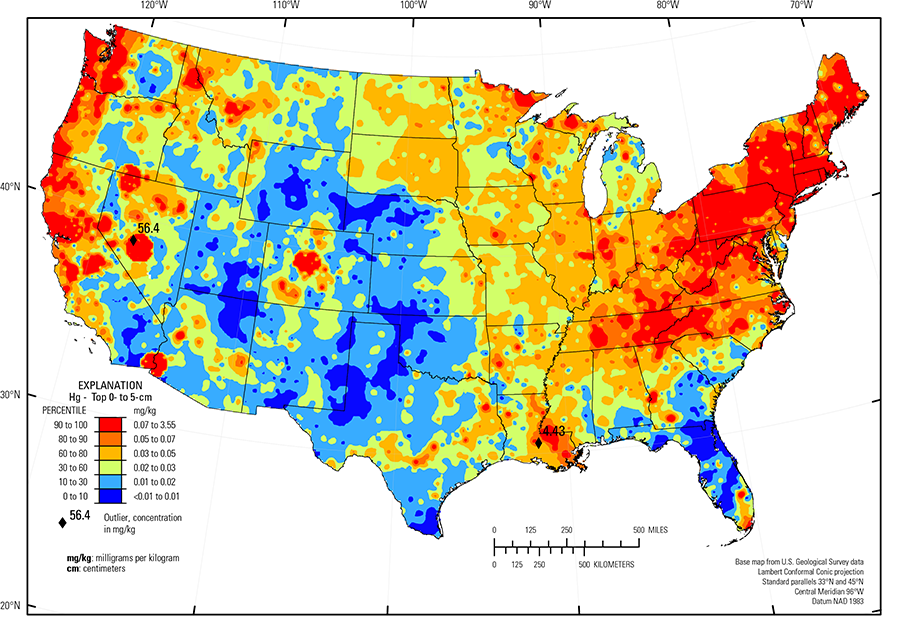
The pattern of Hg distribution in surface soils appears to exhibit an influence of anthropogenic additions. Mercury in the atmosphere is estimated to be about 50 percent derived from coal–fired power plants, according to the EPA, and the remainder being largely from natural sources such as volcanic gases. Atmospheric Hg can be transported variably and, in some cases, very long distances from its source depending on its chemical form and atmospheric conditions. It is deposited both dissolved in precipitation and adsorbed to particulate matter. The EPA website provides a gateway to a large amount of information about Hg pollution, remediation, and health effects.
In the eastern half of the United States, especially in the northeastern States, relatively high concentrations of Hg are widespread and display little relationship to types of parent materials. Mercury tends to be more concentrated in shallower parts of the soil horizon with ratios of concentrations in the top 0- to 5-cm layer to concentrations in the soil C horizon greater than 2 or 3 over large areas. Some of these near–surface high Hg concentrations are probably caused by increased organic carbon compounds to which Hg can bind in shallower soils, such as forested areas in the Upper Midwest. However, loading of Hg to the surface from atmospheric deposition is also a possible cause.
It is well documented that large amounts of Hg have been emitted from power plants fired by fossil fuel (mostly coal). Basic information is available at the EPA website (click here) and a map of generating facilities of various types is available here. The EPA maintains an annual inventory of releases of toxic substances including Hg and Hg compounds, so the amount of Hg released from facilities of various types is well documented (note that "release" in this sense can include material placed in some type of land disposal in addition to emissions to air and water). According to the 2012 Toxic Release Inventory (TRI), more than 5 million pounds of Hg and Hg compounds were released from about 1,600 facilities for that year. Of that, nearly 77,000 pounds were released in stack emissions to the atmosphere. Generating facilities released about 114,000 pounds of Hg and Hg compounds, a small percentage of the total release, but about 44,000 pounds were stack emissions to the atmosphere, accounting for nearly 60 percent of total atmospheric releases. In contrast, the 2016 TRI for Hg and Hg compounds reports a decline in the total releases to around 3.6 million pounds, with 43,000 pounds released in stack emissions to the atmosphere. Facilities, both power plants and other types that report annual releases of Hg or Hg compounds, are highly concentrated in the eastern United States. The sheer abundance of these facilities in the eastern part of the United States, coupled with the relatively high concentrations of Hg in soils, which does not have a clear geologic source, suggests the possibility that widespread atmospheric Hg deposition has enhanced the Hg concentrations of this part of the country.
Statistics - 0 TO 5 CM
| Number of samples | 4,841 |
| LLD | 0.01 mg/kg |
| Number below LLD | 367 |
| Minimum | <0.01 mg/kg |
| 5 percentile | <0.01 mg/kg |
| 25 percentile | 0.01 mg/kg |
| 50 percentile | 0.02 mg/kg |
| 75 percentile | 0.04 mg/kg |
| 95 percentile | 0.10 mg/kg |
| Maximum | 56.4 mg/kg |
| MAD | ND |
| Robust CV | ND |
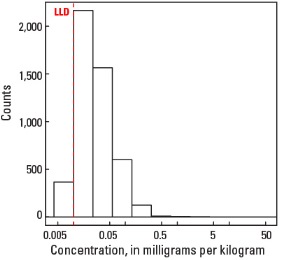
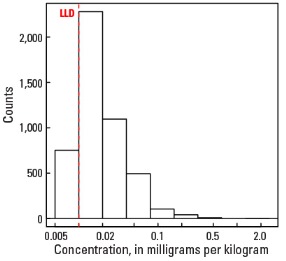
Histogram
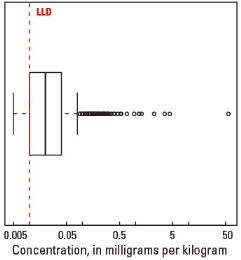
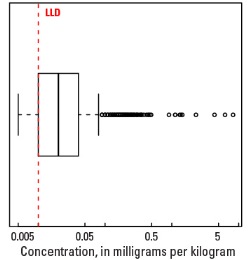
Boxplot
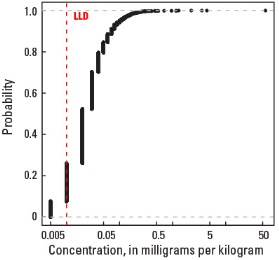
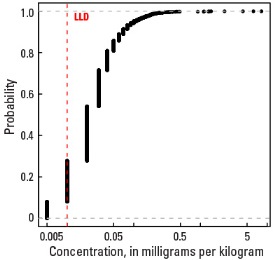
Empirical cumulative distribution function
Statistics - A Horizon
| Number of samples | 4,813 |
| LLD | 0.01 mg/kg |
| Number below LLD | 386 |
| Minimum | <0.01 mg/kg |
| 5 percentile | <0.01 mg/kg |
| 25 percentile | 0.01 mg/kg |
| 50 percentile | 0.02 mg/kg |
| 75 percentile | 0.04 mg/kg |
| 95 percentile | 0.10 mg/kg |
| Maximum | 8.24 mg/kg |
| MAD | ND |
| Robust CV | ND |
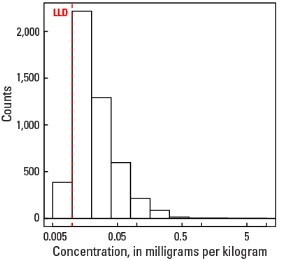
Histogram
Boxplot
Empirical cumulative distribution function
Statistics - C Horizon
| Number of samples | 4,780 |
| LLD | 0.01 mg/kg |
| Number below LLD | 752 |
| Minimum | <0.01 mg/kg |
| 5 percentile | <0.01 mg/kg |
| 25 percentile | 0.01 mg/kg |
| 50 percentile | 0.02 mg/kg |
| 75 percentile | 0.03 mg/kg |
| 95 percentile | 0.07 mg/kg |
| Maximum | 1.75 mg/kg |
| MAD | ND |
| Robust CV | ND |
Histogram
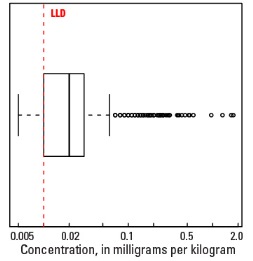
Boxplot