Geologic Features of the Sea Bottom Around a
Municipal Sludge Dumpsite near 39øN, 73øW,
Offshore New Jersey and New York: U.S. Geological Survey Open-file
Report 94-152
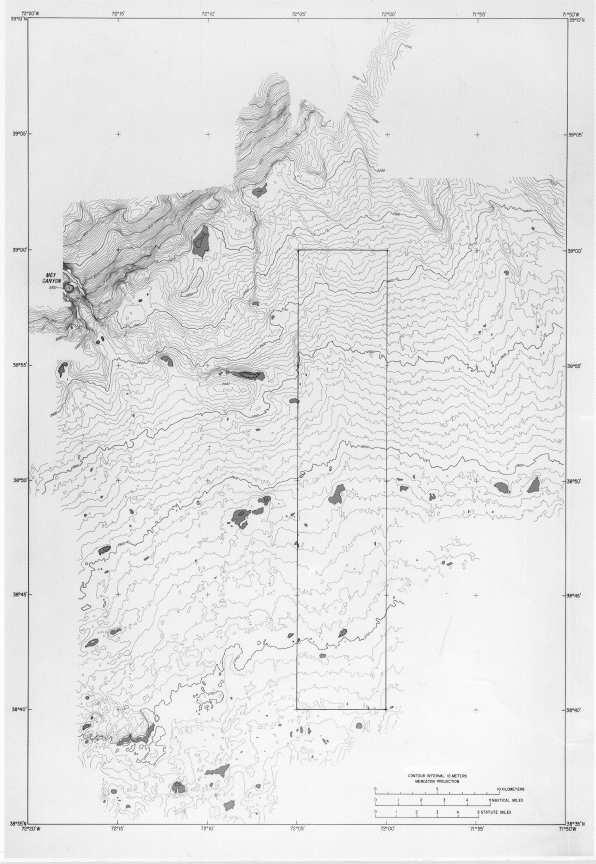
Bathymetric map
Bathymetry of the dumpsite region was mapped aboard RV Atlantis II
during September, 1989, by using a Sea Beam
multibeam echo-sounding
system and computer software developed by the University of Rhode
Island (Davis and others, 1986; Tyce, 1986). The map depicts 1750 km2 of
the sea floor at a 10-m contour interval.
The Sea Beam system uses 16 acoustic beams to measure water depths in a
swath across the ship's track. Each beam is shaped by using two sets
of hull-mounted transducers (one set mounted along the keel and another
athwartship), and insonifies a 2.66 degree ellipse. The beams are
corrected for pitch and roll so the swath of measured depths lies
directly below the ship. The length of the acoustic pulse and the
frequency of digitization limit the resolution of the range
measurements to about 2.5 m. The maximum width of the swath mapped by
the system corresponds to 73 percent of the water depth. Many
individual echo soundings in swaths along the survey-ship's track are
compiled and, in this case, were gridded into 125-m cells for contouring.

The trackline direction of this survey was primarily north-south. A
textural effect of north-south banding and apparent low scarps can be
seen in the computer-produced contour map at some places on the low
slopes of the continental rise, due to small discrepancies from line to
line in the gridded depths. Note that these artifacts are less
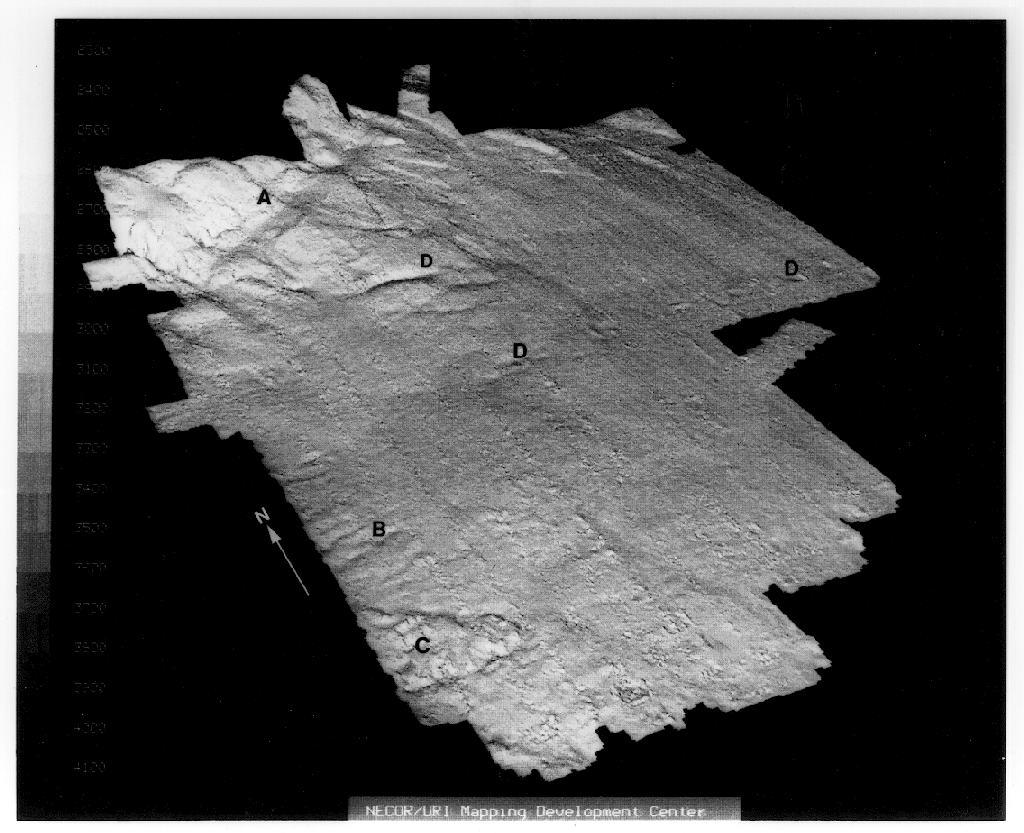
apparent and show more clearly as locally noisy spots in the
three-dimensional perspective illustration of the data.
- To continue, click on "BACK", or on:
- Data and Methods...
- (GLORIA mosaic)
- Description of the sea floor...
- Discussion...
- Conclusions...
- References Cited...
- Illustrations Summary
- Or, to review, click on:
- Abstract...
- Introduction...
******
[an error occurred while processing this directive]